the Creative Commons Attribution 4.0 License.
the Creative Commons Attribution 4.0 License.
 | 13 Nov 2025
Atmospheric sounding of the boundary layer over alpine glaciers using fixed-wing UAVs
Alexander R. Groos
Nicolas Brand
Murat Bronz
Andreas Philipp
Glaciers are an integral part of the high mountain environment and interact with the overlying atmosphere and surrounding terrain in a complex and dynamic manner. The energy exchange between the glacier surface and the overlying atmosphere controls ice melt rates and promotes a characteristic microclimate, including the formation of a low-level katabatic jet that interacts with other, often thermally driven winds in alpine terrain. Information on the local circulation and structure of the atmospheric boundary layer over glaciers is crucial for studying cryosphere-atmosphere interactions and for investigating the characteristics of the katabatic wind, its broader cooling effect, and its susceptibility to be disrupted by strong valley or synoptic winds that promote heat advection from the ice- and snow-free periphery towards the glacier. While the number of ground-based measurements from weather stations and meteorological towers installed on glaciers for boundary layer research has increased in recent years, a lightweight and mobile measurement technique for atmospheric sounding over alpine glaciers has not yet been available. Here we describe a new measurement technique based on a low-cost and open-source fixed-wing UAV, which allows sounding the atmospheric boundary layer over glaciers up to several hundred metres above the surface. In the frame of a feasibility study in 2021, two half-day (16 June, 23 September) and two 24 h campaigns (9/10 July, 25/26 August), including nocturnal soundings, were performed, demonstrating the UAV's capability to reach heights of up to 800 m above the glacier surface. From these campaigns, 40 profiles of air temperature, specific humidity, wind speed, wind direction, and turbulence were derived. The results highlight characteristic features of the glacier boundary layer, including a persistent surface-based inversion, a cool and dry katabatic wind confined to the lowest 50 m a.g.l., an overlying shear layer, and a warmer, often more humid valley wind above 100–200 m a.g.l. These observations illustrate how the boundary layer responds to synoptic forcing and local winds and demonstrate the potential of UAV-based atmospheric soundings for advancing glacier meteorology in complex alpine terrain.
- Article
(13589 KB) - Full-text XML
- BibTeX
- EndNote


Glaciers and ice caps are an integral part of the high mountain environment, interacting with the overlying atmosphere and surrounding terrain in a complex and highly dynamic manner. The spatially and temporally highly variable energy exchange between the glacier surface and the atmosphere strongly controls ice melt rates and promotes a characteristic microclimate, including the formation of katabatic winds, which interact with other, often thermally driven, winds in alpine terrain (e.g. Oerlemans, 2010; Farina and Zardi, 2023). A sound understanding of the principles of multi-scale glacier–atmosphere interactions in alpine terrain and their sensitivity to climate change is essential for accurate and reliable projections of future glacier mass loss (e.g. Mott et al., 2020; Jouberton et al., 2022; Shaw et al., 2023, 2024). Projections of the future evolution of mountain glaciers are, in turn, not only relevant in the context of sea-level rise and freshwater management (e.g. Huss and Hock, 2018; Rounce et al., 2023), but also fundamental for assessing future local changes in the mountain-valley wind system and potential impacts on air temperature and precipitation in glacier forefields related to shrinking ice and snow cover at higher elevations (e.g. Potter et al., 2018; Salerno et al., 2023).
While the general structure of the atmospheric boundary layer over mountain glaciers and the key processes driving local circulations in glacierised terrain are relatively well understood, less is known about how these circulations vary regionally and how they are modified by glacier characteristics, topography, and synoptic forcing. Katabatic winds, in particular, have been studied extensively, as a melting glacier surface in summer (snow or ice at 0 °C) efficiently cools the warmer air aloft and causes a density-driven downslope flow (e.g. Ohata, 1989; Van den Broeke, 1997a, b; Greuell and Böhm, 1998; Oerlemans and Grisogono, 2002). The maximum wind speed of the katabatic jet is typically reached within a few metres above the surface (Van den Broeke, 1997b; Oerlemans, 2010; Mott et al., 2020; Nicholson and Stiperski, 2020), while its cooling influence can extend up to 100 m (Oerlemans and Vugts, 1993; Van den Broeke, 1997a).
An upslope wind advecting warm and moist air from the valley usually develops during the day above the cold and dry downglacier katabatic flow (Van den Broeke, 1997b). The katabatic wind is generally persistent, but can be disturbed, especially near the glacier terminus, by strong synoptic flow or a pronounced valley wind (Oerlemans and Grisogono, 2002; Mott et al., 2020; Nicholson and Stiperski, 2020; Shaw et al., 2024). Such disturbances, and the associated advection of warm air from the glacier periphery and enhanced turbulent heat exchange, can locally and temporarily increase glacier melt (Mott et al., 2020; Shaw et al., 2024). More broadly, the response of near-surface circulations over glaciers to a warming environment, whether through strengthening, weakening, or structural change, will directly impact the future energy and mass balance of mountain glaciers.
Assessing the impact of climate change on the structure of the boundary layer and local winds in glacierised mountain environmentsis is difficult because long-term glacio-meteorological observations of thermally driven winds in glacierised terrain remain scarce and are usually restricted to a handful of high-elevation sites. A recent comparative study in the Swiss Alps showed that the cooling effect of katabatic winds (1–7 °C on warm afternoons) varies widely between sites, depending not only on glacier size but also on the resistance of the katabatic layer to intrusion of warm valley air, which in turn is strongly controlled by local topography and valley orientation (Shaw et al., 2024). Observations from the Himalaya suggest that the increasing thermal contrast between glacier and non-glacier terrain has strengthened the katabatic wind and lowered the elevation of the convergence zone between cold-dry and warm-moist flows, thereby cooling and drying proglacial areas (Salerno et al., 2023). Conversely, the ongoing shrinkage of glaciers will eventually weaken or even eliminate katabatic winds, as shown by recent measurements on retreating glaciers (Shaw et al., 2023), with debris cover further promoting disruption (Nicholson and Stiperski, 2020). In mountain valleys that are projected to become ice-free, climate model simulations suggest that warm air is likely to be advected further up the valley by local winds (Potter et al., 2018).
While automatic weather stations operated continuously or temporarily on mountain glaciers worldwide have provided valuable insights into near-surface winds, temperature fields, and energy fluxes (e.g. Greuell and Böhm, 1998; Oerlemans and Grisogono, 2002; Shea and Moore, 2010; Petersen and Pellicciotti, 2011; Shaw et al., 2016; Steiner and Pellicciotti, 2016; Shaw et al., 2017; Mott et al., 2020; Nicholson and Stiperski, 2020; Shaw et al., 2021, 2023, 2024), techniques for atmospheric sounding on mountain glaciers to greater heights remain scarce. Yet, atmospheric soundings are crucial for resolving the vertical structure of the boundary layer over glaciers and for investigating the interactions between thermally driven local circulations (i.e. glacier, valley and slope winds) and the free atmosphere (e.g. Oerlemans, 2010). Traditional mast or tower measurements can extend the vertical range, but they are logistically demanding and limited to only a few metres above the glacier surface (e.g. Oerlemans and Vugts, 1993; Oerlemans et al., 1999; Litt et al., 2015).
Glacio-meteorological experiments with a large tethered balloon on Vatnajökull in Iceland (Oerlemans et al., 1999) and on Pasterze in the Austrian Alps (Van den Broeke, 1997a, b; Oerlemans and Grisogono, 2002) enabled soundings up to several hundred metres above the surface already two decades ago, but to the authors' knowledge, no comparable soundings have been conducted on mountain glaciers since the Pasterze experiment in 1994, largely due to logistical and financial constraints. More recently, Unoccupied Aerial Vehicles (UAVs) have emerged as a promising, low-cost alternative for boundary-layer research, and have been successfully deployed in polar regions such as Antarctica, Greenland, and Iceland (e.g. Reuder et al., 2009; Cassano, 2014; Jonassen et al., 2015; Cassano et al., 2016; Lampert et al., 2020; Hansche et al., 2023). However, their feasibility for atmospheric sounding over alpine glaciers has not yet been demonstrated.
The aim of this study was therefore to develop a low-cost, open-source fixed-wing UAV for atmospheric boundary layer research on alpine glaciers and to evaluate its suitability for investigating glacier-atmosphere interactions and the local circulation in complex terrain. To this end, we conducted two half-day (June and September) and two 24 h (July and August) measurement campaigns on the Kanderfirn in the Swiss Alps in 2021 under contrasting synoptic conditions. Here, we describe the developed measurement system and present the atmospheric data collected during the four campaigns, and discuss the benefits, challenges, and limitations of using fixed-wing UAVs to study the structure of the boundary layer and local circulation in glacierised high mountain environments.
The Kanderfirn (46.47° N, 7.78° E), a south-west-facing valley glacier in the Swiss Alps (see Fig. 1), was selected as the test site for the UAV-based atmospheric soundings because its setting is well suited to investigate how alpine terrain and synoptic flow influence the occurrence of typical local circulations (i.e., katabatic, valley, and slope winds) and the structure of the atmospheric boundary layer over a mountain glacier. In addition, considerable experience with UAV operations on this glacier is available from previous field campaigns (Groos et al., 2019, 2022; Messmer and Groos, 2024). The glacier currently covers an area of approximately 12 km2 and extends from 2300 m above mean sea level (m a.m.s.l.) at the tongue to 3200 m a.m.s.l. in the accumulation area. To the north, it is bounded by the steep Blüemlisalp massif, which reaches a maximum elevation of 3661 m a.m.s.l. (for a detailed description of the study area, see Groos et al., 2019).
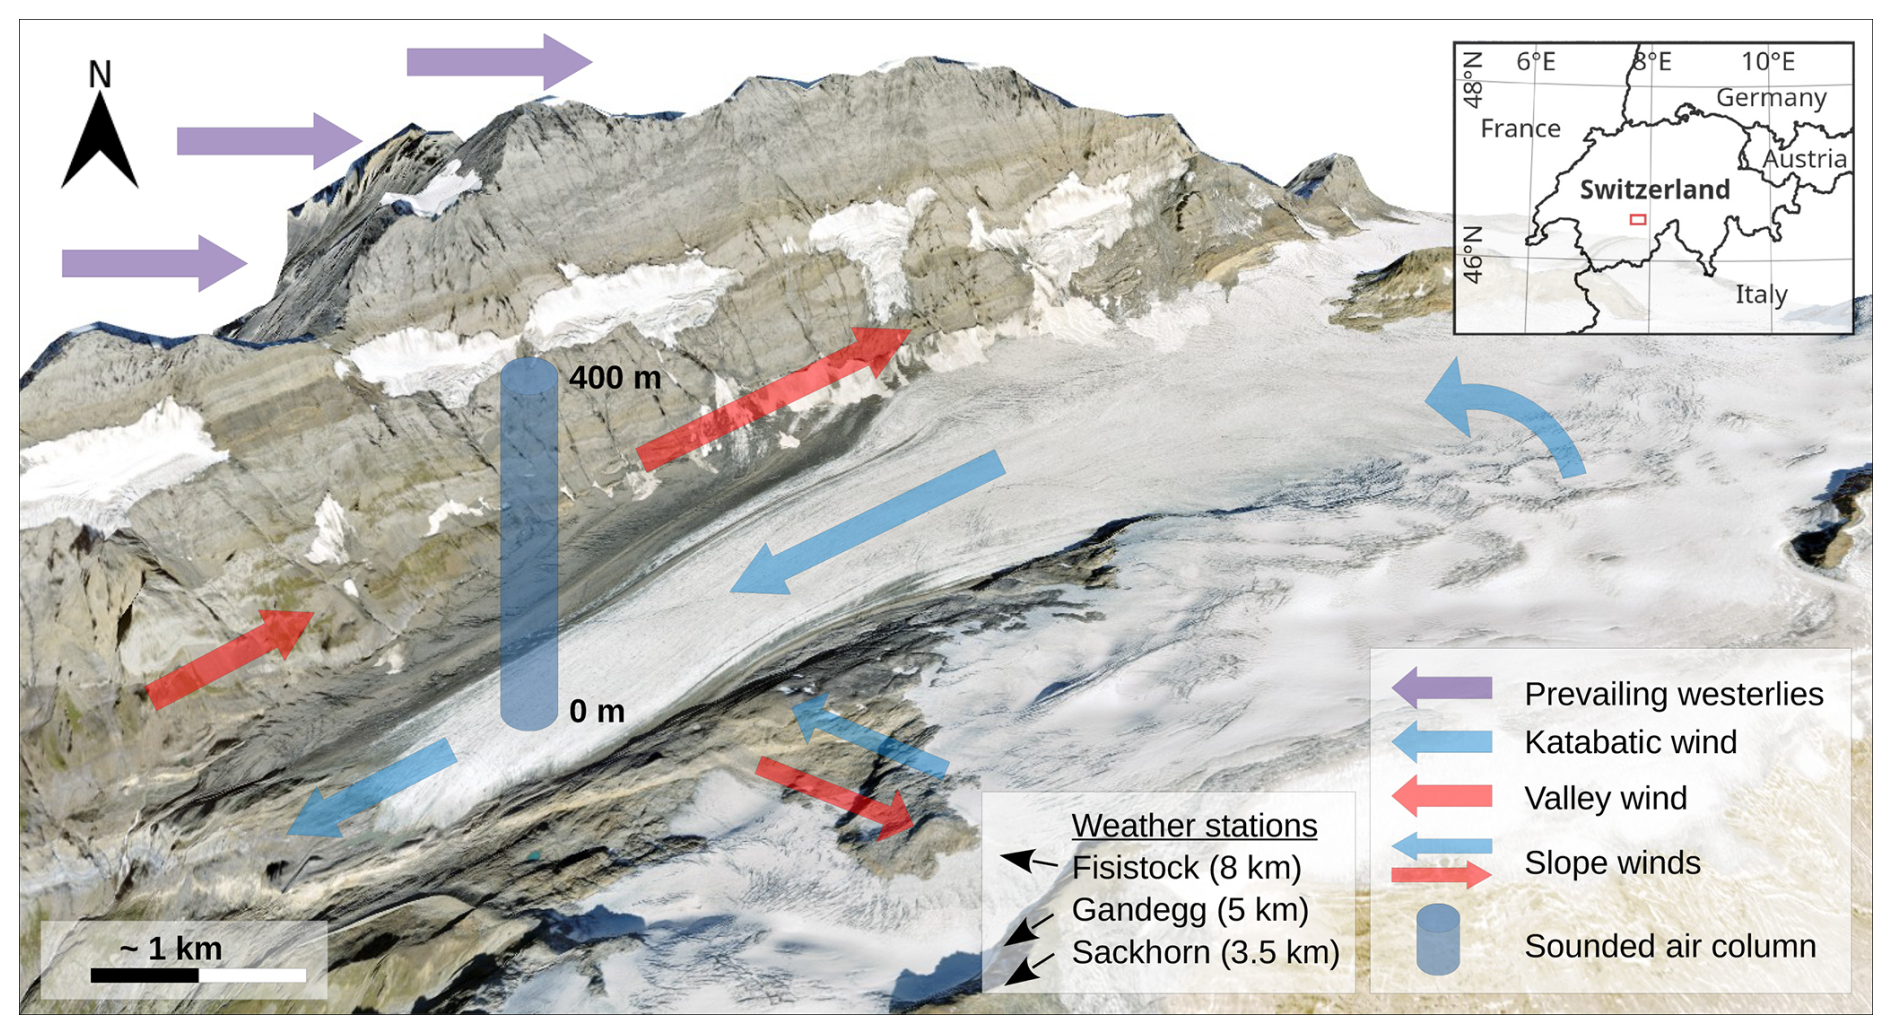
Figure 1Overview of the alpine test site for the UAV-based atmospheric soundings and schematic of the synoptic flow and hypothesised dominant local winds on the Kanderfirn in the Swiss Alps. The approximate location of the nearby weather stations is indicated. The 3D model in the background is based on the SWISSIMAGE (orthophoto) and the swissALTI3D (digital surface model) from 2018, both provided by Swisstopo.
During the campaign on 16 June 2021, at the beginning of the melt season, the glacier surface was still fully snow covered (see Fig. 4), with a snow depth of about 2 m in the sounding area. Snow-free conditions prevailed during the subsequent campaigns. Three automatic weather stations (see Fig. 1) operated by the WSL Institute for Snow and Avalanche Research (SLF) are located in the vicinity of the glacier: one at Fisistock (46.4715° N, 7.6739° E; 2160 m a.m.s.l.), one at Gandegg (46.4293° N, 7.7606° E; 2720 m a.m.s.l.), and one at Sackhorn (46.4397° N, 7.7662° E; 3200 m a.m.s.l.). These stations provide valuable supporting data for the broader interpretation of the atmospheric soundings.
On 16 June 2021, a pronounced ridge over central Europe (see Fig. 2a) created stable and warm conditions across the Bernese Alps (see Fig. 3). Subsidence maintained mostly clear skies and weak synoptic forcing, favouring the development of a local mountain-valley circulation and thermally driven winds in the Kanderfirn area. During 9 to 10 July, on the contrary, the region was influenced by a cyclonic episode associated with a broad trough to the northwest of the Alps (see Fig. 2b). On the morning of 9 July, before the start of the campaign, rainfall persisted in the area, but following the passage of a cold front, warmer and drier air was advected towards the study site (see Fig. 3). At the end of August, the conditions on the northern side of the Alps were relatively cool and stable (see Figs. 2c and 3). On 25 to 26 August, shallow moist layers favored stratus formation, while the middle and upper troposphere remained dry and stable, limiting convective development. Finally, on 23 September, a strong anticyclone extended over central Europe (see Fig. 2d), producing clear, dry, and calm weather in the Bernese Alps. As in June, the absence of a significant synoptic forcing favoured the study of local and thermally driven winds on the glacier.
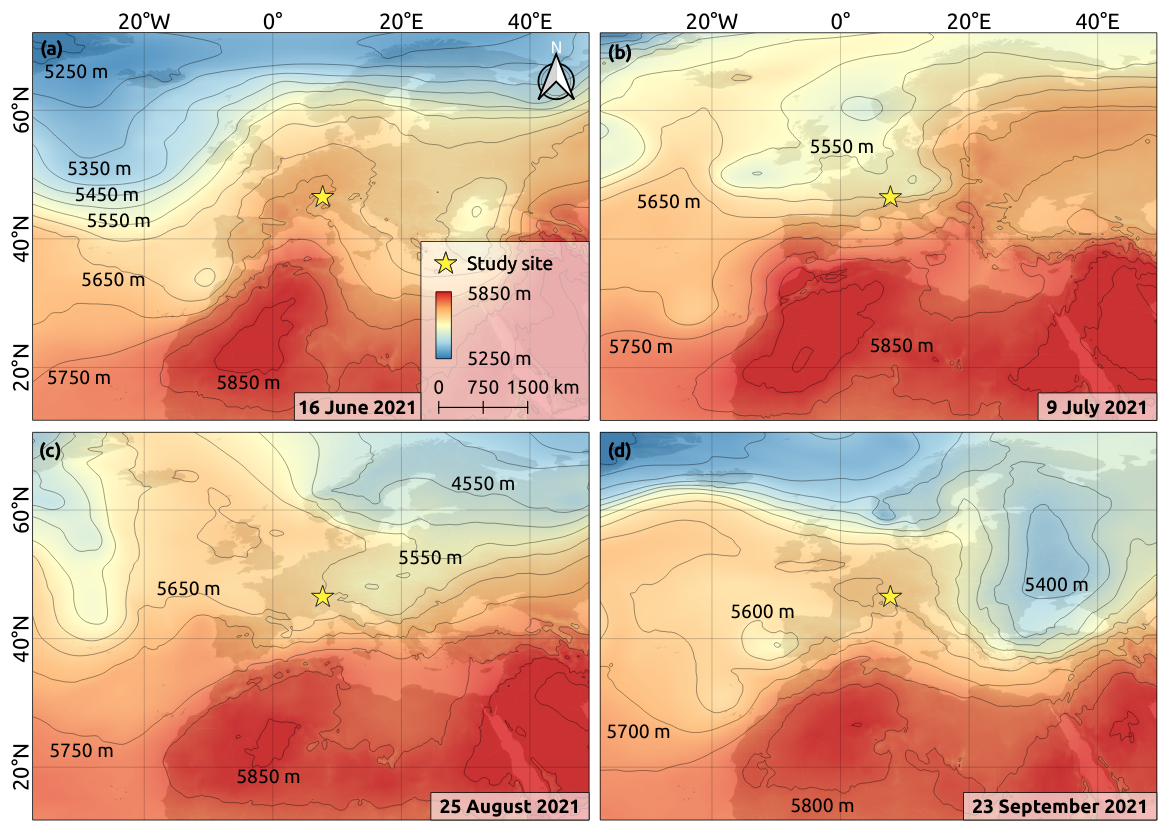
Figure 2Synoptic situation at the time of the measurement campaigns on 16 June (a), 9 July (b), 25 August (c) and 23 September 2021 (d). The synoptic weather charts show the atmospheric thickness between the 1000 and 500 hPa pressure levels derived from ERA5 data.
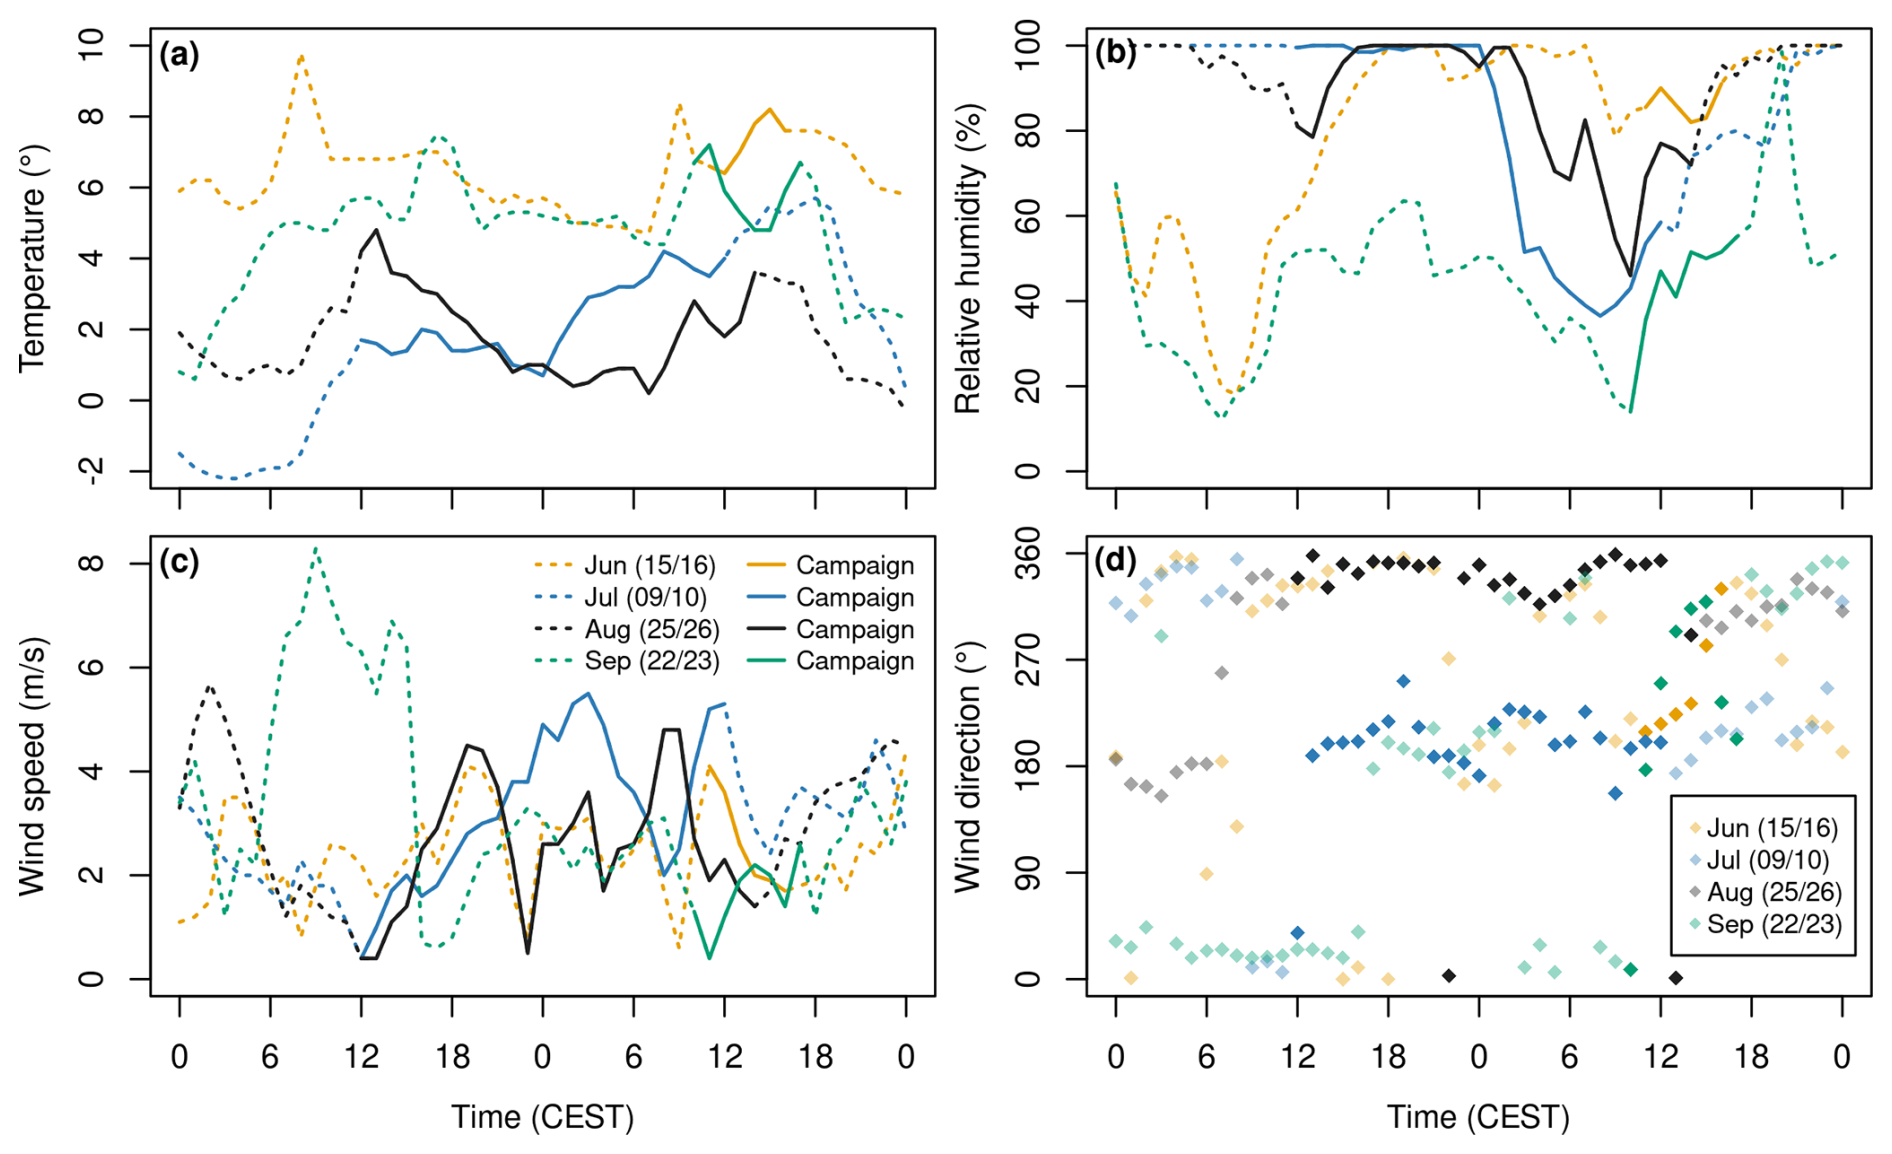
Figure 3Temperature (a), relative humidity (b), wind speed (c), and wind direction (d) recorded at the Sackhorn weather station in 2021 during two-day periods comprising the campaigns in June, July, August, and September.
4.1 Unoccupied Aerial System
For the atmospheric sounding of the boundary layer over alpine glaciers, we designed a lightweight Unoccupied Aerial System (UAS) using low-cost and open-source software and hardware developed within the framework of the Paparazzi UAV project (Hattenberger et al., 2014). The UAS is very similar to the one presented by Groos et al. (2019) for photogrammetric surveys in alpine terrain and consists of a ground segment, an airborne segment (i.e. the UAV) and a communication segment. A mobile and lightweight ground control station (GCS) is necessary in the field for the configuration, monitoring and control of the UAV. Our GCS consists of a rugged outdoor laptop running the Paparazzi software, a remote control (Graupner HoTT mx-16 2.4 GHz) for manual operation of the UAV and a bi-directional wireless modem (XBee Pro S2B 2.4 GHz) for communication between the GCS and the UAV. The wireless modem supports both telemetry (downlink) and telecontrol (uplink).
The fixed-wing UAV for atmospheric sounding (see Fig. 4) was built from scratch and has a wingspan of 160 cm. We used expanded polypropylene (EPP) fuselage parts available from the aeromodelling community to build two identical flying wings. The centrepiece of the UAV is the open-source autopilot (Apogee v1.0) that supports automatic and autonomous flight (Hattenberger et al., 2014). It was developed as part of the Paparazzi UAV project and can be replicated using the hardware design published online (https://wiki.paparazziuav.org/wiki/Apogee/v1.00, last access: 30 September 2025). A rear-mounted brushless electric motor (Hacker A30-12XL V4) with carbon folding propellers in pusher configuration provides the necessary thrust. Two digital servomotors (KST DS145 MG) control the ailerons. For automatic flight and communication with the GCS and remote control, the UAV is equipped with a Global Navigation Satellite System (GNSS, Drotek U-blox NEO-M8T), a wireless modem (XBee Pro S2B 2.4 GHz) and a receiver (Graupner HoTT mx-16 2.4 GHz). A 5000 mAh lithium polymer battery powers the whole system and supports flight times up to 45 min. Several small lights on the UAV enable atmospheric sounding at night. A digital humidity and temperature sensor (Sensiron SHT75), with an accuracy of ±1.8 % for relative humidity and of ±0.3 °C for air temperature (Sensirion, 2011), is connected to the autopilot. The sensor is housed in a white tube to protect it from direct solar radiation (see Fig. 4). During the flight, air flows through the tube from the front to the back, ensuring adequate ventilation of the sensor. All collected data is stored on an SD card and syncronised using the clock of the autopilot. In total, the UAV weighs less than 2 kg and costs about 1200 EUR (excluding the GCS and remote control).
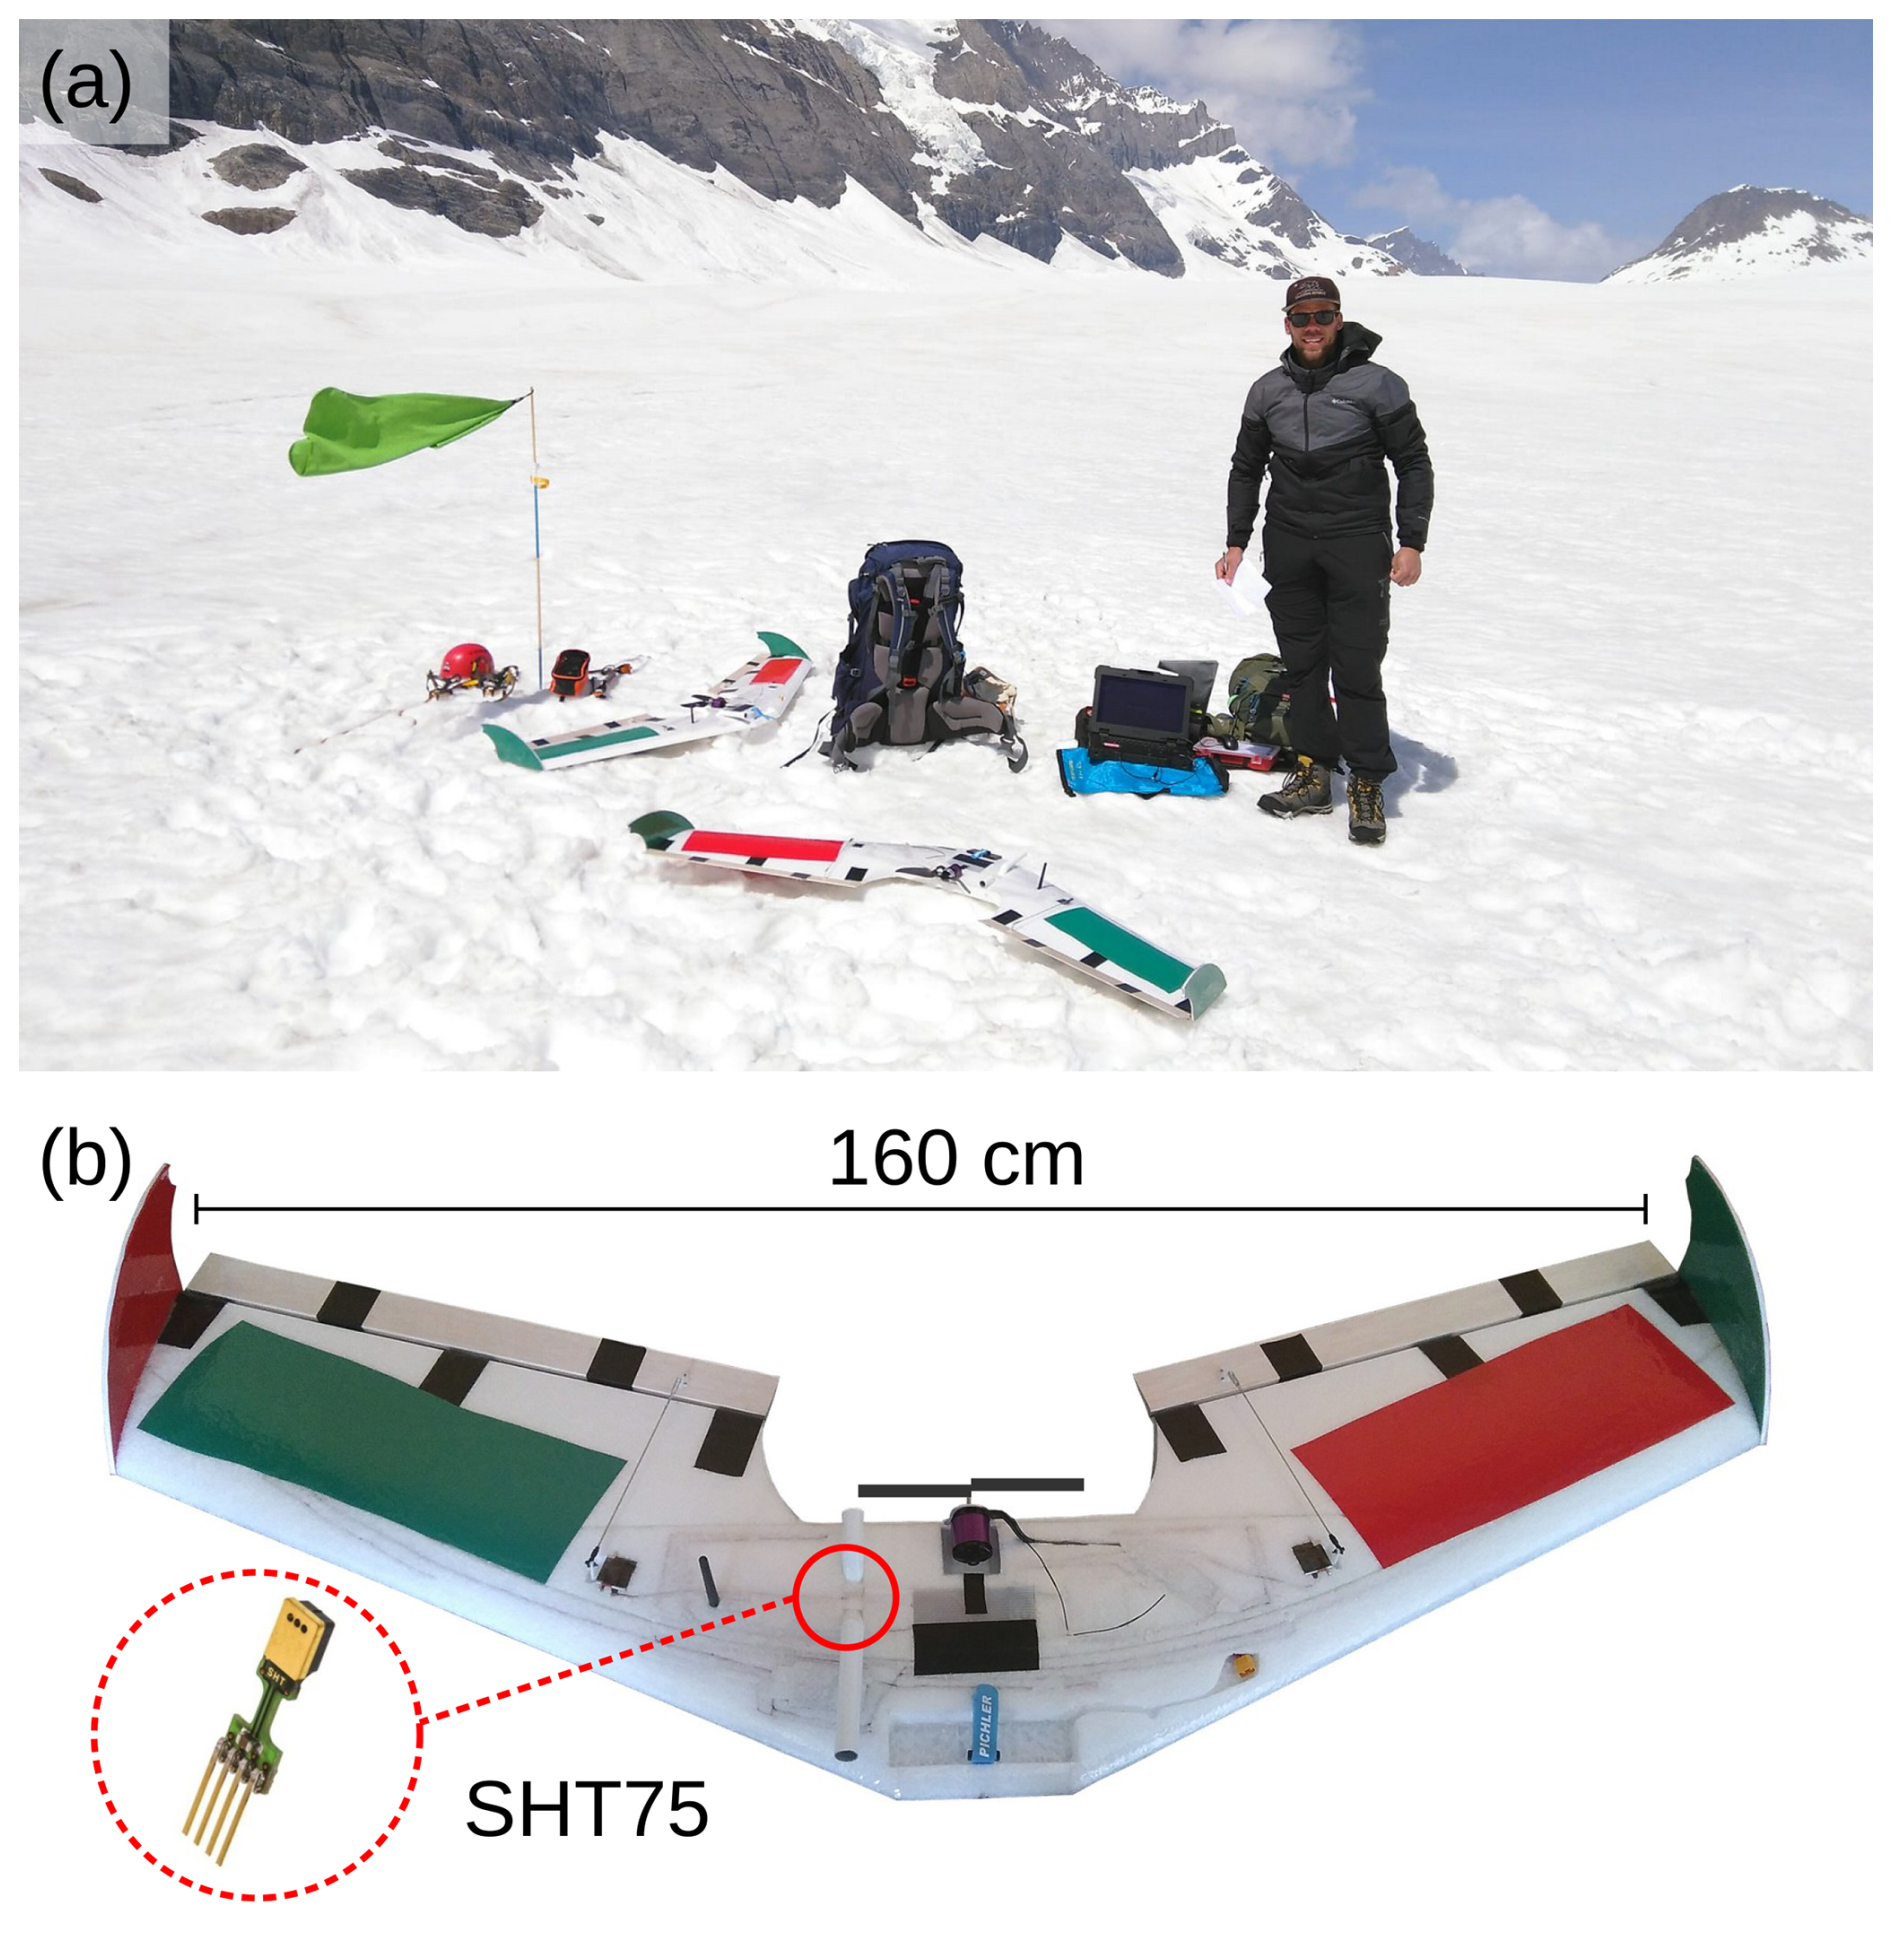
Figure 4UAS and local conditions during the first measurement campaign on 16 June 2021. (a) The Kanderfirn was completely snow-covered. The provisional weather vane (green flag) indicates the cold and dry katabatic wind that prevailed during the entire campaign. (b) Close-up view of the low-cost and open-source fixed-wing UAV equipped with a temperature and humidity probe (SHT75).
To cross-calibrate the temperature and humidity sensors on both UAVs (A2NO1 III and A2NO1 IV), a 24 h intercomparison measurement was performed indoors from 4 to 5 June 2021 with an independent reference logger (see Fig. A1). A fan in front of the two UAVs and reference logger ensured adequate ventilation of the sensors. The mean difference in air temperature between both SHT75 sensors was 0.43 °C and the mean difference in relative humidity was 1.5 % (see Fig. A2).
4.2 Atmospheric soundings
The air column sounded by the fixed-wing UAV was located in the central lower part of the glacier (46.46989° N, 7.777853° E, 2430 m a.m.s.l.), about 1 km from the terminus (see Fig. 1). A total of 40 flights, each (except one) consisting of two vertical profiles, were conducted during the four campaigns in 2021 (see Table 1). Two half-day campaigns were carried out on 16 June (8 flights) and 23 September (5 flights), and two 24 h campaigns, including nocturnal soundings, on 9/10 July (14 flights) and 25/26 August (13 flights). Take-off (i.e., hand launch) and landing of the UAV on the glacier were performed manually during the first three campaigns. For the last campaign, a bungee rope fixed into the glacier with an ice screw was successfully introduced to reduce the risk of failure during take-off. Planned take-offs on the hour were occasionally delayed due to poor GPS accuracy (see Table 1).
Table 1Key figures of the UAV-based atmospheric soundings on 16 June, 9/10 July, 25/26 August and 23 September 2021.
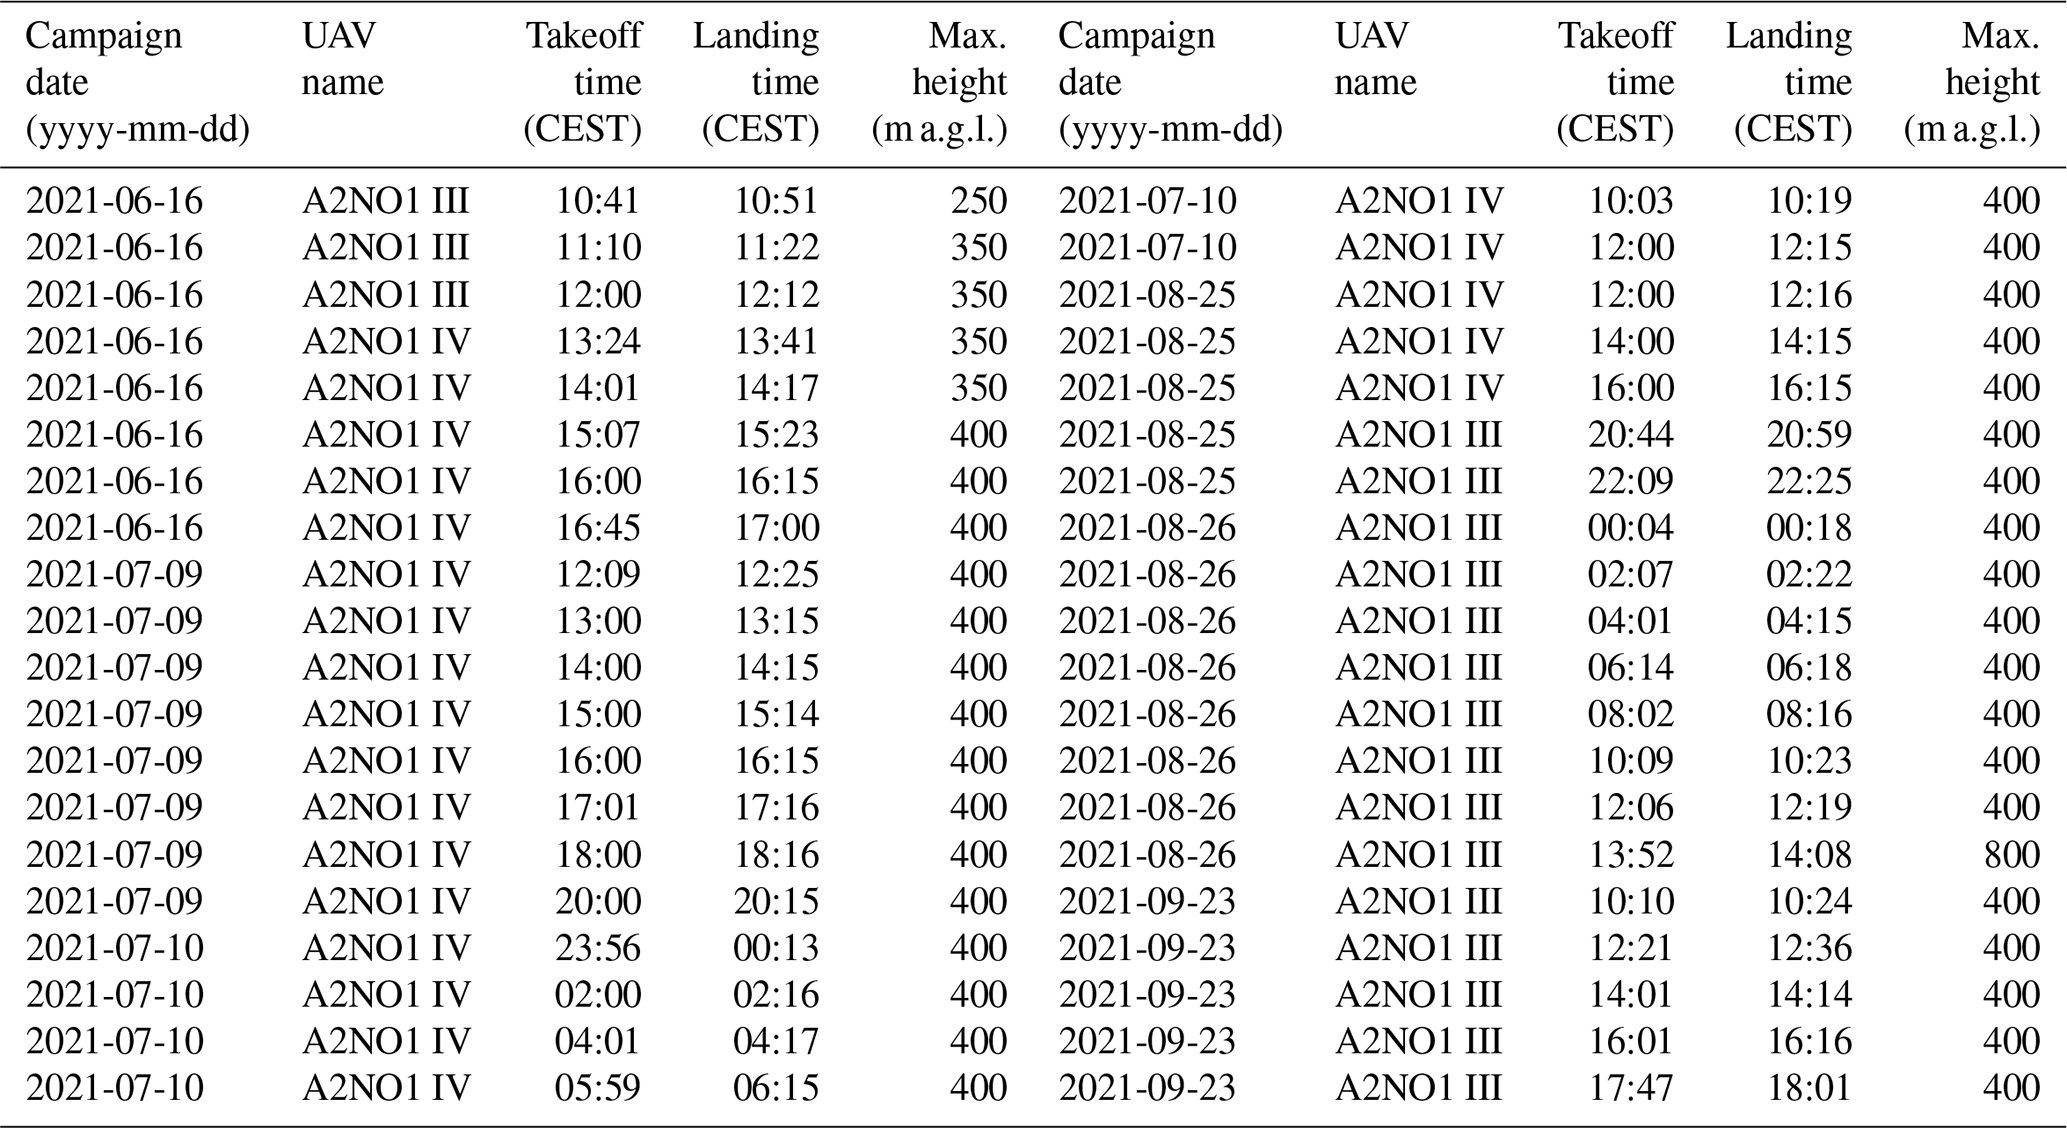
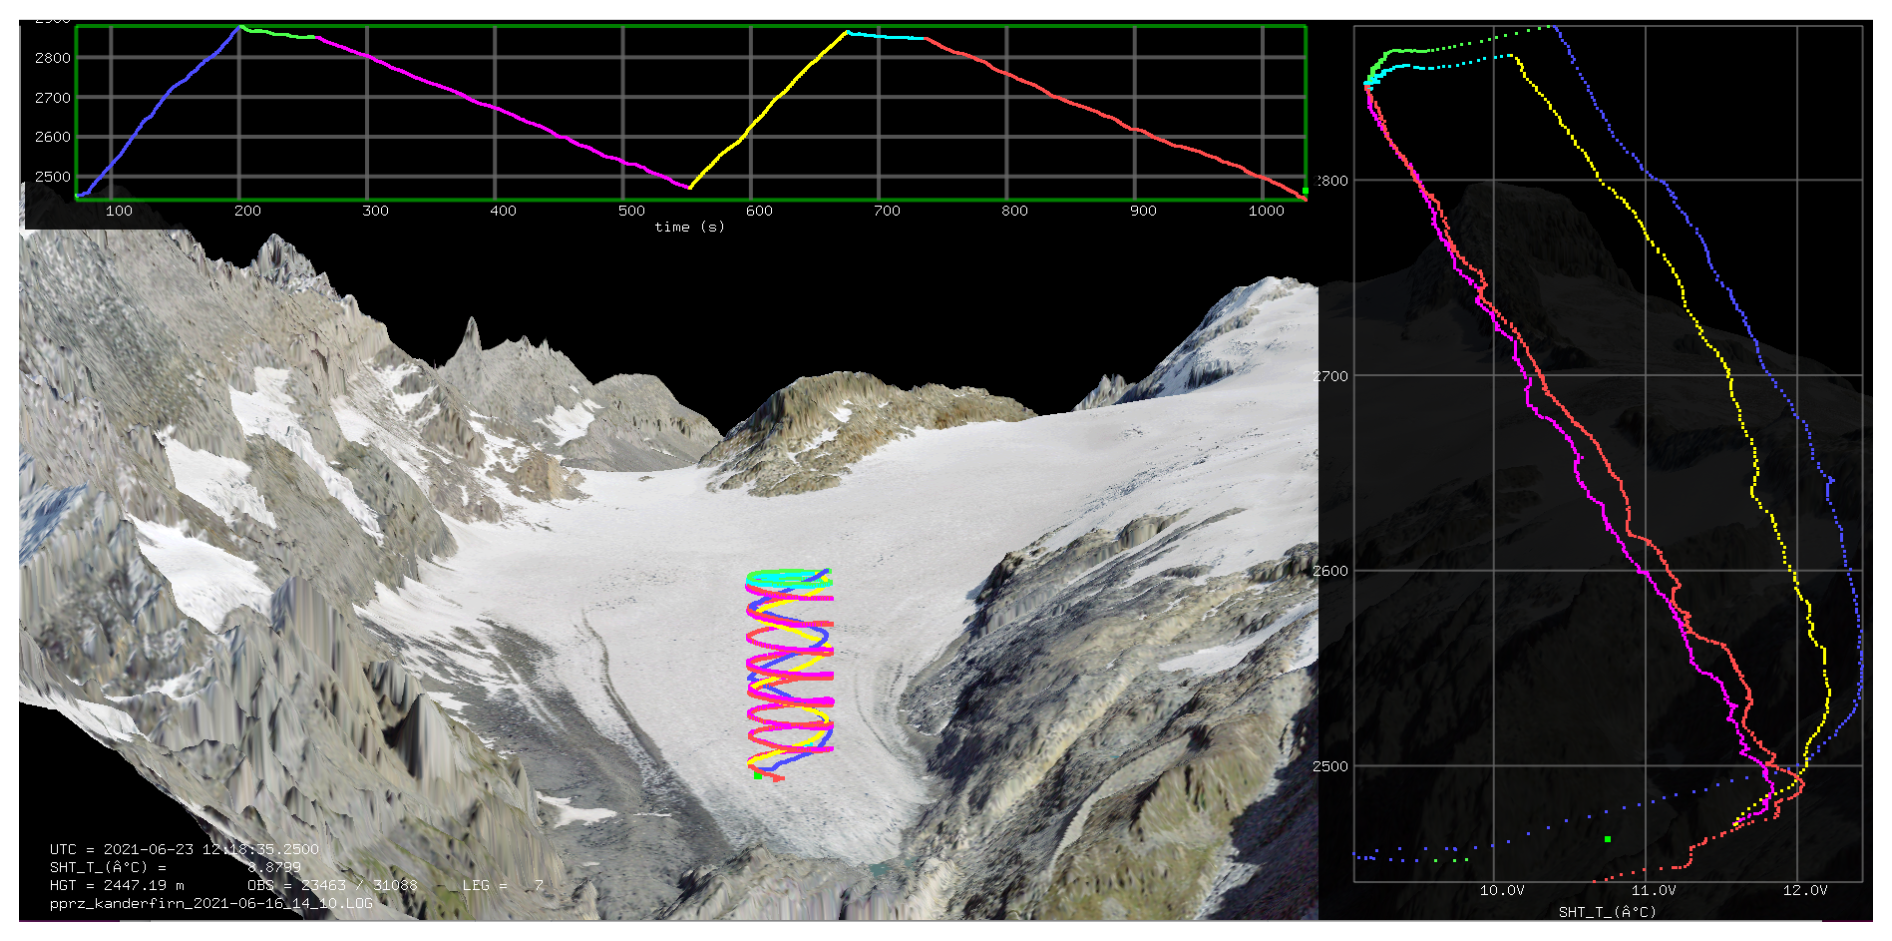
Figure 5Screenshot of the graphical user interface of the open-source software package mmp for data post-processing and 3D visualisation. The top panel shows the flight altitude (m a.m.s.l.) over time, the middle panel shows the flight path of two subsequent soundings and the right panel shows the temperature profiles for two climbs and two descents at about 13:30 CEST. Note that the air temperature measured during the two rapid climbs has a warm-bias due to the inertia of the sensors. The 3D glacier model was generated using open geodata (SWISSIMAGE and swissALTI3D) from Swisstopo.
For the vertical soundings, the UAV automatically followed a pre-programmed flight plan to measure air temperature and relative humidity up to 400 m (see Fig. 5). To demonstrate the feasibility of extending soundings to greater heights, one flight at the end of the August campaign was conducted up to 800 m above ground level (m a.g.l.). After a rapid ascent, the UAV always circled for 60 s at the predefined maximum height (see Table 1) to allow the SHT75 sensor to adapt to the ambient air. The descent was performed in a spiral with constant throttle and a radius of 75 m to enable derivation of wind speed and direction from the GNSS data (see Sect. 4.3). A low mean sink rate on the order of 2 m s−1 (see Fig. B1) was chosen to minimise the effect of sensor inertia (5 s for air temperature and 8 s for relative humidity to reach 63 % of a signal change). Once the UAV descended to less than 10 m a.g.l., the sounding was repeated. A complete sounding (consisting of two ascents and two descents) took approximately 15 min.
4.3 Data processing and analysis
The meteorological data (air temperature, relative humidity and air pressure) and flight recorder data (e.g. roll, pitch, yaw, battery voltage) collected during each sounding are stored in two different log files, which are synchronised using the clock of the autopilot. While the meteorological data are stored in a human readable text file, the flight recorder data are stored in a binary file that is decoded using checksums for further analysis. Decoding, post-processing and reformatting of the data is performed by the open-source FORTRAN software package mmp (mobile measurement post-processing) by Philipp (2025), which assigns all sensor messages to unified time steps and detects take-offs, touch-downs and outliers in the messages from the GNSS module. Time lag correction for the SHT75 sensor and calculation of horizontal wind components can also be performed by this package.
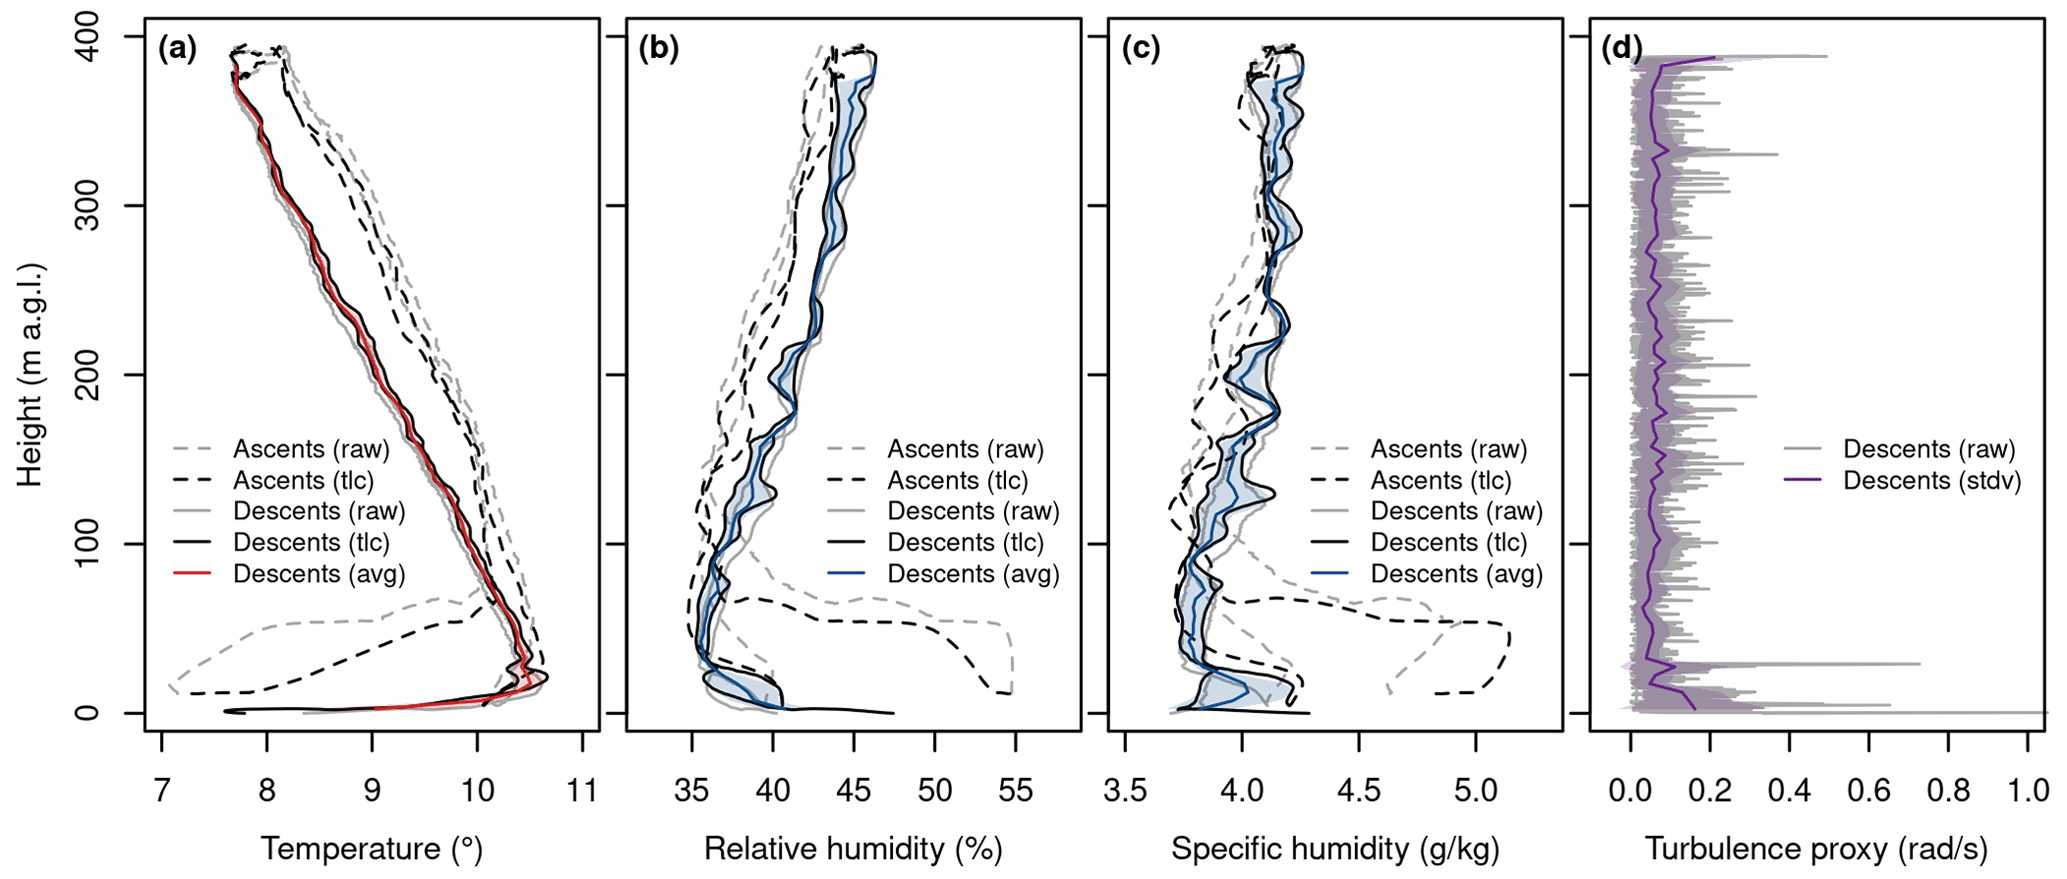
Figure 6Example profiles of measured air temperature (a), measured relative humidity (b), derived specific humidity (c), and estimated turbulence (d) from the sounding on 23 September 2021 at 14:00 CEST, based on both ascent and descent data. raw = measurements recorded on the SD card, tlc = time-lag-corrected, avg = average profile from both descents. Shaded areas denote the standard deviation between the two profiles.
For the analysis of vertical and temporal variations of air temperature, humidity, wind speed, wind direction and turbulence over the glacier surface, only the data from the two consecutive descents (i.e. downward spirals) of each flight were considered, because the measurements from the two ascents are strongly affected by the rapid rate of climb (see Figs. 5, 6). To account for sensor response times (τ=5 s for temperature, τ=8 s for humidity), we applied a time-lag correction to the descent profiles, followed by a Gaussian low-pass filter ( s) to limit noise amplification. The first descent of each sounding lacks data from the lowest metres above the surface, as the uneven terrain and GPS accuracy did not support flying below 10 m a.g.l. before the start of the second climb. The second descent covers the full profile down to the surface. Due to the limited GPS accuracy, the recorded absolute flight altitude varied by a few metres between the different soundings. Therefore, we used the average altitude after landing of each flight to standardise the base height of all soundings.
For each individual vertical profile, air temperature from both descents was merged and binned into 5 m height intervals for consistent comparison. The air temperature measured by UAV A2NO1 III (see Table 1) was adjusted to harmonise the SHT75 sensors of both UAVs (A2NO1 III and A2NO1 IV) using a correction factor of 0.43 °C obtained from the 24 h intercomparison measurement (see Appendix A). To estimate the thickness of the cool katabatic wind that was predominant during all campaigns, we calculated the top height of the surface-based inversion (SBI) visible in most air temperature profiles as follows. We considered air temperature (T) as a function of altitude (z):
To eliminate the short-term variability superimposed on the general air temperature change with altitude, we smoothed the air temperature measurements from the second descent (extending down to the glacier surface) using a Savitzky-Golay filter (Savitzky and Golay, 1964). This filter applies a local polynomial fit within a moving window, which preserves the overall structure of the vertical profile while reducing high-frequency noise. We then computed the first derivative of the smoothed air temperature profile with respect to altitude, since the top of the SBI is characterised by a transition of the temperature gradient from positive to negative values (see Fig. C1b).
The lowest altitude (z=zi) where the first derivative is zero was determined as the top height (zi) of the SBI:
To calculate the lapse rate (i.e. air temperature gradient) above and below the top height of the SBI (zi), we performed a simple linear regression (see Appendix C). For the data points below zi, the linear regression model can be expressed as:
where a1 is the lapse rate below zi and b1 is the intercept. For the data points above zi, the linear regression model can be expressed as:
where a2 is the lapse rate above zi and b2 is the intercept. In addition to the UAV-based lapse rates, we also calculated the environmental lapse rate for the study area at the time of each sounding using data from three nearby weather stations: Fisistock, Gandegg and Sackhorn (see Figs. 1, C1).
Since spatio-temporal variations in relative humidity (RH) can be the result of changes in air temperature, air pressure and/or water vapour, it is not an unambiguous parameter for analysing and interpreting changes in air moisture. Specific humidity (q) is more suitable as it is not sensitive to air temperature or pressure. We have therefore converted the recorded relative humidity (%) into specific humidity (g kg−1) as follows (see Fig. 6):
The partial vapour pressure at saturation (ps) for a given air temperature (T) is calculated using empirical constants from DWD (1976) by:
where E0=6.10780 hPa, A=17.08085 and B=234.175 K. The actual vapour pressure (e) is then given by:
Finally, the specific humidity (q) in g per kg is calculated as:
where mv is the molar mass of water vapour (18.01534 g mol−1), ma is the molar mass of dry air (28.9644 g mol−1) and p is the pressure (in hPa) either measured or calculated from elevation assuming the standard atmosphere. As with air temperature, the specific humidity data from both descents were merged and binned into 5 m height intervals to allow consistent comparison across soundings.
Unlike air temperature and humidity, wind speed, wind direction and turbulence were not measured directly. These three parameters had to be derived from the GNSS data and the recordings made by the inertial measurement unit. The wind estimation algorithm is based on the concept described by Mayer et al. (2012) and Bonin et al. (2013). The wind direction is estimated from the variation in ground speed during a full circle of the flight path with all UAV flight controls, in particular throttle and pitch, held constant. The (opposite) wind direction is then the flight direction at maximum (minimum) ground speed within a circle. The wind speed can be assumed to be the difference between the average ground speed during a circle and the maximum or minimum ground speed.
As a rough approximation of turbulence, the roll rate recorded by the inertial measurement unit at 4 Hz can be used, since eddies with diameters ranging from a few decimetres to a few metres, acting differently on the two wings, cause short rotational movements around the longitudinal axis of the UAV. The intensity of turbulence can then be estimated by calculating the standard deviation of the roll rates within a certain vertical section. In order to focus on the vertical scale of several meters, the turbulence proxy is calculated for 5 m height intervals by computing the standard deviation of all roll rate data points from both descents that fall into the respective bin. This proxy measure of turbulence can only be a rough estimate, as large parts of the turbulence spectrum are missing. Therefore, absolute values, e.g., for turbulence kinetic energy, cannot be derived. However, it is able to depict the general tendency of relatively increasing or decreasing turbulence.
5.1 General boundary layer structure and local circulation
The 40 profiles of air temperature, specific humidity, wind speed, and wind direction obtained from UAV-based atmospheric soundings during four measurement campaigns on the Kanderfirn in summer 2021 clearly reflect the prevailing synoptic situation, while also revealing characteristic patterns of the boundary layer structure and local circulation in alpine terrain. An overview of all profiles from each campaign is provided in Fig. 7.
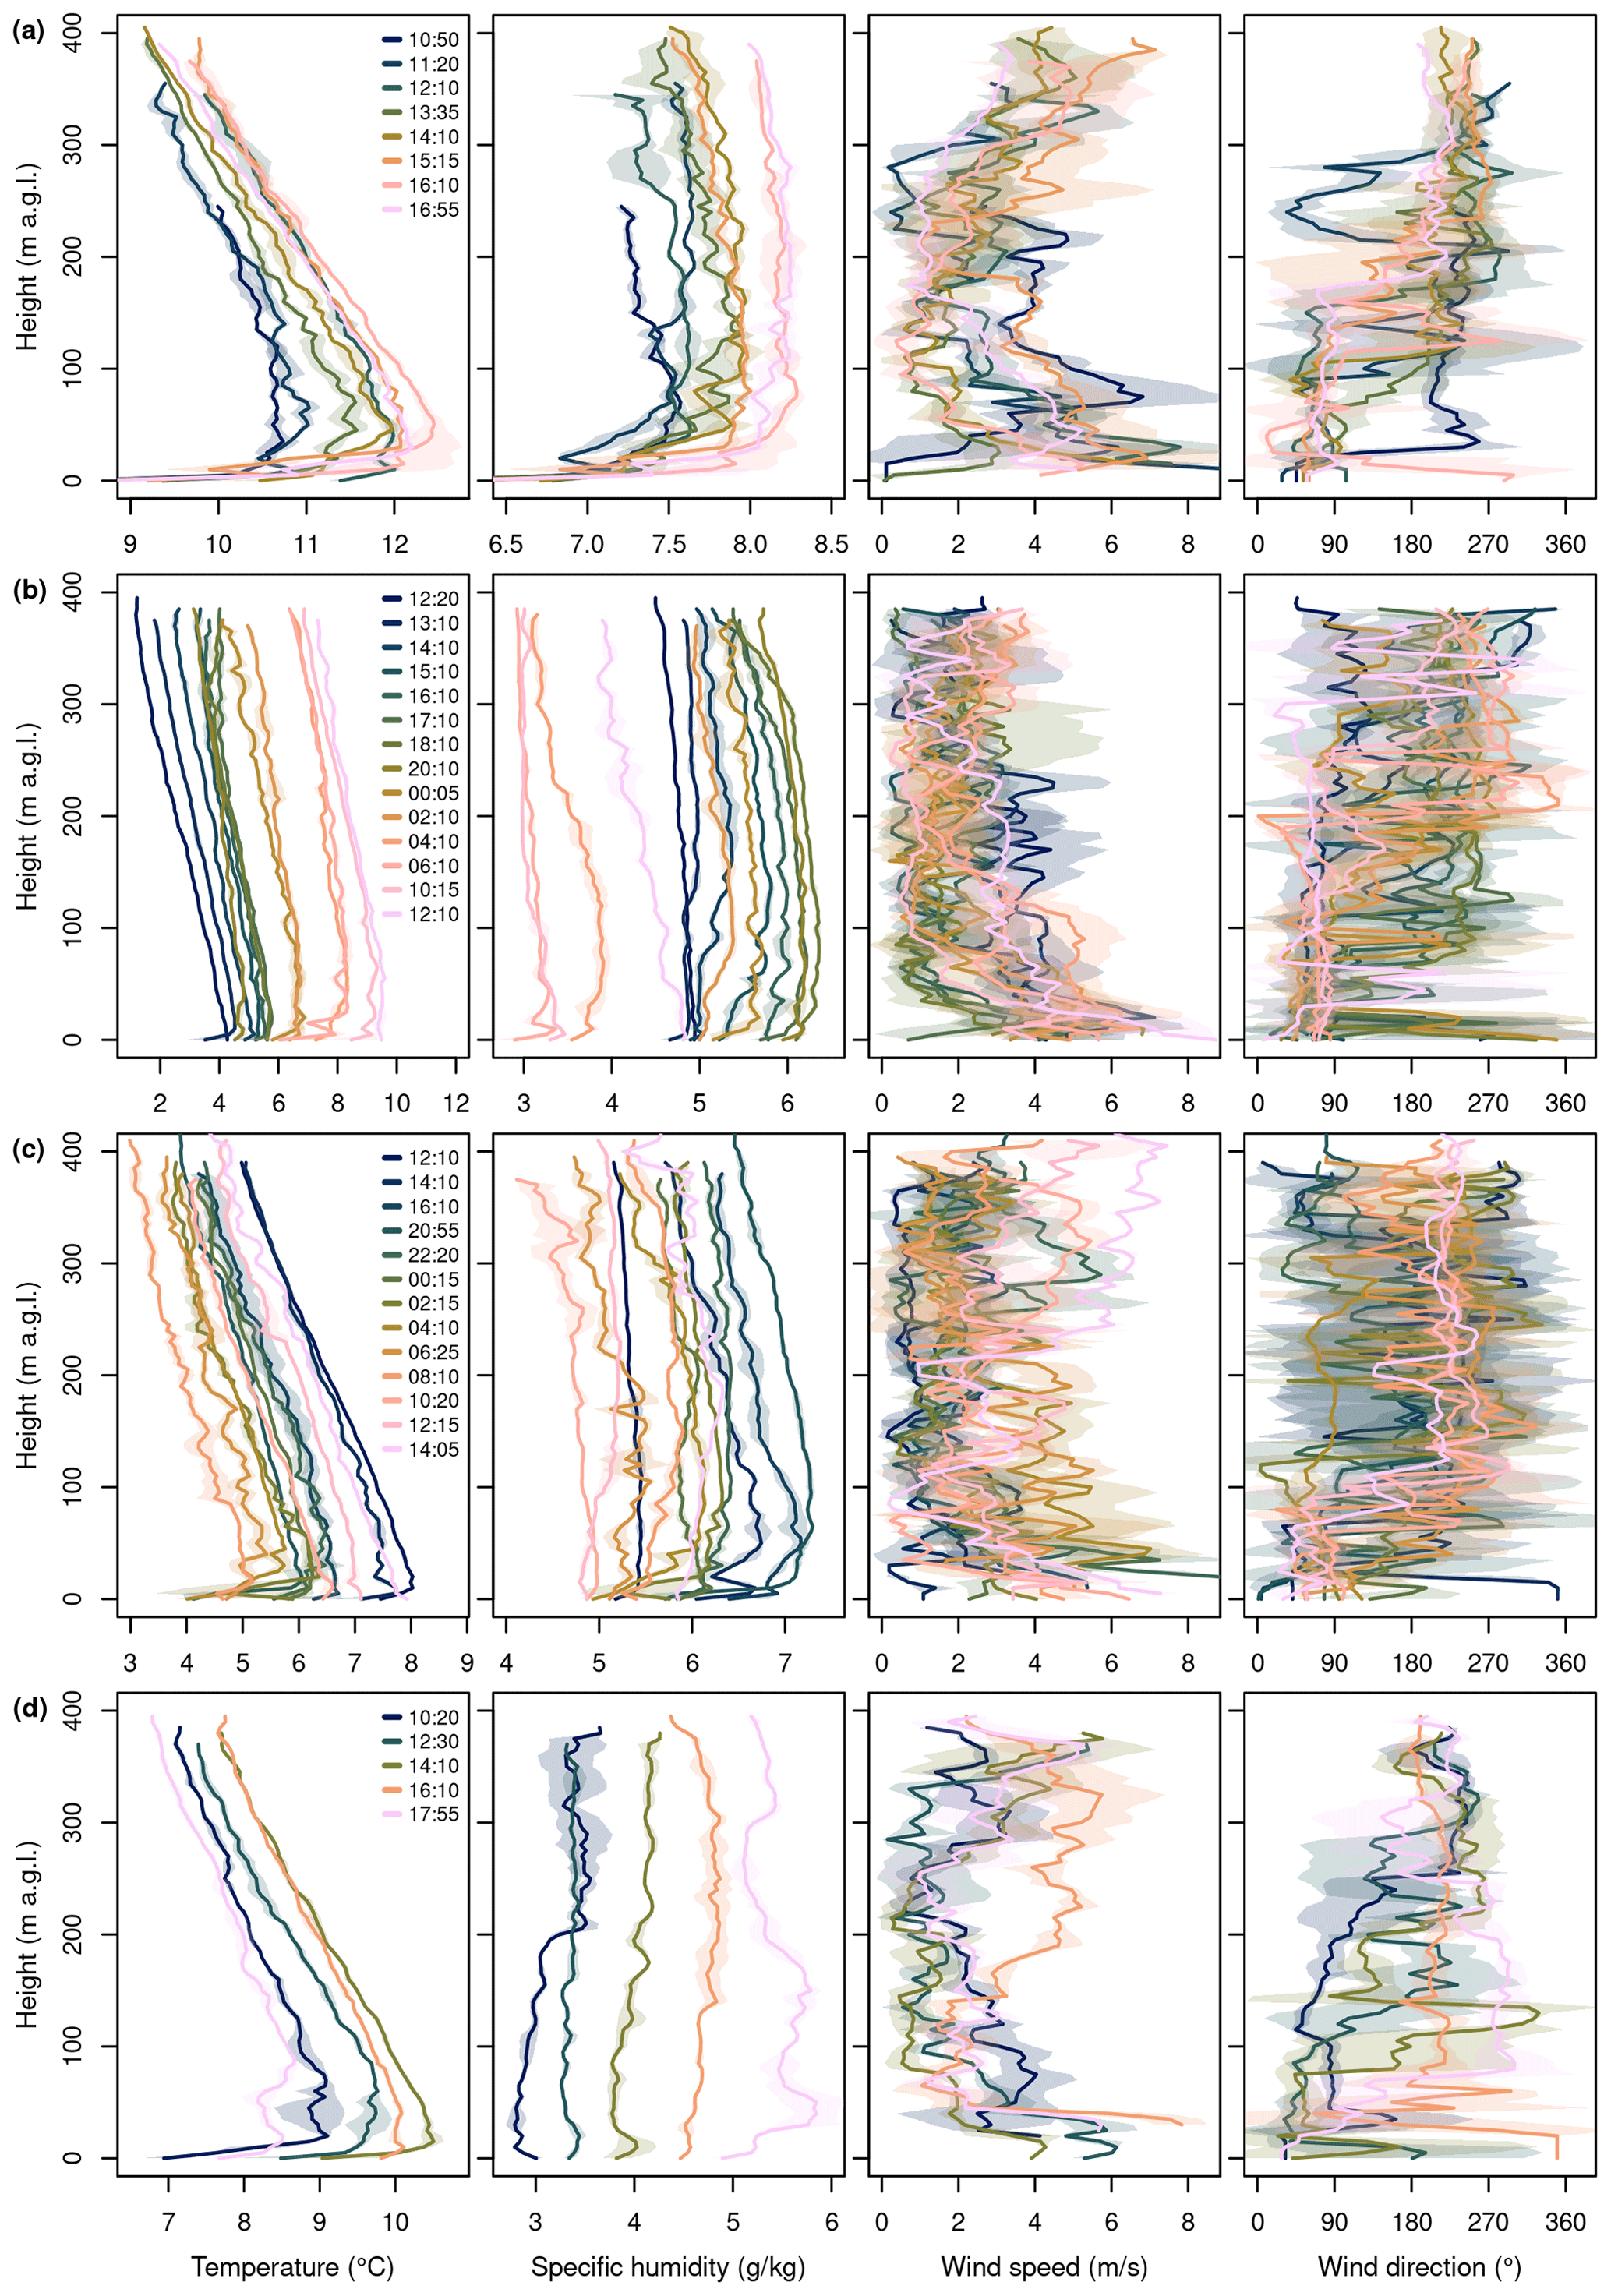
Figure 7Overview of all 40 profiles of air temperature (first column), specific humidity (second column), wind speed (third column), and wind direction (fourth column) from the measurement campaigns on 16 June (a), 9/10 July (b), 25/26 August (c), and 23 September 2021 (d). Shaded areas indicate the standard deviation between consecutive descents of each sounding.
The two consecutive descent measurements of temperature and humidity from each flight agree closely, as indicated by the narrow shaded area around the mean profiles in Fig. 7. This consistency supports the reliability and representativeness of the individual soundings. Larger deviations (e.g. >0.5 °C, >0.5 g kg−1) between successive descents at certain height levels (see for example the 10:20 CEST flight in September, Fig. 7d) suggest short-term dynamics and local mixing within the glacier boundary layer, but such cases are overall rare. In contrast, wind speed and wind direction profiles from a given flight naturally show higher temporal variability, yet they still generally match well (Fig. 7).
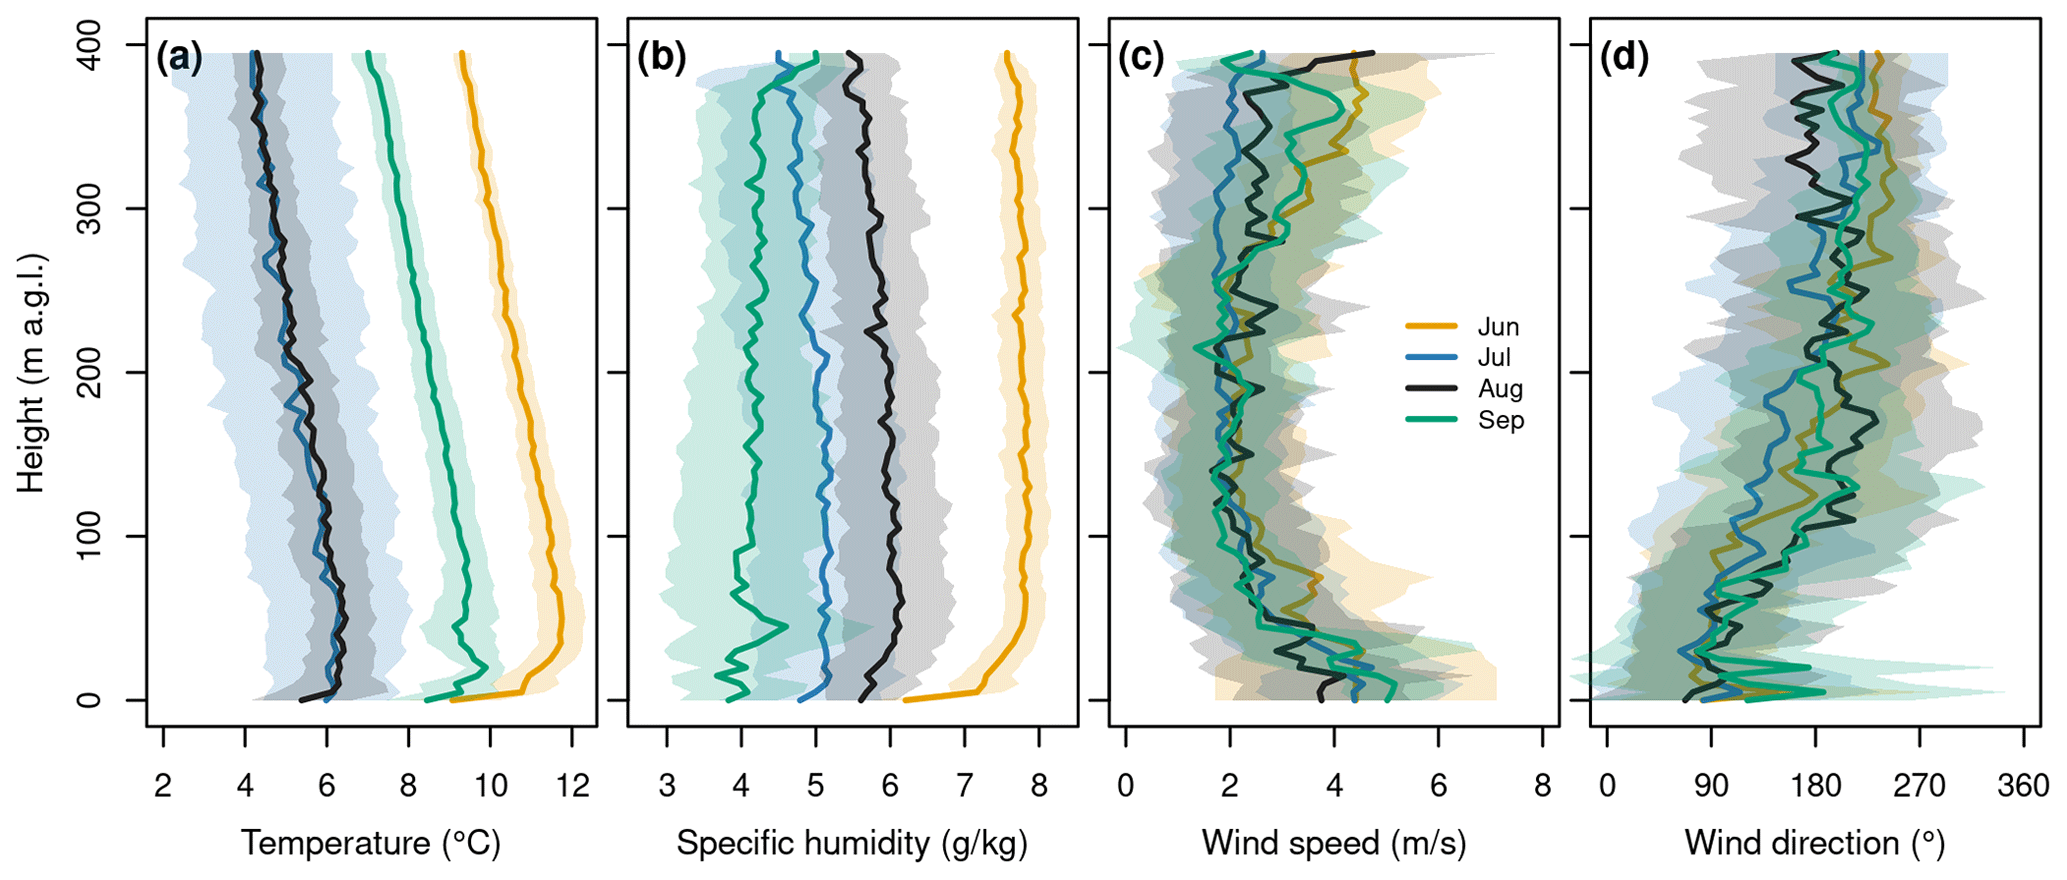
Figure 8Mean profiles of air temperature (a), specific humidity (b), wind speed (c), and wind direction (d) for all four campaigns (summarised from Fig. 7). Shaded areas indicate the standard deviation across all profiles within each campaign.
The aggregated mean profiles for each campaign highlight substantial variability between synoptic conditions: mean air temperature differed by up to 6 °C and specific humidity by up to 4 g kg−1 (Fig. 8), underscoring the strong influence of large-scale weather patterns on the glacier boundary layer (Fig. 2). By contrast, the aggregated mean wind speed and wind direction profiles are strikingly similar across all campaigns, despite large variability within each campaign. All four exhibit a characteristic C-shape: relatively high wind speeds (4–5 m s−1) near the glacier surface, a decrease with height up to about 100 m a.g.l., low wind speeds (about 2 m s−1) between 100 and 200 m a.g.l., and a subsequent increase up to 400 m (Fig. 8). Notably, the wind speed decrease in the lower part coincides with a shift in mean wind direction from east-northeast (70–90°, down-glacier) to southwest (220–240°, up-glacier).
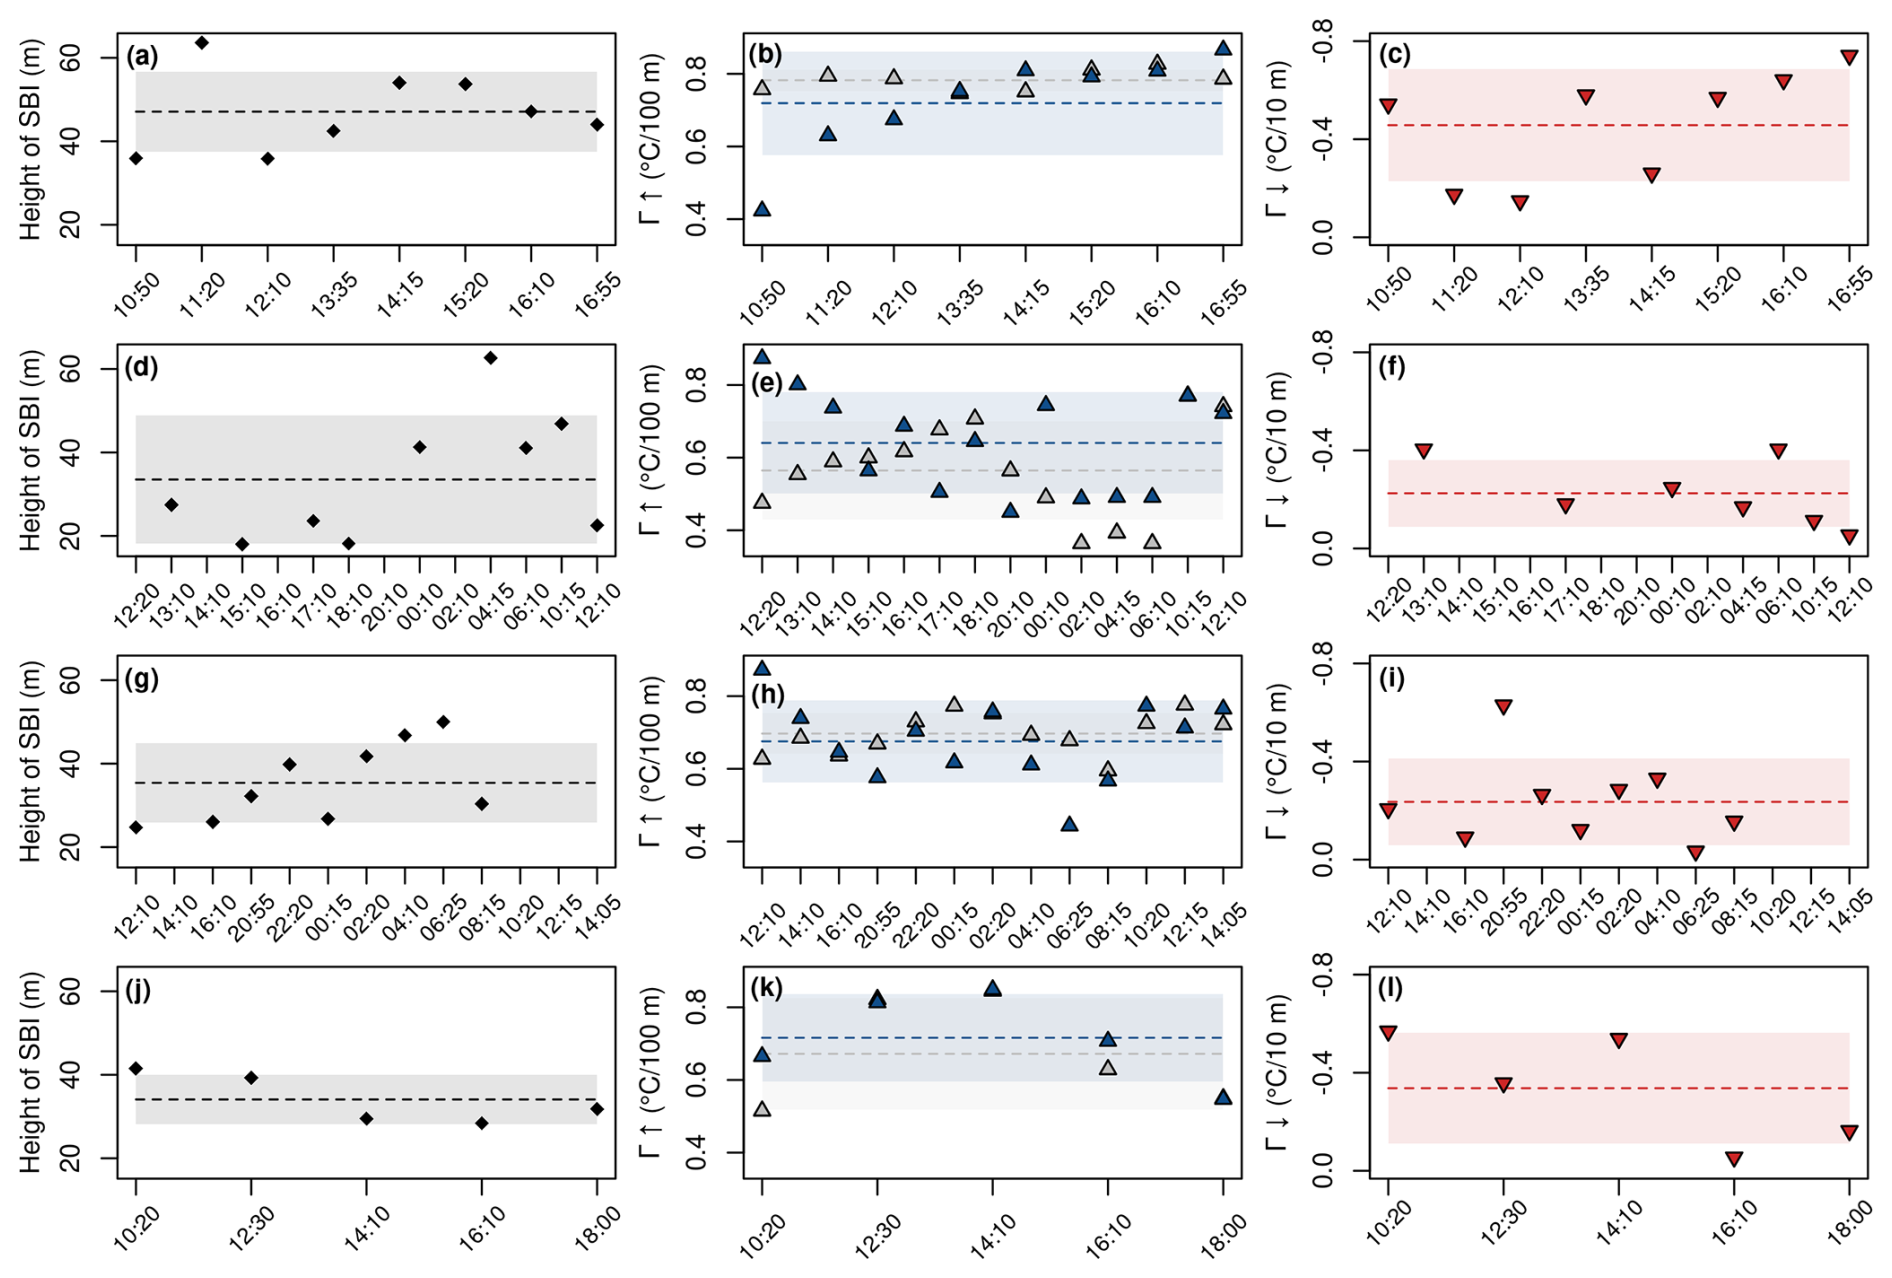
Figure 9Top height of the surface-based inversion (SBI; first column), lapse rate above the SBI (Γ↑) or above the glacier surface when no SBI was present together with the environmental lapse rate from the nearby weather stations Fisistock, Gandegg, and Sackhorn (second column), and lapse rate below the SBI (Γ↓, third column) for each profile of the June (a–c), July (d–f), August (g–i), and September (j–l) campaigns. Dashed lines indicate the campaign mean, and shaded areas represent the standard deviation. Note that the grey and blue triangles at 12:30, 14:10 and 18:00 CEST overlap in panel (k).
A distinct surface-based inversion (SBI) characterises all aggregated mean temperature profiles, especially in June and September (Figs. 8, 9). The SBI is characterised by a sharp temperature increase and, in some cases, also by a marked increase in moisture above the glacier surface. With the exception of five soundings in July and four in August, a SBI was present in all profiles. Across campaigns, the mean SBI top height is 38 ± 12 m. The mean lapse rate below the SBI is −0.31 ± 0.21 °C per 10 m, whereas the mean lapse rate above the SBI (or above the glacier surface in its absence) is 0.68 ± 0.13 °C per 100 m. This latter value closely matches the mean environmental lapse rate (0.66 ± 0.13 °C per 100 m) derived from the three nearby weather stations at the times of the soundings (Fig. 1). However, larger deviations between the lapse rate above the SBI or glacier surface and the environmental lapse rate are evident at the time of individual soundings.
5.2 Boundary layer evolution (16 June 2021)
The half-day campaign on 16 June 2021 (late morning to late afternoon, 8 soundings) took place under the influence of an anticyclone over the Sahara, which created overall stable conditions in the study region (see Sect. 3 and Fig. 2). The June campaign was characterised by the warmest and most humid air column of all four measurement periods (Fig. 8). A distinct SBI was observed throughout the campaign, consistently present in all soundings and representing a defining feature of the boundary layer structure over the glacier during this period (Fig. 7a).
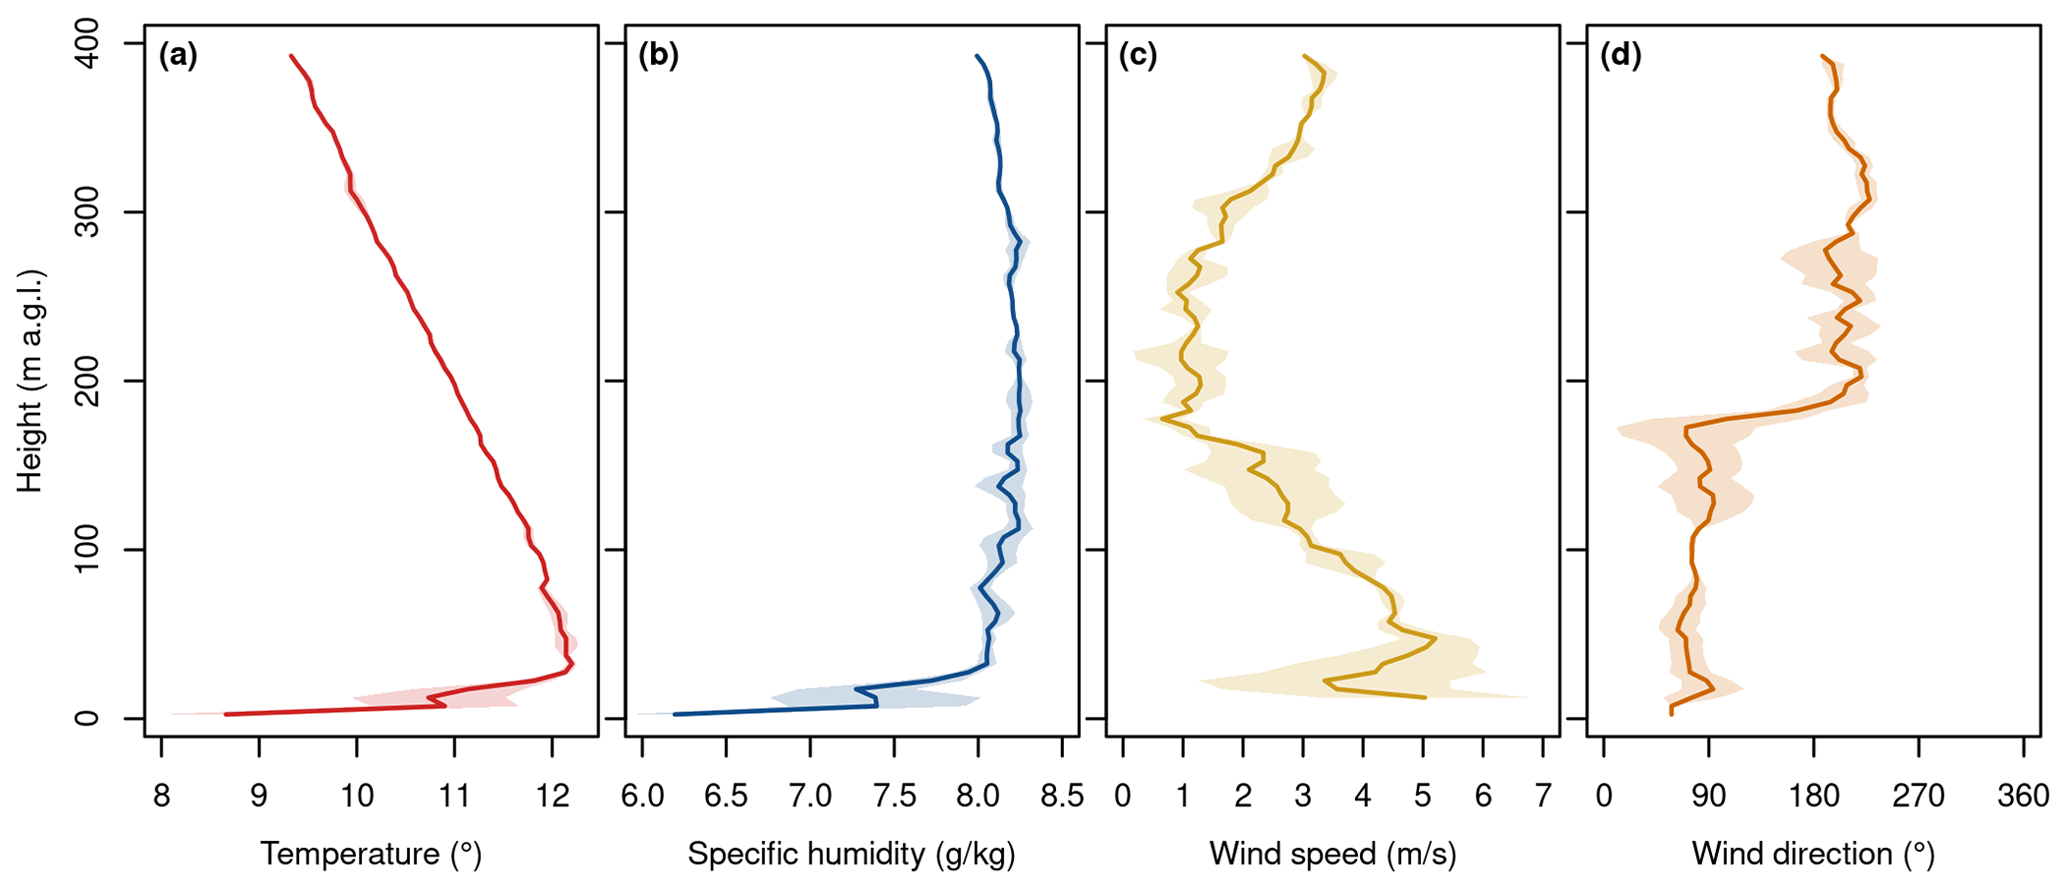
Figure 10Exemplary synthesis plot showing air temperature (a), specific humidity (b), wind speed (c), and wind direction (d) profiles from the 16:55 CEST sounding on 16 June 2021. Shaded areas indicate the standard deviation between the two consecutive descents of this sounding.
The mean top height of the SBI was relatively high at 47 ± 12 m (Fig. 9a). Below the SBI, a distinct negative lapse rate of −0.46 °C per 10 m was observed, indicating a sharp temperature increase just above the glacier surface. Above the SBI, the mean lapse rate was 0.72 °C per 100 m. From late morning to afternoon, the lapse rate above the SBI gradually increased, while the near-surface inversion remained pronounced (Fig. 9b, c). The katabatic wind coincided with exceptionally dry conditions near the surface, more distinct than during any other campaign, as illustrated by the synthesis plot from the 16:55 CEST flight (Fig. 10a, b).
Wind profiles exhibited the typical C-shape found across campaigns, with relatively high wind speeds at the surface, a decrease with height, and a subsequent increase (Fig. 7a). In the 16:55 CEST example profile, wind speed decreased from the surface up to about 170 m, where wind direction shifted abruptly from 80–90° (glacier wind) to 240–250° (valley wind) (Fig. 10c, d).
The temporal evolution of the boundary layer is captured by the heat maps of air temperature, specific humidity, and turbulence (Figs. 11–13). A continuous warming of the entire column was observed until around 16:10 CEST, after which cooling set in (Figs. 7a, 11a). Specific humidity increased steadily throughout the afternoon (Figs. 7a, 12a). No clear diurnal trend in turbulence was detected, although enhanced turbulence was present in the lowest 20–30 m above the glacier surface (Fig. 13a).
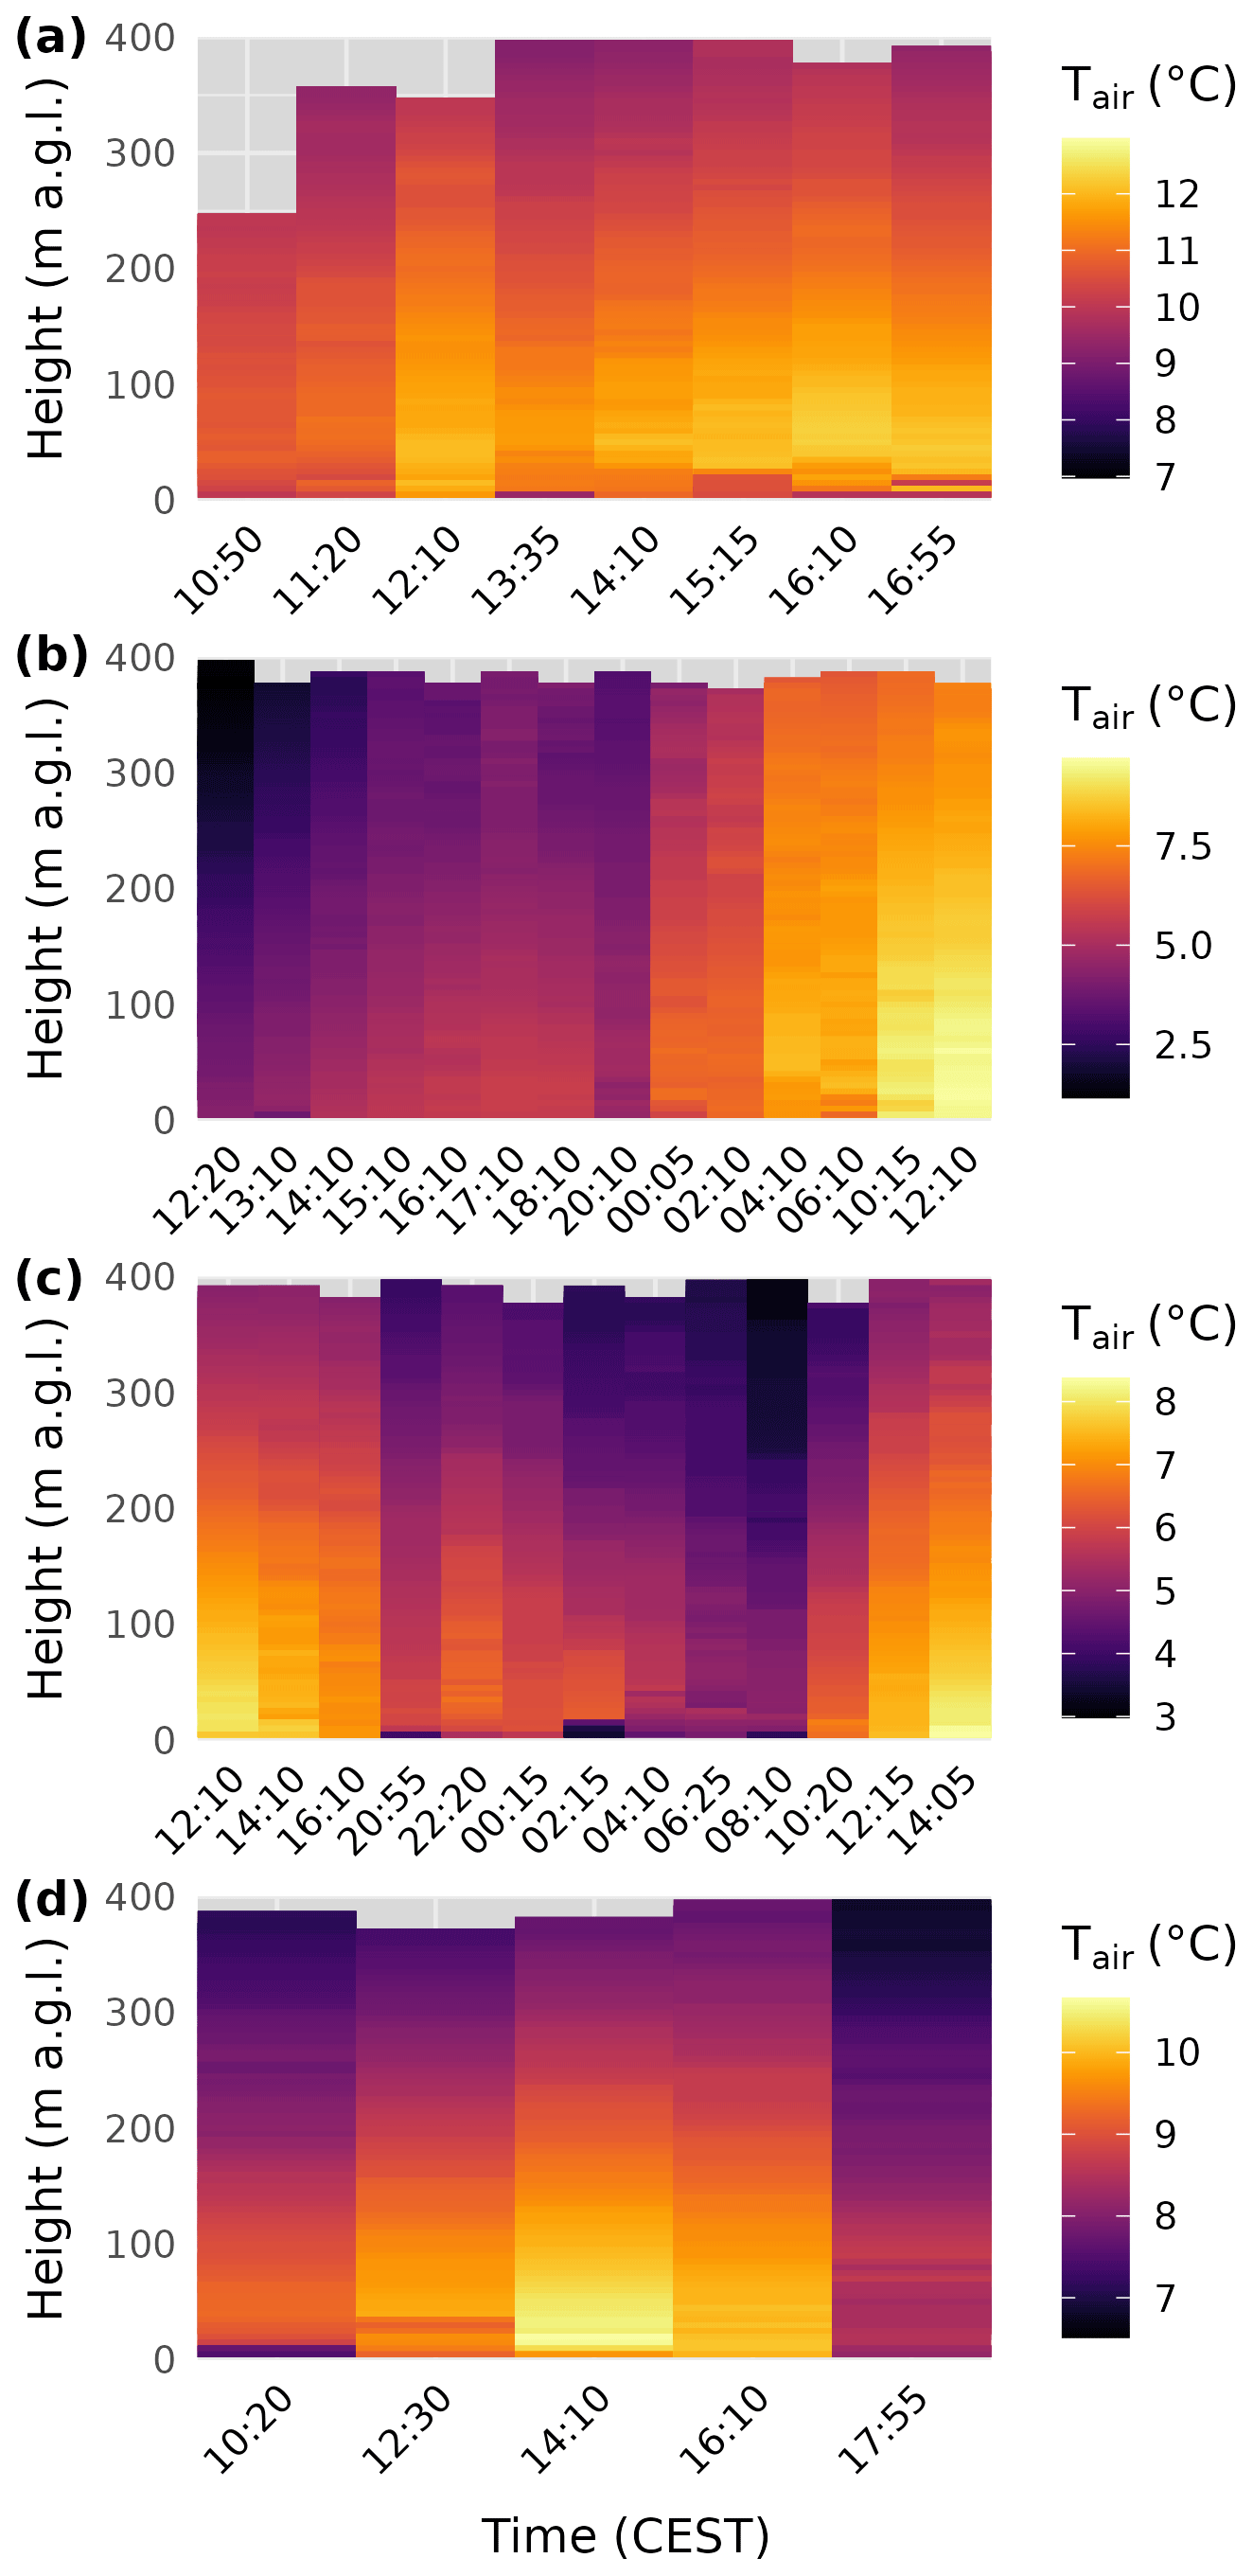
Figure 11Heat maps of the temporal evolution of air temperature over the tongue of the Kanderfirn during the four measurement campaigns in 2021: 16 June (a), 9/10 July (b), 25/26 August (c), and 23 September (d). Note that the temperature scale differs between campaigns.
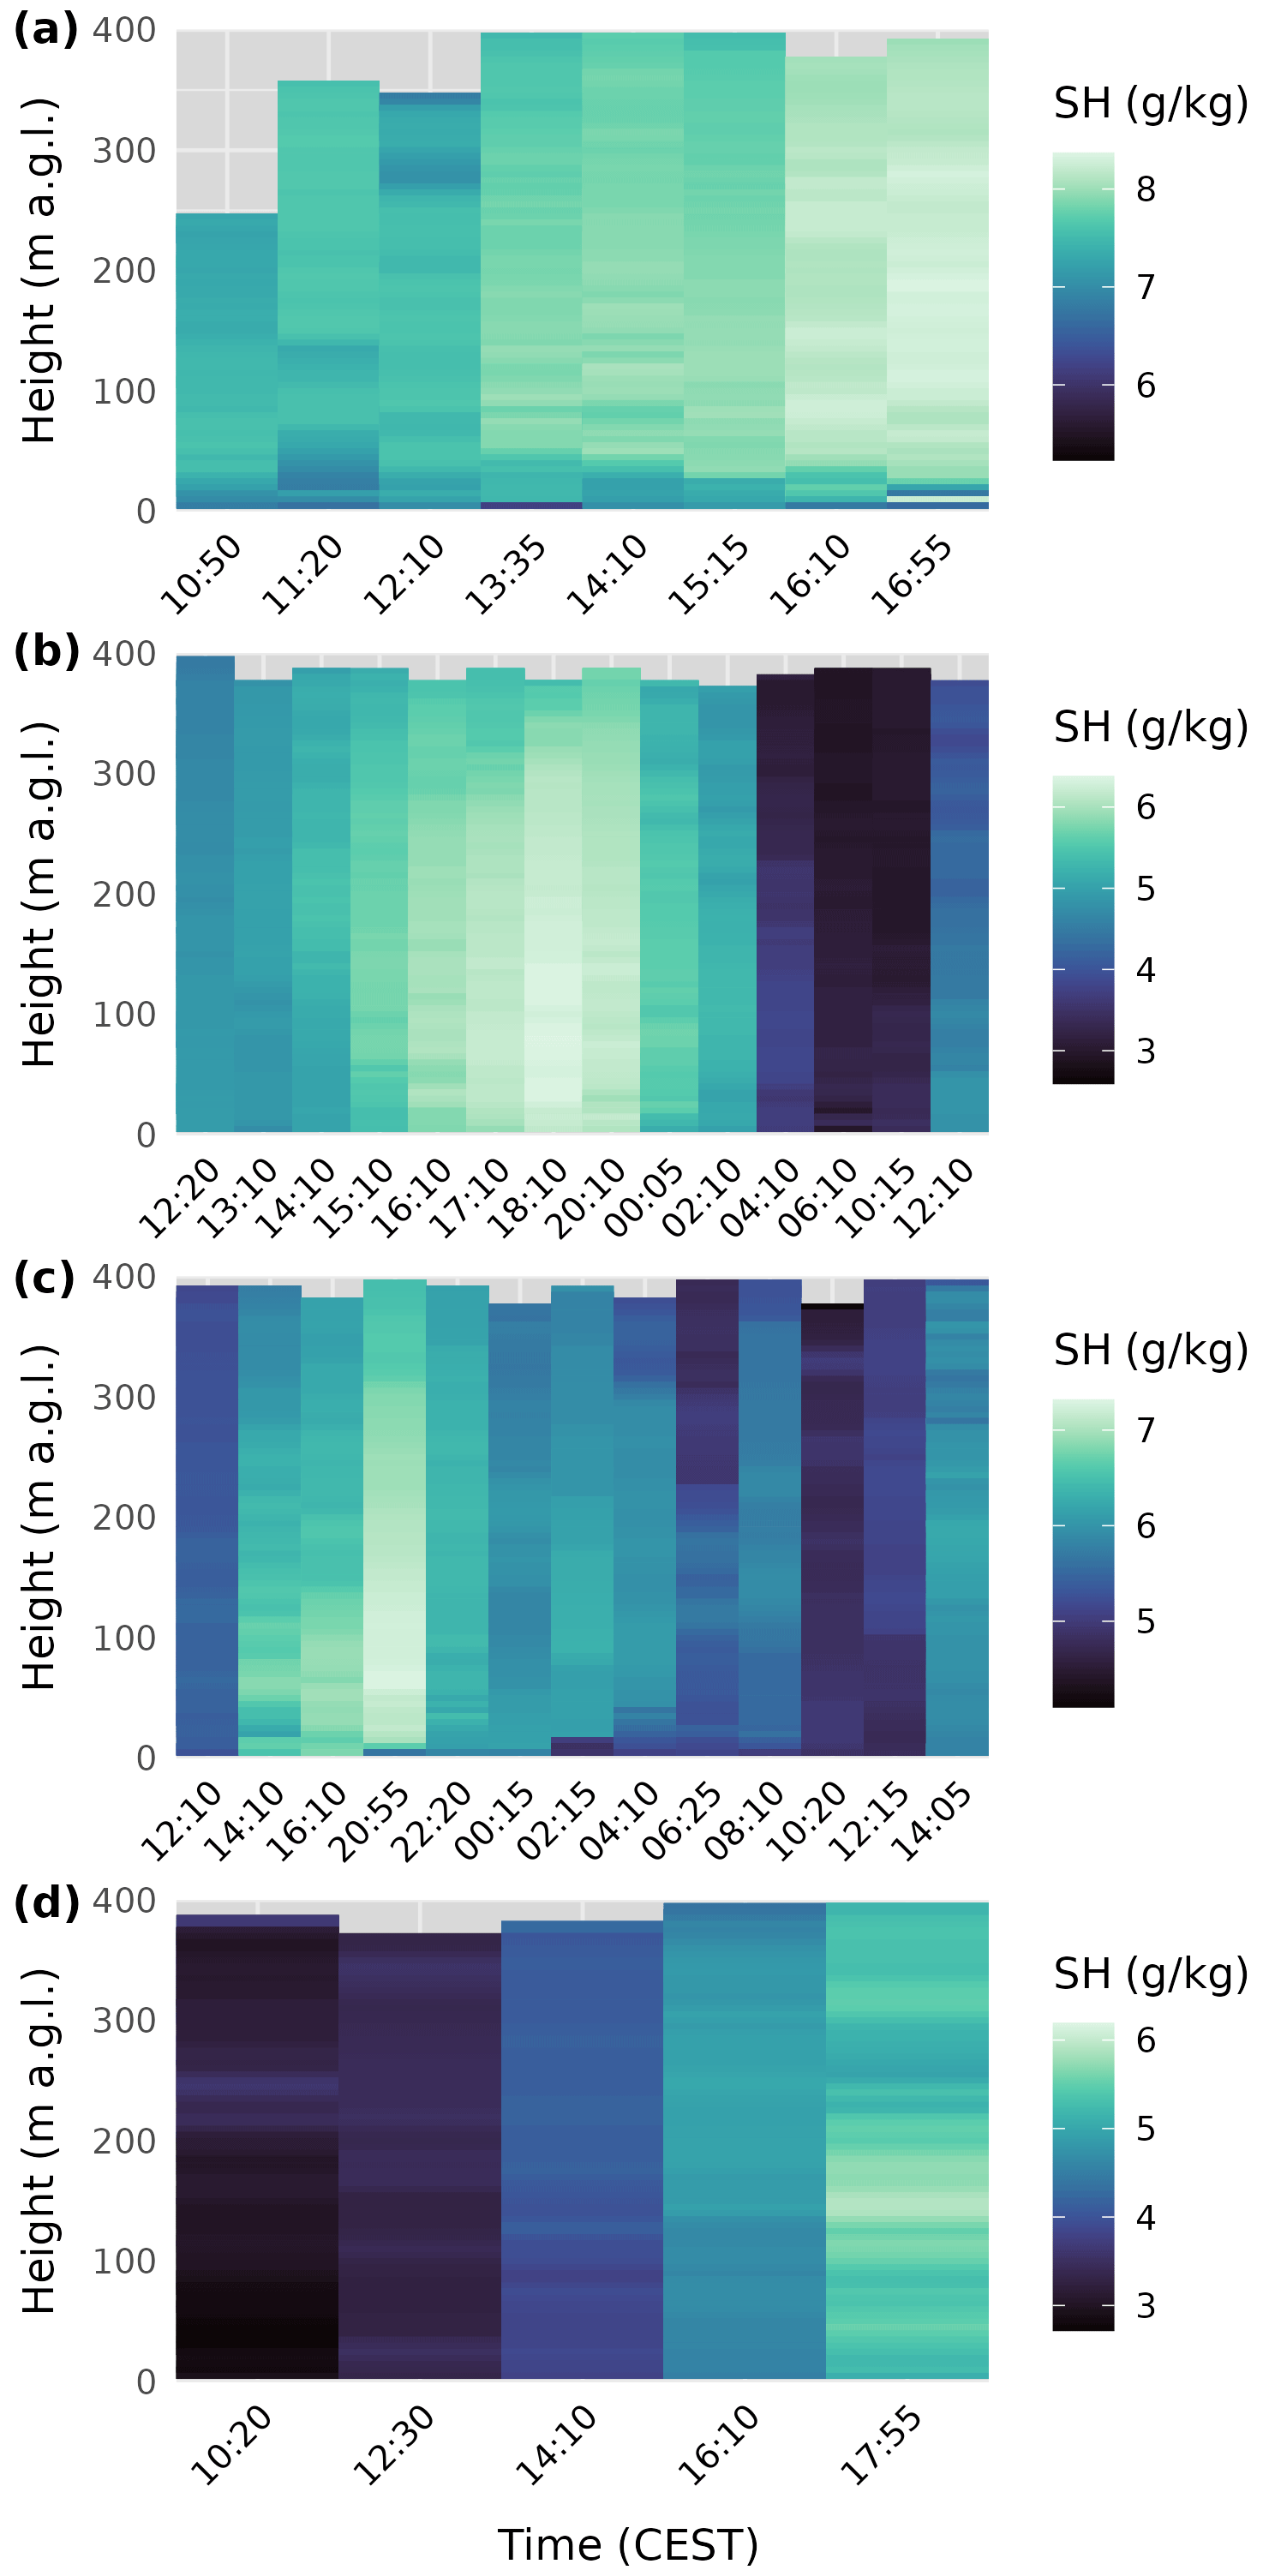
Figure 12Heat maps of the temporal evolution of specific humidity over the tongue of the Kanderfirn during the four measurement campaigns in 2021: 16 June (a), 9/10 July (b), 25/26 August (c), and 23 September (d). Note that the humidity scale differs between campaigns.
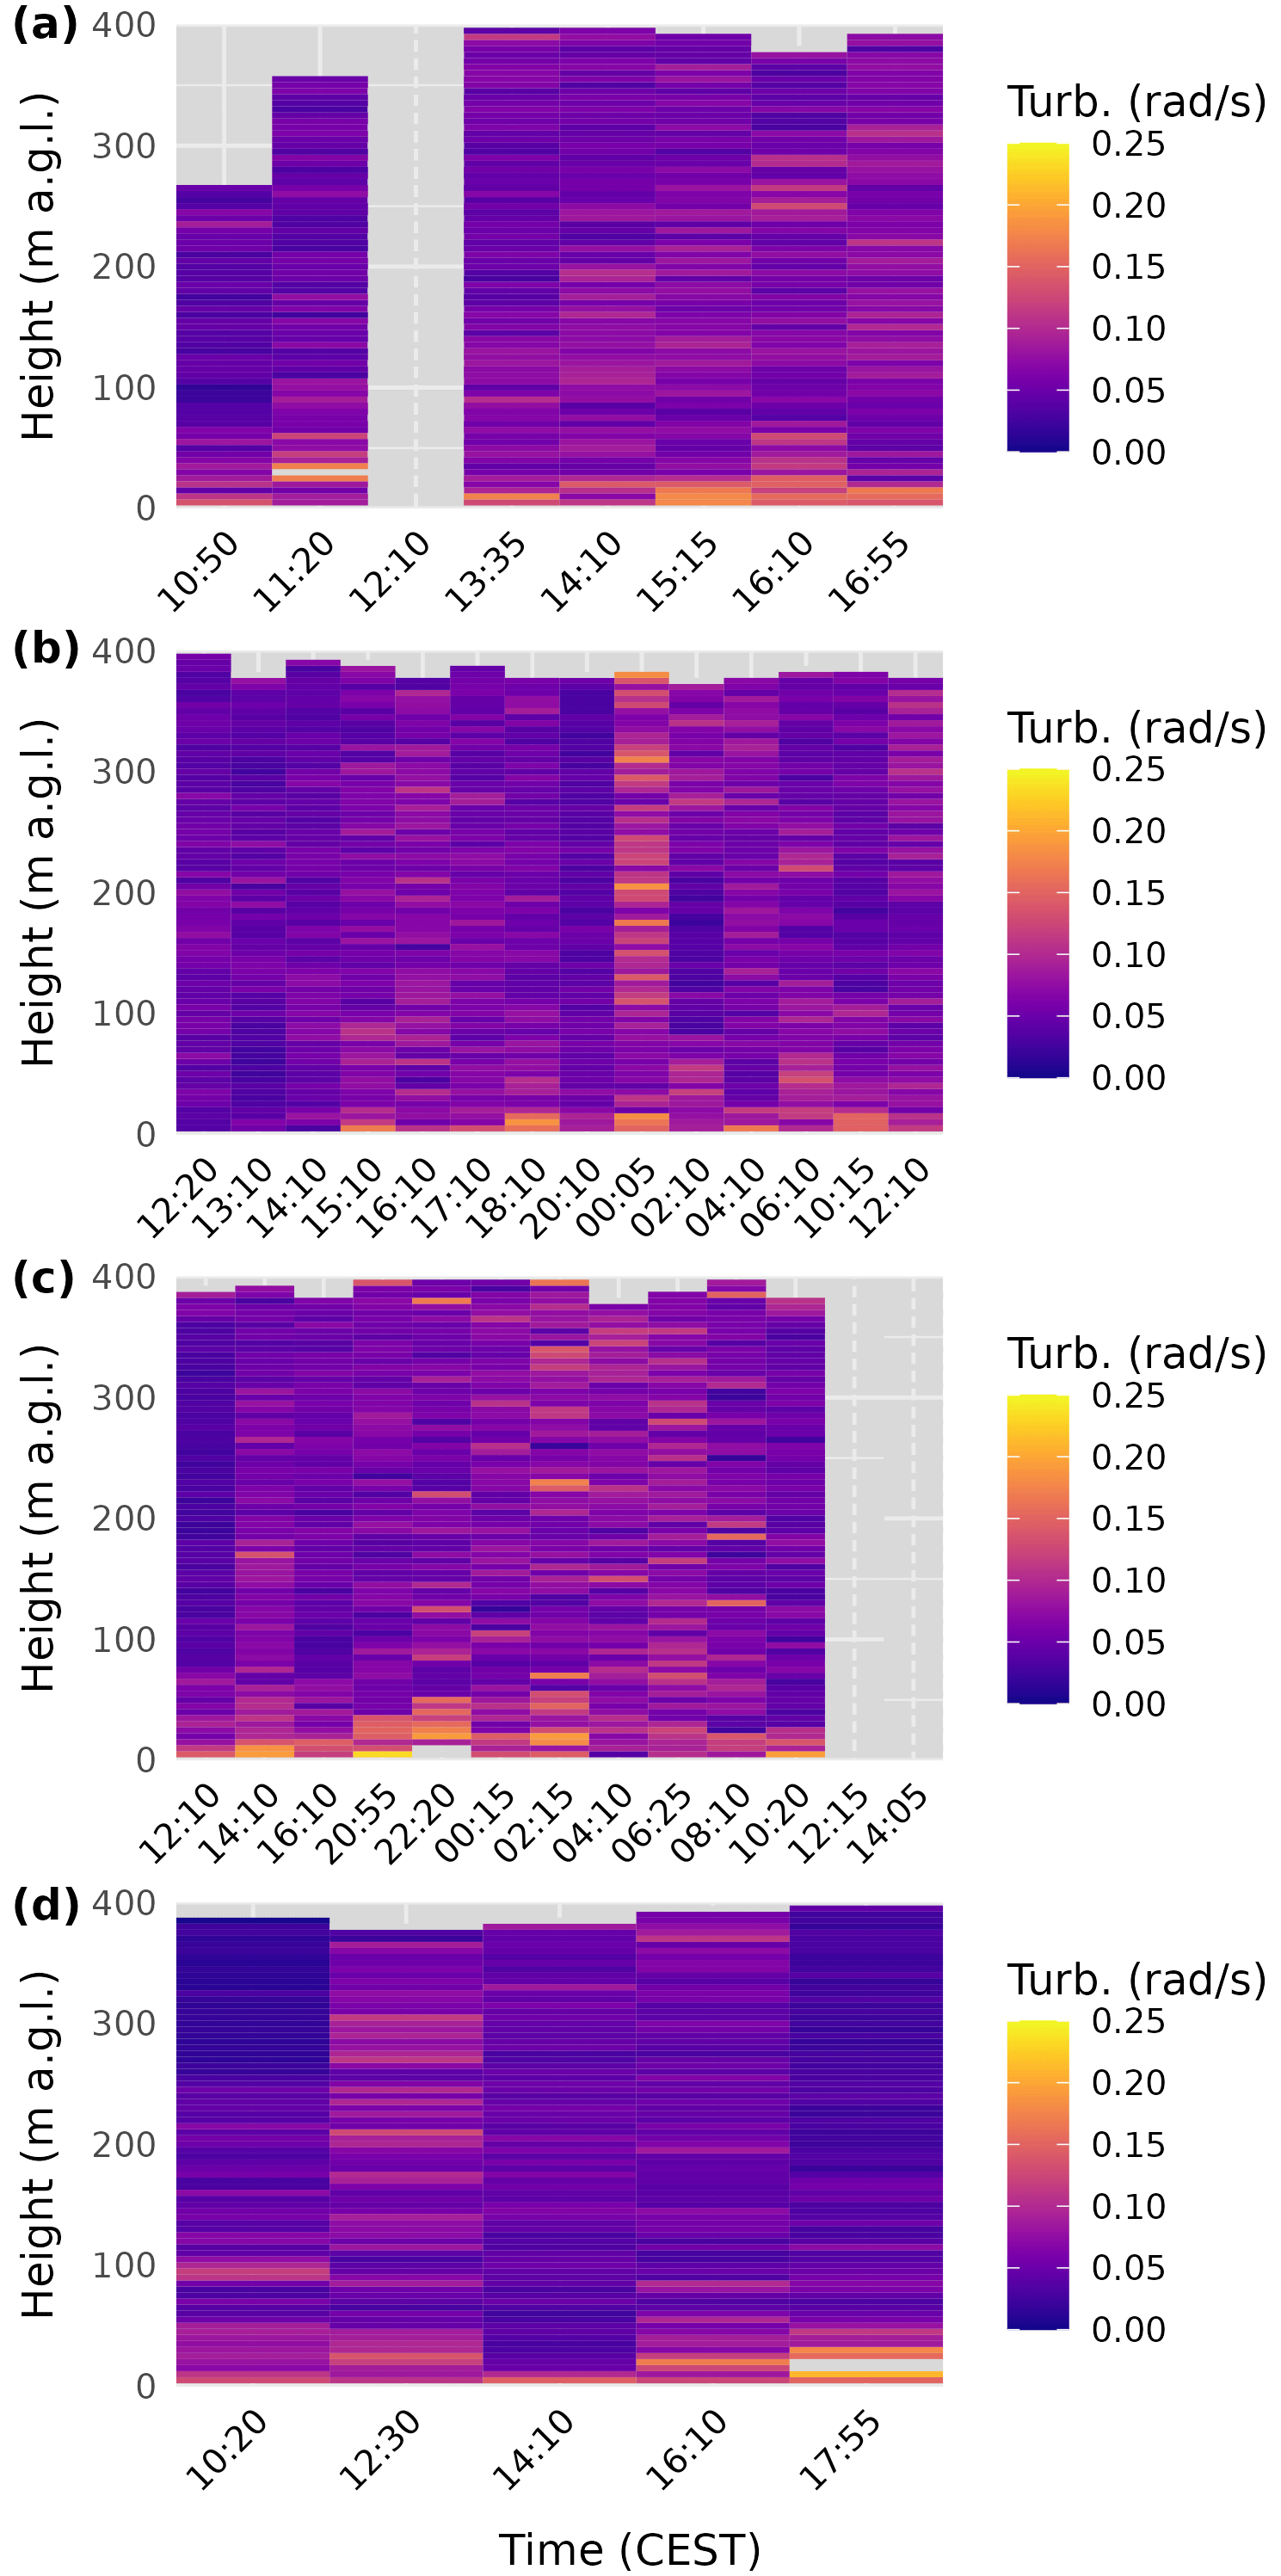
Figure 13Heat maps of the temporal evolution of the estimated turbulence over the tongue of the Kanderfirn during the four measurement campaigns in 2021: 16 June (a), 9/10 July (b), 25/26 August (c), and 23 September (d).
5.3 Boundary layer evolution (9/10 July 2021)
The first 24 h campaign on 9/10 July 2021 (14 soundings) was influenced by a cold front passage just before the start of measurements, leading to mainly southwesterly synoptic flow during the campaign, as indicated by the Sackhorn weather station (see Sect. 3 and Figs. 2, 3). Compared to June, the surface-based inversion (SBI) was less pronounced during July. An SBI was absent in five soundings (Fig. 9d), and the mean SBI top height was relatively low at 34 m. The mean lapse rate above the SBI was 0.64 °C per 100 m, representing a moist adiabatic profile, while the lapse rate below the SBI was stronger at −0.22 °C per 10 m. During the night, lapse rates above the SBI differed from those derived from nearby AWS observations, showing reverse profiles, but became more homogeneous after midnight (Fig. 9e).
The boundary layer evolution over the campaign showed continuous warming from the first sounding at midday on 9 July until the last sounding at midday on 10 July, with warming persisting even during the night (Fig. 11b). A striking feature was the advection of warm and dry air after midnight (Figs. 11b, 12b), which coincided with periods of relatively strong turbulence throughout the entire sounded air column (Fig. 13b).
Wind profiles during this campaign generally exhibited the typical C-shape seen across other campaigns. Despite weaker inversions, the overall boundary layer structure was still influenced by local circulation, with katabatic flow dominating close to the glacier surface. The combination of weaker near-surface inversion, continued warming, and warm, dry advection resulted in a more mixed boundary layer than during the strongly stable June campaign.
5.4 Boundary layer evolution (25/26 August 2021)
The second 24 h campaign on 25/26 August 2021 (13 soundings) was characterised by relatively cool, moist, and stable conditions (see Sect. 3 and Fig. 2). As in July, glacier wind and a surface-based inversion (SBI) were present throughout most of the campaign (Fig. 7c). An SBI was detected in all profiles except four, with a mean top height of 35 m. The mean lapse rate above the SBI was 0.67 °C per 100 m, consistent with a moist adiabatic profile, while the mean lapse rate below the SBI was −0.24 °C per 10 m. Lapse rates above the SBI showed relatively good agreement with the calculated environmental lapse rates (Fig. 9h).
The boundary layer exhibited characteristic diurnal variations. Temperature decreased from the first midday sounding on 25 August, reaching maximum cooling by the morning of 26 August, with the largest cooling at 400 m observed around 8:00 CEST. Warming began in the lower part of the profile thereafter and continued until the end of the campaign in the early afternoon of 26 August (Fig. 11c). Specific humidity increased from the start of the campaign until the evening (21:00 CEST) and then decreased until midday on 26 August (Fig. 12c).
Relatively strong turbulence was observed throughout the day, coinciding with substantial variations in wind speed between individual soundings (Figs. 3, 7c, 13c). The combination of a persistent SBI, cool and moist conditions, and variable wind speeds resulted in a moderately mixed boundary layer with pronounced diurnal thermal variations.
5.5 Boundary layer evolution (23 September 2021)
The final half-day campaign on 23 September 2021 (midday to midday, 5 soundings) took place under a strong anticyclone extending over central Europe, producing relatively warm and dry air, stable conditions, and weak synoptic flow (see Sect. 3 and Figs. 2, 3). A pronounced surface-based inversion (SBI) was present throughout the campaign (Fig. 7), with a mean top height of 34 m. The mean lapse rate above the SBI and glacier surface was 0.71 °C per 100 m, similar to June, and showed the best agreement with environmental lapse rates among all four campaigns (Fig. 9k). Below the SBI, the lapse rate was stronger than in July and August, at −0.34 °C per 10 m, reflecting the development of a pronounced katabatic wind near the glacier surface (Fig. 9l).
The boundary layer evolved with warming from the start of the campaign in the morning until approximately 14:00 CEST, followed by cooling until the end of the campaign (Fig. 11d), an earlier onset than observed in June and August. Specific humidity increased steadily throughout the campaign (Fig. 12d). Turbulence was stronger around midday and in the lower part of the profiles, with minimum turbulence observed in the upper part of the profiles during late morning and late afternoon (Fig. 13d), indicating stable conditions and suppressed vertical mixing.
The aim of the following discussion is (i) to outline the prospects and challenges of UAV-based atmospheric sounding in alpine terrain and (ii) to elaborate on the insights that the described measurement technique can provide into the local mountain-valley wind circulation and the structure of the atmospheric boundary layer over alpine glaciers.
6.1 Atmospheric sounding with UAVs in alpine terrain
The feasibility study comprising four measurement campaigns on the Kanderfirn in the Swiss Alps on 16 June, 9/10 July, 25/26 August and 23 September has demonstrated the suitability of the developed low-cost and open-source fixed-wing UAV for atmospheric sounding of the boundary layer over alpine glaciers up to 800 m a.g.l. (Fig. D1). No major technical problems were encountered during the campaign. However, the campaign revealed some practical challenges and technical limitations that should be considered for future applications and the further development of the sounding technique presented. Manual take-off (i.e. hand launch) of fixed-wing UAVs above 2300 m a.m.s.l. is generally possible if a headwind, such as the persistent katabatic wind during the campaign, provides sufficient uplift. The downsite is that calm conditions increase the potential risk of a crash during launch at this altitude. In addition, hand launches require considerable experience and carry an inherent risk of injury. A much safer and more reliable technique for launching fixed-wing UAVs, which has been implemented successfully during the last campaign, is the use of a bungee rope anchored to the glacier with an ice screw. The bungee rope is attached to a pin that is inserted into a small tube at the underside of the UAV and is automatically released when the UAV passes the anchor point. Due to the rough surface and presence of crevasses, moulins and meltwater channels, automatic landing of a fixed-wing UAV on a glacier is very difficult. Manual landing is possible, but requires extensive training in the operation of fixed-wing UAVs.
Operating a fixed-wing UAV with a relatively large wingspan of 160 cm in alpine terrain has both advantages and disadvantages. Obviously, carrying a fixed-wing UAV of that size in alpine terrain is not convenient. However, the design of the fixed-wing UAV supports gliding and the operation at higher altitudes where air density is significantly reduced. Moreover, the large and coloured surface makes it possible to monitor the UAV at greater heights (up to several hundred metres above ground). This is important for safety reasons. In mountain ranges with heavy helicopter traffic, such as the Alps, automatic UAV operations may require manual intervention and sudden landings. In addition, UAV operations beyond visual line of sight are prohibited by most aviation authorities unless an exemption has been granted (EASA, 2025). Atmospheric soundings up to several hundred metres above ground are no longer possible in the Alps without special permission since the publication of the new EU drone regulations in January 2021, which limit the maximum flight height to 120 m a.g.l. (note that the EU drone regulations were not yet in force in Switzerland during the campaigns on the Kanderfirn in 2021). In an ideal setup, atmospheric sounding with fixed-wing UAVs would be complemented by ground-based measurements (i.e. weather station and/or meteorological tower) and quadcopter soundings for the lowest metres.
Compared to rotary-wing UAVs, where platform-induced heating can bias temperature measurements below the vehicle due to rotor downwash (e.g. Greene et al., 2018), the temperature and humidity sensor in the tube on the presented fixed-wing UAV is protected from solar radiation and major heat sources, and is naturally ventilated during flight. However, low ascent and descent rates are recommended to account for the effect of sensor inertia on air temperature and humidity measurements. Otherwise, the sensor time lag must be corrected (Reuder et al., 2009). While off-the-shelf UAVs usually do not support the (easy) integration of scientific sensors and rather serve as a mobile platform for stand-alone sensors (e.g. Hansche et al., 2023; Messmer and Groos, 2024), UAVs tailored for scientific purposes, such as the presented fixed-wing UAV, support the integration of different sensors and allow the combined analysis of meteorological and flight recorder data (Reuder et al., 2009, 2012; Cassano et al., 2016). Flight recorder data are beneficial because they provide additional information to estimate atmospheric parameters such as wind speed, wind direction and turbulence, which go beyond the classical measurements of air temperature and relative humidity (Mayer et al., 2012; Reuder et al., 2012; Cassano et al., 2016). However, a drawback of the presented sounding technique, which prevents easy replication, is the extensive training required to safely fly and land a fixed-wing UAV in alpine terrain. A more user-friendly system, especially for soundings in complex terrain, are hybrid UAVs that combine efficient forward flight with hovering and vertical take-off and landing capabilities. Hybrid UAVs for scientific research are currently under development, but still need to be tested in high mountain environments (Smeur et al., 2019; Bronz et al., 2020).
6.2 Local circulation and boundary layer structure over alpine glaciers
The vertical profiles of air temperature, specific humidity, wind speed, wind direction and turbulence from Kanderfirn add to the sparse global dataset of atmospheric soundings over glacierised terrain and provide detailed insights into local circulations and the structure of the boundary layer over an alpine glacier during one ablation season. Apart from the Kanderfirn campaign, meteorological measurements with tethered balloons and UAVs up to a few hundred metres above the glacier surface are available from only four sites worldwide: From a glacio-meteorological field experiment on Pasterze in the Austrian Alps in summer 1994 (Van den Broeke, 1997a, b; Oerlemans and Grisogono, 2002), from a glacio-meteorological field experiment on the Vatnajökull ice cap in Iceland in summer 1996 (Oerlemans et al., 1999), from a meteorological campaign on the Hofsjökull ice cap in Iceland in summer 2007 (Reuder et al., 2009, 2012), and from a field campaign on Mittivakkat Gletsjer in southeast Greenland in summer 2019 (Hansche et al., 2023). Although the topographical and climatic conditions vary greatly between the five sites, the soundings from the different campaigns reveal some general characteristics of the structure of the atmospheric boundary layer over glaciers and ice caps.
A key feature of the atmospheric boundary layer over mountain and outlet glaciers during the ablation season is the development of a cool and persistent density-driven katabatic wind. Katabatic winds have been observed during all of the summer field campaigns mentioned above, and are also evident in data from numerous on-glacier weather stations (e.g. Petersen and Pellicciotti, 2011; Petersen et al., 2013; Mott et al., 2020; Nicholson and Stiperski, 2020; Shaw et al., 2023, 2024). While measurements within the lowest metres above the glacier surface are crucial for investigating turbulent energy fluxes and determining the height of the maximum wind speed of the low-level katabatic jet (Van den Broeke, 1997b; Oerlemans, 2010; Mott et al., 2020; Nicholson and Stiperski, 2020), the vertical extent of the katabatic wind layer cannot be determined with weather stations and meteorological towers alone. Tethered balloon and UAV soundings show that the katabatic wind layer is characterised by a pronounced surface-based inversion up to several tens of metres above the glacier surface (Van den Broeke, 1997a; Oerlemans et al., 1999). While the maximum extension of the cooling effect of the katabatic wind layer has not been specifically investigated in previous studies (cf. Van den Broeke, 1997a; Oerlemans et al., 1999; Hansche et al., 2023), the results from the Kanderfirn campaign show clearly that the top height of the surface-based inversion varies considerably in time and that the cooling effect at this location can reach up to 60 m above the glacier surface (cf. Fig. 9). The maximum cooling observed in the lowest 60 m of Kanderfirn was of the order of 4 °C in the late afternoon during the June campaign (cf. Fig. 7a). This is consistent with theory, which predicts that katabatic winds intensify with increasing temperature contrast between the glacier surface and its surroundings (Ohata, 1989; Oerlemans and Grisogono, 2002).
Besides the pronounced cooling effect, relatively dry air, high wind speeds and enhanced turbulence characterise the katabatic wind layer over glaciers during the ablation season. A dry surface layer and a marked increase in humidity in the first tens of metres above the glacier surface, such as observed on Kanderfirn during the June campaign (cf. Fig. 7a), were also found on Pasterze and Mittivakkat Gletsjer (Van den Broeke, 1997a; Hansche et al., 2023). Since the specific humidity on the Kanderfirn was higher throughout the sounded air column above the katabatic wind layer, it is very likely that the dry air near the glacier surface originates from the accumulation area, where evaporation is limited compared to the ablation zone, or from the free atmosphere above. The saturation deficit caused by the dry low-level jet, together with relatively high wind speeds and increased turbulence, may favour evaporation and thus reduce the energy available for melting snow and ice in the ablation zone. This means that katabatic flow has the potential to not only reduce the sensible heat flux (e.g. Shaw et al., 2024), but also increase the latent heat flux and therefore change the Bowen ratio compared to the microclimatic conditions (warmer and more humid air) outside the glacier under certain synoptic situations. Since the temperature and humidity profiles observed above the top height of the surface-based inversions are linear (Figs. 7 and C1; Oerlemans et al., 1999), their extrapolation to the glacier surface and deviation from the measurements below the inversion top height provide an alternative to off-glacier lapse rates and gradients (see e.g. Greuell and Böhm, 1998; Shea and Moore, 2010; Shaw et al., 2024) for estimating and parameterising the cooling and drying effect of the katabatic wind layer.
Above the katabatic wind layer, a well-developed mountain-valley wind circulation similar to that on Kanderfirn (cf. Fig. 8c, d) has been found at Pasterze and Vatnajökull during periods of stable weather (Van den Broeke, 1997b; Oerlemans et al., 1999). A characteristic feature is the decrease in wind speed from a maximum near the surface to a minimum at about 100–200 m above the surface (cf. Fig. 8c). At the height of the minimum wind speed, the horizontal wind direction changes from down-glacier to up-glacier (Fig. 8d; Van den Broeke, 1997b). The valley wind typically advects warmer and more humid air towards the glacier (Van den Broeke, 1997b). However, without additional atmospheric soundings along the glacier flow line, it is difficult to assess whether the glacier and valley winds are essentially decoupled during stable conditions such as on 16 June 2021, or whether entrainment of warm and humid air occurs at higher altitudes. To better capture the interactions between the different thermally driven winds in glacierised alpine terrain, parallel UAV-based atmospheric soundings at different locations on the glacier, together with ground-based measurements, would be helpful. This information is crucial to improve the parameterisation of local atmospheric conditions over mountain glaciers and to assess how a warming world affects the local circulation in alpine terrain.
With the UAV-based atmospheric sounding technique, we have presented a new approach to study the interaction of local winds in alpine terrain and investigate the structure of the atmospheric boundary layer over glaciers up to several hundred metres above the surface. The measurement technique provides a lightweight and low-cost alternative to tethered balloons and complements ground-based measurements at weather stations and meteorological towers. Vertical profiles of air temperature, humidity, pressure, wind speed, wind direction and turbulence can be derived from the synchronised meteorological and flight recorder data collected by the developed open-source fixed-wing UAV. A drawback of the fixed-wing UAV is the extensive training that is required for safe operation in alpine terrain. However, a hybrid UAV combining efficient forward flight with hovering and vertical take-off and landing capabilities is currently under development and will enhance operation in alpine terrain. The UAV-based atmospheric soundings conducted during the feasibility study at the Kanderfirn in the Swiss Alps add to the sparse global dataset of atmospheric soundings in glacierised terrain and reveal typical features of the boundary layer over glaciers in summer. A persistent glacier wind, characterised by a pronounced surface-based inversion, relatively dry air, high wind speeds and enhanced turbulence, was observed at the Kanderfirn. Above the katabatic wind layer, a well-developed valley wind adevecting warm and humid air from the periphery towards the glacier was found. While vertical profiles at one location can provide fundamental insights into the structure of the boundary layer over glaciers, parallel UAV-based soundings at different locations and repeated under different synoptic conditions would be desirable in the future to uncover the interactions between the thermally driven local winds in alpine terrain and to assess the potential impact of rising off-glacier temperatures on the cooling effect of the katabatic wind specifically and on the local circulation in alpine terrain in general.
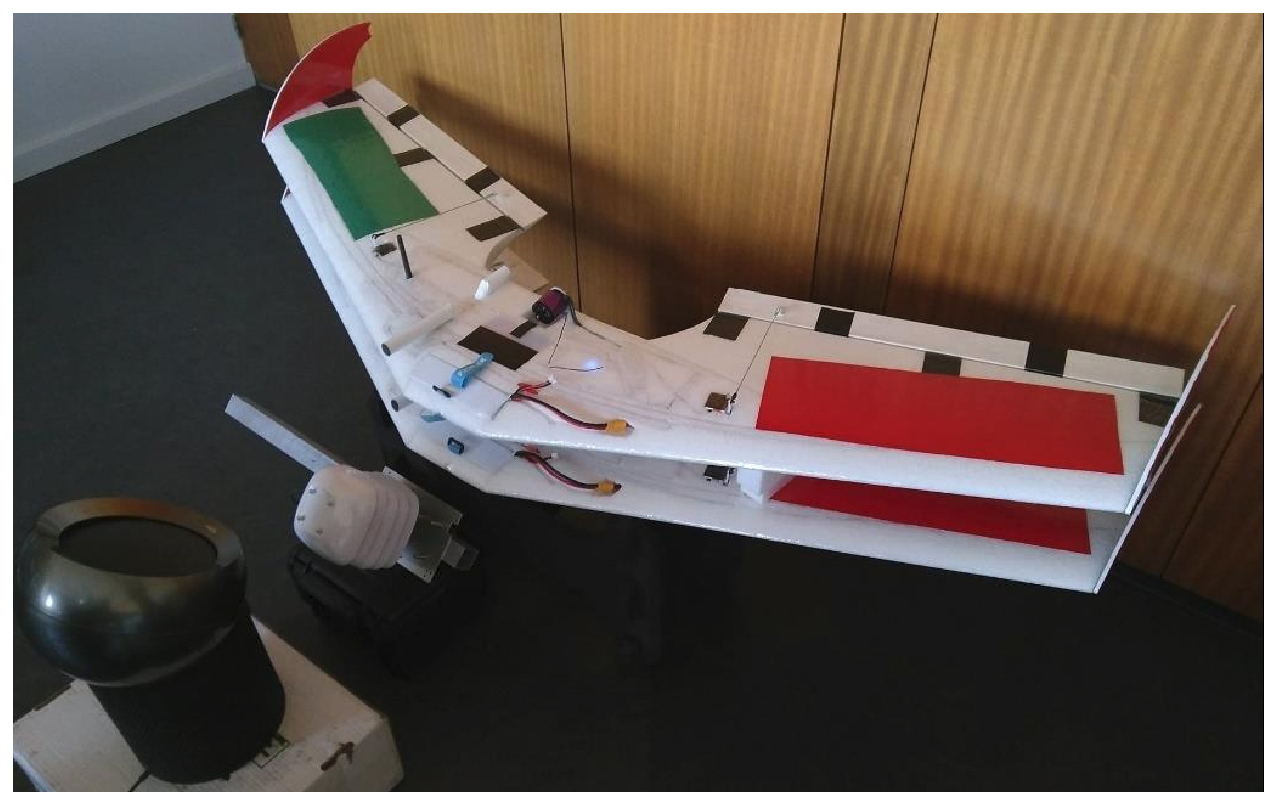
Figure A1Setup of the 24 h intercomparison measurement of the temperature and humidity sensors (SHT75) installed inside the white tube of each UAV and a reference sensor (SHT21, inside the radiation shield) placed in front of both UAVs. A fan ensured continuous air flow. The experiment was conducted from 4 to 5 June 2021.
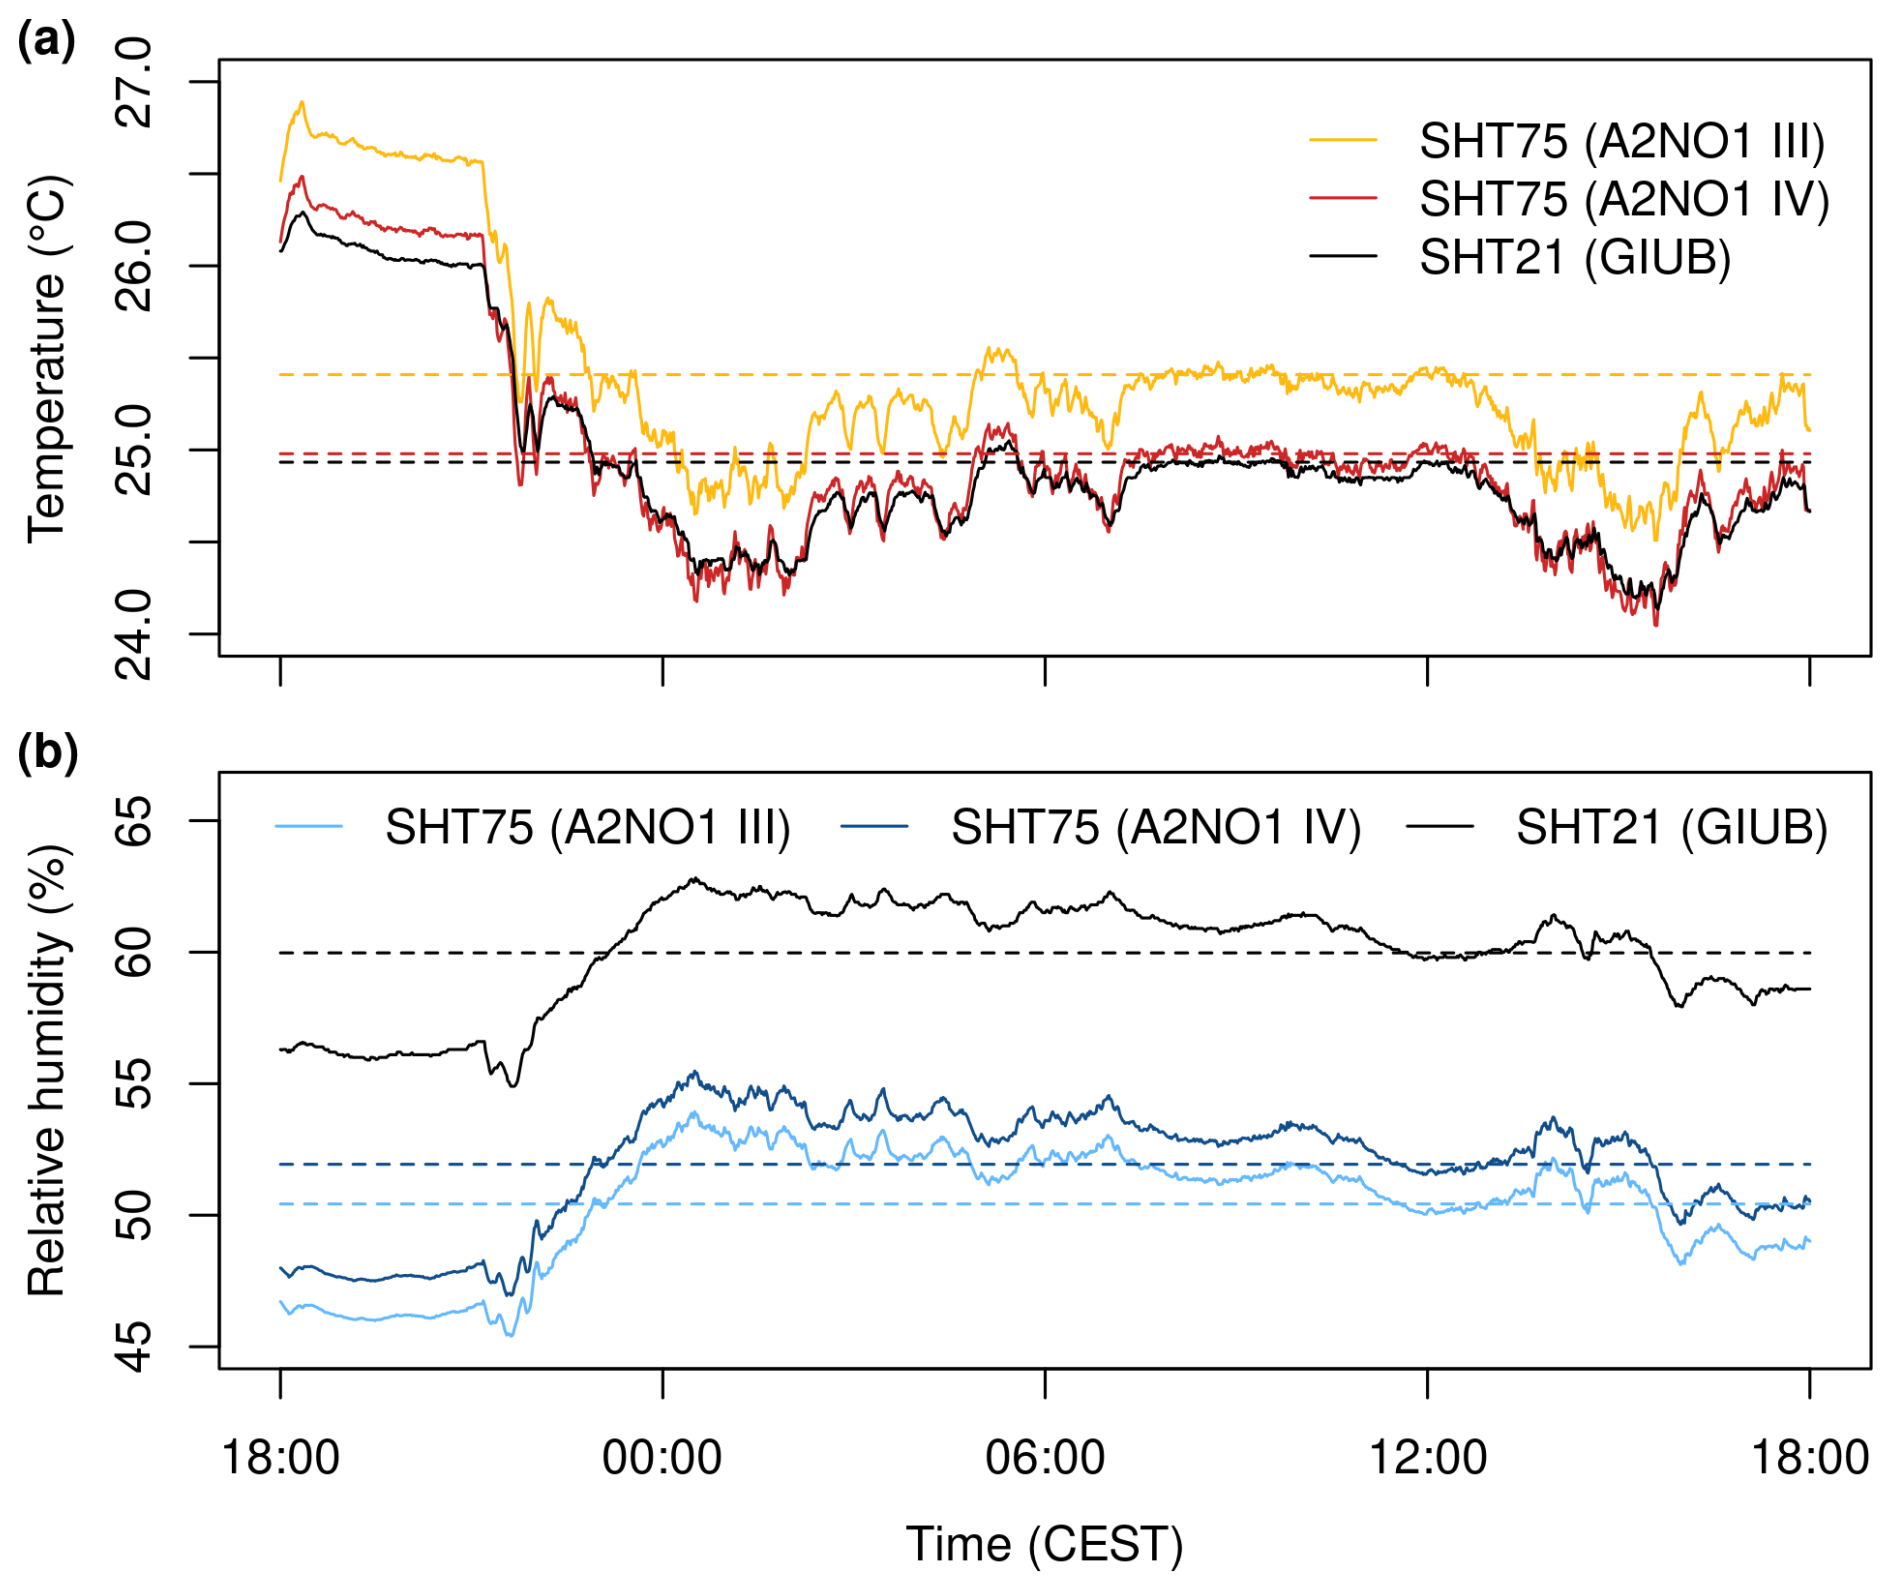
Figure A2Result of the 24 h intercomparison measurement. The mean difference in air temperature between both SHT75 sensors is 0.43 °C and the mean difference in relative humidity is 1.5 %.
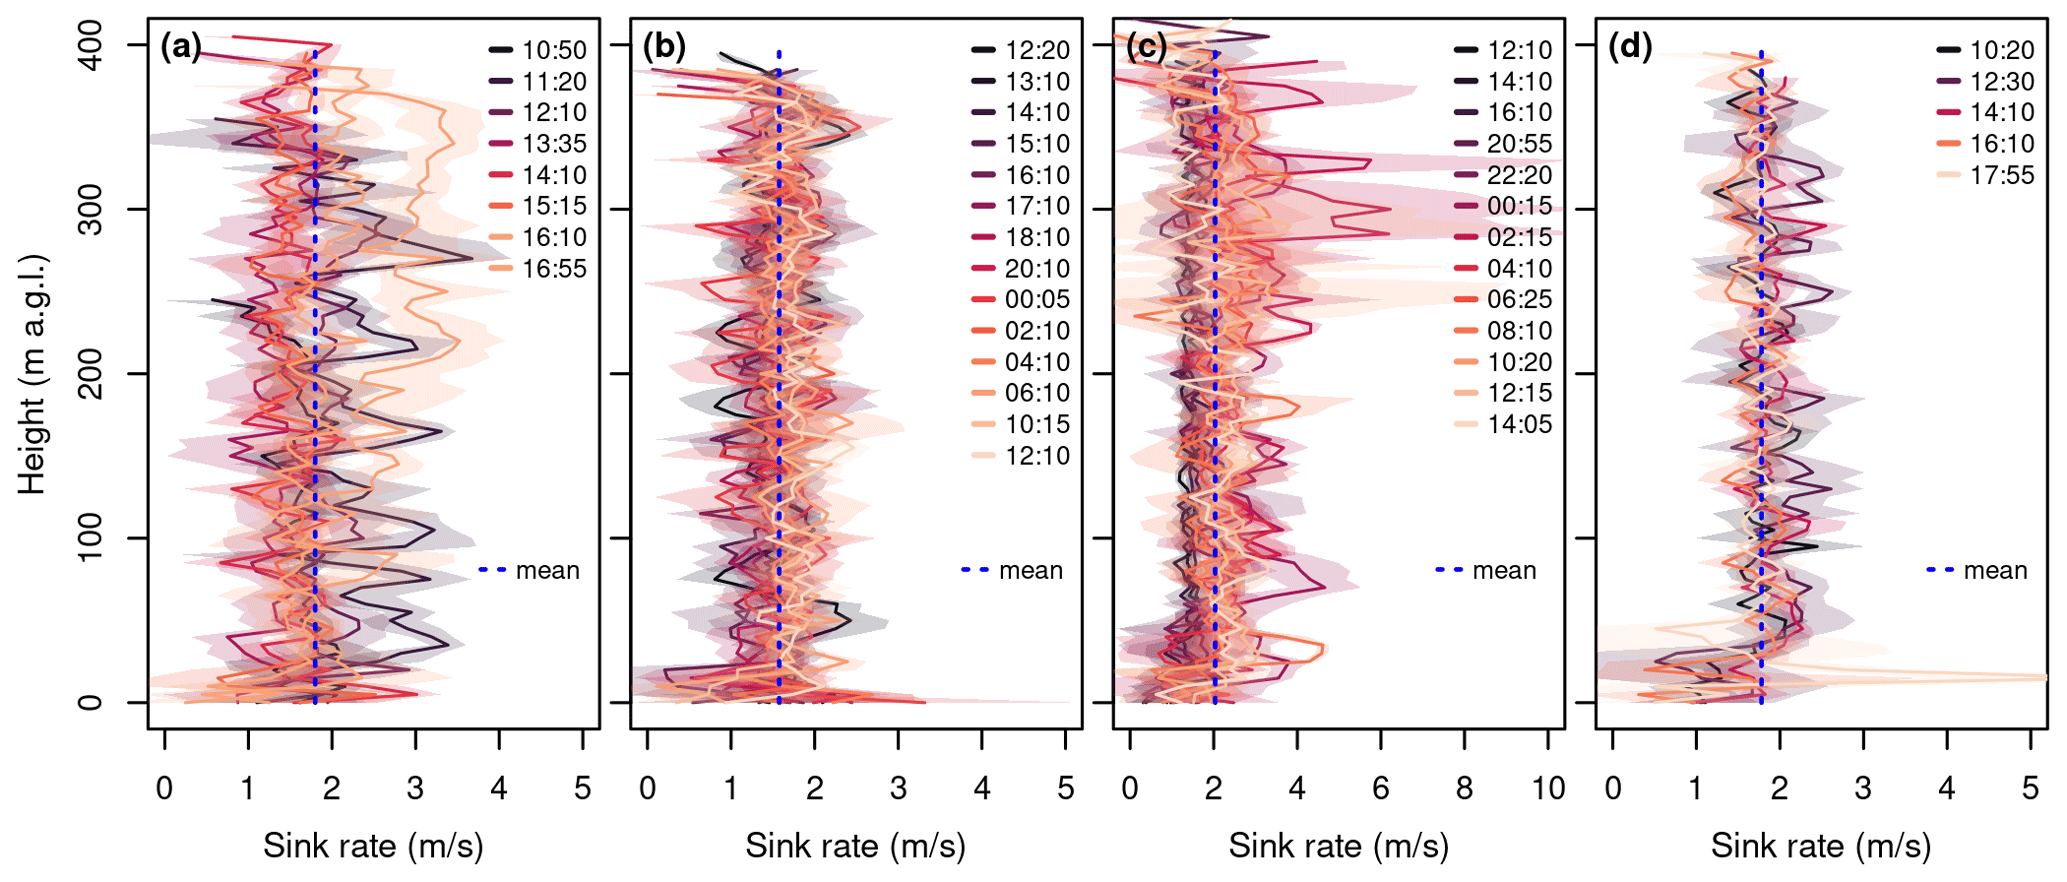
Figure B1Sink rate (binned into 5 m height intervals) from all soundings (each consisting of two descents) on 16 June (a), 9/10 July (b), 25/26 August (c), and 23 September 2021 (d). The shaded area represents the standard deviation between the two descents.
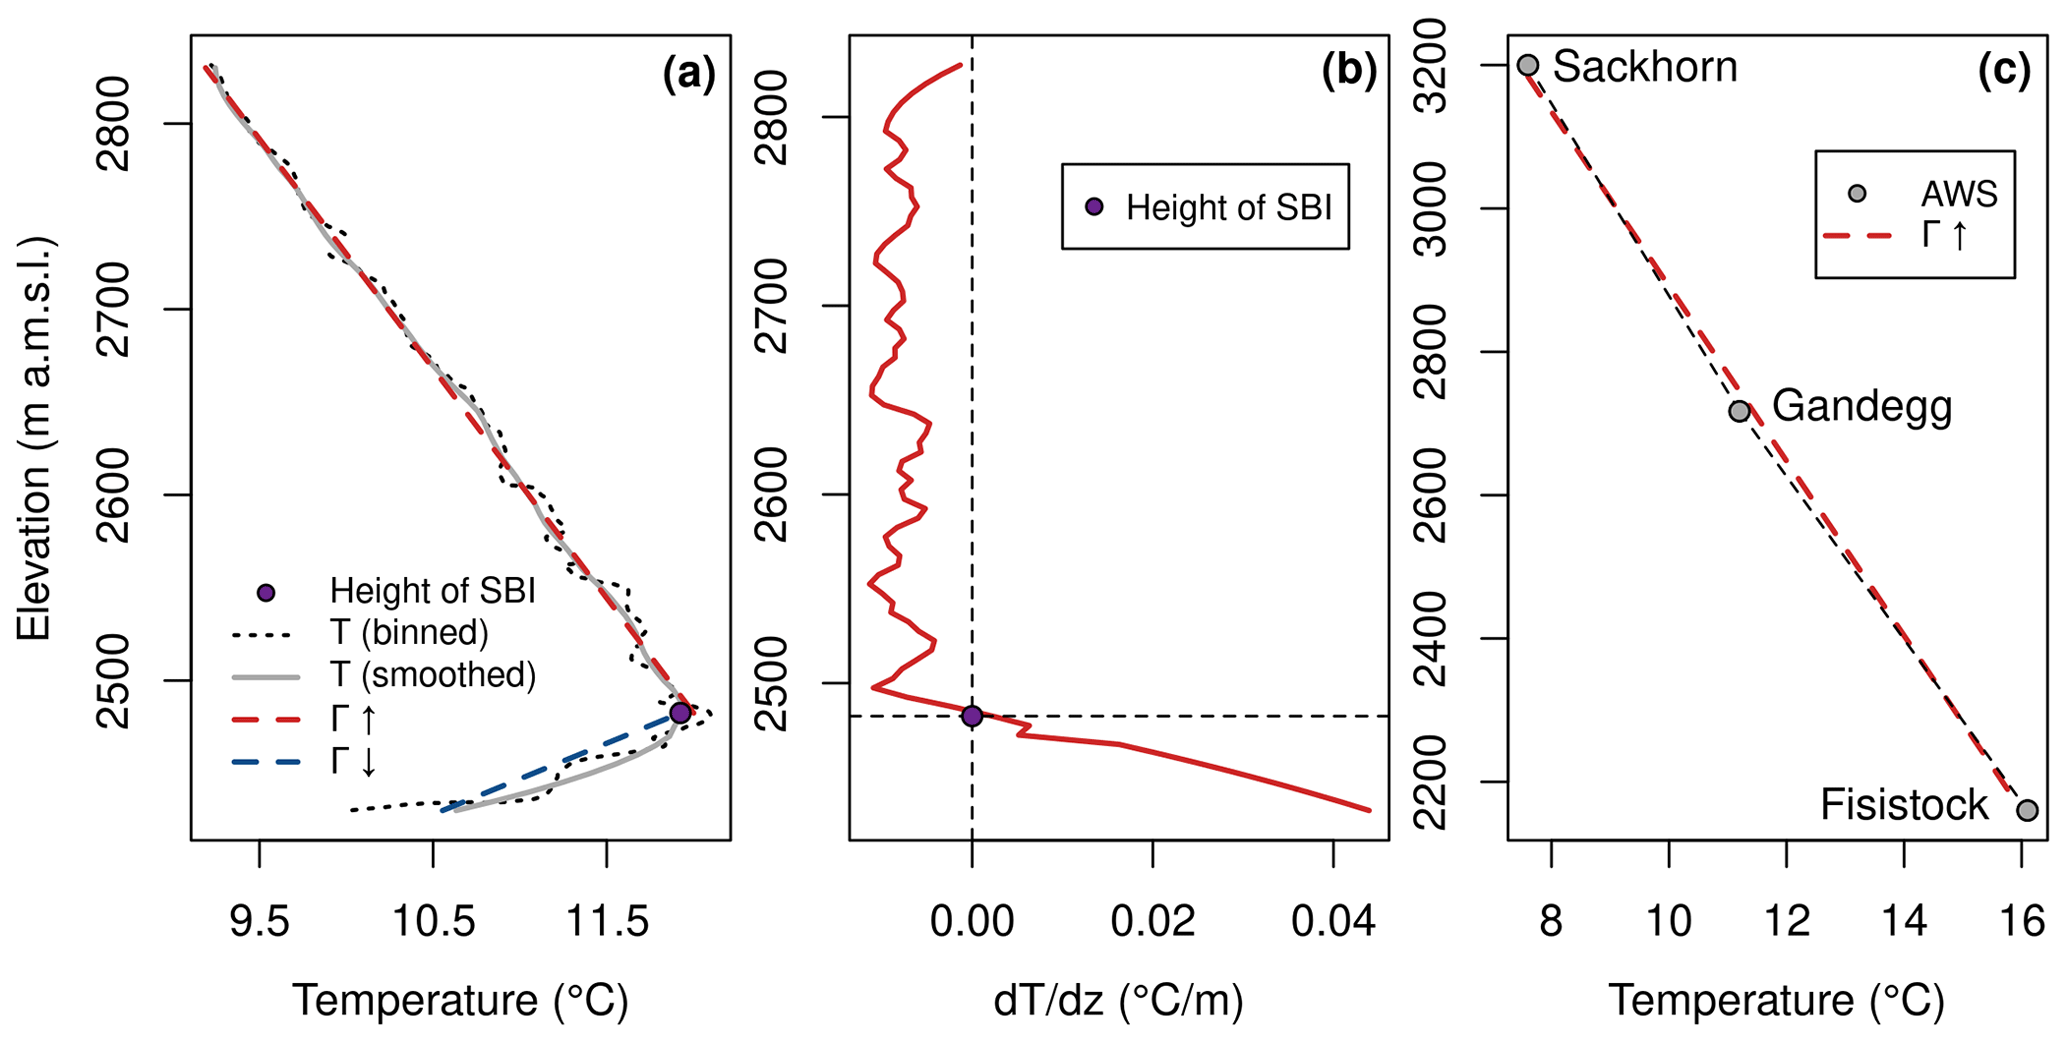
Figure C1Example of the derivation of the lapse rate over the Kanderfirn and its surroundings on 16 June 2021 at about 14:10 CEST. (a) Lapse rate below (Γ↓) and above (Γ↑) the top height of the surface-based inversion (SBI) derived from UAV-based atmospheric soundings. (b) First derivative of the smoothed air temperature profile with respect to altitude; the altitude where the derivative becomes positive defines the top height of the SBI. (c) Environmental lapse rate in the study area derived from three nearby weather stations.
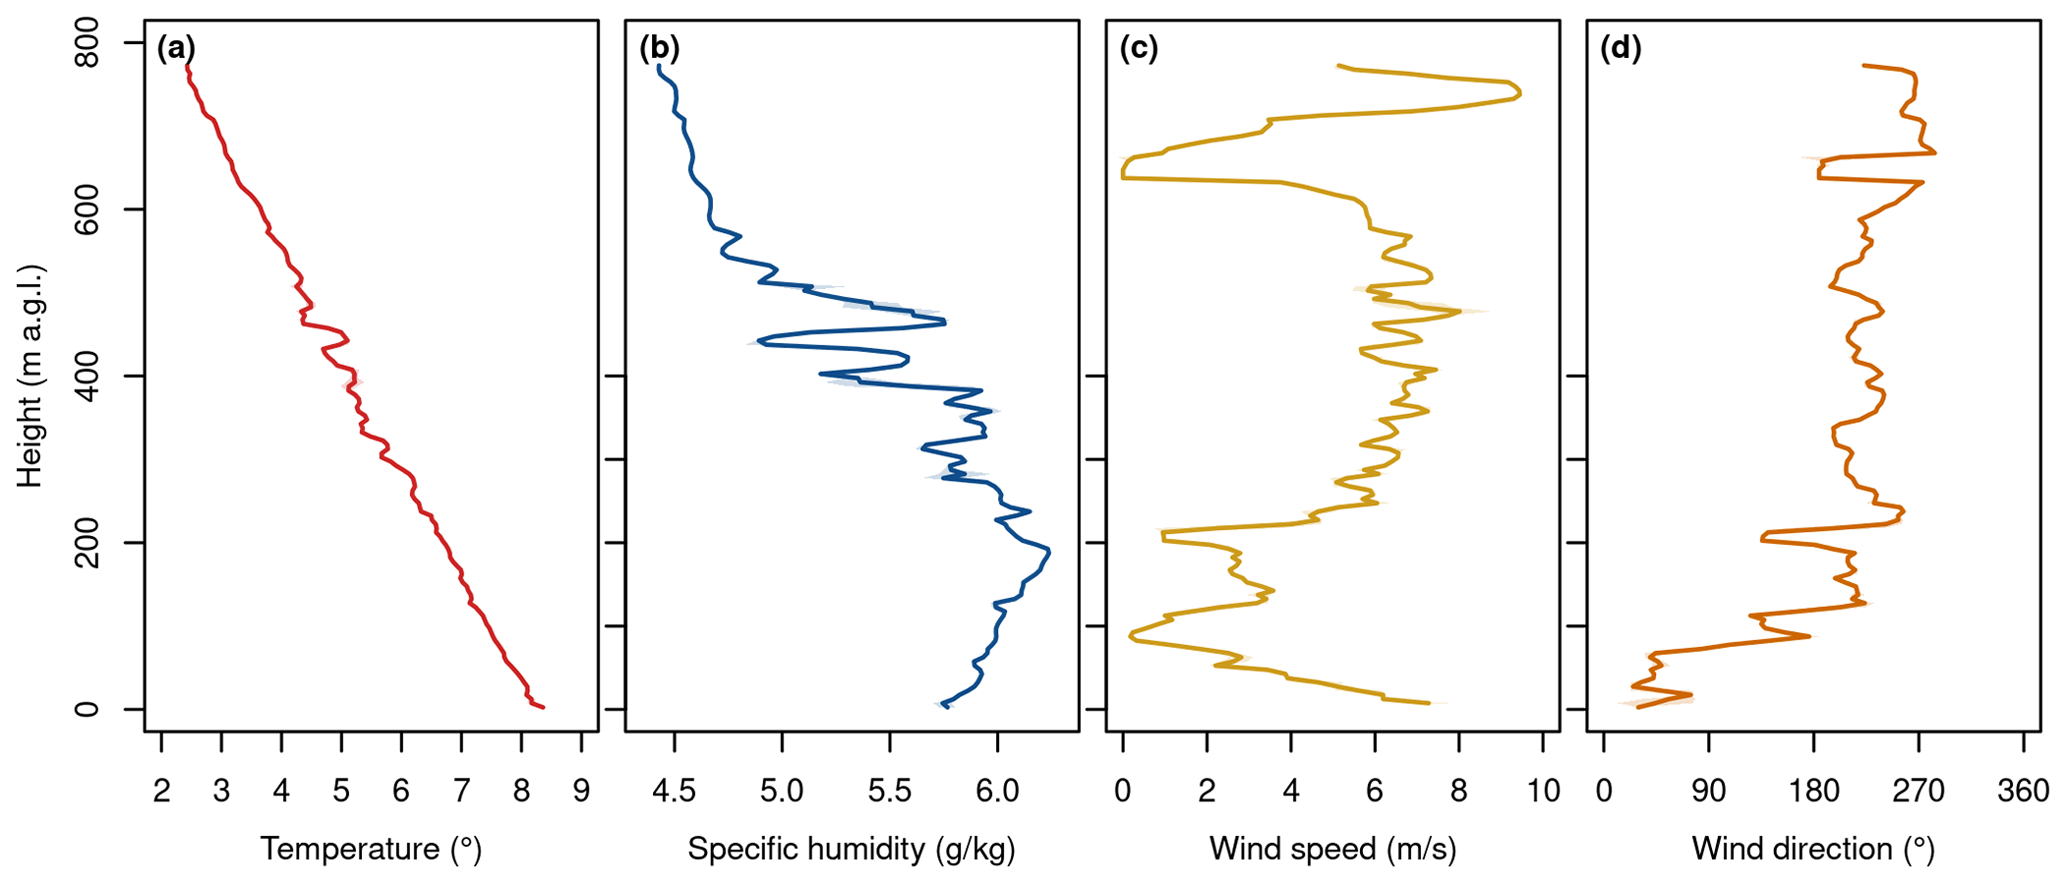
Figure D1Synthesis plot showing air temperature (a), specific humidity (b), wind speed (c), and wind direction (d) profiles from the 800 m sounding on 26 August 2021 at about 14:05 CEST.
The atmospheric sounding and flight recorder data as well as the scripts for data post-processing, reformatting, analysis and visualisation can be downloaded from the open-access repository Zenodo: https://doi.org/10.5281/zenodo.17564436 (Groos et al., 2025). The mobile measurement post-processing (mmp) FORTRAN package can be downloaded from the following Git repository: https://git.rz.uni-augsburg.de/philipan/mmp (Philipp, 2025).
ARG conceived the study. ARG and AP designed the UAV. MB supported the development of the UAS and helped to implement the Paparazzi UAV software and hardware. NB built the two UAVs with the help of ARG. NB and ARG carried out the measurement campaign. AP developed the mmp software package for processing and analysing the flight data and atmospheric measurements. ARG, NB and AP analysed the data. ARG drafted the manuscript and prepared the figures with contributions from NB and AP. All authors contributed to the discussion of the results and revision of the manuscript.
The contact author has declared that none of the authors has any competing interests.
Publisher's note: Copernicus Publications remains neutral with regard to jurisdictional claims made in the text, published maps, institutional affiliations, or any other geographical representation in this paper. While Copernicus Publications makes every effort to include appropriate place names, the final responsibility lies with the authors. Views expressed in the text are those of the authors and do not necessarily reflect the views of the publisher.
We would like to thank Heinz Veit for his support of this study and Peter Leiser for his assistance with soldering the electronic components of the two UAVs. We also extend our gratitude to the lead developers of the Paparazzi UAV project, Gautier Hattenberger and Hector Garcia de Marina, for their valuable discussions and support in implementing the UAV hardware and ground control station software. Finally, we thank the editor, Maximilian Maahn, and the two anonymous reviewers for their constructive comments during the review process, which greatly improved the clarity and quality of this paper.
This research was supported by the Deutsche Forschungsgemeinschaft (DFG, German Research Foundation) within the framework of the Franco-German research project FlyHigh (grant no. GR 5407/2-1). The costs associated with the construction of the fixed-wing UAVs and the implementation of the measurement campaign on the Kanderfirn were covered by the Institute of Geography, University of Bern.
This paper was edited by Maximilian Maahn and reviewed by two anonymous referees.
Bonin, T. A., Chilson, P. B., Zielke, B. S., Klein, P. M., and Leeman, J. R.: Comparison and application of wind retrieval algorithms for small unmanned aerial systems, Geosci. Instrum. Method. Data Syst., 2, 177–187, https://doi.org/10.5194/gi-2-177-2013, 2013. a
Bronz, M., Tal, E., Favalli, F., and Karaman, S.: Mission-Oriented Additive Manufacturing of Modular Mini-UAVs, in: AIAA Scitech 2020 Forum, American Institute of Aeronautics and Astronautics, Orlando, FL, 1–11, ISBN 978-1-62410-595-1, https://doi.org/10.2514/6.2020-0064, 2020. a
Cassano, J. J.: Observations of atmospheric boundary layer temperature profiles with a small unmanned aerial vehicle, Antarctic Science, 26, 205–213, https://doi.org/10.1017/S0954102013000539, 2014. a
Cassano, J. J., Seefeldt, M. W., Palo, S., Knuth, S. L., Bradley, A. C., Herrman, P. D., Kernebone, P. A., and Logan, N. J.: Observations of the atmosphere and surface state over Terra Nova Bay, Antarctica, using unmanned aerial systems, Earth Syst. Sci. Data, 8, 115–126, https://doi.org/10.5194/essd-8-115-2016, 2016. a, b, c
DWD: Aspirations-Psychrometer-Tafeln, Vieweg & Sohn Verlagsgesellschaft, Braunschweig, ISBN 3-528-18231-8, 1976. a
EASA: Guidelines for UAS operations in the open and specific category – Ref to Regulation (EU) 2019/947, https://www.easa.europa.eu/en/downloads/139435/en (last access: 12 November 2025), 2025. a
Farina, S. and Zardi, D.: Understanding Thermally Driven Slope Winds: Recent Advances and Open Questions, Boundary-Layer Meteorology, 189, 5–52, https://doi.org/10.1007/s10546-023-00821-1, 2023. a
Greene, B. R., Segales, A. R., Waugh, S., Duthoit, S., and Chilson, P. B.: Considerations for temperature sensor placement on rotary-wing unmanned aircraft systems, Atmos. Meas. Tech., 11, 5519–5530, https://doi.org/10.5194/amt-11-5519-2018, 2018. a
Greuell, W. and Böhm, R.: 2 m temperatures along melting mid-latitude glaciers, and implications for the sensitivity of the mass balance to variations in temperature, Journal of Glaciology, 44, 9–20, https://doi.org/10.3189/S0022143000002306, 1998. a, b, c
Groos, A. R., Bertschinger, T. J., Kummer, C. M., Erlwein, S., Munz, L., and Philipp, A.: The potential of low-cost UAVs and open-source photogrammetry software for high-resolution monitoring of alpine glaciers: A case study from the Kanderfirn (Swiss Alps), Geosciences, 9, 1–21, https://doi.org/10.3390/geosciences9080356, 2019. a, b, c
Groos, A. R., Aeschbacher, R., Fischer, M., Kohler, N., Mayer, C., and Senn-Rist, A.: Accuracy of UAV Photogrammetry in Glacial and Periglacial Alpine Terrain: A Comparison With Airborne and Terrestrial Datasets, Frontiers in Remote Sensing, 3, 871994, https://doi.org/10.3389/frsen.2022.871994, 2022. a
Groos, A. R., Brand, N., Bronz, M., and Philipp, A.: Atmospheric sounding of the boundary layer over alpine glaciers using fixed-wing UAVs (v2.0.0), Zenodo [data set], https://doi.org/10.5281/zenodo.17564436, 2025. a
Hansche, I., Shahi, S., Abermann, J., and Schöner, W.: The vertical atmospheric structure of the partially glacierised Mittivakkat valley, southeast Greenland, Journal of Glaciology, 69, 1097–1108, https://doi.org/10.1017/jog.2022.120, 2023. a, b, c, d, e
Hattenberger, G., Bronz, M., and Gorraz, M.: Using the Paparazzi UAV System for Scientific Research, in: IMAV 2014, International Micro Air Vehicle Conference and Competition, Delft University of Technology, Delft, the Netherlands, 247–252, https://doi.org/10.4233/uuid:b38fbdb7-e6bd-440d-93be-f7dd1457be60, 2014. a, b
Huss, M. and Hock, R.: Global-scale hydrological response to future glacier mass loss, Nature Climate Change, 8, 135–140, https://doi.org/10.1038/s41558-017-0049-x, 2018. a
Jonassen, M. O., Tisler, P., Altstädter, B., Scholtz, A., Vihma, T., Lampert, A., König-Langlo, G., and Lüpkes, C.: Application of remotely piloted aircraft systems in observing the atmospheric boundary layer over Antarctic sea ice in winter, Polar Research, 34, 25651, https://doi.org/10.3402/polar.v34.25651, 2015. a
Jouberton, A., Shaw, T. E., Miles, E., McCarthy, M., Fugger, S., Ren, S., Dehecq, A., Yang, W., and Pellicciotti, F.: Warming-induced monsoon precipitation phase change intensifies glacier mass loss in the southeastern Tibetan Plateau, Proceedings of the National Academy of Sciences, 119, e2109796119, https://doi.org/10.1073/pnas.2109796119, 2022. a
Lampert, A., Altstädter, B., Bärfuss, K., Bretschneider, L., Sandgaard, J., Michaelis, J., Lobitz, L., Asmussen, M., Damm, E., Käthner, R., Krüger, T., Lüpkes, C., Nowak, S., Peuker, A., Rausch, T., Reiser, F., Scholtz, A., Sotomayor Zakharov, D., Gaus, D., Bansmer, S., Wehner, B., and Pätzold, F.: Unmanned Aerial Systems for Investigating the Polar Atmospheric Boundary Layer – Technical Challenges and Examples of Applications, Atmosphere, 11, 416, https://doi.org/10.3390/atmos11040416, 2020. a
Litt, M., Sicart, J.-E., and Helgason, W.: A study of turbulent fluxes and their measurement errors for different wind regimes over the tropical Zongo Glacier (16° S) during the dry season, Atmos. Meas. Tech., 8, 3229–3250, https://doi.org/10.5194/amt-8-3229-2015, 2015. a
Mayer, S., Hattenberger, G., Brisset, P., Jonassen, M., and Reuder, J.: A “no-flow-sensor” wind estimation algorithm for unmanned aerial systems, International Journal of Micro Air Vehicles, 4, 15–30, 2012. a, b
Messmer, J. and Groos, A. R.: A low-cost and open-source approach for supraglacial debris thickness mapping using UAV-based infrared thermography, The Cryosphere, 18, 719–746, https://doi.org/10.5194/tc-18-719-2024, 2024. a, b
Mott, R., Stiperski, I., and Nicholson, L.: Spatio-temporal flow variations driving heat exchange processes at a mountain glacier, The Cryosphere, 14, 4699–4718, https://doi.org/10.5194/tc-14-4699-2020, 2020. a, b, c, d, e, f, g
Nicholson, L. and Stiperski, I.: Comparison of turbulent structures and energy fluxes over exposed and debris-covered glacier ice, Journal of Glaciology, 1–13, https://doi.org/10.1017/jog.2020.23, 2020. a, b, c, d, e, f
Oerlemans, J.: The Microclimate of Valley Glaciers, Igitur, Utrecht Publishing & Archiving Services, Universiteitsbibliotheek Utrecht, ISBN 987-90-393-5305-5, 2010. a, b, c, d
Oerlemans, J. and Grisogono, B.: Glacier winds and parameterisation of the related surface heat fluxes, Tellus A: Dynamic Meteorology and Oceanography, 54, 440–452, https://doi.org/10.3402/tellusa.v54i5.12164, 2002. a, b, c, d, e, f
Oerlemans, J. and Vugts, H. F.: A Meteorological Experiment in the Melting Zone of the Greenland Ice Sheet, Bulletin of the American Meteorological Society, 74, 355–365, https://doi.org/10.1175/1520-0477(1993)074<0355:AMEITM>2.0.CO;2, 1993. a, b
Oerlemans, J., Björnsson, H., Kuhn, M., Obleitner, F., Palsson, F., Smeets, C., Vugts, H. F., and Wolde, J. D.: Glacio-Meteorological Investigations On Vatnajökull, Iceland, Summer 1996: An Overview, Boundary-Layer Meteorology, 92, 3–24, https://doi.org/10.1023/A:1001856114941, 1999. a, b, c, d, e, f, g
Ohata, T.: Katabatic Wind on Melting Snow and Ice Surfaces (II): Application of a Theoretical Model, Journal of the Meteorological Society of Japan. Ser. II, 67, 113–122, https://doi.org/10.2151/jmsj1965.67.1_113, 1989. a, b
Petersen, L. and Pellicciotti, F.: Spatial and temporal variability of air temperature on a melting glacier: Atmospheric controls, extrapolation methods and their effect on melt modeling, Juncal Norte Glacier, Chile: Temperature Variability Over A Glacier, Journal of Geophysical Research: Atmospheres, 116, D23109, https://doi.org/10.1029/2011JD015842, 2011. a, b
Petersen, L., Pellicciotti, F., Juszak, I., Carenzo, M., and Brock, B.: Suitability of a constant air temperature lapse rate over an Alpine glacier: testing the Greuell and Böhm model as an alternative, Annals of Glaciology, 54, 120–130, https://doi.org/10.3189/2013AoG63A477, 2013. a
Philipp, A.: mmp – mobile measurement post-processing, GitLab University of Augsburg [code], https://git.rz.uni-augsburg.de/philipan/mmp (last access: 30 September 2025), 2025. a, b
Potter, E. R., Orr, A., Willis, I. C., Bannister, D., and Salerno, F.: Dynamical Drivers of the Local Wind Regime in a Himalayan Valley, Journal of Geophysical Research: Atmospheres, 123, 13186–13202, https://doi.org/10.1029/2018JD029427, 2018. a, b
Reuder, J., Brisset, P., Jonassen, M., Müller, M., and Mayer, S.: The Small Unmanned Meteorological Observer SUMO: A new tool for atmospheric boundary layer research, Meteorologische Zeitschrift, 18, 141–147, https://doi.org/10.1127/0941-2948/2009/0363, 2009. a, b, c, d
Reuder, J., Ablinger, M., Ágústsson, H., Brisset, P., Brynjólfsson, S., Garhammer, M., Jóhannesson, T., Jonassen, M. O., Kühnel, R., Lämmlein, S., De Lange, T., Lindenberg, C., Malardel, S., Mayer, S., Müller, M., Ólafsson, H., Rögnvaldsson, O., Schäper, W., Spengler, T., Zängl, G., and Egger, J.: FLOHOF 2007: an overview of the mesoscale meteorological field campaign at Hofsjökull, Central Iceland, Meteorology and Atmospheric Physics, 116, 1–13, https://doi.org/10.1007/s00703-010-0118-4, 2012. a, b, c
Rounce, D. R., Hock, R., Maussion, F., Hugonnet, R., Kochtitzky, W., Huss, M., Berthier, E., Brinkerhoff, D., Compagno, L., Copland, L., Farinotti, D., Menounos, B., and McNabb, R. W.: Global glacier change in the 21st century: Every increase in temperature matters, Science, 379, 78–83, https://doi.org/10.1126/science.abo1324, 2023. a
Salerno, F., Guyennon, N., Yang, K., Shaw, T. E., Lin, C., Colombo, N., Romano, E., Gruber, S., Bolch, T., Alessandri, A., Cristofanelli, P., Putero, D., Diolaiuti, G., Tartari, G., Verza, G., Thakuri, S., Balsamo, G., Miles, E. S., and Pellicciotti, F.: Local cooling and drying induced by Himalayan glaciers under global warming, Nature Geoscience, 16, 1120–1127, https://doi.org/10.1038/s41561-023-01331-y, 2023. a, b
Savitzky, A. and Golay, M. J. E.: Smoothing and Differentiation of Data by Simplified Least Squares Procedures, Analytical Chemistry, 36, 1627–1639, https://doi.org/10.1021/ac60214a047, 1964. a
Sensirion: Datasheet SHT7x (SHT71, SHT75), https://sensirion.com/media/documents/9A2ADC83/61642805/Sensirion_Humidity_Sensors_SHT7x_Datasheet.pdf (last access: 30 September 2025), 2011. a
Shaw, T. E., Brock, B. W., Fyffe, C. L., Pellicciotti, F., Rutter, N., and Diotri, F.: Air temperature distribution and energy-balance modelling of a debris-covered glacier, Journal of Glaciology, 62, 185–198, https://doi.org/10.1017/jog.2016.31, 2016. a
Shaw, T. E., Brock, B. W., Ayala, A., Rutter, N., and Pellicciotti, F.: Centreline and cross-glacier air temperature variability on an Alpine glacier: assessing temperature distribution methods and their influence on melt model calculations, Journal of Glaciology, 63, 973–988, https://doi.org/10.1017/jog.2017.65, 2017. a
Shaw, T. E., Yang, W., Ayala, Á., Bravo, C., Zhao, C., and Pellicciotti, F.: Distributed summer air temperatures across mountain glaciers in the south-east Tibetan Plateau: temperature sensitivity and comparison with existing glacier datasets, The Cryosphere, 15, 595–614, https://doi.org/10.5194/tc-15-595-2021, 2021. a
Shaw, T. E., Buri, P., McCarthy, M., Miles, E. S., Ayala, A., and Pellicciotti, F.: The Decaying Near‐Surface Boundary Layer of a Retreating Alpine Glacier, Geophysical Research Letters, 50, e2023GL103043, https://doi.org/10.1029/2023GL103043, 2023. a, b, c, d
Shaw, T. E., Buri, P., McCarthy, M., Miles, E. S., and Pellicciotti, F.: Local Controls on Near‐Surface Glacier Cooling Under Warm Atmospheric Conditions, Journal of Geophysical Research: Atmospheres, 129, e2023JD040214, https://doi.org/10.1029/2023JD040214, 2024. a, b, c, d, e, f, g, h
Shea, J. M. and Moore, R. D.: Prediction of spatially distributed regional‐scale fields of air temperature and vapor pressure over mountain glaciers, Journal of Geophysical Research: Atmospheres, 115, 2010JD014351, https://doi.org/10.1029/2010JD014351, 2010. a, b
Smeur, E. J. J., Bronz, M., and de Croon, G. C. H. E.: Incremental Control and Guidance of Hybrid Aircraft Applied to a Tailsitter Unmanned Air Vehicle, Journal of Guidance, Control, and Dynamics, 43, 274–287, https://doi.org/10.2514/1.G004520, 2019. a
Steiner, J. F. and Pellicciotti, F.: Variability of air temperature over a debris-covered glacier in the Nepalese Himalaya, Annals of Glaciology, 57, 295–307, https://doi.org/10.3189/2016AoG71A066, 2016. a
Van den Broeke, M. R.: Momentum, Heat, and Moisture Budgets of the Katabatic Wind Layer over a Midlatitude Glacier in Summer, Journal of Applied Meteorology, 36, 763–774, https://doi.org/10.1175/1520-0450(1997)036<0763:MHAMBO>2.0.CO;2, 1997a. a, b, c, d, e, f, g
Van den Broeke, M. R.: Structure and diurnal variation of the atmospheric boundary layer over a mid-latitude glacier in summer, Boundary-Layer Meteorology, 83, 183–205, https://doi.org/10.1023/A:1000268825998, 1997b. a, b, c, d, e, f, g, h, i
- Abstract
- Introduction
- Study area
- Synoptic situation
- Methodology
- Results
- Discussion
- Conclusions
- Appendix A: Sensor intercomparison
- Appendix B: Sink rates
- Appendix C: Lapse rates
- Appendix D: 800 m profile on 26 August at 14:05 CEST
- Code and data availability
- Author contributions
- Competing interests
- Disclaimer
- Acknowledgements
- Financial support
- Review statement
- References