the Creative Commons Attribution 4.0 License.
the Creative Commons Attribution 4.0 License.
 | 18 Nov 2025
Estimation of nighttime aerosol optical depths using the ground-based microwave radiometer
Guanyu Liu
Sheng Yue
Lulu Zhang
Chongzhao Zhang
Aerosol optical depth (AOD) is a crucial parameter for understanding the impact of aerosols on Earth's atmosphere and air quality. Nevertheless, most existing remote sensing techniques rely on the shortwave spectrum, precluding nighttime measurements. While lunar and stellar photometry can measure nighttime AOD, their data availability is limited due to the scarce moonlight for lunar photometry and the rarity of application for stellar photometry. In this study, we made a first attempt to retrieve AOD from ground-based microwave radiometer (MWR) measurements in Beijing Nanjiao Meteorological Observatory in China. Brightness temperatures (BTs) at the K-band (from 22.23 to 30.00 GHz) and V-band (from 51.25 to 58.80 GHz) are trained against daytime spectral AOD from sun photometer measurements together with the temperature profile using the random forest regression (RFR) retrieval model, and the model is then used to retrieve nighttime AOD. The algorithm demonstrates satisfactory performance, with reasonable agreement with lunar AOD retrievals from the lunar photometer (R=0.91 and RMSE =0.14). The results also reveal a distinct day–night cycle of AOD, with nighttime AOD typically higher than its daytime value for the Beijing-CAMS Aerosol Robotic Network (AERONET) site and AOD estimated based on MWR measurements. The physical basis of our approach is verified using vertical temperature and humidity profiles from sounding observation and simulation results from WRF-Chem as well as the monochromatic radiative transfer model (MonoRTM). Our study provides an effective and convenient approach to estimate nighttime aerosol loading from surface, which has great potential in environmental monitoring and climate forcing research.
- Article
(8069 KB) - Full-text XML
-
Supplement
(2250 KB) - BibTeX
- EndNote


Aerosols have a significant impact on weather patterns and the Earth's climate (Huang et al., 2014; Li et al., 2022, 2019; Riemer et al., 2019), offsetting about one-third of the warming effect by anthropogenic greenhouse gases and influence large-scale circulation (Huang et al., 2014; Li et al., 2022). However, accurately assessing their role in radiative forcing is a major challenge (Fan et al., 2016; Ghan et al., 2016; IPCC, 2021; Seinfeld et al., 2016). Monitoring aerosol optical depth (AOD) is crucial for understanding aerosol impacts on climate and air quality, as it reflects the total amount of aerosols in the atmosphere from its direct radiative impact (Visioni et al., 2023; Yang et al., 2020). As a result, there have been extensive efforts to measure AOD by various methods.
The AOD is firstly measured through the inversion of the Beer–Bouguer–Lambert law, which describes the attenuation of spectral direct normal irradiance (DNI) (Gueymard, 2012). This process typically involves the use of a spectrometer or spectroradiometer to measure direct solar irradiance as monochromatically as possible on a specific spectral channel (Gueymard, 2012). This can be achieved using either a filter-based photometer or a narrow-band spectroradiometer. The ground-based Cimel CE318-T sun photometer is widely used within the Aerosol Robotic Network (AERONET) to provide relatively accurate estimates of daytime AOD serving as referenced values since 1980s (Holben et al., 1998). Other observations measure physicochemical properties of aerosols instead of optical properties like AOD (Kremser et al., 2016; Li et al., 2016b). Mainstream aerosol remote sensing techniques rely on aerosol scattering of shortwave radiation in the ultraviolet and/or visible spectrum; thus only daytime AOD can be obtained (Sayer et al., 2019; Sun et al., 2021). However, aerosols typically have day–night variability, due to factors such as different emission sources and boundary layer structure (Arola et al., 2013; Cachorro et al., 2004; Cachorro et al., 2008; Guo et al., 2017). Aerosols at nighttime also have detectable impacts on the radiative balance, since they usually exert a warming effect in contrast to the cooling effect at daytime (Chen and Zhao, 2024; Colarco et al., 2014; Zhang et al., 2022), particularly in polar regions with the rapid change of AOD between daytime and nighttime (Chen and Zhao, 2024; Stenchikov et al., 2002; Wei et al., 2021). In special cases such as aerosols above the open oceans, they consistently exert a cooling influence in both shortwave and longwave, yet for dust aerosols, they potentially exert a warming effect in longwave during both day and night (Adebiyi et al., 2023; Feng et al., 2022; Song et al., 2022).
Remote sensing of aerosol properties at night is a challenging task. Lunar photometry has emerged during recent years as an effective and relative accurate nighttime AOD retrieval technique and has been widely used within the AERONET since 2013 (Barreto et al., 2013, 2016). However, this method is limited in its temporal coverage, providing data for only approximately half of each month. This limitation arises because the method requires a substantial amount of moon-reflected solar radiation, which is not consistently available due to the imperfect anti-correlation between the lunar and solar set/rise cycles (Barreto et al., 2017; Berkoff et al., 2011). Compared with the lunar photometer method, stellar photometry, despite its rarity of use, provides nighttime AOD measurements by leveraging stellar irradiance, eliminating lunar phase corrections, with long-term datasets revealing diurnal aerosol dynamics (Pérez-Ramírez et al., 2011, 2016, 2008, 2015). Arctic deployments and further development such as using a wide-field imager enhance its adaptability in extreme environments and spatiotemporal resolution, addressing gaps in traditional sun-photometer-based nocturnal monitoring (Ebr et al., 2021; Ivănescu et al., 2021; Ivănescu and O'Neill, 2023). However, this method is not widely adopted globally due to the bulkiness of the facilities and the complex operational processes required for deployment (Herber et al., 2002; Leiterer et al., 1995). Other research studies take advantage of urban light to retrieve nighttime AOD from space from multiple sensors (Jiang et al., 2022; Meng et al., 2023; Wang et al., 2023, 2020; Zhou et al., 2021). For example, Zhang et al. (2019) examined the effectiveness of retrieving nighttime AOD over urban areas by utilizing city lights observed through the satellite-based instrument VIIRS (Visible Infrared Imaging Radiometer Suite) Day-Night Band (DNB). However, this approach has limitations as it does not account for multiple scattering and gas absorption, which can potentially reduce the signals from aerosols (Zhou et al., 2021). Furthermore, these studies are constrained to the spatial scale of urban areas, resulting in vast rural regions being unexplored (Meng et al., 2023). Active remote sensing, such as lidars, can provide aerosol measurements at both day- and nighttime (Balmes et al., 2021; Jiang et al., 2024). Nonetheless, solving the lidar equation requires assumption of the lidar ratio, and this assumed lidar ratio often causes large uncertainty of the retrieved extinction profiles as well as column-integrated AOD usually (Liu et al., 2018; Rogers et al., 2014; Santa Maria and Winker, 2005). For the day–night difference of AOD, previous studies find slight increases in nighttime AOD using the long-term sun and star photometry data (Pérez-Ramírez et al., 2012, 2016; Wang et al., 2004). Moreover, using Infrared Atmospheric Sounder Interferometer (IASI) and Cloud-Aerosol Transport System (CATS) is also effective to understand day–night differences in dust aerosols (Tindan et al., 2023; Yu et al., 2021). Graßl et al. (2024) also presented a homogenized dataset derived from a sun and star photometer operated in the European Arctic over a 20-year period. However, existing research regarding day–night difference of AOD only focuses on special types of aerosols such as dust aerosols and has low availability due to the moon phase and urban light extent (Barreto et al., 2017; Jiang et al., 2022; Meng et al., 2023; Wang et al., 2023, 2020; Zhou et al., 2021). Due to our limited capability to measure nighttime AOD, there is a significant knowledge gap between daytime and nighttime aerosol properties.
In contrast to shortwave radiation, which is only available during daytime, longwave radiation, especially in the thermal infrared and microwave spectrum, exists during both day and night and offers the potential to derive nighttime aerosol property (Dufresne et al., 2002; Panicker et al., 2008). Previous research has explored the possibility to retrieve aerosol loading using longwave measurements but mostly focused on large particles such as dust (Clarisse et al., 2019; DeSouza-Machado et al., 2010; Klüser et al., 2012; Pierangelo et al., 2004, 2005; Zheng et al., 2022, 2023). For example, using collocated thermal infrared observations from MODIS and dust optical depth from Cloud-Aerosol Lidar with Orthogonal Polarization (CALIOP), Zheng et al. (2023) simultaneously retrieve the thermal infrared dust optical depth and coarse-mode effective diameter over global oceans. Observational and simulation studies indicate that the microwave brightness temperatures (BTs) and brightness temperature polarization differences may both be useful for estimating the dust mass loading (Ge et al., 2008; Hong et al., 2008; Huang et al., 2007; Mitra et al., 2013). Our previous study utilized satellite-based thermal infrared measurements in the atmospheric window region to retrieve nighttime AOD (Liu et al., 2024) and proved the effectiveness of these longwave measurements in deriving aerosol properties.
The ground-based microwave radiometer (MWR) is a widely used remote sensing instrument to retrieve temperature and humidity profiles using emitted longwave radiation by the surface–atmosphere system (Bianco et al., 2005; Greenwald et al., 2018; Knupp et al., 2009). Considering the aforementioned concepts of utilizing longwave radiances to retrieve aerosol properties and the potential alterations in microwave BTs due to the modified temperature and humidity profiles resulting from the shortwave radiation effect of aerosols, there is potential that aerosol information can be derived from MWR measurements, thereby further filling the gaps of previous retrieval methods. Therefore, in this study, we explore the possibility to retrieve AOD using surface-based MWR measurements in the K spectral bands (22.23, 22.50, 23.03, 23.83 25.00, 26.23, 28.00, and 30.00 GHz) and V spectral bands (51.25, 51.76, 52.28, 52.80, 53.34, 53.85, 54.40, 54.94, 55.50, 56.02, 56.66, 57.29, 57.96, and 58.80 GHz). A machine-learning-based algorithm is developed to estimate AOD during both day and night. The theoretical basis of the method is further verified using regional model and radiative transfer simulations. The difference between day- and nighttime AOD is also examined using the retrieval results.
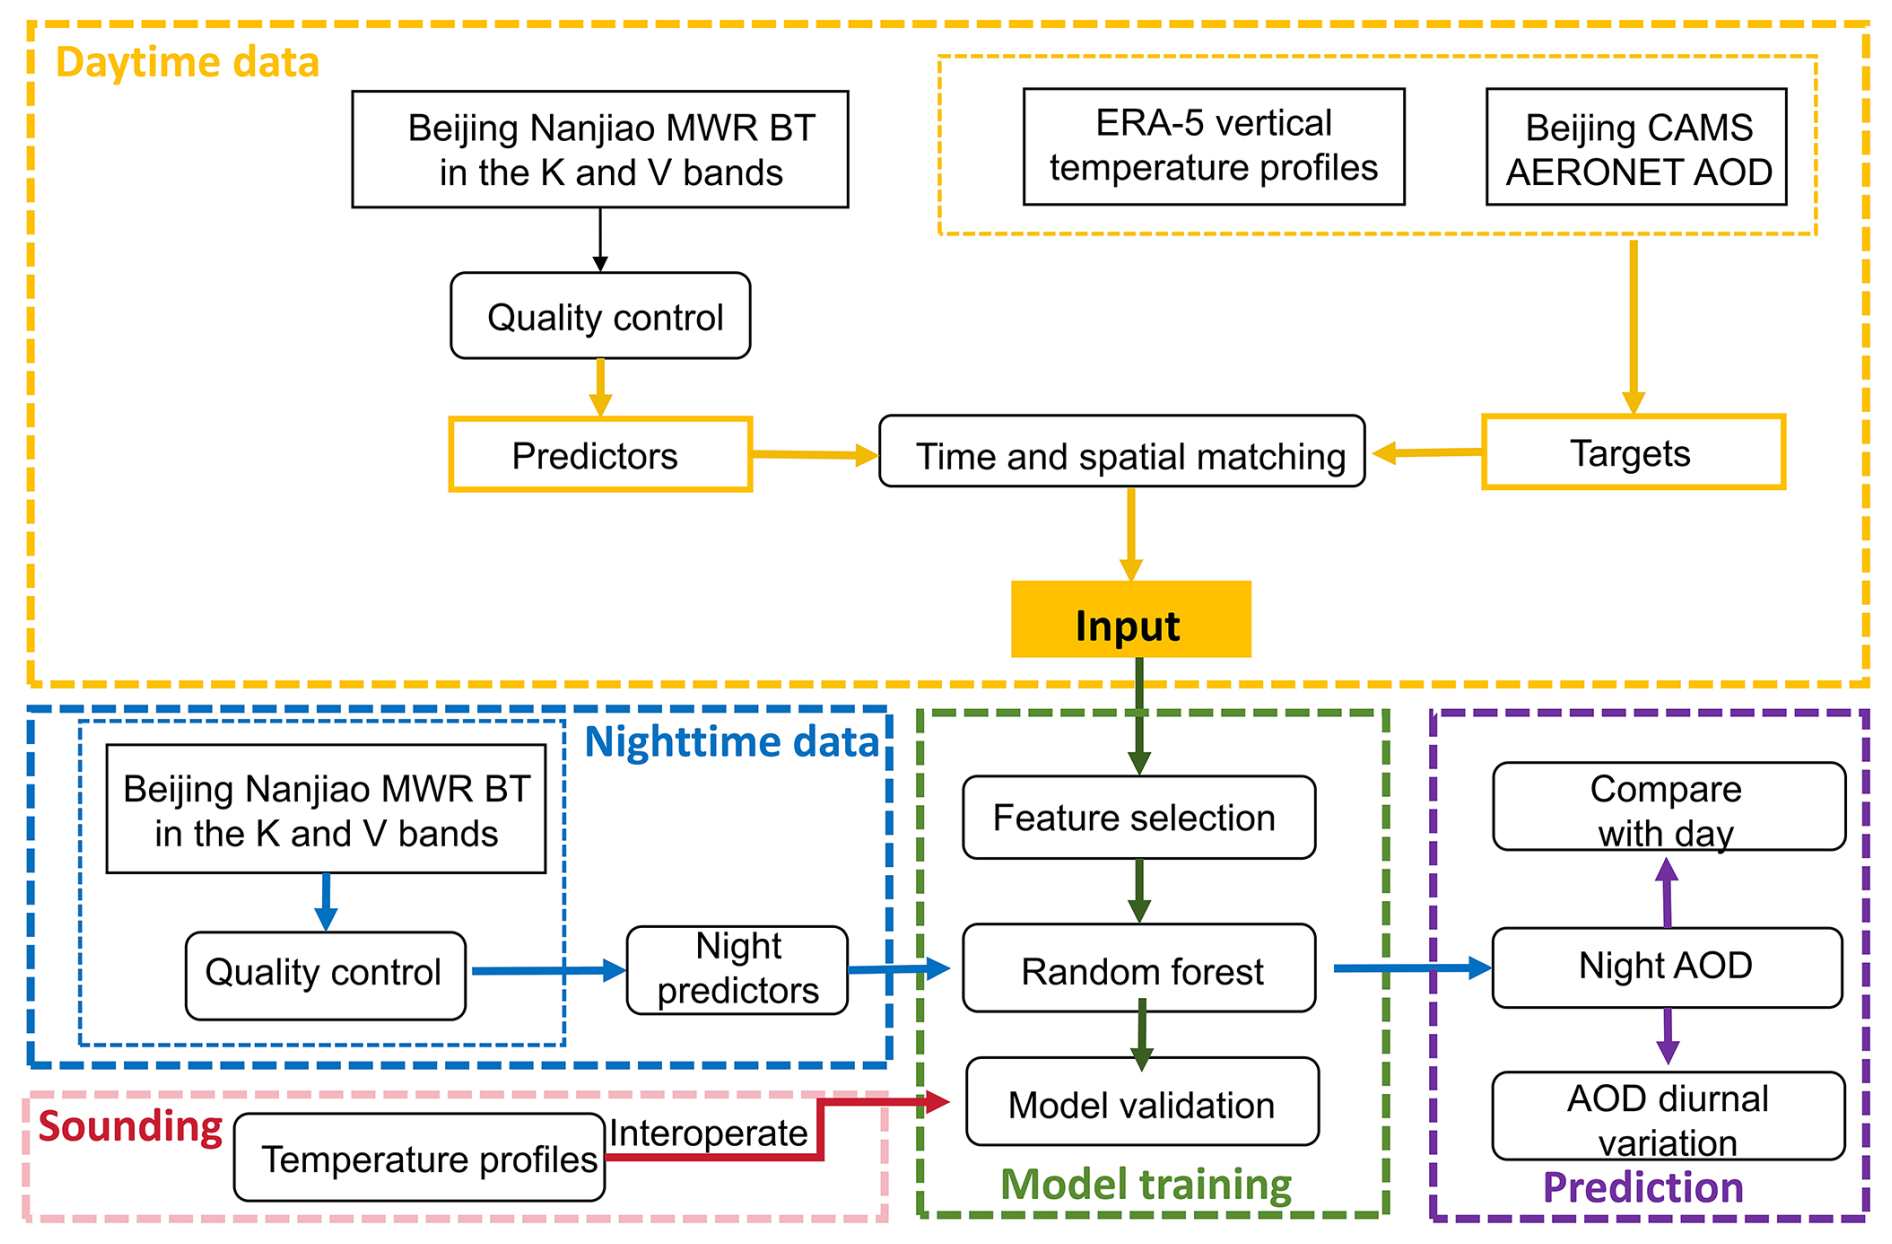
Figure 1The flowchart for clear-sky nighttime AOD and vertical temperature profile retrieval algorithm.
The retrieval algorithm used in this study is described in Fig. 1 and includes four main steps: (1) preprocessing of input variables, (2) training of the Random Forest Regression (RFR) retrieval model, (3) estimation of AOD using the trained model, and (4) independent validation to refine the model and assess its performance compared to lunar photometer observations. The details of the datasets and methods are explained below.
2.1 Datasets
The study area is located at the northern edge of the North China Plain, featuring a temperate continental monsoon climate with four distinct seasons (Yu et al., 2009). Spring is occasionally influenced by dust episodes transported by northwesterly and westerly winds from the Kumutage and Taklimakan deserts in western China or by northerly winds from the Mongolian deserts (Liu et al., 2022a). Summer is marked by relatively hot and humid conditions and accounts for approximately 74 % of the annual precipitation. Autumn is mild and dry, with clear skies and cooling temperatures. Winter is cold and dry, with occasional snowfall and minimal precipitation (Feng et al., 2010; Hao et al., 2017).
In this study, we utilized BT data collected from the MP-3000A MWR, which was stationed at the Beijing Nanjiao Meteorological Observatory located in China (39.80° N, 116.47° E, http://bj.cma.gov.cn/, last access: 8 April 2024) (Ding et al., 2010; Lei et al., 2011; Zhou et al., 2024). The MP-3000A MWR is capable of detecting signals in the K-band (22 to 30 GHz) and V-band (51 to 59 GHz), and it is also equipped with additional features such as a precipitation sensor, an infrared radiation thermometer, and other relevant instruments. To maintain the accuracy and consistency of the atmospheric BT measurements, the MWR undergoes regular real-time calibration. These measurements are essential for obtaining temperature profiles and AOD data. Our analysis focuses on the K- and V-band of BT observations with 22 available channels because BT observations at the K-band are sensitive to water vapor absorption and BT observations at the V-band are sensitive to oxygen absorption and temperature changes. We use the data ranging from December 2019 to October 2020 with a temporal resolution of 1 min due to limitations of data distribution policy. We also aim to extend the temporal range of our analysis in the future study.
The measured BTs include inaccuracies and unusual values caused by instrumental faults, calibration problems, and environmental factors. Hence, it is crucial to conduct quality control (QC) checks on the BT data before processing it further. These checks involve removing abnormal values to ensure that the BTs fall within a reasonable temperature range of 2.7 to 330 K and inspecting for data consistency over time as per the methodology of Zhang et al. (2024). Ultimately, nearly 4.36 % of BT data were excluded from the study due to a combination of instrumental faults, calibration problems, and environmental factors. Notably, the Level 2 sun photometer AOD products from AERONET are already validated and represent clear-sky conditions. Therefore, the collocation of MWR data with these AERONET products inherently excludes cloudy conditions. While AERONET data can be cloud-free in the direction of the sun, the MWR, which measures in the zenith direction, may still detect the presence of clouds. Therefore, we further conducted additional cloud screening following the method of the previous study to ensure the clear-sky conditions in the analysis (Zhang et al., 2024).
AOD retrieved using the solar and lunar methods at the Beijing-CAMS AERONET site (39.95° N,116.32° E, located in the Chinese Academy of Meteorological Sciences; see Table S1 in the Supplement), which is the closest site to the MWR location (20.77 km), is used as training and validation data in the retrieval algorithm. For training our model, we utilized Level 2 sun photometer AOD products at the wavelengths of 440, 500, 675, 870, and 1020 nm during the day and Version 3 Level 1.5 lunar AOD products at the same wavelengths to validate AOD retrievals at night. It is noteworthy that the distance between the Beijing-CAMS AERONET site and MWR site is 20.77 km. Considering the vast urban area of Beijing, which spans approximately 160 km both east–west and north–south, this distance is relatively short. We specifically chose this AERONET station rather than others because it is the only one that provides consistent Version 3 Level 1.5 lunar AOD products from 2019 to 2020, ensuring a consistent dataset with daytime AOD for our analysis.
Given that MWRs are instrumental in tracking atmospheric temperature and humidity profile changes (Zhang et al., 2024), our method retrieves vertical temperature profiles concurrently. This is achieved using temperatures at different pressure levels obtained from the European Center for Medium-Range Weather Forecasts (ECMWF) Reanalysis version 5 (ERA-5) as the target for our training (Hersbach et al., 2023). We chose the ECMWF products mainly because of their hourly temporal resolution, which provides more training samples for the RFR model than the twice-daily sounding data. This enhances the model's ability to capture temporal variability and improve prediction accuracy of the predicted variables. To further assess the accuracy of the model in predicting vertical temperature profiles, we utilized the collocated sounding data obtained from Beijing Meteorological Station (station ID: 54511) during the corresponding time frame. The collocation process involves identifying the temporally nearest valid BT measurement and subsequently inputting this BT value into the model to generate the MWR-based vertical temperature profile prediction. The radiosonde temperature profiles are then vertically interpolated to the standard pressure levels (100, 200, 500, 700, 850, and 1000 hPa) using a linear interpolation method, allowing for direct comparison with the MWR-based temperature profile prediction. These sounding data were collected twice daily respectively at 00:00 and 12:00 UTC from December 2019 to October 2020.
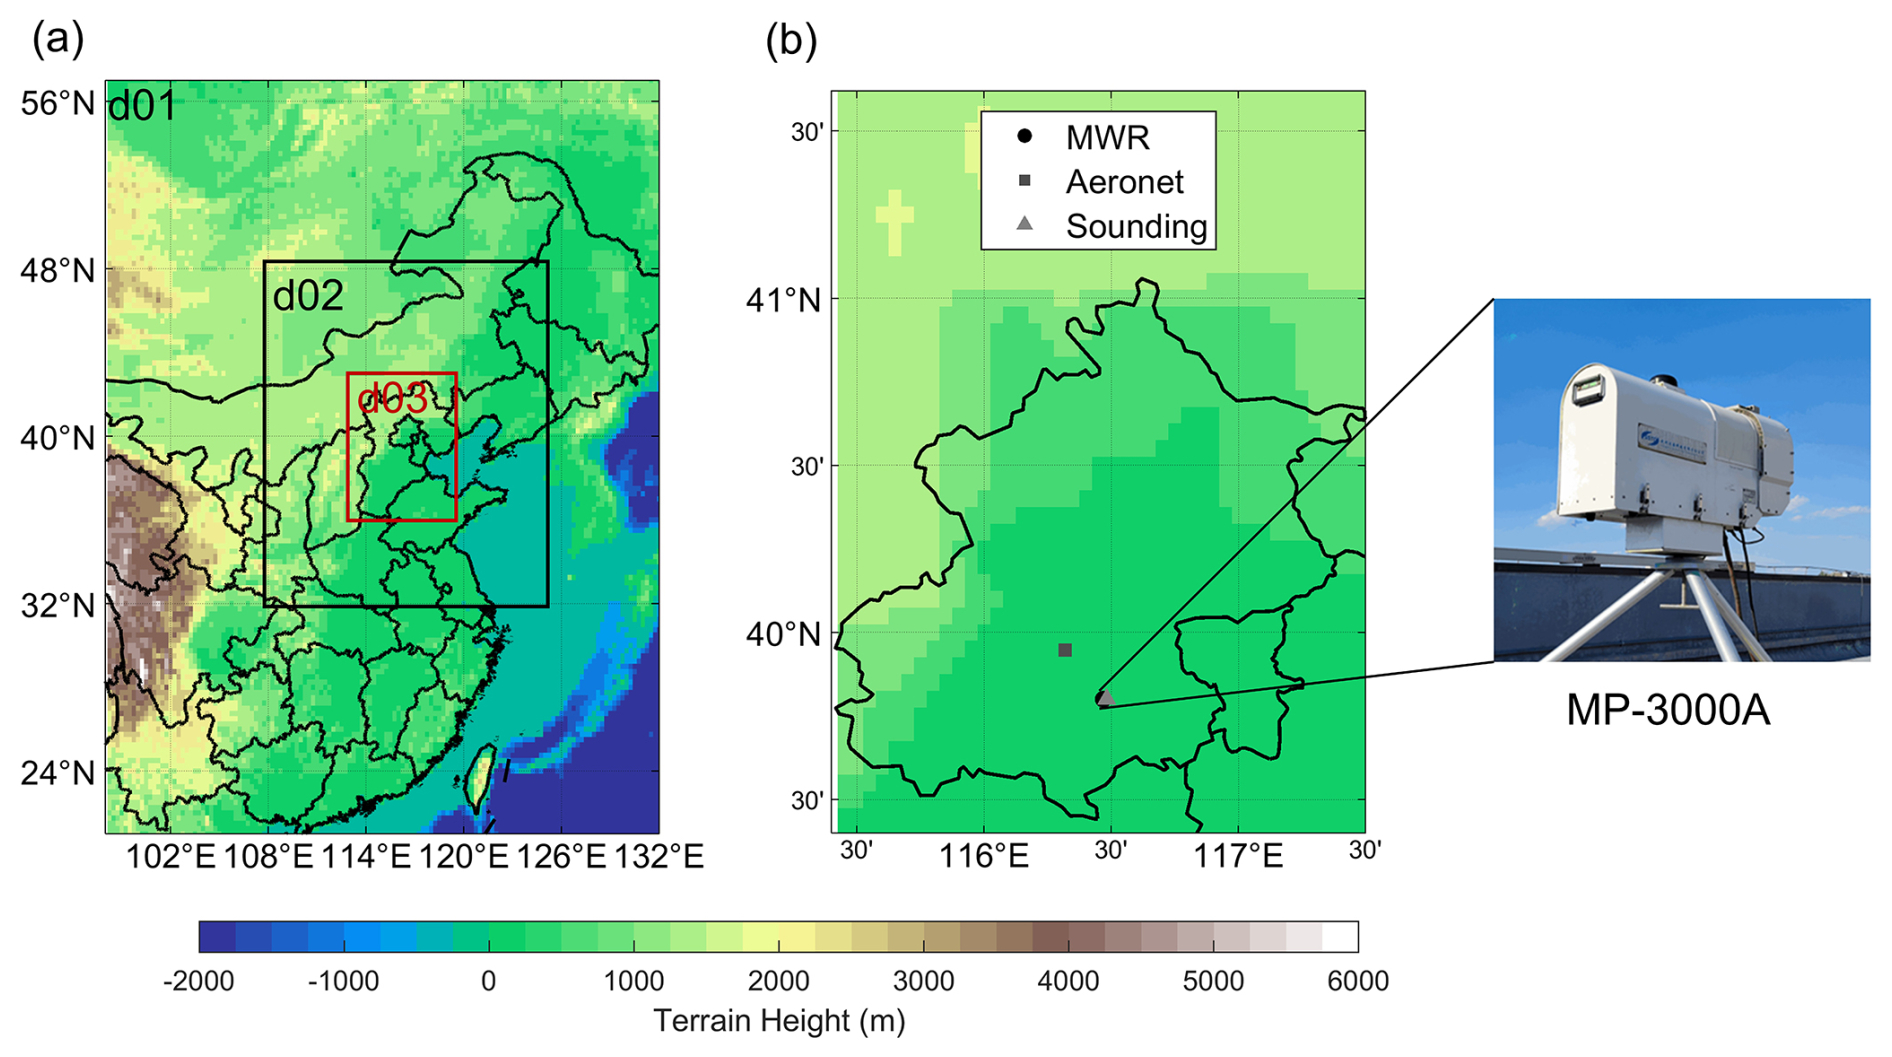
Figure 2(a) Simulation domains of the WRF-Chem experiments. (b) Left panel: the locations of observation sites in this study. The black circle indicates the MWR, the dark-gray square indicates the photometer, and the light triangle indicates the sounding. Right panel: the MWR used in this study is located in domain 3. This domain has a spatial resolution of 10 km. The MP-3000A MWR by Radiometrics is deployed at the Beijing Nanjiao Meteorological Observatory (39.80° N, 116.47° E) in China for brightness temperature (BT) measurements.
For the physical interpretation of our retrieval method, we employed collocated vertical profiles of temperature and relative humidity (RH) from the same sounding data under varying aerosol loadings to explore the effects of aerosol loading on the vertical profiles of meteorological variables. These vertical profiles were further utilized to compute BTs using the monochromatic radiative transfer model (MonoRTM).
In summary, our study primarily relies on in situ measurements from three sites: the MWR site, the AERONET site, and the sounding site (see Table S1 and Fig. 2b for details). These sites are located at the Beijing Nanjiao Meteorological Observatory, the Chinese Academy of Meteorological Sciences, and the Beijing Meteorological Station, respectively. All three sites are situated within the urban or suburban areas of Beijing, with relatively close proximity to each other. The aerosol types expected at these sites include urban aerosols and mixed aerosols, with dust aerosols peaking during the boreal spring season (Chen et al., 2016; Ou et al., 2017).
2.2 Retrieval algorithm
Because the relationship between aerosol loading and microwave radiation is complicated and could be nonlinear, we use a machine-learning-based retrieval method focusing on the RFR method (Svetnik et al., 2003). The RFR model leverages the power of ensemble learning, integrating multiple decision trees to enhance prediction accuracy and robustness. Each decision tree within the ensemble is constructed using a random subset of the training data and a random selection of features, thereby reducing overfitting and improving generalization capabilities. Through this mechanism, the RFR model can effectively capture the complex interactions between aerosol properties and microwave radiation signals, providing a reliable and efficient approach for aerosol retrieval.
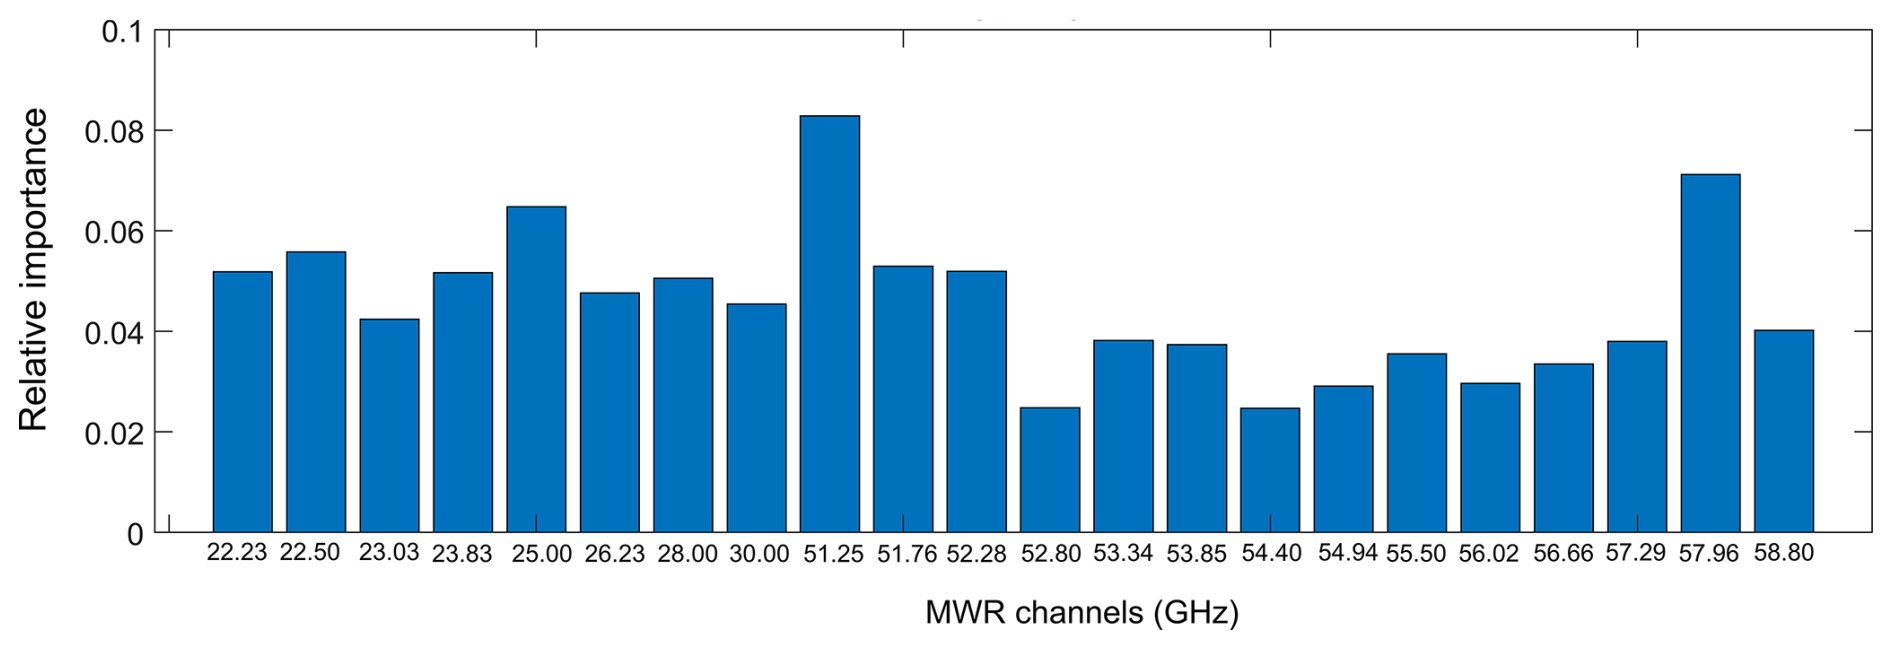
Figure 3Relative importance of all BTs in different frequencies measured by MWR in the RFR model. The vertical axis represents relative importance (unitless), and the horizontal axis corresponds to different variable inputs (BTs in different frequencies measured by MWR in the RFR model). These channels include 8 K-bands (22.23, 22.50, 23.03, 23.83, 25.00, 26.23, 28.00, 30.00 GHz) and 14 V-bands (51.25, 51.76, 52.28, 52.80, 53.34, 53.85, 54.40, 54.94 GHz, 55.50 56.02, 56.66, 57.29, 57.96, 58.80 GHz).
All variables are rigorously matched in both temporal and spatial dimensions to ensure consistency and accuracy. Specifically, AOD data derived from sun photometer measurements are temporally matched with BTs from the MWR within a 5 min time window. Meanwhile, hourly temperature profiles from the ERA-5 reanalysis datasets are collocated with MWR BTs within a 30 min time window and a 15 km spatial radius. It should be noted that the acquisition of temperature profiles relies solely on the ERA-5 reanalysis data and does not require data from the AERONET station and that the 15 km spatial radius only refers to the distance between the ERA-5 grid point and the MWR site location.
We first apply the relative importance feature selection technique, which is based on the Gini importance measure (Nembrini et al., 2018), to identify significant independent variables and build a generalized model. In the context of random forests, the relative importance of each predictor variable (feature) is quantified by a numeric array of size 1-by-Nvars. The importance measure for each variable is defined as the increase in prediction error that results from permuting the values of that variable across the out-of-bag observations. This measure is calculated for each tree in the ensemble and then averaged across all trees. To standardize the importance scores, the average values are normalized by dividing them by the standard deviation computed over the entire ensemble. This process yields a normalized importance measure that provides a robust assessment of each feature's contribution to the model's predictive performance. The relative importance of each factor is presented in Fig. 3. It is observed that BTs across various frequency bands carry similar levels of importance, suggesting that the BTs are almost equally important for retrieving AOD.
The retrieval algorithm is subsequently trained using 8 selected K-band BTs and 14 V-band BTs from the MP-3000A MWR as input variables. The target variables include AOD at 440, 500, 675, 870, and 1020 nm from the Beijing-CAMS AERONET site, as well as ERA-5 vertical temperature profiles at 100, 200, 500, 700, 850, and 1000 hPa. To ensure the representativeness of the sampling, we select the first three-quarters of the data in each month as the training set and the last one-quarter of the data as the testing set. Additionally, the algorithm is adapted to estimate nighttime AOD using nighttime BTs from microwave radiometry as input, which is then validated against nighttime AOD observations from lunar measurements by the lunar photometer for the same period. Moreover, AOD, whether in the visible or microwave region, is associated with aerosol loading, which serves as the foundation for retrieving visible AOD using microwave observations. Since we primarily aim at retrieving AOD rather than aerosol type, we did not consider AOD at the other wavelengths when building the AOD retrieval model. The relationship between AOD at 440, 500, 675, 870, and 1020 nm (the output wavelengths of the RFR model) and at the microwave band is enclosed in the random forest model. The model performance is assessed against photometer retrievals using metrics such as linear regression slope and intercept, correlation coefficient (R), root-mean-square error (RMSE), and mean absolute percentage error (MAPE).
The RFR model is built by varying the number of decision trees from 8 to 256. Through validation analysis, it is determined that the optimal number of trees is 128, based on the best performance during validation. The super parameters of this RFR model are detailed in Table S2. After refining the algorithm through extensive training and testing, it is used to retrieve nighttime AOD from nighttime MWR BTs, with validation against collocated lunar AOD measurements from the lunar photometer. Moreover, before investigating the diurnal cycle of MWR-derived AOD, we perform a quality control on the minute-resolution retrieval results that typically have a higher noise level. Specifically, for each specific minute, we extract the AOD for this minute from each day to form an AOD sequence. We then calculate the mean and standard deviation of this AOD sequence. Finally, we remove AOD that exceeds 3 times the standard deviation. Considering the suitable quantity of outliers procured by setting the threshold at 3 standard deviations and the prevalently utilized 3σ rule, we used 3 standard deviations as the threshold (Li et al., 2016a; Liu et al., 2024; Wang et al., 2012).
2.3 WRF-Chem simulations
To investigate the effect of aerosols on downward microwave radiation, we use the Weather Research and Forecasting model with Chemistry (WRF-Chem) simulations combined with the MonoRTM radiative transfer model. Because MWR-observed BT change not only is due to AOD change but also reflects the change of meteorological conditions due to the AOD change, we apply WRF-Chem and the MonoRTM instead of radiative transfer simulations only.
WRF-Chem simulation runs from 00:00 UTC on 17 December 2016 to 00:00 UTC on 20 December 2016 (a 72 h period). The simulation period is different from that of the retrieval because there are no updated emission fields for 2019 and 2020. The initial meteorological conditions used for the simulations are based on the National Center for Atmospheric Research (NCEP) Final Global Forecast System Operational Analysis (FNL) provided by the National Oceanic and Atmospheric Administration (NOAA), with a 1°×1° spatial resolution and a 6 h temporal interval. The emission fields used here are Emissions Database for Global Atmospheric Research (EDGAR), MIX, and Multi-resolution Emission Inventory for China (MEIC) (Crippa et al., 2018; Li et al., 2017; Wang et al., 2014). The surface emissivity we used for simulation is the default data for WRF-Chem. The simulation domain encompasses the area of Beijing, Tianjin, and Hebei provinces (as shown in Fig. 2a), with a center point at 40.00° N, 116.25° E. The model employs a three-tiered nesting configuration, featuring outer grids of 40×46 with a 90 km horizontal spacing, middle grids of 48×60 with a 30 km horizontal spacing, and inner grids of 51×72 with a 10 km horizontal spacing. The vertical atmosphere is segmented into 47 levels, ranging from the model's ground level to 100 hPa, encompassing both the surface and the upper atmosphere. Figure 3 illustrates the domains of the WRF model simulations and the location of the MWR deployed at the Beijing Nanjiao Meteorological Observatory in China. To further confirm our findings, we perform another set of parallel experiments lasting from 00:00 UTC on 3 December 2016 to 00:00 UTC on 5 December 2016 (a 48 h period) with the same settings. Additionally, to augment the representativeness of our results, analogous WRF-Chem simulations were executed during the boreal summer from 00:00 UTC on 5 July 2016 to 00:00 UTC on 8 July 2016 (a 72 h period). The choice of these simulation periods is based on the presence of significant pollution events, which provide a robust basis for examining the influence of aerosols on meteorological fields and the associated microwave BTs. The first day of both sets of experiments is used for model stabilization, and the subsequent days are utilized for analysis.
For the choices of physical parameterization schemes, we employ the Lin microphysics scheme, the rapid radiative transfer model for global climate model (GCM) applications (RRTMG) for shortwave radiation, the Yonsei University (YSU) boundary layer scheme, the Monin–Obukhov ground layer scheme, the Carbon-Bond Mechanism version Z (CBM-Z) for gas-phase chemistry, and the Model for Simulating Aerosol Interactions and Chemistry (MOSAIC). The model output has a 1 h temporal resolution. Here, we utilize AOD at 550 nm instead of 500 nm because WRF-Chem does not simulate AOD at 500 nm. Thus, 550 nm was selected as the closest available alternative wavelength in the WRF-Chem output.
To investigate the responses of surface downward microwave radiation to aerosol loadings, we also conducted two parallel experiments with and without aerosol emissions in the study. Two simulations that are designated as “EXP_AER” and “EXP_NOAER” are carried out. The EXP_AER experiment is defined as a control simulation in which the aerosol and aerosol precursor emission scheme is turned on. This aerosol emission includes emissions of carbon monoxide, nitrogen oxides, sulfate oxides, dust aerosols, biomass aerosols, biomass burning aerosols, sea salt aerosols, and anthropogenic aerosols. The sensitivity experiment (“EXP_NOAER”) is also conducted by closing corresponding aerosol and aerosol precursor emission scheme. The difference between control and sensitivity results are considered the adjustments of vertical meteorological profiles to aerosol loadings. This method is also widely used to explore the radiative forcing of different kinds of aerosol and its effects on meteorological fields in previous studies (Chen et al., 2023c; Matsui et al., 2018).
It is important to note that the aerosol–radiation interaction feature is activated in the WRF-Chem model to investigate the impact of aerosol loadings on meteorological fields. Subsequently, we input meteorological profile data from pollution cases without cloud cover at each grid point into the monochromatic radiative transfer model (MonoRTM) to calculate the corresponding BT responses at various frequencies within the K-band.
2.4 MonoRTM
The MonoRTM (Clough et al., 2005; Huang et al., 2013), developed by Atmospheric and Environmental Research (AER), is a radiative transfer model specifically designed for microwave and millimeter-wave applications (Clough et al., 2005; Huang et al., 2013). This model is particularly useful in the microwave radiation calculation (Payne et al., 2011). In this study, it is used to calculate the brightness temperatures (BTs) associated with the simulated temperature and humidity vertical profiles from WRF-Chem.
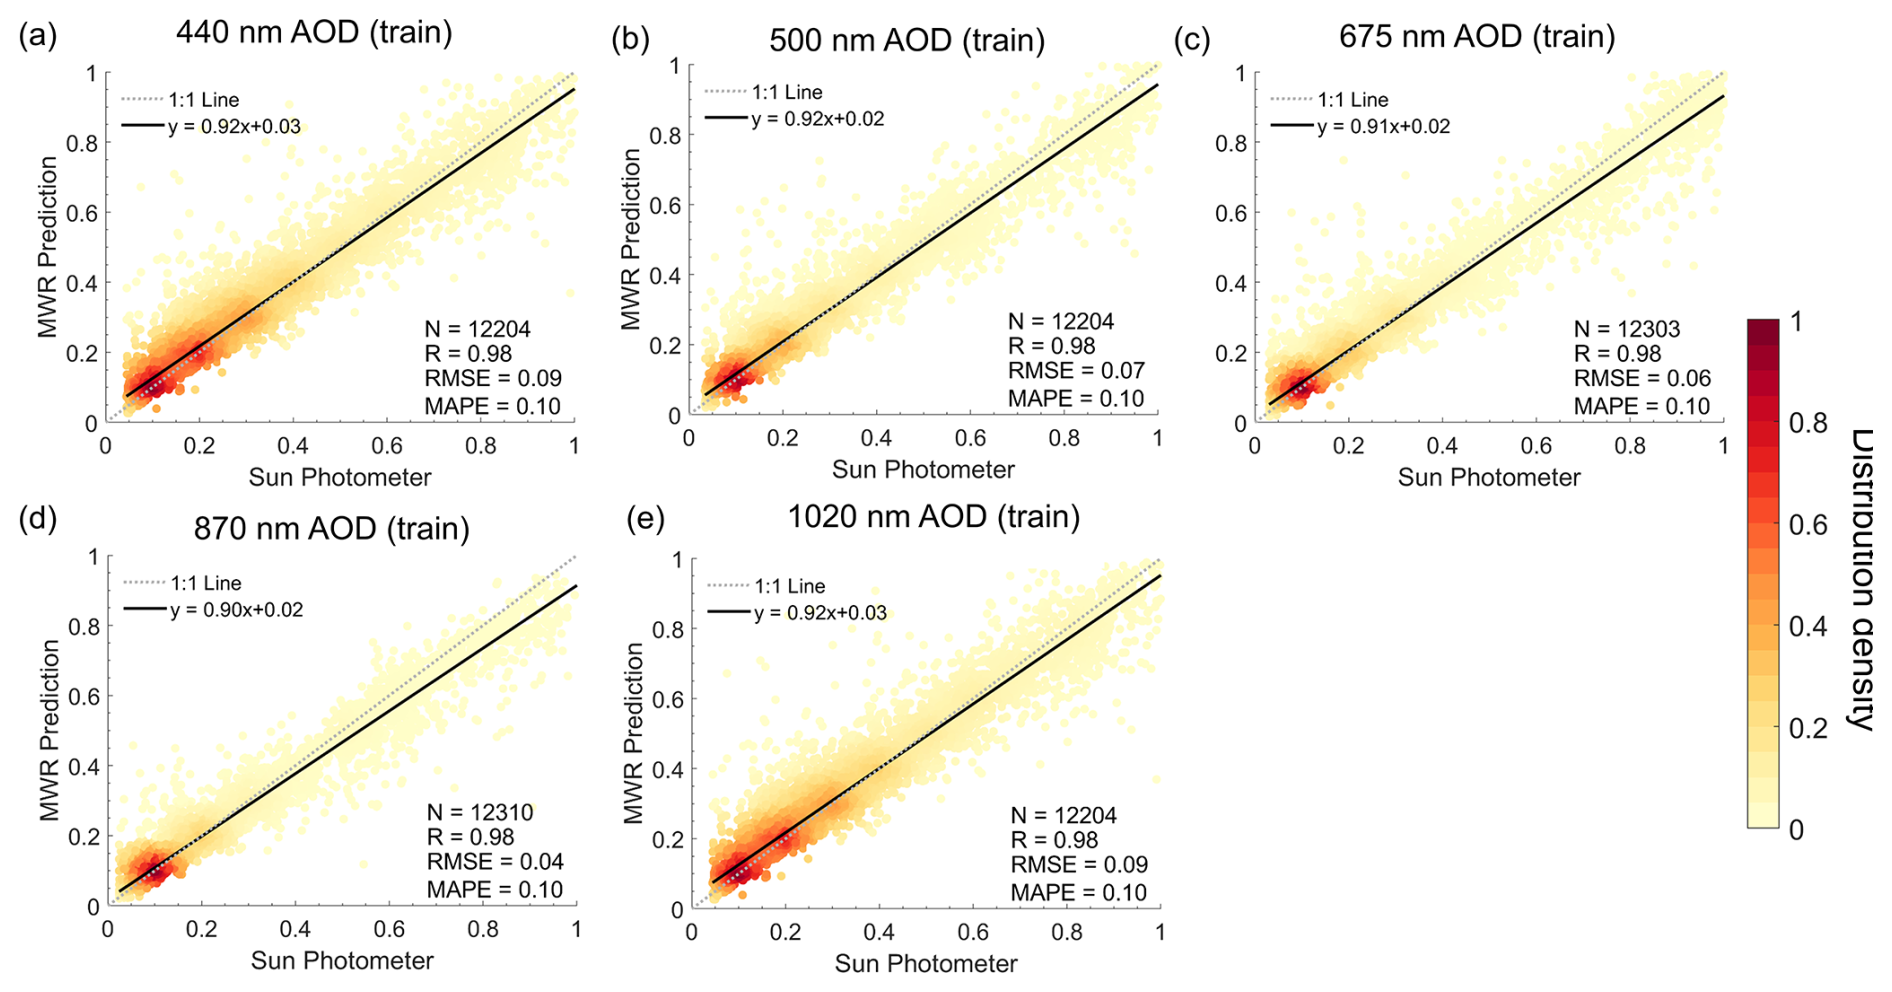
Figure 4Density scatter plots of daytime AOD in the training set of MWR and sun photometer with (a) 440, (b) 500, (c) 675, (d) 870, and (e) 1020 nm. The dashed dark-gray line represents the 1:1 line, and the black solid line represents the linear regression line.
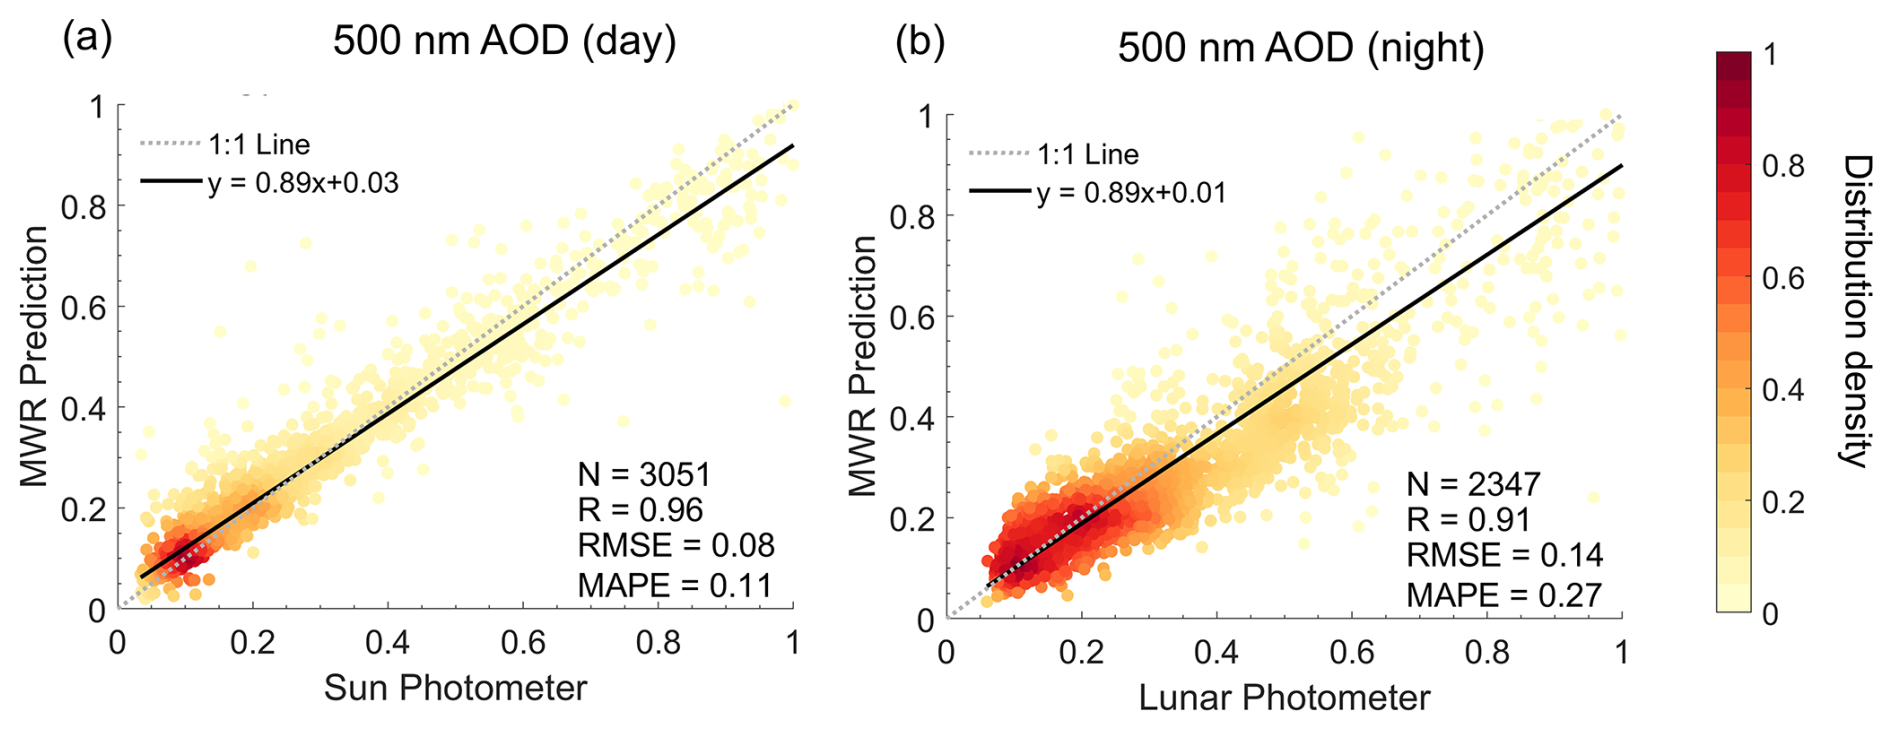
Figure 5Density scatter plots of 500 nm AOD in the testing set of MWR and the photometer with (a) daytime and (b) nighttime. The dashed dark-gray line represents the 1:1 line, and the black solid line represents the linear regression line. Note that the daytime corresponds to 06:00 am to 06:00 pm local time (UTC+8), and nighttime corresponds to the remaining time.
3.1 Model fitting and validation
The AERONET AOD data are used for training and validating the model. Specifically, daytime AERONET AOD data are used for model training and testing. To ensure the representativeness of the sampling, we have partitioned the data such that the three-quarters of the data in each month are designated as the training set, while the remaining one-quarter serves as the testing set. After training, nighttime MWR BT measurements are input into the model to generate nighttime AOD estimates. These estimates are then compared with nighttime AERONET lunar AOD measurements for validation.
The retrieval model has great fitting performance, as shown by Fig. 4. The model fitting reaches correlation coefficients of 0.98 for 440, 500, 675, 870, and 1020 nm, respectively, albeit with a minor systematic low bias for high-AOD scenarios, which is similar to MODIS AOD products (Levy et al., 2013). Due to the consistent model performance in all wavelengths (Fig. 4), we will focus on results at 500 nm in the following discussions since this is typically the reference wavelength for satellite remote sensing (Levy et al., 2013).
Figure 5 displays the comparison between the daytime and nighttime AOD independently retrieved by MWR using our algorithm and those from the sun and lunar photometer from December 2019 to October 2020. The model, tested during the daytime, utilized a dataset of over 3000 samples and achieved correlation coefficients of 0.96 for 500 nm (Fig. 5a). The performance in 500 nm of the testing set (R=0.96, RMSE =0.08, and MAPE =0.11) is slightly inferior to the training set (R=0.98, RMSE =0.07, and MAPE =0.10) regarding the statistical metrics (Fig. 5a). Most points are concentrated on the 1:1 line, with RMSE within 0.08 and MAPE within 0.11. The accuracy of this estimation is similar to existing shortwave-based algorithms based on the satellite sensor such as the MODIS aerosol products (Levy et al., 2013). However, the key advantage of using microwave BT is the capability to retrieve AOD at night, a feature lacking in these shortwave-based algorithms (Fig. 5b). Nighttime AOD retrieval reaches comparable performance to that for daytime, exhibiting a high correlation of 0.91 with lunar AOD. A minor systematic bias towards lower values in high-AOD scenarios is also noted, with RMSE about 0.14 and MAPE approximately 0.27, indicating the overall satisfactory performance of MWR retrievals. In addition, the MWR results also capture the spectral variation of AOD for fine-mode (440 to 870 nm Ångström index >1) and coarse-mode particles (440 to 870 nm Ångström index <1) well, as shown in Fig. 6. Moreover, the MWR tends to underestimate AOD during both daytime and nighttime, particularly at shorter wavelengths. As the wavelength increases, this underestimation diminishes, and the MWR measurements align more closely with AERONET observations (Fig. 6). This trend is observed for both fine-mode and coarse-mode aerosols (Fig. 6).

Figure 6The relationship between wavelength and its corresponding AOD for MWR-based (blue lines) and the photometer (red lines) in the daytime (solid lines) and nighttime (dashed lines) for (a) fine-mode particles (440 to 870 nm Ångström index >1) and (b) coarse-mode particles (440 to 870 nm Ångström index <1). The upper bound of the error bar is the 25th percentile, the middle is the median, and the lower bound is the 75th percentile.
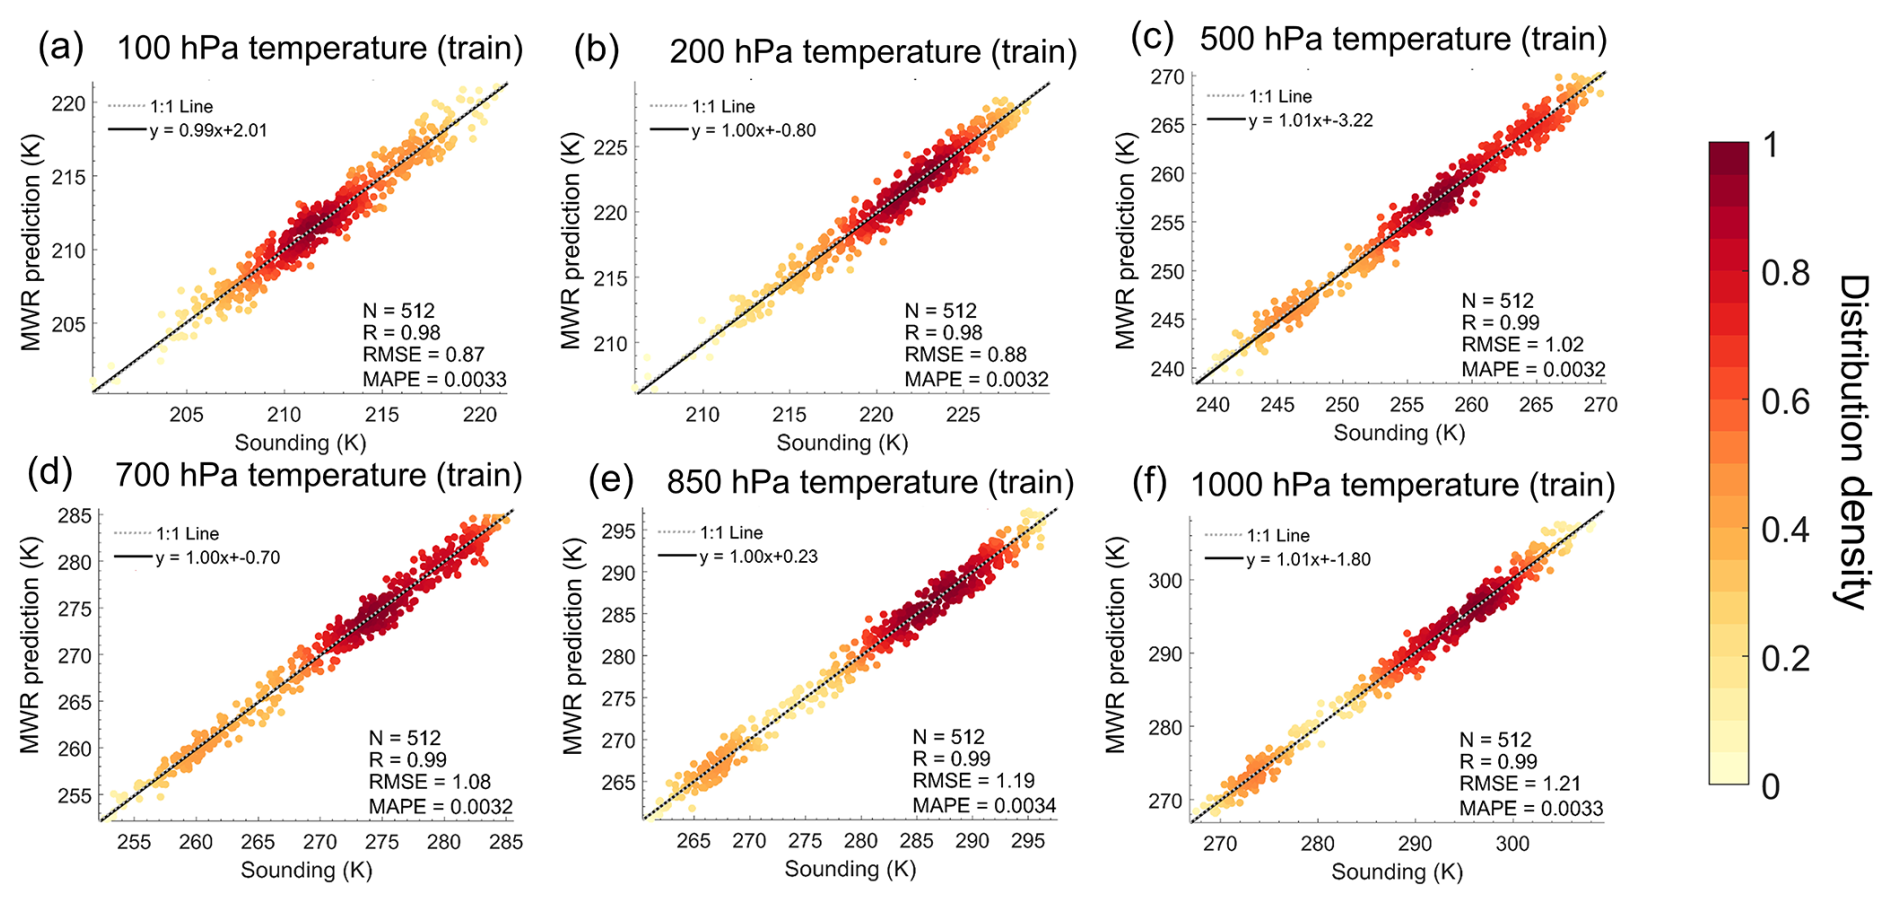
Figure 7Density scatter plots of the vertical temperature profile in the training set of MWR and sounding data at (a) 100, (b) 200, (c) 500, (d) 700, (e) 850, and (f) 1000 hPa. The dashed dark-gray line represents the 1:1 line, and the black solid line represents the linear regression line.
For retrieving vertical temperatures profiles, similarly to the AOD, we also partitioned the data such that three-quarters of the data in each month are designated as the training set, while the remaining one-quarter serves as the testing set. Our algorithm simultaneously retrieves daytime and nighttime temperature profiles. As shown in Figs. 7 and 8, atmospheric temperature retrieval results also demonstrate good performance and exceed those of AOD. This is expected since the main signals in the microwave come from emitted radiation by the atmosphere that is directly related to temperature. In detail, R is generally above 0.98, and all of the RMSEs are around 1.0 K in the training set (Fig. 7). Similarly, the model's performance on the testing set is somewhat lower compared to the training set but remains satisfactory overall. Specifically, R is above 0.95, and all of the RMSEs are around 1.8 K the testing set (Fig. 8), comparable to previous studies using MWR to retrieve temperature profiles with an optimal estimation method (Cimini et al., 2006). The significant biases at some pressure levels may be attributed to the larger biases between sounding data and reanalysis data that are used to train the model (Varga and Breuer, 2022). Our model also captures the characteristics of the climatological mean temperature vertical profile well, with the error in each pressure layer within 1.5 K (Fig. 9a). There are greater RMSE and bias in low pressure levels partially due to the higher temperature variations in these levels; the overall RMSE and bias serve to illustrate the exemplary performance of the model in estimating the vertical temperature profiles (Fig. 9b and c).
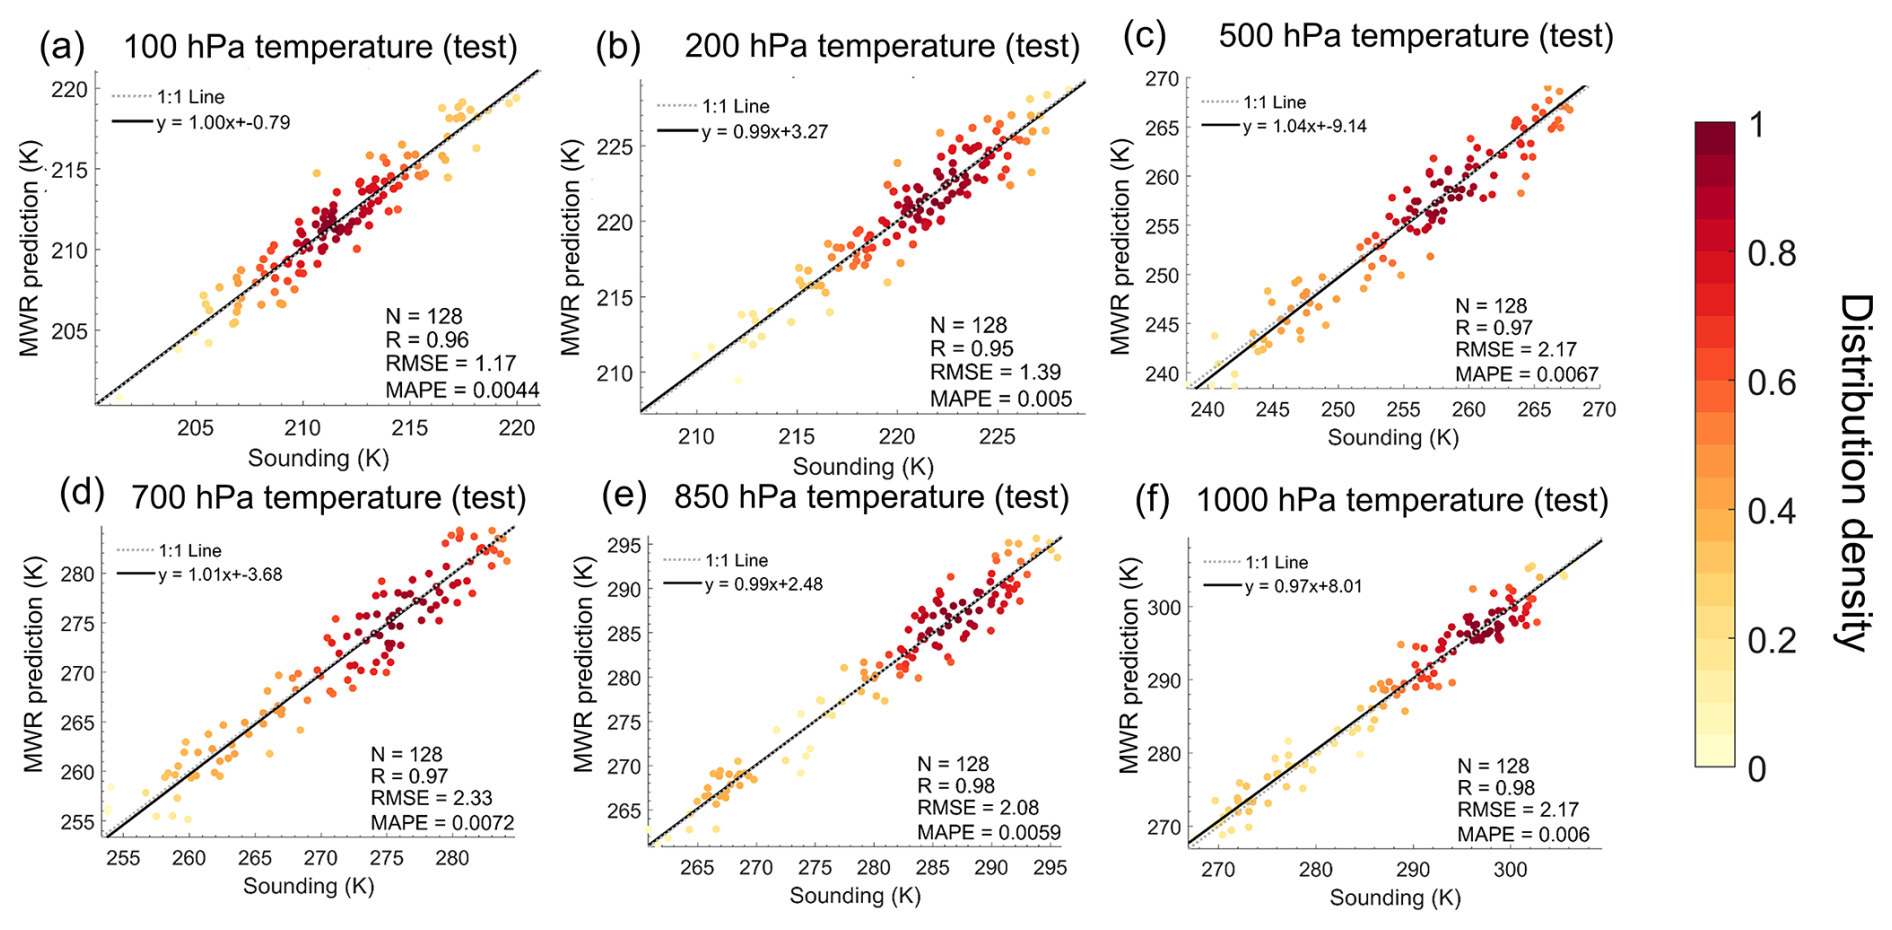
Figure 8Density scatter plots of the vertical temperature profile in the testing set of MWR and sounding data at (a) 100, (b) 200, (c) 500, (d) 700, (e) 850, and (f) 1000 hPa. The dashed dark-gray line represents the 1:1 line, and the black solid line represents the linear regression line.
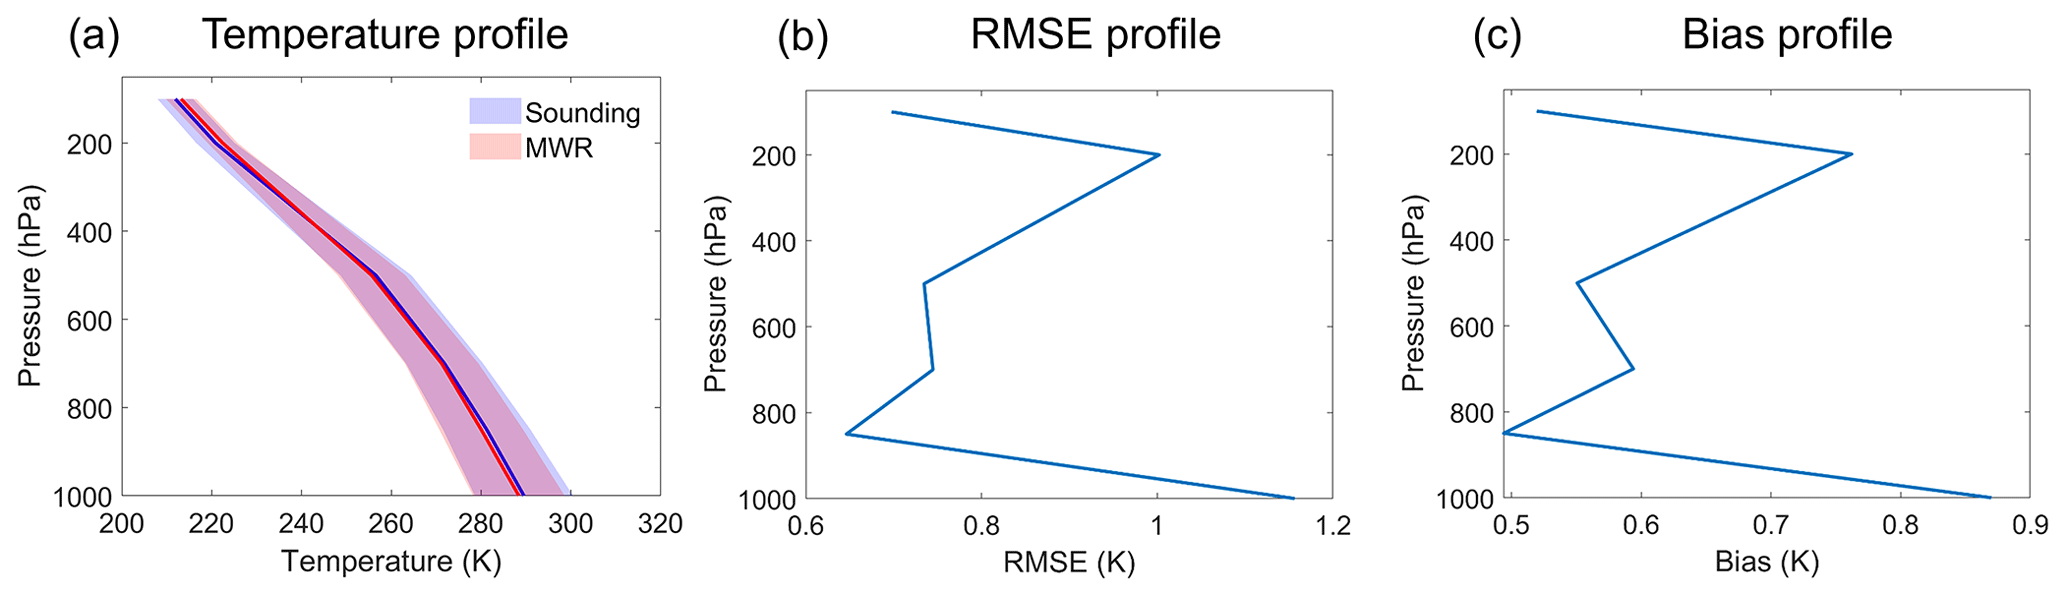
Figure 9(a) Climatological mean vertical temperature profiles from sounding (the blue shading and line) and MWR (the red shading and line). (b) RMSE vertical profile calculated between sounding and MWR temperature. (c) Similar to (b) but for the bias vertical profile.
In summary, the day- and nighttime MWR-based AOD and vertical temperature profiles derived from our algorithm successfully capture the AOD variability and vertical temperature profile characteristics with satisfactory accuracy. This model also unveils the spectral characteristics of AOD, with higher wavelengths corresponding to lower AOD. With great performance through model validation, we will investigate the diurnal cycle of AOD in the following section.
3.2 The diurnal cycle of MWR-derived AOD
We further examine the day–night differences in the AOD retrieved by MWR and compare them to those revealed by surface photometer. It should be noted that the analysis period in the following section remains from December 2019 to October 2020, contingent upon the availability of data. We acknowledge that the analysis period may not fully represent typical regional conditions due to COVID-19 (Lv et al., 2020; Sulaymon et al., 2021). However, the impact of COVID was mainly confined to January–March 2020. By April 2020, Beijing had largely recovered, with industrial and anthropogenic pollution sources returning to normal (Liu et al., 2022b; Tao et al., 2021). Figure 10a–b illustrate the mean diurnal cycles of the photometer AOD and MWR-based AOD derived from BT observations at the Beijing Nanjiao Meteorological Observatory in China. Although the MWR-based AOD tends to underestimate extreme values relative to the photometer AOD, the MWR measurements exhibit strong agreement with the photometer AOD (Fig. 10a–b). As shown in Fig. 10a, mean diurnal AOD follows a bimodal temporal distribution, with a greater peak ∼ 21:00 LT and a secondary peak at ∼ 03:00 LT. The AOD stays relatively low from 06:00 to 10:00 LT and gradually rises from 10:00 to 21:00 LT, reaching the first peak at 21:00 LT. After that greater peak, the AOD decreases from 22:00 to 00:00 LT and then increases again until it reaches the second peak at 03:00 LT. This pattern is consistent across other spectral bands (675, 870, and 1020 nm, not shown here). This decrease may be attributed to the higher relative humidity near 23:00 LT and the corresponding aerosol scavenging effect, but further investigation is needed in future studies. Moreover, although the MWR-based AOD seems to underestimate the extreme pollution with high AOD compared with photometer observations, since the number of upper outliers of AOD of the photometer is higher than that of MWR, the overall temporal pattern is similar to that of the photometer (Fig. 10a).
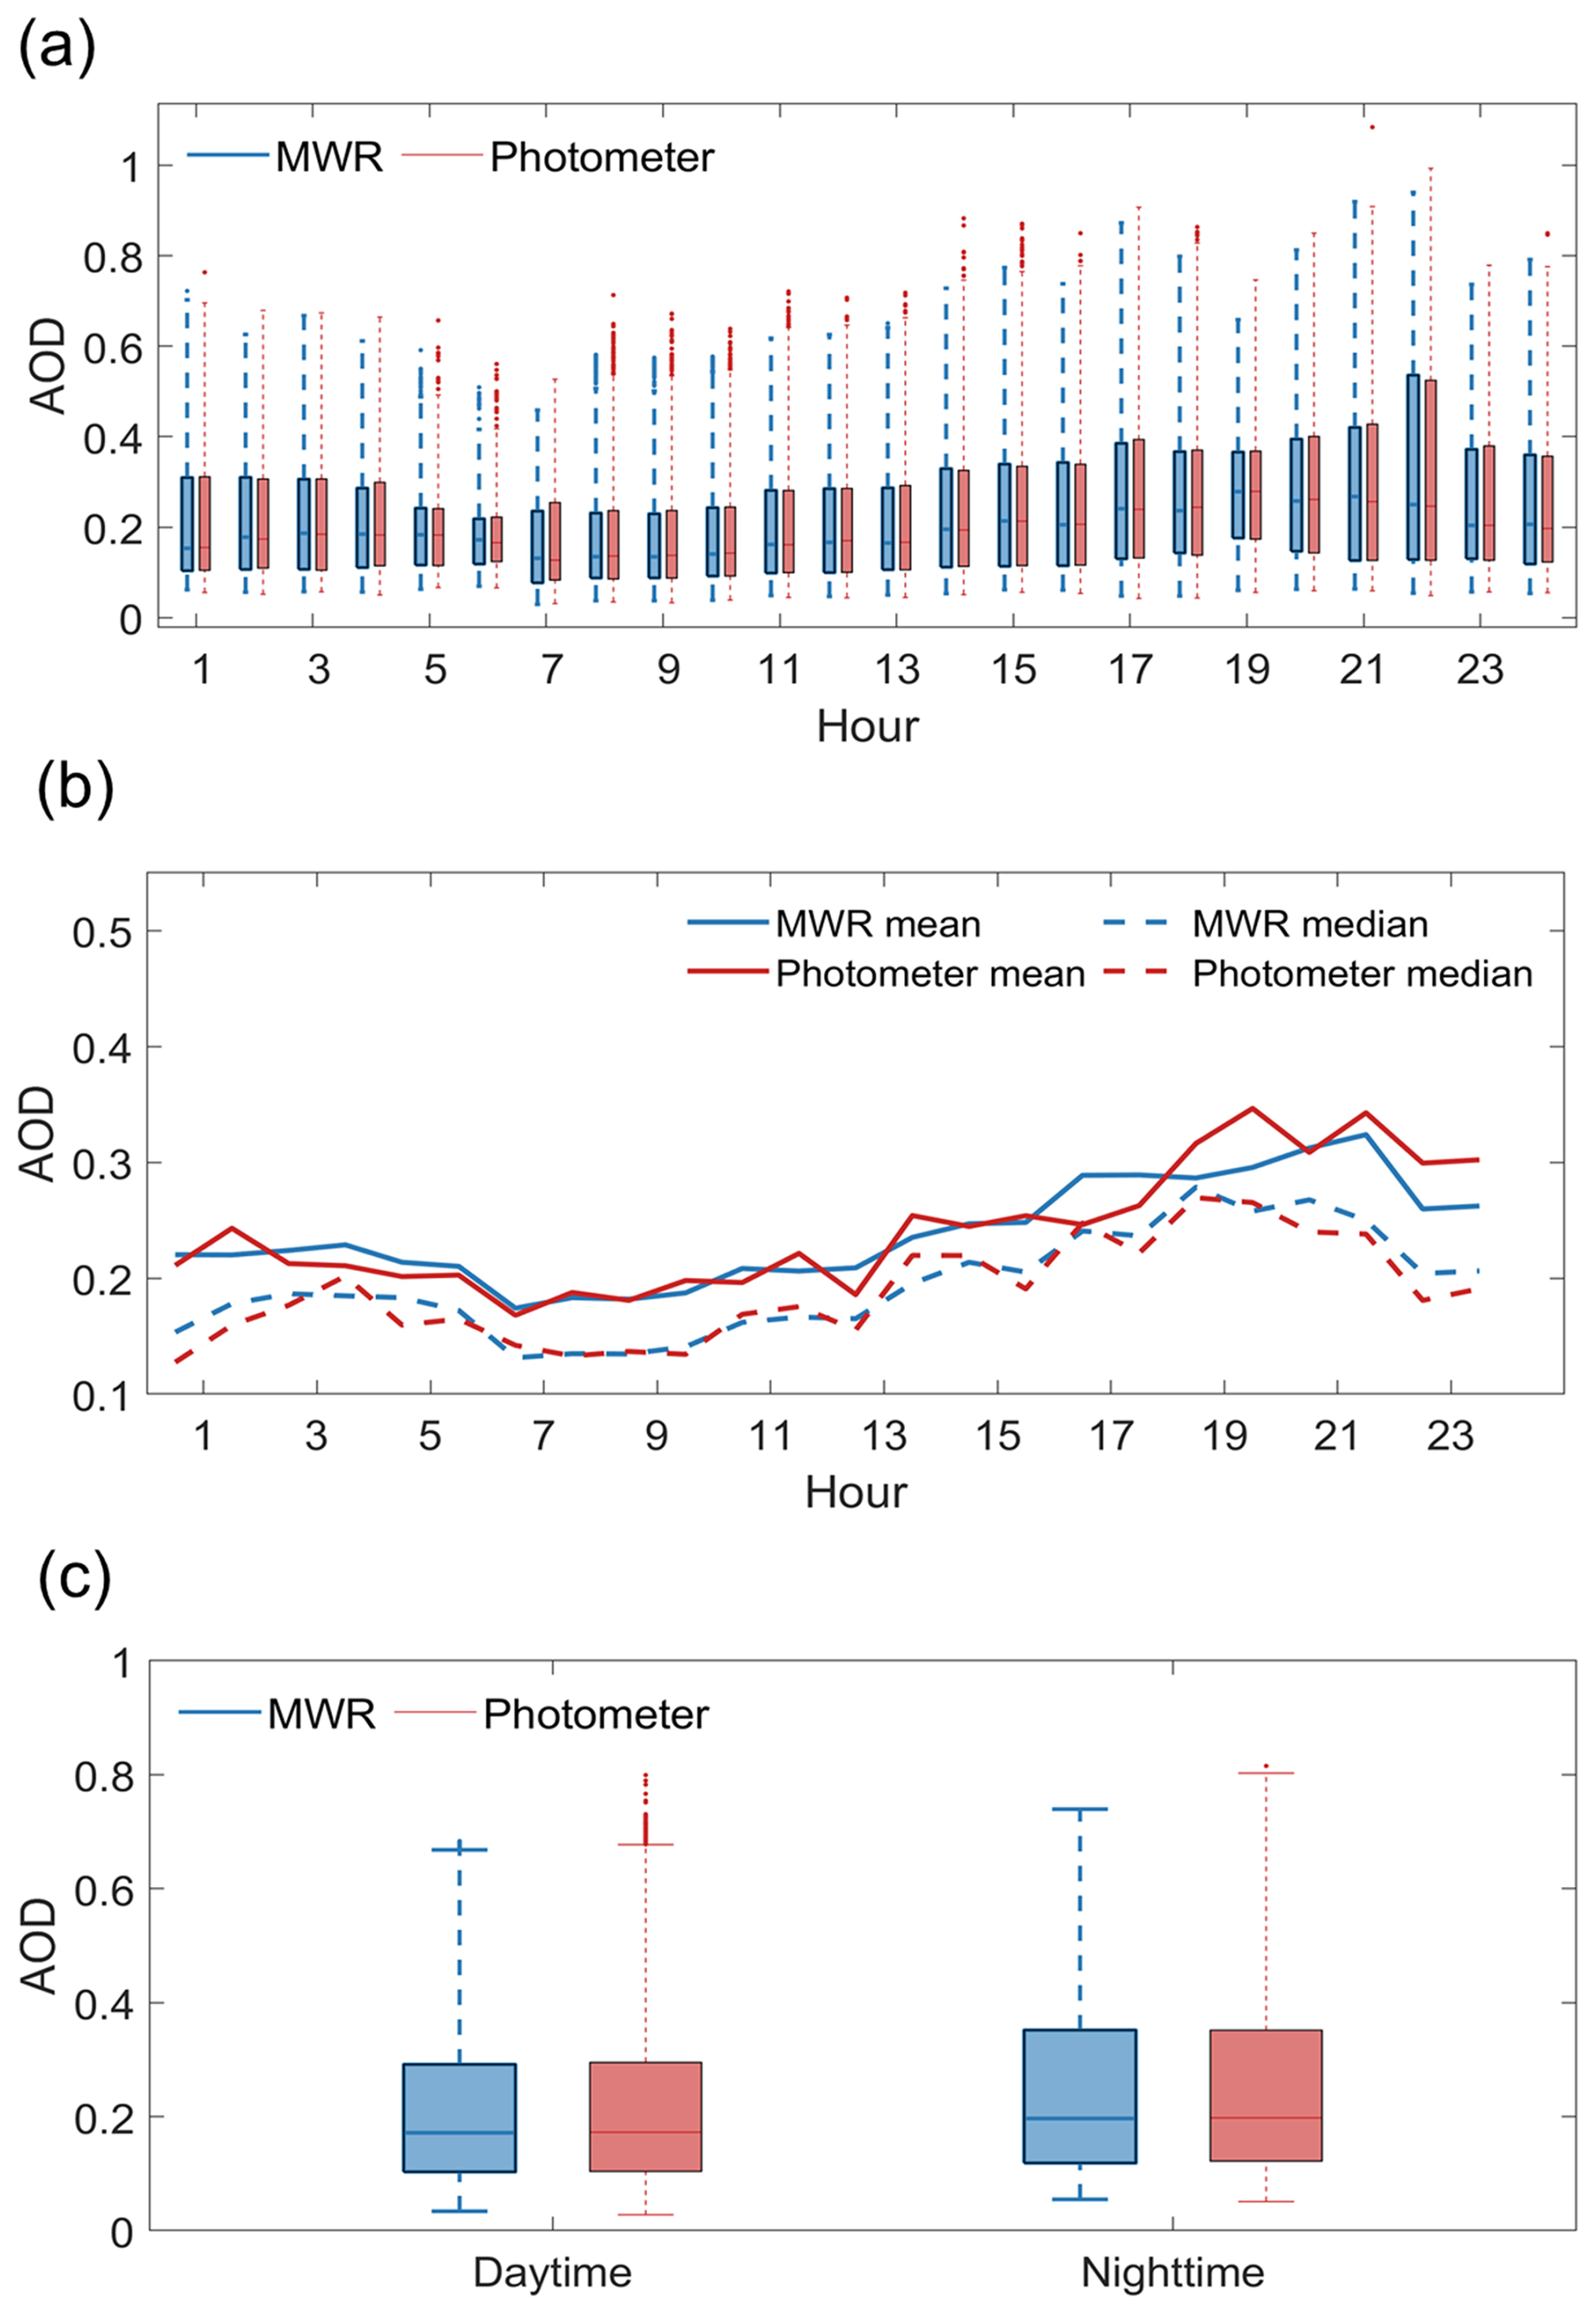
Figure 10The diurnal cycle of annual mean MWR AOD and photometer AOD at 500 nm. (a) The box plot of hourly MWR AOD (red box plots) and photometer AOD (blue box plots). The small dots represent outliers greater than or less than , where q75 and q25 correspond to 75th and 25th percentile. (b) The time series of mean AOD (solid lines) and median AOD (dashed lines) of MWR AOD (red lines) and photometer AOD (blue lines). (c) The box plot of daytime and nighttime AOD. Blue boxes correspond to MWR data, and red boxes correspond to photometer data.
The mean and median AOD values further support the above findings, highlighting higher nighttime AOD compared to daytime (Fig. 10b). This difference is validated by the box plots of MWR-based AOD and photometer AOD (Fig. 10c), passing Student's t test significance test with p≤0.05. Specifically, the median daytime AOD is in the range of 0.15 to 0.28 for MWR and 0.15 to 0.27 for the photometer, while the median nighttime AOD is greater than 0.34 for MWR and higher than 0.30 for the photometer. Similarly, the mean daytime AOD is in the range of 0.25 to 0.35 for MWR and 0.24 to 0.32 for the photometer, while the mean nighttime AOD is greater than 0.40 for MWR and over 0.44 for the photometer. This discrepancy between daytime and nighttime AOD has also been observed in previous studies estimating nighttime AOD by incorporating infrared radiance measurement from the Atmospheric InfraRed Sounder (AIRS) instrument into the machine learning model, further corroborated by surface and space lidar measurements (Liu et al., 2024). Notably, the mean AOD tends to exceed the median AOD, partly due to the long-tail distribution of AOD and the presence of high extreme values (Sayer et al., 2019).
We have further divided the results into four seasons and validated the consistency of the diurnal cycle of AOD across all seasons, with the most pronounced diurnal difference occurring in summer (Fig. S1 in the Supplement). It is noted that the lunar AOD is not available for JJA, which further underscores the supplementary role of MWR-predicted AOD in complementing lunar AOD measurements. The seasonal variation of AOD diurnal cycle agrees with previous studies derived from downscaling reanalysis datasets (Wang et al., 2025). The more significant diurnal difference in AOD during summer can be attributed to two primary factors. Firstly, the intense solar radiation and high temperatures prevalent in summer significantly promote the formation of aerosol particles through the process of gas-to-particle conversion (Chen et al., 2023a). Secondly, the high humidity levels in summer facilitate aerosol hygroscopic growth, which enhances aerosol extinction (Chen et al., 2023b; Lv et al., 2017). AOD at the other wavelengths (440, 675, 870, and 1020 nm) exhibits similar diurnal patterns, with peaks at about 20:00–22:00 (not shown here) and higher nighttime AOD in general (Fig. 6).
The increase in nighttime AOD compared to daytime can be attributed to various factors, including a shallower mixed layer due to reduced horizontal mixing and transport, a decrease in atmospheric environmental capacity, higher relative humidity, enhanced aerosol hygroscopic growth, or intensified pollution emissions (Brock et al., 2016). Similar observations of elevated nighttime particle matter concentration have been reported in previous studies (Perrone et al., 2022; Su et al., 2023). However, research on nighttime aerosol properties is limited, warranting further analysis to fully understand these discrepancies, which exceeds the scope of this study.
In summary, using the BT measured by the MWR to retrieve AOD during nighttime, we can uncover the daily cycle of AOD. This improves our understanding of the daytime–nighttime AOD variability, provides insights into the diurnal changes of atmospheric pollution, and sheds light on nighttime aerosol radiative effects.
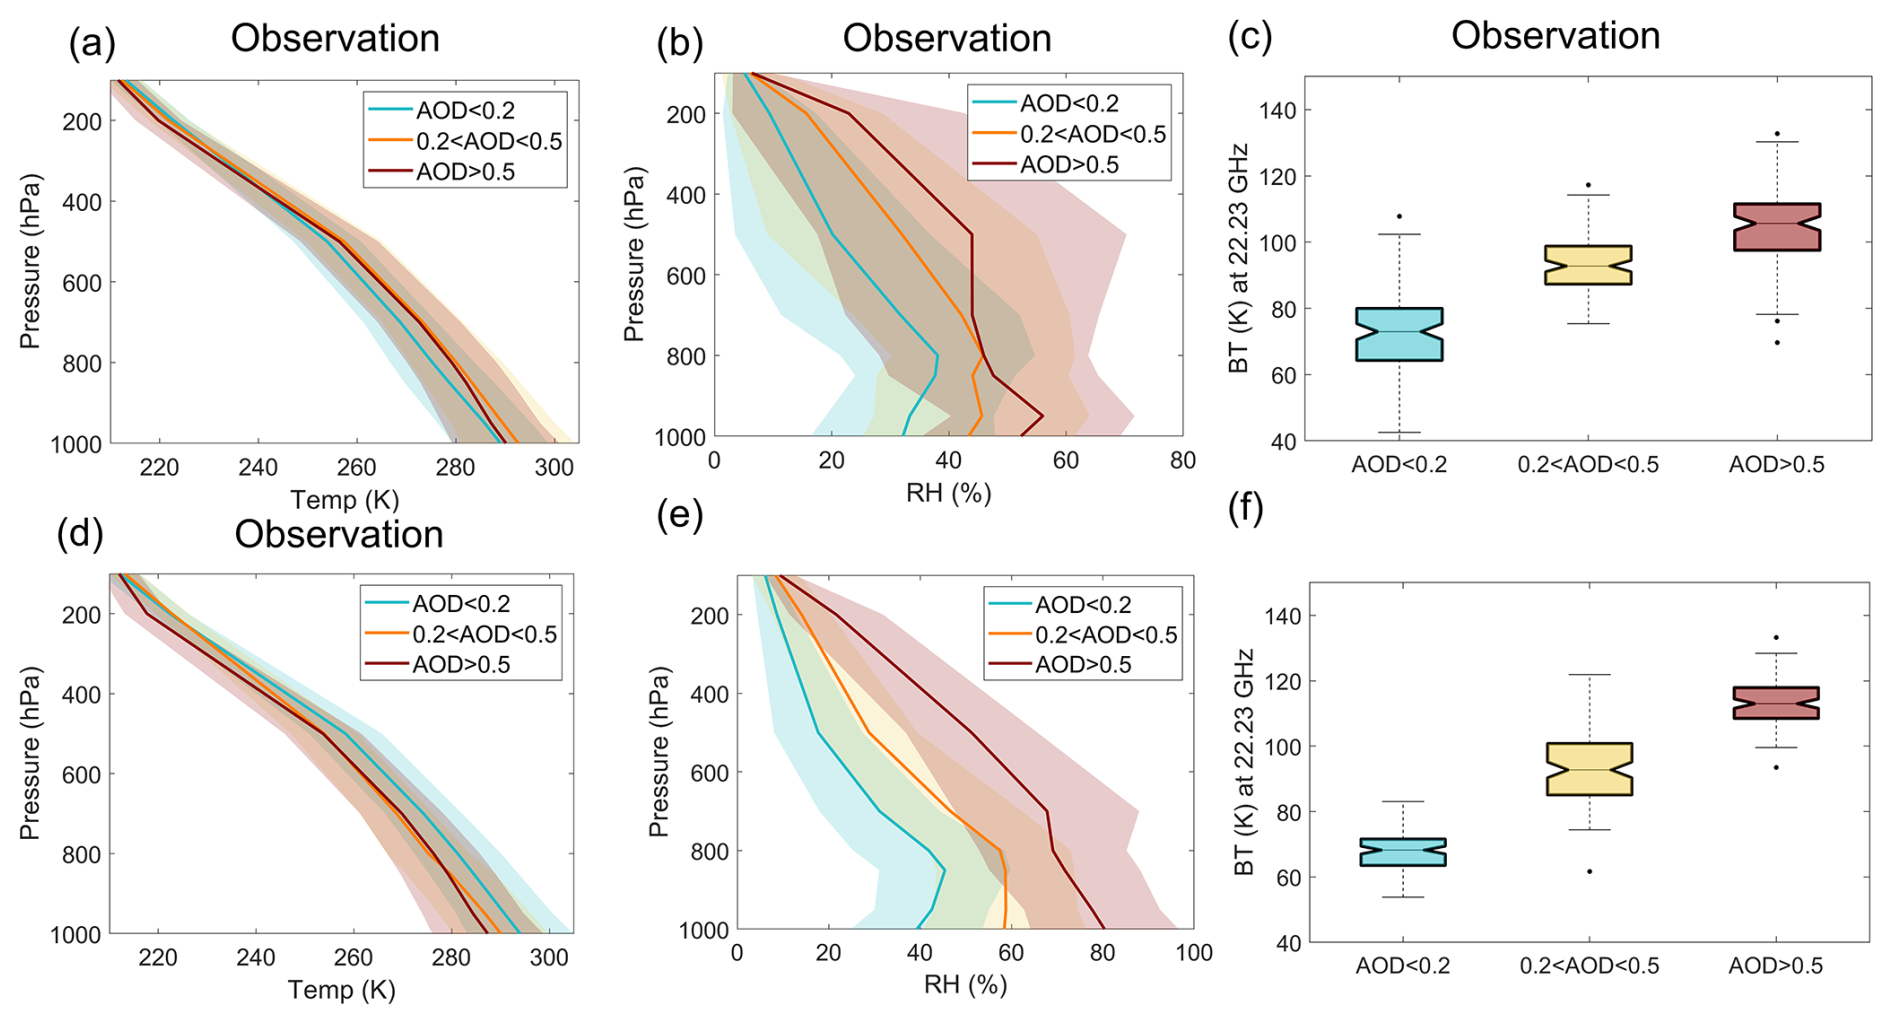
Figure 11(a–b) The observational vertical profiles of temperature (Temp, unit: K) and relative humidity (RH, unit: %) under various AOD levels at 550 nm. The cyan, orange, and red solid lines correspond to low-level polluted scenarios (AOD <0.2), mid-level polluted scenarios (0.2< AOD <0.5), and high-level polluted scenarios (AOD >0.5). (c) Their corresponding brightness temperature (BT, unit: K) at 22.23 GHz calculated by MonoRTM. (d–f) Similar to (a)–(c) but for the WRF-Chem simulation. The shading represents the spread of samples with 1 standard deviation. All differences have passed the significance test of p value ≤0.01 by Student's t test.
3.3 Physical interpretation
Since the machine learning technique does not necessarily represent the physical relationship between aerosol loading and microwave radiances, we further verify the theoretical basis of our technique by analyzing the observed temperature and RH profiles under various AOD levels and using WRF-Chem combined with MonoRTM simulations. The simulation is designed to establish a connection between aerosol loadings and microwave radiances. A set of sensitivity experiments with and without aerosol forcing is conducted using WRF-Chem as described in Sect. 2, whose atmospheric profiles, including temperature, water vapor, gases, and aerosols, are then used as inputs to the MonoRTM to simulate the downward microwave radiances (represented by BT) observed by the MWR. To mitigate the influence of surface temperature on BT, we maintained a consistent surface temperature range (265–270 K) throughout the simulation.
We first analyze the temperature and RH profiles from sounding observations under various AOD levels (Fig. 11a–b and d–e). These AOD levels include light pollution (AOD <0.2), medium pollution (0.2< AOD <0.5), and heavy pollution (AOD >0.5) scenarios. The selection of this threshold is to ensure a balanced sample size for each scenario. All differences in the temperature and RH profiles under different AOD scenarios passed the significance test with p≤0.1 by the t test. For the temperature profiles, a higher AOD corresponds to a lower temperature in the upper atmosphere, and vice versa (Fig. 11a). However, for the low-level atmosphere, the temperature might first increase as AOD increases and then decrease with AOD as increases. This is associated with aerosol type and optical properties (Che et al., 2024; Mahowald et al., 2011). For the RH vertical profiles, RH increases as AOD increases at all pressure levels (Fig. 11b). This may be attributed to the aerosol hygroscopic growth effect, leading to a higher AOD (Quan et al., 2018). Notably, since the collocation between MWR and Level 2 sun photometer AOD products from the AERONET is for clear-sky data, the vertical profile of RH is relatively low. BTs at 22.23 GHz calculated by these vertical profiles from MonoRTM also demonstrate that BTs tend to increase with AOD (Fig. 11c). BTs at other frequencies in the K-band also show a similar trend (not shown here). We have also conducted a detailed seasonal analysis and found similar responses in temperature, RH, and BT to AOD, with minor differences likely attributable to variations in aerosol types (Fig. S2). Similarly, the WRF-Chem output also demonstrates the sensitiveness of temperature and RH vertical profiles to aerosol loading, contributing to statistically significant BT difference under different pollution levels (Fig. 11d–f). Although there might be a significant discrepancy of BT between WRF simulation results and observations with regards to the range, the trend and the overall pattern are quite similar, revealing the similar trends in BT as a function of AOD (Fig. 11f). This suggests that despite the range discrepancies, the fundamental relationships between BT and AOD are consistent between observation and simulation. The above observational evidence might indicate that MWR estimates AOD by detecting the temperature and humidity profile differences caused by the presence of aerosols, but the impact of aerosols on microwave radiative transfer is highly complex, involving multiple processes such as aerosol scattering and absorption, changes in surface temperature and temperature/humidity profiles due to aerosol radiative and hygroscopic effects, and the nonlinear relationship between aerosol properties in the microwave and visible spectra. The above-mentioned complexities inspire us to conduct further simulations to verify the theoretical basis of our technique.
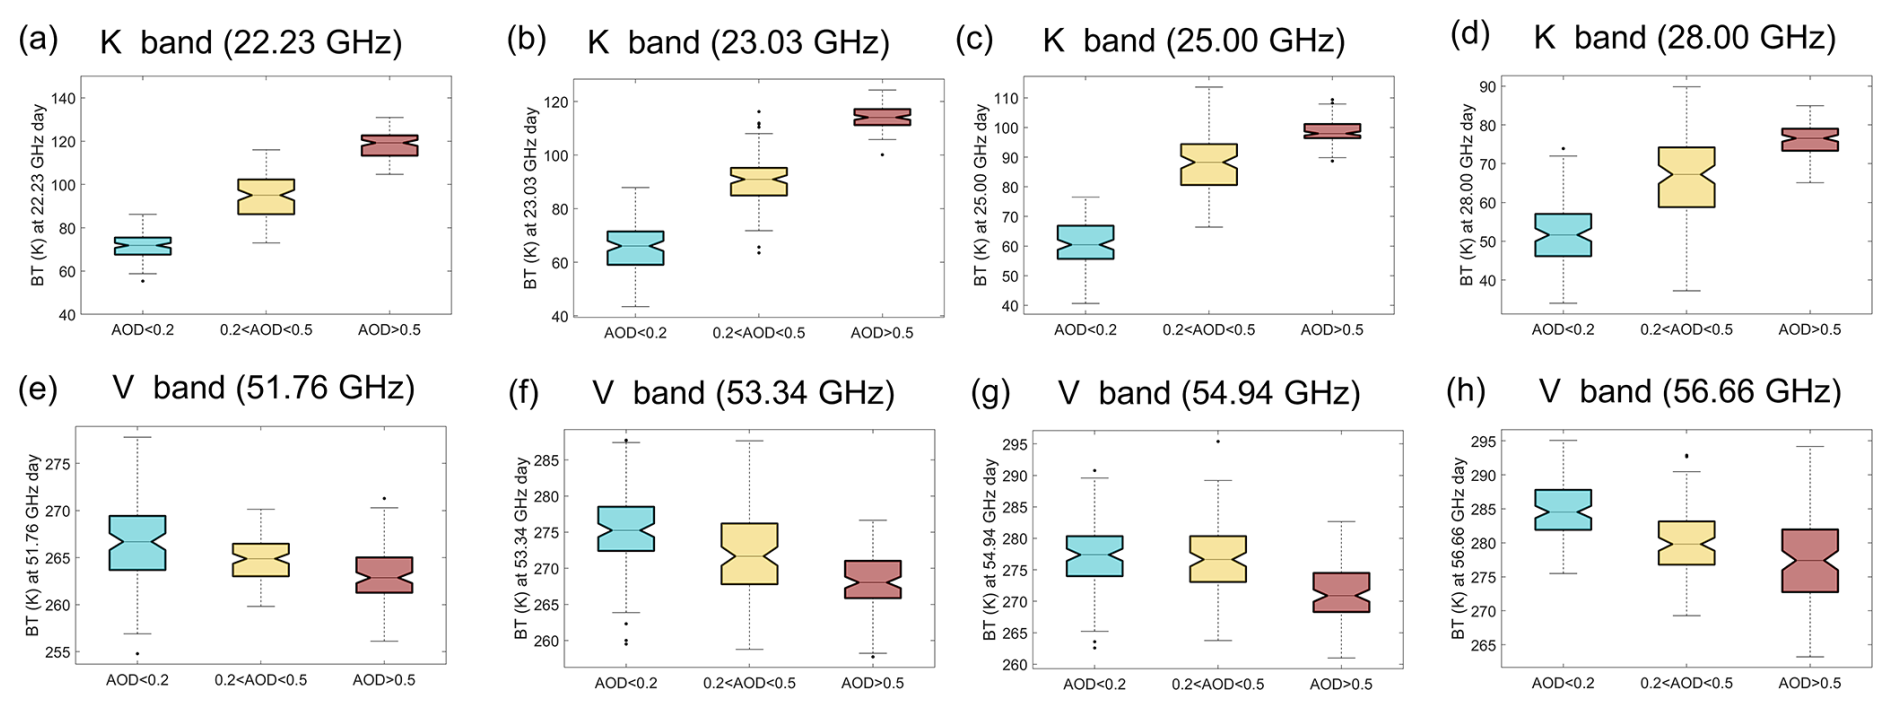
Figure 12The box plots of relationship between BT and AOD at 550 nm when fixing the surface temperature at 270–275 K from 00:00 UTC on 18 December 2016 to 00:00 UTC on 20 December 2016 in the WRF-Chem simulation. The frequencies of BT are (a) 22.23, (b) 23.03, (c) 25.00, (d) 28.00, (e) 51.76, (f) 53.34, (g) 54.94, and (h) 56.66 GHz during the daytime.
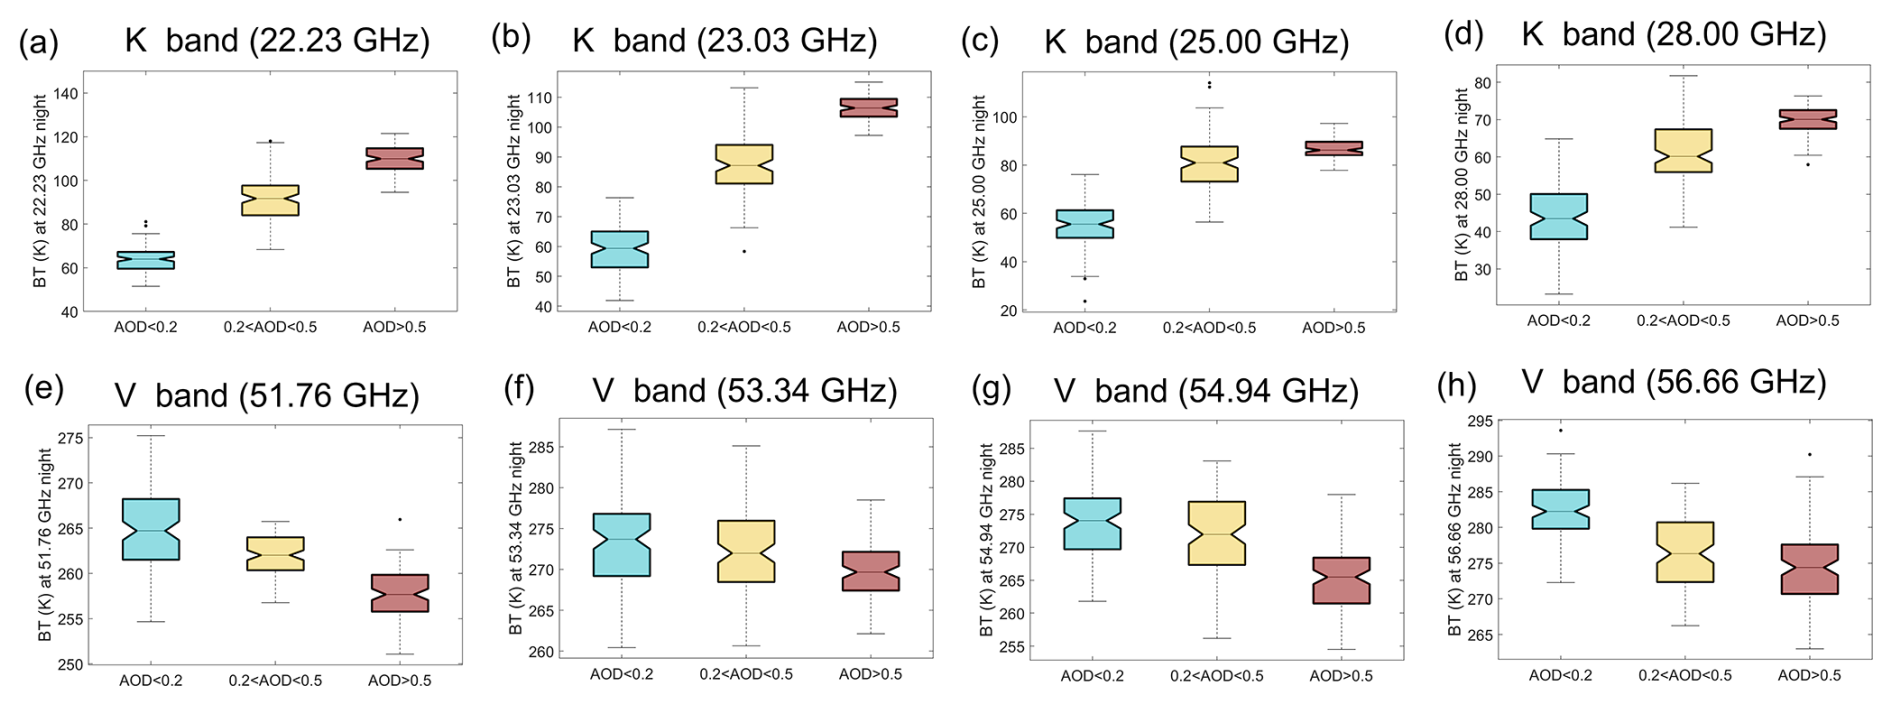
Furthermore, to isolate the impact of AOD on BT, we have fixed the surface temperature between 270 and 275 K in our analysis. The selection of this specific surface temperature range effectively minimizes the influence of temperature variability on BT. Our simulation results, illustrated in Figs. 12 and 13, indicate that for all frequencies in the K-band, BT increases as AOD levels increase. This phenomenon exists in both the daytime and the nighttime. Specifically, at 22.23 GHz, BT levels for clean conditions range from 60 to 80 K, while for polluted conditions they range from 80 to 130 K, showing a statistically significant difference at both daytime and nighttime (Figs. 12a and 13a). BT levels at other frequencies support this trend, indicating that BT tends to increase with AOD (Figs. 12b–d and 13b–d). The increase in K-band BT with AOD might be related to coherent changes of water vapor and aerosols, due to either aerosol absorption of water or meteorological conditions that affect both water vapor and aerosols. When AOD is higher, RH is typically also higher, accompanied by more water vapor due to the hygroscopic growth effect of aerosols, as supported by previous analysis (Fig. 11a and c). Since the K-band includes the water vapor absorption line near 22.235 GHz, the BT in the K-band is sensitive to water vapor, and thus the BT increases as AOD increases (Liu et al., 2014; Xie et al., 2013), further strengthening the theoretical foundation of the proposed approach.
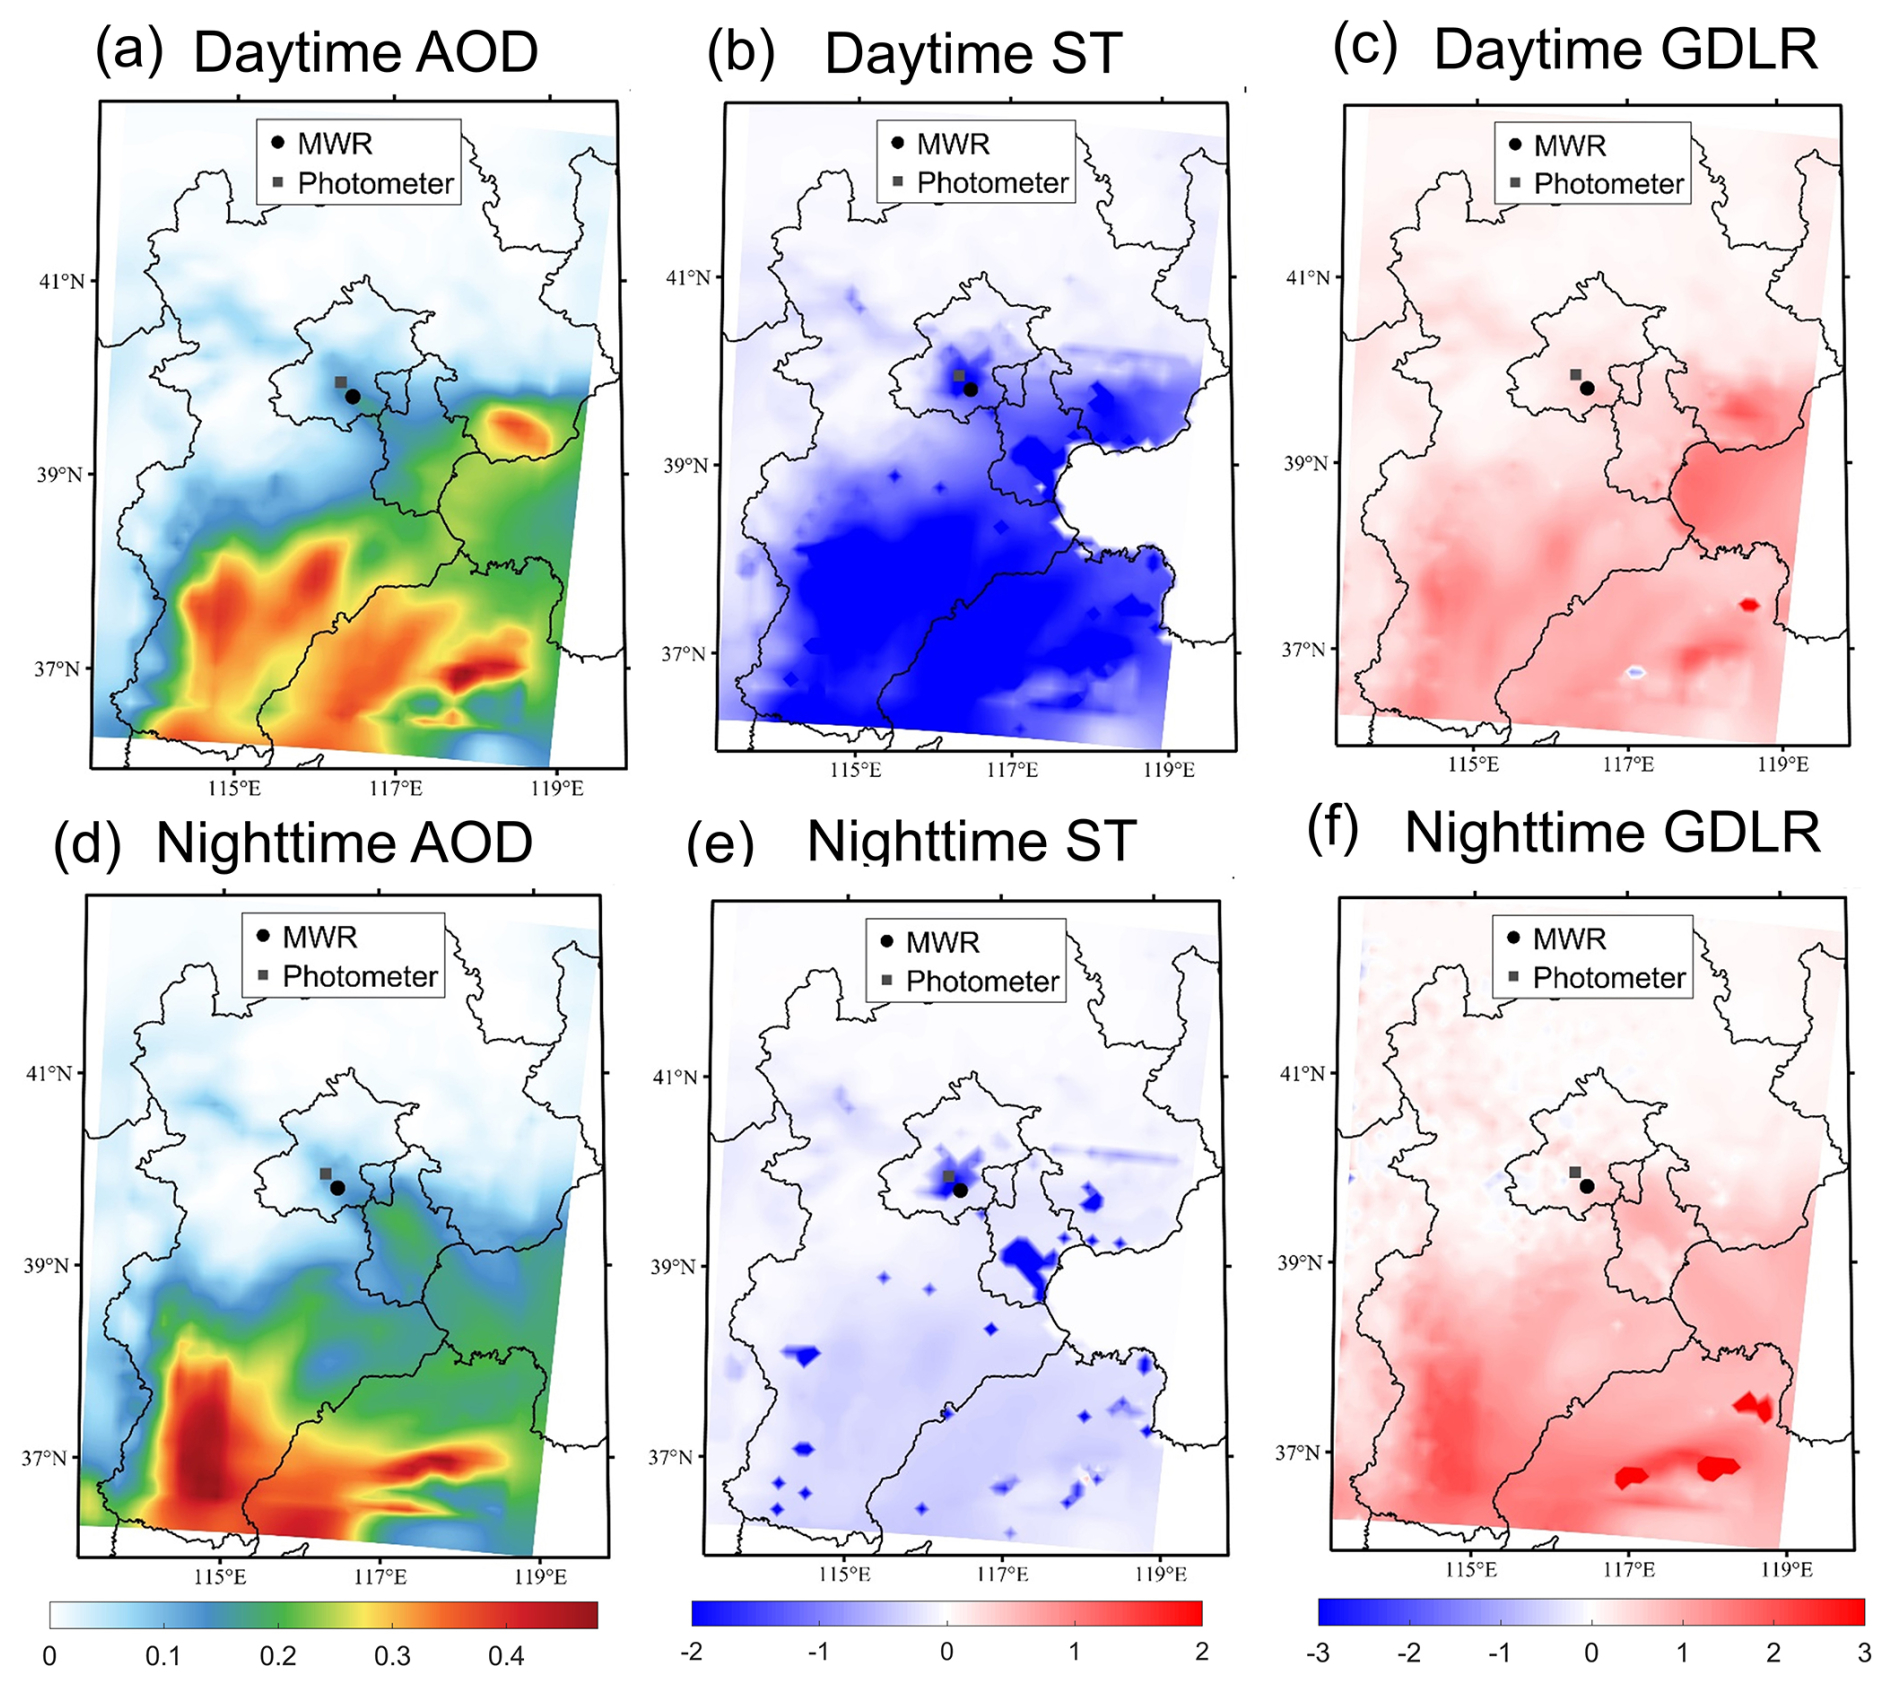
Figure 14The difference of (a, d) aerosol optical depth (AOD, unitless), (b, e) surface temperature (ST, K), and (c, f) ground downward longwave radiation (GDLR, W/m2) between EXP_AER and EXP_NOAER experiments (EXP_AER-EXP_NOAER) during the (a–c) daytime and (d–f) nighttime. The black circle indicates the MWR, and the dark-gray square indicates the photometer. The daytime corresponds to the period from 22:00 UTC on 18 December 2016 to 10:00 UTC on 19 December 2016. The nighttime corresponds to the period from 10:00 UTC on 19 December 2016 to 22:00 UTC on 19 December 2016.
In contrast to the observations in the K-band, an analysis of the V-band frequencies reveals a consistent decrease in BT with the reduction of AOD levels, applicable to both diurnal and nocturnal periods (Figs. 12e–h and 13e–h), which corresponds well to the cooling effect of aerosols. Notably, at a frequency of 51.76 GHz, the BT levels exhibit a range of 264 to 270 K under pristine atmospheric conditions, whereas under polluted conditions, these levels are observed to be between 262 and 265 K. Although the magnitude of this change is less pronounced than that observed in the K-band, it passes the statistical significance (p≤0.1 by the t test), indicating a reliable and measurable effect. The detailed physical interpretation is as follows: due to the presence of the oxygen absorption band within the frequency range of the V-band, it is highly sensitive to changes in atmospheric temperature (Van Leeuwen et al., 2001). Variations in AOD can influence the atmospheric temperature profile as shown by observation and simulation (Fig. 11b and d). Consequently, in cases when AOD is high, the BT in the V-band decreases.
The above-mentioned conclusion was further verified by simulations lasting from 00:00 UTC on 3 December 2016 to 00:00 UTC on 5 December 2016 (a 48 h period) with the same settings (not shown). In conclusion, MWR has the potential to estimate AOD by identifying the differences in temperature and humidity profiles, as well as the direct scattering and absorption signals that arise from varying aerosol loadings. While previous studies have demonstrated that large aerosol particles, particularly dust aerosols, can significantly influence microwave radiation and BT (Ge et al., 2008; Hong et al., 2008), the primary mechanism by which MWR estimates AOD in this study might be through detecting the changes of temperature and RH profiles.
To deepen our understanding of the impact of aerosol loading on longwave radiation, we conducted a comparative analysis using WRF-Chem. By comparing scenarios with aerosol loadings (EXP_AER) and without aerosol loadings (EXP_NOAER), we examined the differences in AOD, surface temperature (ST) and ground downward longwave radiation (GDLR). This comparison is specifically designed to examine the impact of aerosol loading on longwave radiation, particularly its spatial distribution. As such, no BT information is generated or output in this comparison experiment. The findings reveal that higher aerosol concentration levels have a negative effect on ST (Fig. 14b and e), particularly during the daytime (Fig. 14b), while positively influencing GDLR (Fig. 14c and f), especially at nighttime (Fig. 14f), which is consistent with the above MonoRTM calculations.
The validity of the aforementioned conclusion was further corroborated through simulations that spanned the period of 00:00 UTC on 3 December 2016 to 00:00 UTC on 5 December 2016, encompassing a continuous 48 h period, utilizing identical settings (not shown here). Additionally, to augment the representativeness of our results, analogous WRF-Chem simulations were executed during the boreal summer. Specifically, these simulations were conducted from 00:00 UTC on 5 July 2016 to 00:00 UTC on 8 July 2016, covering a 72 h duration, and they also yielded consistent conclusions (Figs. S3–S5).
This study introduces a new method for estimating clear-sky AOD using BT measurements in the K- and V-band obtained from the MWR. By establishing a strong correlation (R=0.96, RMSE =0.11, and MAPE =0.11 in the daytime testing set) between the photometer AOD and multiple BTs derived from the MWR at the Beijing Nanjiao Meteorological Observatory using a machine learning algorithm, we were able to accurately retrieve nighttime AOD (R=0.91, RMSE =0.14, and MAPE =0.28) and vertical temperature profiles (R>0.95 for all levels and RMSE <2.20 K for all levels). This model also captures the spectral characteristics of AOD well, with a higher Ångström index for fine-mode-dominated AOD and a lower Ångström index for coarse-mode-dominated AOD. After applying this model with satisfactory performance, we investigate the AOD diurnal cycle and find that AOD values follow a bimodal diurnal cycle temporal distribution, with a greater peak at ∼ 21:00 and a secondary peak at ∼ 03:00, suggesting higher nighttime AOD compared with daytime. The difference between daytime and nighttime AOD observed in the MWR data well agrees with sun and lunar photometer observations as well as particle matter concentration observations.
The theoretical basis of our algorithm is also confirmed by analyzing observational vertical profiles of temperature and RH under various AOD levels and WRF-Chem as well as MonoRTM simulations. Observation indicated that the vertical profiles of temperature and RH have statistically significant differences (p≤0.1) under different AOD levels, suggesting that MWR might estimate AOD by detecting the temperature and humidity profile differences caused by various aerosol loadings. Simulation further indicated a consistent and mostly linear increase in BTs in the K-band (increasing from ∼ 70 to ∼ 105 K at 22.23 GHz) and decrease in BTs in the V-band (decreasing from ∼ 265 to ∼ 257 K at 51.76 GHz) with AOD (550 nm, the wavelength of WRF-Chem simulated AOD) across all time periods. Aerosols tend to induce a cooling effect at surface while increasing ground downward longwave radiation, especially at the nighttime. This study holds significant promise for environmental and climate research as MWR BT measurements can be obtained at both day and night without being hindered by bright surfaces. The methodology developed here can potentially be applied to MWRs in other locations worldwide to retrieve both daytime and nighttime AOD values. However, it is important to note that this investigation is preliminary and may contain uncertainties. It is also applicable under clear-sky conditions since during cloudy-sky conditions, the downward microwave radiation will be dominated by that emitted by clouds.
It is important to note that the analysis of AOD is specifically conducted for the Beijing Nanjiao Meteorological Observatory in China, covering the period from December 2019 to October 2020. This time frame encompasses various climate and pollution conditions and is contingent upon the availability of data. Moving forward, we aim to extend the time range of our analysis and explore additional aerosol characteristics that may be inferred from BT measurements, such as aerosol absorption and layer height. This will enhance our understanding of aerosol distribution and properties, ultimately improving our ability to monitor and predict aerosol impacts on climate and the environment.
The sun photometer AOD data were obtained from https://aeronet.gsfc.nasa.gov/new_web/webtool_aod_v3.html (last access: 20 April 2024), the lunar photometer AOD data were obtained from https://aeronet.gsfc.nasa.gov/new_web/webtool_aod_v3_lunar.html (last access: 20 April 2024), the temperature profile from the ERA-5 reanalysis data was downloaded from https://doi.org/10.24381/cds.bd0915c6 (Hersbach et al., 2023), and the MonoRTM source code is available on https://github.com/AER-RC/monoRTM (Clough et al., 2005; Huang et al., 2013; last access: 18 April 2024). The sounding data from Beijing Meteorological Station (station ID: 54511) were obtained from https://weather.uwyo.edu/upperair/bufrraob.shtml (last access: 10 April 2024).
The supplement related to this article is available online at https://doi.org/10.5194/amt-18-6705-2025-supplement.
GL and JL conceived the study and wrote the original draft. GL, SY, LZ, and CZ ran the simulation and conducted the corresponding analysis. All authors revised and reviewed the draft.
The contact author has declared that none of the authors has any competing interests.
Publisher's note: Copernicus Publications remains neutral with regard to jurisdictional claims made in the text, published maps, institutional affiliations, or any other geographical representation in this paper. While Copernicus Publications makes every effort to include appropriate place names, the final responsibility lies with the authors. Views expressed in the text are those of the authors and do not necessarily reflect the views of the publisher.
The authors thank Pawan Gupta and Elena Lind for their effort in establishing and maintaining the Beijing-CAMS AERONET site.
This study is funded by the National Natural Science Foundation of China (NSFC) (grant nos. 42425503 and 42175144), the National Key Research and Development Program of China (grant no. 2023YFF0805401), and the Peking University–BHP Carbon and Climate Wei-Ming PhD Scholars Program (WM202401).
This paper was edited by Daniel Perez-Ramirez and reviewed by two anonymous referees.
Adebiyi, A., Kok, J. F., Murray, B. J., Ryder, C. L., Stuut, J. B. W., Kahn, R. A., Knippertz, P., Formenti, P., Mahowald, N. M., Garcia-Pando, C. P., Klose, M., Ansmann, A., Samset, B. H., Ito, A., Balkanski, Y., Di Biagio, C., Romanias, M. N., Huang, Y., and Meng, J.: A review of coarse mineral dust in the Earth system, Aeolian Research, 60, https://doi.org/10.1016/j.aeolia.2022.100849, 2023.
Arola, A., Eck, T. F., Huttunen, J., Lehtinen, K. E. J., Lindfors, A. V., Myhre, G., Smirnov, A., Tripathi, S. N., and Yu, H.: Influence of observed diurnal cycles of aerosol optical depth on aerosol direct radiative effect, Atmos. Chem. Phys., 13, 7895–7901, https://doi.org/10.5194/acp-13-7895-2013, 2013.
Balmes, K. A., Fu, Q., and Thorsen, T. J.: The Diurnal Variation of the Aerosol Optical Depth at the ARM SGP Site, Earth and Space Science, 8, https://doi.org/10.1029/2021EA001852, 2021.
Barreto, A., Cuevas, E., Damiri, B., Guirado, C., Berkoff, T., Berjón, A. J., Hernández, Y., Almansa, F., and Gil, M.: A new method for nocturnal aerosol measurements with a lunar photometer prototype, Atmos. Meas. Tech., 6, 585–598, https://doi.org/10.5194/amt-6-585-2013, 2013.
Barreto, Á., Cuevas, E., Granados-Muñoz, M.-J., Alados-Arboledas, L., Romero, P. M., Gröbner, J., Kouremeti, N., Almansa, A. F., Stone, T., Toledano, C., Román, R., Sorokin, M., Holben, B., Canini, M., and Yela, M.: The new sun-sky-lunar Cimel CE318-T multiband photometer – a comprehensive performance evaluation, Atmos. Meas. Tech., 9, 631–654, https://doi.org/10.5194/amt-9-631-2016, 2016.
Barreto, Á., Román, R., Cuevas, E., Berjón, A. J., Almansa, A. F., Toledano, C., González, R., Hernández, Y., Blarel, L., Goloub, P., Guirado, C., and Yela, M.: Assessment of nocturnal aerosol optical depth from lunar photometry at the Izaña high mountain observatory, Atmos. Meas. Tech., 10, 3007–3019, https://doi.org/10.5194/amt-10-3007-2017, 2017.
Berkoff, T. A., Sorokin, M., Stone, T., Eck, T. F., Hoff, R., Welton, E., and Holben, B.: Nocturnal Aerosol Optical Depth Measurements with a Small-Aperture Automated Photometer Using the Moon as a Light Source, Journal of Atmospheric and Oceanic Technology, 28, 1297–1306, https://doi.org/10.1175/JTECH-D-10-05036.1, 2011.
Bianco, L., Cimini, D., Marzano, F. S., and Ware, R.: Combining microwave radiometer and wind profiler radar measurements for high-resolution atmospheric humidity profiling, Journal of Atmospheric and Oceanic Technology, 22, 949–965, https://doi.org/10.1175/JTECH1771.1, 2005.
Brock, C. A., Wagner, N. L., Anderson, B. E., Beyersdorf, A., Campuzano-Jost, P., Day, D. A., Diskin, G. S., Gordon, T. D., Jimenez, J. L., Lack, D. A., Liao, J., Markovic, M. Z., Middlebrook, A. M., Perring, A. E., Richardson, M. S., Schwarz, J. P., Welti, A., Ziemba, L. D., and Murphy, D. M.: Aerosol optical properties in the southeastern United States in summer – Part 2: Sensitivity of aerosol optical depth to relative humidity and aerosol parameters, Atmos. Chem. Phys., 16, 5009–5019, https://doi.org/10.5194/acp-16-5009-2016, 2016.
Cachorro, V. E., Romero, P. M., Toledano, C., Cuevas, E., and de Frutos, A. M.: The fictitious diurnal cycle of aerosol optical depth: A new approach for ”in situ” calibration and correction of AOD data series, Geophysical Research Letters, 31, https://doi.org/10.1029/2004GL019651, 2004.
Cachorro, V. E., Toledano, C., Berjón, A., de Frutos, A. M., Torres, B., Sorribas, M., and Laulainen, N. S.: An ”in situ” calibration correction procedure (KCICLO) based on AOD diurnal cycle:: Application to AERONET -: El Arenosillo (Spain) AOD data series, Journal of Geophysical Research-Atmospheres, 113, https://doi.org/10.1029/2007JD009673, 2008.
Che, H. Z., Xia, X. G., Zhao, H. J., Li, L., Gui, K., Zheng, Y., Song, J. J., Qi, B., Zhu, J., Miao, Y. C., Wang, Y. Q., Wang, Z. L., Wang, H., Dubovik, O., Holben, B., Chen, H. B., Shi, G. Y., and Zhang, X. Y.: Aerosol optical and radiative properties and their environmental effects in China: A review, Earth-Science Reviews, 248, https://doi.org/10.1016/j.earscirev.2023.104634, 2024.
Chen, A., Yang, J., He, Y., Yuan, Q., Li, Z., and Zhu, L.: High spatiotemporal resolution estimation of AOD from Himawari-8 using an ensemble machine learning gap-filling method, Science of the Total Environment, 857, https://doi.org/10.1016/j.scitotenv.2022.159673, 2023a.
Chen, A. N. and Zhao, C. F.: Progress of aerosol direct radiative forcing, Chinese Science Bulletin-Chinese, 69, 30–44, https://doi.org/10.1360/TB-2023-0375, 2024.
Chen, H., Cheng, T., Gu, X., Li, Z., and Wu, Y.: Characteristics of aerosols over Beijing and Kanpur derived from the AERONET dataset, Atmospheric Pollution Research, 7, 162–169, https://doi.org/10.1016/j.apr.2015.08.008, 2016.
Chen, J., Shen, Y., Chi, X., and Zhu, S.: Factors influencing the hygroscopicity of aerosols and the effects of hygroscopicity on aerosol optical properties, Journal of Environmental Engineering Technology, 13, 2081–2091, 2023b.
Chen, Y., Chen, S. Y., Zhou, J., Zhao, D., Bi, H. R., Zhang, Y., Alam, K., Yu, H. P., Yang, Y. X., and Chen, J. Y.: A super dust storm enhanced by radiative feedback, npj Climate and Atmospheric Science, 6, https://doi.org/10.1038/s41612-023-00418-y, 2023c.
Cimini, D., Hewison, T. J., Martin, L., Güldner, J., Gaffard, C., and Marzano, F. S.: Temperature and humidity profile retrievals from ground-based microwave radiometers during TUC, Meteorologische Zeitschrift, 15, 45–56, https://doi.org/10.1127/0941-2948/2006/0099, 2006.
Clarisse, L., Clerbaux, C., Franco, B., Hadji-Lazaro, J., Whitburn, S., Kopp, A. K., Hurtmans, D., and Coheur, P. F.: A Decadal Data Set of Global Atmospheric Dust Retrieved From IASI Satellite Measurements, Journal of Geophysical Research-Atmospheres, 124, 1618–1647, https://doi.org/10.1029/2018JD029701, 2019.
Clough, S. A., Shephard, M. W., Mlawer, E., Delamere, J. S., Iacono, M., Cady-Pereira, K., Boukabara, S., and Brown, P. D.: Atmospheric radiative transfer modeling: a summary of the AER codes, Journal of Quantitative Spectroscopy & Radiative Transfer, 91, 233–244, https://doi.org/10.1016/j.jqsrt.2004.05.058, 2005.
Colarco, P. R., Nowottnick, E. P., Randles, C. A., Yi, B. Q., Yang, P., Kim, K. M., Smith, J. A., and Bardeen, C. G.: Impact of radiatively interactive dust aerosols in the NASA GEOS-5 climate model: Sensitivity to dust particle shape and refractive index, Journal of Geophysical Research-Atmospheres, 119, 753–786, https://doi.org/10.1002/2013JD020046, 2014.
Crippa, M., Guizzardi, D., Muntean, M., Schaaf, E., Dentener, F., van Aardenne, J. A., Monni, S., Doering, U., Olivier, J. G. J., Pagliari, V., and Janssens-Maenhout, G.: Gridded emissions of air pollutants for the period 1970–2012 within EDGAR v4.3.2, Earth Syst. Sci. Data, 10, 1987–2013, https://doi.org/10.5194/essd-10-1987-2018, 2018.
DeSouza-Machado, S. G., Strow, L. L., Imbiriba, B., McCann, K., Hoff, R. M., Hannon, S. E., Martins, J. V., Tanré, D., Deuzé, J. L., Ducos, F., and Torres, O.: Infrared retrievals of dust using AIRS: Comparisons of optical depths and heights derived for a North African dust storm to other collocated EOS A-Train and surface observations, Journal of Geophysical Research-Atmospheres, 115, https://doi.org/10.1029/2009JD012842, 2010.
Ding, H., Zheng, Z., and Liu, W.: Warming Trend and Seasonal Variation in Beijing During 1951–2008, Advances in Climate Change Research, 6, 187–191, 2010.
Dufresne, J. L., Gautier, C., Ricchiazzi, P., and Fouquart, Y.: Longwave scattering effects of mineral aerosols, Journal of the Atmospheric Sciences, 59, 1959–1966, https://doi.org/10.1175/1520-0469(2002)059<1959:LSEOMA>2.0.CO;2, 2002.
Ebr, J., Karpov, S., Eliásek, J., Blazek, J., Cunniffe, R., Ebrová, I., Janecek, P., Jelínek, M., Jurysek, J., Mandát, D., Masek, M., Pech, M., Prouza, M., and Trávnícek, P.: A New Method for Aerosol Measurement Using Wide-field Photometry, Astronomical Journal, 162, https://doi.org/10.3847/1538-3881/abf7b1, 2021.
Fan, J. W., Wang, Y., Rosenfeld, D., and Liu, X. H.: Review of Aerosol-Cloud Interactions: Mechanisms, Significance, and Challenges, Journal of the Atmospheric Sciences, 73, 4221–4252, https://doi.org/10.1175/JAS-D-16-0037.1, 2016.
Feng, T., Fu, Z.-T., and Mao, J.-Y.: The multi-fractal characteristics of climate variables in Beijing, Chinese Journal of Geophysics-Chinese Edition, 53, 2037–2044, https://doi.org/10.3969/j.issn.0001-5733.2010.09.004, 2010.
Feng, Y., Wang, H., Rasch, P. J., Zhang, K., Lin, W., Tang, Q., Xie, S., Hamilton, D. S., Mahowald, N., and Yu, H.: Global Dust Cycle and Direct Radiative Effect in E3SM Version 1: Impact of Increasing Model Resolution, Journal of Advances in Modeling Earth Systems, 14, https://doi.org/10.1029/2021MS002909, 2022.
Ge, J., Huang, J., Weng, F., and Sun, W.: Effects of dust storms on microwave radiation based on satellite observation and model simulation over the Taklamakan desert, Atmos. Chem. Phys., 8, 4903–4909, https://doi.org/10.5194/acp-8-4903-2008, 2008.
Ghan, S., Wang, M. H., Zhang, S. P., Ferrachat, S., Gettelman, A., Griesfeller, J., Kipling, Z., Lohmann, U., Morrison, H., Neubauer, D., Partridge, D. G., Stier, P., Takemura, T., Wang, H. L., and Zhang, K.: Challenges in constraining anthropogenic aerosol effects on cloud radiative forcing using present-day spatiotemporal variability, Proceedings of the National Academy of Sciences of the United States of America, 113, 5804–5811, https://doi.org/10.1073/pnas.1514036113, 2016.
Graßl, S., Ritter, C., Wilsch, J., Herrmann, R., Doppler, L., and Román, R.: From polar day to polar night: a comprehensive sun and star photometer study of trends in Arctic aerosol properties in Ny-Ålesund, Svalbard, Remote Sensing, 16, 3725, https://doi.org/10.3390/rs16193725, 2024.
Greenwald, T. J., Bennartz, R., Lebsock, M., and Teixeira, J.: An Uncertainty Data Set for Passive Microwave Satellite Observations of Warm Cloud Liquid Water Path, Journal of Geophysical Research-Atmospheres, 123, 3668–3687, https://doi.org/10.1002/2017JD027638, 2018.
Gueymard, C. A.: Temporal variability in direct and global irradiance at various time scales as affected by aerosols, Solar Energy, 86, 3544–3553, https://doi.org/10.1016/j.solener.2012.01.013, 2012.
Guo, J. P., Xia, F., Zhang, Y., Liu, H., Li, J., Lou, M. Y., He, J., Yan, Y., Wang, F., Min, M., and Zhai, P. M.: Impact of diurnal variability and meteorological factors on the PM2.5 – AOD relationship: Implications for PM2.5 remote sensing, Environmental Pollution, 221, 94–104, https://doi.org/10.1016/j.envpol.2016.11.043, 2017.
Hao, R., Wang, W., and Hao, J.: Classification of climate types and dynamic change in Beijing-Tianjin-Hebei region, Journal of Anhui Agricultural University, 44, 670–676, 2017.
Herber, A., Thomason, L. W., Gernandt, H., Leiterer, U., Nagel, D., Schulz, K. H., Kaptur, J., Albrecht, T., and Notholt, J.: Continuous day and night aerosol optical depth observations in the Arctic between 1991 and 1999, Journal of Geophysical Research-Atmospheres, 107, https://doi.org/10.1029/2001JD000536, 2002.
Hersbach, H., Bell, B., Berrisford, P., Biavati, G., Horányi, A., Muñoz Sabater, J., Nicolas, J., Peubey, C., Radu, R., Rozum, I., Schepers, D., Simmons, A., Soci, C., Dee, D., and Thépaut, J.-N.: ERA5 hourly data on pressure levels from 1940 to present, Copernicus Climate Change Service (C3S) Climate Data Store (CDS) [data set], https://doi.org/10.24381/cds.bd0915c6, 2023.
Holben, B. N., Eck, T. F., Slutsker, I., Tanre, D., Buis, J. P., Setzer, A., Vermote, E., Reagan, J. A., Kaufman, Y. J., Nakajima, T., Lavenu, F., Jankowiak, I., and Smirnov, A.: AERONET – A federated instrument network and data archive for aerosol characterization, Remote Sensing of Environment, 66, 1–16, https://doi.org/10.1016/S0034-4257(98)00031-5, 1998.
Hong, G., Yang, P., Weng, F. Z., and Liu, Q. H.: Microwave scattering properties of sand particles: Application to the simulation of microwave radiances over sandstorms, Journal of Quantitative Spectroscopy & Radiative Transfer, 109, 684–702, https://doi.org/10.1016/j.jqsrt.2007.08.018, 2008.
Huang, J. P., Ge, J. M., and Weng, F. Z.: Detection of Asia dust storms using multisensor satellite measurements, Remote Sensing of Environment, 110, 186–191, https://doi.org/10.1016/j.rse.2007.02.022, 2007.
Huang, J. P., Wang, T. H., Wang, W. C., Li, Z. Q., and Yan, H. R.: Climate effects of dust aerosols over East Asian arid and semiarid regions, Journal of Geophysical Research-Atmospheres, 119, 11398–11416, https://doi.org/10.1002/2014JD021796, 2014.
Huang, X., Zhang, X., Leng, L., Li, F., and Fan, Y.: Study on retrieval methods with MonoRTM for microwave radiometer measurements, Scientia Meteorologlca Sinica, 33, 138–145, 2013.
IPCC: Short-Lived Climate Forcers, in: Climate Change 2021: The Physical Science Basis. Contribution of Working Group I to the Sixth Assessment Report of the Intergovernmental Panel on Climate Change, Cambridge University Press, United Kingdom and New York, https://doi.org/10.1017/9781009157896.008, 2021.
Ivănescu, L. and O'Neill, N. T.: Multi-star calibration in starphotometry, Atmos. Meas. Tech., 16, 6111–6121, https://doi.org/10.5194/amt-16-6111-2023, 2023.
Ivănescu, L., Baibakov, K., O'Neill, N. T., Blanchet, J.-P., and Schulz, K.-H.: Accuracy in starphotometry, Atmos. Meas. Tech., 14, 6561–6599, https://doi.org/10.5194/amt-14-6561-2021, 2021.
Jiang, M., Chen, L., He, Y., Hu, X., Liu, M., and Zhang, P.: Nighttime aerosol optical depth retrievals from VIIRS day/night band data, National Remote Sensing Bulletin, 26, 493–504, 2022.
Jiang, X., Wang, Y., Wang, L., Tao, M., Wang, J., Zhou, M., Bai, X., and Gui, L.: Characteristics of Daytime-And-Nighttime AOD Differences Over China: A Perspective From CALIOP Satellite Observations and GEOS-Chem Model Simulations, Journal of Geophysical Research-Atmospheres, 129, https://doi.org/10.1029/2023JD039158, 2024.
Klüser, L., Kleiber, P., Holzer-Popp, T., and Grassian, V. H.: Desert dust observation from space – Application of measured mineral component infrared extinction spectra, Atmospheric Environment, 54, 419–427, https://doi.org/10.1016/j.atmosenv.2012.02.011, 2012.
Knupp, K. R., Ware, R., Cimini, D., Vandenberghe, F., Vivekanandan, J., Westwater, E., Coleman, T., and Phillips, D.: Ground-Based Passive Microwave Profiling during Dynamic Weather Conditions, Journal of Atmospheric and Oceanic Technology, 26, 1057–1073, https://doi.org/10.1175/2008JTECHA1150.1, 2009.
Kremser, S., Thomason, L. W., von Hobe, M., Hermann, M., Deshler, T., Timmreck, C., Toohey, M., Stenke, A., Schwarz, J. P., Weigel, R., Fueglistaler, S., Prata, F. J., Vernier, J. P., Schlager, H., Barnes, J. E., Antuña-Marrero, J. C., Fairlie, D., Palm, M., Mahieu, E., Notholt, J., Rex, M., Bingen, C., Vanhellemont, F., Bourassa, A., Plane, J. M. C., Klocke, D., Carn, S. A., Clarisse, L., Trickl, T., Neely, R., James, A. D., Rieger, L., Wilson, J. C., and Meland, B.: Stratospheric aerosol-Observations, processes, and impact on climate, Reviews of Geophysics, 54, 278–335, https://doi.org/10.1002/2015RG000511, 2016.
Lei, L., Sun, J., and Wei, D.: Distinguishing the Category of the Summer Convective Weather by Sounding Data in Beijing, Meteorological Monthly, 37, 136–141, 2011.
Leiterer, U., Naebert, A., Naebert, T., and Alekseeva, G.: A new star photometer developed for spectral aerosol optical thickness measurements in Lindenberg, Contributions to Atmospheric Physics, 68, 133–141, 1995.
Levy, R. C., Mattoo, S., Munchak, L. A., Remer, L. A., Sayer, A. M., Patadia, F., and Hsu, N. C.: The Collection 6 MODIS aerosol products over land and ocean, Atmos. Meas. Tech., 6, 2989–3034, https://doi.org/10.5194/amt-6-2989-2013, 2013.
Li, J., Li, C. C., Zhao, C. S., and Su, T. N.: Changes in surface aerosol extinction trends over China during 1980-2013 inferred from quality-controlled visibility data, Geophysical Research Letters, 43, 8713–8719, https://doi.org/10.1002/2016GL070201, 2016a.
Li, J., Carlson, B. E., Yung, Y. L., Lv, D. R., Hansen, J., Penner, J. E., Liao, H., Ramaswamy, V., Kahn, R. A., Zhang, P., Dubovik, O., Ding, A. J., Lacis, A. A., Zhang, L., and Dong, Y. M.: Scattering and absorbing aerosols in the climate system, Nature Reviews Earth & Environment, 3, 363–379, https://doi.org/10.1038/s43017-022-00296-7, 2022.
Li, M., Zhang, Q., Kurokawa, J.-I., Woo, J.-H., He, K., Lu, Z., Ohara, T., Song, Y., Streets, D. G., Carmichael, G. R., Cheng, Y., Hong, C., Huo, H., Jiang, X., Kang, S., Liu, F., Su, H., and Zheng, B.: MIX: a mosaic Asian anthropogenic emission inventory under the international collaboration framework of the MICS-Asia and HTAP, Atmos. Chem. Phys., 17, 935–963, https://doi.org/10.5194/acp-17-935-2017, 2017.
Li, W. J., Shao, L. Y., Zhang, D. Z., Ro, C. U., Hu, M., Bi, X. H., Geng, H., Matsuki, A., Niu, H. Y., and Chen, J. M.: A review of single aerosol particle studies in the atmosphere of East Asia: morphology, mixing state, source, and heterogeneous reactions, Journal of Cleaner Production, 112, 1330–1349, https://doi.org/10.1016/j.jclepro.2015.04.050, 2016b.
Li, Z. Q., Wang, Y., Guo, J. P., Zhao, C. F., Cribb, M., Dong, X. Q., Fan, J. W., Gong, D. Y., Huang, J. P., Jiang, M. J., Jiang, Y. Q., Lee, S. S., Li, H., Li, J. M., Liu, J. J., Qian, Y., Rosenfeld, D., Shan, S. Y., Sun, Y. L., Wang, H. J., Xin, J. Y., Yan, X., Yang, X., Yang, X. Q., Zhang, F., and Zheng, Y. T.: East Asian Study of Tropospheric Aerosols and their Impact on Regional Clouds, Precipitation, and Climate (EAST-AIRCPC), Journal of Geophysical Research-Atmospheres, 124, 13026–13054, https://doi.org/10.1029/2019JD030758, 2019.
Liu, C. S., Shen, X. X., and Gao, W.: Intercomparison of CALIOP, MODIS, and AERONET aerosol optical depth over China during the past decade, International Journal of Remote Sensing, 39, 7251–7275, https://doi.org/10.1080/01431161.2018.1466070, 2018.
Liu, D. W., Lv, C. C., Liu, K., Xie, Y., and Miao, J. G.: Retrieval Analysis of Atmospheric Water Vapor for K-Band Ground-Based Hyperspectral Microwave Radiometer, IEEE Geoscience and Remote Sensing Letters, 11, 1835–1839, https://doi.org/10.1109/LGRS.2014.2311833, 2014.
Liu, G. Y., Li, J., Jiang, Z. J., and Li, X. C.: Impact of sea surface temperature variability at different ocean basins on dust activities in the Gobi Desert and north China, Geophysical Research Letters, 49, e2022GL099821, https://doi.org/10.1029/2022GL099821, 2022a.
Liu, G. Y., Li, J., Li, J., Yue, S., and Zhou, R. L.: Estimation of Nighttime Aerosol Optical Depths Using Atmospheric Infrared Sounder Longwave Radiances, Geophysical Research Letters, 51, https://doi.org/10.1029/2023GL108120, 2024.
Liu, S., Yang, X. C., Duan, F. Z., and Zhao, W. J.: Changes in Air Quality and Drivers for the Heavy PM2.5 Pollution on the North China Plain Pre- to Post-COVID-19, International Journal of Environmental Research and Public Health, 19, https://doi.org/10.3390/ijerph191912904, 2022b.
Lv, M., Liu, D., Li, Z., Mao, J., Sun, Y., Wang, Z., Wang, Y., and Xie, C.: Hygroscopic growth of atmospheric aerosol particles based on lidar, radiosonde, and in situ measurements: Case studies from the Xinzhou field campaign, Journal of Quantitative Spectroscopy & Radiative Transfer, 188, 60–70, https://doi.org/10.1016/j.jqsrt.2015.12.029, 2017.
Lv, Z. F., Wang, X. T., Deng, F. Y., Ying, Q., Archibald, A. T., Jones, R. L., Ding, Y., Cheng, Y., Fu, M. L., Liu, Y., Man, H. Y., Xue, Z. G., He, K. B., Hao, J. M., and Liu, H. A.: Source-Receptor Relationship Revealed by the Halted Traffic and Aggravated Haze in Beijing during the COVID-19 Lockdown, Environmental Science & Technology, 54, 15660–15670, https://doi.org/10.1021/acs.est.0c04941, 2020.
Mahowald, N., Ward, D. S., Kloster, S., Flanner, M. G., Heald, C. L., Heavens, N. G., Hess, P. G., Lamarque, J. F., and Chuang, P. Y.: Aerosol Impacts on Climate and Biogeochemistry, in: Annual Review of Environment and Resources, edited by: Gadgil, A. and Liverman, D. M., 45–74, https://doi.org/10.1146/annurev-environ-042009-094507, 2011.
Matsui, H., Hamilton, D. S., and Mahowald, N. M.: Black carbon radiative effects highly sensitive to emitted particle size when resolving mixing-state diversity, Nature Communications, 9, https://doi.org/10.1038/s41467-018-05635-1, 2018.
Meng, Y., Zhou, J., Wang, Z., Tang, W., Ma, J., Zhang, T., and Long, Z.: Retrieval of nighttime aerosol optical depth by simultaneous consideration of artificial and natural light sources, Science of the Total Environment, 896, https://doi.org/10.1016/j.scitotenv.2023.166354, 2023.
Mitra, A. K., Sharma, A. K., Soni, V. K., and Kundu, P. K.: Characteristics of recent dust storms over the Indian region using real time multi-satellite observations from the direct broadcast receiving system at IMD, Advances in Space Research, 51, 1195–1203, https://doi.org/10.1016/j.asr.2012.11.017, 2013.
Nembrini, S., König, I. R., and Wright, M. N.: The revival of the Gini importance?, Bioinformatics, 34, 3711–3718, https://doi.org/10.1093/bioinformatics/bty373, 2018.
Ou, Y., Zhao, W., Wang, J., Zhao, W., and Zhang, B.: Characteristics of Aerosol Types in Beijing and the Associations with Air Pollution from 2004 to 2015, Remote Sensing, 9, https://doi.org/10.3390/rs9090898, 2017.
Panicker, A. S., Pandithurai, G., Safai, P. D., and Kewat, S.: Observations of enhanced aerosol longwave radiative forcing over an urban environment, Geophysical Research Letters, 35, https://doi.org/10.1029/2007GL032879, 2008.
Payne, V. H., Mlawer, E. J., Cady-Pereira, K. E., and Moncet, J. L.: Water Vapor Continuum Absorption in the Microwave, IEEE Transactions on Geoscience and Remote Sensing, 49, 2194–2208, https://doi.org/10.1109/TGRS.2010.2091416, 2011.
Pérez-Ramírez, D., Ruiz, B., Aceituno, J., Olmo, F. J., and Alados-Arboledas, L.: Application of Sun/star photometry to derive the aerosol optical depth, International Journal of Remote Sensing, 29, 5113–5132, https://doi.org/10.1080/01431160802036425, 2008.
Pérez-Ramírez, D., Lyamani, H., Olmo, F. J., and Alados-Arboledas, L.: Improvements in star photometry for aerosol characterizations, Journal of Aerosol Science, 42, 737–745, https://doi.org/10.1016/j.jaerosci.2011.06.010, 2011.
Pérez-Ramírez, D., Lyamani, H., Olmo, F. J., Whiteman, D. N., and Alados-Arboledas, L.: Columnar aerosol properties from sun-and-star photometry: statistical comparisons and day-to-night dynamic, Atmos. Chem. Phys., 12, 9719–9738, https://doi.org/10.5194/acp-12-9719-2012, 2012.
Pérez-Ramírez, D., Veselovskii, I., Whiteman, D. N., Suvorina, A., Korenskiy, M., Kolgotin, A., Holben, B., Dubovik, O., Siniuk, A., and Alados-Arboledas, L.: High temporal resolution estimates of columnar aerosol microphysical parameters from spectrum of aerosol optical depth by linear estimation: application to long-term AERONET and star-photometry measurements, Atmos. Meas. Tech., 8, 3117–3133, https://doi.org/10.5194/amt-8-3117-2015, 2015.
Pérez-Ramírez, D., Lyamani, H., Smirnov, A., O'Neill, N. T., Veselovskii, I., Whiteman, D. N., Olmo, F. J., and Alados-Arboledas, L.: Statistical study of day and night hourly patterns of columnar aerosol properties using sun and star photometry, Remote Sensing of Clouds and the Atmosphere XXI, WOS:000391488200014, https://doi.org/10.1117/12.2242372, 2016.
Perrone, M. R., Lorusso, A., and Romano, S.: Diurnal and nocturnal aerosol properties by AERONET sun-sky-lunar photometer measurements along four years, Atmospheric Research, 265, https://doi.org/10.1016/j.atmosres.2021.105889, 2022.
Pierangelo, C., Chédin, A., Heilliette, S., Jacquinet-Husson, N., and Armante, R.: Dust altitude and infrared optical depth from AIRS, Atmos. Chem. Phys., 4, 1813–1822, https://doi.org/10.5194/acp-4-1813-2004, 2004.
Pierangelo, C., Mishchenko, M., Balkanski, Y., and Chédin, A.: Retrieving the effective radius of Saharan dust coarse mode from AIRS, Geophysical Research Letters, 32, L20813, https://doi.org/10.1029/2005GL023425, 2005.
Quan, J. N., Jiang, C. L., Xin, J. Y., Zhao, X. J., Jia, X. C., Liu, Q., Gao, Y., and Chen, D.: Evaluation of satellite aerosol retrievals with in situ aircraft and ground measurements: Contribution of relative humidity, Atmospheric Research, 212, 1–5, https://doi.org/10.1016/j.atmosres.2018.04.024, 2018.
Riemer, N., Ault, A. P., West, M., Craig, R. L., and Curtis, J. H.: Aerosol Mixing State: Measurements, Modeling, and Impacts, Reviews of Geophysics, 57, 187–249, https://doi.org/10.1029/2018RG000615, 2019.
Rogers, R. R., Vaughan, M. A., Hostetler, C. A., Burton, S. P., Ferrare, R. A., Young, S. A., Hair, J. W., Obland, M. D., Harper, D. B., Cook, A. L., and Winker, D. M.: Looking through the haze: evaluating the CALIPSO level 2 aerosol optical depth using airborne high spectral resolution lidar data, Atmos. Meas. Tech., 7, 4317–4340, https://doi.org/10.5194/amt-7-4317-2014, 2014.
Santa Maria, M. and Winker, D.: Sampling uncertainties in observing the global aerosol with a nadir-viewing satellite lidar, Lidar Remote Sensing for Industry and Environmental Monitoring V, WOS:000227658800037, https://doi.org/10.1117/12.583098, 2005.
Sayer, A. M., Hsu, N. C., Lee, J., Kim, W. V., and Dutcher, S. T.: Validation, Stability, and Consistency of MODIS Collection 6.1 and VIIRS Version 1 Deep Blue Aerosol Data Over Land, Journal of Geophysical Research-Atmospheres, 124, 4658–4688, https://doi.org/10.1029/2018JD029598, 2019.
Seinfeld, J. H., Bretherton, C., Carslaw, K. S., Coe, H., DeMott, P. J., Dunlea, E. J., Feingold, G., Ghan, S., Guenther, A. B., Kahn, R., Kraucunas, I., Kreidenweis, S. M., Molina, M. J., Nenes, A., Penner, J. E., Prather, K. A., Ramanathan, V., Ramaswamy, V., Rasch, P. J., Ravishankara, A. R., Rosenfeld, D., Stephens, G., and Wood, R.: Improving our fundamental understanding of the role of aerosol-cloud interactions in the climate system, Proceedings of the National Academy of Sciences of the United States of America, 113, 5781–5790, https://doi.org/10.1073/pnas.1514043113, 2016.
Song, Q., Zhang, Z., Yu, H., Kok, J. F., Di Biagio, C., Albani, S., Zheng, J., and Ding, J.: Size-resolved dust direct radiative effect efficiency derived from satellite observations, Atmos. Chem. Phys., 22, 13115–13135, https://doi.org/10.5194/acp-22-13115-2022, 2022.
Stenchikov, G., Robock, A., Ramaswamy, V., Schwarzkopf, M. D., Hamilton, K., and Ramachandran, S.: Arctic Oscillation response to the 1991 Mount Pinatubo eruption: Effects of volcanic aerosols and ozone depletion, Journal of Geophysical Research-Atmospheres, 107, https://doi.org/10.1029/2002JD002090, 2002.
Su, X., Huang, Y. H., Wang, L. C., Cao, M. D., and Feng, L.: Validation and diurnal variation evaluation of MERRA-2 multiple aerosol properties on a global scale, Atmospheric Environment, 311, https://doi.org/10.1016/j.atmosenv.2023.120019, 2023.
Sulaymon, I. D., Zhang, Y. X., Hopke, P. K., Hu, J. L., Zhang, Y., Li, L., Mei, X. D., Gong, K. J., Shi, Z. H., Zhao, B., and Zhao, F. X.: Persistent high PM2.5 pollution driven by unfavorable meteorological conditions during the COVID-19 lockdown period in the Beijing-Tianjin-Hebei region, China, Environmental Research, 198, https://doi.org/10.1016/j.envres.2021.111186, 2021.
Sun, J. Y. T., Veefkind, P., van Velthoven, P., and Levelt, P. F.: Aerosol Absorption Over Land Derived From the Ultra-Violet Aerosol Index by Deep Learning, IEEE Journal of Selected Topics in Applied Earth Observations and Remote Sensing, 14, 9692–9710, https://doi.org/10.1109/JSTARS.2021.3108669, 2021.
Svetnik, V., Liaw, A., Tong, C., Culberson, J. C., Sheridan, R. P., and Feuston, B. P.: Random forest: A classification and regression tool for compound classification and QSAR modeling, Journal of Chemical Information and Computer Sciences, 43, 1947–1958, https://doi.org/10.1021/ci034160g, 2003.
Tao, C. L., Wheiler, K., Yu, C., Cheng, B. D., and Diao, G.: Does the joint prevention and control regulation improve the air quality? A quasi-experiment in the Beijing economic belt during the COVID-19 pandemic, Sustainable Cities and Society, 75, https://doi.org/10.1016/j.scs.2021.103365, 2021.
Tindan, J. Z., Jin, Q., and Pu, B.: Understanding day–night differences in dust aerosols over the dust belt of North Africa, the Middle East, and Asia, Atmos. Chem. Phys., 23, 5435–5466, https://doi.org/10.5194/acp-23-5435-2023, 2023.
Van Leeuwen, G. M. J., Hand, J. W., de Kamer, J. B., and Mizushina, S.: Temperature retrieval algorithm for brain temperature monitoring using microwave brightness temperatures, Electronics Letters, 37, 341–342, https://doi.org/10.1049/el:20010269, 2001.
Varga, A. J. and Breuer, H.: Evaluation of convective parameters derived from pressure level and native ERA5 data and different resolution WRF climate simulations over Central Europe, Climate Dynamics, 58, 1569–1585, https://doi.org/10.1007/s00382-021-05979-3, 2022.
Visioni, D., Bednarz, E. M., Lee, W. R., Kravitz, B., Jones, A., Haywood, J. M., and MacMartin, D. G.: Climate response to off-equatorial stratospheric sulfur injections in three Earth system models – Part 1: Experimental protocols and surface changes, Atmos. Chem. Phys., 23, 663–685, https://doi.org/10.5194/acp-23-663-2023, 2023.
Wang, H. Z., Zhang, R., Wang, G. H., An, Y. Z., and Jin, B. G.: Quality control of Argo temperature and salinity observation profiles, Chinese Journal of Geophysics-Chinese Edition, 55, 577–588, https://doi.org/10.6038/j.issn.0001-5733.2012.02.020, 2012.
Wang, J., Xia, X. G., Wang, P. C., and Christopher, S. A.: Diurnal variability of dust aerosol optical thickness and Angstrom exponent over dust source regions in China, Geophysical Research Letters, 31, https://doi.org/10.1029/2004GL019580, 2004.
Wang, L. T., Wei, Z., Yang, J., Zhang, Y., Zhang, F. F., Su, J., Meng, C. C., and Zhang, Q.: The 2013 severe haze over southern Hebei, China: model evaluation, source apportionment, and policy implications, Atmos. Chem. Phys., 14, 3151–3173, https://doi.org/10.5194/acp-14-3151-2014, 2014.
Wang, N., Hu, Y., Li, X. M., Kang, C., and Yan, L.: AOD Derivation from SDGSAT-1/GLI Dataset in Mega-City Area, Remote Sensing, 15, https://doi.org/10.3390/rs15051343, 2023.
Wang, S. Y., Li, F. X., de Leeuw, G., Fan, C., and Li, Z. Q.: A multilevel downscaling model for enhancing nocturnal aerosol optical depth reanalysis from CAMS over the Beijing-Tianjin-Hebei region, China, Environmental Technology & Innovation, 39, https://doi.org/10.1016/j.eti.2025.104238, 2025.
Wang, X., Mu, X., and Yan, G.: Quantitative Analysis of Aerosol Influence on Suomi-NPP VIIRS Nighttime Light in China, IEEE Journal of Selected Topics in Applied Earth Observations and Remote Sensing, 13, 3557–3568, https://doi.org/10.1109/JSTARS.2020.3003480, 2020.
Wei, L. Y., Wang, Y., Liu, S., Zhang, G., and Wang, B.: Distinct roles of land cover in regulating spatial variabilities of temperature responses to radiative effects of aerosols and clouds, Environmental Research Letters, 16, https://doi.org/10.1088/1748-9326/ac3f04, 2021.
Xie, Y., Chen, J. X., Liu, D. W., Lv, C. C., Liu, K., and Miao, J. G.: Development and Calibration of a K-Band Ground-Based Hyperspectral Microwave Radiometer for Water Vapor Measurements, Progress in Electromagnetics Research-Pier, 140, 415–438, https://doi.org/10.2528/PIER13050704, 2013.
Yang, Z. M., Zdanski, C., Farkas, D., Bang, J., and Williams, H.: Evaluation of Aerosol Optical Depth (AOD) and PM2.5 associations for air quality assessment, Remote Sensing Applications-Society and Environment, 20, https://doi.org/10.1016/j.rsase.2020.100396, 2020.
Yu, X. N., Zhu, B., and Zhang, M. G.: Seasonal variability of aerosol optical properties over Beijing, Atmospheric Environment, 43, 4095–4101, https://doi.org/10.1016/j.atmosenv.2009.03.061, 2009.
Yu, Y., Kalashnikova, O. V., Garay, M. J., Lee, H., Choi, M., Okin, G. S., Yorks, J. E., Campbell, J. R., and Marquis, J.: A global analysis of diurnal variability in dust and dust mixture using CATS observations, Atmos. Chem. Phys., 21, 1427–1447, https://doi.org/10.5194/acp-21-1427-2021, 2021.
Zhang, J., Jaker, S. L., Reid, J. S., Miller, S. D., Solbrig, J., and Toth, T. D.: Characterization and application of artificial light sources for nighttime aerosol optical depth retrievals using the Visible Infrared Imager Radiometer Suite Day/Night Band, Atmos. Meas. Tech., 12, 3209–3222, https://doi.org/10.5194/amt-12-3209-2019, 2019.
Zhang, L., Liu, M., He, W., Xia, X., Yu, H., Li, S., and Li, J.: Ground Passive Microwave Remote Sensing of Atmospheric Profiles Using WRF Simulations and Machine Learning Techniques, Journal of Meteorological Research, 38, 680–692, https://doi.org/10.1007/s13351-024-4004-2, 2024.
Zhang, X. Y., Xu, X. Y., Chen, H. S., Hu, X. M., and Gao, L.: Dust-planetary boundary layer interactions amplified by entrainment and advections, Atmospheric Research, 278, https://doi.org/10.1016/j.atmosres.2022.106359, 2022.
Zheng, J. Y., Zhang, Z. B., Garnier, A., Yu, H. B., Song, Q. Q., Wang, C. X., Dubuisson, P., and Di Biagio, C.: The thermal infrared optical depth of mineral dust retrieved from integrated CALIOP and IIR observations, Remote Sensing of Environment, 270, https://doi.org/10.1016/j.rse.2021.112841, 2022.
Zheng, J., Zhang, Z., Yu, H., Garnier, A., Song, Q., Wang, C., Di Biagio, C., Kok, J. F., Derimian, Y., and Ryder, C.: Thermal infrared dust optical depth and coarse-mode effective diameter over oceans retrieved from collocated MODIS and CALIOP observations, Atmos. Chem. Phys., 23, 8271–8304, https://doi.org/10.5194/acp-23-8271-2023, 2023.
Zhou, L. A., Wang, C., Miao, S., and Li, J.: Impact of the Complex Terrain in Beijing on Formation of Low-Level Jets, Journal of Meteorological Research, 38, 138–150, https://doi.org/10.1007/s13351-024-3122-1, 2024.
Zhou, M., Wang, J., Chen, X., Xu, X., Colarco, P. R., Miller, S. D., Reid, J. S., Kondragunta, S., Giles, D. M., and Holben, B.: Nighttime smoke aerosol optical depth over US rural areas: First retrieval from VIIRS moonlight observations, Remote Sensing of Environment, 267, https://doi.org/10.1016/j.rse.2021.112717, 2021.