the Creative Commons Attribution 4.0 License.
the Creative Commons Attribution 4.0 License.
 | 22 Dec 2025
A system for analysis of H2 and Ne in polar ice core samples
Miranda H. Miranda
John D. Patterson
Murat Aydin
This paper describes instrumentation and procedures developed to measure H2 and Ne in polar ice core samples. Gases are extracted from ice core samples by melting under vacuum. Measurements are conducted by gas chromatographic separation with detection by a pulsed helium ionization detector (He-PDD). The analytical system was developed for field analysis of ice core samples immediately after drilling. This minimizes the potential for exchange of these highly permeable gases between the ice core and the modern atmosphere. The design, operation, and performance of the instrument are discussed using data from the initial deployment to Summit, Greenland. The results demonstrate the feasibility of ice core analysis of H2 and Ne with precision of 8.6 % and 10.2 % (1σ) respectively.
- Article
(3491 KB) - Full-text XML
-
Supplement
(1199 KB) - BibTeX
- EndNote


The global biogeochemical cycle of atmospheric H2 is complex, involving both natural and anthropogenic sources and losses to soils and reaction with atmospheric OH (Novelli et al., 1999; Paulot et al., 2021). Research on the biogeochemical cycle of H2 has been stimulated by efforts to expand the H2 energy sector, which would likely result in increased emissions. Efforts are ongoing to quantify the impact of increased emissions on air quality and climate (Warwick et al., 2022, 2023; Derwent et al., 2020). Reconstructing the paleo-atmospheric history of H2 provides an opportunity to assess both natural variability in sources/sinks and anthropogenic impact on in the global H2 budget. Firn air studies show that atmospheric H2 levels increased by about 65 % over the past century (Patterson et al., 2023).
Polar ice core records could extend these records across the entire industrial era and capture a wider range of response of atmospheric H2 to climate variability. At present, there are no paleo-atmospheric records of H2 recovered from ice cores. This is largely due to the high permeability of H2 in ice which causes ice core samples to rapidly equilibrate with the modern atmosphere after drilling (Haan, 1996; Patterson and Saltzman, 2021). The mobility of H2 in ice is a result of its small molecular diameter (2.89 Å), which is small relative to the 4.5 Å gap in the hexagonal structure of ice 1H. Ne has a similar atomic diameter (2.75 Å) and similar permeability in ice. The mobility of H2 and Ne in ice also leads to pore close-off fractionation during the air entrapment process (Patterson et al., 2020, 2021, 2023; Severinghaus and Battle, 2006). Measurements of Ne in ice cores may be a useful diagnostic tool for quantifying the effects of pore close-off fractionation on the levels of H2 in polar firn and ice (Patterson et al., 2020).
Here we describe instrumentation for the analysis of H2 and Ne in polar ice core samples. The instrument was developed to extract and analyze samples in the field immediately after recovery recovered from the ice core drill to avoid possible subsequent changes due to permeation during storage. The instrumentation was deployed for the first time at Summit, Greenland during the summer of 2024. The design, operation, and performance characteristics of the instrument are discussed and some results from the initial deployment are presented.
The instrument described here consists of: (1) a vacuum system for extracting air from ice core samples and transferring the air to a GC injection loop or to a flask for storage, and (2) a gas chromatograph, detector, and data acquisition electronics. The system is based on commercially available components, with the exception of a custom-made piston pump for transferring and pressurizing small air samples into an injection loop to improve detection sensitivity. There are surprisingly few off-the-shelf solutions to this problem described in the analytical literature. The construction and operation of the piston pump is therefore described in detail.
2.1 Ice core extraction line
The ice core extraction line (Fig. 1) is a stainless-steel vacuum system consisting of an oil-free vacuum pump (ScrollLabs model SVF-E0-5PFS), a capacitance manometer (MKS Baratron), welded bellows valves and ball valves (Swagelok models SS-4H and SS-41GXS2). The manifold is constructed largely with 3.2 mm stainless-steel tubing and Swagelok fittings. A bulkheaded 6.4 mm ultra-torr adapter and short length of 6.4 mm PFA (or Synflex 1300) tubing serves as the connection to the glass ice core melting chamber. The manifold also includes a Nafion membrane tube inside a box filled with Drierite desiccant, used to dry the gas sample. Nafion is a fluoropolymer membrane that acts as a very selective, semi-permeable membrane to water vapor. Water vapor levels are estimated to be < 1 % in the sample after the Nafion tube. The materials used in the extraction line (stainless steel, PFA, PTFE, Nafion, Viton, Synflex 1300) were tested for H2 loss and outgassing on timescales of 1–2 h, relevant for the extraction of the gas from the ice core. The extraction line was designed to transfer air extracted from an ice core sample to the GC injection loop and/or to a glass sample flask for later analysis.
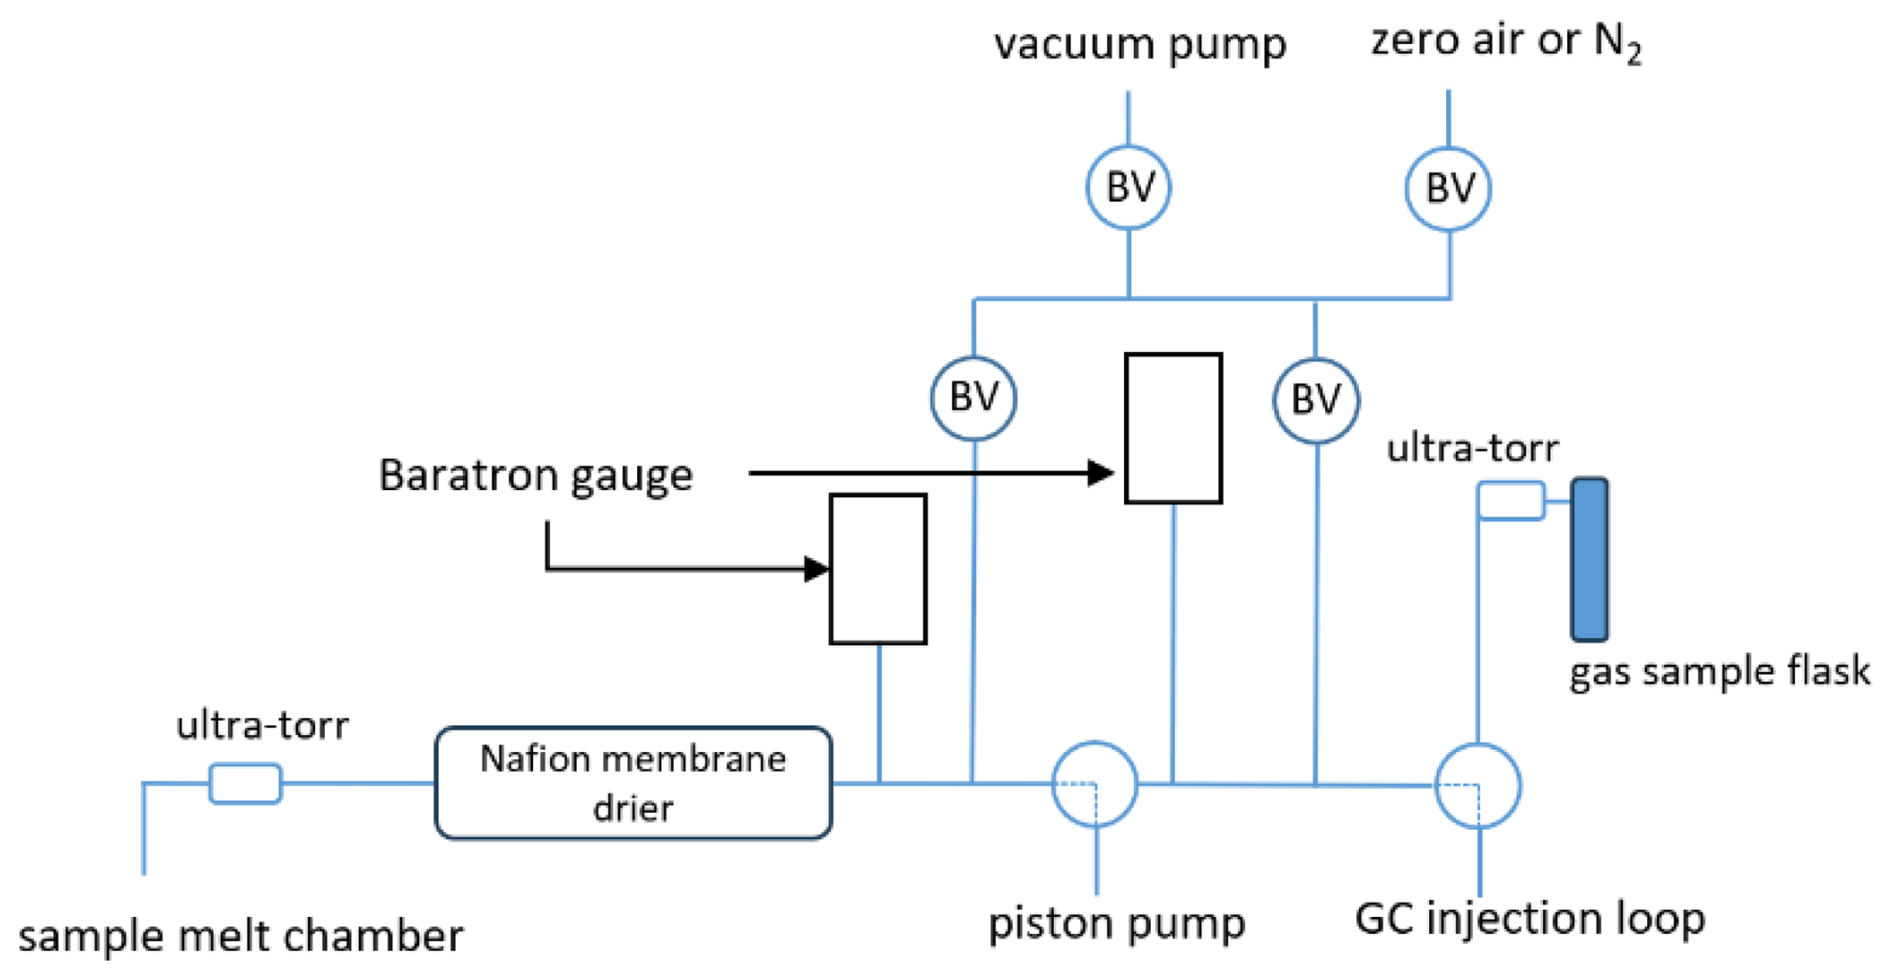
Figure 1Schematic of gas extraction line used for the measurement of H2 and Ne from polar ice cores. Circles labelled “BV” represent bellows valves, the unlabeled circles with dotted lines represent 3-way ball valves and “ultra-torr” refers to ultra-torr adapter.
2.2 Ice core extraction chamber
The ice core samples in this study were 7 cm diameter, cut into 10 cm long sections for analysis (roughly 350 g). The samples are scraped with a scalpel on all sides to clean the drilling fluid. The samples are melted in a 500 cm3 glass chamber. The flask is built from a 75 mm borosilicate glass O-ring joint (Ace Glass, 7646-18). The Viton O-ring exhibited outgassing of H2 during initial tests with melting ice. This outgassing did not occur when the flask was dry, so we suspect the outgassing was related to contact of Viton with liquid water. The other side of the glass joint is glass-blown into a dome shape to close the joint and to create the lower portion of the glass chamber (Fig. 2). The top of the chamber is a 6.4 mm flat borosilicate glass plate with a glass valve (Glass Expansion K2B3-08) fused at the center of the plate (Fig. 2).
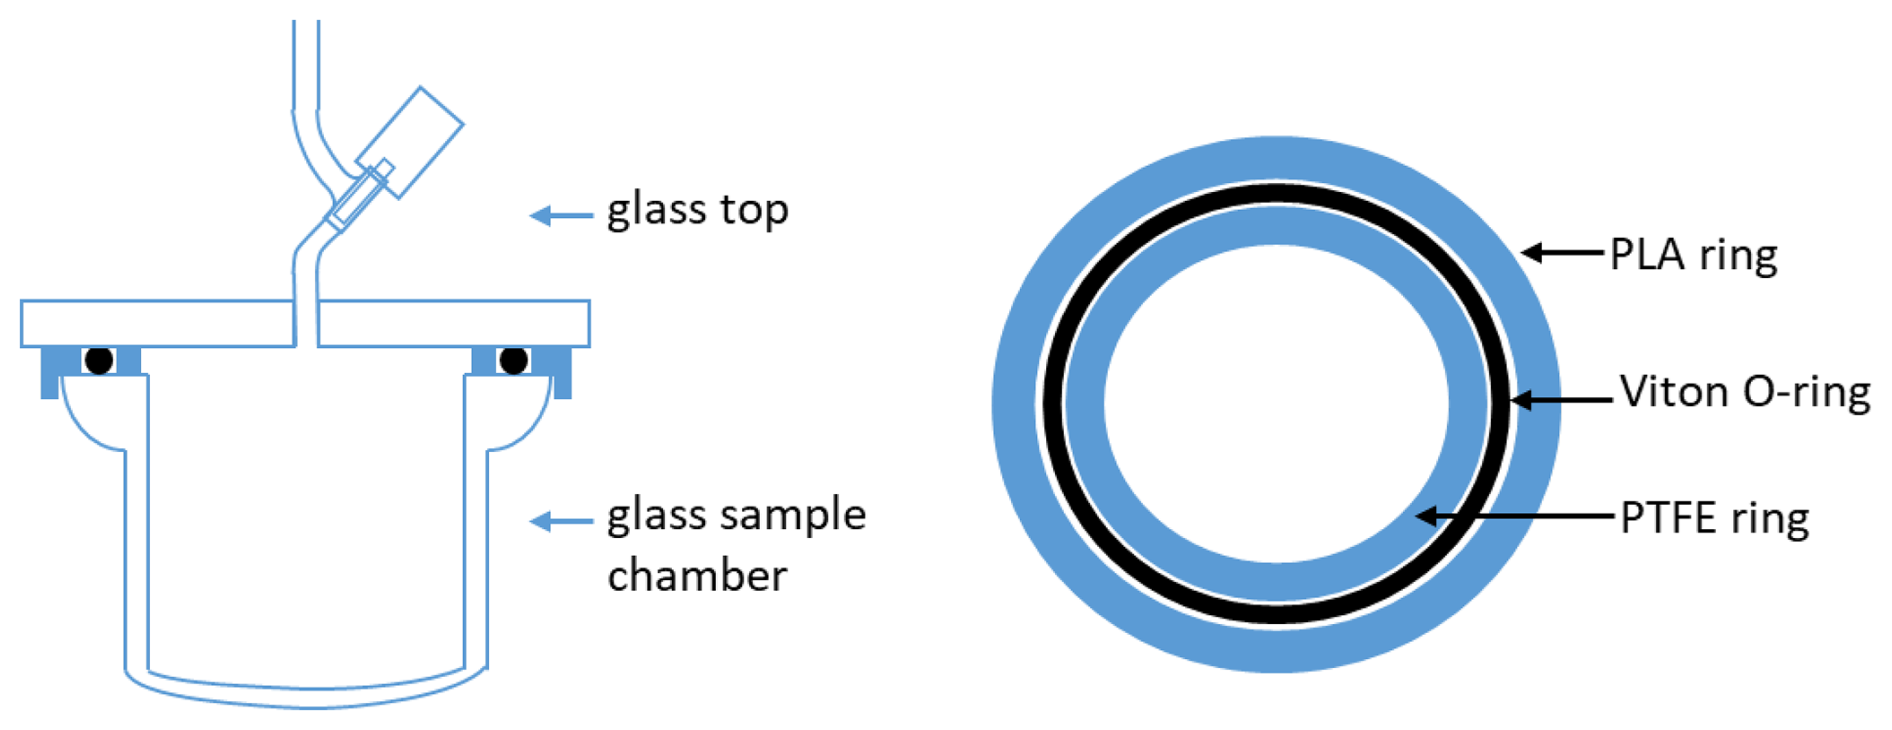
Figure 2Left: Cross-section of the 500 cm3 glass extraction chamber used for the measurement of H2 and Ne in polar ice cores. The valve is a glass gas expansion valve with PTFE O-rings. Right: Top view of the Viton O-rings and the plastic O-rings acting as a groove. Black circles represent the Viton O-ring, and the blue solid circles represent concentric plastic rings that conform the removable O-ring groove.
To avoid contact between the O-ring and liquid water, the O-ring joint was ground flat to remove the groove. Instead, an O-ring (Viton A, size #239) was located between two concentric plastic rings. These plastic rings serve as a removable “groove” to locate the Viton O-ring. These plastic rings also limit compression of the Viton O-ring when the chamber is evacuated. The outer plastic ring is held in place by a 6.4 mm lip that fits over the outer wall of the glass joint. This outer ring is external to the chamber and does not contact the sample. It was 3D printed using polylactic acid (PLA). The inner ring which does contact the ice core sample is machined from 3.2 mm thick PTFE sheet.
2.3 Sample transfer piston pump
A sample transfer piston pump was developed and fabricated in-house to deliver ice core air to the injection loop of the gas chromatograph or to a glass flask for storage (Fig. 3). The pump cylinder was made from a precision bore borosilicate glass tube (25.4 mm ID, 20 cm long; Ace Glass), with a narrow bore 6.4 mm OD glass tube fused to one end as the inlet. The other end of the tube was slightly flared to facilitate insertion of the piston. The piston was machined in four parts from solid rod (316 stainless-steel, PEEK, or MACOR machinable ceramic) and assembled with stainless-steel bolts. The multi-segment design of the piston allowed the piston seals to be installed without distortion. When assembled, the piston has three square grooves, each 3.2 mm wide and 1.6 mm deep with 0.03 in. radiused outer edges to avoid damaging the O-rings during assembly. The piston was supported at two grooves by wear rings made from split PTFE washers (19 mm ID, 25.4 mm OD, McMaster-Carr 95630A251). The third groove contains the dynamic seal which is in contact with the sample air. The piston has a #8 blind threaded hole in one end that is used to connect the piston to the linear actuator arm. In the expanded position, the cylinder volume in contact with the sample air has a volume of approximately 100 cm3. The piston has a travel distance of 20 cm and stops within 1 mm of the cylinder end. When compressed, the volume of the cylinder and end tube is approximately 2 cm3, giving a compression ratio of approximately 50 : 1. There is additional volume associated with tubing and fittings between the pump and the injection loop, so the actual compression ratio is considerably lower (roughly 10 : 1).
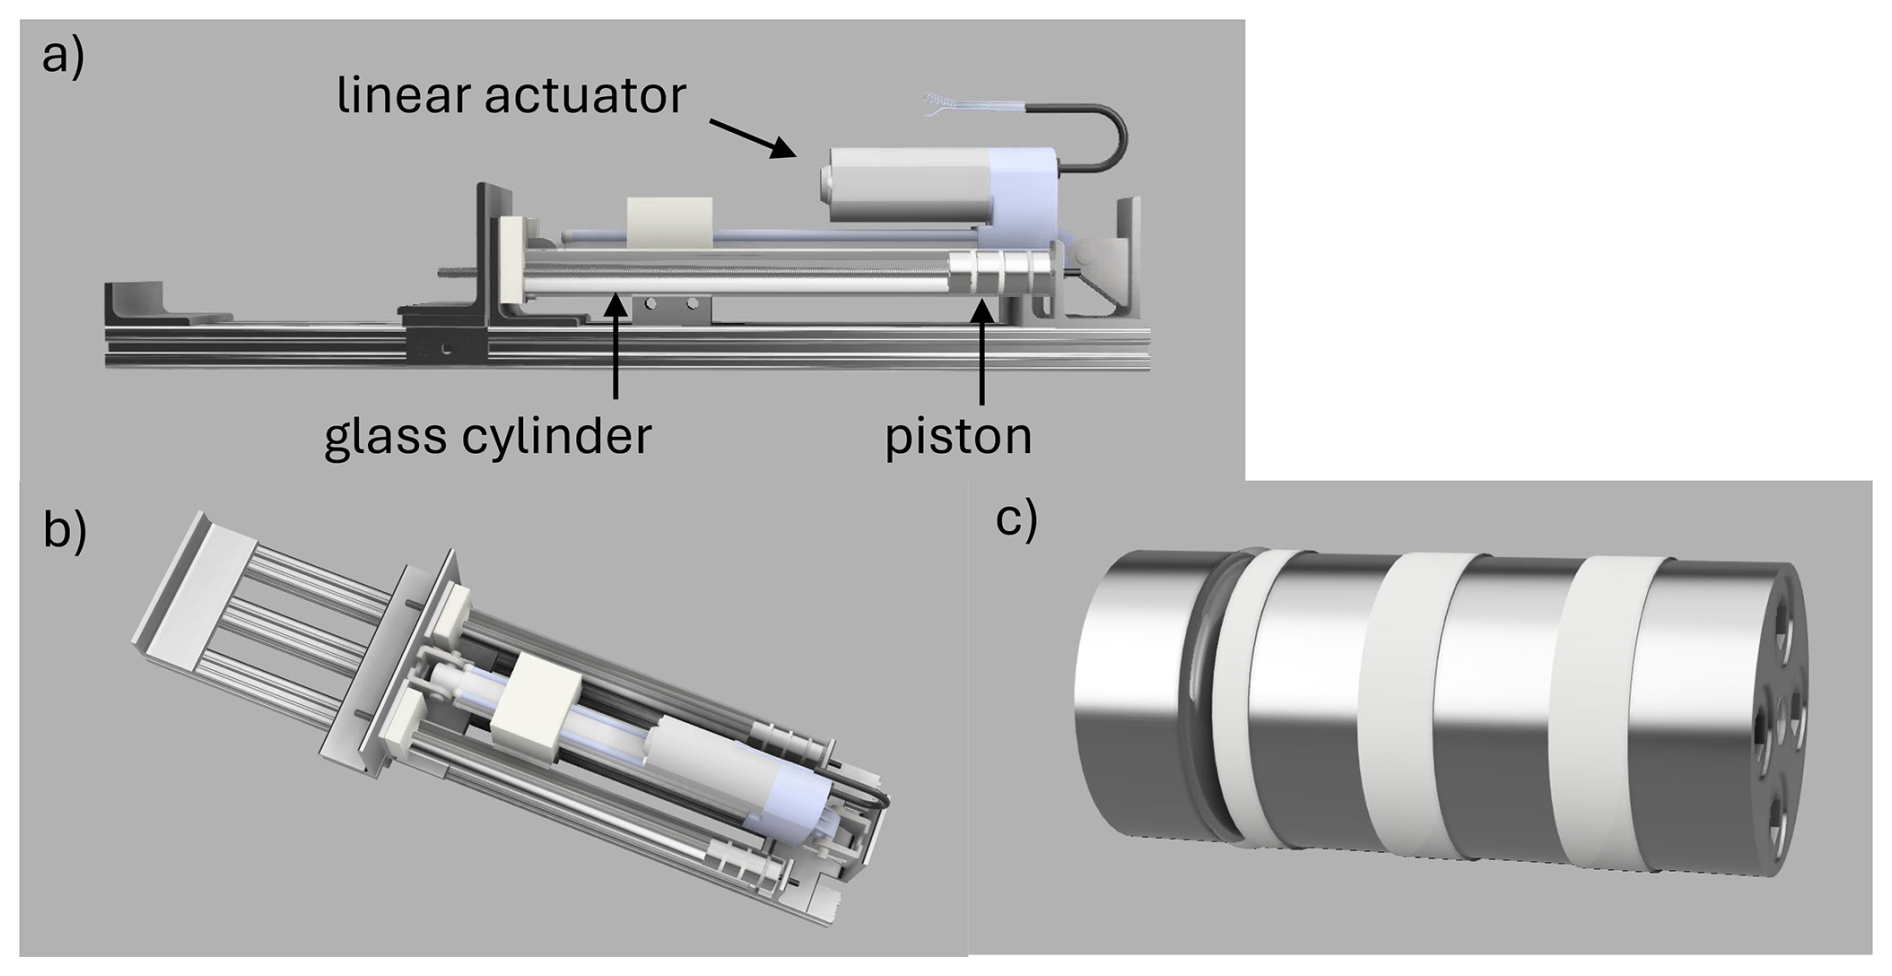
Figure 3Dual cylinder piston pump for gas sample compression: (a) side view, (b) top view, (c) expanded view of piston.
The requirements for the piston seal are: (1) a leakage rate of ambient air into the vacuum system that is small relative to the gas sample, (2) negligible outgassing of detectable H2 or other gases of interest, and (3) reasonably long service lifetime relative to the duration of a field project, and (4) tolerance for temperature variability typically encountered in field conditions.
A Teflon (PFA or FEP) encapsulated Viton A O-ring was used as the piston seal (#210, I.D. 19 mm, cross section 3.5 mm, Row Inc.). Encapsulated O-rings are not typically recommended for use as dynamic piston seals, presumably because of rapid wearing of the sealing surface under the high shear and high temperatures often associated with rapid piston cycling in industrial applications. In this low-speed application wear rates were not a determinative factor. These seals required replacement in the field, most likely from exposure to wide ranging temperatures. In laboratory conditions, the wearing of the encapsulated O-ring became noticeable in the piston “standard” blanks after roughly 600 cycles or about 1–2 months of use. Higher H2 levels in the daily blanks were followed by the replacement of the O-ring. More information about blanks is found in Sect. 3.
Several other types of seals were tested for this application. Stainless-steel spring-energized PTFE seals exhibited excellent mechanical stability but an unacceptably high air leakage rate (McMaster-Carr, 5383N18). Viton O-rings were tested with and without vacuum baking and/or lubrication (Krytox LVP fluorocarbon grease). These maintained an excellent static vacuum seal but exhibited H2 outgassing after exposure to air. This outgassing is associated with movement of the O-ring. It seems likely that the outgassing is related to expulsion of gases trapped in voids in the polymer due to compressive or shear forces during use. This H2 likely originates from chemical reactions in the Viton rather than from permeation of ambient air because the O-ring did not outgas detectable Ne or CH4. Permeation rates of Ne and H2 in Viton are relatively similar due to their similar atomic/molecular size (Brehm et al., 1987). We also tested a lubricating fluorocarbon coating (Cytonix, FluoroSyl 880) deposited from a suspension in methanol onto the glass cylinder inner surface and heat bonded. No combination of seal and lubricant outperformed the Teflon encapsulated Viton O-ring with no lubrication.
The piston pump was driven by an electromechanical linear actuator with DC motor and 20 cm stroke. Feedback between motor and piston is required to maintain a constant piston speed because the pressure differential between pump cylinder and surrounding atmosphere varies dramatically during the analysis. Two commonly used types of sensors were tested for this application: (1) resistance of a 3-wire 10 kΩ potentiometer providing positional feedback (Firgelli FA-PO-150-12V-8) and (2) Hall sensor providing pulses with a frequency proportional to actuator speed (Firgelli F-SD-H-220-12V-8). Both types of feedback were successfully implemented for use in this application. The advantages/disadvantages of the two approaches are discussed briefly below.
The pump operation is controlled by an Arduino Mega 2560 microprocessor operating as a PID (proportional/integral/derivative) controller. The Arduino controller input is obtained from the feedback sensor of the linear actuator. For the positional feedback method, a high precision 5V reference voltage (AD584) was supplied to the potentiometer and to the Arduino analog to digital converter. For the Hall sensor, the pulse edges were detected by an Arduino digital input configured as a software interrupt and the microprocessor clock was used to determine pulse frequency. The linear actuator motor was driven by a pulse width modulated (PWM) Arduino output with the base frequency adjusted to 490 Hz to reduce audible noise. This control signal was applied to a L298N dual H-bridge PWM motor controller to power the DC motor of the linear actuator (BTS7890).
The PID loop is designed to maintain constant piston speed. For the potentiometer equipped actuator, speed is determined from the difference in position between iterations of a software loop. For the Hall sensor, pulse frequency provides a direct measurement of piston speed. The set point for piston speed is nominally 1 stroke per minute or 3.3 mm s−1 and can be varied over a wide range if needed. The control loop typically maintains speed to within a few percent of the set point.
For this project, a dual cylinder piston pump was constructed using a single linear actuator (Fig. 3). In this configuration, retraction of the linear actuator causes compression in both pump cylinders simultaneously. The two cylinders are connected in parallel providing about 200 cm3 of volume for expansion of the air sample. The glass cylinder is mounted securely between two aluminium angles with the open end located in a Delrin block and the inlet/outlet end cushioned by a silicon rubber pad. The pump frame consists of three parallel aluminium t-slot rails spaced 25 mm apart and 60 cm in length (80/20 Inc, 1010). The linear actuator is mounted on the central rail and glass cylinders are mounted on the outboard rails on either side. The linear actuator rod is bolted to an aluminium angle that slides along the outboard t-slot rails on two linear bearings (80/20 Inc., 6425). Stainless-steel threaded rods (1/4-20) couple the two pistons to the sliding aluminium angle. These rods are connected to the pistons using a short length of nylon or PEEK 10-32 threaded rod. The flexibility of the plastic rod allows for minor misalignment between the actuator rod and the cylinder.
During development of the pump, a single cylinder version of the pump was constructed. The linear actuator and cylinder are mounted on a single 1 in. t-slot rail (80/20 Inc, 1010) 60 cm in length, with two pairs of t-slot angles mounted on the sides for mounting and stability. In the single cylinder version, the linear actuator arm is connected directly to the piston and extension of the actuator causes pump compression. The end of the linear actuator rod is drilled and tapped to accept a flexible #8 threaded rod (PEEK or nylon) to couple the rod and piston.
2.4 Gas chromatograph and helium pulsed discharge detector
The field gas chromatograph is an SRI Instruments 8610C equipped with a heated 10 port two position valve (VICI) with a 3 cm3 injection loop. The heated 10 port two position valve and the chromatographic column were heated to 30 °C via the GC. Chromatographic separation was carried out using two stainless-steel HayesSep DB columns packed in our laboratory (3 mm OD, 2.2 mm ID, 5 m long, mesh size 100/120). Ultra-high purity He (99.999 %) carrier gas was passed through getters to remove traces of H2 and other impurities. Three helium gas flows (carrier, backflush, and discharge) were controlled by electronic pressure control (EPC) units on the gas chromatograph. A high-capacity getter (VICI model HP2) was used on the He supply, and three smaller capacity getters (VICI model HPM) were used in the downstream of the three electronic pressure controllers (Fig. 4). Two of the EPCs have flow restrictors downstream that came pre-installed on the 8610C system. The EPCs with flow restrictors were used for the pre-column and the analytical column. He carrier flow was 30 cm3 min−1 with both columns in line. Detection was done using a pulsed discharge detector with a discharge gas flow of 7 cm3 min−1 (He-PDD D2-I, VICI).
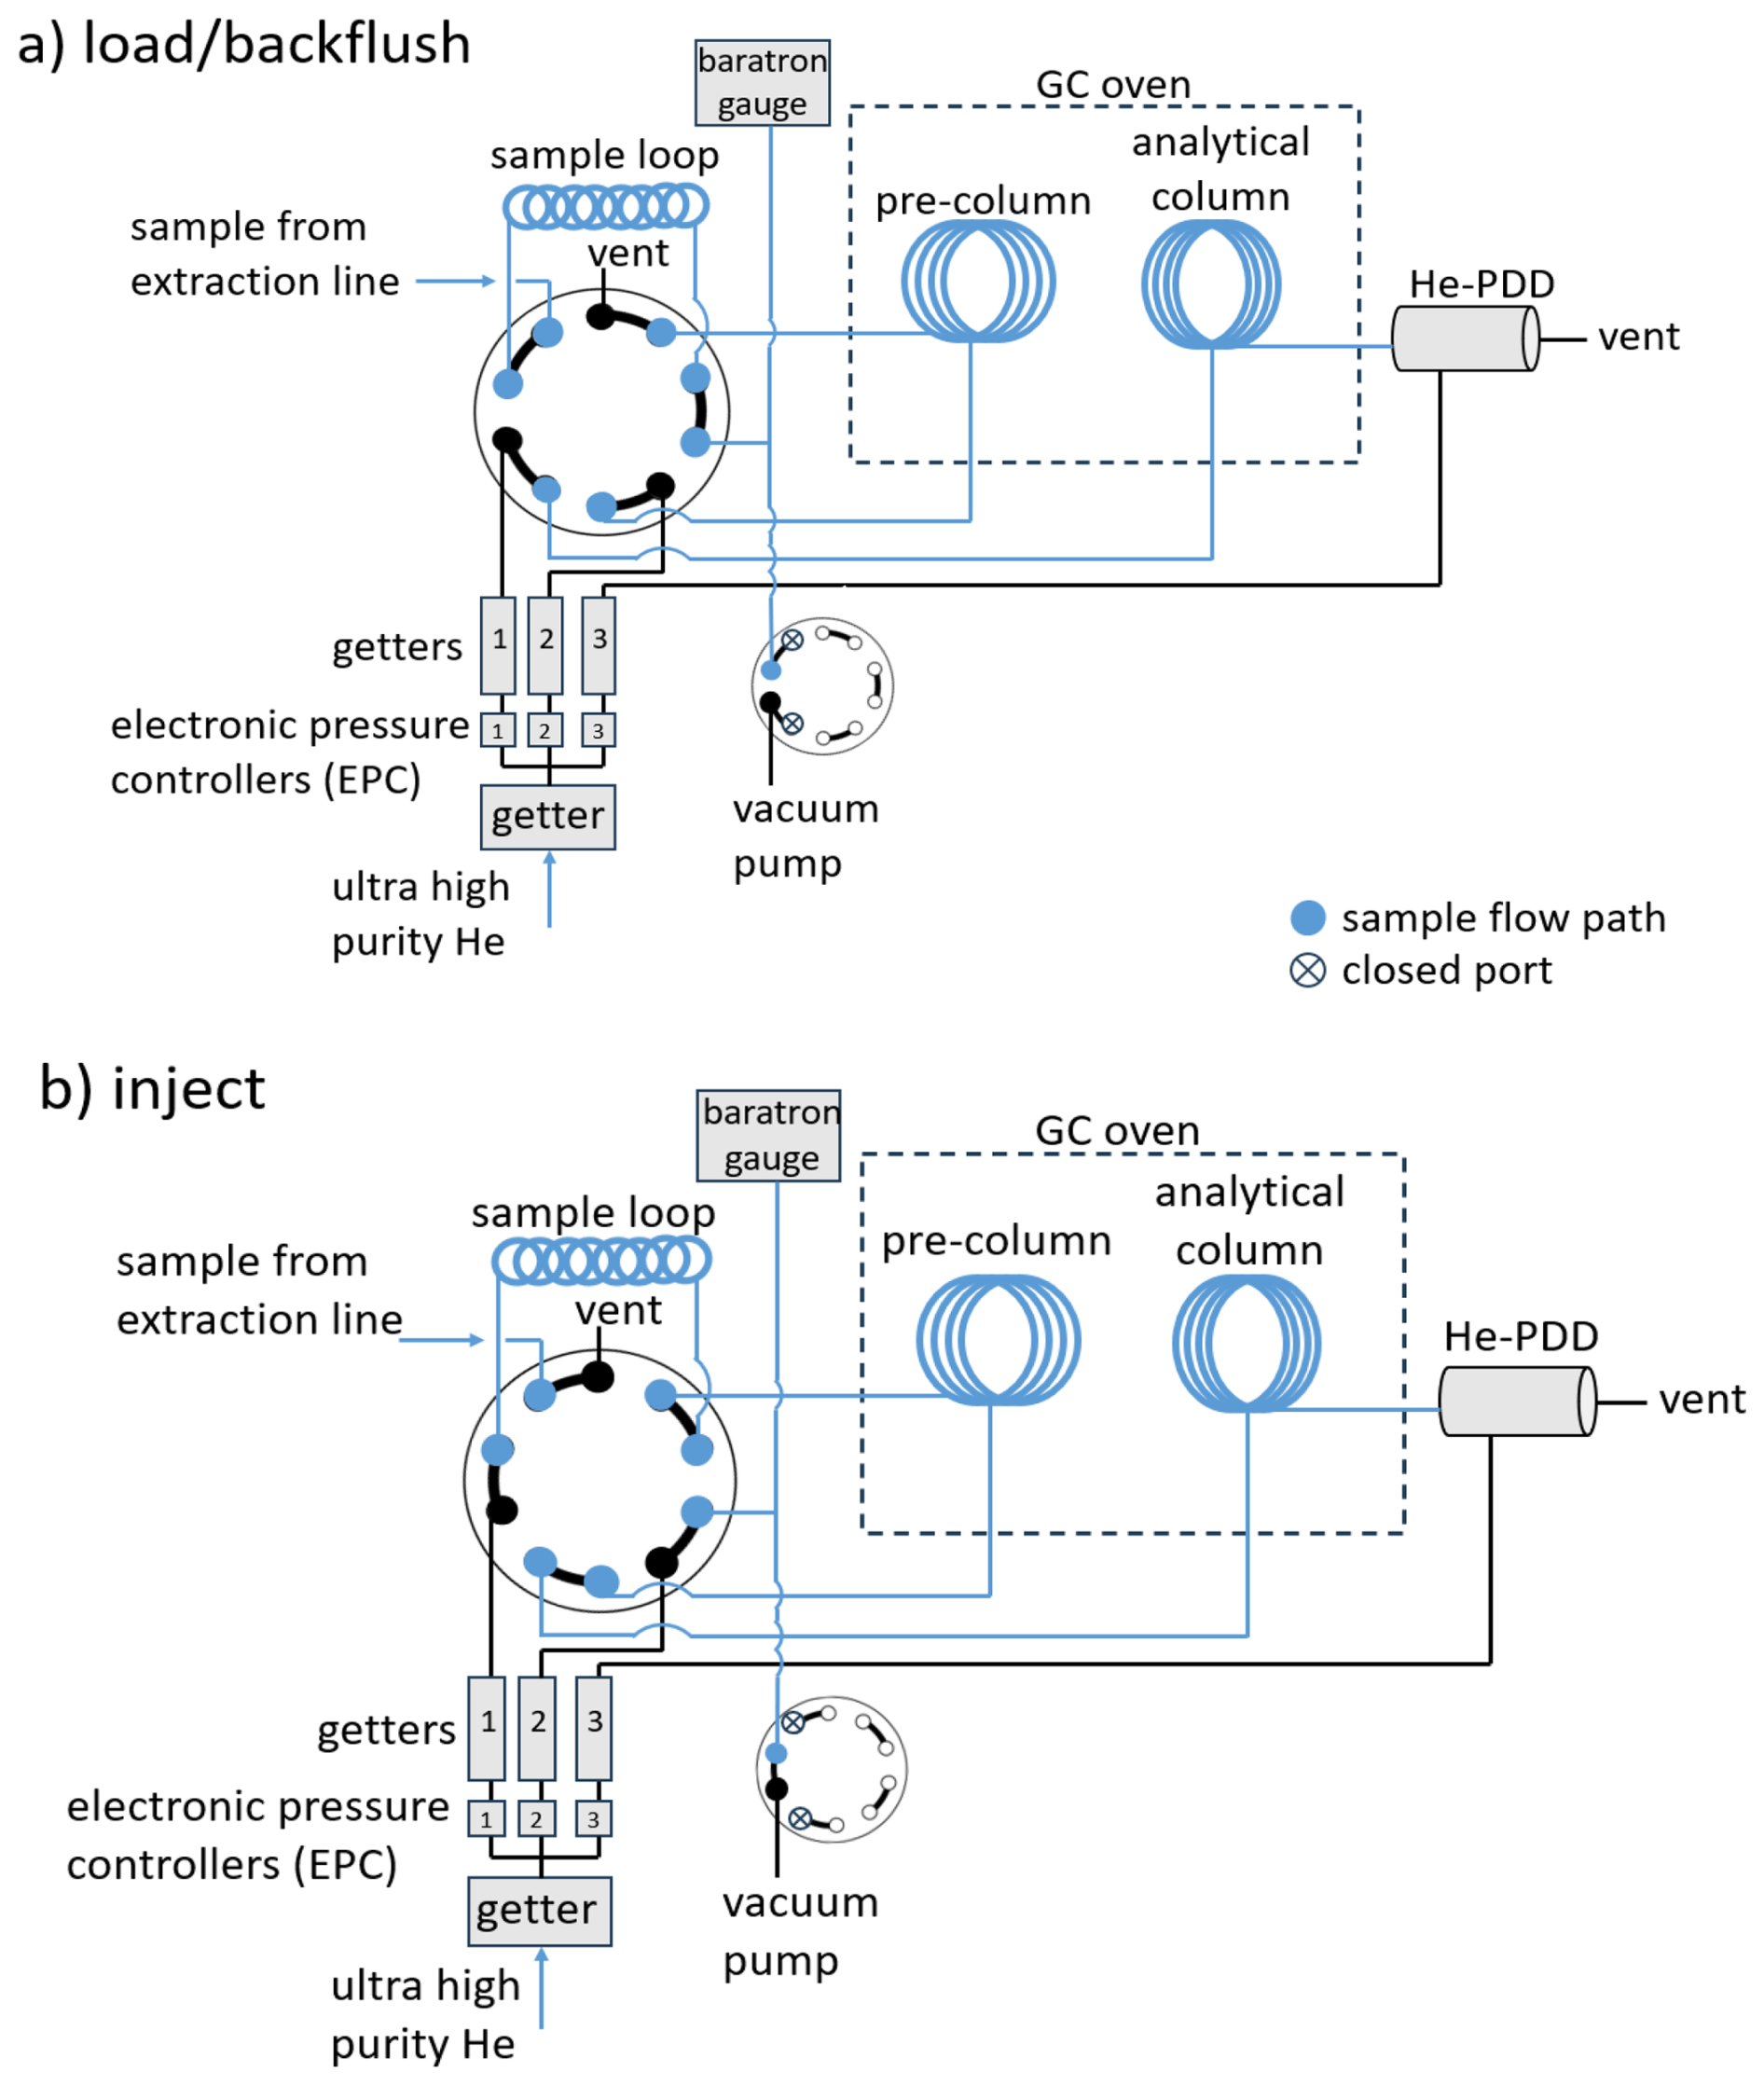
Figure 4Schematic of the gas chromatograph and helium pulsed discharge detector (GC/He-PDD) setup used in the field analysis of H2 and Ne. (a) Set up is shown in the load/backflush position. (b) Set up is shown in the inject position. Circles with the 5 connections represent the 10 port two position VICI valves.
The first chromatographic column is configured as a precolumn that is backflushed midway (2.9 min) through the chromatographic run. This prevented water vapor, CO2, and other high boiling compounds from reaching the main column and the detector. Backflushing of the precolumn was delayed until Ne and H2 were detected to avoid flow-induced disturbances to the baseline. This allowed major constituents from air (O2, N2, Ar) to elute from the precolumn onto the analytical column. Allowing these high abundance gases to reach detector causes contamination that disrupts the detector baseline for several minutes. A second 10 port two position valve (VICI) was used as a detector bypass valve. The detector bypass valve diverts the flow effluent from the analytical column to waste. This valve is actuated for 3.5 min during elution of the major air peaks (minutes 3–6.5 of the run). During this period, the discharge He flow rate is increased to compensate for the diverted column eluent.
A stand-alone He-PDD (VICI model D-3) was mounted on the gas chromatograph with homemade 200V supply. The detector temperature is maintained at 100 °C using a PID controller. The detector signal was amplified by the SRI gas chromatograph electrometer and A/D conversion was done by the data acquisition board in the gas chromatograph (SRI 333 A/D Board). PC-based data acquisition and control was provided using PeakSimple software (SRI). For H2 and most other trace gases, the He-PDD induces photoionization of the analyte with detection of the resulting electrons. A helium plasma is generated in which photons ranging in energy from 13.5 to 17.7 eV are emitted from the transition of diatomic helium He2 (A1 ) to the dissociative 2He (1S1) ground state (Wentworth et al., 1994). This mode of detection results in a sensitive, linear response to H2 over several orders of magnitude, including the range of atmospheric H2 abundance (Novelli et al., 1999). Ne cannot be ionized by this mechanism, as its ionization potential is 21.56 eV, which is above the He plasma photon energy. Instead, Ne is ionized in the He plasma by reaction with the He∗ metastable (19.8 eV). This mechanism of ionization results in a much less sensitive and non-linear response for Ne, compared to that for H2 (and most other gases).
2.5 Calibration
Calibration is based on three high-pressure gas standards (1000 psi) prepared in our laboratory in electropolished stainless-steel cylinders (Swagelok 304L-HDF8-1GAL, 3.8 L). These cylinders contained roughly 350 ppm H2, 18 ppm Ne, 600 ppm CH4, and 5 ppm CO with N2 (99.99 %) as the balance gas. The three high-pressure cylinders were filled prior to the field project and were intercompared prior to shipping, in the field, and after completion of the field work. The high-pressure cylinder standards are prepared by expanding the pure gases (H2, Ne, CH4, CO) from a section of the stainless-steel vacuum line at a known pressure, volume, and temperature into the evacuated stainless-steel cylinder. N2 is then added to the cylinder through a high-pressure transfer line. The added N2 is determined gravimetrically.
The high-pressure standards are intercompared by diluting them into flasks at relatively high concentrations (5 ppm H2, 25 ppb Ne) and analyzing them on the same system. Intercomparison of these standards yielded agreement within ±2 % (1σ) which is consistent with our estimate of the uncertainties in their preparation. The high-pressure gas standards prepared for this study are not intended for multi-year use and have not yet been intercompared with gas standards from other laboratories. Working standards diluted from two of the high-pressure cylinders gave no indication of drift of the high-pressure cylinders over the course of six months (Fig. 5).
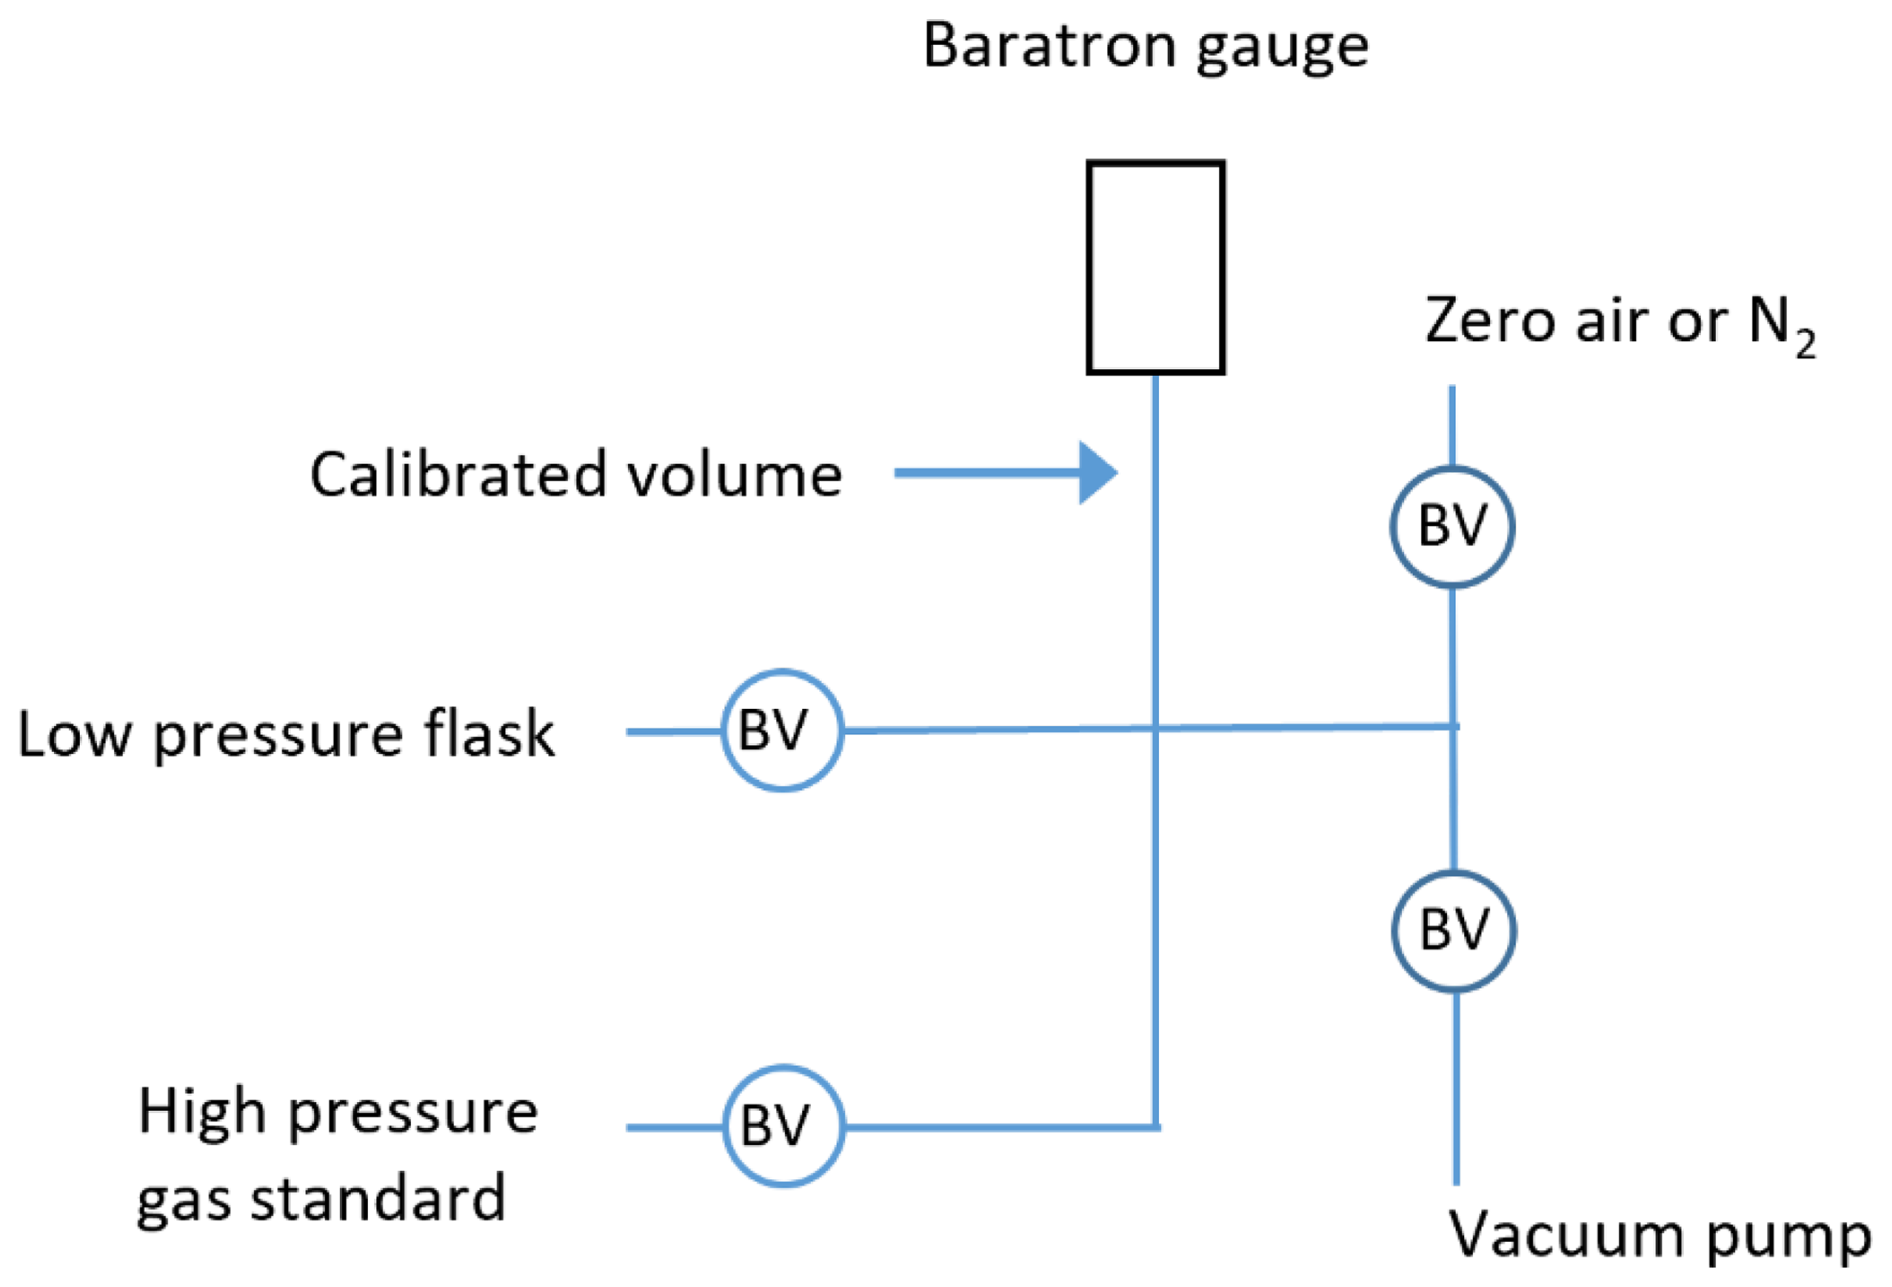
Figure 5Schematic of the dilution system used to produce working standards in the field. The low-pressure flask and high-pressure gas standard are connected to the vacuum line using PFA tubing. The circles marked BV indicate bellows valves.
Working standards are prepared by diluting the high-pressure standard cylinder barometrically into evacuated 2 L electropolished stainless-steel flasks with bellows valves, with N2 as the balance gas. Dilution was done in the field using a simple stainless-steel vacuum line with Swagelok VCR fittings and bellows valves (Swagelok, SS-4BG-V51), a heated Baratron capacitance manometer (MKS Type 631), and an oil-free vacuum pump (ScrollLabs, model SVF-E1-5) (schematic of dilution system found in Fig. 5). Working standards were prepared weekly. The weekly preparation of the working standards ensured that the 2 L flask wouldn't show any H2 drift over the course of the analysis. Prior laboratory measurements showed that the 2 L flasks would drift over the course of 3–4 weeks. Four sets of field working standards were prepared over the course of 1 month. The field working standards contained concentrations ranging from 150 to 500 ppb for H2 and 10 to 25 ppm for Ne. Each day, four different working standards were analyzed. The standards were run in duplicate or triplicate throughout the day for a total of 8–10 working standard runs each day.
2.6 Thermal considerations for field work
One of the challenges for the deployment of the system at Summit, Greenland was the interruption of generator power at night, allowing the laboratory tent cool to ambient temperatures as low as −25 °C. This raised concern about stabilization of the analytical system each day and the potential for leaks due to fluctuating temperatures. To minimize these issues, we constructed a tubular aluminum frame insulation box with insulated sheathing boards, which was placed over the analytical system each night. The insulation box temperature was controlled using an in-line duct fan, temperature sensor, and PID temperature controller set to 20 °C. The analytical system was powered using a 6 kWh lithium battery pack, charged by generators during the day (Goalzero, Yeti 6000X). Gas flows, GC oven temperature, and detector temperature were maintained at the normal operating values overnight. The nighttime power draw was approximately 80 W which provided heating for the insulation box. The in-line fan was activated in order to cool the box if the temperature in the box reached 20 °C, which did occur during the deployment.
The procedure for processing an ice core sample begins by: (1) cutting the sample to length (10 cm for the 70 mm diameter cores used in this study), (2) mechanically scraping the ice with a scalpel to remove exterior contaminants, (3) sealing the sample in the extraction chamber and cycling the chamber through several cycles of flushing with high purity N2 and evacuation to the vapor pressure of the ice (about 1 mbar at −20 °C). The chamber is then sealed, and a warm water bath (40 °C) is raised to immerse most of the chamber. The ice melting process takes 20–30 min, and the warm water bath is removed and replaced with an ice water bath just prior to the melting of the last piece of ice this to limit the amount of water vapor present in the chamber. The extraction line is evacuated and isolated from the vacuum pump, and the air sample is expanded slowly through the Nafion drier and into the line and piston pump in the compressed position. The piston pump is slowly expanded (∼ 1 min), withdrawing the sample from the melt chamber into the piston. The pressure is allowed to stabilize and is recorded. The 3-way valve is then positioned to direct the piston pump contents either to the GC injection valve loop or to a glass flask for storage. The piston pump is then slowly compressed (1 min) and the pressure is again allowed to stabilize and is recorded.
For immediate GC analysis, the loop was then isolated from the piston pump and the injection valve was actuated. Sample pressures in the GC injection loop for the first analysis were typically in the range of 600–750 mbar, with the variability largely due to the amount of ice sample scraped during cleaning. After completion of the chromatographic run, the injection loop was evacuated and flushed with N2, isolated, filled with residual sample from the piston pump, and injected. Sample pressures for the second analysis were typically 20 % lower. The entire chromatographic run takes approximately 10 min (Fig. 6).
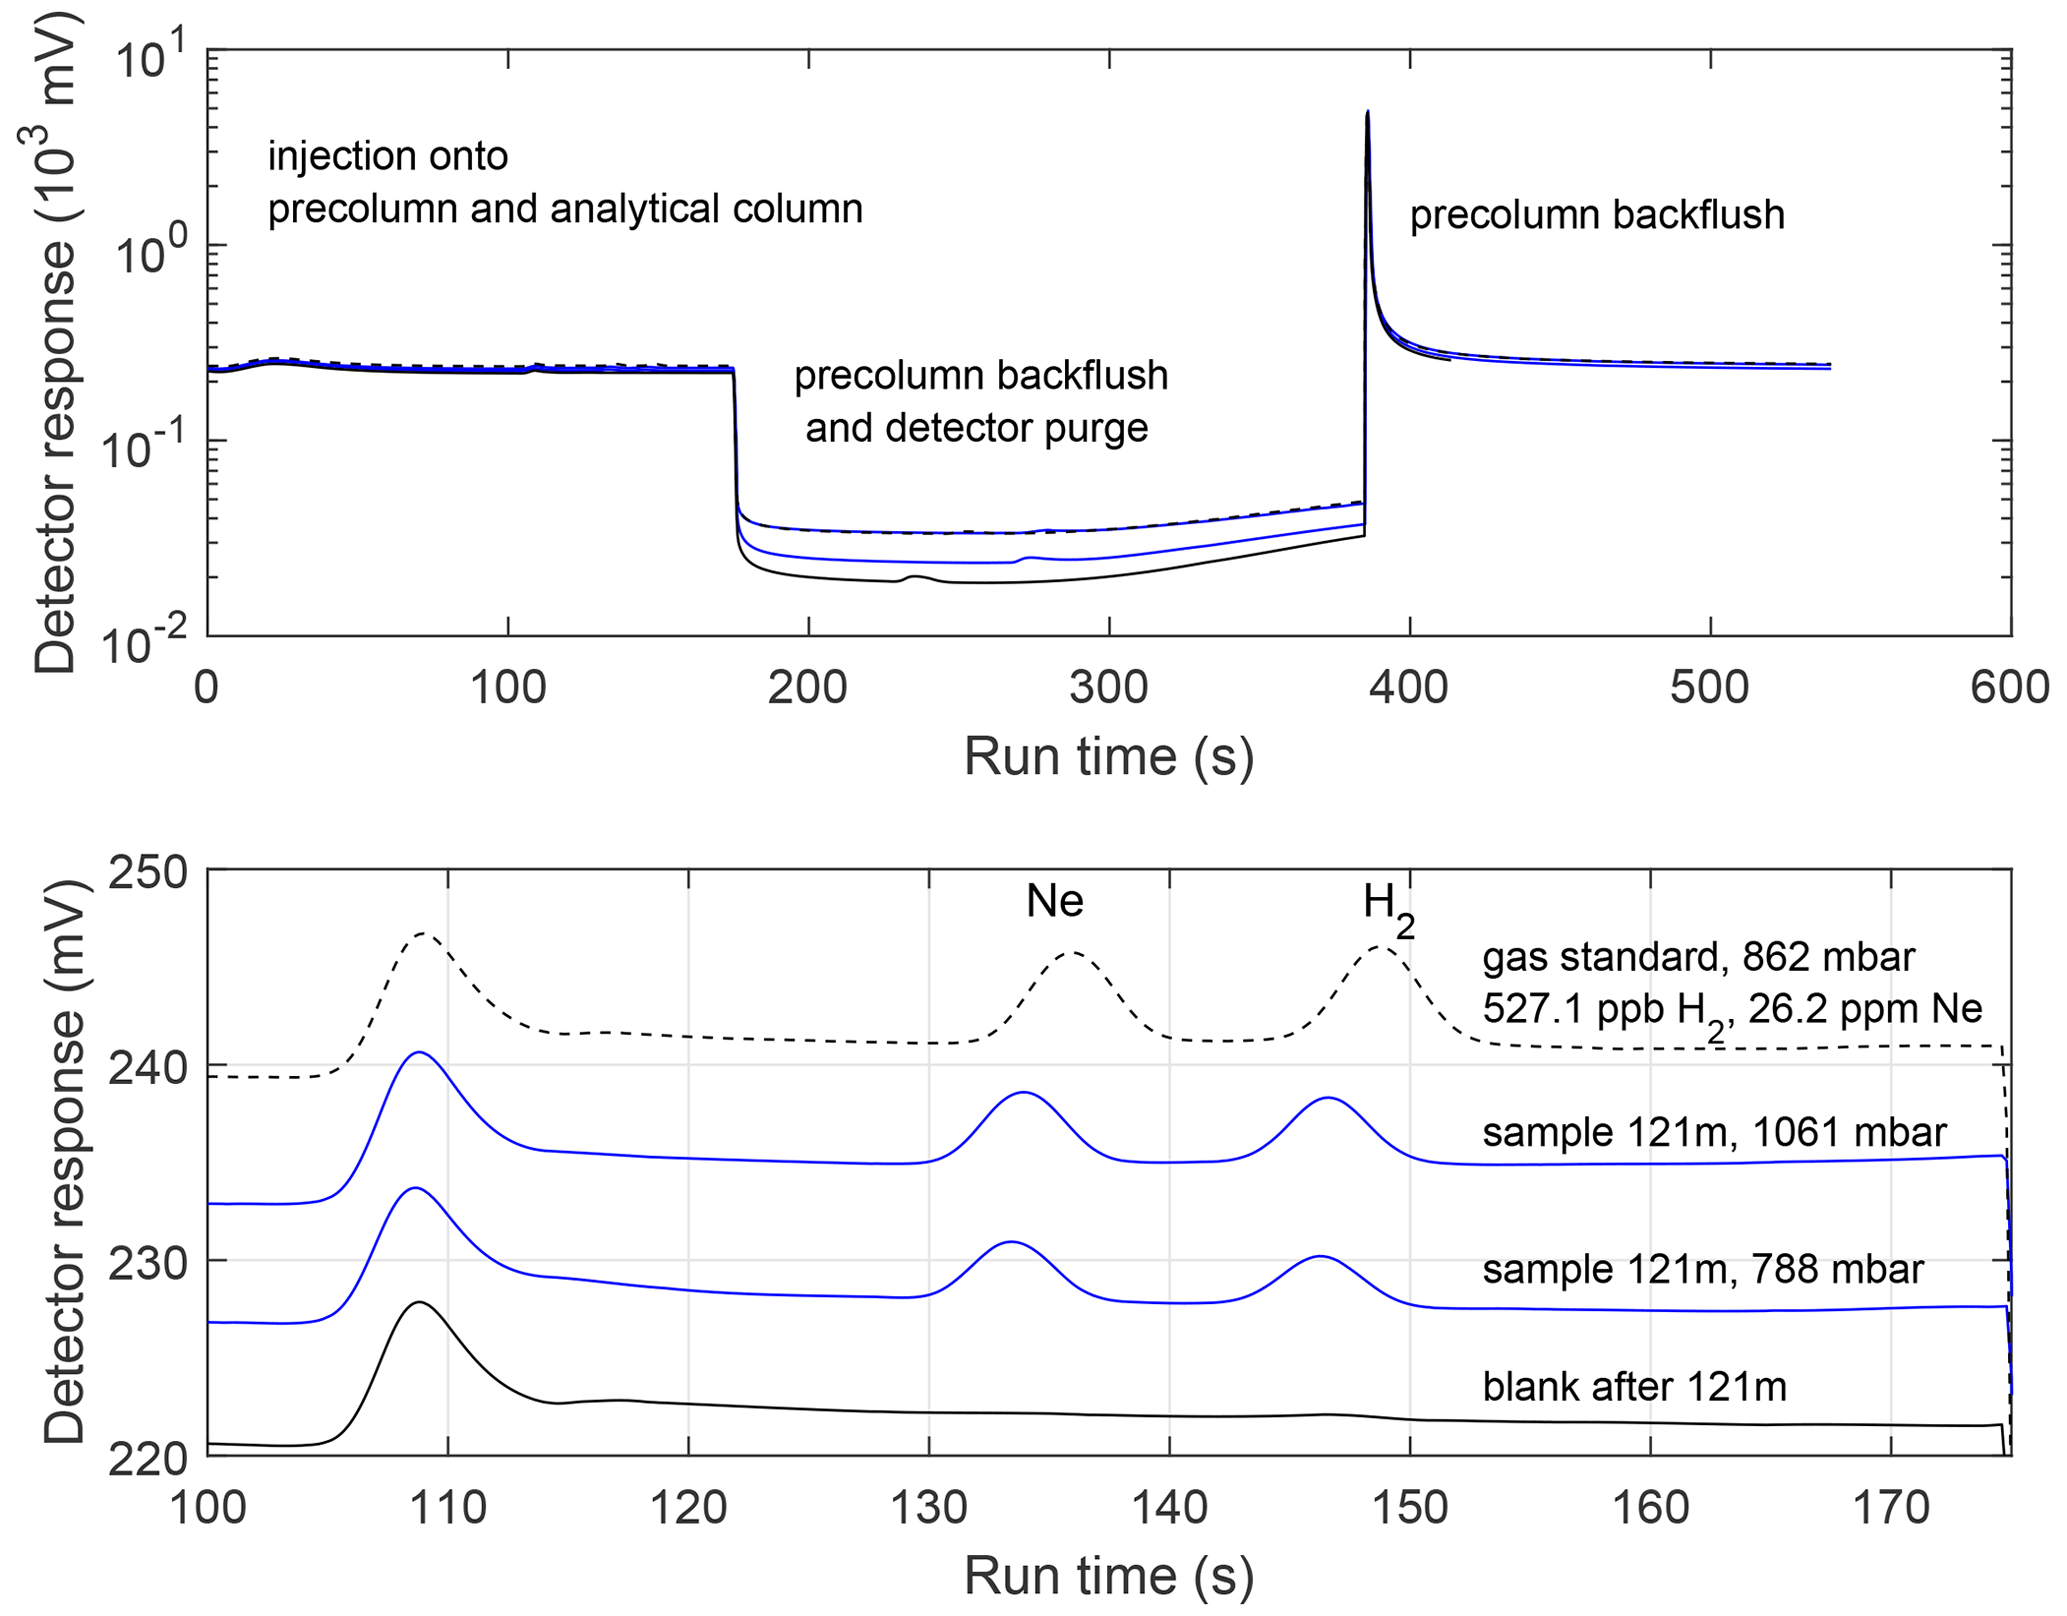
Figure 6Detector signals from analysis of an ice core sample (Summit, Greenland; 121 m depth) and the associated blank and gas standard. Upper: Complete run from the injection, illustrating the timing of the precolumn backflush and detector purge, Lower: Expanded view of the detector signals during elution of Ne and H2. The detector signals are shifted vertically so as not to overlap. The early unlabelled peak is due to a change in flow rate associated with the backflush of the precolumn prior to the injection.
Three types of blanks were assessed during the field expedition. (1) “Pre-run” blanks involved evacuating a frozen ice core sample in the extraction flask, kept cold with a snow-filled dewar. After several flushes, the flask was filled with high-purity N2 and isolated from the vacuum line. The N2 was extracted from the flask and analyzed in the same manner as a sample. (2) “Post-run” blanks were similar, except the high-purity N2 was loaded into a flask containing cold melt water after the sample had been extracted. (3) “Standard” blanks involved loading high-purity N2 directly into the piston-pump. There was not a significant difference between the three types of blanks, suggesting that the blank signal arises primarily from the piston pump itself. The three types of blanks are aggregated to apply a single blank correction to all samples and standards that were exposed to the piston pump. The average blank H2 peak area was 0.96 mV s, and the average Ne blank was 0.43 mV s, compared to typical ice core sample peak areas of 7–17 mV s for H2 and 5–15 mV s for Ne. Qualitatively, blank H2 peaks appeared to be true deviations from the baseline, while the Ne peak area was more typically integration of noise on a sloping baseline (Fig. 6). A recent set of laboratory measurements showed blank variability on the order of 3 % of the typical H2 levels in ice cores. The H2 blanks exhibited temporal variability during the field project that was larger than typically encountered in the laboratory, most likely reflecting the wide variations in temperature (Fig. S1 in the Supplement). We therefore fit a smoothing spline to the blank data, using the Matlab fit function with a smoothing parameter of 10−10. The resulting time-dependent blank correction was applied to all samples and standards.
Daily calibration curves were made for H2 (150–500 ppb) and Ne (10–25 ppm) with loop pressures spanning the range encountered for the ice core samples (400–800 mbar, Fig. 6). Standards were run through the piston pump and were blank-corrected. For H2, a preliminary calibration curve was generated from a linear regression model of the measured peak areas against the product of the gas standard mixing ratio and injection loop pressure (i.e. the partial pressure of H2) using the Matlab function fitlm. Fitting the H2 standards from the entire expedition yields the calibration curve:
with an R2 value of 0.968 (n = 158) where A is integrated peak area (mV s) and is the assigned partial pressure of H2 in the sample loop (mbar) (Fig. 7). In theory, injection loop temperature should also be accounted for in the regression, but including it did not change the regression statistics. The Ne calibration is sensitive to the total loop pressure for reasons that are not well understood but must be related to variations in detector flow rate and the mechanism of ionization (Sect. 2.4). The preliminary calibration relationship for Ne was:
with an R2 value of 0.704 (n = 158), where PLoop is total gas pressure in the sample loop (mbar) and PNe is partial pressure of Ne in the loop (mbar).
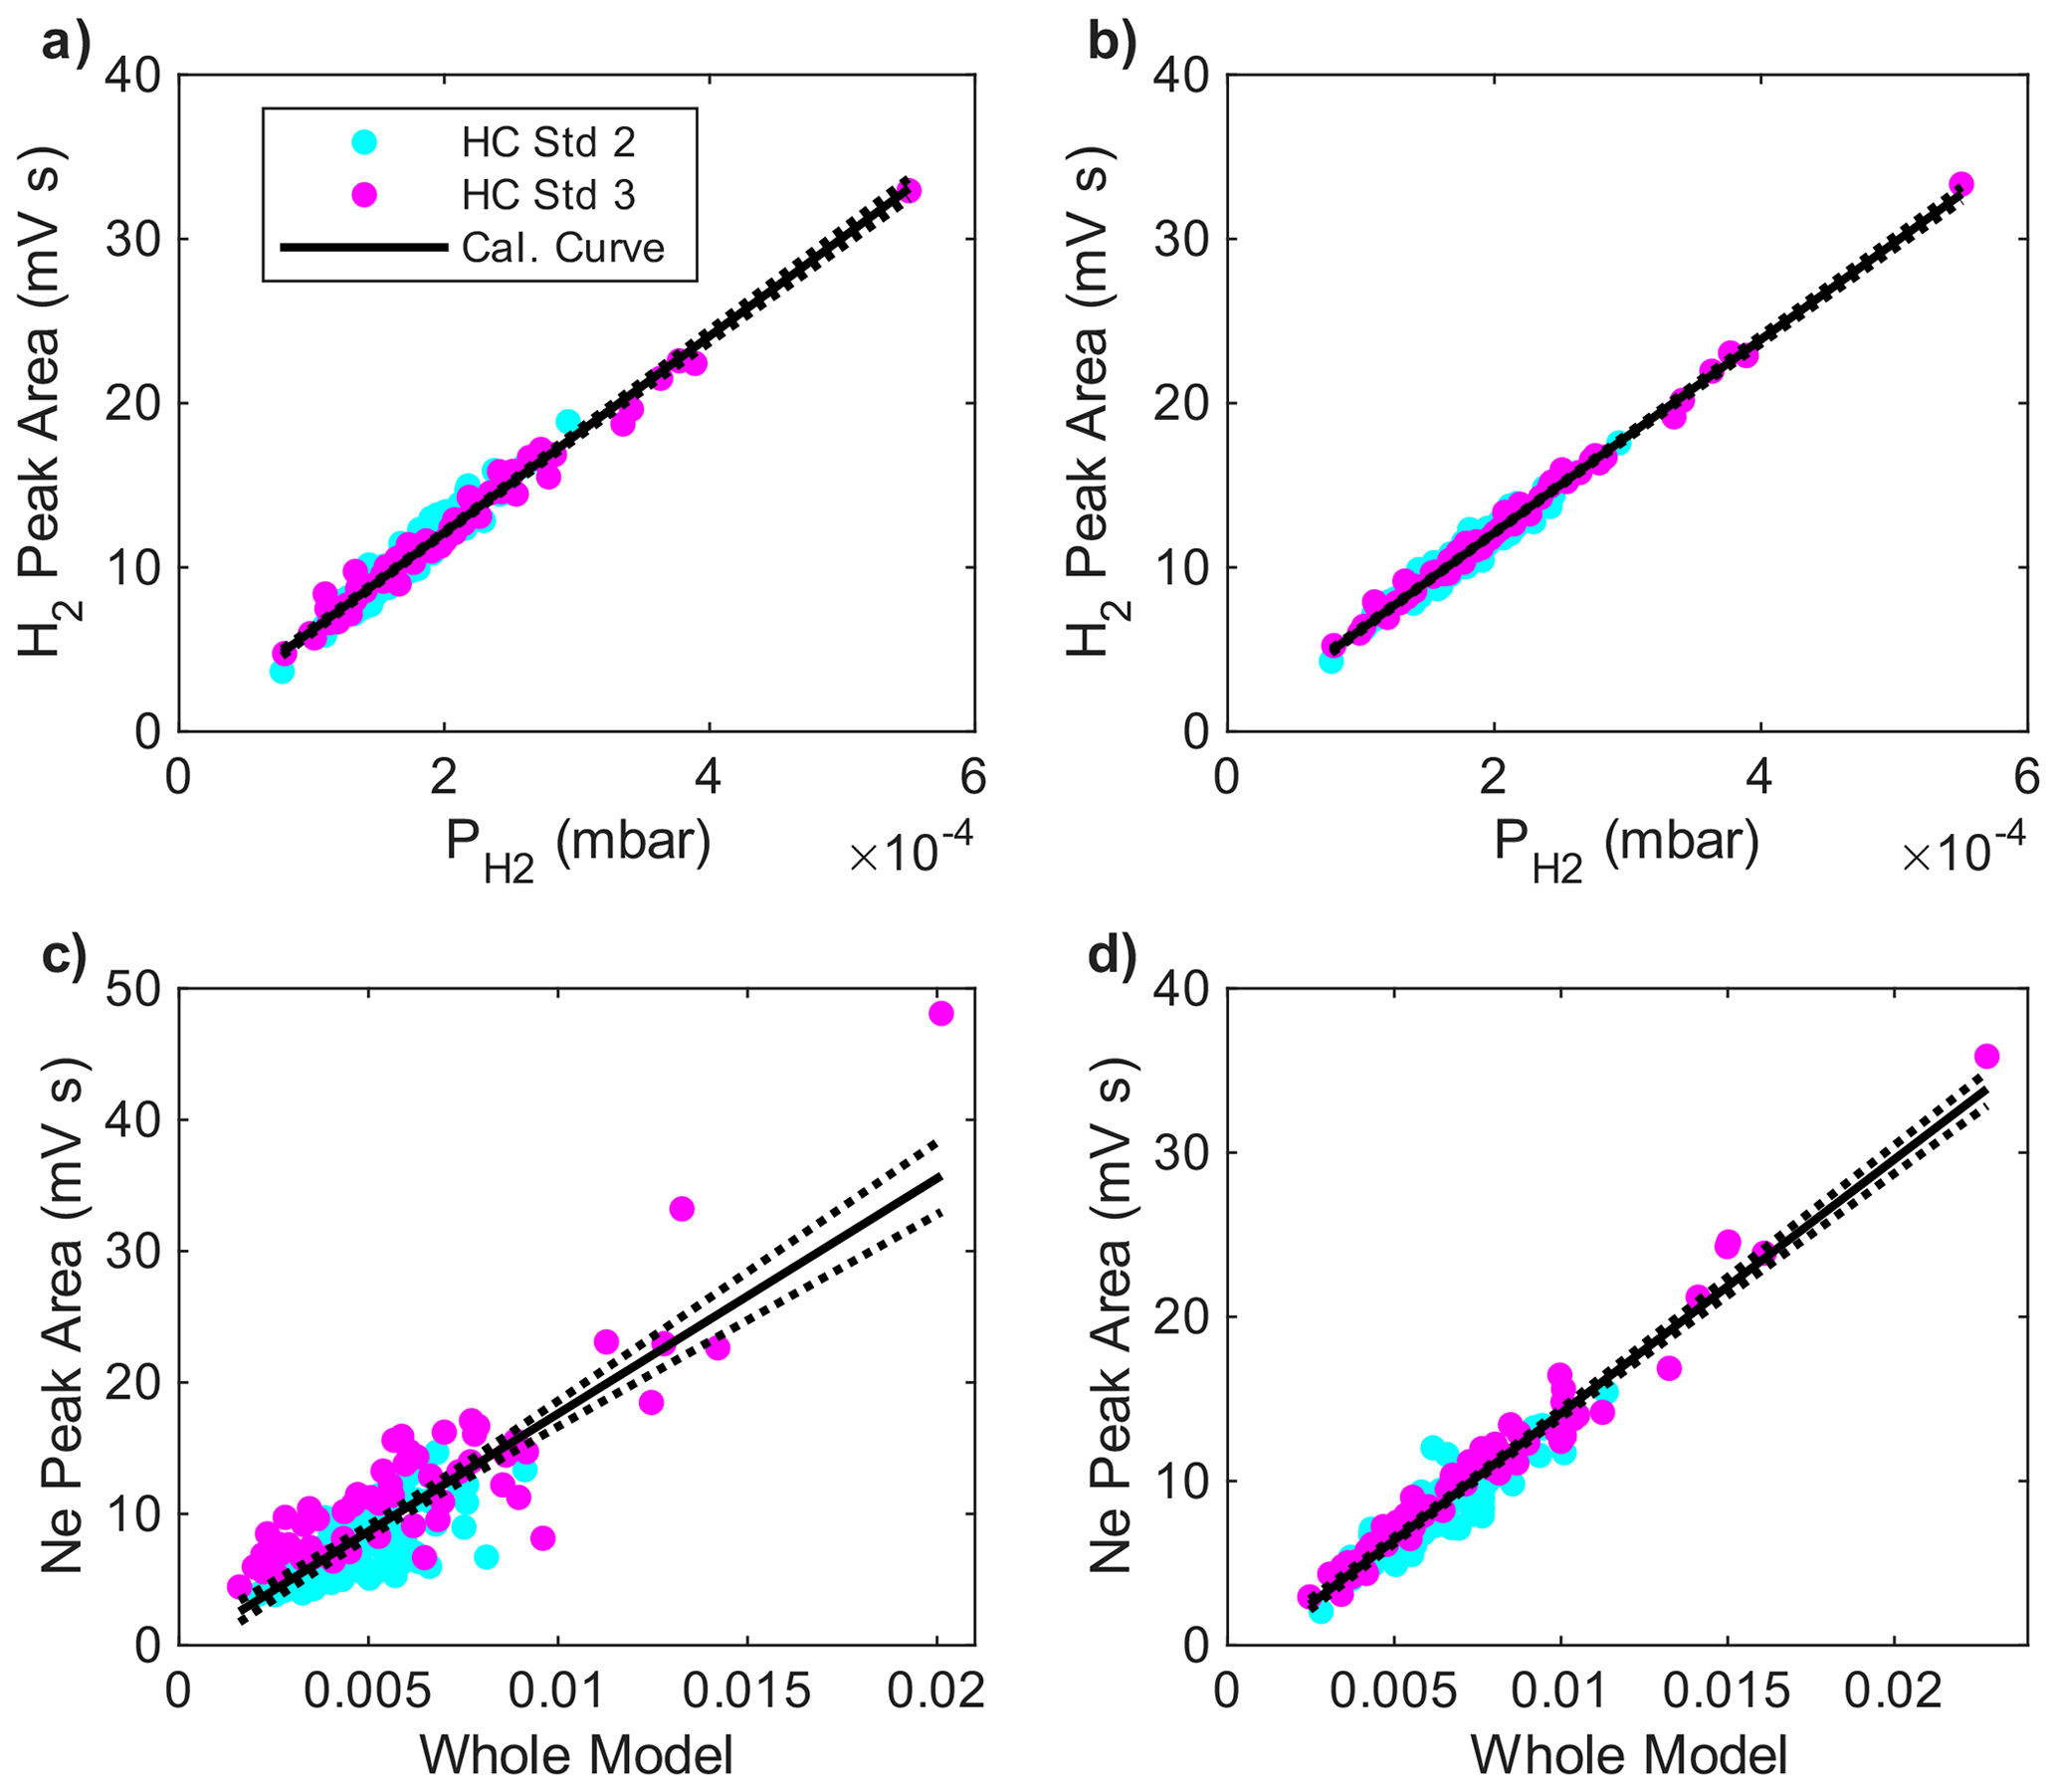
Figure 7Calibration data for H2 (a, b) and Ne (c, d) obtained during the field deployment at Summit, Greenland. Panels (a) and (c) are uncorrected for sensitivity drift. Panels (b) and (d) are after correcting for signal drift. Peak areas are plotted against partial pressure for H2 (a, b) because of the linearity of the calibration. For Ne, peak areas are plotted against the non-linear model described in the text (c, d). Magenta and cyan dots illustrate the comparison between data from two different high-pressure standards. See text for details.
Residuals vary day-to-day, indicating changes in detector response (Fig. S2). Changes in sensitivity were unusually large during this deployment (particularly for Ne), due to the harsh environmental conditions and electronic instability in electronic pressure controller regulating the detector discharge gas flow. The magnitude of the residuals on each day scaled with peak size to some degree. Therefore, for each day, we fit the residuals with the integrated peak area as the independent variable. This daily drift correction was applied to both standards and samples run on the same day, and then the linear regression is run a second time. The drift correction for the H2 calibration is small, yielding a final calibration of:
with the R2 value slightly increasing to 0.985. The correction for Ne is larger, with the corrected regression yielding a final calibration curve of
with the R2 value increasing dramatically to 0.936.
Mixing ratios are assigned by solving the final calibration curves for mixing ratio using the measured loop pressure. Monte Carlo sampling is used to propagate uncertainty in the blank correction, drift correction, and standard mixing ratios. The resulting relative uncertainties in assigned mixing ratios average 8.6 % (1σ) for H2 and 10.2 % for Ne.
The factors limiting system precision are different for H2 versus Ne. The largest source of uncertainty in the H2 measurements is the blank associated with the piston pump, and minor changes in the dynamic seal material or configuration might lead to improvement. The primary source of uncertainty in the Ne measurements is the generally low and non-linear response of the He-PDD detector. The mechanism of detection of Ne in the He-PDD involves reaction with metastable He∗ rather than photoionization (as in the case of H2), as a consequence of the high Ne ionization energy (Sect. 2.4). Alternative detectors are needed for higher precision Ne measurements.
Measurements of 10 ice core samples, made over 7 d, from 135–175 m depth are shown to illustrate the instrument performance under field conditions (Fig. 8). The time scale assigned to these data is roughly 1600–1730 CE, based on dating of previous Summit ice cores. For this segment H2 levels were 249.2 ± 13.6 ppb (1σ). The variability in the data is consistent with the uncertainty in a single measurement, suggesting that atmospheric H2 levels were constant within the measurement uncertainty over this period. For the same ice core samples, Ne levels were 14.8 ± 1.8 ppm. Ne levels in the modern atmosphere are 18.2 ppm. The mean Ne levels in the ice core are significantly lower. This Ne deficit is expected in ice cores, due to the permeation of Ne out of pressurized pores during the firn air close-off process (Patterson et al., 2020; Severinghaus and Battle, 2006). Model calculations suggest that the deficit should be on the order of 3 % and the deficit observed here is significantly larger. These are the first simultaneous observations of ice core H2 and Ne, and this surprising result will be a focus of future study. The variance in the Ne data is consistent with the analytical uncertainty based on the calibration runs.
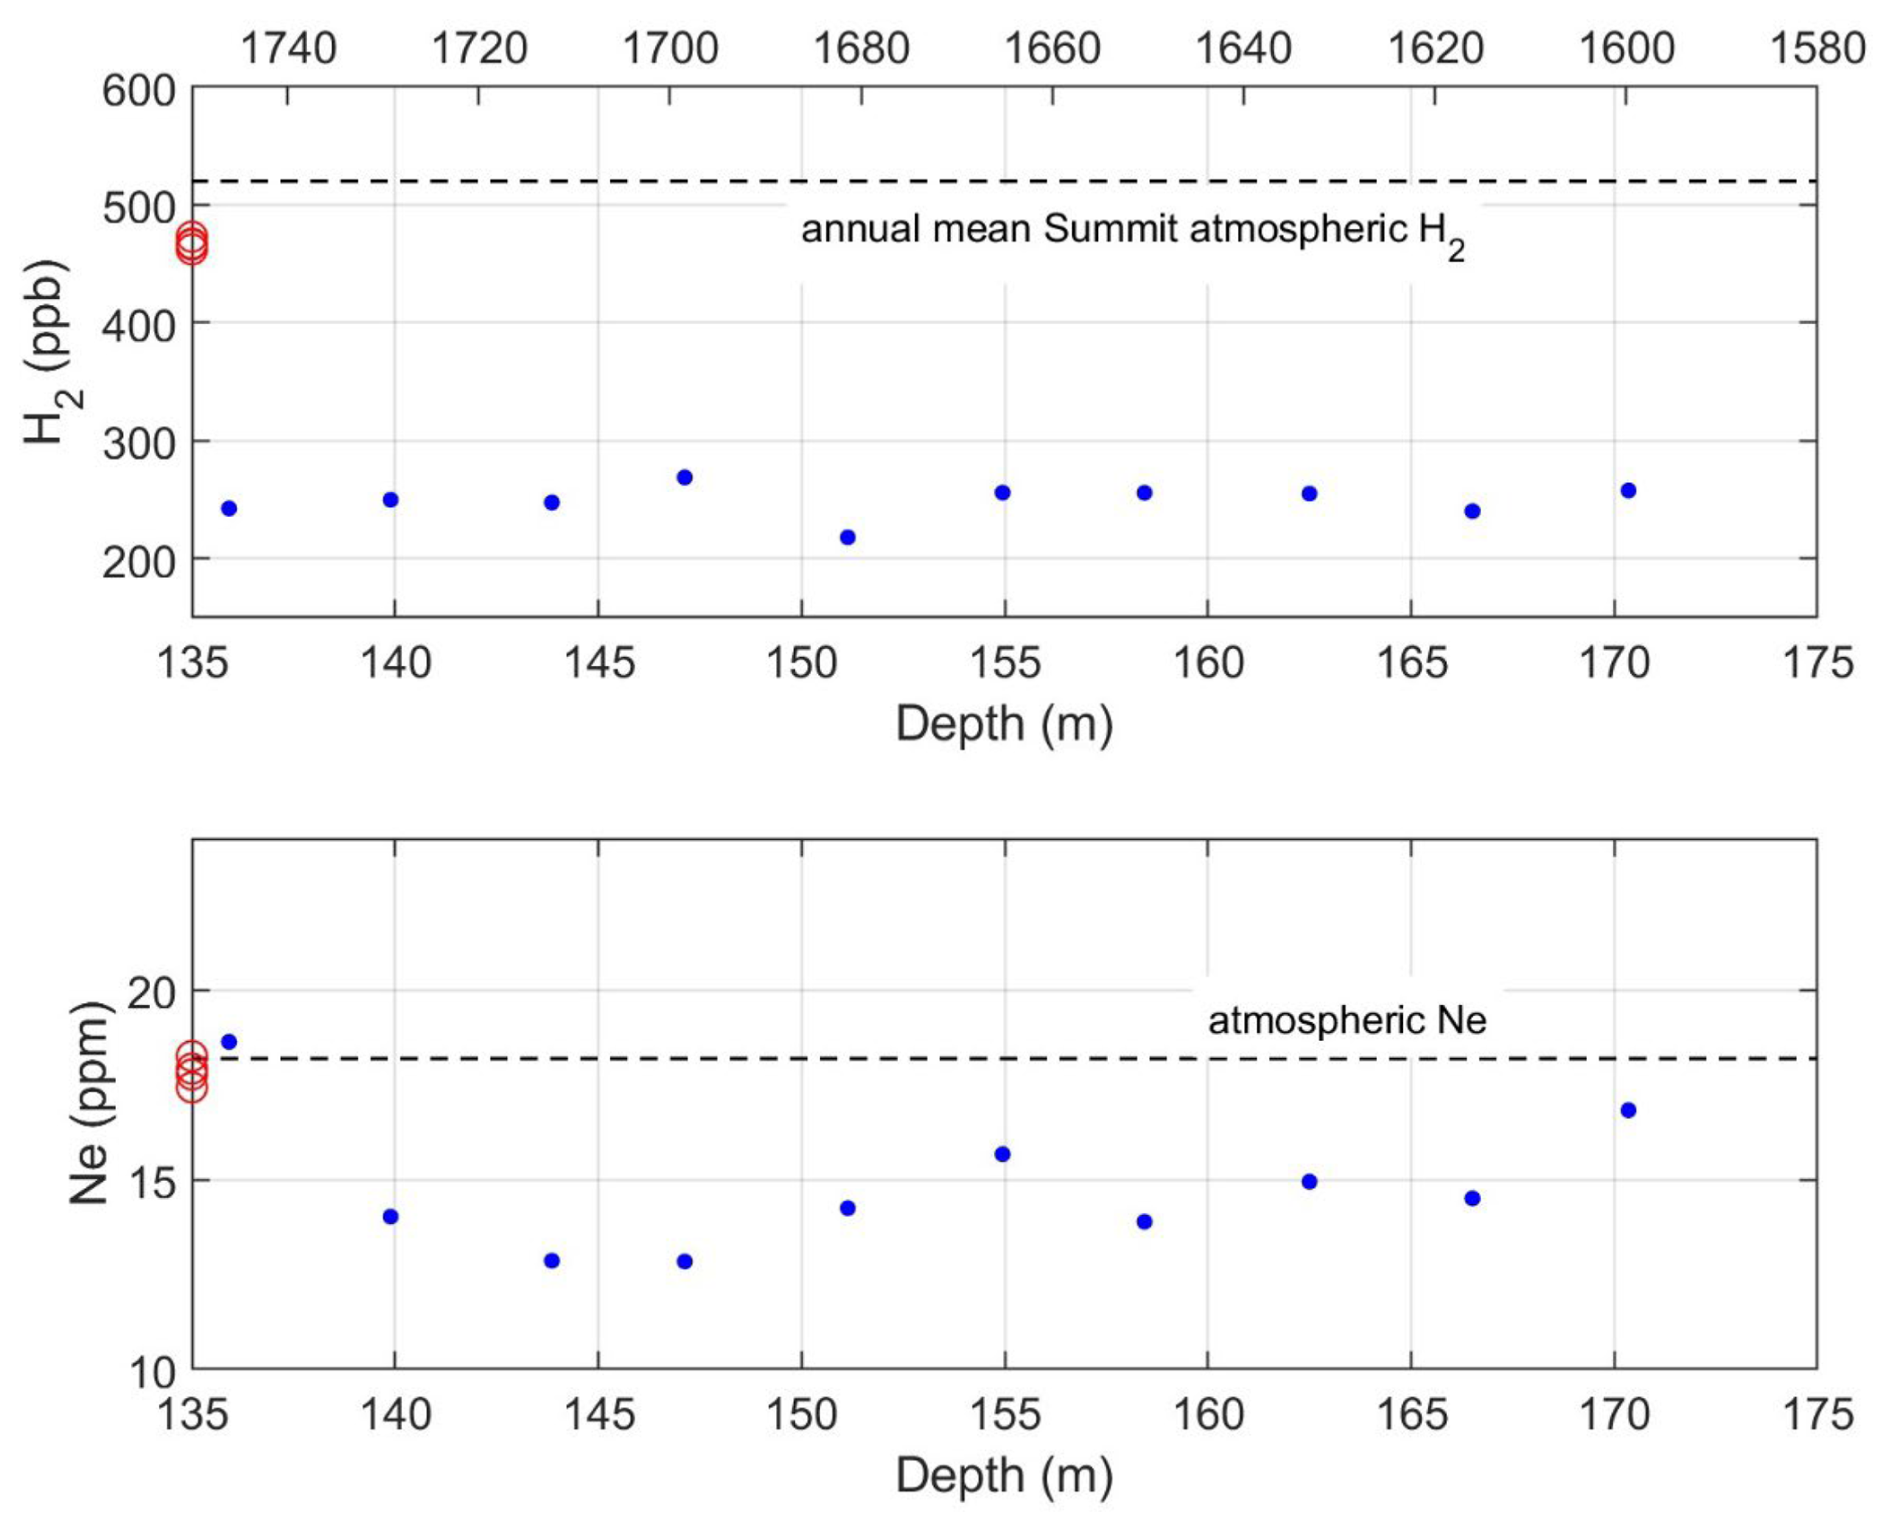
Figure 8Preliminary results from analysis of ice core samples from Summit, Greenland ranging from 135–175 m with approximate gas ages of 295–425 years based on the age depth relationship for previous Summit ice cores (Mitchell et al., 2013; Rhodes et al., 2013). Upper solid blue dots: H2 mixing ratios. The horizontal dashed line indicates annual average atmospheric H2 levels at Summit from 2010–2021 from the NOAA flask network (Pétron et al., 2024). Upper red circles: Atmospheric H2 levels measured in-situ for the field project. Lower solid blue dots: Ne mixing ratios from the same ice core samples. The horizontal dashed line is the average modern atmospheric Ne level. Lower red circles: Atmospheric Ne levels measured in situ for the field project.
To the best of our knowledge, the system described here is the first developed to measure H2 and Ne in polar ice core samples in the field in during ice coring. The system generally performed as intended and the measurements were made successfully. There is a need for further development in terms of the materials used in the piston pump dynamic seal to reduce H2 blanks and extend the working life, and a more sensitive field portable method for detection of Ne. In addition, it would be valuable to develop the capability to store ice core air extracted in the field for subsequent analysis in the laboratory. This would allow sampling on deployments where logistical limitations preclude on-site analysis, and permit higher precision analysis under laboratory conditions using a wider range of analytical instrumentation.
Raw field data from this study is not archived, due to complex processing of data during highly variable conditions. Metadata and final processed data resulting from this field project are available at https://doi.org/10.18739/A2SX64C3X (Patterson et al., 2025). No specialized software code was utilized in this project. Equations described herein were implemented with standard Matlab functions.
The supplement related to this article is available online at https://doi.org/10.5194/amt-18-7865-2025-supplement.
ESS, JDP, MHM designed, constructed and tested the instrumentation. MA drilled and sampled the ice core. JDP conducted the field measurements and analyzed the data. ESS prepared the manuscript with contributions from all authors.
The contact author has declared that none of the authors has any competing interests.
Publisher's note: Copernicus Publications remains neutral with regard to jurisdictional claims made in the text, published maps, institutional affiliations, or any other geographical representation in this paper. While Copernicus Publications makes every effort to include appropriate place names, the final responsibility lies with the authors. Views expressed in the text are those of the authors and do not necessarily reflect the views of the publisher.
The authors with to thank Cyril McCormic for electronic design and troubleshooting. The authors also thank the NSF Ice Drilling Program for their support in the field through NSF Continuing Grant 2318480, field planning support from Batelle, and assistance from the NSF Ice Core Facility. This research was funded by the NSF through grant nos. 1907971 and 224540 and by NOAA through NA23OAR4310139.
This research has been supported by the National Science Foundation (grant nos. 1907971 and 224540) and the National Oceanic and Atmospheric Administration, Climate Program Office (grant no. NA23OAR4310139).
This paper was edited by Mingjin Tang and reviewed by two anonymous referees.
Brehm, K., Ecker, K. H., Kowalewsky, H., and Weise, H. P.: Permeation through elastomeric O-ring seals, IAEA, vol. 2, 359–367, ISBN 92-0-020187-3, 1987.
Derwent, R. G., Stevenson, D. S., Utembe, S. R., Jenkin, M. E., Khan, A. H., and Shallcross, D. E.: Global modelling studies of hydrogen and its isotopomers using STOCHEM-CRI: Likely radiative forcing consequences of a future hydrogen economy, International Journal of Hydrogen Energy, 45, 9211–9221, https://doi.org/10.1016/j.ijhydene.2020.01.125, 2020.
Haan, D.: Teneurs en monoxyde de carbone de l'air contenu dans la glace de l'Antarctique et du Groenland, Universite Joseph Fourier – Grenoble, https://theses.hal.science/tel-00754243v1/document (last access: 15 December 2025), 1996.
Mitchell, L., Brook, E., Lee, J. E., Buizert, C., and Sowers, T.: Constraints on the Late Holocene anthropogenic contribution to the atmospheric methane budget, Science, 33422, 964–966, 2013.
Novelli, P. C., Lang, P. M., Masarie, K. A., Hurst, D. F., Myers, R., and Elkins, J. W.: Molecular hydrogen in the troposphere: Global distribution and budget, Journal of Geophysical Research, 104, 30427–30444, 1999.
Patterson, J. D. and Saltzman, E. S.: Diffusivity and solubility of H2 in ice Ih: Implications for the behavior of H2 in polar ice, Journal of Geophysical Research Atmospheres, 126, 1–14, https://doi.org/10.1029/2020JD033840, 2021.
Patterson, J. D., Aydin, M., Crotwell, A. M., Petron, G., Severinghaus, J. P., and Saltzman, E. S.: Atmospheric history of H2 over the past century reconstructed from South Pole firn air, Geophysical Research Letters, 47, 1–8, https://doi.org/10.1029/2020GL087787, 2020.
Patterson, J. D., Aydin, M., Crotwell, A. M., Pétron, G., and Severinghaus, J. P.: H2 in Antarctic firn air: Atmospheric reconstructions and implications for anthropogenic emissions, Proceedings of the National Academy of Sciences of the United States of America, 118, https://doi.org/10.1073/pnas.2103335118, 2021.
Patterson, J. D., Aydin, M., Crotwell, A. M., Pétron, G., Severinghaus, J. P., Krummel, P. B., Langenfelds, R. L., Petrenko, V. V., and Saltzman, E. S.: Reconstructing atmospheric H2 over the past century from bi-polar firn air records, Clim. Past, 19, 2535–2550, https://doi.org/10.5194/cp-19-2535-2023, 2023.
Patterson, J., Saltzman, E., Aydin, M., and Miranda, M.: Measurements of molecular hydrogen (H2), neon (Ne), and methane (CH4) in a shallow ice core drilled at Summit, Greenland during June and July of 2024, NSF Arctic Data Center [data set], https://doi.org/10.18739/A2SX64C3X, 2025.
Paulot, F., Paynter, D., Naik, V., Malyshev, S., Menzel, R., and Horowitz, L. W.: Global modeling of hydrogen using GFDL-AM4.1: Sensitivity of soil removal and radiative forcing, International Journal of Hydrogen Energy, 46, 13446–13460, https://doi.org/10.1016/j.ijhydene.2021.01.088, 2021.
Pétron, G., Crotwell, A. M., Mund, J., Crotwell, M., Mefford, T., Thoning, K., Hall, B., Kitzis, D., Madronich, M., Moglia, E., Neff, D., Wolter, S., Jordan, A., Krummel, P., Langenfelds, R., and Patterson, J.: Atmospheric H2 observations from the NOAA Cooperative Global Air Sampling Network, Atmos. Meas. Tech., 17, 4803–4823, https://doi.org/10.5194/amt-17-4803-2024, 2024.
Rhodes, R. H., Faïn, X., Stowasser, C., Blunier, T., Chappellaz, J., McConnell, J. R., Romanini, D., Mitchell, L. E., and Brook, E. J.: Continuous methane measurements from a late Holocene Greenland ice core: Atmospheric and in-situ signals, Earth and Planetary Science Letters, 368, 9–19, https://doi.org/10.1016/j.epsl.2013.02.034, 2013.
Severinghaus, J. P. and Battle, M. O.: Fractionation of gases in polar ice during bubble close-off: New constraints from firn air Ne, Kr and Xe observations, Earth and Planetary Science Letters, https://doi.org/10.1016/j.epsl.2006.01.032, 2006.
Warwick, N., Griffiths, P., Keeble, J., Archibald, A., and Pyle, J.: Atmospheric implications of increased Hydrogen use, https://www.gov.uk/government/publications/atmospheric-implications-of-increased-hydrogen-use (last access: 15 December 2025), 2022.
Warwick, N. J., Archibald, A. T., Griffiths, P. T., Keeble, J., O'Connor, F. M., Pyle, J. A., and Shine, K. P.: Atmospheric composition and climate impacts of a future hydrogen economy, Atmos. Chem. Phys., 23, 13451–13467, https://doi.org/10.5194/acp-23-13451-2023, 2023.
Wentworth, W. E., Cai, H., and Stearns, S.: Pulsed discharge helium ionization detector Universal detector for inorganic and organic compounds at the low picogram level, Journal of Chromatography A, 668, 135–152, https://doi.org/10.1016/0021-9673(94)00913-9, 1994.