the Creative Commons Attribution 4.0 License.
the Creative Commons Attribution 4.0 License.
 | 06 Jan 2026
GEMS ozone profile retrieval: impact and validation of version 3.0 improvements
Arno Keppens
Daesung Choi
Sungjae Hong
Cheol-Hee Kim
Hyo-Jung Lee
Wonbae Jeon
Jhoon Kim
Ja-Ho Koo
Joowan Kim
Kanghyun Baek
Xiong Liu
Gonzalo González Abad
Klaus-Peter Heue
Jean-Christopher Lambert
Yeonjin Jung
Hyunkee Hong
Won-Jin Lee
This study presents the first comprehensive description of the operational GEMS (Geostationary Environment Monitoring Spectrometer) ozone profile retrieval algorithm and evaluates the performance of the reprocessed version 3.0 dataset. The retrieval operates in the 310–330 nm spectral range and yields total degrees of freedom for ozone ranging from 1.5 to 3. Although the vertical sensitivity is limited, GEMS achieves an effective vertical resolution of 5–10 km and is capable of separating tropospheric and stratospheric ozone layers. This work highlights significant algorithmic and calibration improvements in version 3.0. Radiometric offsets in irradiance measurements are corrected using a scaling factor derived from the average ratio to a solar reference, while residual wavelength-dependent biases in the normalized radiance are further mitigated through soft calibration. In addition, shift corrections are applied separately to irradiance and radiance wavelengths. As a result, version 3.0 significantly reduces spectral fitting residuals, lowering them from 0.8 % in version 2.0 to 0.2 % under nominal conditions. This improvement also mitigates altitude-dependent oscillating biases observed in the previous version (+40 DU in the troposphere, −20 DU in the stratosphere). The version 3 ozone profiles show agreements within ±10 DU of ozonesonde observations, with a mean bias of −7.7 % in tropospheric ozone columns and within 5 % in the stratosphere. Furthermore, the retrievals capture day-to-day vertical ozone variability, as demonstrated by comparisons with daily ozonesonde launches in February and March 2024. Integrated ozone columns derived from the profiles also show improved consistency with ground-based total ozone measurements, yielding a mean bias of −3.6 DU and outperforming the GEMS operational total column ozone product.
- Article
(4649 KB) - Full-text XML
- Companion paper
-
Supplement
(1291 KB) - BibTeX
- EndNote


Atmospheric ozone is a powerful greenhouse gas and air pollutant, harming human health and ecosystems in the troposphere (Van Dingenen et al., 2009; Isaksen et al., 2009). In the stratosphere, ozone is essential for protecting life on Earth by absorbing harmful ultraviolet (UV) radiation from the Sun (Solomon, 1999). It also plays a key role in maintaining the Earth's radiative balance and stratospheric temperature structure (Monks et al., 2015). Monitoring both layers is vital for understanding pollutant transport, regulating air quality, addressing climate change, and protecting environmental health.
The Geostationary Environmental Monitoring Spectrometer (GEMS) onboard the Korean GEO-KOMPSAT (Geostationary Korea Multi-Purpose Satellite)-2B satellite provides high temporal and spatial resolution data on ozone, its precursors (NO2 and HCHO), SO2, and aerosols over East Asia (Kim et al., 2020). GEMS offers two primary ozone products: total column ozone (O3T) and the full ozone profile (O3P). The O3T product is retrieved using the historical TOMS look-up table algorithm (Kim et al., 2024), while the O3P product provides vertically resolved ozone information across 24 atmospheric layers, retrieved based on an optimal estimation-based inversion framework (Bak et al., 2020). A comprehensive evaluation of GEMS v2.0 O3T product has been conducted by Baek et al. (2023, 2024), assessing its spatial and temporal representativeness on hourly, daily, and seasonal scales through cross-comparisons with ground-based Pandora measurements and independent satellite observations from polar-orbiting platforms. The product revealed strong correlations with Pandora (0.97) and satellite data (0.99), but showed a pronounced seasonal and latitudinal dependence in mean bias, attributed to the absence of a calibration component accounting for the bidirectional transmittance distribution function (BTDF) in irradiance measurements (Kang et al., 2024). A minor update to the look-up table was subsequently implemented, resulting in the release of version 2.1 (Kim et al., 2024). Although the GEMS O3P product has not yet been fully described in peer-reviewed literature, the algorithm implemented for processing version 2.0 closely follows the Smithsonian Astrophysical Observatory (SAO) ozone profile algorithm used for generating the Ozone Monitoring Instrument (OMI) Collection 3 ozone profile research product (Liu et al., 2010). The OMI ozone profile product has demonstrated its reliability in supporting studies of ozone variability driven by the chemical and dynamical processes, quantifying global tropospheric budget of ozone, and evaluating model representation (e.g., Bak et al., 2022; Hayashida et al., 2015; Kuang et al., 2017; Lu et al., 2018). However, the project Product Evaluation of GEMS L2 via Assessment with S5P and Other Sensors (PEGASOS, funded by the European Space Agency) reported the need for improvements prior to scientific use, citing significant altitude-dependent oscillating biases in the GEMS O3P version 2.0 product, with deviations of up to 30 % in the troposphere and from −10 % to −20 % in the stratosphere (https://www.dlr.de/en/eoc/research-transfer/projects-missions/pegasos, last access: 29 October 2025). In addition, the PEGASOS report identified large discrepancies between the GEMS O3P and O3T products. The inconsistencies in ozone profile quality between GEMS and OMI can be attributed to differences in radiometric and wavelength calibration stability, rather than to the retrieval algorithm itself, which shares similar forward and inverse processes.
These findings prompted the development of version 3.0 of the GEMS ozone profile product, which incorporates improvements in spectral and radiometric calibration, including:
-
on-orbit derivation of slit functions,
-
wavelength calibration of both radiance and irradiance spectra,
-
irradiance offset correction to address solar diffuser-induced angular dependence and long-term optical degradation, and
-
soft calibration to correct residual radiometric biases in the normalized radiances.
In addition to these calibration enhancements, the algorithmic updates include modifications to the forward model calculations, fitting parameters, and several auxiliary inputs. This paper is structured around three main objectives. The retrieval algorithm and the updates from version 2.0 to version 3.0 are introduced in the second section. Section 3 focuses on the retrieval characterization and error analysis based on optimal estimation diagnostics. Validation results using independent reference datasets are discussed in Sect. 4. The final section concludes this paper with remarks for future updates.
2.1 GEMS operations
GEMS is an ultraviolet-visible imaging spectrograph equipped with a single two-dimensional charge-coupled device (CCD) detector array, with one dimension for the 1033 wavelengths and the other for the 2048 spatial pixels (Lee et al., 2024). It measures solar irradiance once each night and Earth's backscattered radiance hourly from 07:45 to 16:45 Korea Standard Time (KST), covering the spectral range from 300 to 500 nm with a spectral resolution of approximately 0.6 nm full width at half maximum (FWHM). A shared optical path is used for both radiance and irradiance measurements, except for the dedicated solar diffusers, which operate on different duty cycles (daily and semiannually) to manage sunlight intensity and prevent detector saturation. In GEMS, spatial pixels represent fixed ground-based observation points on Earth, aligned in the north-south direction, as viewed from geostationary orbit, covering latitudes from 5° S to 45° N. These spatial pixels correspond to the “cross-track pixels” in polar-orbiting satellites, which are aligned across the flight path. For Earth observation, GEMS scans an east-west swath from 75 to 145° E in approximately 700 mirror steps (scan lines) in full-scan mode and 350 mirror steps in half-scan mode. Four scan modes – Half East (HE), Half Korea (HK), Full Central (FC), and Full West (FW) – are operated sequentially, with their spatial extents shown in Fig. 1 and the detailed schedule summarized in Tables S1 and S2 in the Supplement. Currently, the Version 2 irradiance and Version 1.2.4 radiance products are used as the standard Level 1C inputs for subsequent Level 2 processing. Neither product has been reprocessed since the initial on-orbit testing; the official data period began on 1 November 2020. To enhance computational efficiency and improve the signal-to-noise ratio, Level 1C and selected Level 2 products (e.g., cloud, surface reflectance, total ozone) are also available with spatial binning at 2 × 2 or 4 × 4 pixels. The ozone profile retrieval specifically utilizes 4 × 4 binned data, resulting in a 512 × 175 frame dataset.
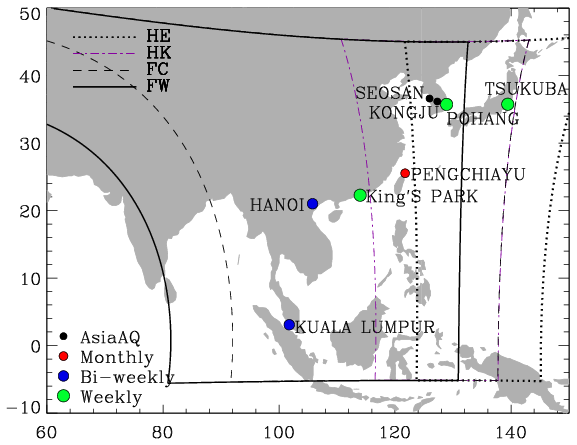
Figure 1Geographic coverage of the four GEMS scan modes: Half East (HE), Half Korea (HK), Full Central (FC), and Full West (FW), indicated by the curved boundaries. Colored dots indicate ozonesonde stations with regular launches within the GEMS domain, classified by launch frequency: red for monthly, blue for bi-weekly, and green for weekly. Black dots represent additional sites that participated during the Asia-AQ campaign.
2.2 Algorithm Heritage
The heritage of the ozone profile retrieval algorithm is rooted in long-standing efforts to develop, improve, and validate ozone profile retrievals from spaceborne instruments such as the Global Ozone Monitoring Experiment (GOME), the OMI, the Ozone Mapping and Profiler Suite (OMPS), and the Tropospheric Monitoring Instrument (TROPOMI) (Bak et al., 2017, 2024, 2025a; Cai et al., 2012; Liu et al., 2005, 2010; Zhao et al., 2021). The optimal estimation technique (Rodgers, 2000) provides the theoretical foundation for solving the inverse problem, enabling the transformation of spectral measurements into geophysical quantities. The retrieval process iteratively adjusts the atmospheric state vector to minimize a cost function that accounts for both the mismatch between simulated and measured spectra and the deviation from the a priori constraints. This optimization critically depends on stable wavelength and radiometric calibration, as well as an accurate radiative transfer model, to ensure robust spectral fitting and reliable results. Algorithmic updates from the OMI Collection 4 research product (Bak et al. 2024) were incorporated into the development of the GEMS Version 3.0 ozone profile product. In addition, new calibration methodologies were implemented for GEMS L1C radiance and irradiance to ensure spectral fitting stability and improve retrieval accuracy. The following sections provide a detailed description of the inversion framework and its implementation.
2.3 Optimal Estimation
The Optimal Estimation-based inversion (Rodgers, 2000) is physically regularized toward minimizing the difference between a measured spectrum Y and a spectrum that is simulated by the forward model F(X). Given an atmospheric state X, the inversion is constrained by the measurement error covariance matrix Sy and statistically regularized by an a priori state vector Xa with a priori covariance matrix Sa. The cost function (chi-square) and the updated equation for the posterior state vector X at iteration step i+1 are written as
and
where each component of the matrix K is the derivative of the forward model to the actual atmospheric state, called the Jacobians or weighting function matrix.
The posterior error covariance matrix, quantifying the total uncertainty in the retrieved state , is given by:
The retrieval gain matrix G, representing the sensitivity of the retrieval to the measurements, can be written as:
The product of G and K then yields the averaging kernel matrix A, which characterizes the sensitivity of the retrieved state to the true atmospheric state:
Beyond information content analysis, the matrices G and A also govern the retrieval error characteristics. Accordingly, can be expressed as:
which represents a weighted combination of the true atmospheric state and a priori information, and adds the measurement noise. The retrieval uncertainty due to measurement noise is quantified by propagating σy from the measurement space into the state space through the gain matrix G, resulting into the measurement error covariance matrix:
Meanwhile, the smoothing error covariance matrix, representing the retrieval uncertainty caused by limited vertical information, is defined as:
These two contributions then add up to the total error covariance as given in Eq. (3), or .
2.4 Implementation details and algorithm updates
The state vector X includes 24 partial ozone columns, surface albedo (0th and 1st order wavelength terms), cloud fraction, and six additional calibration parameters (see Table S3). The measurement vector Y consists of the logarithms of the sun-normalized radiance spectra, which enhances retrieval stability by reducing the sensitivity to absolute radiance errors and Fraunhofer lines. Measurement errors (σy) are assumed to be mutually uncorrelated. Since the GEMS L1C product does not provide measurement error estimates, a constant relative error of 0.2 % is uniformly applied across the spectral range. Accordingly, the measurement error covariance matrix is defined as:
Correlations between ozone layers are accounted for in the a priori error covariance matrix using a correlation length L of 6 km, defined as:
where and are the a priori errors of the ith and jth components of the state vector, respectively. The updates from GEMS v2.0 to v3.0 mirror those from OMI Collection 3 to Collection 4 (Bak et al., 2024). In particular, the radiative transfer model is replaced with the PCA-VLIDORT v2.8 (Bak et al., 2021) to enhance the simulation efficiency. A look-up table correction was also implemented to account for approximations in the radiative transfer calculation related to the number of streams, coarse vertical layering, and polarization treatment. The TSIS-1 Hybrid Solar Reference Spectrum (Coddington et al., 2021) is now used instead of the solar reference from Chance and Kurucz (2010). The ozone cross-section has been switched from BDM 1995 (Brion et al., 1993; Daumont et al., 1992; Malicet et al., 1995) to BW 2018 (Birk and Wagner, 2018). Notably, the a priori ozone profile, based on the tropopause-based ozone climatology (Bak et al., 2013), has been consistently used in GEMS v2.0, GEMS v3.0, and OMI Collection 4. The temperature data are necessary to account for the temperature dependence of the ozone cross-section, while surface and tropopause pressures are used to define the 25-level pressure grids (Fig. S1). The tropopause pressure is also used to convert the a priori ozone profile from a tropopause-based to a surface-based vertical coordinate system. For meteorological inputs, the Global Forecast System (GFS) of a National Centers for Environmental Prediction (NCEP) weather forecast model is used in the daytime processing (DRPO) mode. GFS data are downloaded daily at 05:00 KST, covering forecast periods between 06:00 and 18:00 KST, with lead times of 12 to 21 h. In the reprocessing (RPRO) mode, the meteorological input is switched to the NCEP FNL (Final) Operational Global Analysis data. The meteorological fields, provided at 3 h intervals (GFS) or 6 h intervals (FNL) per day, are interpolated to match the GEMS reference time.
2.5 Calibration methodologies
The calibration process consists of several key components: on-orbit slit function derivation and wavelength calibration to ensure spectral accuracy (Sect. 2.5.1), as well as irradiance offset correction and soft calibration to reduce radiometric uncertainties (Sect. 2.5.2).
2.5.1 Spectral correction
The instrument spectral response function (ISRF), or slit function is required to degrade high-resolution spectra (e.g., absorption cross-sections) to match the spectral resolution of GEMS. Pre-flight ISRFs, measured at six discrete wavelengths and interpolated across all 1033 wavelength grids, are available (Kang et al., 2022). However, our companion study (Bak et al., 2025b) proposes an on-orbit slit function derivation for GEMS based on a super-Gaussian model to account for temporal variations in the instrument response, and therefore the details are not repeated here. That study also indicated that the irradiance spectrum requires a 0.055 nm wavelength shift to align with the Fraunhofer lines. In most GEMS Level 2 trace gas algorithms, the irradiance-derived shift is applied directly to the radiance spectra, under the assumption that the spectral shifts in radiance and irradiance are similar. However, as shown in Fig. 2, substantial discrepancies are evident in both the magnitude and spatial pattern of the spectral shift between radiance and irradiance, ranging from 0.02 to 0.04 nm, with larger differences toward the northern edge of the spatial domain. Additionally, as degradation progresses, pixel-to-pixel perturbations increase toward the central spatial pixels in both radiance and irradiance measurements. Therefore, independent shift correction is implemented to radiance and irradiance. To ensure computational efficiency, the radiance shift is determined from the first mirror step and applied uniformly along the scan direction, based on the observation that spectral shifts in the radiance data remain relatively consistent across mirror steps.
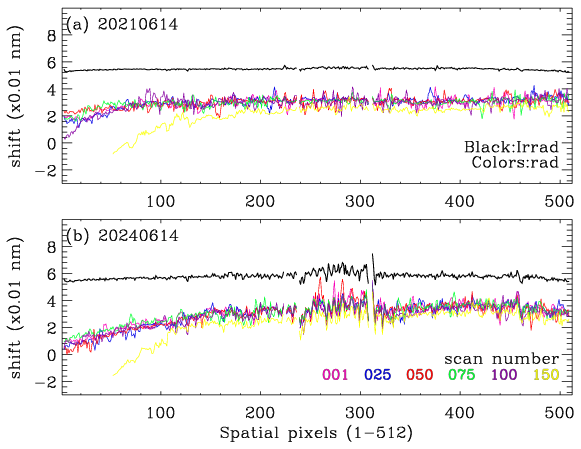
Figure 2Shifts of irradiance and radiance relative to the solar reference from Coddington et al. (2021), shown as a function of spatial pixel number (1–512) for (a) 14 June 2021 and (b) 14 June 2024. Colored lines represent scan lines (mirror steps) plotted at 25-intervals, ranging from 1 to 150.
2.5.2 Radiometric correction
The GEMS irradiance is spatially and seasonally biased due to a missing calibration component for the BTDF, which defines how light transmits through a diffuser based on incident and outgoing angles – a well-known issue (Kang et al. 2024). Additionally, our companion study (Bak et al., 2025b) identified progressive radiometric degradation, resulting in an annual irradiance decrease of ∼ 5 % in the shorter UV range. Because normalized radiance is used in spectral fitting, such irradiance biases can directly propagate into retrieval output. To address these discrepancies, a major revision was implemented in version 3. Specifically, a correction factor was introduced to compensate for the systematic difference between the GEMS irradiance (Im) and a high-resolution solar reference spectrum (Iref). This correction factor (C) is derived by minimizing the following cost function:
where: S: instrument spectral response function (ISRF), convolution operator, λ: wavelength shift, : coefficients of a third-order baseline polynomial centered at .
In this approach, the slit function parameters and the wavelength shift are first determined independently and then held fixed, allowing the solar reference spectrum to be adjusted to the measured irradiance in terms of spectral resolution and spectral alignment. The scaling factor C and the baseline polynomial Pb are subsequently fitted to capture remaining radiometric differences. As presented in Fig. 3, the derived values of C exhibit significant seasonal and spatial variations in irradiance offset related to angular dependence, along with a gradual temporal decline attributable to optical degradation, most prominently at the middle spatial pixels. In version 3, only the scaling factor C is applied in the irradiance correction, by dividing the irradiance by C. This decision was made because applying the baseline polynomial Pb directly to the irradiance introduced artificial structures into the spectral fitting of the normalized radiance, resulting in a significant underestimation of stratospheric ozone retrievals. Residual wavelength-dependent uncertainties are instead addressed through the soft calibration process, which has been newly implemented in version 3. This empirical correction eliminates systematic biases in the normalized radiance by applying adjustment factors derived from the ratio of measurements to simulated spectra based on accurate forward model calculations. The ozone profile input for the forward model calculation is constructed using daily zonal mean Microwave Limb Sounder (MLS) data (Livesey et al., 2022) above 215 hPa and climatological profiles (McPeters and Labow, 2012) below that level, with the integrated total column adjusted to match the zonal mean total ozone from daily OMPS measurements (Jaross, 2017). A one-week set of clear sky measurements, collected at 02:45 UTC between 11 and 17 July 2021, is used to derive the soft calibration spectra as a function of the 512 spatial pixels. While a cloud fraction threshold of 0.2 is typically used to define clear-sky conditions, we relaxed this criterion to 0.4 due to the known overestimation in the GEMS cloud product, which is also affected by irradiance offsets. Figure 4 illustrates the derived soft spectra and the impact of applying the irradiance correction. After correction, the soft calibration spectra show significantly reduced biases and improved spatial consistency. The residual biases are generally positive and remain below 3 % for most pixels, except for a few central pixels that exhibit negative values, possibly due to unflagged dead pixels in the GEMS L1C data. In contrast, without the correction, substantial wavelength-and spatially dependent biases are evident, with systematic biases ranging from 3 % to 10 % in the shorter UV range. Moreover, the standard deviation of the residual spectra stays below 1 % for spatial pixels numbered above 400, while it increases to above 3 % for pixels below 100 without correction. With correction applied, this increase is limited to 2 %. Figure 5 demonstrates the resulting improvement in spectral fitting accuracy achieved through the application of both radiometric (scaling correction to irradiance and soft calibration to normalized radiance) and wavelength calibration in version 3, compared to version 2. With these corrections, mean fitting residuals decreased from approximately 0.8 % in v2.0 to 0.2 % in v3.0 across most spatial pixels, representing more than a fourfold enhancement in retrieval precision. Version 3.0 not only reduces the mean fitting residuals but also achieves substantial improvements in seasonal stability, spatial uniformity, and the removal of systematic and random artifacts, – highlighting the enhanced calibration and retrieval procedures.
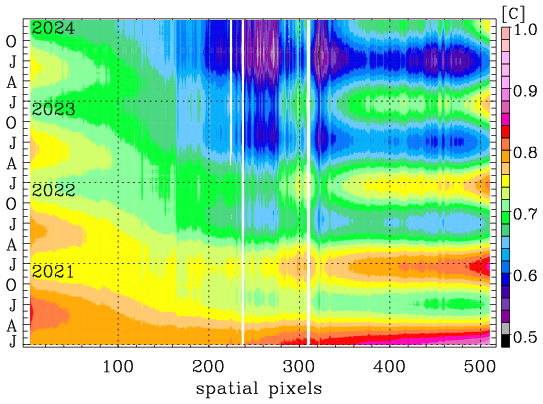
Figure 3Time–space distribution of the derived correction factor C across 512 spatial pixels from January 2021 to December 2024. The factor C, fitted over the 310–330 nm spectral window, represents the ratio of GEMS irradiance to a high-resolution solar reference spectrum.
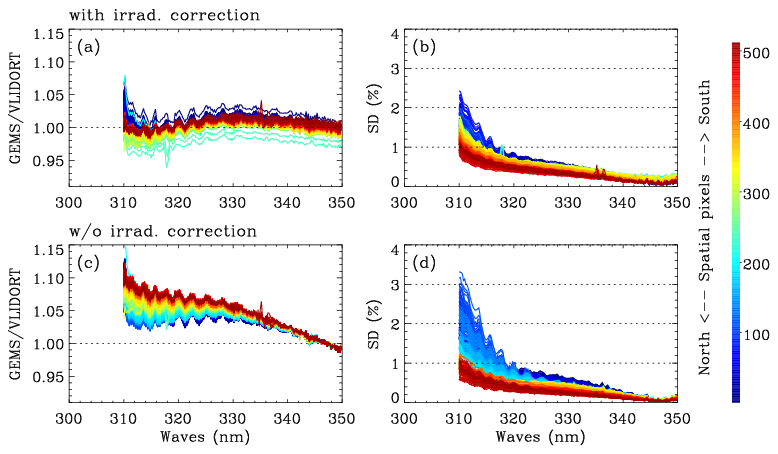
Figure 4GEMS soft spectrum, derived as the mean difference between measured and simulated normalized radiances, as a function of wavelength (300–350 nm) for each of the 512 spatial pixels (color-coded from north to south), with the standard deviation of the mean difference. The upper panels (a, b) include the scaling correction for the irradiance offset, while the bottom panels (c, d) do not.
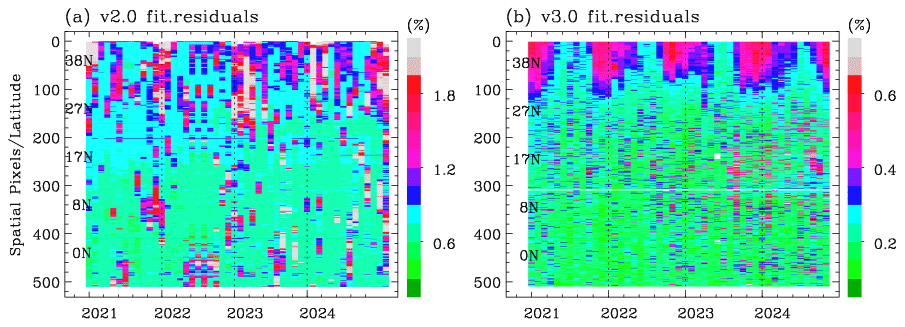
Figure 5Comparison of spectral fitting quality from ozone profile retrievals between versions 2.0 and 3.0, averaged over the first 20 scanlines and shown as a function of the 512 spatial pixels. The evaluation is performed on the 15th day of each month from 2021 to 2024 (04:45 UTC). Fitting residuals, calculated as the root mean square (RMS) of the relative differences between measured and simulated radiance (%), are stored as “ResidualOffit” in version 2 and “avg_residuals” in version 3. Note that the color scale range in panel (b) is narrowed to one-third of panel (a) to enhance the visibility of the lower residual values.
The averaging kernel matrix (AKM) and error covariance matrix (CVM) are used to characterize the retrieval sensitivity and its associated uncertainties. Their characteristics are mainly governed by the fitting window, measurement noise, and the a priori covariance matrix, and they remain largely unchanged between versions 2 and 3 of the retrieval algorithm. The rows of the AKM serve as vertical smoothing functions, representing the sensitivity of the retrieved ozone to changes in the true atmospheric state (see Eq. 5). The trace of the AKM, referred as the degrees of freedom for signal (DFS), quantifies the number of independent pieces of information available from the measurements. Retrieval uncertainty, given by the square root of the CVM diagonal, is assessed against the a priori uncertainty, considering both the total error and the contribution from measurement noise alone.
Figure 6 shows the mean averaging kernels and uncertainty profiles from the GEMS 04:45 UTC scans, covering two regions with different viewing zenith angles (VZA) and two dates with different solar zenith angles (SZA).
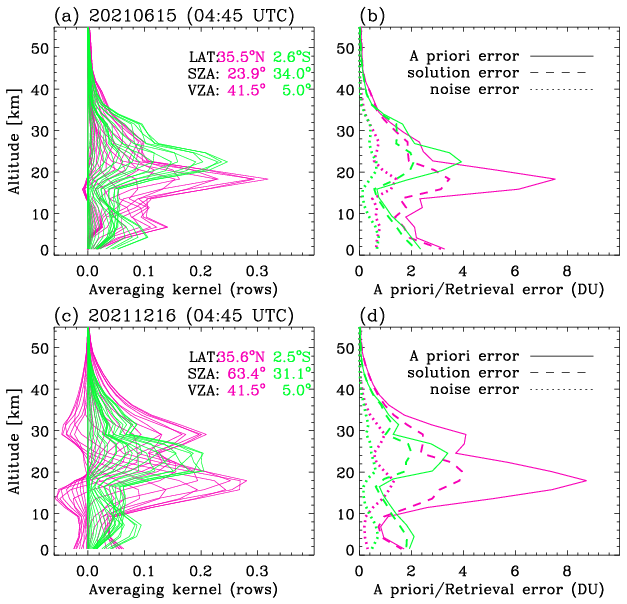
Figure 6Averaging kernels and retrieval errors of ozone profiles from the 04:45 UTC scans on 15 June (a, b) and 16 December (c, d) 2021. Pink and green lines indicate averages over cross-track pixels 50–100 and 450–550, respectively, at the first scan line.
The averaging kernels peak notably just below the stratospheric ozone layer and within the upper troposphere–lower stratosphere (UTLS), where the a priori uncertainty is largest, indicating that the retrieval provides the greatest information content. The vertical location of these peaks is strongly influenced by the optical path length (SZA and VZA). At the kernel peaks, the retrieval uncertainty is reduced by ∼ 50 % with respect to the a priori, with about one-third of the total (solution) error being due to measurement noise. Away from the peaks, the reduction in uncertainty is generally smaller. At high SZAs, negative kernel oscillations are evident, reflecting challenges in vertically allocating the measurement information. This suggests that the retrieval may offer only limited improvement over the prior under such conditions.
Figure 7 presents the sub-column DFS values for the troposphere and stratosphere. The corresponding ozone partial columns are provided in Fig. S2, reflecting the expected dependence of information content on atmospheric ozone concentration. The stratospheric DFS increases with optical path length, and thus with latitude (Fig. 7c, d), whereas the tropospheric DFS shows the opposite behaviour, with higher values at lower SZA/VZA (Fig. 7a, b). This relationship becomes more complex by factors such as tropospheric ozone abundance, surface reflectance, and other scene-dependent characteristics including aerosol and clouds. In the summer case, the tropospheric DFS indicates that the retrieval yields more information when ozone concentrations are higher, resulting in stronger absorption signals (0.5–1.0 DFS). In the December case, tropospheric DFS values generally range from 0.2 to 0.5 at latitudes below 30°. Abnormally high DFS values (0.7–0.9) are linked to elevated surface albedo, retrieved as a compensation for missing cloud information in pixels where the GEMS Level 2 cloud product fails to provide valid output (Fig. S3). Summing the tropospheric and stratospheric contributions, the total DFS ranges from 1.5 to 3, with a compensating effect observed at higher latitudes, where decreases in tropospheric DFS are offset by increases in stratospheric DFS.
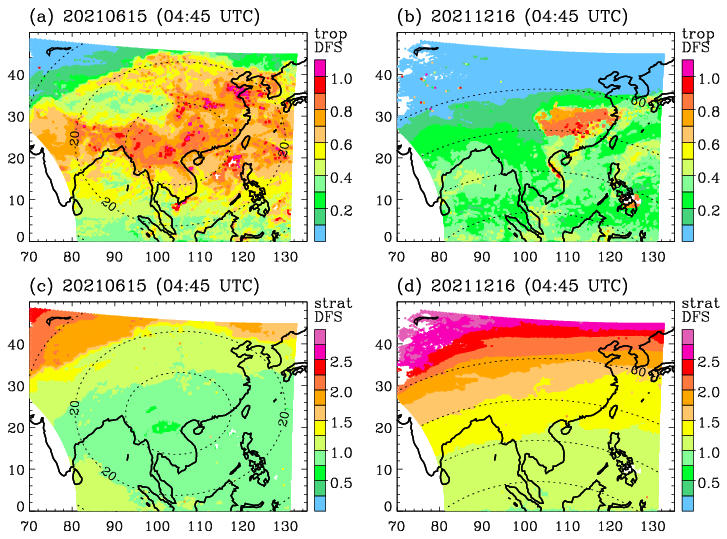
Figure 7Degrees of freedom for signal (DFS) for tropospheric column ozone on (a) 15 June and (b) 16 December 2021, and analogous for the stratospheric column in (c) and (d), respectively. Contours indicate the solar zenith angle (SZA) at 20° intervals. The corresponding ozone distributions are shown in Fig. S2.
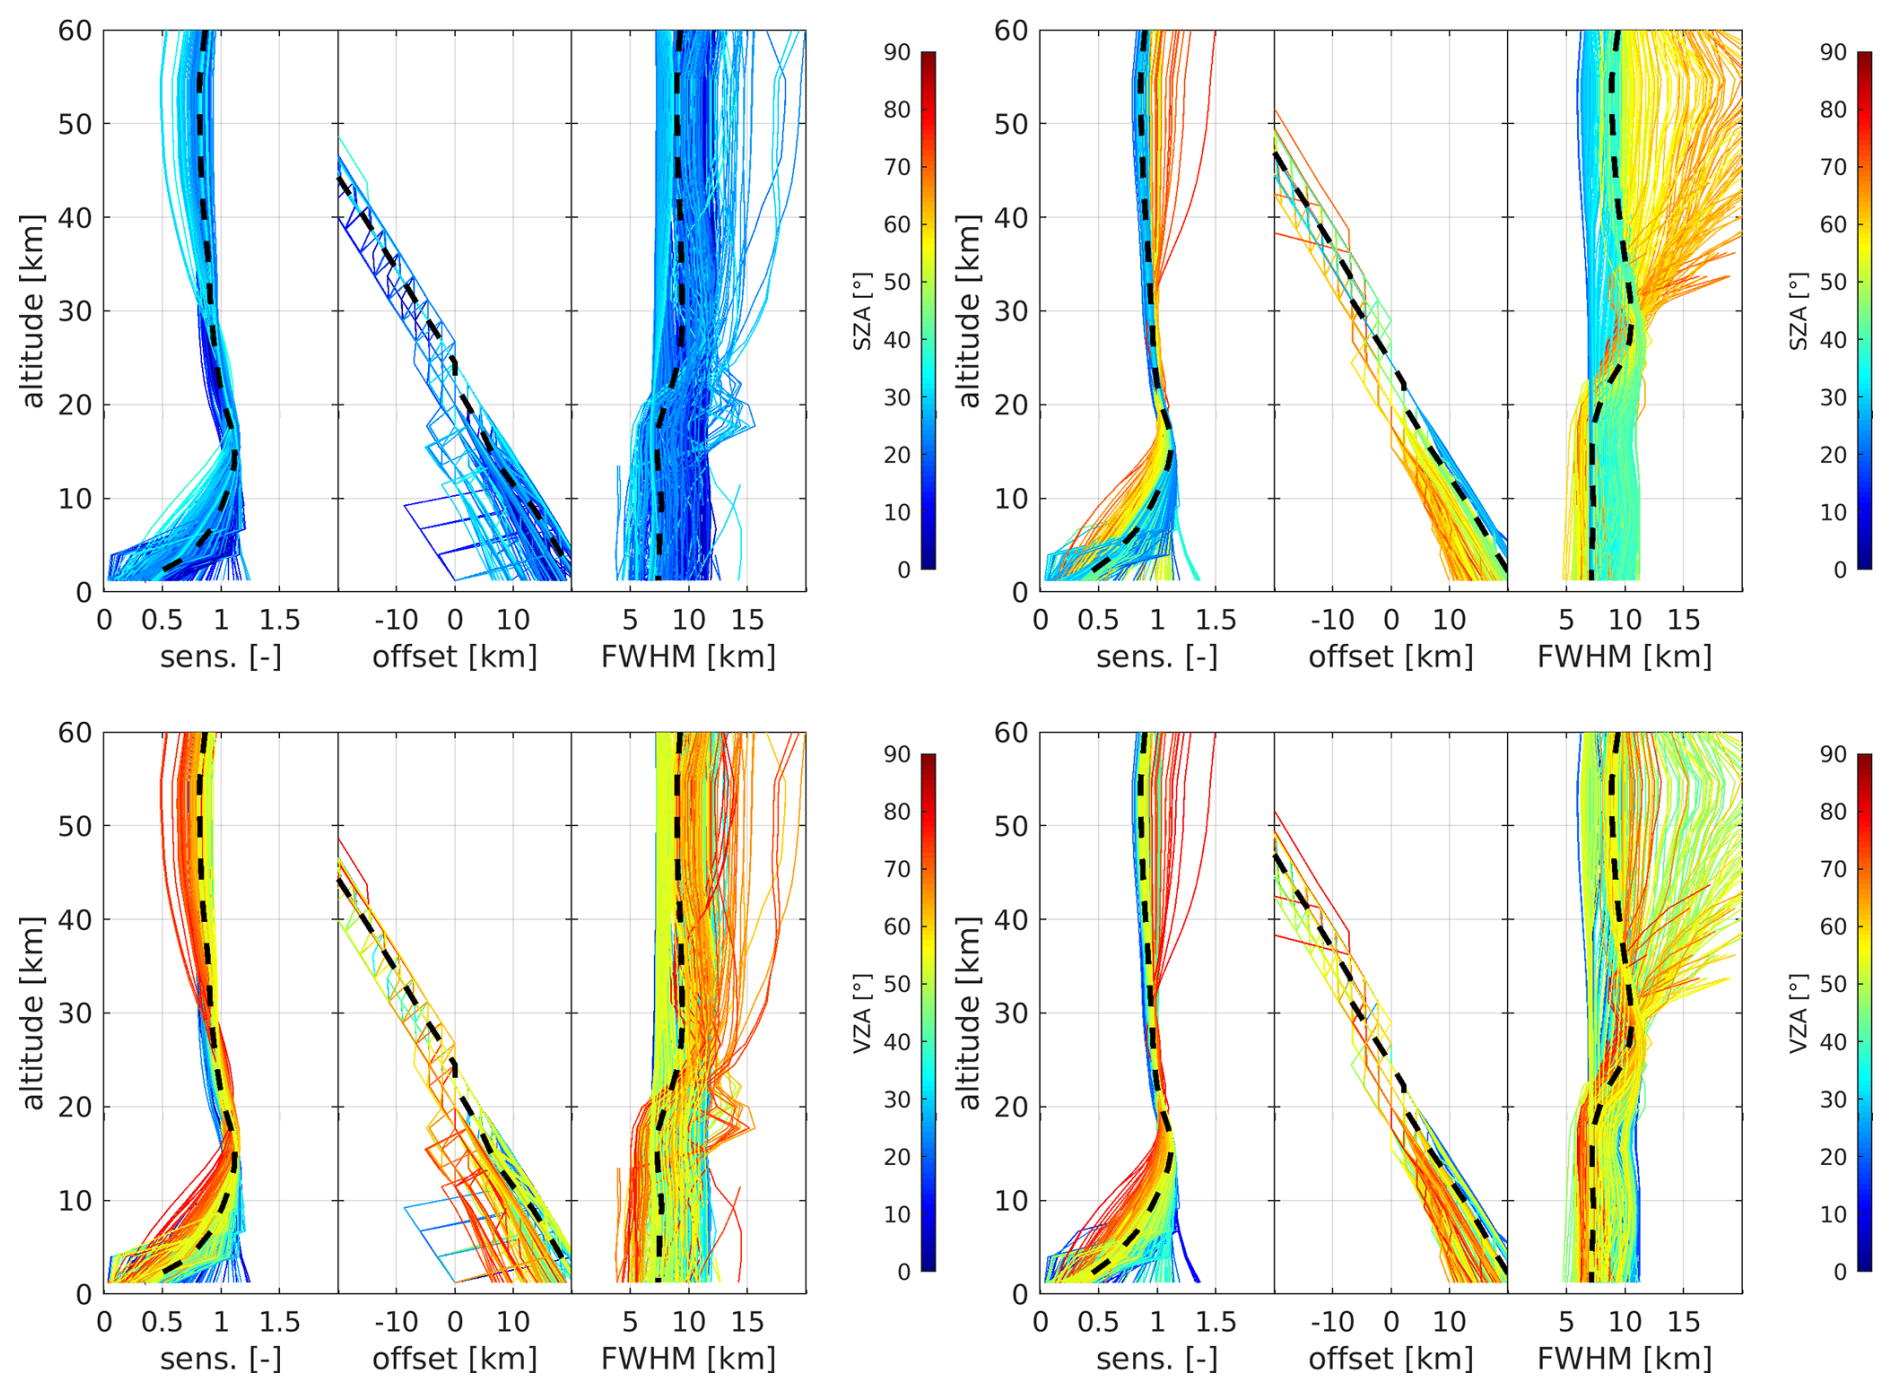
Figure 8Sensitivity, offset, and kernel FWHM for GEMS ozone profile retrievals on 15 June (left) and 16 December (right) 2021. Black dashed lines indicate median values. Color coding represents SZA (top) and VZA (bottom), which are the primary quantities influencing retrieval characteristics; additional factors are presented in the Supplement.
In this work, we further examine three supplementary diagnostics: the retrieval sensitivity, retrieval offset and effective vertical resolution (which differs from the sampling resolution), following Keppens et al. (2015). The sum of each row of the AKM quantifies the total retrieval sensitivity, providing a vertically resolved and normalized measure of the contribution from satellite observations relative to the a priori profile. The retrieval offset indicates any vertical mismatch between the location of maximum sensitivity (the retrieval barycenter) and the nominal retrieval altitude (Rodgers, 2000). The effective vertical resolution is defined by the FWHM of each averaging kernel. This measure, however, does not account for averaging kernel oscillations, including the occurrence of negative values (see Fig. 6). Figure 8 presents the retrieval diagnostics described above – sensitivity, offset, and vertical resolution – for GEMS ozone profile retrievals, evaluated from every tenth mirror step and spatial pixel, yielding on the order of 1000 profiles for the 04:45 UTC scan. The results show that, on average, the vertical sensitivity of the retrievals is close to unity throughout most of the profile. Sensitivity drops below 0.5 only in the lowest 5 km, with higher values occurring above highly reflective surfaces (e.g., high cloud fractions). In the troposphere, vertical sensitivity generally increases with shorter optical paths (e.g., lower SZA and VZA), which enhance atmospheric penetration. In the stratosphere, however, higher sensitivities occur under more oblique viewing geometries (higher VZA), particularly during winter when large SZAs further enhance the DFS. By contrast, in summer, when SZAs are smaller, stratospheric sensitivity is lower for near-nadir viewing angles (i.e., shorter path lengths).
Outside the UTLS (about 15–30 km), the retrieval barycenter deviates nearly linearly from the nominal retrieval altitude. Consequently, the vertical sensitivity is primarily distributed off-diagonal, with its barycenter residing in the UTLS (as can also be seen from the averaging kernel peak positions in Fig. 6). In the troposphere, the retrieval offset depends on SZA and VZA (and thus latitude), but shows no other significant dependences on the influence quantities examined (Fig. S4). The offset decrease under more oblique solar and viewing geometry (larger SZA and VZA), although this is accompanied by a reduction in tropospheric retrieval sensitivity.
The average effective vertical resolution of the GEMS ozone profiles ranges from 6 to 10 km. Both in the troposphere and stratosphere, they strongly depend on SZA and VZA. However, opposite behaviors are observed above and below the tropopause: longer path lengths lead to coarser vertical resolution (larger FWHM) in the troposphere, while in the stratosphere, especially under very high SZA, they result in finer vertical resolution, with the retrieved information distributed over a larger vertical extent.
As a preliminary step in establishing a reliable validation framework for GEMS ozone profile retrievals, Bak et al. (2019) evaluated ozonesonde soundings from 10 East Asian sites and found that electrochemical concentration cell (ECC) sensors provided more reliable measurements than modified Brewer–Mast (MBM) and carbon–iodine (CI) sondes. They also emphasized the importance of maintaining consistent procedures across the preparation, operation, and post-processing stages to ensure long-term data quality and consistency. Among these sites, five – Pohang, King's Park, Tsukuba, Hanoi, and Kuala Lumpur – have remained active during the GEMS mission, regularly launching balloon-borne ECC ozone sensors. Weekly regular observations have continued at Pohang, King's Park, and Tsukuba in the afternoon (01:30–02:30 pm LT). Hanoi and Kuala Lumpur, where ozonesondes are launched bi-weekly, were not recommended as reference sites in Bak et al. (2019) because of frequent changes in sensing solution concentrations or the ozonesonde manufacturer. During the GEMS operational period, however, these inconsistencies have been better managed, and data from these sites are therefore included in this study. In addition, monthly ozonesonde observations from Pengchiayu, initiated in 2022, are also incorporated. Table 1 summarizes the availability of the regular ozonesonde sites used for GEMS validation in Sect. 4.1. In Sect. 4.2, we further include 13 ozonesondes launched at Seosan (126.38° E, 36.92° N) and 10 launched at Kongju (127.74° E, 36.47° N), South Korea, as part of the 2024 Airborne and Satellite Investigation of Asian Air Quality (ASIA-AQ) campaign (NASA, 2023). Integrated total ozone columns were also evaluated at Seosan during the ASIA-AQ campaign (Sect. 4.2) using Pandora measurements.
Table 1List of regular ozonesonde stations used in this study.
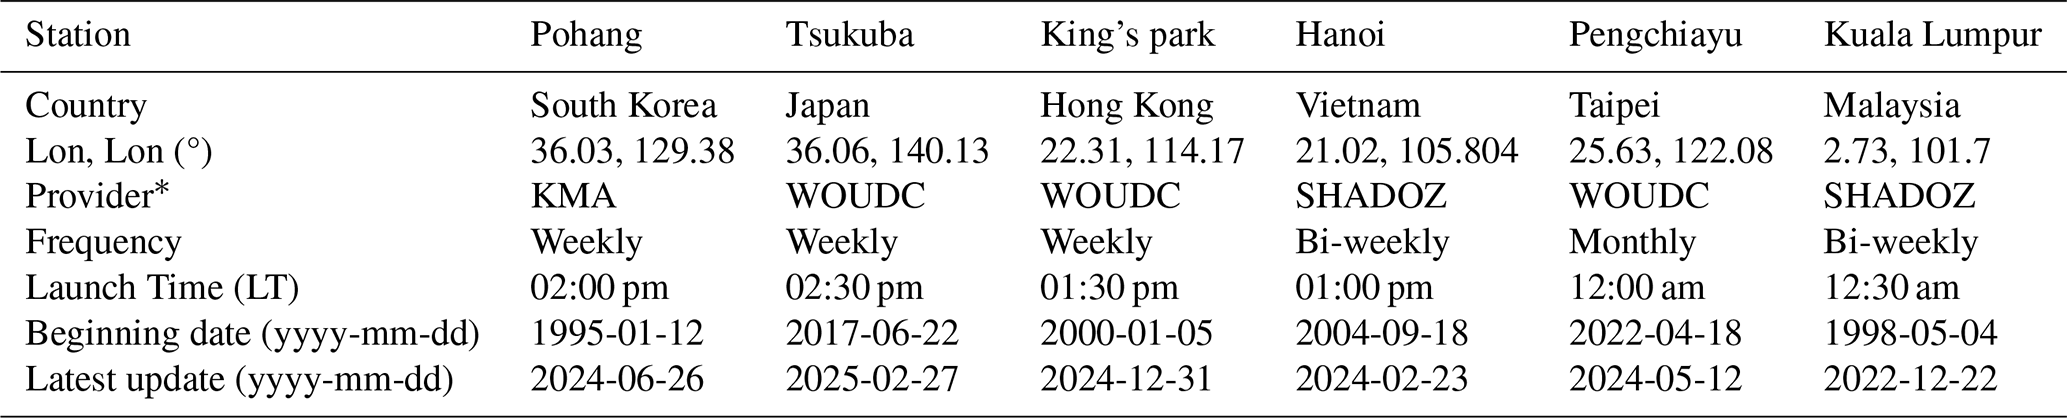
∗ KMA (Korea Meteorological Administration), WOUDC (World Ozone and Ultraviolet Radiation Data Centre), SHADOZ (Southern Hemisphere ADditional OZonesondes).
4.1 Validation with regular ozonesonde soundings
Ozonesondes are used to validate GEMS measurements from FW scans, which provide better temporal coincidence in the afternoon (Tables 1 and S1–S2). However, those from Tsukuba are matched with GEMS FC scan measurements due to spatial constraints (see Fig. 1). Figure 9 illustrates how well GEMS captures the vertical distribution of ozone up to 35 km – the typical burst altitude of ozonesonde balloons – at three stations representing different latitudinal bands: mid-latitudes (Pohang), subtropics (Hanoi), and tropics (Kuala Lumpur). The reprocessed GEMS ozone profiles (v3.0) demonstrates substantial improvements, particularly at the mid-latitude site of Pohang. Tropospheric ozone agrees within 10 DU of ozonesonde measurements, while stratospheric ozone is within 5 DU. However, the GEMS v2.0 reveals high biases in tropospheric ozone of up to 20 DU, reaching 40 DU near the tropopause, while underestimating stratospheric ozone columns by as much as 20 DU. At lower-latitude sites, both GEMS v2.0 and v3.0 produce qualitatively similar ozone profiles, as the vertical structure shows relatively weak seasonal variability and the tropopause altitude remains stable, making the retrievals easier to constrain with a priori information.
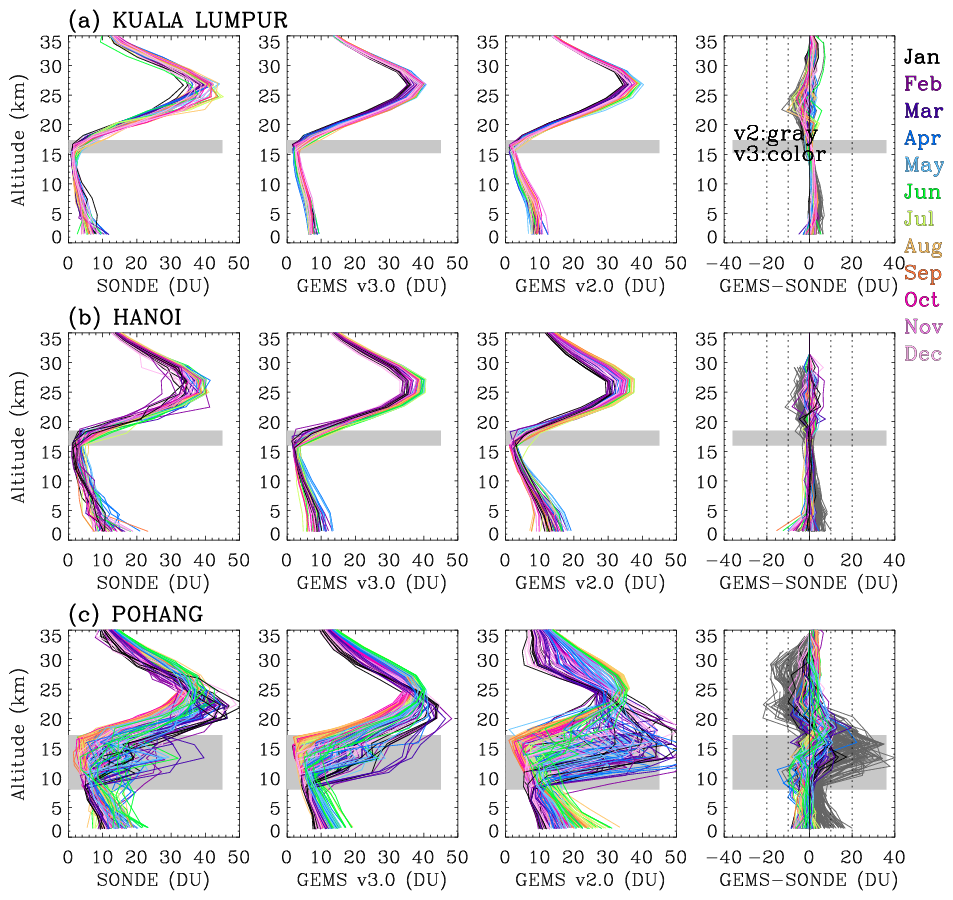
Figure 9Ozone vertical profiles (in DU) at three sites – (a) Kuala Lumpur, (b) Hanoi, and (c) Pohang – during 2021–2024. Each panel displays individual ozonesonde soundings along with corresponding GEMS v3.0 and v2.0 retrievals. The last columns present the respective differences (GEMS − SONDE) for GEMS v3.0 and v2.0, displayed in color and dark gray, respectively. The gray shaded area denotes the range of tropopause altitudes (minimum to maximum).
Figure 10 presents time series comparisons of lower tropospheric ozone columns (below 300 hPa) derived from GEMS (v2.0 in gray and v3.0 in black) and ozonesonde observations (in red) at six stations across different latitudes during the period 2021 to 2024.
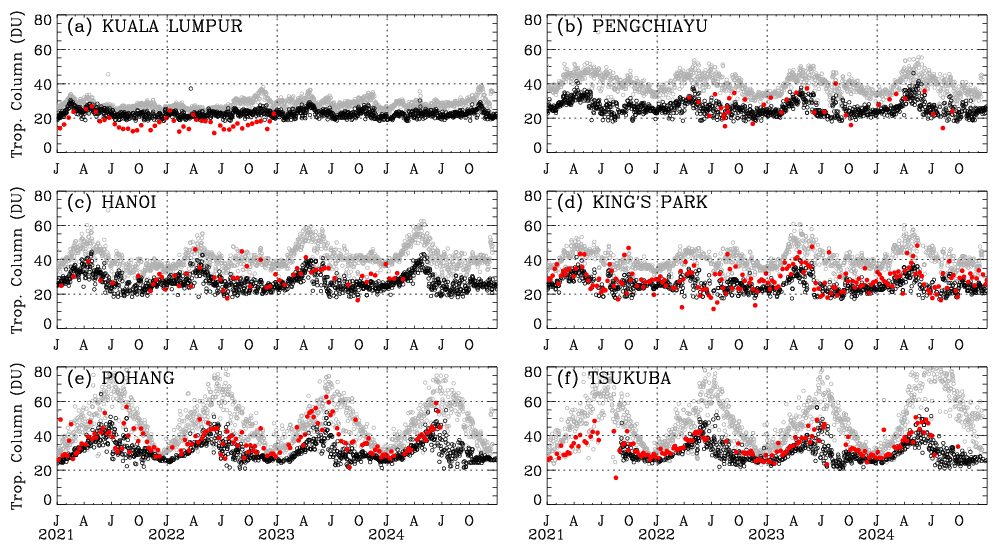
Figure 10Time-series of tropospheric ozone columns (surface–300 hPa) from GEMS v3.0 (black), GEMS v2.0 (grey), and ozonesondes (red). The x-axis marks the months of the year using initials: J (January), A (April), J (July), and O (October).
Mid-latitude sites (Pohang and Tsukuba) exhibit pronounced seasonality, with ozonesonde-derived tropospheric ozone columns ranging from 25 to 50 DU – peaking in summer and declining toward winter. Within the summer season, ozone levels typically reach their maximum in June, followed by a sharp decline in July and August. As shown, GEMS v3.0 reasonably reproduces this seasonal pattern. At subtropical sites such as Hanoi, King's Park, and Pengchiayu, seasonal changes are less pronounced, with ozone columns typically fluctuating between 20 and 45 DU. A distinct spring peak of 40–45 DU is consistently observed in both ozonesonde and GEMS v3.0 time-series. The lowest ozone levels are observed between July and October, remaining a few DU lower than the wintertime minimum. At the tropical site of Kuala Lumpur, ozonesonde measurements are limited in 2021 and 2022, but the available data suggest minimal seasonal variation in tropospheric ozone, consistent with the weak seasonal signals typically observed in the tropics. With its dense temporal coverage, GEMS v3.0 complements the sparse ozonesonde measurements and identifies the flat tropospheric ozone levels throughout the 2021–2024 period. However, GEMS v2.0 systematically retrieves higher ozone amounts across all latitudinal bands. This overestimation is much more pronounced at mid-latitudes than at lower latitudes. In particular, GEMS v2.0 significantly overestimates summer ozone values by 30 DU compared to GEMS v3.0, with the discrepancy decreasing toward winter. In the subtropics, the difference between GEMS v2.0 and v3.0 remains about 15 DU, without clear seasonal change. In particular, GEMS v2.0 retrieves higher ozone amounts in 2023 and 2024 compared to earlier years, which is not reflected in either GEMS v3.0 or ozonesonde data. This increasing discrepancy is likely associated with the optical degradation of the instrument, which leads to decreasing irradiance values over time (Kang et al. 2024) and, in turn, affects the accuracy of the ozone profile retrievals. In the tropics, the GEMS products from both versions agree within 5 DU during 2021–2022, but the difference increases to within 10 DU in 2023–2024. Notably, the issues identified in GEMS v2.0 are substantially mitigated in GEMS v3.0, owing to the newly implemented radiometric calibration applied to both irradiance and normalized radiance.
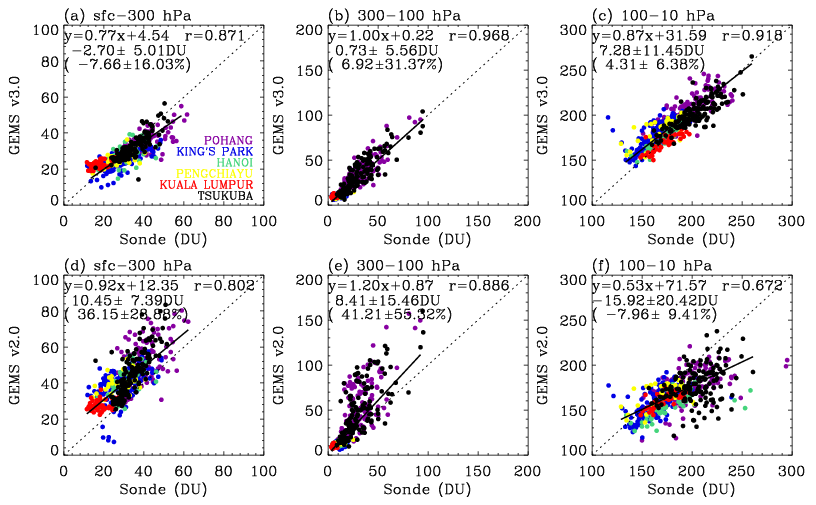
Figure 11Scatter plots of GEMS and ozonesonde ozone columns for three different layers, surface–300, 300–100, and 100–10 hPa. The upper panels (a–c) show results from GEMS v3.0, and the bottom panels (d–f) from GEMS v2.0. Each data pair is color-coded by station. Regression lines and correlation coefficients (r) are derived from all data pairs, along with the mean bias and standard deviation reported in both DU and percentage.
The quantitative comparison between GEMS and ozonesonde measurements is presented in Fig. 11a, d for tropospheric ozone columns below 300 hPa. Compared to version 2.0, which exhibits a substantial positive bias of 36.15 % and high variability (±28.88 %), GEMS v3.0 shows a marked improvement, reducing the bias to −7.66 % with lower scatter (±16.03 %) and achieving a higher correlation with ozonesonde observations (r = 0.87 vs. r = 0.80). The regression slope for GEMS v2.0 is closer to unity than that of v3.0, due to the presence of both negative biases at high-ozone sites and positive biases at low-ozone sites, whereas v2.0 shows more uniform positive biases across stations. Figure 11 also evaluates ozone partial columns in upper troposphere and lower stratosphere (UTLS: 300-100 hPa) and the middle stratosphere (100–10 hPa), respectively. The 100–10 hPa layer, which corresponds to the ozone maximum in the stratosphere, also shows good agreement, with GEMS v3.0 achieving a correlation of r = 0.92 and a relatively small mean bias (4.31 ± 6.38 %), further supporting the reliability of the updated retrievals at higher altitudes.
The GEMS retrievals are inherently more influenced by a priori information compared to existing nadir satellite products such as OMI and TROPOMI, due to the narrower spectral range (310–330 nm versus 270–330 nm). Despite both versions employing the same a priori constraints, GEMS v2.0 exhibits poorer agreement with ozonesonde data than the a priori itself, reflecting the detrimental impact of radiometric uncertainties on the retrievals. However, GEMS v3.0 demonstrates better agreement than the a priori, indicating improved retrieval performance, especially when retrieving high ozone concentrations in both the troposphere and stratosphere. A comparison between GEMS a priori and ozonesondes is provided in Fig. S4.
4.2 Validation with Asia-AQ campaign ozonesonde soundings
Figure 12a shows the date-altitude cross-section of ozone mixing ratios obtained from ozonesondes at Seosan (February) and Kongju (March) during the 2024 Asia-AQ campaign. As the two sites are only about 131 km apart, they are treated jointly in the analysis and considered to represent similar ozone seasonality. Ozone concentrations near the surface range from 30 to 50 ppb, which are lower than those in the upper troposphere – approximately 60 ppb in February and increasing to 80 ppb in March. These observed ozone structures and their temporal variations are consistently reproduced from GEMS v3.0 retrievals (Fig. 12b). Notably, during the absent of ozonesonde measurements in early March, GEMS v3.0 provides valuable supplementary information, revealing a downward propagation of ozone-rich air from the upper to the lower troposphere over time. Above the tropopause (∼ 10 km), ozone mixing ratios generally exceed 0.1 ppm. The superimposed potential temperature profiles remained temporally stable in the stratosphere, reflecting persistent stratification and limited vertical dynamical activity. However, ozone mixing ratios in the lower stratosphere, particularly below 15 km, exhibited marked variability between 0.3 and 0.5 ppm, likely associated with isentropic transport. GEMS v3.0 effectively captures these variations, with enhanced ability to resolve ozone fluctuations in the lower stratosphere. However, as shown in Fig. 12c, GEMS v2.0 produces smoother, less structured patterns.
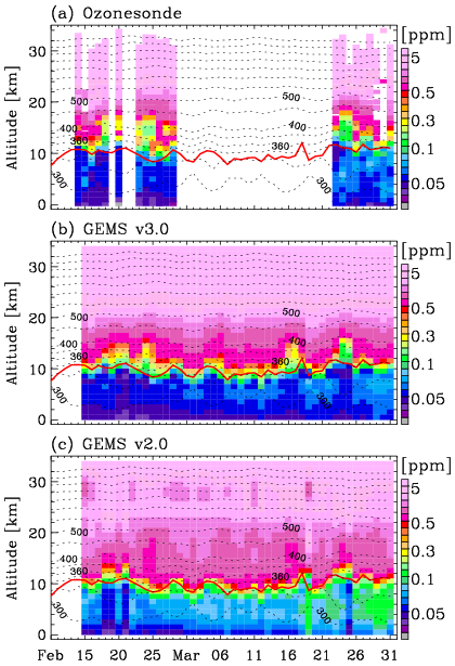
Figure 12Time series of daily ozone mixing ratio profiles from ozonesondes and GEMS (v3.0 and v2.0) during the 2024 Asia-AQ campaign. The red line denotes the thermal tropopause, while the black contour lines (50 K intervals) represent potential temperatures, derived from the FNL meteorological product.
The evaluation of integrated ozone profiles as total ozone can provide useful insight into the overall accuracy and consistency of vertical profile retrievals when compared with well-established ground-based total column measurements (Bak et al., 2015). Ground-based Pandora total ozone column measurements at Seosan (Park and Cede, 2025) are used as a reference to evaluate the total ozone integrated from GEMS ozone profiles during the Asia-AQ campaign (Fig. 13). An intercomparison of total ozone columns from GEMS (Kim et al., 2024), OMPS (Jaross, 2017), and TROPOMI (Copernicus Sentinel-5P, 2020) is also included to assess the consistency between GEMS ozone products (O3P and O3T) and to evaluate the relative performance of GEMS compared to other satellite observations. As shown, total ozone values recorded by Pandora ranged from 300 to 450 DU during February and March 2024. These records closely align with satellite observations, evidenced by correlation coefficients of 0.97 or higher across all products. However, the retrievals from GEMS O3T show inconsistent performance between low and high ozone levels, resulting in a regression slope of 0.9, whereas the other satellite products exhibit slopes close to unity. GEMS O3T also significantly underestimates Pandora measurements, with a mean bias of −20 DU, primarily due to uncertainties in irradiance calibration (Baek et al., 2023). The scatter in the OMPS total ozone comparison is larger than that of the other products – by a factor of two – likely due to its coarse spatial resolution. GEMS O3P shows better agreement than the other satellite products, both in terms of scatter and biases, ranging from 1.5 to 8 DU (−3.66 ± 4.27 DU).
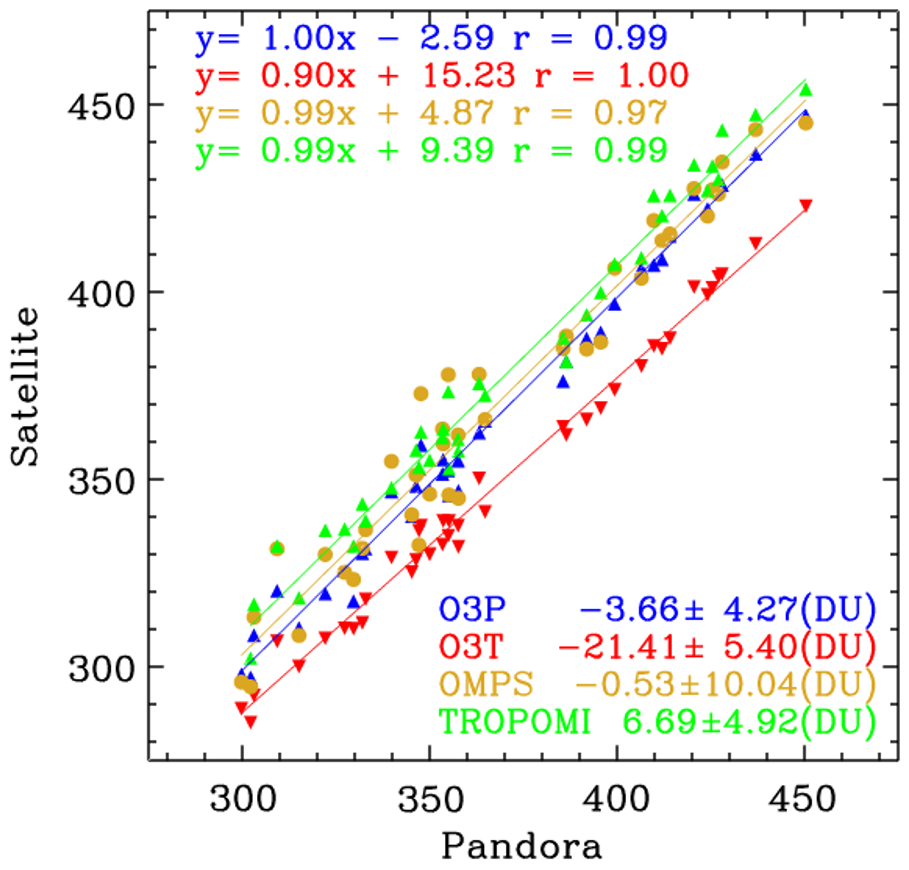
Figure 13Scatter plots of total ozone columns from GEMS O3P, GEMS O3T, OMPS, and TROPOMI against Pandora measurements at Seosan during February–March 2024. A total of 44 Pandora observation days was available, of which 42 remained after quality control. Regression lines and correlation coefficients (r) are shown in the top legend, and mean bias ±1σ in the bottom legend. For comparison, Pandora observations are averaged within ±30 min of 04:45 UTC each day and satellite-Pandora pairs were selected based on the nearest satellite pixel within 100 km.
This study provides the first detailed description of the GEMS operational ozone profile retrieval algorithm in the literature, along with an analysis of its retrieval characteristics in the 310–330 nm spectral range. The vertical sensitivity of the GEMS ozone profile is close to unity throughout most of the atmosphere. A decrease to values below 0.5 is observed only in the lowest 5 km. Outside of the lower stratosphere (about 15–30 km), the vertical sensitivity is mostly found off-diagonal, resulting in a rather low average retrieval DFS of about 1.5, up to 3 at maximum. The effective vertical resolution of the GEMS O3P retrieval amounts to 5–10 km.
This work primarily highlights substantial algorithmic and calibration enhancements implemented in version 3.0 over the previous version. Unlike other Level 2 algorithms that typically assume a uniform spectral shift, this work accounts for independent spectral shifts in radiance and irradiance. To address significant irradiance offsets – arising spatially and seasonally from BTDF-induced effects, and temporally from optical component degradation – a scaling factor correction is introduced. This scaling factor basically represents the ratio between the measured irradiance and the solar reference, capturing systematic deviations due to calibration limitations. Additionally, a soft calibration is applied to compensate for residual wavelength-dependent uncertainties not addressed by the scaling factor, as well as for spatial (cross-track) variations in normalized radiance. The GEMS soft spectra are derived from clear-sky observations during the week of 11–17 July 2021, at 02:45 UTC, to address systematic residuals between measured and simulated normalized radiances as a function of spatial pixel, and are applied uniformly across all observation times. We also adopt the newly implemented forward model, additional fitting parameters, and auxiliary data from the OMI Collection 4 ozone profile algorithm (Bak et al., 2024). As a result, version 3.0 achieves a spectral fitting residual of 0.2 % (low SZA/VZA) in ozone profile retrievals, indicating a fourfold improvement compared to version 2.0. Validation results further confirm the improved performance of the version 3.0 ozone profile product. Comparisons with regular ozonesonde observations from six East and Southeast Asian stations reveal substantial bias reduction and improved consistency in both the troposphere and lower stratosphere, effectively smoothing the altitude-dependent oscillating biases observed in version 2.0. The mean tropospheric ozone column bias is reduced from +36.2 % in version 2.0 to −7.7 % in version 3.0, accompanied by an improvement in the correlation coefficient from 0.80 to 0.87. Stratospheric retrievals also show good agreement, with a mean bias of 4.3 % and a correlation coefficient of 0.92. Time series comparisons of tropospheric ozone demonstrate a better representation of the seasonal cycle in version 3.0, whereas version 2.0 exhibited an artificial increasing trend. Additional validation using ozonesonde data from the 2024 Asia-AQ campaign supports the improved vertical structure and day-to-day variability captured by GEMS version 3.0. Furthermore, GEMS total ozone columns derived from version 3.0 profiles show excellent agreement with Pandora measurements (r = 0.99, mean bias = −3.7 DU), outperforming the GEMS total ozone product. The reprocessing of the GEMS ozone profile dataset has been completed and the version 3 product is publicly available through the Environmental Satellite Center website (https://nesc.nier.go.kr/en/html/datasvc/index.do, last access: 20 August 2025; NIER, 2025).
In this study, we focused on the afternoon measurements at 04:45 UTC (13:45 LT, KST), which correspond to the overpass time of polar-orbiting satellites in East Asia. In the next version (version 4), we will aim to improve and validate the ozone profile product for hourly observations. Irradiance calibration will be enhanced by accounting for BTDF effects and optical degradation in the Level 1C processing, which is expected to provide a more robust foundation for both ozone profile retrievals and auxiliary input data such as total ozone and cloud information. In turn, the use of soft spectra will be extended to support hourly, seasonal, and yearly applications, enabling improved temporal consistency in the quality of the GEMS ozone profile product for both diurnal variation analysis and long-term atmospheric monitoring.
The GEMS L2 O3P algorithm is not available publicly.
GEMS L2 O3P data can be obtained from the Environmental Satellite Center website (https://nesc.nier.go.kr/en/html/datasvc/index.do; NIER, 2025; current version is 3.0 for entire mission). The Asia-AQ campaign archives are available from https://www-air.larc.nasa.gov/missions/asia-aq/ (NASA, 2023). The regular ozonesonde observations are downloaded from the WOUDC (https://woudc.org/en/data/dataset-information/ozonesonde, last access: 19 December 2025), SHADOZ (https://tropo.gsfc.nasa.gov/shadoz/Archive.html, last access: 19 December 2025) and KMA (https://data.kma.go.kr, last access: 29 October 2025), websites.
The supplement related to this article is available online at https://doi.org/10.5194/amt-19-119-2026-supplement.
JB, DC, JHK (Jae-Hwan Kim), XL, and KY developed the ozone profile retrieval algorithm. GGA developed the radiance data reading modules. AK and JCL performed the retrieval characterization. JHK (Ja-Ho Koo) and JK (Joowan Kim) provided the Asia-AQ ozonesonde data. SH, KB, YJ and KPH conducted the validation. CHK, HL, and WJ advised on the implementation of meteorological reanalysis and forecast data. JK (Jhoon Kim) led the overall GEMS project. HH and WL managed the project. All authors contributed to the data analysis and manuscript preparation.
The contact author has declared that none of the authors has any competing interests.
Publisher's note: Copernicus Publications remains neutral with regard to jurisdictional claims made in the text, published maps, institutional affiliations, or any other geographical representation in this paper. While Copernicus Publications makes every effort to include appropriate place names, the final responsibility lies with the authors. Views expressed in the text are those of the authors and do not necessarily reflect the views of the publisher.
We thank the GEMS science team and the Environmental Satellite Center (ESC) of the National Institute of Environmental Research (NIER) for their support in the development of the GEMS ozone profile retrieval algorithm. We also acknowledge the contributions of the TEMPO, ESA PEGASUS, and ASIA-AQ, WOUDC, SHADOZ teams to algorithm improvements and product validation. Finally, we express our sincere gratitude to the late Daesung Choi, whose dedication and commitment made a lasting contribution to the advancement of the GEMS ozone profile algorithm.
This research has been supported by the National Research Foundation of Korea (grant nos. 2020R1A6A1A03044834 and 2021R1A2C1004984), the National Institute of Environmental Research (grant no. NIER-2025-04-02-063), the European Space Agency (grant no. 4000138176/22/I-DT-lr), and the National Aeronautics and Space Administration (grant nos. NNL13AA09C and 80NSSC19K1626).
This paper was edited by Mark Weber and reviewed by Serena Di Pede and Glen Jaross.
Baek, K., Bak, J., Kim, J. H., Park, S. S., Haffner, D. P., and Lee, W.: Validation of geostationary environment monitoring spectrometer (GEMS), TROPOspheric Monitoring Instrument (TROPOMI), and Ozone Mapping and Profiler Suite Nadir Mapper (OMPS) using pandora measurements during GEMS Map of Air Pollution (GMAP) field campaig, Atmos. Environ., 324, 120408, https://doi.org/10.1016/j.atmosenv.2024.120408, 2024.
Bak, J., Liu, X., Wei, J. C., Pan, L. L., Chance, K., and Kim, J. H.: Improvement of OMI ozone profile retrievals in the upper troposphere and lower stratosphere by the use of a tropopause-based ozone profile climatology, Atmos. Meas. Tech., 6, 2239–2254, https://doi.org/10.5194/amt-6-2239-2013, 2013.
Bak, J., Liu, X., Kim, J. H., Chance, K., and Haffner, D. P.: Validation of OMI total ozone retrievals from the SAO ozone profile algorithm and three operational algorithms with Brewer measurements, Atmos. Chem. Phys., 15, 667–683, https://doi.org/10.5194/acp-15-667-2015, 2015.
Bak, J., Liu, X., Kim, J.-H., Haffner, D. P., Chance, K., Yang, K., and Sun, K.: Characterization and correction of OMPS nadir mapper measurements for ozone profile retrievals, Atmos. Meas. Tech., 10, 4373–4388, https://doi.org/10.5194/amt-10-4373-2017, 2017.
Bak, J., Baek, K.-H., Kim, J.-H., Liu, X., Kim, J., and Chance, K.: Cross-evaluation of GEMS tropospheric ozone retrieval performance using OMI data and the use of an ozonesonde dataset over East Asia for validation, Atmos. Meas. Tech., 12, 5201–5215, https://doi.org/10.5194/amt-12-5201-2019, 2019.
Bak, J., Kim, J. H., Nam, H., Baek, K., and Shin, D.: Geostationary Environment Monitoring Spectrometer (GEMS) Algorithm Theoretical Basis Document Ozone Profile Retrieval Algorithm (April 2020), 10–11, https://nesc.nier.go.kr/ko/html/satellite/doc/doc.do (last access: 29 October 2025), 2020.
Bak, J., Liu, X., Spurr, R., Yang, K., Nowlan, C. R., Miller, C. C., Abad, G. G., and Chance, K.: Radiative transfer acceleration based on the principal component analysis and lookup table of corrections: optimization and application to UV ozone profile retrievals, Atmos. Meas. Tech., 14, 2659–2672, https://doi.org/10.5194/amt-14-2659-2021, 2021.
Bak, J., Song, E.-J., Lee, H.-J., Liu, X., Koo, J.-H., Kim, J., Jeon, W., Kim, J.-H., and Kim, C.-H.: Temporal variability of tropospheric ozone and ozone profiles in the Korean Peninsula during the East Asian summer monsoon: insights from multiple measurements and reanalysis datasets, Atmos. Chem. Phys., 22, 14177–14187, https://doi.org/10.5194/acp-22-14177-2022, 2022.
Bak, J., Liu, X., Yang, K., Gonzalez Abad, G., O'Sullivan, E., Chance, K., and Kim, C.-H.: An improved OMI ozone profile research product version 2.0 with collection 4 L1b data and algorithm updates, Atmos. Meas. Tech., 17, 1891–1911, https://doi.org/10.5194/amt-17-1891-2024, 2024.
Bak, J., Liu, X., Abad, G. G., and Yang, K.: An Extension of Ozone Profile Retrievals from TROPOMI Based on the SAO2024 Algorithm, Remote Sens., 17, https://doi.org/10.3390/rs17050779, 2025a.
Bak, J., Yang, K., Keppens, A., Kim, M., Liu, X., Kim, J. H., Kim, J., Ahn, M.-H., Chong, H., Hong, S., Lee, K., Kang, M., Lee, W.-J. and Hong, H.: Geostationary Environment Monitoring Spectrometer (GEMS): Long-term radiometric accuracy and spectral stability from 4.5 years of on-orbit solar irradiance observations, IEEE T. Geosci. Remote, 63, 1–11, https://doi.org/10.1109/TGRS.2025.3627802, 2025b.
Birk, M. and Wagner, G.: ESA SEOM-IAS – Measurement and ACS database O3 UV region, Zenodo, https://doi.org/10.5281/zenodo.1485588, 2018.
Brion, J., Chakir, A., Daumont, D., Malicet, J., and Parisse, C.: High-resolution laboratory absorption cross section of O3. Temperature effect, Chem. Phys. Lett., 213, 610–612, https://doi.org/10.1016/0009-2614(93)89169-I, 1993.
Cai, Z., Liu, Y., Liu, X., Chance, K., Nowlan, C. R., Lang, R., Munro, R., and Suleiman, R.: Characterization and correction of global ozone monitoring experiment 2 ultraviolet measurements and application to ozone profile retrievals, J. Geophys. Res.-Atmos., 117, 1–16, https://doi.org/10.1029/2011JD017096, 2012.
Chance, K. and Kurucz, R. L.: An improved high-resolution solar reference spectrum for earth's atmosphere measurements in the ultraviolet, visible, and near infrared, J. Quant. Spectrosc. Radiat. Transf., 111, 1289–1295, https://doi.org/10.1016/j.jqsrt.2010.01.036, 2010.
Coddington, O. M., Richard, E. C., Harber, D., Pilewskie, P., Woods, T. N., Chance, K., Liu, X., and Sun, K.: The TSIS-1 Hybrid Solar Reference Spectrum, Geophys. Res. Lett., 48, e2020GL091709, https://doi.org/10.1029/2020gl091709, 2021.
Copernicus Sentinel-5P (processed by ESA): TROPOMI Level 2 Ozone Total Column products, Version 02, European Space Agency [data set], https://doi.org/10.5270/S5P-ft13p57, 2020.
Daumont, D., Brion, J., Charbonnier, J., and Malicet, J.: Ozone UV spectroscopy I: Absorption cross-sections at room temperature, J. Atmos. Chem., 15, 145–155, https://doi.org/10.1007/BF00053756, 1992.
Hayashida, S., Liu, X., Ono, A., Yang, K., and Chance, K.: Observation of ozone enhancement in the lower troposphere over East Asia from a space-borne ultraviolet spectrometer, Atmos. Chem. Phys., 15, 9865–9881, https://doi.org/10.5194/acp-15-9865-2015, 2015.
Isaksen, I. S. A., Granier, C., Myhre, G., Berntsen, T. K., Dalsøren, S. B., Gauss, M., Klimont, Z., Benestad, R., Bousquet, P., Collins, W., Cox, T., Eyring, V., Fowler, D., Fuzzi, S., Jöckel, P., Laj, P., Lohmann, U., Maione, M., Monks, P., Prevot, A. S. H., Raes, F., Richter, A., Rognerud, B., Schulz, M., Shindell, D., Stevenson, D. S., Storelvmo, T., Wang, W.-C., van Weele, M., Wild, M., and Wuebbles, D.: Atmospheric composition change: Climate–Chemistry interactions, Atmos. Environ., 43, 5138–5192, https://doi.org/10.1016/j.atmosenv.2009.08.003, 2009.
Jaross, G.: OMPS-NPP L2 NM Ozone (O3) Total Column Swath Orbital V2, Goddard Earth Sciences Data and Information Services Center (GES DISC) [data set], Greenbelt, MD, USA, https://doi.org/10.5067/0WF4HAAZ0VHK, 2017.
Kang, M., Ahn, M. H., Ko, D. H., Kim, J., Nicks, D., Eo, M., Lee, Y., Moon, K. J., and Lee, D. W.: Characteristics of the Spectral Response Function of Geostationary Environment Monitoring Spectrometer Analyzed by Ground and In-Orbit Measurements, IEEE Trans. Geosci. Remote Sens., 60, 1–16, https://doi.org/10.1109/TGRS.2021.3091677, 2022.
Kang, M., Ahn, M.-H., Lee, Y., Ho Ko, D., Eo, M., Kim, J., and Moon, K.-J.: On-Orbit Correction of Bi-Directional Transmittance Distribution Function (BTDF) of Geostationary Environment Monitoring Spectrometer (GEMS), IEEE Trans. Geosci. Remote Sens., 62, 1–15, https://doi.org/10.1109/TGRS.2024.3510337, 2024.
Keppens, A., Lambert, J.-C., Granville, J., Miles, G., Siddans, R., van Peet, J. C. A., van der A, R. J., Hubert, D., Verhoelst, T., Delcloo, A., Godin-Beekmann, S., Kivi, R., Stübi, R., and Zehner, C.: Round-robin evaluation of nadir ozone profile retrievals: methodology and application to MetOp-A GOME-2, Atmos. Meas. Tech., 8, 2093–2120, https://doi.org/10.5194/amt-8-2093-2015, 2015.
Kim, J., Jeong, U., Ahn, M.-H., Kim, J. H., Park, R. J., Lee, H., Song, C. H., Choi, Y.-S., Lee, K.-H., Yoo, J.-M., Jeong, M.-J., Park, S. K., Lee, K.-M., Song, C.-K., Kim, S.-W., Kim, Y. J., Kim, S.-W., Kim, M., Go, S., Liu, X., Chance, K., Miller, C. C., Al-Saadi, J., Veihelmann, B., Bhartia, P. K., Torres, O., Abad, G. G., Haffner, D. P., Ko, D. H., Lee, S. H., Woo, J.-H., Chong, H., Park, S. S., Nicks, D., Choi, W. J., Moon, K.-J., Cho, A., Yoon, J., Kim, S., Hong, H., Lee, K., Lee, H., Lee, S., Choi, M., Veefkind, P., Levelt, P. F., Edwards, D. P., Kang, M., Eo, M., Bak, J., Baek, K., Kwon, H.-A., Yang, J., Park, J., Han, K. M., Kim, B.-R., Shin, H.-W., Choi, H., Lee, E., Chong, J., Cha, Y., Koo, J.-H., Irie, H., Hayashida, S., Kasai, Y., Kanaya, Y., Liu, C., Lin, J., Crawford, J. H., Carmichael, G. R., Newchurch, M. J., Lefer, B. L., Herman, J. R., Swap, R. J., Lau, A. K. H., Kurosu, T. P., Jaross, G., Ahlers, B., Dobber, M., McElroy, C. T., and Choi, Y.: New Era of Air Quality Monitoring from Space: Geostationary Environment Monitoring Spectrometer (GEMS), Bull. Am. Meteorol. Soc., 101, E1–E22, https://doi.org/10.1175/BAMS-D-18-0013.1, 2020.
Kim, J. H., Baek, K., and Lee, H.: Geostationary Environment Monitoring Spectrometer (GEMS) Algorithm Theoretical Basis Document Total Column Ozone Retrieval Algorithm (December 2024), https://nesc.nier.go.kr/ko/html/satellite/doc/doc.do (last access: 29 October 2025), 2024.
Kuang, S., Newchurch, M. J., Johnson, M. S., Wang, L., Burris, J., Pierce, R. B., Eloranta, E. W., Pollack, I. B., Graus, M., de Gouw, J., Warneke, C., Ryerson, T. B., Markovic, M. Z., Holloway, J. S., Pour-Biazar, A., Huang, G., Liu, X., and Feng, N.: Summertime tropospheric ozone enhancement associated with a cold front passage due to stratosphere-to-troposphere transport and biomass burning: Simultaneous ground-based lidar and airborne measurements, J. Geophys. Res.-Atmos., 122, 1293–1311, https://doi.org/10.1002/2016JD026078, 2017.
Lee, K., Lee, D.-W., Chang, L.-S., Yu, J.-A., Lee, W.-J., Kang, K.-H., and Jeong, J.: Pioneering Air Quality Monitoring over East and Southeast Asia with the Geostationary Environment Monitoring Spectrometer (GEMS), Korean J. Remote Sens., 40, 741–752, https://doi.org/10.7780/kjrs.2024.40.5.2.5, 2024.
Liu, X., Chance, K., Sioris, C. E., Spurr, R. J. D., Kurosu, T. P., Martin, R. V., and Newchurch, M. J.: Ozone profile and tropospheric ozone retrievals from the Global Ozone Monitoring Experiment: Algorithm description and validation, J. Geophys. Res., 110, D20307, https://doi.org/10.1029/2005JD006240, 2005.
Liu, X., Bhartia, P. K., Chance, K., Spurr, R. J. D., and Kurosu, T. P.: Ozone profile retrievals from the Ozone Monitoring Instrument, Atmos. Chem. Phys., 10, 2521–2537, https://doi.org/10.5194/acp-10-2521-2010, 2010.
Livesey, N. J., Read, W. G., Wagner, P. A., Froidevaux, L., Santee, M. L., Schwartz, M. J., Lambert, A., Millán Valle, L. F., Pumphrey, H. C., Manney, G. L., Fuller, R. A., Jarnot, R. F., Knosp, B. W., and Lay, R. R.: Version 5.0x Level 2 and 3 data quality and description document, Tech. Rep. JPL D-105336 Rev. B, Jet Propulsion Laboratory, California Institute of Technology, Pasadena, California, 91109-8099, 2022.
Lu, X., Zhang, L., Liu, X., Gao, M., Zhao, Y., and Shao, J.: Lower tropospheric ozone over India and its linkage to the South Asian monsoon, Atmos. Chem. Phys., 18, 3101–3118, https://doi.org/10.5194/acp-18-3101-2018, 2018.
Malicet, J., Daumont, D., Charbonnier, J., Parisse, C., Chakir, A., and Brion, J.: Ozone UV spectroscopy. II. Absorption cross-sections and temperature dependence, J. Atmos. Chem., 21, 263–273, https://doi.org/10.1007/BF00696758, 1995.
McPeters, R. D. and Labow, G. J.: Climatology 2011: An MLS and sonde derived ozone climatology for satellite retrieval algorithms, J. Geophys. Res.-Atmos., 117, https://doi.org/10.1029/2011JD017006, 2012.
Monks, P. S., Archibald, A. T., Colette, A., Cooper, O., Coyle, M., Derwent, R., Fowler, D., Granier, C., Law, K. S., Mills, G. E., Stevenson, D. S., Tarasova, O., Thouret, V., von Schneidemesser, E., Sommariva, R., Wild, O., and Williams, M. L.: Tropospheric ozone and its precursors from the urban to the global scale from air quality to short-lived climate forcer, Atmos. Chem. Phys., 15, 8889–8973, https://doi.org/10.5194/acp-15-8889-2015, 2015.
NASA: Draft Planning Document for ASIA-AQ, https://espo.nasa.gov/sites/default/files/documents/Draft%20Planning%20Document%20for%20ASIA-AQ_20230720.pdf (last access: 20 August 2025), 2023.
National Institute of Environmental Research (NIER): GEMS data, Environmental Satellite Center [data set], https://nesc.nier.go.kr/en/html/datasvc/index.do, last access: 20 August 2025.
Park, J. and Cede, A.: Pandora total ozone column data at Seosan (P164s1), Institute of Atmospheric Environment, Chungcheong Province, Republic of Korea, https://doi.org/10.48596/pgn.rout2p1-8.Seosan.P164s1, 2025.
Rodgers, C. D.: Inverse Methods for Atmospheric Sounding: Theory and Practice, World Scientific Publishing, Singapore, ISBN 981022740X, 9789810227401, 2000.
Solomon, S.: Stratospheric ozone depletion: A review of concepts and history, Rev. Geophys., 37, 275–316, https://doi.org/10.1029/1999RG900008, 1999.
Van Dingenen, R., Dentener, F. J., Raes, F., Krol, M. C., Emberson, L., and Cofala, J.: The global impact of ozone on agricultural crop yields under current and future air quality legislation, Atmos. Environ., 43, 604–618, https://doi.org/10.1016/j.atmosenv.2008.10.033, 2009.
Zhao, F., Liu, C., Cai, Z., Liu, X., Bak, J., Kim, J., Hu, Q., Xia, C., Zhang, C., Sun, Y., Wang, W., and Liu, J.: Ozone profile retrievals from TROPOMI: Implication for the variation of tropospheric ozone during the outbreak of COVID-19 in China, Sci. Total Environ., 764, 142886, https://doi.org/10.1016/j.scitotenv.2020.142886, 2021.
- Abstract
- Introduction
- GEMS Ozone Profile Retrieval Algorithm
- Retrieval Characterization
- Validation using independent reference datasets
- Conclusions for Version 3 and Remarks for the Next Version
- Code availability
- Data availability
- Author contributions
- Competing interests
- Disclaimer
- Acknowledgements
- Financial support
- Review statement
- References
- Supplement