the Creative Commons Attribution 4.0 License.
the Creative Commons Attribution 4.0 License.
 | 14 Apr 2026
Uncertainty assessment of TROPOMI NO2 over Europe using ground-based remote sensing observations
Felipe Cifuentes
Henk Eskes
Ankie Piters
Julian Gomez
John Douros
Gaia Pinardi
Martina M. Friedrich
Enrico Dammers
Manuel Gebetsberger
K. Folkert Boersma
Satellite observations of NO2 are crucial for tracking air pollution and its impacts on health and climate on the global scale. However, these measurements are affected by uncertainties arising from instrumental limitations, retrieval assumptions, and representation errors, making quantification of uncertainties critical for reliable data use. In this study, we assess key sources of uncertainty in tropospheric NO2 columns from the TROPOMI satellite instrument by studying the retrieval steps, and by comparing with Pandora and MAX-DOAS ground-based observations. For this assessment, we make use of high-resolution model simulations available for Europe and the Netherlands. Systematic errors in the stratosphere–troposphere partitioning of NO2 are identified, with TROPOMI overestimating stratospheric columns by up to 0.15 Pmolec cm−2 at high northern latitudes during winter, corresponding to tropospheric biases of up to 1.5 Pmolec cm−2, linked to limitations in the TM5-MP assimilation and magnified by large air-mass factor ratios in winter. In comparing satellite and ground-based observations, representation errors due to sub-pixel horizontal gradients are assessed using high-resolution LOTOS-EUROS simulations, resulting in uncertainties of approximately 6 % at polluted locations. Furthermore, major differences in vertical sensitivity between TROPOMI and MAX-DOAS lead to smoothing errors reaching up to 20 %. Comparisons of TROPOMI with Pandora direct sun measurements show a good seasonal agreement. The negative bias obtained when using the default TM5-MP a-priori profiles is partly mitigated with high-resolution CAMS-European a-priori profiles. A further reduction of this comparison bias is obtained when kilometer-scale simulations over the Netherlands are used, indicating the crucial role of the a-priori spatial resolution in the comparisons. Significant differences in absolute value and seasonality are observed between the MAX-DOAS FRM4DOAS, Pandora direct-sun, and Pandora sky-scan, indicative of the uncertainties in the ground-based remote sensing observations. Finally, uncertainties derived from the histogram of differences between TROPOMI and ground-based measurements generally still exceed expectations from the combination of all estimated uncertainty contributions, indicating that current estimates are likely still optimistic.
- Article
(24659 KB) - Full-text XML
- BibTeX
- EndNote


Nitrogen oxides () are major air pollutants. They are primarily emitted as nitric oxide (NO) from combustion processes and are rapidly converted to nitrogen dioxide (NO2) in the atmosphere through reactions with ozone (O3). NO2 poses risks to human health and environmental stability (de Vries, 2021) and serves as a widely used tracer for anthropogenic emissions from sources such as transportation, power generation, and industry. In addition to its direct impacts, NO2 plays a central role in atmospheric chemistry, contributing to the formation of ground-level O3 and secondary organic and inorganic aerosols (Seinfeld and Pandis, 2006), both of which significantly degrade air quality. NO2 also contributes to acid rain and nitrogen deposition, which can affect terrestrial and aquatic ecosystems (Clark et al., 2013). Consequently, monitoring NO2 is essential for air quality assessment, emission monitoring, and the development of effective mitigation policies to protect public health and the environment.
Satellite-based observations offer a comprehensive global view of NO2, including remote regions where ground-based monitoring stations are rare or unavailable. These observations complement localized data, enhancing air quality assessments. The advancements in satellite spatial resolution enable the study of pollution patterns at regional and local scales, and even allow for the differentiation of specific pollution sources within an area (Goldberg et al., 2021). In addition, satellite datasets offer consistent historical records, facilitating long-term trend analysis and evaluating the effectiveness of air quality policies over time (Zara et al., 2021). Beyond monitoring, they can also be used to derive observationally constrained emission estimates (Streets et al., 2013). The TROPOspheric Monitoring Instrument (TROPOMI) (Veefkind et al., 2012) on the Sentinel-5 Precursor (S5P) satellite has become a cornerstone of atmospheric monitoring. With its high spatial resolution (up to 3.5 × 5.5 km2) and daily global coverage, TROPOMI provides valuable data for air quality management, including tracking pollution dynamics (Fan et al., 2021), identifying emission sources (Beirle et al., 2019a), validating air quality models (Skoulidou et al., 2021) and supporting air quality forecasting. Nonetheless, satellite retrievals are subject to uncertainties arising from factors such as cloud and aerosol properties, surface albedo, vertical distribution of gases, and assumptions in radiative transfer models (Boersma et al., 2004; Chan et al., 2020). Therefore, comparing TROPOMI NO2 observations with independent measurements is crucial to ensure the reliability of the data and its subsequent applications, and also to fully assess uncertainties in the TROPOMI retrieval process.
Satellite NO2 measurements can be compared against airborne (Tack et al., 2021; Riess et al., 2023) or ground-based remote sensing data (Wang et al., 2020) and model simulations. Airborne measurements provide NO2 profiles at high horizontal resolution, but they are not regularly conducted on a global scale, limiting their availability. In contrast, ground-based instruments operate continuously, providing long-term reference data at specific locations. Ground-based measurements of NO2 typically rely on three types of UV-VIS Differential Optical Absorption Spectroscopy (DOAS) instruments, each providing observations sensitive to different altitude ranges. Multi-Axis DOAS (MAX-DOAS) is used for tropospheric column and lower-tropospheric profile observations, while Zenith-Scattered-Light DOAS (ZSL-DOAS) measures the stratospheric column at dawn and dusk. Pandora instruments contribute with direct sun measurements for total column, and sky-scan measurements for tropospheric column NO2 retrievals (Verhoelst et al., 2021).
The TROPOMI NO2 product undergoes routine validation since the beginning of the mission, through the Validation Data Analysis Facility (VDAF) of the S5P Mission Performance Centre (MPC). This validation relies on a comprehensive global network of 31 MAX-DOAS, 25 ZSL-DOAS, and 70 Pandora instruments, as detailed in the quarterly reports (Lambert et al., 2025). Validation results indicate an overall relative difference of −32 % between the TROPOMI official L2 tropospheric NO2 product and MAX-DOAS, which increases to −47 % in highly polluted regions. The relative difference is −8.5 % for total columns and −3.1 % for the stratospheric column. Additionaly, several independent studies have evaluated TROPOMI NO2 product over specific regions using MAX-DOAS (Chan et al., 2020; Dimitropoulou et al., 2020, 2022; Kun et al., 2022; Wang et al., 2020, 2022) and Pandora (Griffin et al., 2019; Ialongo et al., 2020; Judd et al., 2020; Liu et al., 2024; Zhao et al., 2020) measurements. These studies consistently report relative underestimations of TROPOMI tropospheric and total NO2 columns compared to reference measurements. The difference is largely attributed to uncertainties in the vertical NO2 a-priori profile, derived from the 1° × 1° TM5-MP model, whose coarse resolution is insufficient to capture the variations in concentrations near the hotspots. Several studies have demonstrated that replacing TROPOMI coarse TM5-MP NO2 a-priori vertical profile with a high-resolution alternative provides a more accurate representation of meteorological and chemical fields. This increases column concentrations near emission sources by over 30 % and produces steeper concentration gradients around these areas (Griffin et al., 2019; Ialongo et al., 2020; Judd et al., 2020; Liu et al., 2020; Zhao et al., 2020; Douros et al., 2023; Riess et al., 2025; Cifuentes et al., 2025).
Although several studies have compared TROPOMI measurements with various ground-based remote sensing instruments, limited attention has been given to the impact of measurement uncertainties on these comparisons. Each instrument contributes its own uncertainties, arising from limitations in its capabilities, sensitivity to different components of the atmosphere, errors in the retrieval algorithms, and the natural variability of the atmosphere. In addition, the comparison process itself introduces further uncertainty, as the instruments often sample different air masses, have different spatial and temporal resolutions, different vertical sensitive profiles, and use distinct proxies or assumptions to estimate NO2 column densities. These factors can cause differences between the retrieved NO2 columns that stem from methodological and observational differences rather than performance alone, and must be addressed for meaningful comparisons. Understanding the various sources of uncertainty in satellite retrievals is essential for accurately assessing methodological errors. Thoroughly characterizing these uncertainties helps improve retrieval algorithms, supports robust validation, and enhances the data usefulness in models and other interpretative frameworks, such as data assimilation efforts.
The focus of the present research is to study the systematic uncertainties associated with the TROPOMI NO2 retrieval, to improve the interpretation of intercomparisons with ground-based remote sensing instruments such as MAX-DOAS and Pandora. This study seeks to characterize not only the uncertainties inherent to the satellite retrieval itself but also those arising from the comparison process, including differences in spatial representativeness and viewing geometry between instruments that can result in different representations of the same atmospheric features. Furthermore, we quantify the impact of replacing the default TM5-MP a-priori used in TROPOMI with a European product that uses high-resolution (0.1° × 0.1°) CAMS models ensemble output to refine the a-priori assumptions (Douros et al., 2023), and we also discuss the consistency between the ground-based remote sensing products. To this end, we employ both total and tropospheric NO2 columns from TROPOMI, considering the operational product based on TM5-MP and CAMS models ensemble output a-priori assumptions. For the Netherlands, a third retrieval employing LOTOS-EUROS a-priori profiles is also considered. Ground-based reference data include Pandora observations from the Pandonia Global Network (PGN) and MAX-DOAS measurements retrieved from the Network for the Detection of Atmospheric Composition Change (NDACC) rapid delivery (RD) portal. A key contribution of this study is the use of a long and consistent time series across all datasets included in the intercomparisons, incorporating TROPOMI data spanning more than six and a half years with different a-priori assumptions for the European domain.
2.1 TROPOMI
Launched in October 2017, the TROPOMI instrument is a nadir-viewing spectrometer aboard the S5P polar satellite. It measures radiation in the ultraviolet, visible, and infrared spectral regions, allowing the observation of atmospheric trace gases and aerosols (Veefkind et al., 2012). S5P operates in a sun-synchronous, ascending orbit with an Equator overpass time of 13:30 local time (LT). The measured tropospheric NO2 columns have a nadir spatial resolution of 5.5 × 7 km2 before 6 August 2019 and 3.5 × 5.5 km2 thereafter.
The retrieval of NO2 columns follows a three-step process. Initially, the NO2 slant column density (SCD) is derived from TROPOMI's L1b spectral measurements using a DOAS fitting technique. Next, the total SCD is separated into stratospheric and tropospheric components through data assimilation within the TM5-MP model, which operates at a horizontal resolution of 1° × 1° (Williams et al., 2017). Finally, the SCDs are converted into vertical column densities (VCDs) using total and altitude-dependent air mass factors (AMFs). These AMFs are influenced by several factors, including NO2 vertical profiles from TM5-MP, satellite viewing geometry, surface albedo, surface pressure, and the properties of clouds and aerosols. A more detailed explanation of the retrieval process can be found in van Geffen et al. (2022, 2024). The differences between the successive versions of the NO2 retrieval are summarized in the Product Readme File (Eskes et al., 2025).
The tropospheric vertical columns of NO2 (Nv,trop) are calculated using the following equation:
where Ns denotes the total SCD, Ns,strat represents the stratospheric contribution to the SCD, and Mtrop is the tropospheric AMF. The three parameters presented in Eq. (1) correspond to nearly independent retrieval steps, each contributing its own source of uncertainty to the final estimate of NO2 columns (Boersma et al., 2004).
For individual retrievals, uncertainties in Ns include both random and systematic components. Random uncertainties primarily arise from instrumental noise and are estimated operationally on a pixel-by-pixel basis, typically ranging from 0.5 to 0.6 Pmolec cm−2 (van Geffen et al., 2020, 2024). Systematic errors originate from uncertainties in the spectral fitting process, such as wavelength calibration, reference spectra, instrumental spectral characteristics, and temperature-dependent variations in the NO2 absorption cross-section. Their contribution, however, is expected to be negligible (Boersma et al., 2002).
Uncertainties in Ns,strat arise from both the propagation of errors in the SCD and random errors associated with the assimilation approach used to separate stratospheric and tropospheric contributions. Errors in the assimilation can result from inaccuracies in the chemical or meteorological representation of the TM5-MP model, or from misclassification of upper-tropospheric NO2 as stratospheric. In operational settings, the Ns,strat uncertainties for TROPOMI are estimated at 0.2 Pmolec cm−2, representing the global root-mean-square of the observation-minus-forecast residuals over unpolluted regions (van Geffen et al., 2024). However, it has been noted by Rijsdijk et al. (2025) and Glissenaar et al. (2025) that these errors exhibit both seasonal and latitudinal variability.
Uncertainties in Mtrop are predominantly systematic, arising from errors in the a-priori NO2 vertical profile and other model parameters, including cloud fraction and height, surface albedo, and aerosol optical thickness. A random component may also be present, attributable to sampling or interpolation errors. Mtrop uncertainties are assessed on a pixel-by-pixel basis and are generally estimated to be in the range of 30 %–50 % for individual retrievals (van Geffen et al., 2024).
Accordingly, the combined uncertainty (σ) for an individual retrieval can be estimated as shown in Eq. (2) under the assumption that the errors in the three retrieval steps are uncorrelated. When TROPOMI data are averaged spatially or temporally, the random components of individual uncertainties tend to cancel out, while systematic components persist. In this context, each source of uncertainty (σm,s) in Eq. (2) should be adjusted following Eq. (3), where ϕ represents the fraction of each component that is correlated (systematic) and wi is the weight of each measurement. Details on the fraction of TROPOMI retrieval errors that are spatially correlated can be found in Rijsdijk et al. (2025), while the extent of temporal correlation in these errors is analyzed by Glissenaar et al. (2025). Note that uncertainties of averaged (super)observations are thus lower than those associated with individual pixels, and over clean or remote regions are typically dominated by , while over polluted areas, constitutes the primary source of uncertainty.
At the time of this study, TROPOMI data are available in five different versions spanning the observational time series (Eskes et al., 2025). Version 2.4 provides reprocessed data from 30 April 2018 to 25 July 2022, followed by offline versions v2.4 (until 12 March 2023), v2.5 (until 26 November 2023), v2.6 (until 7 September 2024), v2.7.1 (until 20 November 2024), and v2.8 (current version). The record from 30 April 2018 to 26 November 2023 can be considered as one consistent dataset, with minor differences between versions v2.4 and v2.5. However, version 2.6 introduced modifications in cloud retrieval that affected NO2 values, generally resulting in lower concentrations, and it is advised to discard data from this version. Version 2.7.1 incorporated a new albedo dataset, while v2.8 further refined the cloud retrieval.
Additionally, Douros et al. (2023) introduced a European TROPOMI product that replaces the original TM5-MP prior with profiles from the CAMS regional ensemble analysis and global models, significantly improving the spatial resolution to 0.1° × 0.1°. This product is publicly available (https://www.temis.nl/airpollution/no2_cams.php, last access: 9 April 2026) and covers the same time period as the standard TROPOMI dataset and is processed for the retrieval versions discussed above. This product results in increased column levels over the hotspots, as illustrated in Fig. 1. Initial validation conducted by Douros et al. (2023) showed that this product outperforms the standard TROPOMI version. Further details on how to replace TROPOMI operational a-priori are outlined in the Product User Manual (Eskes et al., 2024), and in Douros et al. (2023).
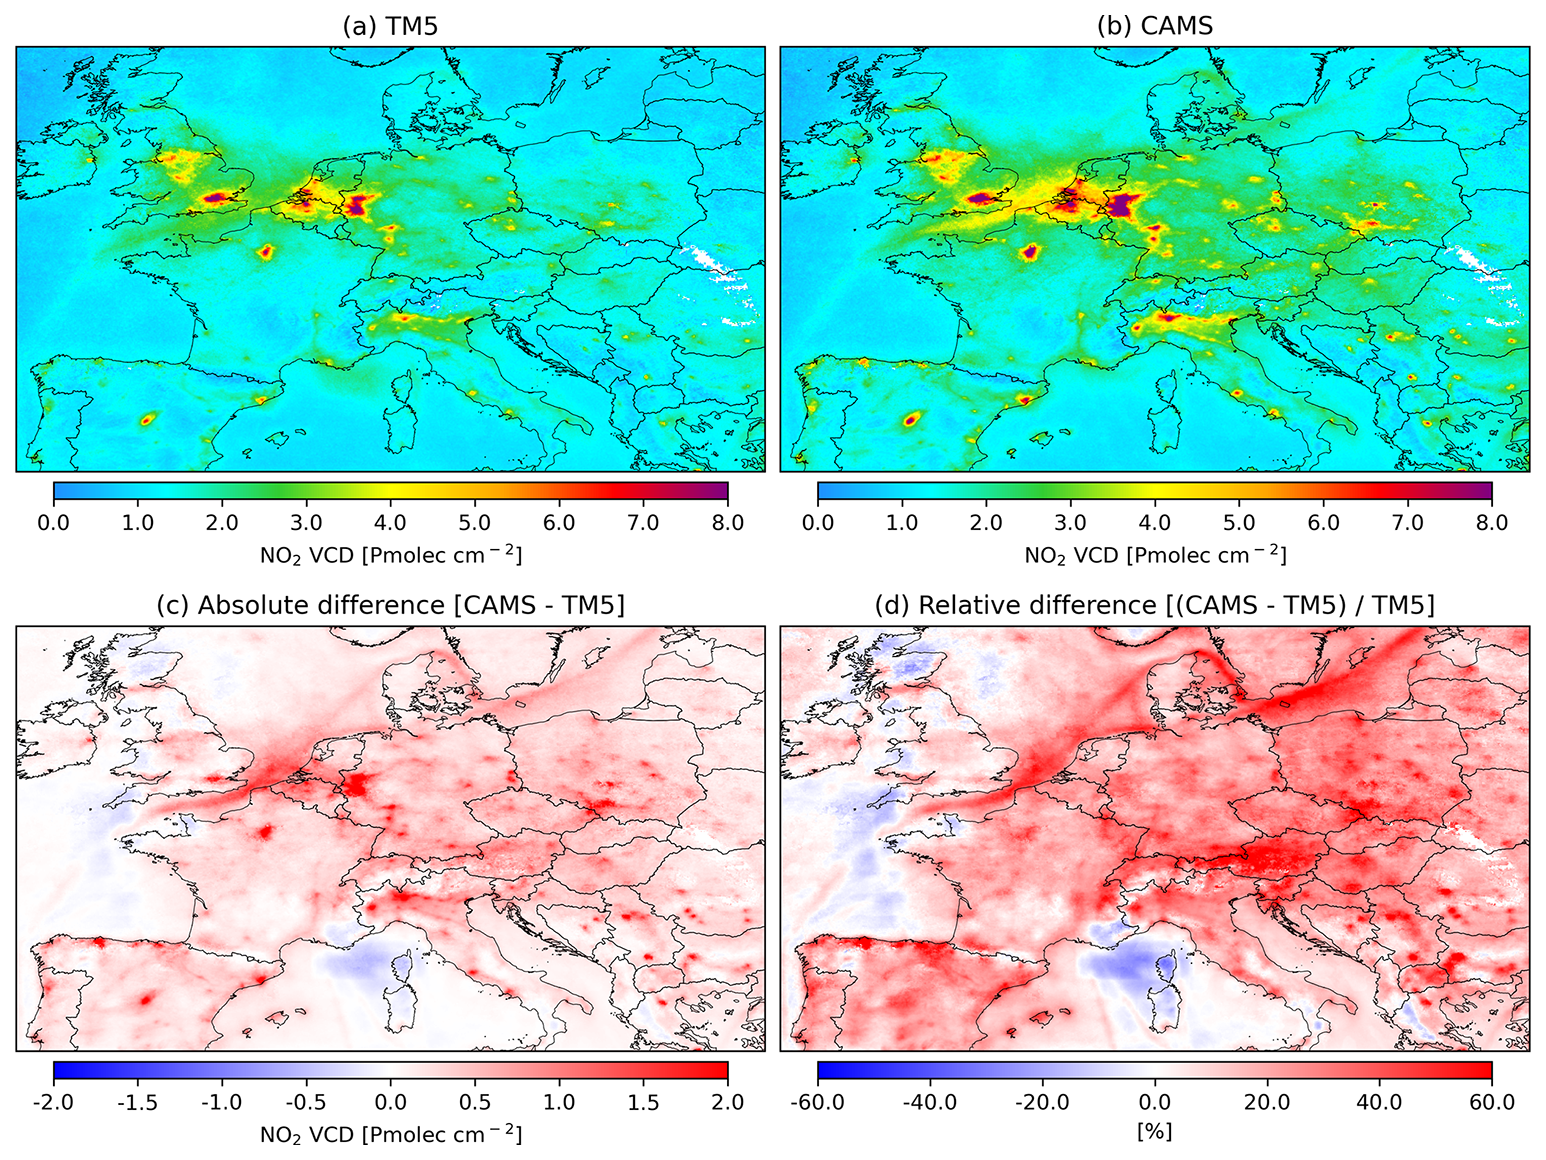
Figure 1Comparison of TROPOMI tropospheric NO2 columns for July 2018 using different a-priori profiles. Shown are results retrieved with TM5-MP and CAMS a-priori profiles at different resolutions. (a) TROPOMI with TM5-MP a-priori profile (1° × 1° resolution). (b) TROPOMI with CAMS a-priori profile (0.1° × 0.1° resolution). (c) Absolute difference between TROPOMI retrieved with CAMS and TM5-MP a-priori profiles (d) Relative difference (%) between TROPOMI retrieved with CAMS and TM5-MP a-priori profiles.
In this study, we use TROPOMI NO2 observations retrieved with TM5-MP and CAMS a-priori profiles for the period 1 May 2018 to 31 December 2024, consisting of the v2.4 reprocessed data and subsequent offline versions up to v2.8. The v2.6 offline data are excluded from the analysis, following the product readme file (Eskes et al., 2025). To improve data reliability, pixels with a quality assurance value below 0.75 are removed, effectively filtering out pixels with cloud radiance fractions greater than 0.5 and reducing the influence of uncertain retrievals (Eskes et al., 2024; van Geffen et al., 2022, 2024). For Europe, this means that approximately 45 % of the observations are included.
2.2 Pandora
The Pandora instrument is a ground-based spectrometer designed to measure sunlight in the UV-VIS spectral range (280–525 nm) with a high spectral resolution of 0.6 nm (Herman et al., 2009). It delivers high-quality radiance measurements from direct-sun observations or sky scans, facilitating the retrieval of total and tropospheric column densities, as well as vertical profile information, for trace gases such as NO2, O3, SO2, H2O and CH2O (Tzortziou et al., 2023; Herman et al., 2019).
NO2 total vertical column densities are obtained through direct-sun (DS) measurements, during which the instrument actively tracks the sun to capture direct sunlight. SCDs are derived using a DOAS technique within the 400-470 nm spectral range, and subsequently converted to total column densities by applying direct-sun geometry AMF (Herman et al., 2009; Cede et al., 2025). Direct-sun measurements are essential for validation and evaluation because they provide low uncertainties in the AMF, as they are nearly independent of radiative transfer models (RTM) and atmospheric composition knowledge (Zhao et al., 2020).
In sky-scan mode, the Pandora instruments can retrieve tropospheric NO2 and provide vertical profile information. For this, sky radiance measurements are performed at multiple pointing zenith angles (PZA, minimally at 0, 60, 75, 88, and 89°) at a fixed azimuth. It is important to note that PZA values are referenced to the zenith; therefore, a PZA of 75° corresponds to an elevation angle of 15° when referenced to the horizon. These radiance measurements are used to derive SCDs of NO2 as well as the O2–O2 dimer. The SCDs of the O2–O2 dimer are used to determine a representative AMF. This AMF is then applied to the difference in NO2 SCDs at different elevation angles to calculate the tropospheric column (Marais et al., 2021; Cede, 2024; Cede et al., 2025).
In this study, we use total NO2 column measurements processed with retrieval version rnvs3p1-8 and tropospheric column measurements processed with the retrieval version rnvh3p1-8, using Blick Processing Software 1.8 (Cede et al., 2025; Cede, 2024). Data from 18 stations across Europe, as listed in Table 1, are analyzed, with their locations shown in Fig. 2. Pandora column measurements are filtered by selecting only data with quality flags 0, 1, 10, and 11, which indicate assured or non-assured high- and medium-quality data. The monthly mean time series of filtered and collocated Pandora DS and sky-can observations with TROPOMI are shown in Figs. B1 and B2, respectively, indicating the periods of data availability for each station analyzed in this study.
Table 1PGN and MAX-DOAS sites used for validation.
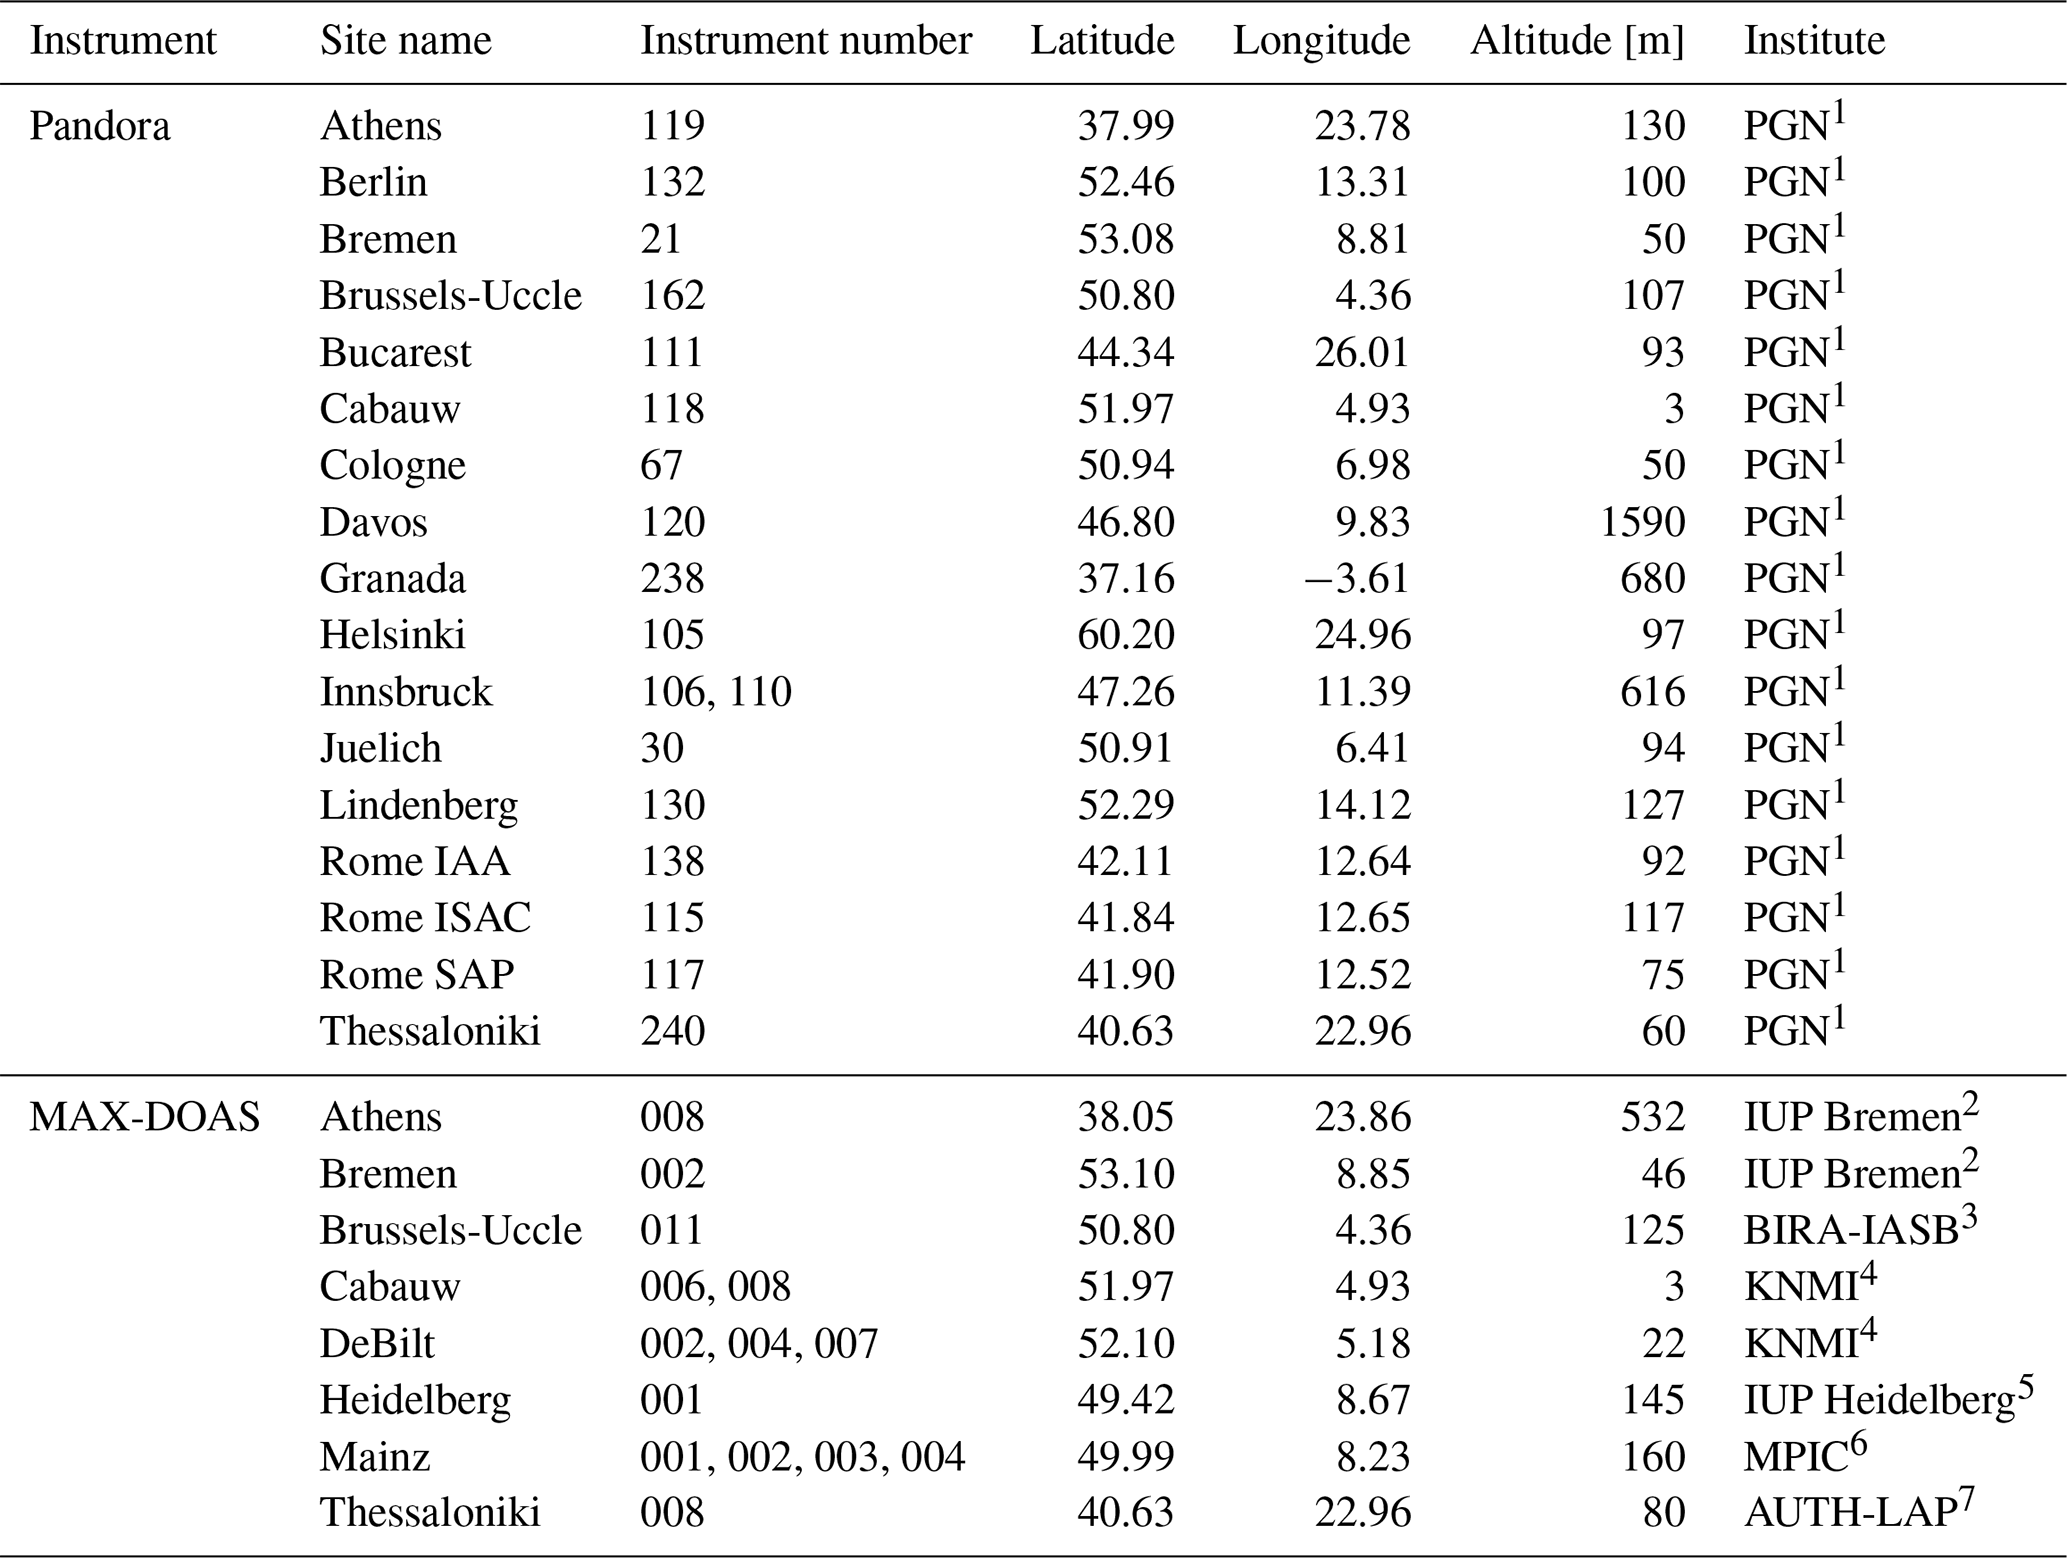
1 Pandonia Global Network. 2 Institute for Environmental Physics, University of Bremen. 3 Royal Belgian Institute for Space Aeronomy. 4 Royal Netherlands Meteorological Institute. 5 Institute of Environmental Physics, University of Heidelberg. 6 Max Planck Institute for Chemistry. 7 Laboratory of Atmospheric Physics, Aristotle University of Thessaloniki.
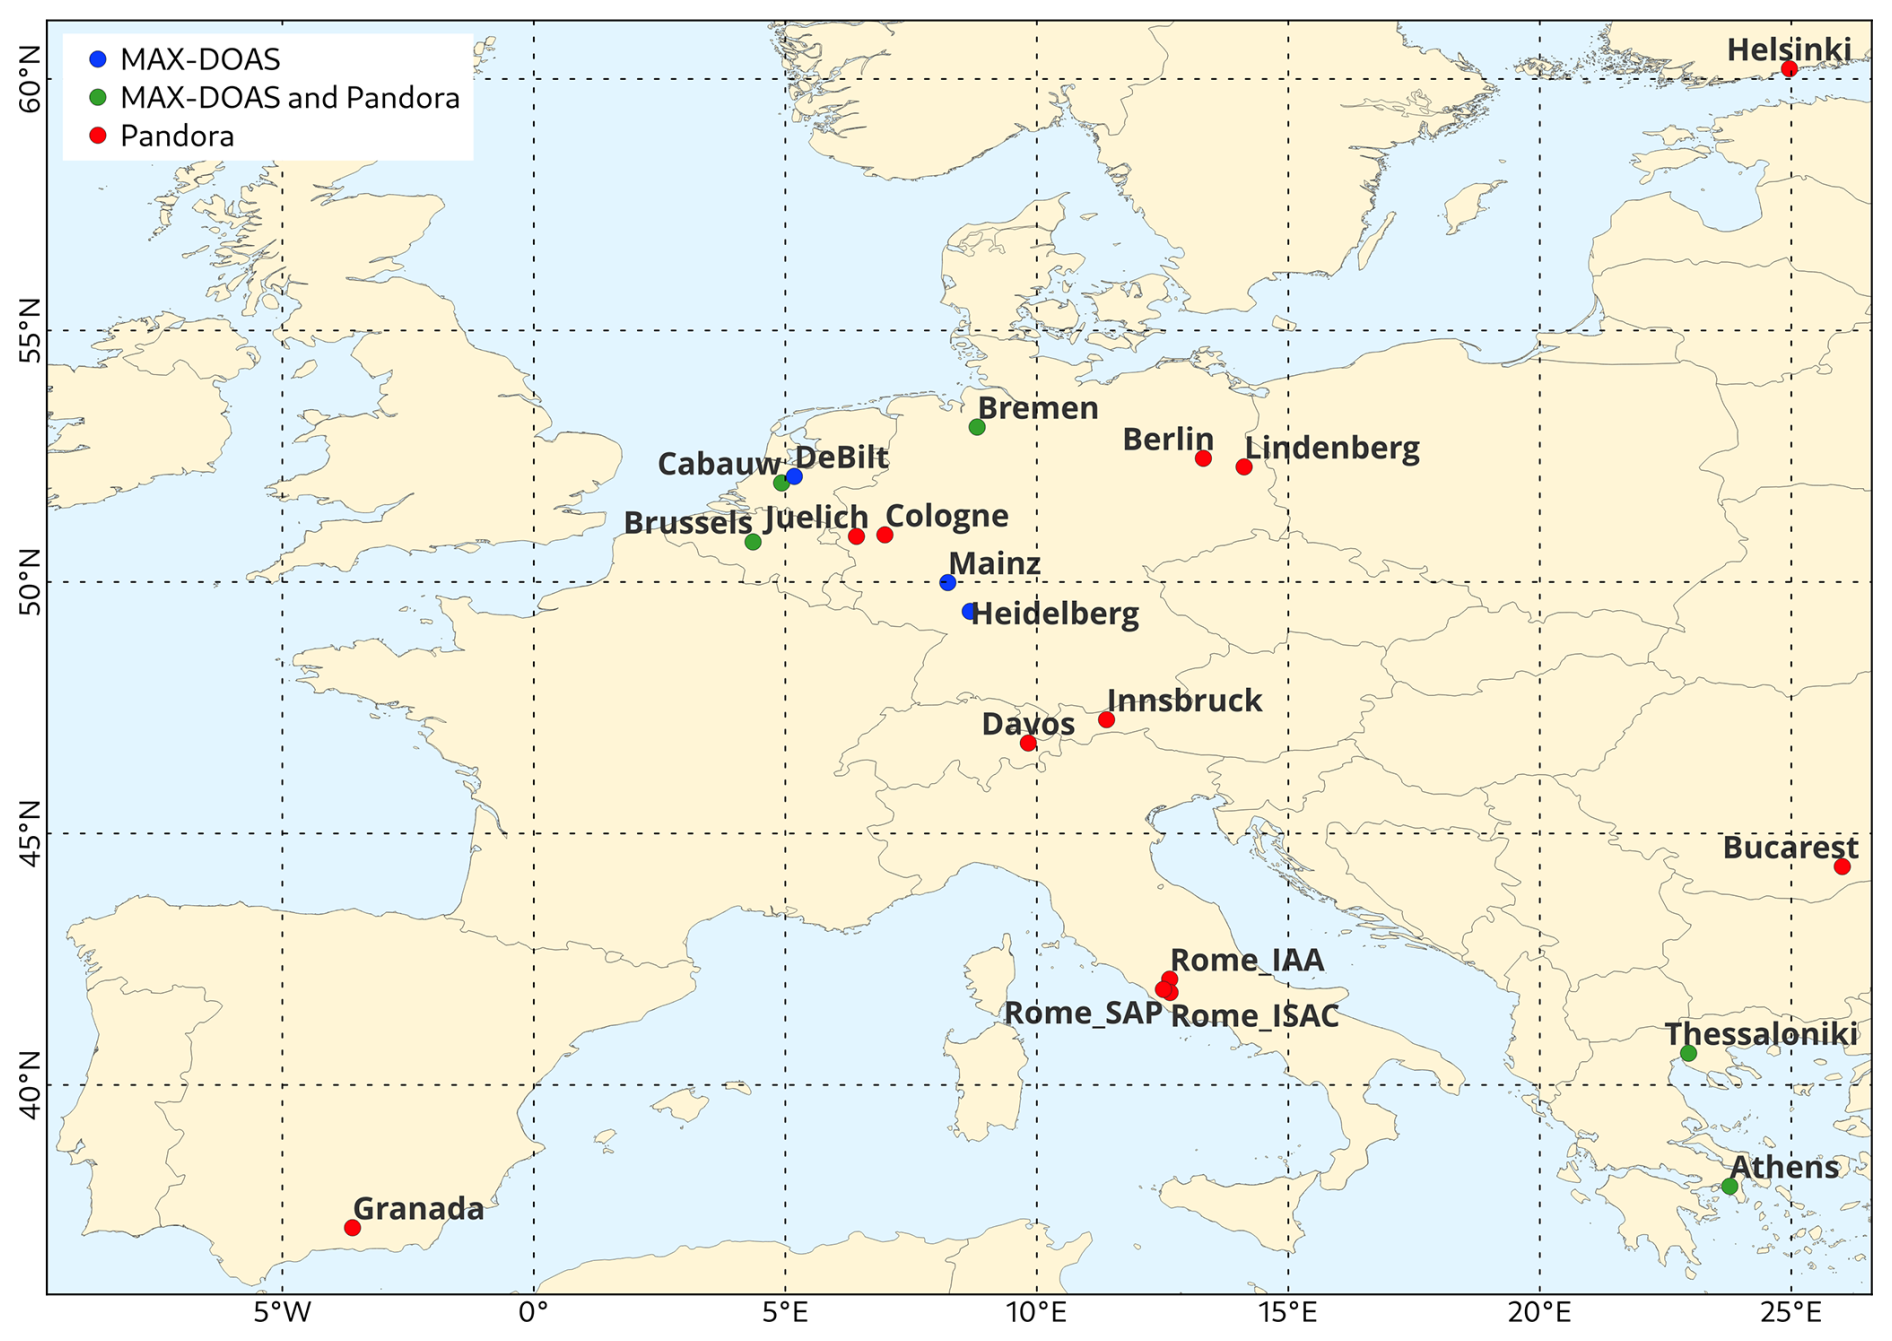
Figure 2Map of FRM4DOAS MAX-DOAS and PGN Pandora sites used for validating the TROPOMI NO2 product.
As described by Cede (2024), uncertainties in Pandora NO2 retrievals are categorized into three types based on their correlation structure: independent (zero correlation, representing random errors), common (infinite correlation, representing systematic errors), and structured (partially correlated, with correlation greater than zero but not infinite). At the Level 1 (L1) stage, the uncertainties currently reported mainly concern the independent uncertainty component, which stems from instrumental detector noise and atmospheric variability. At the spectral fitting level (L2fit), additional uncertainties are introduced that are more systematic and structured in nature. These arise from the field calibration technique (MLE) (Herman et al., 2009), including the estimation of the SCD amount and temperature in the reference spectra, effective height, and sampling, as well as from structured contributions due to other gases present in the fitting window. In the final L2 data product, uncertainties caused by AMF errors, mainly associated with the selected effective height of the NO2 layer in DS algorithm, are also included. Pandora files include independent, common, and structured uncertainties for total NO2 (DS algorithm), but only independent uncertainties for tropospheric columns (Sky-scan algorithm). In this study, we supplement the tropospheric uncertainty estimates with an additional common uncertainty of 20 %, adopted as a conservative approximation to enable more consistent comparisons.
2.3 MAX-DOAS
The Multi-Axis Differential Optical Absorption Spectroscopy (MAX-DOAS) technique is a remote sensing method designed to measure the vertical and horizontal distributions of atmospheric trace gases and aerosols (Honninger et al., 2004; Dimitropoulou et al., 2020). This technique utilizes spectroscopic observations of scattered sunlight in the UV-VIS spectral range at various elevation viewing angles (typically 2, 4, 6, 8, 10, 12, 15, 30, and 90°) with respect to the horizon, and a DOAS technique to derive SCDs. By observing sunlight scattered across different angles, MAX-DOAS instruments achieve greater sensitivity to near-surface absorbers and can retrieve vertical profile information, which enhances the accuracy of measurements within the lower atmosphere (Honninger et al., 2004).
The Fiducial Reference Measurements for DOAS (FRM4DOAS) initiative, led by the European Space Agency (ESA), aims to ensure the harmonization and quality assurance of MAX-DOAS measurements across different locations and instruments. FRM4DOAS provides a centralized data processing system, standard retrieval algorithms, and intercomparisons to improve data consistency for satellite validation and air quality studies. By establishing reference measurements, FRM4DOAS enhances the reliability of MAX-DOAS data for use in atmospheric monitoring networks and climate research (Van Roozendael et al., 2024). Publicly accessible MAX-DOAS measurements following FRM4DOAS guidelines are provided by the NDACC RD data portal (https://www-air.larc.nasa.gov/missions/ndacc/, last access: 9 April 2026).
In the FRM4DOAS operational processor, NO2 retrieval is performed using the Mexican MAX-DOAS Fit (MMF) (Friedrich et al., 2019), which employs an optimal estimation method (OEM) and provides vertical profiles and averaging kernels (AKs) on a pre-defined altitude grid from 0 to 4 km using 200 m steps. An alternative approach, processed in parallel, is the Mainz Profile Algorithm (MAPA) (Beirle et al., 2019b), which employs a parameterized profile shape method. MAPA is used to constrain the MMF data; therefore, only MMF data consistent with the MAPA results are uploaded to the NDACC RD portal. The MMF algorithm retrieves data in two sequential steps: first, it determines the aerosol profile, followed by the trace gas retrieval, which incorporates the retrieved aerosol profile into its forward model. Both steps follow the same structure, consisting of a forward model and an inversion algorithm. According to Friedrich et al. (2019), tropospheric NO2 retrievals using the MMF algorithm are influenced by random noise, smoothing errors, spectroscopic uncertainties, and systematic forward model errors. The total retrieval uncertainty in the tropospheric column is estimated at 20.3 %, with major contributions from smoothing (12.5 %), aerosol extinction profile errors (5.1 %), spectroscopy (3.0 %), and measurement noise (2.4 %).
This study uses data from 8 stations, centrally processed using the FRMDOAS.01.01 processor with the MMF retrieval algorithm, constrained with MAPA (Van Roozendael et al., 2024). Table 1 provides a description of the stations, while their locations are shown in Fig. 2. Furthermore, the monthly mean time series of filtered and collocated MAX-DOAS observations with TROPOMI is shown in Fig. B3, illustrating the periods of data availability.
2.4 LOTOS-EUROS
LOTOS-EUROS is a three-dimensional offline chemical transport model (CTM) developed in the Netherlands, used for operational air quality forecasts in the Netherlands and throughout Europe (Manders et al., 2017). In this study, we use LOTOS-EUROS version 2.2.009 to generate an hourly, high-resolution (1.3 × 1.7 km2) NO2 dataset covering the Netherlands for the period 2019–2023. The simulations are carried out using 12 vertical layers, reaching from the surface up to approximately 9 km altitude.
The simulations use a one-way nesting with three domains: a parent domain over Europe (15° W–35° E, 35–70° N), an intermediate domain over northwestern Europe (2–16° E, 47–56° N), and a high-resolution target domain over the Netherlands (3.1–7.5° E, 50.3–53.7° N). The model is driven by ECMWF Integrated Forecast System (IFS). European emissions are obtained from the CAMS-REG-v5.1 inventory (Kuenen et al., 2022), whereas emissions for the Netherlands and adjacent areas within the target domain are derived from the national Emission Registration (ER; https://www.emissieregistratie.nl/, last access: 9 April 2026) and the Gridding Emission Tool for ArcGIS (GrETA) datasets, available at 1 × 1 km2 resolution. Annual emissions are temporally disaggregated using monthly, daily, and hourly profiles by source category, and vertically distributed by sector, with industrial and power plant emissions allocated according to typical stack heights. Further details are provided in Manders et al. (2021).
LOTOS-EUROS is a contributing model to the CAMS European air-quality ensemble, which provides forecasts of key atmospheric pollutants based on an ensemble of advanced chemical transport models. Within CAMS, LOTOS-EUROS is routinely evaluated against in situ monitoring networks and TROPOMI satellite retrievals, as well as benchmarked against the performance of the other ensemble members (Peuch et al., 2022; Colette et al., 2025). The model has also participated in multiple intercomparison exercises, in which it has consistently shown strong performance (Bessagnet et al., 2016; Colette et al., 2017; Vivanco et al., 2018). With the specific emission dataset and model configuration applied in this study, the resulting simulations have been evaluated against TROPOMI satellite observations and ground-based measurements over the Netherlands as part of the Nationaal Kennisprogramma Stikstof (NKS) program (Dammers et al., 2026).
2.5 Comparison uncertainties
Differences in the way satellite and ground-based instruments sample atmospheric NO2 contribute to the uncertainties when comparing measurements from these instruments. As schematically illustrated in Fig. 3, MAX-DOAS (and also Pandora sky-scan observations) measure NO2 from the ground along the telescope line of sight at varying elevation angles, capturing contributions from local emissions within a few kilometers. Indeed, according to Irie et al. (2011), the horizontal spatial representativeness of MAX-DOAS measurements for the lowest 1 km thick layer spans 3–11 km in the UV and 3–15 km in the VIS. In contrast, satellite observations sample NO2 from space and report average columns over the satellite footprint (3.5 × 5.5 km2 at nadir). This difference in observation geometry also results in each instrument having different sensitivities to atmospheric NO2 as a function of altitude. As shown in the inset of Fig. 3, MAX-DOAS is most sensitive to near-surface NO2, as indicated by its AKs, which peak near the surface and decrease with altitude. In contrast, TROPOMI is less sensitive to surface concentrations, with AKs that are low near the surface and increase with altitude.
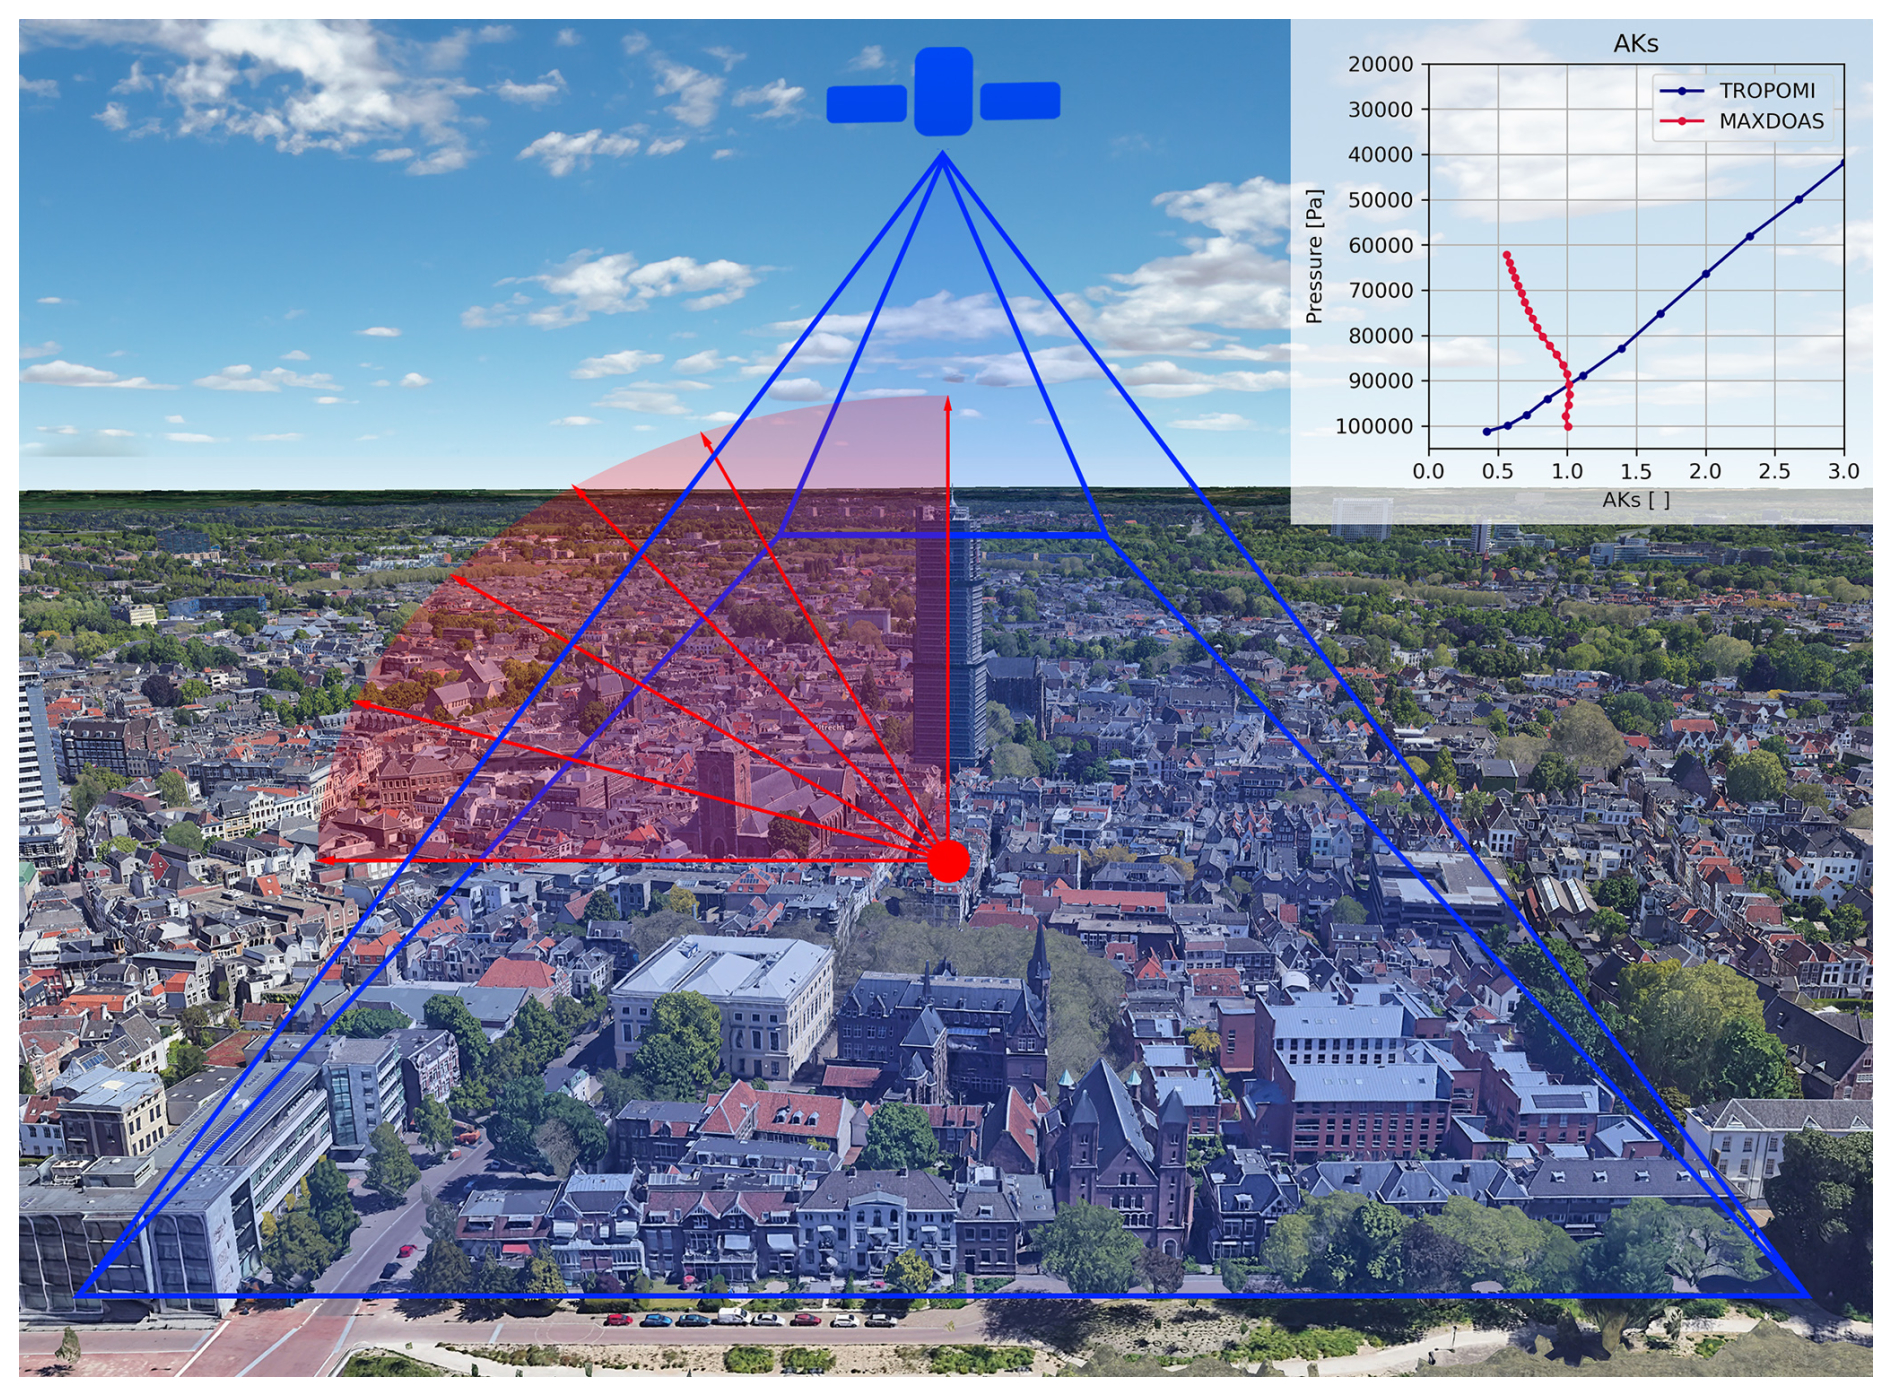
Figure 3Illustration of collocated satellite and MAX-DOAS measurement modes over the city of Utrecht. The inset shows the annual mean averaging kernels for MAX-DOAS and TROPOMI at the De Bilt station. Note that the illustration is not to scale and is intended as a schematic representation.
Overall, ground-based and satellite observations have different spatial and temporal resolutions and sample partly different air masses, which introduces a representation error when comparing the measurements from the instruments. For example, in a traditional (single-axis) MAX-DOAS instrument, the line of sight always points in the same direction. If that direction happens to intersect a localized polluted area, the MAX-DOAS measurement will reflect higher concentrations, whereas TROPOMI, which averages over its entire footprint, is expected to report lower concentrations by including cleaner surrounding areas. Additional differences between instrument measurements may arise from inconsistencies in the retrieval methods, such as the choice of temperature-dependent cross-sections, the fitted species in the DOAS steps, or the treatment of aerosols (Lambert et al., 2025; Verhoelst et al., 2021).
Note that when comparing two instruments, the statistical distribution of the differences between their measurements is expected to fall within the range defined by the combined uncertainties of the individual instruments and the representation errors inherent to the comparison. This can be estimated as shown in Eq. (4), under the assumption that satellite, ground-based, and representation uncertainties are uncorrelated.
The methods employed in this study consist of three main components. First, we re-estimate stratospheric systematic errors in the TROPOMI retrieval to better characterize its uncertainty budget. Second, we establish a representation uncertainty to account for differences in spatial sampling and vertical sensitivity when comparing TROPOMI data with ground-based remote sensing instruments. Finally, an intercomparison between TROPOMI and the ground-based instruments is performed, incorporating the revised TROPOMI uncertainty estimates, along with those from the ground-based data and the previously evaluated representation effects.
3.1 Stratospheric retrieval uncertainties in TROPOMI
In the TROPOMI retrieval, the separation of the total SCD into stratospheric and tropospheric components is performed using a data assimilation system. When the CTM simulation of the stratospheric NO2 column closely matches the TROPOMI SCDs over clean oceanic regions during the assimilation, the difference between the observed total SCDs and the assimilated stratospheric SCDs is effectively interpreted as the tropospheric SCD within the TROPOMI field of view. Uncertainties in the stratospheric partition are thus mainly caused by errors in the chemistry-transport model TM5-MP and in the data assimilation analysis and short-range forecast. The discrepancy between observations and model forecasts (OmF) over unpolluted scenes provides an upper bound on the uncertainty of the model grid-cell mean stratospheric NO2 columns (Dirksen et al., 2011). In remote, unpolluted regions, the total NO2 column is dominated by its stratospheric component; consequently, OmF differences can be attributed largely to errors in the modeled stratospheric contribution itself. Rijsdijk et al. (2025) analyzed the root-mean-square error (RMSE) of the OmF differences for TROPOMI as a function of latitude and day of year to derive uncertainty estimates for the stratospheric column. This approach provides a more realistic assessment of stratospheric-column uncertainty than the operational values based on the global mean RMSE. In the present study, our focus is on identifying systematic patterns in the OmF that can reveal biases in the stratospheric column and subsequently be propagated into the tropospheric estimates. To this end, we analyze OmF data at a monthly resolution. We use TROPOMI geometrical NO2 vertical columns, calculated as the slant column divided by the geometrical AMF, for the period 2019–2021, regridded into superobservations at a spatial resolution of 1° × 1° to match the TM5-MP model grid. These superobservations are compared with TM5-MP-forecasted total NO2 columns for the same period. Following the methodology of Rijsdijk et al. (2025) and Glissenaar et al. (2025), the OmF analysis is restricted to clean regions, defined here as pixels with tropospheric NO2 columns below 0.8 Pmolec cm−2.
3.2 Representation uncertainty due to horizontal gradients
We employ high-resolution (approximately 1.3 × 1.7 km2) simulations from the LOTOS-EUROS model over the Netherlands to investigate the fine-scale spatial variability of NO2 and to assess how much of this variability can be resolved by a typical TROPOMI pixel, and how that compares with a ground-based observation. The analysis focuses on the regions surrounding the ground-based instruments at Cabauw and De Bilt. Cabauw is situated in a relatively homogeneous environment, whereas De Bilt exhibits strong concentration gradients that vary markedly with wind direction (Vlemmix et al., 2015).
To quantify the representation uncertainty associated with comparing TROPOMI observations to ground-based measurements, we implemented the following procedure. First, we defined a grid of 4 × 4 LOTOS–EUROS model pixels (6.8 × 5.2 km2), approximating the average TROPOMI pixel size (6 × 5.5 km2). The bounding box was initially positioned such that it contained the model pixel whose coordinates coincide with each ground-based station. We then calculated the mean concentration over the 4 × 4 grid at a typical TROPOMI overpass time (13:30 LT) and estimated the error relative to the single model pixel corresponding to the station location. To emulate the quasi-random offset between TROPOMI pixel footprints and the station location, the 4 × 4 box was systematically shifted while keeping the station coordinates fixed, so that the station occupied each of the 16 pixels within the box. Finally, for each day, we computed the root-mean-square error (RMSE) across all 16 configurations to quantify the representativeness error.
While the preceding analysis characterizes the random errors that may arise when comparing individual TROPOMI observations with ground-based measurements, we also sought to investigate potential systematic effects. To do so, we applied the same procedure described above using seasonal model averages instead of daily outputs, thereby mimicking aggregated TROPOMI observations. In this way, short-term variability in the chemical fields and meteorology is averaged out, isolating the more persistent components of the representativeness error. As an additional step, we repeated the analysis at both daily and seasonal scales using a larger modeling box of 10 × 14 pixels (roughly 13 × 24 km2), corresponding to the nominal ground footprint of Ozone Monitoring Instrument (OMI) at nadir. OMI is an earlier-generation satellite instrument (the predecessor of TROPOMI) which also provides retrievals of tropospheric NO2 columns. By comparing OMI-equivalent aggregated satellite columns to ground-based measurements, we aim to assess how the coarser spatial resolution of OMI, compared to TROPOMI, affects the representation of horizontal gradients and the consistency between satellite and ground-based observations.
3.3 Representation uncertainty due to vertical sensitivity of the instruments
Beyond the spatial and temporal mismatches between remote-sensing instruments that must be addressed for meaningful intercomparisons, each measurement exhibits distinct characteristics stemming from its sensitivity to different atmospheric layers and the prior atmospheric composition profiles employed in the retrieval process (Rodgers and Connor, 2003; von Clarmann, 2014). To better understand if two remote sensing instruments agree within the bounds of their known limitations, it is possible to estimate a smoothing error (Ssmoothing), defined by Rodgers and Connor (2003) using the following equation:
where a1 and a2 are the respective AKs of the instruments, and Sc represents the a-priori covariance matrix of the comparison ensemble. Note that Sc is a square matrix with n × n elements, where n is the number of vertical levels used in the retrieval of the remote sounding instrument. Each element in Sc can be estimated as defined by Rodgers (2000):
where ε is the expected value operator, y is the ensemble a-priori at a given vertical level, and is the mean a-priori ensemble of the remote sounding instruments at that same level.
In this study, we estimate the smoothing error arising from the comparison of the TROPOMI operational product and MAX-DOAS FRM4DOAS measurements using Eq. (5). We restrict our analysis to the period 2019–2020 because TROPOMI L2 files do not routinely provide the a-priori profile information used in the retrieval, and reconstructing this information is computationally demanding. We present results for the stations in Athens, Bremen, De Bilt, and Mainz, which offer a good number of collocated MAX-DOAS and TROPOMI measurements over these two years (see Fig. B3). A key consideration in this procedure is that the TROPOMI a-priori profiles and AKs are interpolated to match the vertical resolution of the MAX-DOAS FRM4DOAS retrievals. This introduces a mismatch because MAX-DOAS data are only available up to 4 km, whereas TROPOMI provides AKs and a-priori profiles for the full atmospheric column. To ensure comparability, TROPOMI information is therefore truncated to the vertical extent of the MAX-DOAS retrievals. The resulting smoothing error estimates are reported by season to investigate potential seasonal variability at this scale.
3.4 Satellite and ground-based intercomparison approach
We assess the TROPOMI total NO2 column by comparing it with Pandora direct sun observations. For this analysis, we use the TROPOMI summed total column, which represents the sum of the retrieved stratospheric and tropospheric vertical column densities. As explained in the ATBD (van Geffen et al., 2024), this is not equal to the standard total column retrieval reported in the TROPOMI L2 file. The summed product reduces the dependence on the prior TM5-MP profile, and in particular on the ratio between the stratospheric and tropospheric sub-column, helping to mitigate potential systematic retrieval errors (van Geffen et al., 2022; Ialongo et al., 2020). TROPOMI tropospheric NO2 observations are compared with MAX-DOAS and Pandora sky-scan measurements. Additionally, we tested the consistency between the ground-based instruments by comparing them directly with each other, without the constraint of matching the TROPOMI overpass time.
To ensure spatial collocation when comparing with the satellite, TROPOMI measurements are matched to the corresponding Pandora and MAX-DOAS instruments when a valid TROPOMI pixel footprint encompasses the coordinates of the ground-based equipment. For temporal alignment, MAX-DOAS and Pandora observations are averaged within a 1 h window (±30 min) centered on the TROPOMI satellite overpass time. For comparisons exclusively between ground-based instruments, temporal matching is performed by taking the timestamp of each MAX-DOAS observation and averaging all Pandora measurements within a 1 h window. Note that the choice of time window influences both the number of collocations and the associated comparison errors. As illustrated in Fig. B4, the difference between MAX-DOAS FRM4DOAS and Pandora DS observations, after subtraction of the stratospheric component, decreases when the time window is reduced from 60 to 10 min; however, approximately half of the coincident observations are lost. Therefore, a 1 h time window is selected to preserve a sufficient number of collocations for robust statistical evaluation.
The agreement between TROPOMI and ground-based measurements is assessed using mean bias (MB), normalized mean bias (NMB), root mean square error (RMSE), correlation coefficient (R), and regression slopes. Regression is performed using the reduced major axis (RMA) method, which is preferred when both the dependent and independent variables are subject to measurement uncertainty. Unlike standard least-squares regression, which minimizes only the vertical deviations and can underestimate the true slope. Detailed definitions of these statistical metrics can be found in Appendix A.
To account for instrument uncertainties in the comparison, we use the following approach. For TROPOMI, we used the uncertainties provided in the L2 operational files for each individual retrieval and adjusted them for stratospheric errors as estimated in this study and by Rijsdijk et al. (2025). When calculating monthly or longer-term averages, these uncertainties were scaled by a factor of 0.3 to reflect only the correlated errors, following the recommendation of Glissenaar et al. (2025). For MAX-DOAS, the NDACC files report uncertainties associated solely with spectroscopy and measurement noise; we therefore added an additional error component based on Friedrich et al. (2019), who suggest a total retrieval uncertainty of 20.3 %. For Pandora direct-sun observations, we used the independent, common, and structured uncertainties provided in the data files, resulting in uncertainties of about 5 %. In the case of Pandora sky-scan observations, where only independent uncertainties are reported, we included an additional 20 % common (systematic) error, in line with what is assumed for MAX-DOAS retrievals.
Based on the instrument uncertainties described above, together with a representation error estimated later in this study (see Sect. 4.2 and 4.3), we calculate the combined uncertainty for the comparisons using Eq. (4). Table 2 summarizes the average instrument uncertainties over the study period and across the stations included in this analysis. The values reported here reveal a pronounced seasonality in the smoothing term, and they also show that the Pandora DS measurements exhibit notably lower uncertainties compared with the other measurement types.
Table 2Individual retrieval uncertainties for each of the instruments sample at the locations of the European stations included in this study.
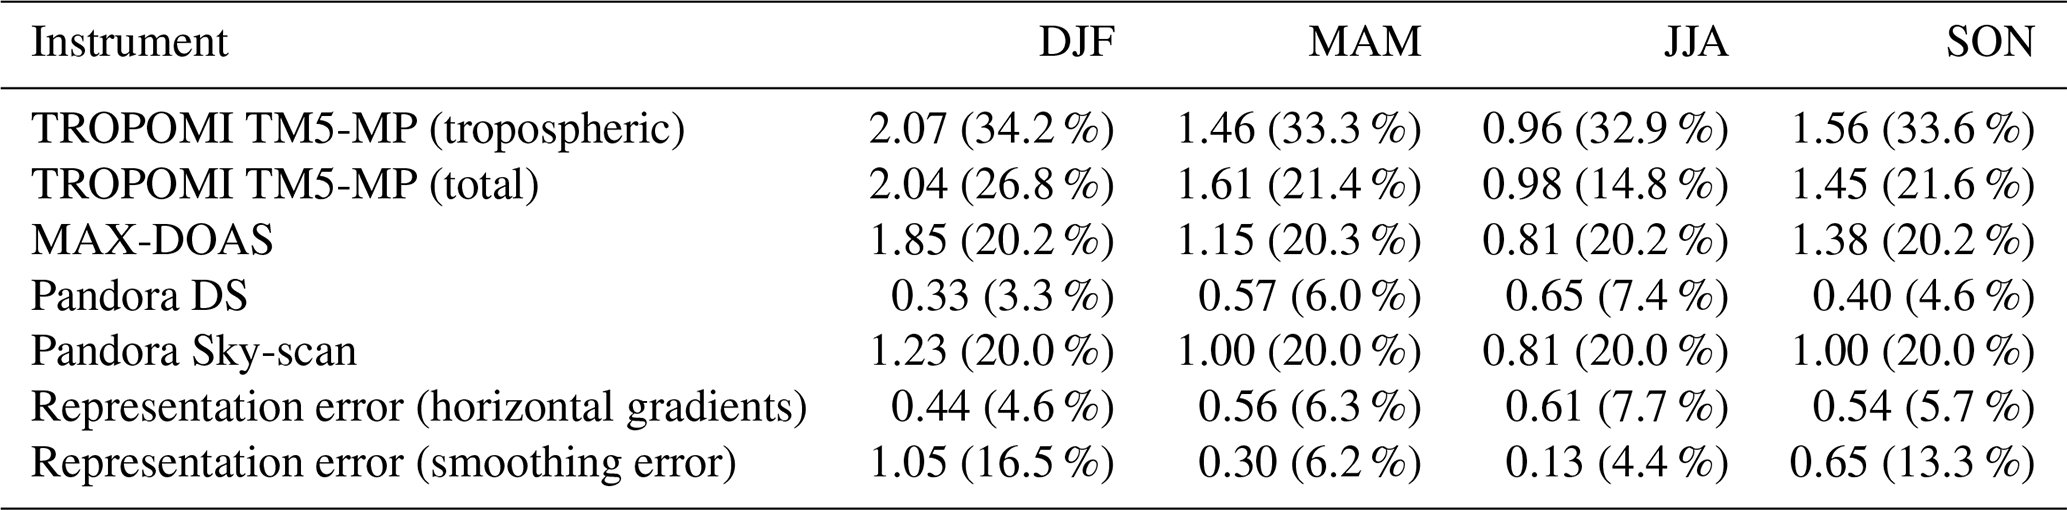
Uncertainties provided in Pmolec cm−2 and in percentage within brackets. Representation errors estimated for De Bilt station as representative of Northern Europe. Smoothing errors were estimated only for the comparisons between TROPOMI with TM5-MP a-priori and MAX-DOAS FRM4DOAS.
4.1 Influence of stratospheric biases on the TROPOMI retrieval
Uncertainties in the stratospheric NO2 column of TROPOMI were recently assessed by Rijsdijk et al. (2025), who evaluated the RMSE of OmF differences over unpolluted scenes, binned by latitude and season. We replicate this approach here, and the results are shown in Fig. B5. Note that the current TROPOMI retrieval uncertainty estimate uses a fixed mean value of 0.2 Pmolec cm−2. Nonetheless, there is a clear seasonal and latitudinal dependence, the largest uncertainties occur between 30 and 60° during Northern Hemisphere winter, reaching up to 0.4 Pmolec cm−2. Rijsdijk et al. (2025) attribute this behavior to elevated stratospheric NO2 concentrations in the Northern Hemisphere, which amplify absolute errors. The uncertainty of the stratospheric NO2 column further depends on the quality of the data assimilation and the observation geometry, both of which vary with latitude and season (van Geffen et al., 2020, 2024). Larger retrieval uncertainties and modeling deficiencies in NO2 simulations during winter have also been reported by Douros et al. (2023). Moreover, polar regions are not observed during winter due to the absence of sunlight, resulting in an accumulation of model biases over the dark pole, further degrading stratospheric column estimates at high latitudes in late winter. TROPOMI stratospheric NO2 is routinely evaluated against NDACC ZSL-DOAS measurements, demonstrating agreement within 3 % across seasonal and latitudinal variations (Lambert et al., 2025).
In addition to assessing the magnitude of the uncertainties, we also investigate the systematic direction (bias) of the associated errors, which is relevant for our study. Figure 4 illustrates the monthly-mean OmF for TROPOMI superobservations aggregated onto the TM5-MP grid. Note that although the quantities are derived from geometric NO2 vertical columns, restricting the analysis to remote, unpolluted scenes ensures that the tropospheric contribution is minimal. Under these conditions, discrepancies in the column can be interpreted predominantly as biases in the stratospheric component. A pronounced seasonal signal is observed, characterized by persistently negative OmF values during the boreal winter (November–March), most notably at high northern latitudes. This behavior indicates that the model forecasts systematically exceed the TROPOMI observations during this period, implying a positive bias in the estimated stratospheric column under wintertime conditions.
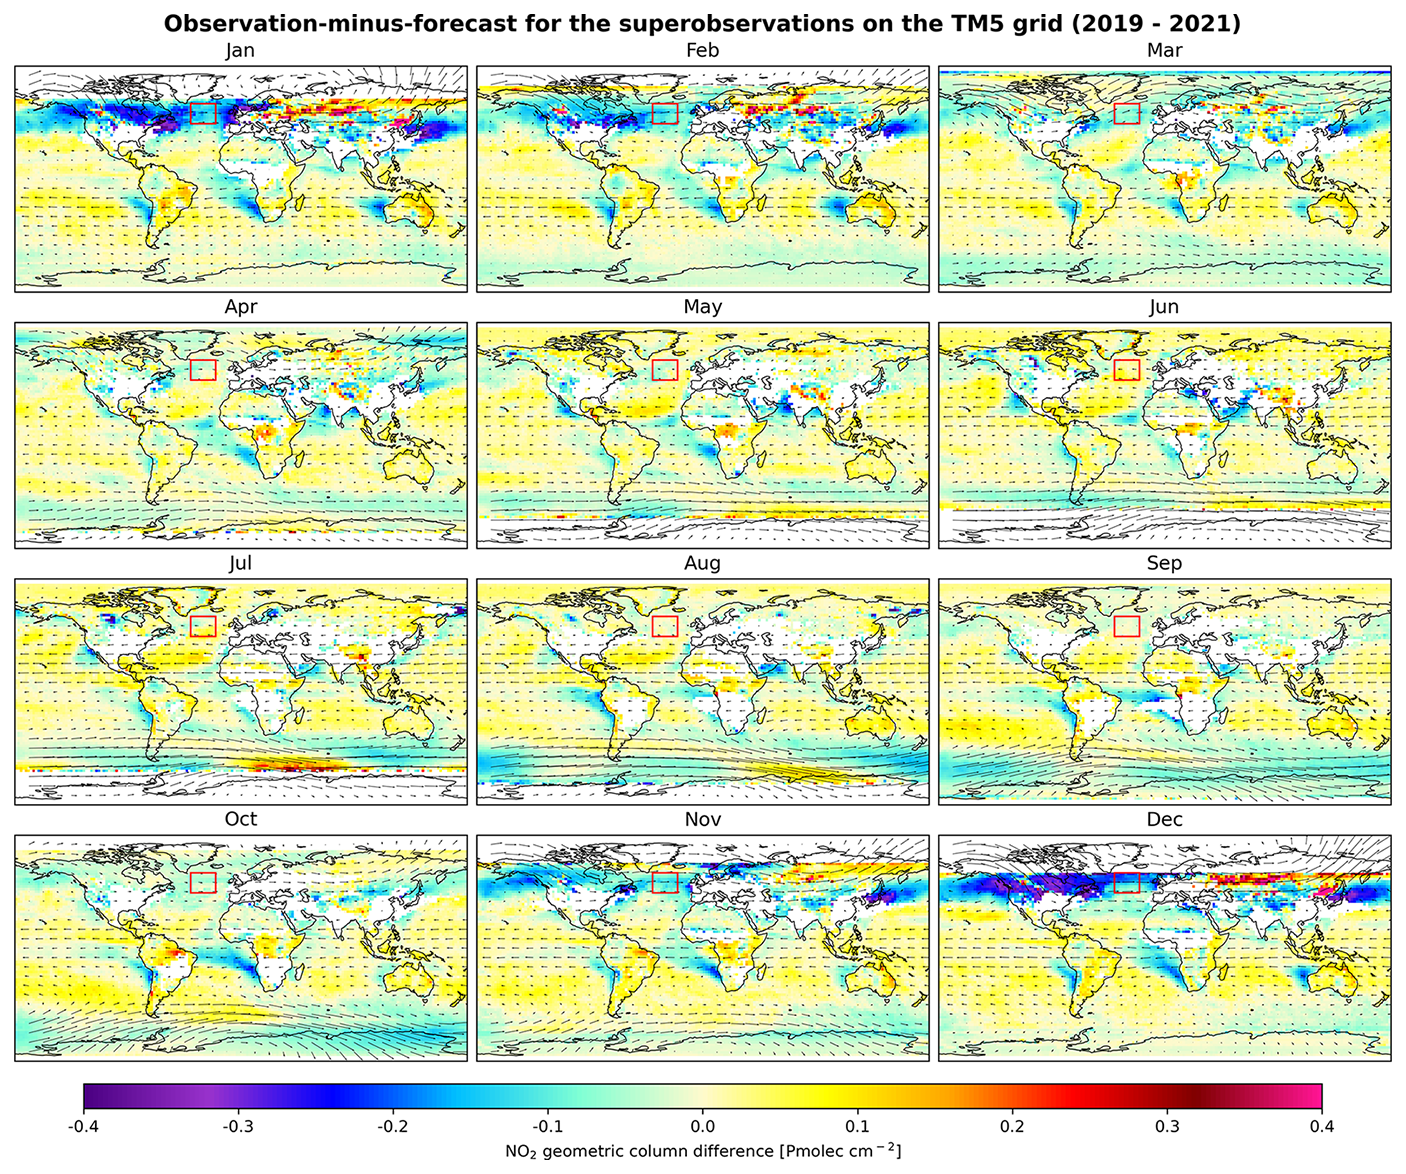
Figure 4Observation minus forecast for the geometric vertical columns (slant column divided by the geometrical AMF) for all months, and averaged over 3 years 2019–2021. Areas with no data or mean tropospheric column above 0.8 Pmolec cm−2 are removed (white). Also shown are the average wind speed and direction at 20 hPa. The red square indicates a remote, clean area over the Atlantic used to estimate the average stratospheric bias. Although derived from total NO2 columns, focusing on remote, unpolluted scenes minimizes the tropospheric contribution, allowing discrepancies to be interpreted mainly as stratospheric biases.
The magnitude of the stratospheric NO2 errors is relatively small, as illustrated in Fig. 4. Near the European coastline along the Atlantic, errors are on the order of 0.4 Pmolec cm−2. However, these values may be influenced by outflow from continental pollution, and therefore may also include remaining contributions from tropospheric NO2 rather than representing purely stratospheric errors. In contrast, in the more remote and cleaner regions of the Atlantic (indicated by the red square in Fig. 4), which serve as a better proxy for stratospheric-only errors, the values peak at 0.15 Pmolec cm−2 (11 %) in December. The stratospheric bias shows a clear seasonal pattern, with errors of 9 % in winter, 3 % in autumn and spring, and approximately −1 % in summer.
Biases in the stratospheric column propagate directly into the posterior estimates of tropospheric NO2. Because the tropospheric component is obtained by subtracting the stratospheric column from the total, any overestimation of the stratospheric contribution leads to a systematic underestimation of the tropospheric column. This impact is further amplified by the ratio of stratospheric to tropospheric AMFs. This ratio, shown in Table 3 for De Bilt as representative values for North-West Europe, exhibits a pronounced seasonal variability, approaching 10 in winter and decreasing to about 3 in summer due to the changing solar zenith angle and profile shape. Consequently, even small stratospheric biases will be amplified under winter conditions, leading to underestimations of retrieved tropospheric NO2 columns of 1.53 Pmolec cm−2 in December, the most critical month. In summer, the stratospheric errors are minimal and, together with the lower AMF ratio, result in negligible propagation into the tropospheric column.
Table 3Estimate of stratospheric systematic NO2 biases per month, derived from the monthly-averaged OmF analysis over a clean Atlantic region and its propagation into the tropospheric column computed from the ratio of the stratospheric divided by the tropospheric AMF.
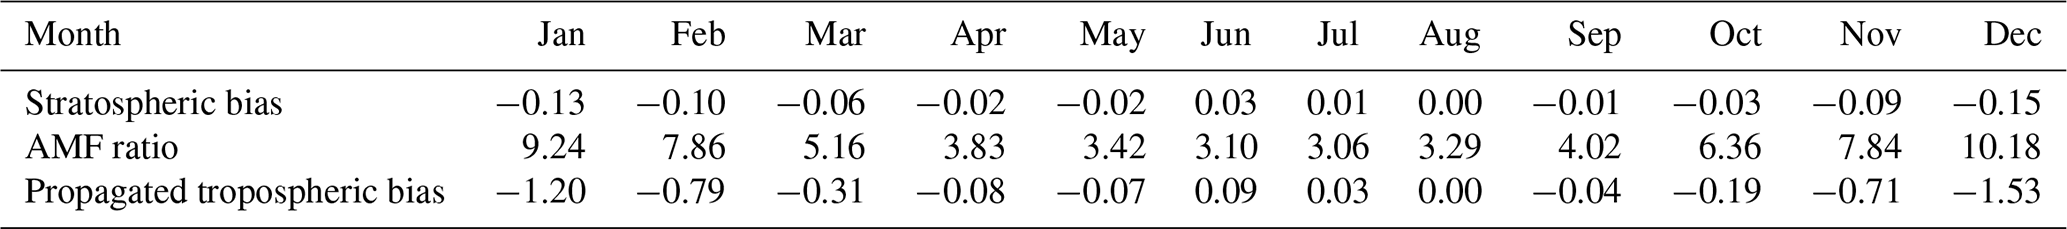
* Biases provided in Pmolec cm−2. Stratospheric to tropospheric AMF ratios derived for Cabauw station as a representative value for North-West Europe.
It is important to remember that the tropospheric errors presented below originate from a stratospheric bias estimated over a remote area in the North Atlantic Ocean and then amplified using AMF ratios representative of a northwestern European station. These errors therefore indicate the potential bias that could occur in the northwestern European region. The precise magnitude of the bias at a given station is difficult to quantify, as tropospheric errors in polluted regions are not solely attributable to biases in the stratospheric partition. They may also be influenced by additional factors, including unmodeled emission sources, simplifications or inaccuracies in the chemical schemes, and local variability.
4.2 Representation error due to horizontal gradients
Figure 5 presents the average simulated tropospheric NO2 VCD over the city of Utrecht across different seasons, generated with the LOTOS-EUROS model at a spatial resolution of approximately 1.3 × 1.7 km2. The figure also indicates the pixel corresponding to the coordinates of the two ground stations in the Netherlands, Cabauw and De Bilt, as well as the surrounding area (6.8 × 5.2 km2) encompassing neighboring pixels, which approximates the footprint of an average TROPOMI observation (6 × 5.5 km2) centered on the coordinates of these stations.
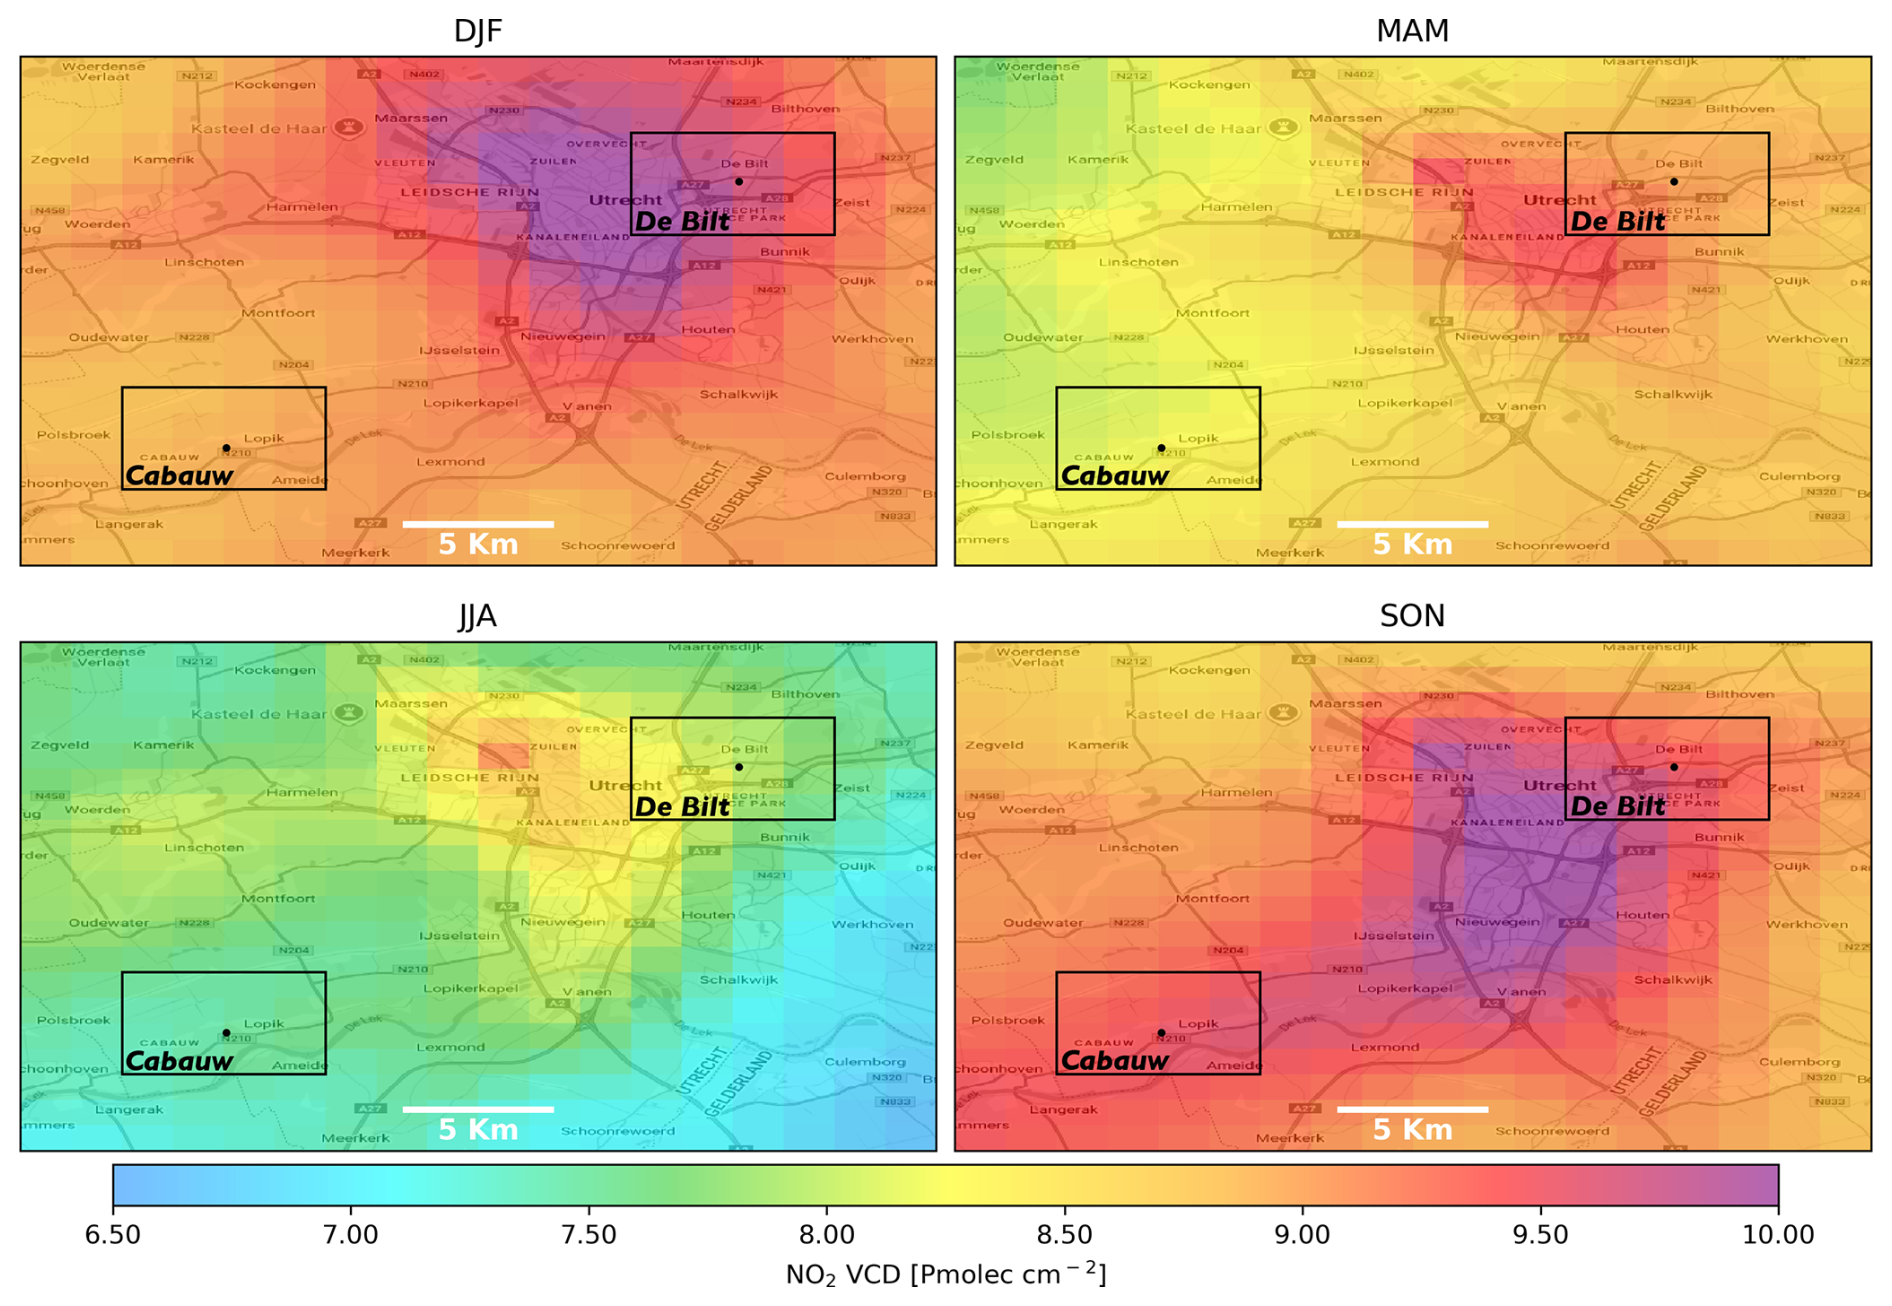
Figure 5Tropospheric columns of NO2, in Pmolec cm−2 as simulated by LOTOS-EUROS for the four seasons in 2019. Shown are the city of Utrecht, the Netherlands, and its surroundings. The De Bilt and Cabauw measurement sites are indicated by the dots, and the box around them approximates the footprint of an average TROPOMI observation. The horizontal gradients around the sites will lead to systematic representation errors in the comparison with the satellite.
When considering seasonal averages, the NO2 VCDs around the Cabauw station show weaker spatial gradients than those observed on day-to-day timescales, leading to a relatively homogeneous spatial distribution. The representation uncertainty estimated from the seasonal averages remains low throughout the year, with a mean error of 0.9 %. In contrast, the area surrounding the De Bilt station exhibits more heterogeneous VCDs, yielding a mean representation error of 2.1 %, nearly twice that estimated for Cabauw. The representation errors at the Cabauw station are smaller, as it is a relatively uniform background site located at some distance from major NO2 emission sources like the A12 highway, the Rotterdam harbor and industries, or Utrecht city; thus, horizontal concentration gradients are on average weak. In contrast, the De Bilt station is located just outside the city of Utrecht, with urban areas and highways to the west and more rural landscapes to the east, leading to stronger horizontal concentration gradients.
It should be noted that the values discussed above are derived from average modeled concentration fields over extended time periods (seasonal and annual scales); as a result, day-to-day variations in emissions and meteorology are averaged out, leading to smoother concentration gradients. When the representation errors are computed on a daily basis, the uncertainties increase, with annual mean values reaching 4.7 % at Cabauw and 6.0 % at De Bilt (Errors by season are provided in Table 4). Thus, when satellite and ground-based measurements are compared at daily (orbit-by-orbit) scale, representation errors become an important source of uncertainty. The uncertainty arises from horizontal gradients at scales smaller than a TROPOMI pixel, which are averaged out in the TROPOMI observations. This averaging introduces biases when comparing TROPOMI data with measurements from ground-based instruments, which are sensitive to air masses in the specific direction of their field of view. The magnitude of this bias depends on the local conditions at each station, as the strength of concentration gradients is influenced by nearby emission sources and local meteorological factors. Note also that errors are smaller in winter than in summer, which can be attributed to the extended lifetime of NO2 during winter, resulting in a more spatially homogeneous NO2 field with reduced concentration gradients within a TROPOMI pixel.
Table 4Representation uncertainty between TROPOMI and ground-based instruments due to horizontal gradients.
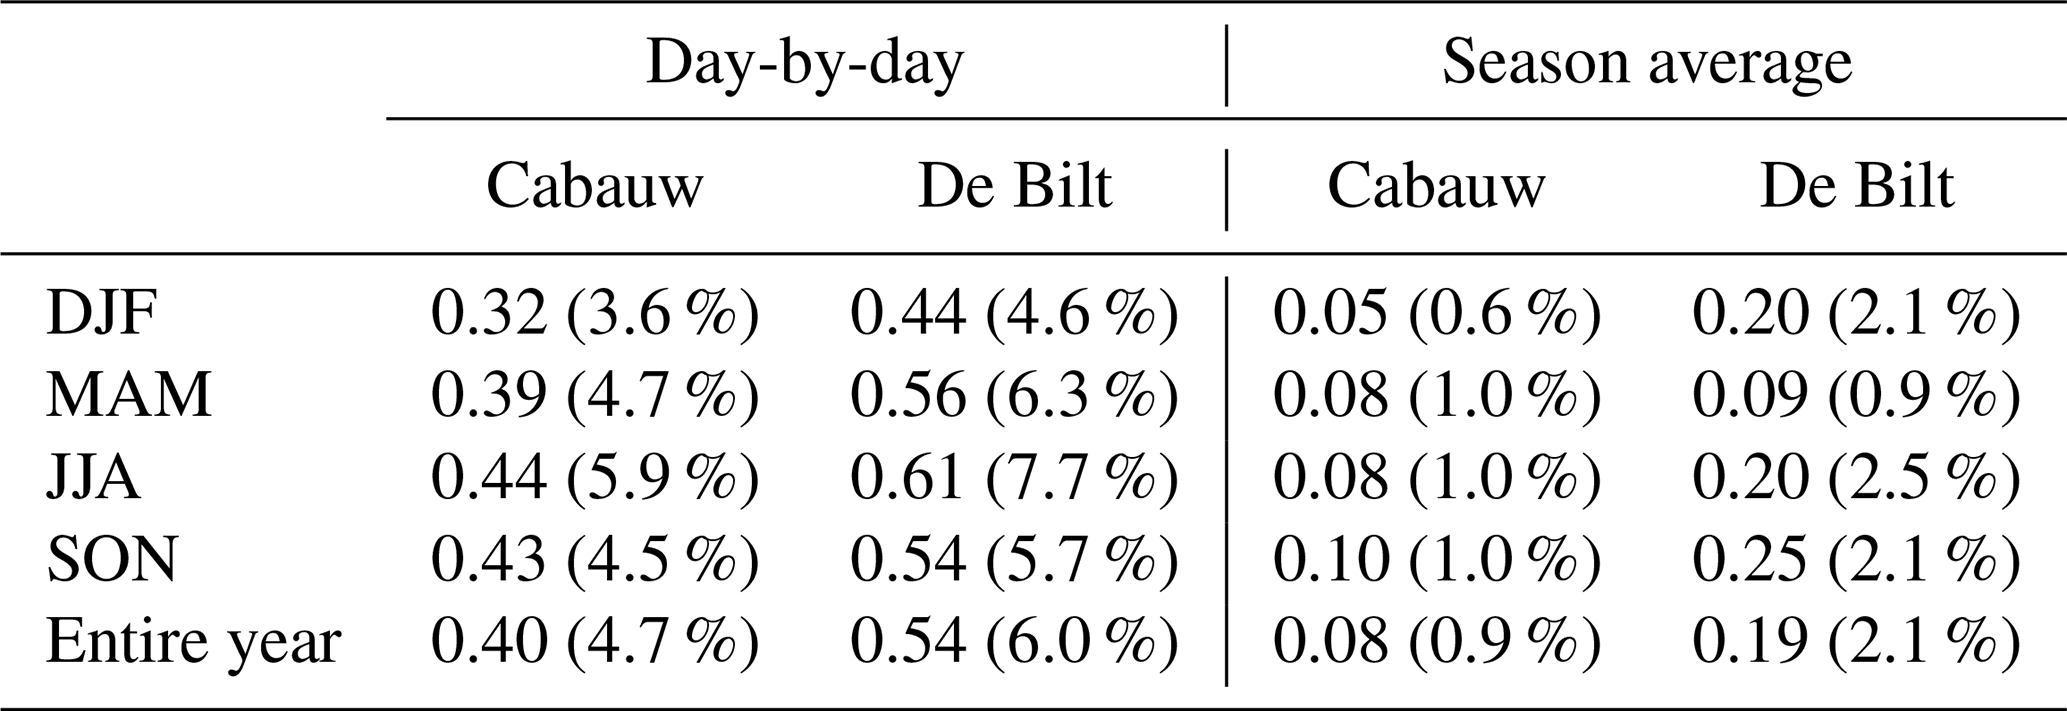
Uncertainty values are provided in Pmolec cm−2 and in percentage between brackets.
In this study, because the high-resolution model is limited to the Netherlands domain, we treat the representation errors estimated for the De Bilt station (6 % of the NO2 VCD) as a suitable proxy for the error that may arise when comparing TROPOMI observations with other ground-based remote-sensing sites in the European network. Nevertheless, we recommend estimating this value individually for each station whenever possible. Indeed, the magnitude of representation error is strongly dependent on site-specific emission patterns and geographical characteristics, both of which determine the strength of horizontal NO2 gradients within a satellite pixel. Stations located near strong emission sources, such as urban centers, industrial facilities, or major transportation corridors, often experience pronounced spatial variability in NO2 concentrations. This effect has been illustrated by Pinardi et al. (2020), who showed substantial variability in subpixel horizontal gradients across several locations worldwide and quantified their impact on comparisons between ground-based and GOME-2A and OMI satellite retrievals. Topography can further amplify these gradients. For example, at stations such as Innsbruck, which is situated within a narrow Alpine valley, atmospheric pollutants can become confined by surrounding mountainous terrain. Under stable meteorological conditions, this confinement may lead to the accumulation of pollutants in the urban basin while adjacent areas remain comparatively cleaner. As a result, strong spatial contrasts in NO2 concentrations can develop over relatively short horizontal distances, increasing the representation error when comparing local ground-based observations with satellite pixels that average over tens of square kilometers. Also, coastal stations may exhibit representation errors arising from heterogeneous surface types within a single satellite pixel. For instance, a TROPOMI pixel covering the region around Thessaloniki may include both land and sea surfaces. Because emission sources and atmospheric chemistry differ substantially between these environments, the resulting spatial gradients can also be significant.
For context, we also estimated the representation error associated with comparing OMI NO2 fields to ground-based observations. Detailed values are provided in Table C1, which shows that representation errors increase substantially relative to TROPOMI. For example, at the De Bilt station, day-by-day representation errors averaged to an annual value of about 6 % for TROPOMI, whereas for OMI they increased to approximately 14 %. The smaller value obtained for TROPOMI reflects, at least in part, the higher spatial resolution of TROPOMI compared to OMI, which reduces the spatial averaging within each pixel and therefore limits the smoothing of horizontal NO2 gradients. This reduction in pixel size directly mitigates representation errors, particularly in urban or industrialized regions where NO2 concentrations can vary strongly over short distances. This is consistent with previous findings from Pinardi et al. (2020), who showed that horizontal dilution effects increase with satellite footprint size. Nonetheless, even with TROPOMI finer resolution, representation uncertainty remains a non-negligible component of the total error budget and should be considered when interpreting satellite–ground comparisons. Future work could benefit from high-resolution regional model simulations across Europe to better constrain these uncertainties at the station level and to account for their dependence on emission strength, boundary layer dynamics, and seasonally varying transport processes.
4.3 Representation errors due to the vertical instrument sensitivity
Figure 6 shows the vertical sensitivity of TROPOMI and MAX-DOAS expressed through their AK profiles. Here we see that ground-based observations have an enhanced sensitivity to lower tropospheric layers due to their position at the surface in combination with the low elevation viewing angles, whereas TROPOMI exhibits a reduced sensitivity near the (dark) surface and stronger signals from NO2 in higher layers. These differences in sensitivity imply a dependence of the comparison on the a-priori profiles and must be accounted for to avoid misinterpretation of satellite–ground discrepancies. It is also important to note that MAX-DOAS offers a finer vertical sampling, with data available at 200 m intervals from the surface up to 4 km. However, its vertical coverage is more limited compared to TROPOMI, which provides information for the entire atmospheric column. The a-priori NO2 profiles used to inform the retrievals for both TROPOMI and MAX-DOAS are shown in Fig. 6. The MAX-DOAS a-priori profiles decrease exponentially with altitude and remain nearly identical across seasons, whereas the retrieved profiles display some seasonal dependence, showing higher surface values in winter and autumn. This behavior is similar to the TROPOMI TM5-MP a-priori profiles, which also exhibit seasonal variability.
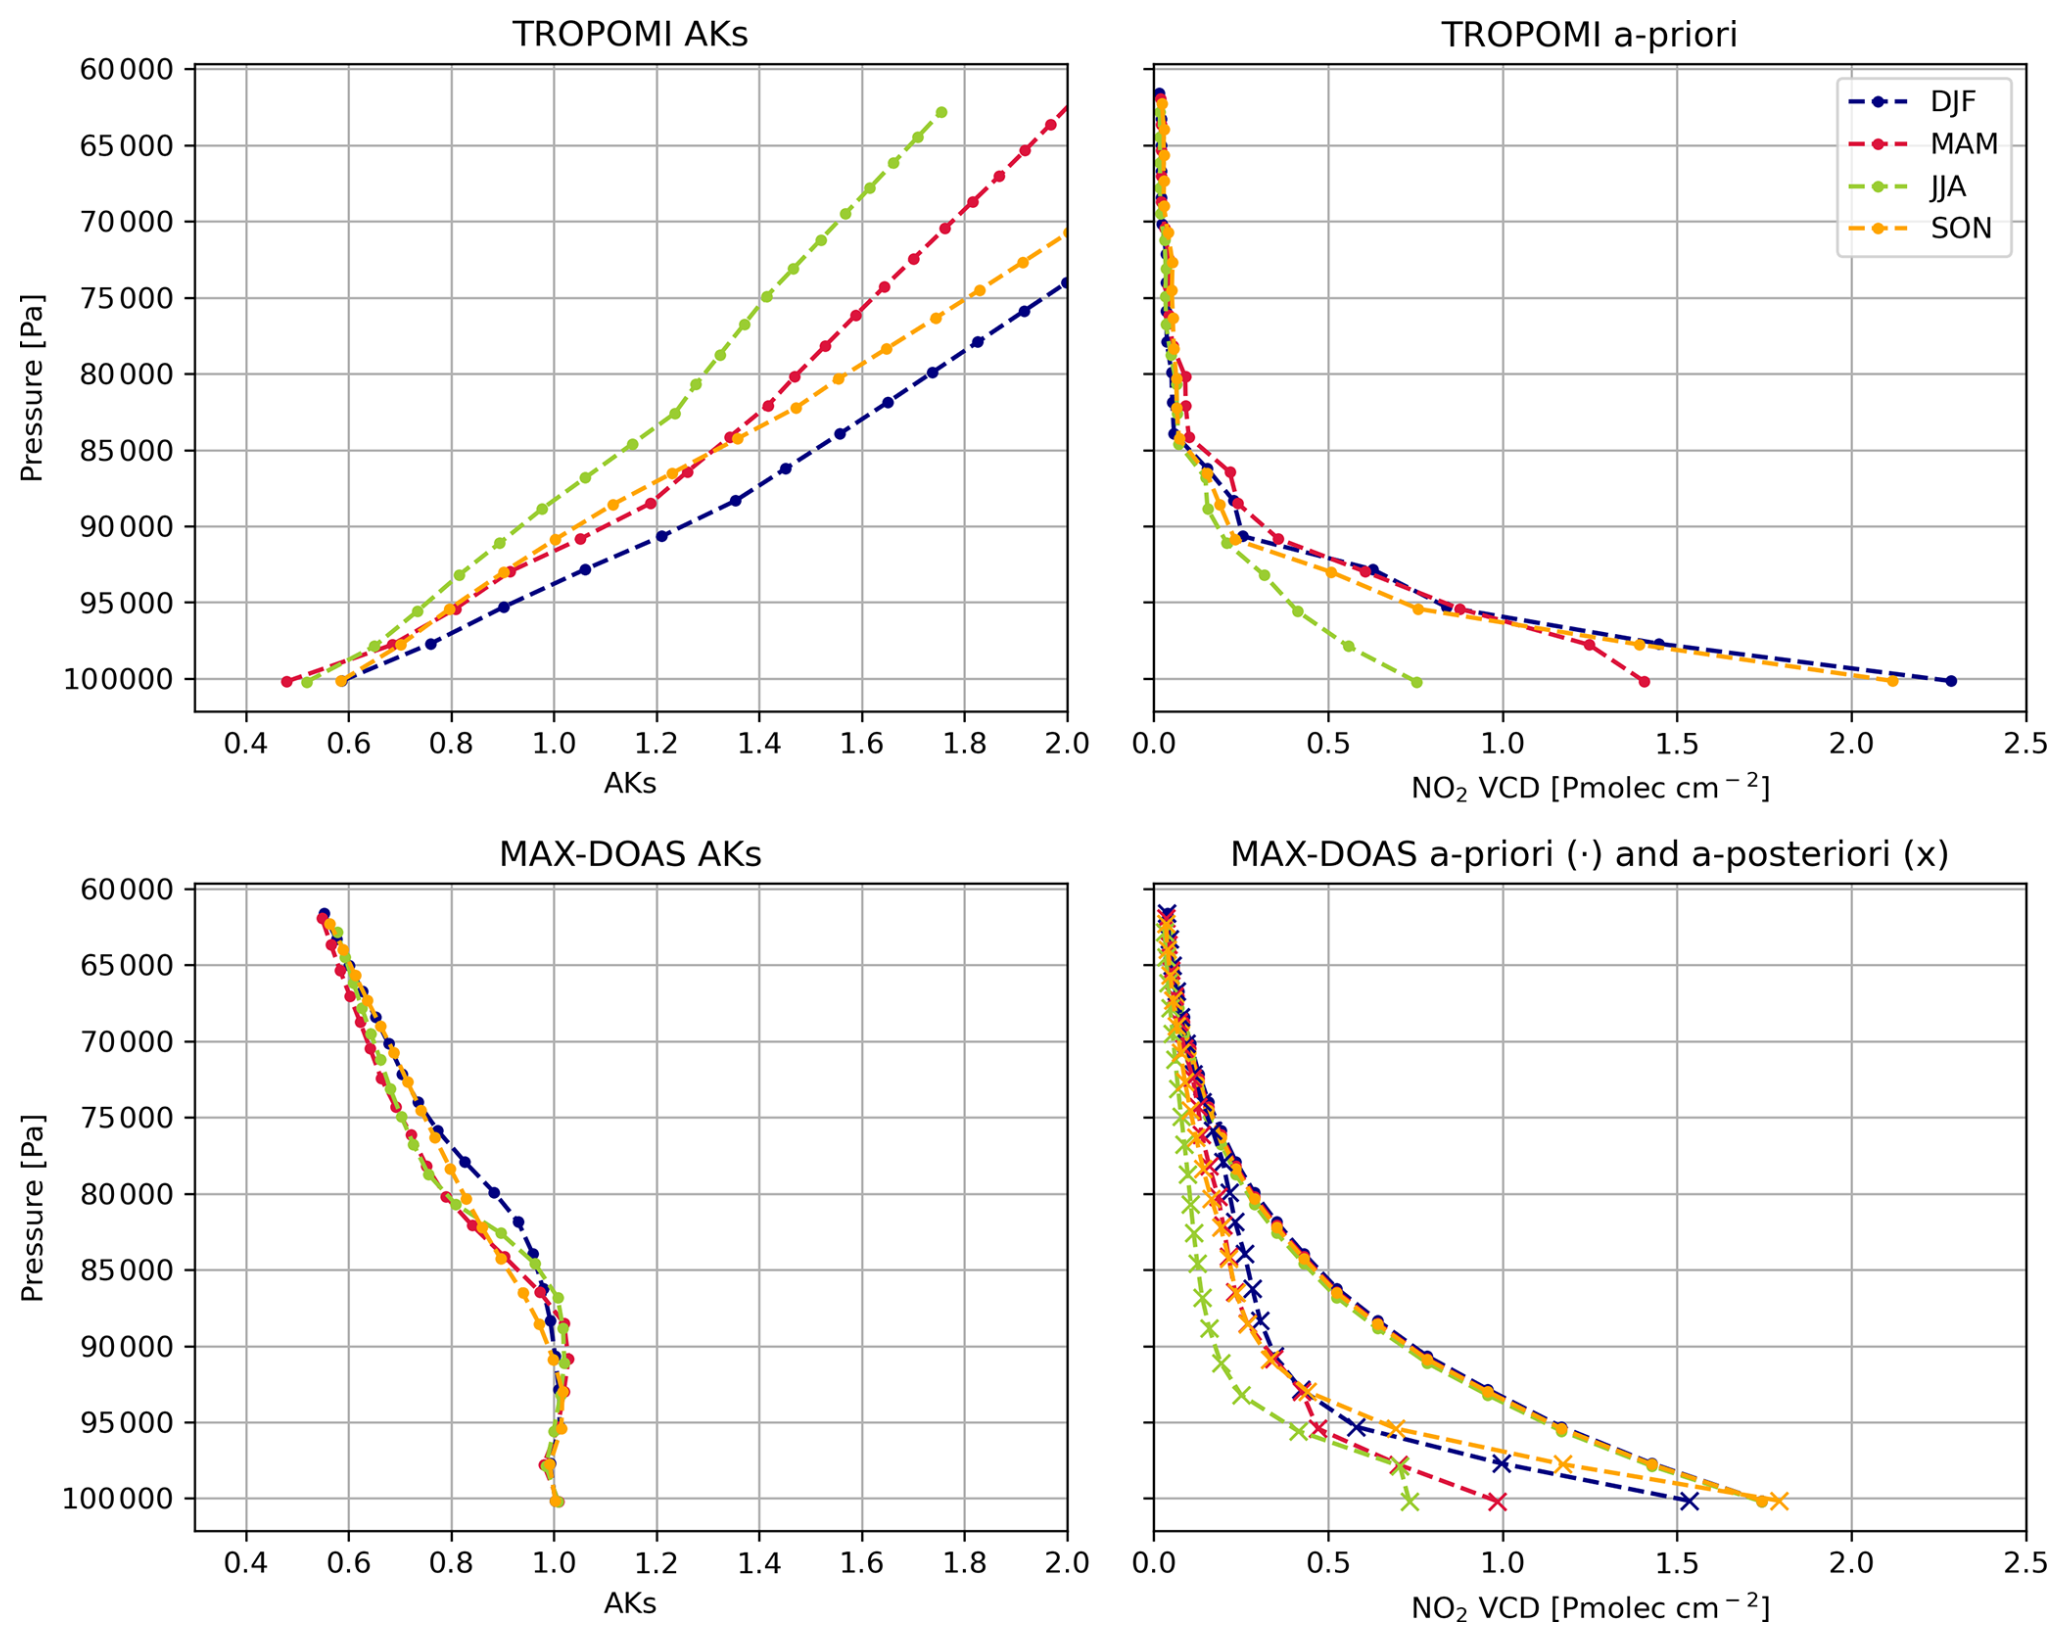
Figure 6Comparison of TROPOMI TM5 and MAX-DOAS FRM4DOAS tropospheric AKs and a-priori vertical profiles at De Bilt station. TROPOMI data are vertically interpolated to match the MAX-DOAS vertical grid.
Using the AKs and a-priori profiles, we estimated the smoothing error for the intercomparison between the TROPOMI and MAX-DOAS instruments by season, following Eq. (5). The results are summarized in Table 5. Smoothing errors are largest in winter (DJF) and autumn (SON). For example, during winter, the errors rise to almost 20 % at Bremen and De Bilt. This is consistent with the earlier discussion showing that both the TROPOMI a-priori and the MAX-DOAS a-posteriori profiles exhibit their highest near-surface NO2 concentrations during these periods. Because TROPOMI has limited sensitivity to the boundary layer, whereas MAX-DOAS is highly sensitive to near-surface NO2, discrepancies between the instruments are greatest under conditions of strong surface pollution, as reflected in the elevated smoothing errors. In spring and summer, smoothing errors are smaller but still non-negligible, ranging from 3 % to 9 % across the analyzed stations.
Table 5Seasonal smoothing errors for comparisons between MAX-DOAS FRM4DOAS and TROPOMI with TM5-MP a-priori for 2019–2020.
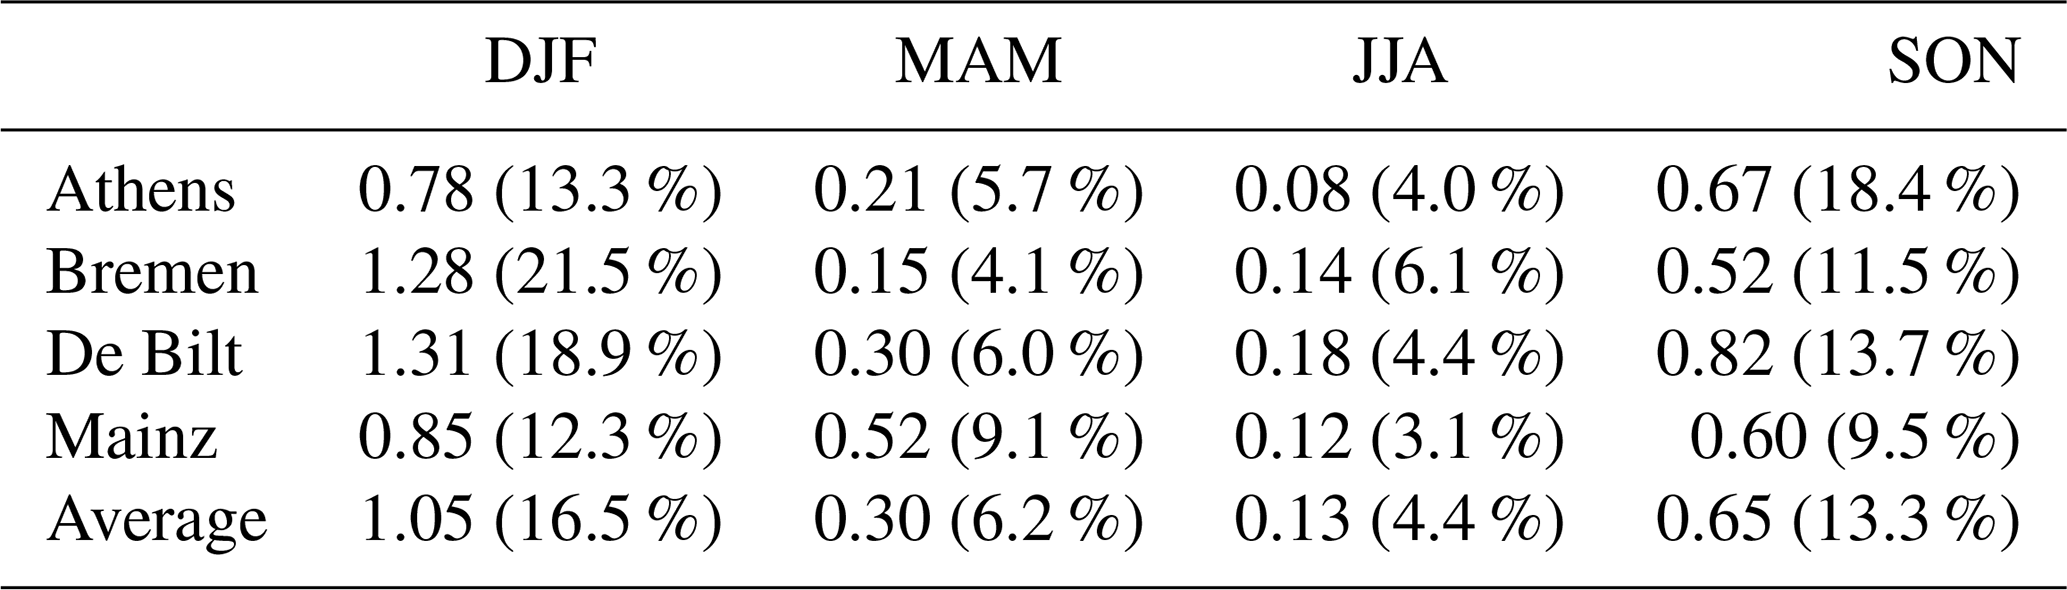
Uncertainty values are provided in Pmolec cm−2 and in percentage between brackets.
4.4 Consistency between ground-based instruments
Before comparing satellite and ground-based observations, it is important to first assess the consistency among ground-based remote-sensing instruments. This step allows for isolating instrument- and retrieval-specific differences that could otherwise obscure the interpretation of satellite–ground discrepancies. To do this, we use the complete set of ground-based measurements rather than restricting the analysis to periods coinciding with satellite overpasses, maximizing data coverage and enabling a more robust evaluation of inter-instrument comparability. We analyze collocated observations from MAX-DOAS FRM4DOAS retrievals and Pandora DS and sky-scan products at three stations (Bremen, Cabauw, and Thessaloniki). Temporal matching is performed by taking the timestamp of each MAX-DOAS observation and averaging all Pandora measurements within a ±30-minute window; cases without valid matches are discarded. For interpretation, monthly averages are then computed, ensuring that an equal number of observations from each dataset is included. The resulting comparisons are presented in Fig. 7. As an additional reference, we include Pandora DS measurements after subtracting the stratospheric contribution reported in the PGN L2 files. These stratospheric values are derived using an external OSIRIS-based climatology. We adopt the DS-derived tropospheric columns as a baseline for the comparisons between ground-based instruments because direct-sun observations generally provide the most accurate and lowest-uncertainty measurements among the available ground-based techniques.
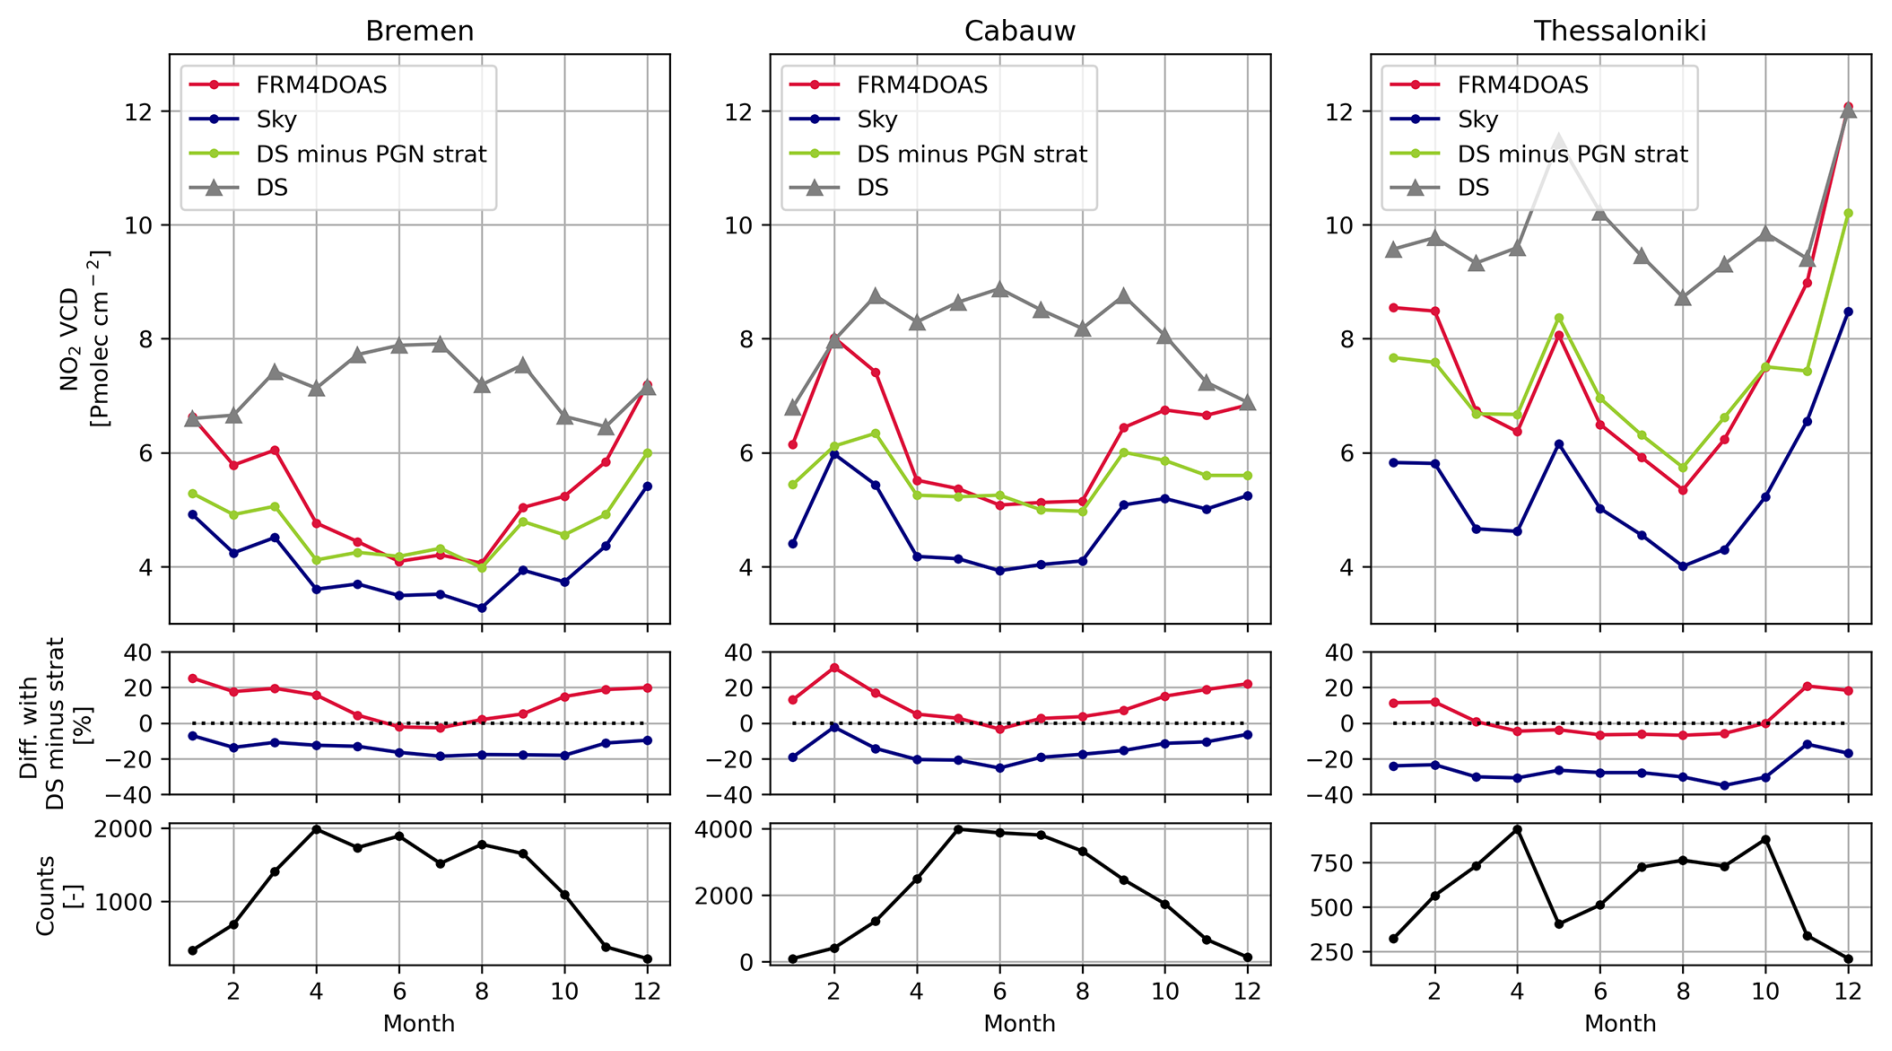
Figure 7Monthly mean comparison of tropospheric and total NO2 ground-based observations. The upper panels show MAX-DOAS FRM4DOAS tropospheric columns (FRM4DOAS, red), Pandora sky-scan tropospheric columns (Sky, blue), Pandora direct-sun tropospheric columns obtained by subtracting the stratospheric component from the Pandora climatology (DS minus PGN strat, green), and Pandora direct-sun total columns (DS, gray). The middle panels show the relative differences between Pandora direct-sun tropospheric columns (DS minus PGN strat) and MAX-DOAS FRM4DOAS (red) and Pandora sky-scan (blue) tropospheric measurements. The lower panels show the number of collocated observations for each analyzed station.
Overall, MAX-DOAS FRM4DOAS retrievals exhibit good agreement with the DS-minus-stratosphere observations during summer across all three stations. In contrast, during winter months, MAX-DOAS FRM4DOAS tropospheric columns tend to be higher, especially at Bremen (20 %) and Cabauw (22 %), indicating a seasonal dependence in the consistency between the two datasets at these locations. At these same stations, we further observe instances in winter in which the tropospheric MAX-DOAS FRM4DOAS columns approach or even exceed the Pandora DS total columns.
The apparent overestimation of tropospheric VCDs derived from MAX-DOAS measurements in winter, relative DS measurements from which model stratospheric column contributions have been subtracted, can be partly attributed to a selection effect. During winter, significantly fewer MAX-DOAS and DS observations are valid, as indicated by the observation counts in Fig. 7. This reduction is mainly due to more frequent overcast conditions and lower light levels. Consequently, the number of coincident observations is reduced, which limits the robustness of the statistical analysis in winter. In addition, we find that the quality control applied to the FRM4DOAS tropospheric NO2 VCD retrievals from MAX-DOAS measurements tends to favor conditions with elevated NO2 concentrations during winter. As illustrated in Fig. B6, MAX-DOAS NO2 retrievals using a geometric approximation increase in December from 7.7 to 8.9 Pmolec cm−2 (approximately 15 %) when MAPA flagging is used as a constraint, compared to retrievals without flagging. Furthermore, differences in viewing geometry between ground-based instruments may lead to the sampling of different air masses, thereby affecting the comparison. The importance of consistent viewing directions between MAX-DOAS and Pandora instruments has been highlighted by Bae et al. (2025), who reported an improvement of approximately 10 % in agreement, expressed as the mean relative difference (MRD), when viewing geometries were better aligned. As an illustrative example, we consider the MAX-DOAS station in Bremen, which operates with multiple viewing azimuth angles (VAA). Restricting the analysis to a single viewing direction can substantially affect the comparison with other ground-based instruments (see Fig. B7). In particular, larger discrepancies are observed when using observations at a VAA of 180°, compared to those at 270 and 295° at this particular station.
The Pandora sky-scan observations are consistently lower than both the MAX-DOAS FRM4DOAS and the Pandora DS-minus-stratosphere tropospheric columns throughout the entire year at all three stations. Relative to the DS, the sky-scan retrievals exhibit annual mean biases of −14 % at Bremen, −15 % at Cabauw, and −26 % at Thessaloniki. The sky-scan algorithm represents a simplified approach within the optimal estimation framework, which may partly explain the larger biases. Nevertheless, the agreement for the seasonal variability is reasonable, indicating that the sky-scan observations remain a valuable source of information for subsequent intercomparisons with satellite observations.
4.5 Sensitivity of TROPOMI tropospheric comparisons with the ground-based observations
As previously discussed, there is a substantial spread among the values reported by the different ground-based instruments. To evaluate how this variability affects the intercomparison with TROPOMI, Fig. 8 presents the monthly time series of ground-based retrievals collocated with the satellite measurements. In contrast to Fig. 7, only ground-based observations averaged within ±30 min of each TROPOMI overpass are retained, which reduces both the number of coincident observations and their temporal coverage throughout the day.
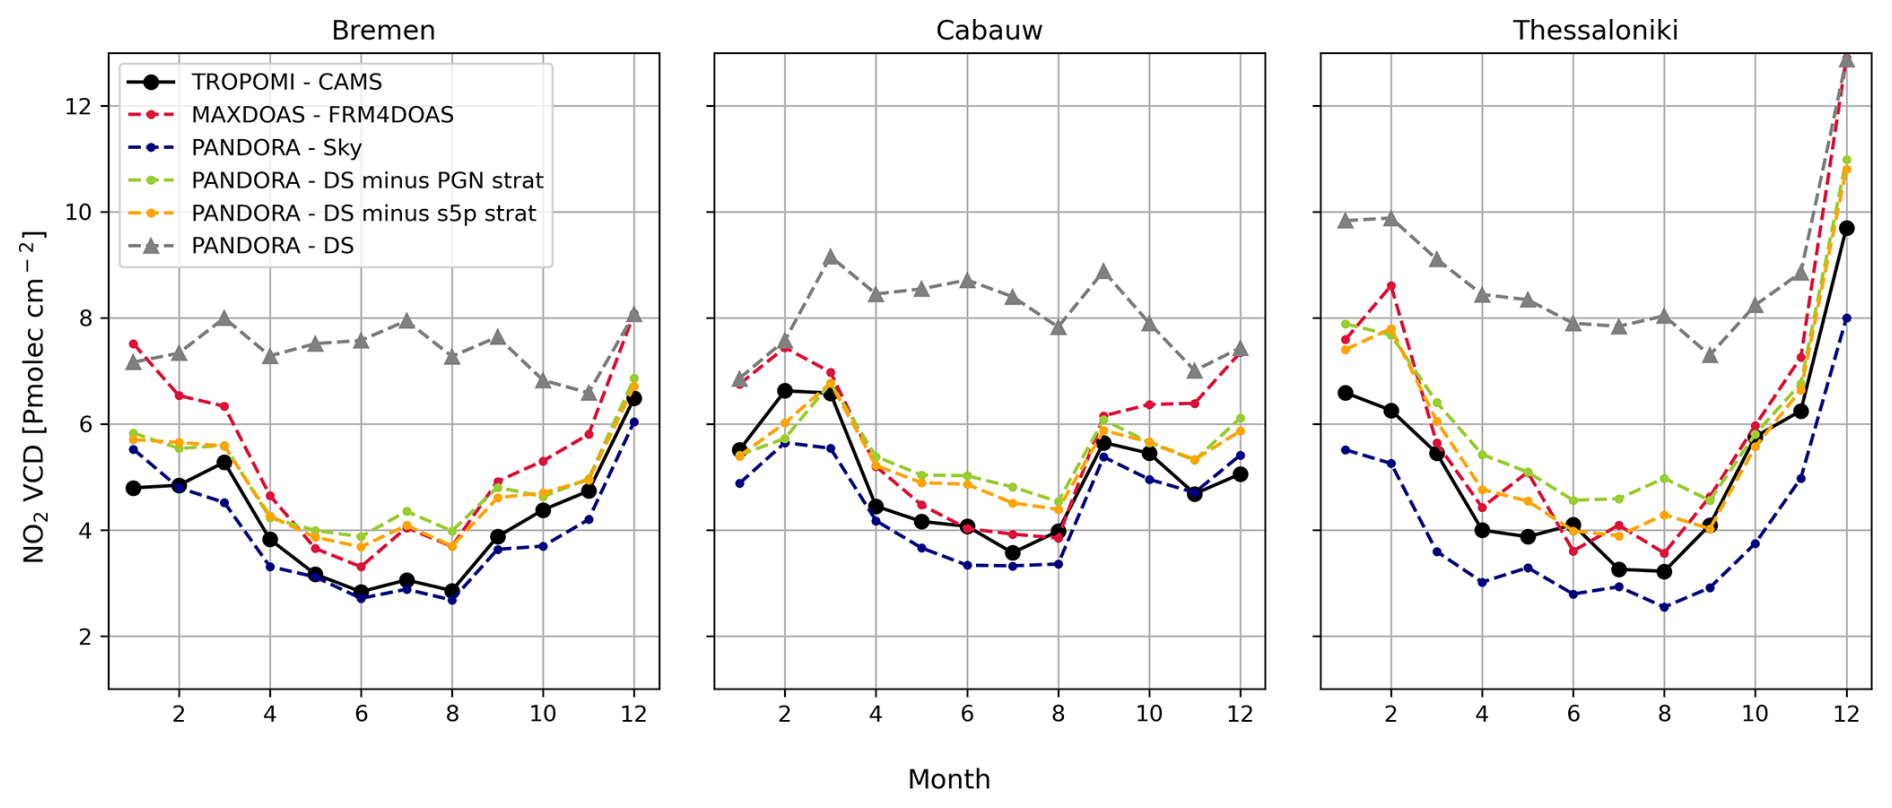
Figure 8Monthly-averaged seasonal cycle of total and tropospheric NO2 columns from TROPOMI with CAMS a-priori, Pandora direct sun (DS) and sky-scan (sky), and MAX-DOAS FRM4DOAS (FRM4DOAS) measurements at stations with collocated observations.
The TROPOMI retrievals using CAMS a-priori are near the middle of the ground-based ensemble, and all observation types exhibit broadly consistent seasonal behavior. An exception is the MAX-DOAS FRM4DOAS product, which at both Bremen and Cabauw shows elevated NO2 columns during winter, as previously mentioned when comparing the ground-based instruments alone. Note that in Fig. 8 we include two DS-derived tropospheric retrievals, one obtained by subtracting the stratospheric component from the PGN L2 product, and another using the stratospheric component from the TROPOMI S5P L2 product. The results from these two approaches are very similar, even though the PGN stratospheric field is climatology-based, whereas the S5P stratospheric field is obtained through assimilation within the NO2 retrieval. Using the S5P stratospheric component yields slightly lower tropospheric columns, but the differences are minor for stations like Bremen and Cabauw.
Figure B8 presents a quantitative comparison of the TROPOMI retrievals using CAMS a-priori with each ground-based dataset. At Bremen and Cabauw, comparisons with Pandora sky-scan measurements indicate relative positive biases of 8 % and 11 %, respectively. In contrast, comparisons with MAX-DOAS FRM4DOAS suggest relative negative biases of −20 % and −10 %. When using the DS retrieval corrected with the S5P stratospheric component, the resulting biases are also negative, at −14 % and −10 % for the same stations. These results indicate that the inferred TROPOMI bias and overall performance are dependent on the choice of ground-based reference dataset.
5.1 TROPOMI total NO2 column vs. Pandora
We found a strong consistency between TROPOMI total column measurements and Pandora DS observations, with correlation coefficients reaching up to 0.79 when high-resolution CAMS a-priori profiles were employed (Fig. 9). The TROPOMI operational retrievals using the TM5-MP a-priori show a low bias of approximately 23 % relative to Pandora, which is substantially reduced to 12 % when updated with CAMS European a-priori profiles. In addition, both the regression slope and the RMSE improve with the a-priori replacement, with the RMSE decreasing from 3.7 to 3.1 Pmolec cm−2, further highlighting the enhanced agreement between the two datasets when CAMS a-priori information is used. The improvements obtained when using CAMS a-priori profiles instead of TM5-MP are primarily attributed to the higher spatial resolution of the CAMS models ensemble, which enables a more accurate representation of emissions and meteorological processes. This enhanced resolution improves the depiction of horizontal NO2 gradients and provides a spatial scale more consistent with that of TROPOMI observations.
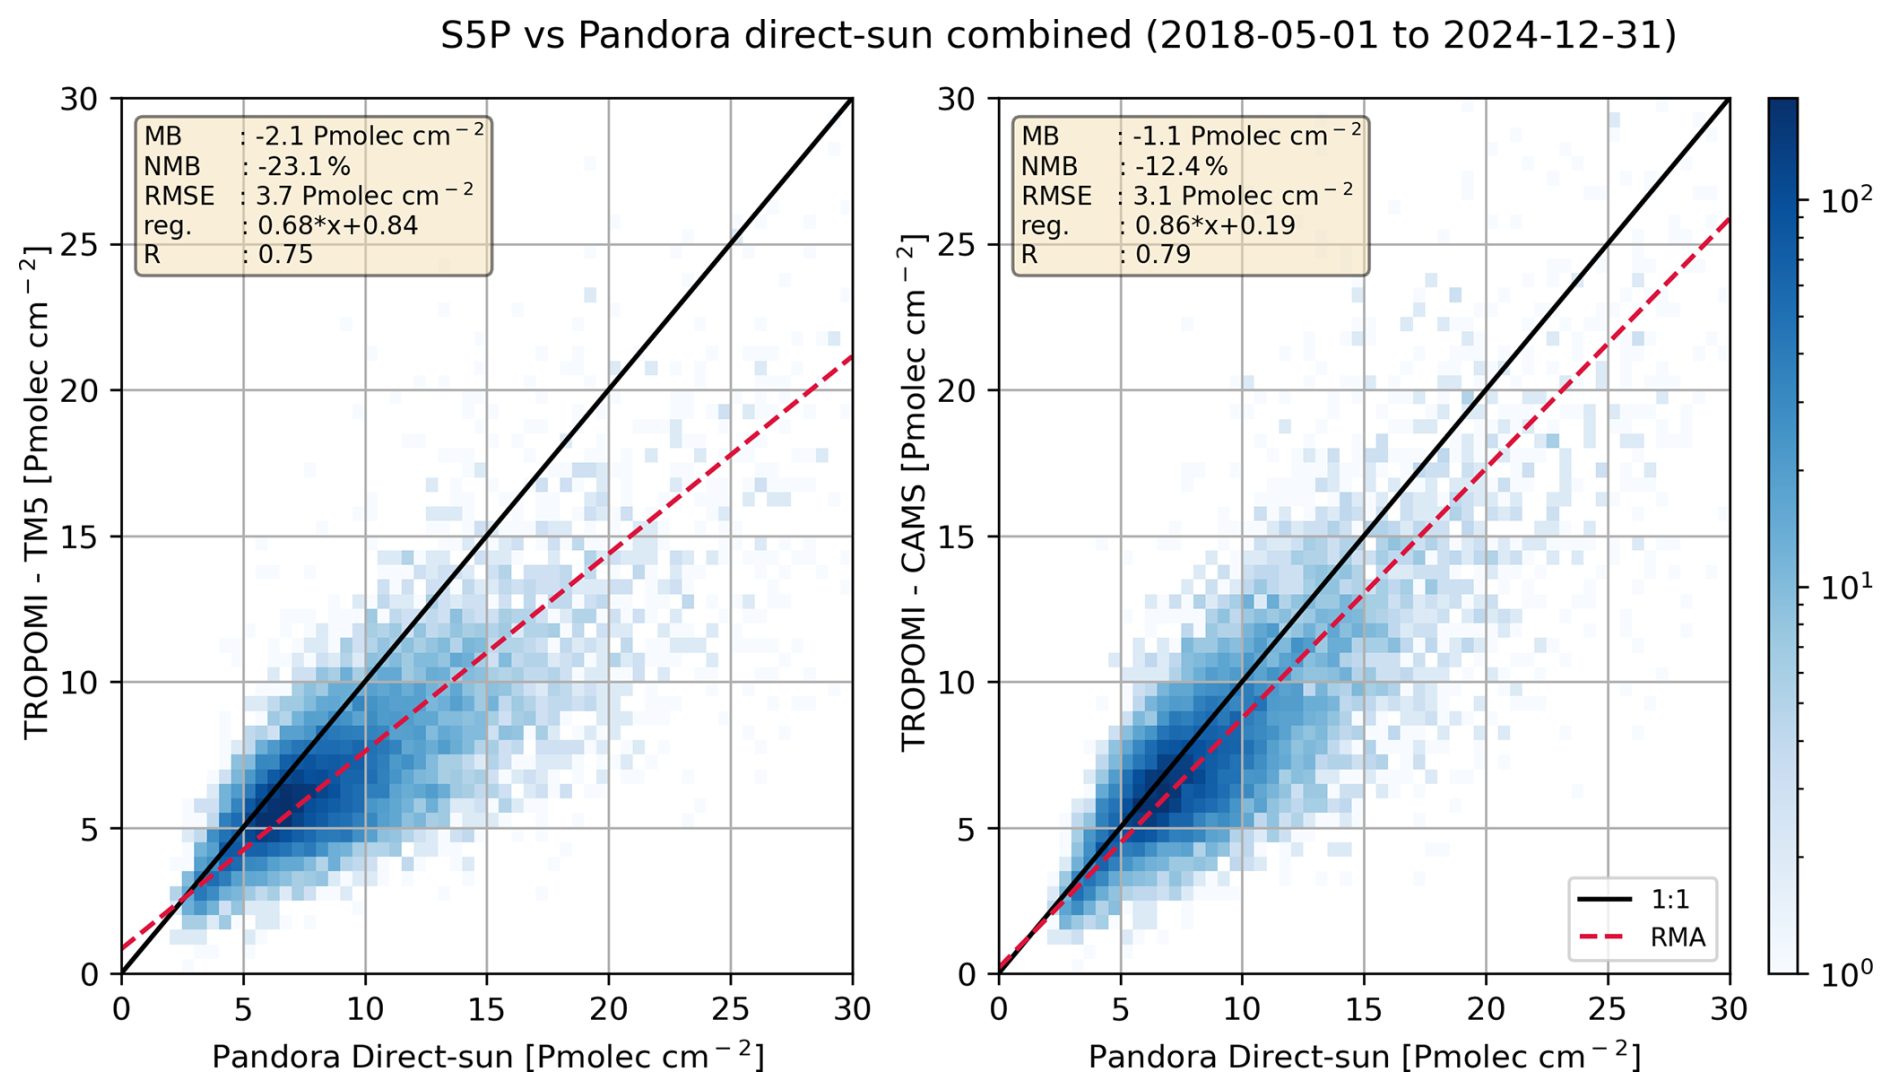
Figure 9Scatter plot of TROPOMI versus Pandora total NO2 column observations aggregated across 18 European stations. Left: operational TROPOMI retrievals using TM5-MP a-priori profiles at 1° × 1° resolution. Right: TROPOMI retrievals using CAMS a-priori profiles at 0.1° × 0.1° resolution (Douros et al., 2023).
Monthly averages of NO2 total column, shown in Fig. 10, illustrate that TROPOMI consistently captures the seasonal variability observed by Pandora at all European stations throughout the year. This agreement holds across nearly all stations evaluated, indicating that TROPOMI retrievals, particularly when using the CAMS a-priori, reliably reproduce the temporal patterns measured by ground-based observations. One striking difference is observed in Helsinki during the winter months. The retrieval over snow in v2.4 was characterized by large uncertainties and likely overestimations over snow. In v2.8 the scene pressure retrieval was improved, mainly due to an updated FRESCO cloud algorithm that now uses two spectral windows and a corrected reflectance error definition. As a result, reductions in NO2 over snow by a factor of two have been reported (van Geffen et al., 2024). This improvement is expected to enhance wintertime comparisons in an upcoming TROPOMI reprocessing.
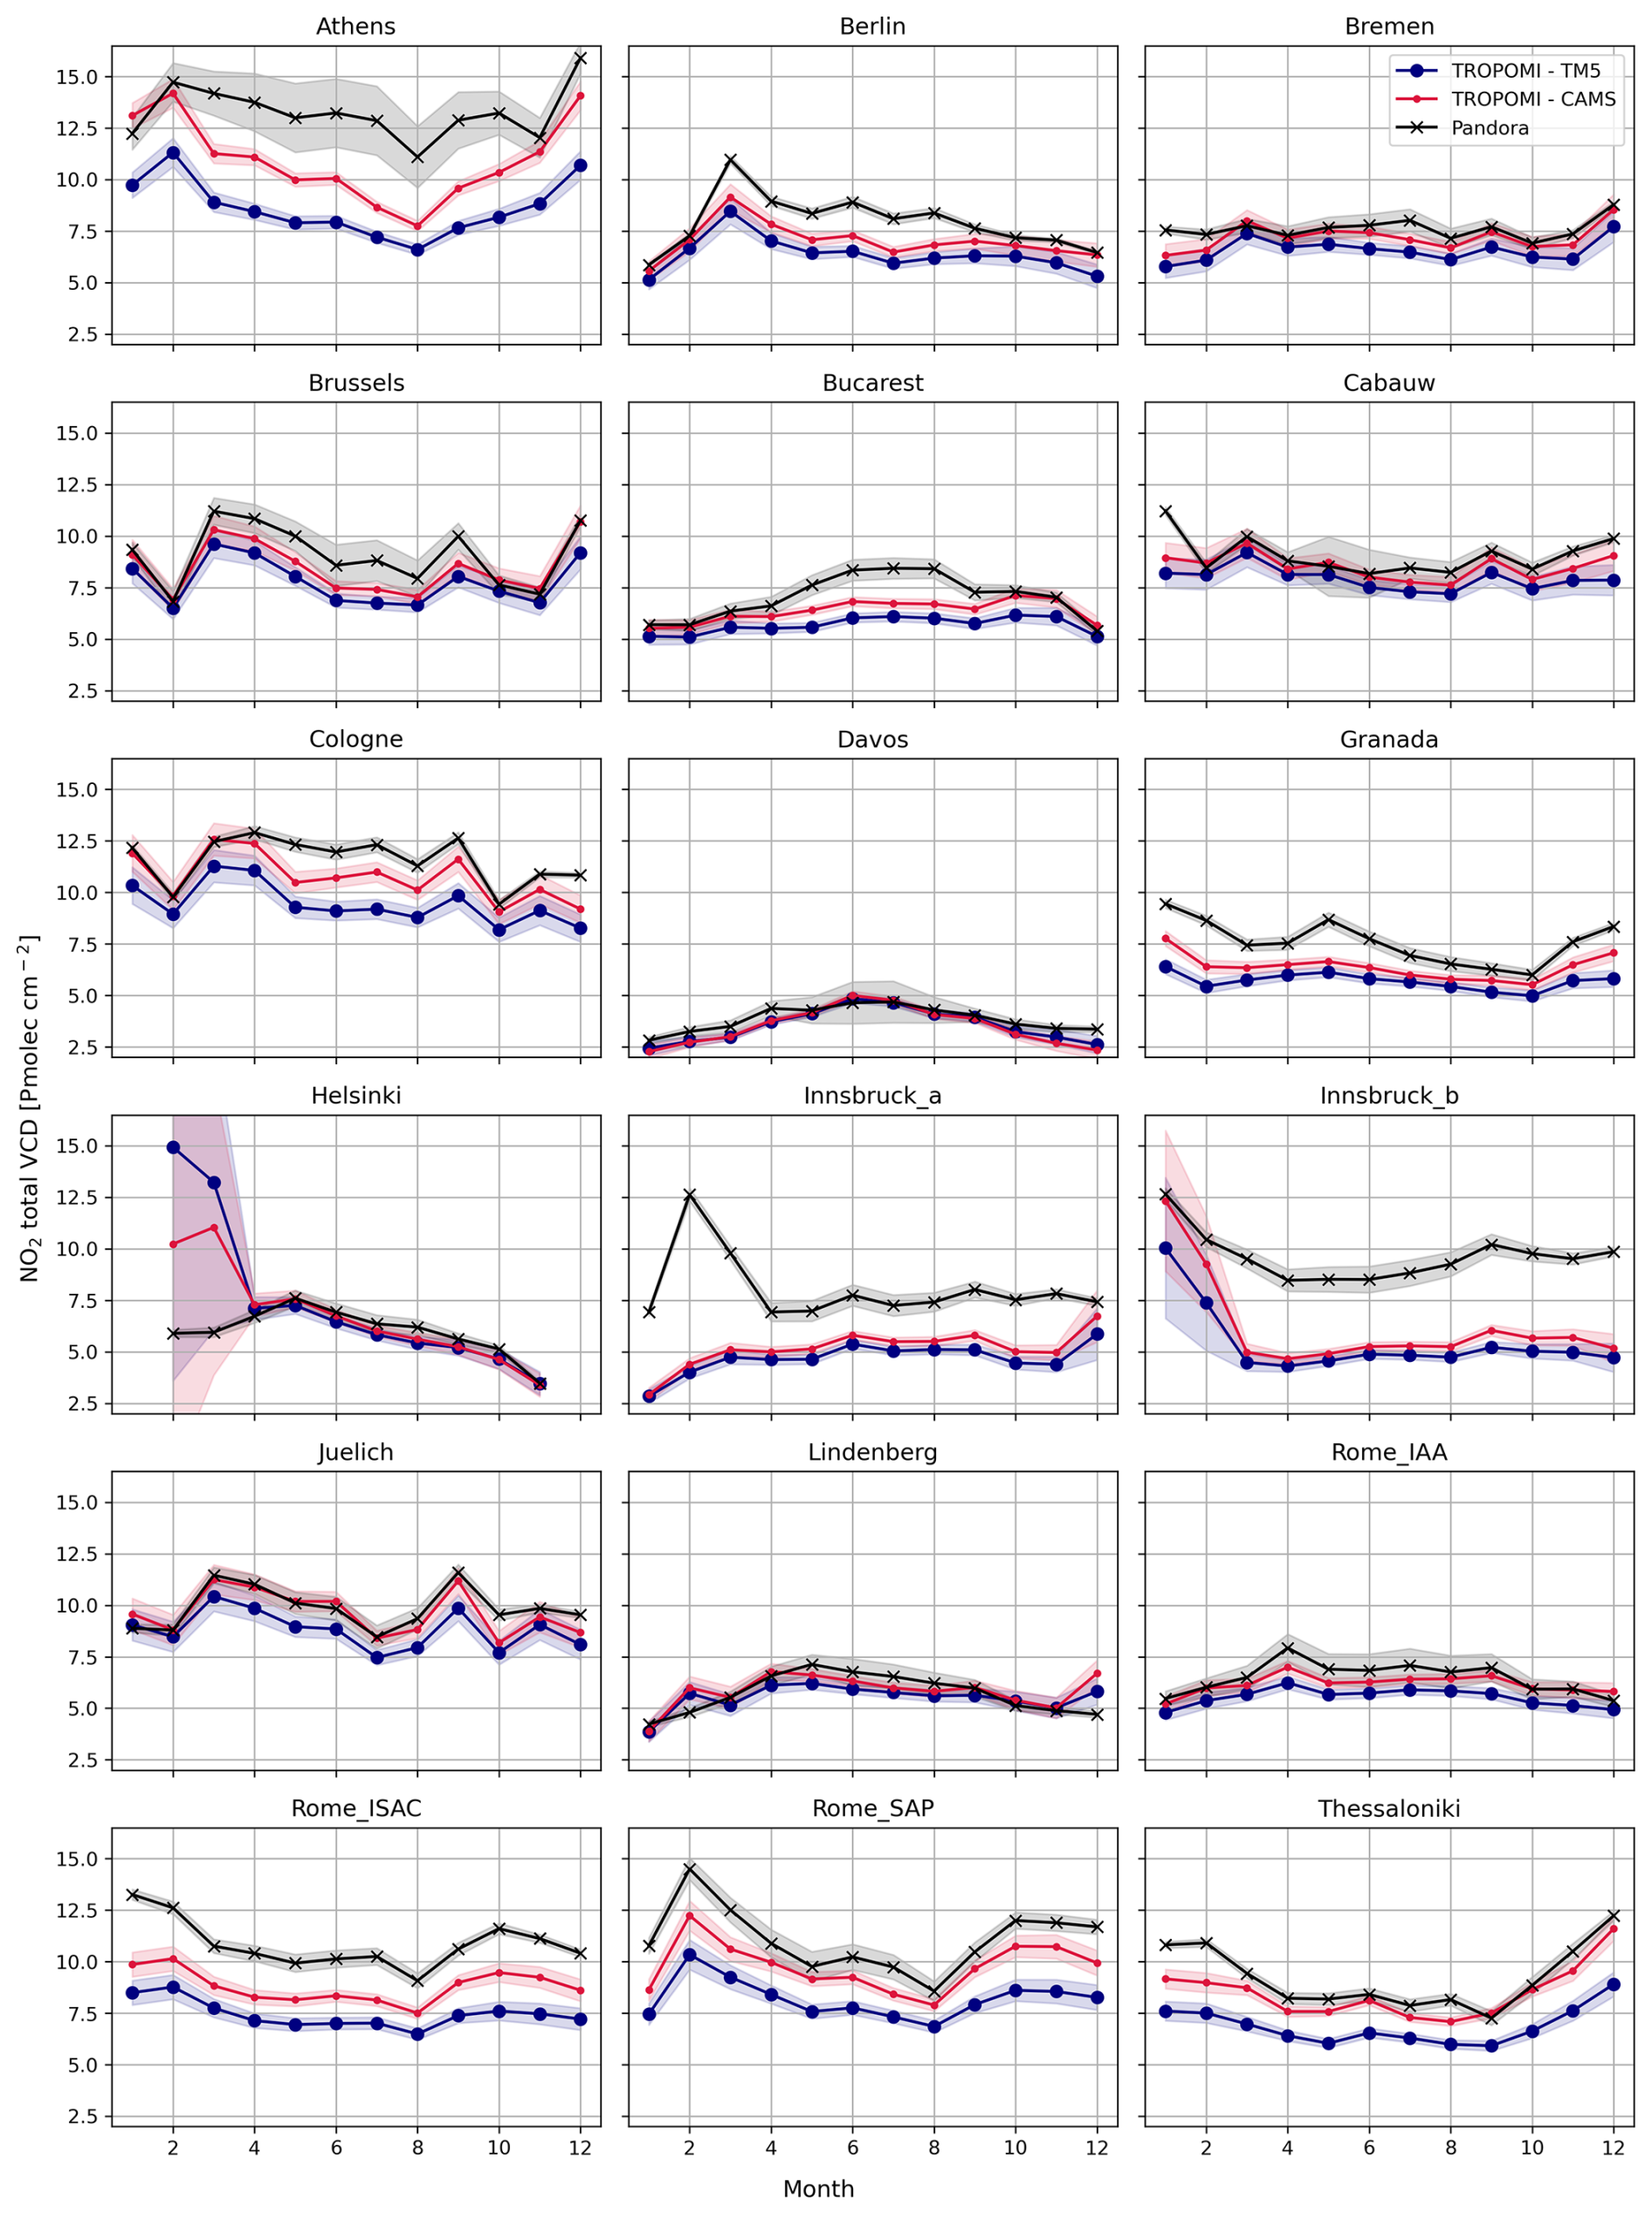
Figure 10Monthly-averaged seasonal cycle comparison between the TROPOMI sum of tropospheric and stratospheric column with Pandora direct-sun total NO2 column observations. Shaded areas around the lines represent the total uncertainty for each measurement type.
We analyzed the distribution of differences between TROPOMI and Pandora total column measurements to assess whether the instruments agree within their respective uncertainty ranges. The results for each station are presented in Fig. B9. In these plots, the black line represents the expected distribution of differences, derived by combining the satellite, ground-based, and representation uncertainties as described in Eq. (4). The blue and red lines correspond to the observed distributions of differences, fitted with Gaussian functions, obtained when comparing TROPOMI data using TM5-MP (blue) and CAMS (red) a-priori profiles. The fitted distributions of differences across all evaluated stations are nearly identical for the TM5-MP and CAMS TROPOMI retrievals; however, the offset is smaller when CAMS a-priori profiles are used. Therefore, the subsequent discussion focuses exclusively on the CAMS-based results.
The uncertainties derived from fitting the differences between instruments are consistent with those expected from Eq. (4) for the Cabauw station. Here, the fitted and expected uncertainties are nearly identical (1.96 and 1.98 Pmolec cm−2). At Berlin, Bremen, Brussels, Cologne, Helsinki, Lindenberg, and Rome IAA, the fitted uncertainties are slightly higher but remain within 25 % of the expected values. In contrast, Bucarest and Granada show differences of approximately 35 %. More substantial deviations are observed at Innsbruck, Julich, Rome_ISAC, and Rome_SAP, where the fitted uncertainties exceed the expected ones by more than 60 %. The largest discrepancies occur at Athens and Thessaloniki, where the fitted uncertainties are more than twice the expected values. For example, the presence of mountainous terrain surrounding the ground station in Athens, and the combination of land, coastal, and mountainous areas within the satellite footprint in Thessaloniki, may explain the higher uncertainties observed at these sites. These results suggest that the uncertainty estimates for the individual instruments or the representation errors derived in this study may be somewhat optimistic. Alternatively, the discrepancies could indicate the presence of additional sources of uncertainty that have not yet been accounted for in the current analysis.
5.2 Dependence on the a-priori
The comparisons show that the replacement of the coarse global TM5 1° × 1° simulations by the CAMS regional 0.1° × 0.1° reduces the negative bias substantially. CAMS better resolves the cities and major hotspots, but the resolution of these CAMS simulations is still limited compared to the actual length scales of variability for NO2 and also compared to the resolution of TROPOMI. The question therefore remains whether the comparison biases may further reduce if even higher resolution model profiles are used.
To further evaluate the impact of the a-priori replacement on the consistency between TROPOMI and Pandora observations, we included a third TROPOMI retrieval using LOTOS-EUROS high-resolution simulation results at 1.3 × 1.7 km2 as the a-priori. This analysis focused on the period 2019–2023 and the Cabauw station, for which modeling outputs were available. The comparison results are summarized in Fig. 11. Both the CAMS and LOTOS-EUROS a-priori profiles show a clear improvement over the default TM5-MP a-priori. The negative bias is reduced from 12 % in the default TM5-MP version to 6 % with CAMS and nearly 0 % with LOTOS-EUROS. In addition to the bias, the RMSE and regression slopes also improve in both cases compared to the default TM5-MP configuration. It is worth noting that the higher spatial resolution of LOTOS-EUROS enables a more accurate representation of concentration hotspots and gradients. This may be the main reason why the lowest bias among all options is obtained here. However, the LOTOS-EUROS model differs from the ensemble model in CAMS, and part of the profile changes may be due to modeling aspects instead of resolution alone. But we can conclude that detailed quantitative validation studies require high-resolution model profiles.
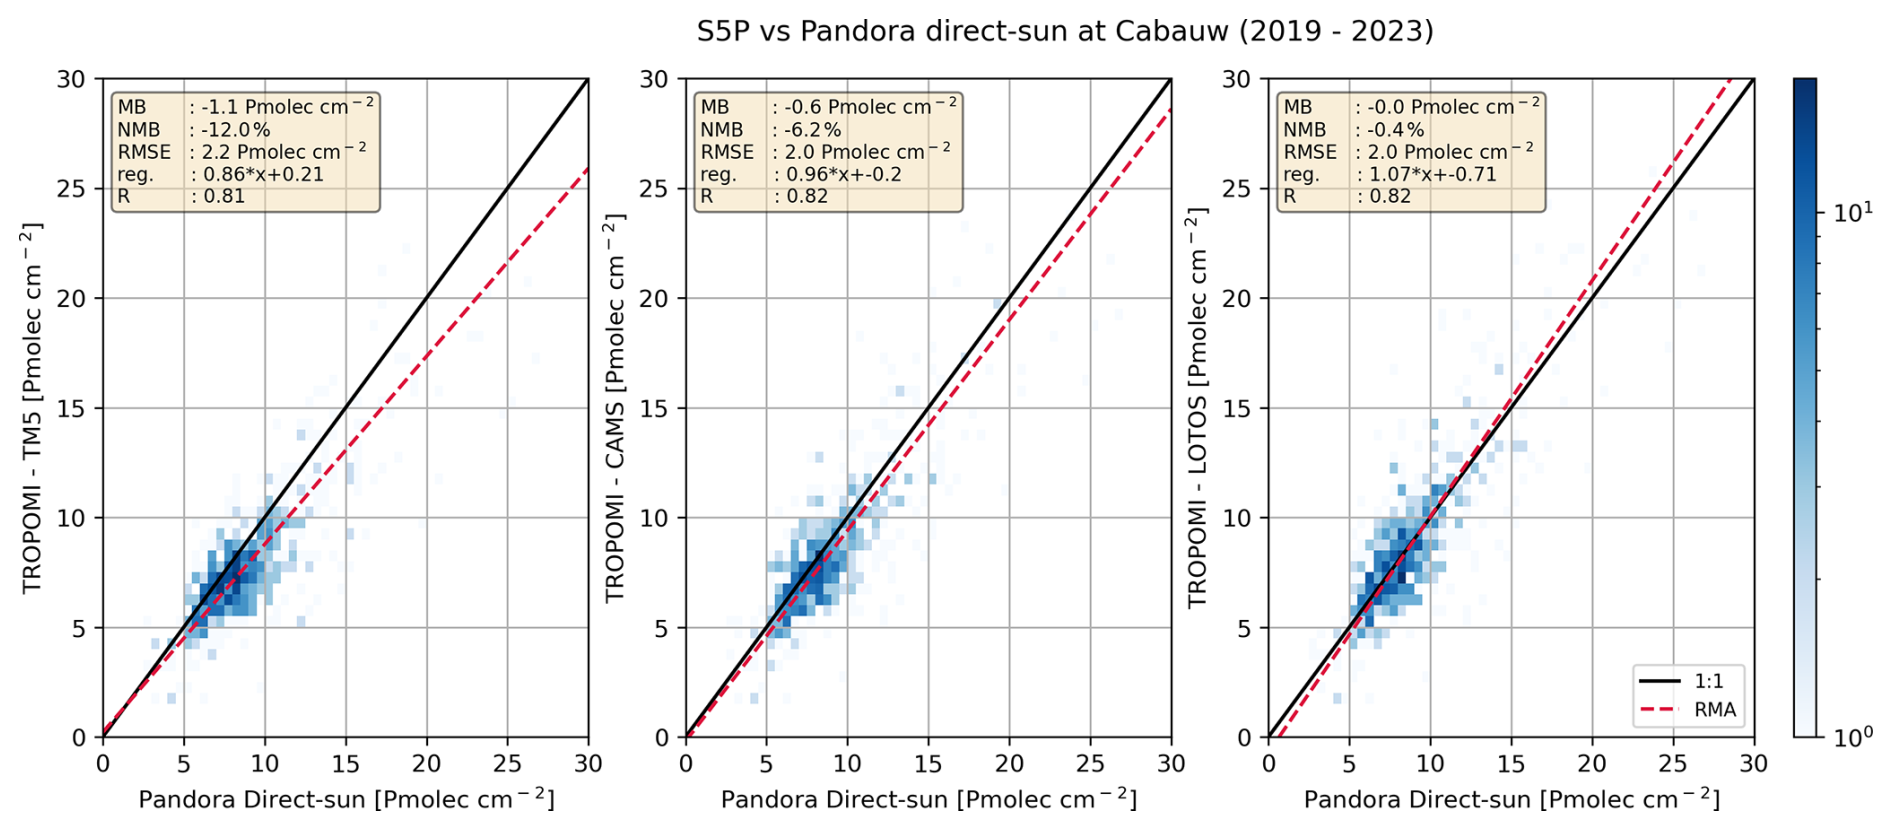
Figure 11Scatter plot between TROPOMI and Pandora total NO2 column observations at Cabauw station for 2019–2023. Left panel: the operational TROPOMI retrievals with TM5-MP 1° × 1° resolution a-priori profiles. Center panel: TROPOMI retrievals based on CAMS a-priori profiles at 0.1° × 0.1° resolution. Right panel: TROPOMI retrievals based on LOTOS-EUROS a-priori profiles at 1.3 × 1.7 km2 resolution.
5.3 TROPOMI tropospheric NO2 compared to Pandora sky-scan
Comparisons between TROPOMI tropospheric NO2 columns and Pandora sky-scan observations, similar to those performed for the total NO2 column validation, demonstrate good agreement, with correlation coefficients up to 0.79, as shown in Fig. 12. On average, TROPOMI exhibits a low bias of approximately 20 % when using the default TM5-MP a-priori profiles. This bias is reduced to nearly 0 % when CAMS a-priori profiles are employed.
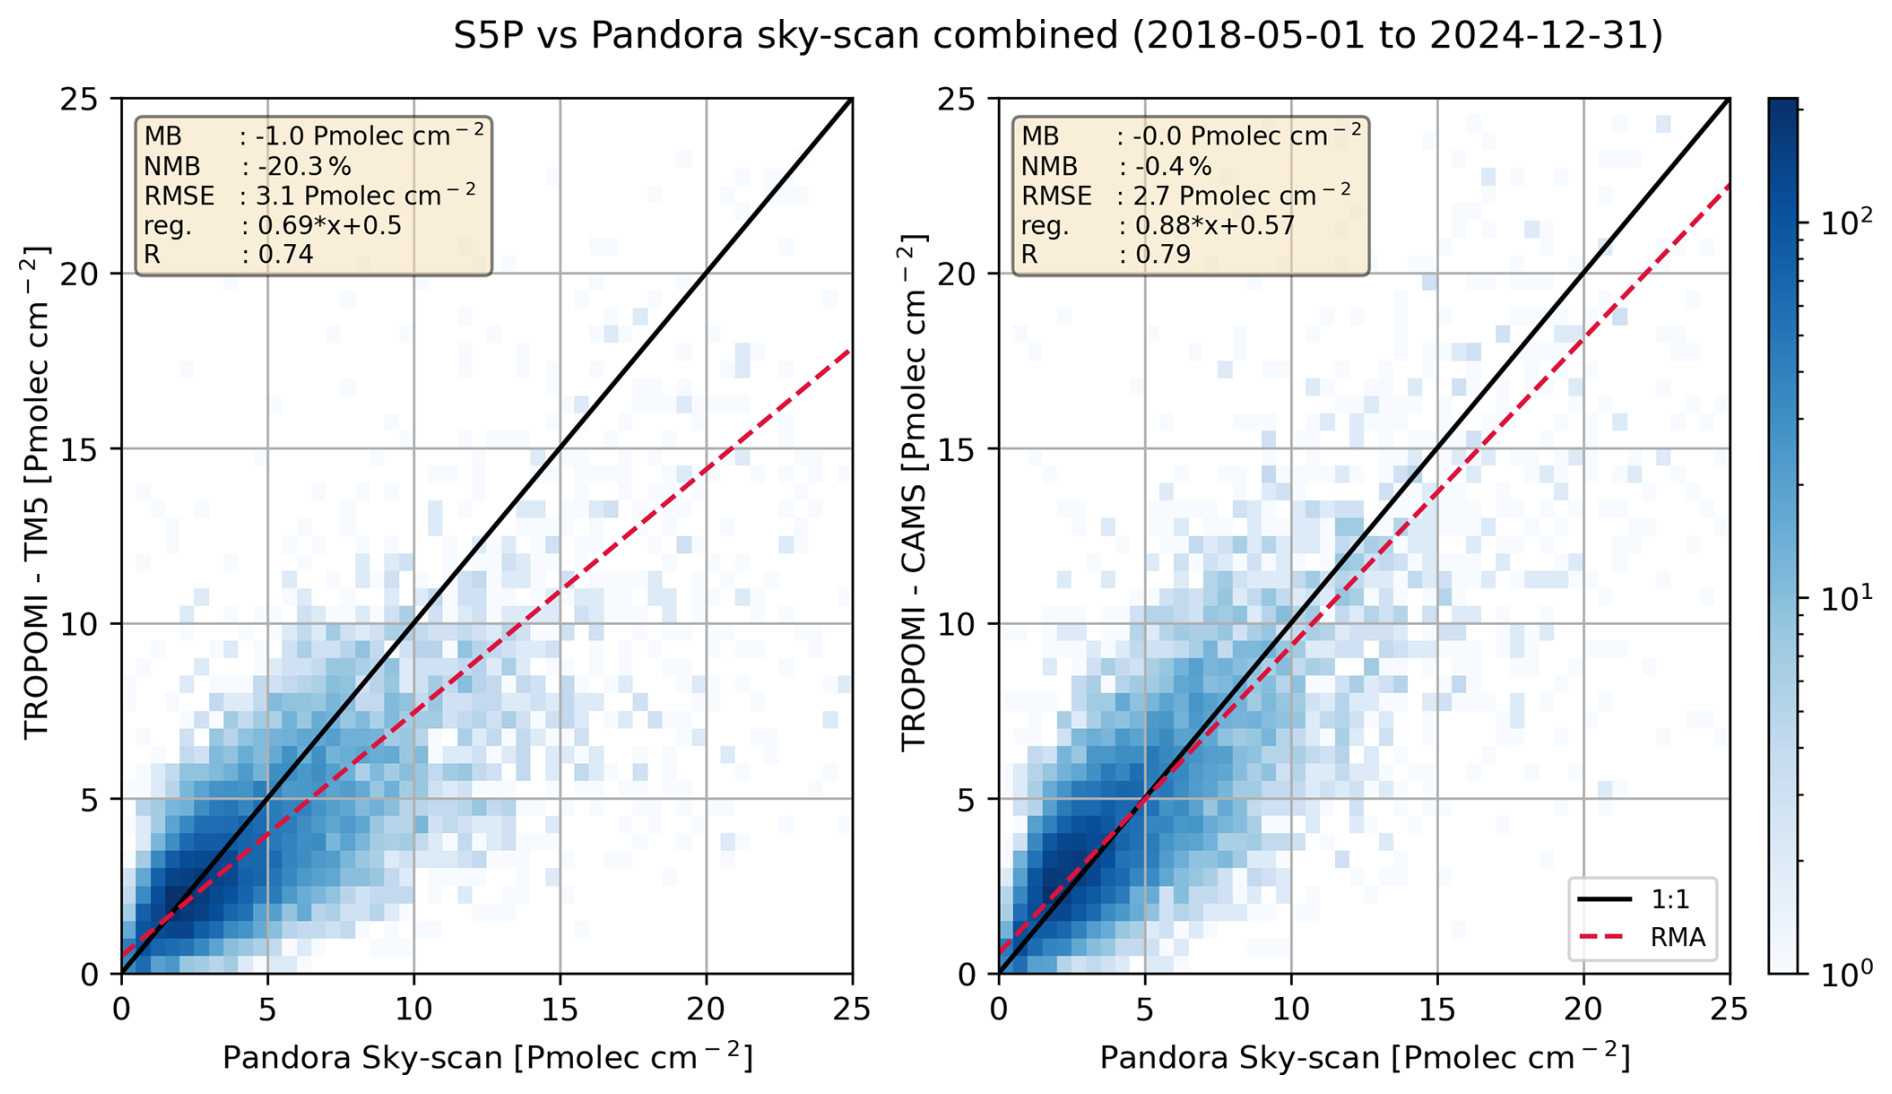
Figure 12Scatter plot of TROPOMI versus Pandora tropospheric NO2 column observations aggregated across 18 European stations. Left: operational TROPOMI retrievals using TM5-MP a-priori profiles at 1° × 1° resolution. Right: TROPOMI retrievals using CAMS a-priori profiles at 0.1° × 0.1° resolution (Douros et al., 2023).
Figure 13 presents monthly averaged tropospheric NO2 columns, demonstrating that TROPOMI reliably reproduces the seasonal patterns observed by Pandora across the year. Lower NO2 levels are recorded in summer, reflecting enhanced photochemical activity and lower emission rates. Conversely, the highest columns are observed during winter, corresponding to increased anthropogenic emissions and less efficient photochemical removal processes. While the seasonal trends between TROPOMI and Pandora are in good agreement, slight differences in magnitude are attributed to differences in spatial representativeness, vertical sensitivity, or retrieval assumptions.
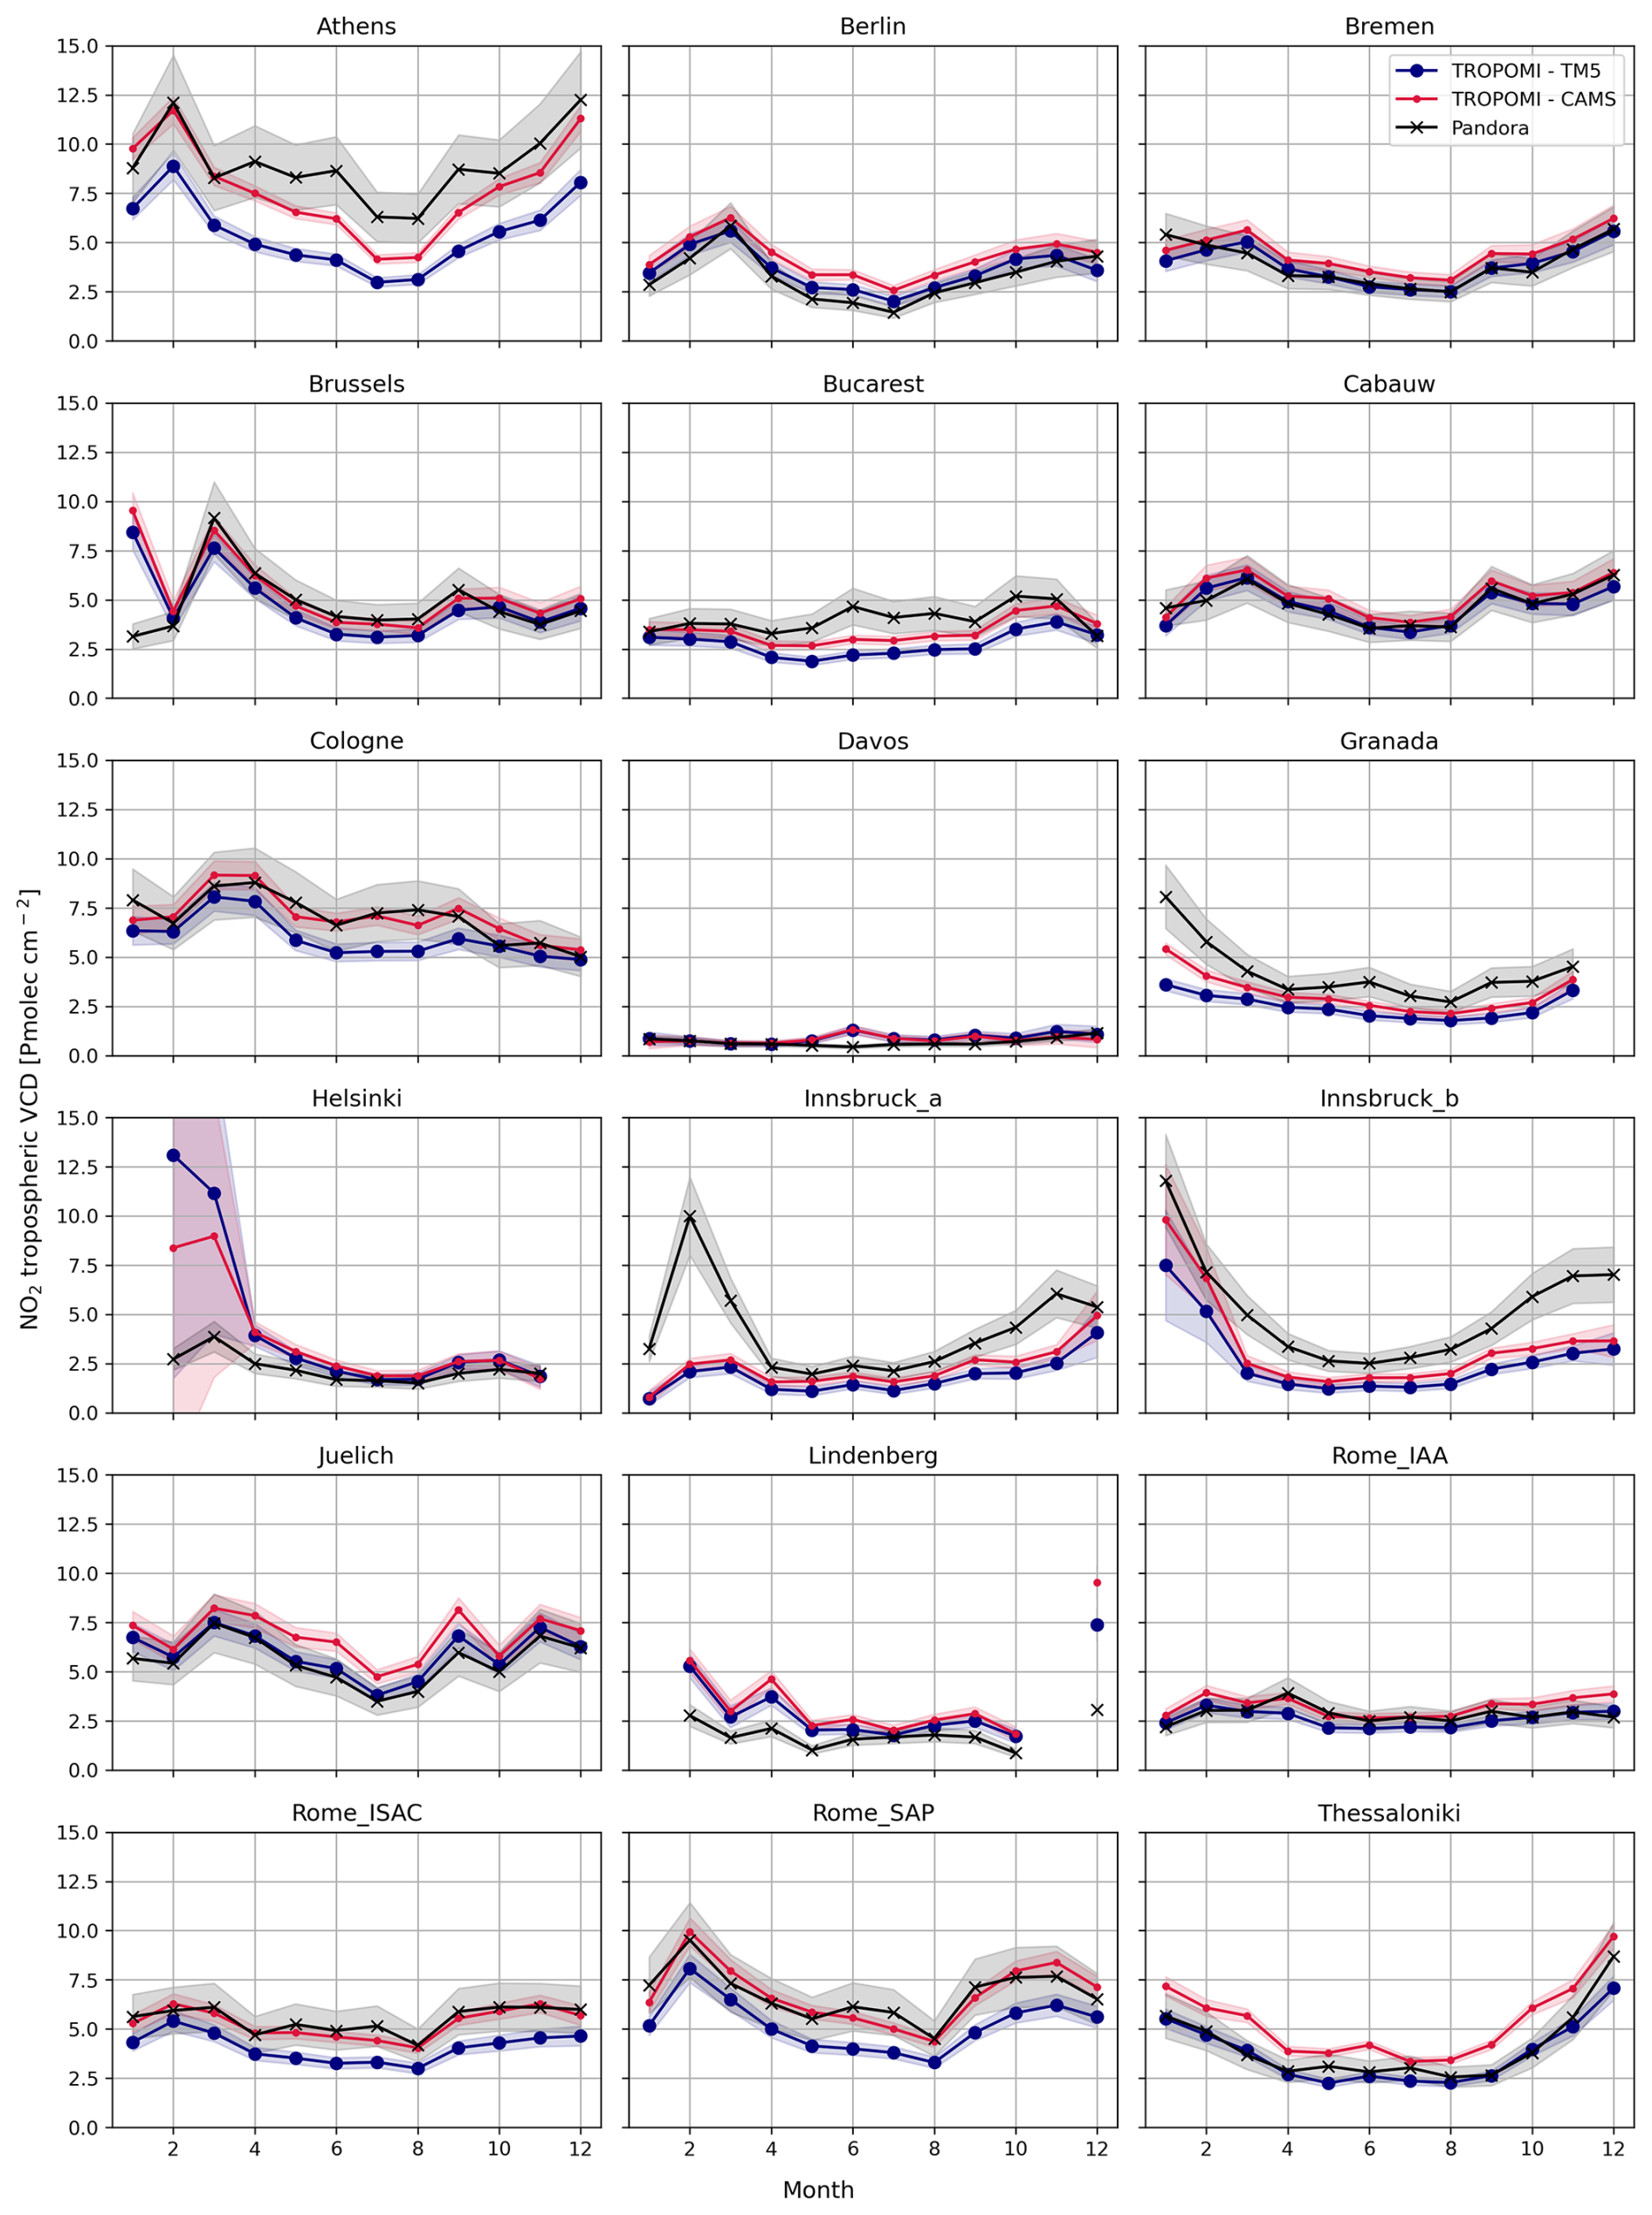
Figure 13Monthly-averaged seasonal cycle comparison between the TROPOMI tropospheric column with Pandora sky-scan tropospheric NO2 column observations. Shaded areas around the lines represent the total uncertainty for each measurement type.
The uncertainties obtained from fitting the distribution of differences between TROPOMI and Pandora sky-scan measurements (Fig. B10), similar to the DS results, show good agreement with those expected from Eq. (4) for the stations Berlin, Bremen, Brussels, Cabauw, Cologne, Davos, Granada, Helsinki, and Rome_SAP, with relative differences below 20 %. In contrast, the fitted uncertainties for Bucarest, Julich, Lindenberg, Rome_IAA, and Rome_ISAC are 50 %–60 % higher than expected, while at Athens, Innsbruck, and Thessaloniki, the fitted values exceed the expected ones by more than 70 %.
5.4 TROPOMI tropospheric NO2 with MAX-DOAS FRM4DOAS
In comparison with MAX-DOAS measurements, TROPOMI tropospheric NO2 exhibits a strong correlation, with a coefficient of 0.82 when using CAMS a-priori, as illustrated in Fig. 14. TROPOMI with TM5-MP a-priori underestimates NO2 concentrations in comparison with MAX-DOAS FRM4DOAS retrieval, with a mean bias of approximately 30 %, consistent with the values reported by Lambert et al. (2025) in the operational validation of TROPOMI. This underestimation is reduced to about 15 % when CAMS a-priori profiles are used instead of TM5-MP. The residual biases after replacing the a-priori profiles may indicate the need for even higher-resolution a-priori information. They may also stem from vertical smoothing errors between the instruments. For TROPOMI with TM5-MP a-priori profiles, this issue is discussed in Sect. 4.3, where such errors can reach up to 20 %.
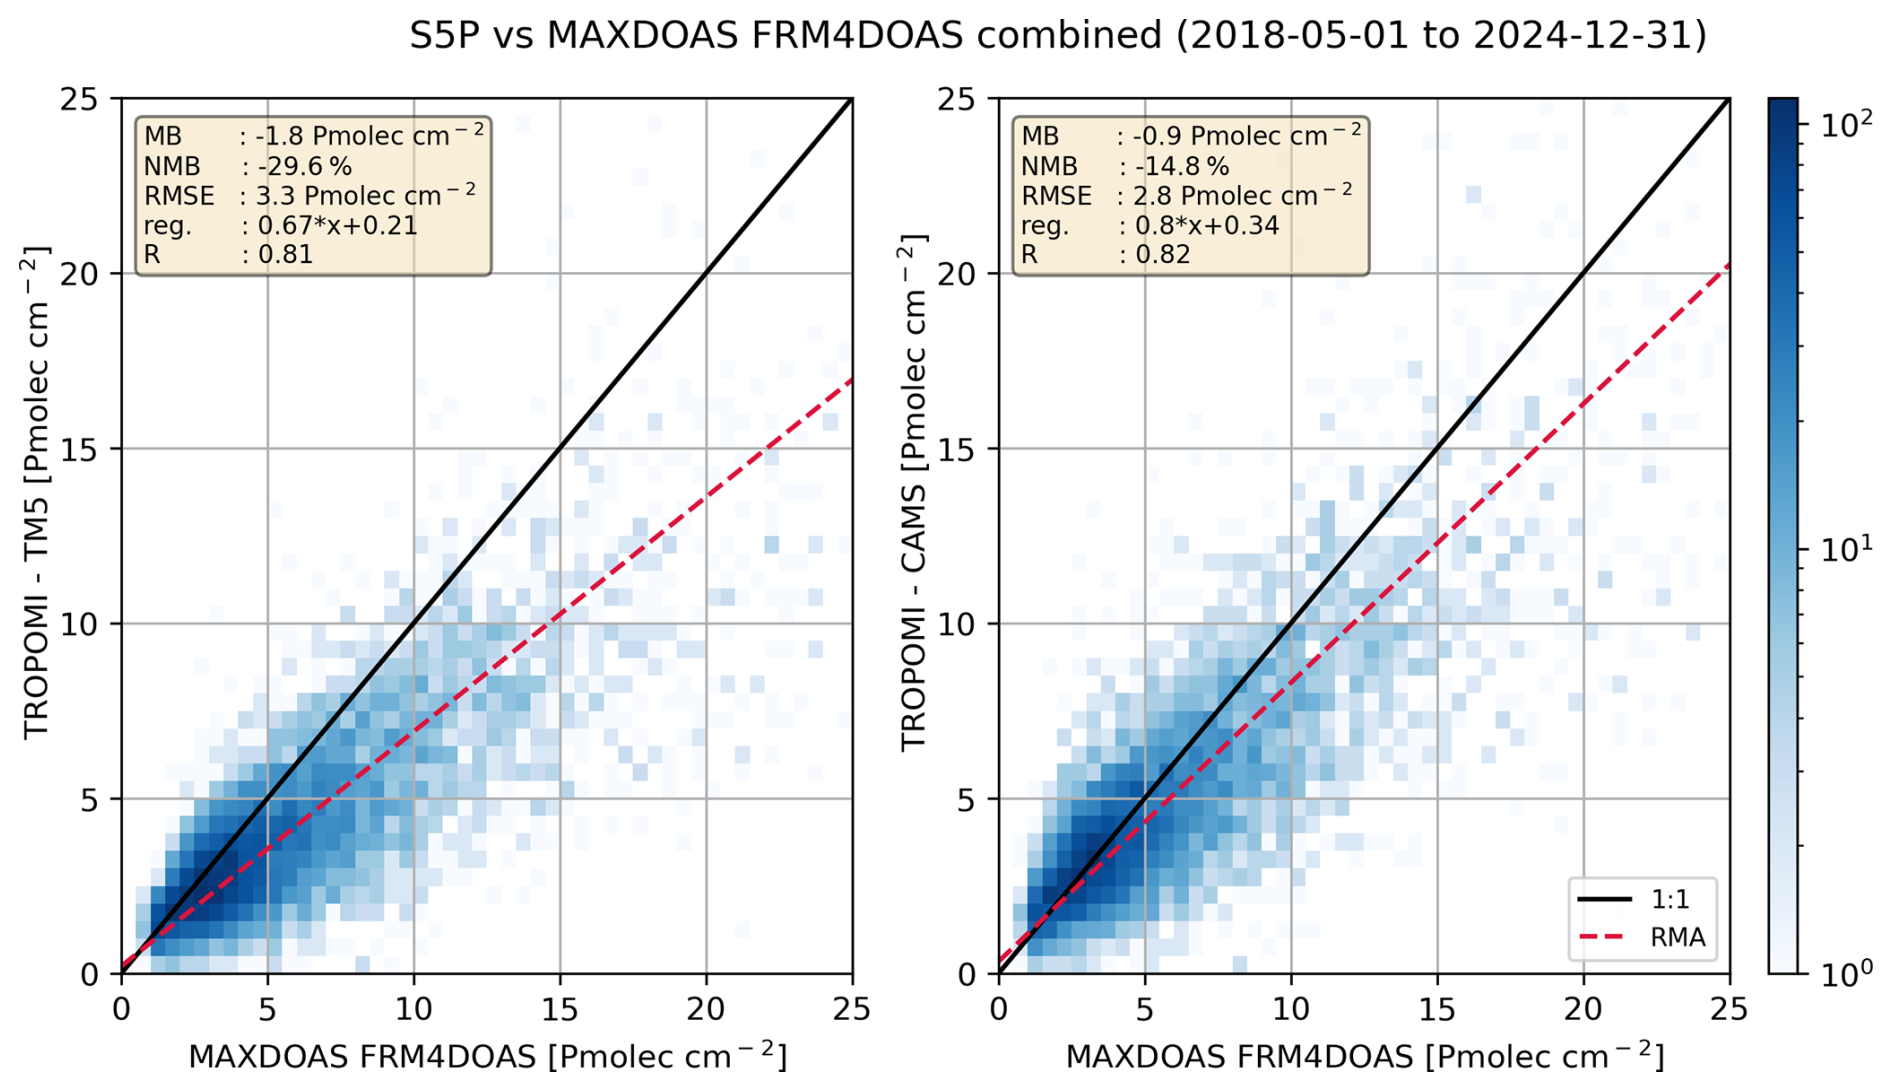
Figure 14Scatter plot of TROPOMI versus MAX-DOAS FRM4DOAS tropospheric NO2 column observations aggregated across 8 European stations. Left: operational TROPOMI retrievals using TM5-MP a-priori profiles at 1° × 1° resolution. Right: TROPOMI retrievals using CAMS a-priori profiles at 0.1° × 0.1° resolution (Douros et al., 2023).
The agreement between TROPOMI and MAX-DOAS measurements exhibits a clear seasonal pattern, with larger biases during winter months. During this period, MAX-DOAS FRM4DOAS values tend to exceed those from TROPOMI at all evaluated stations except Athens, as shown in Fig. 15. The Athens site is a special case because the MAX-DOAS instrument is positioned on a hill overlooking the city, causing it to miss part of the near-surface NO2. As previously discussed in Sect. 4.4, MAX-DOAS FRM4DOAS generally reports higher values than the other ground-based instruments during winter. The larger errors observed in this season can be explained by several factors. Such as the reduced number of collocated observations, which increases the uncertainty, and the greater variability and steeper vertical gradients of NO2 in winter heighten the impact of the differences in the vertical sensitivity of the instruments.
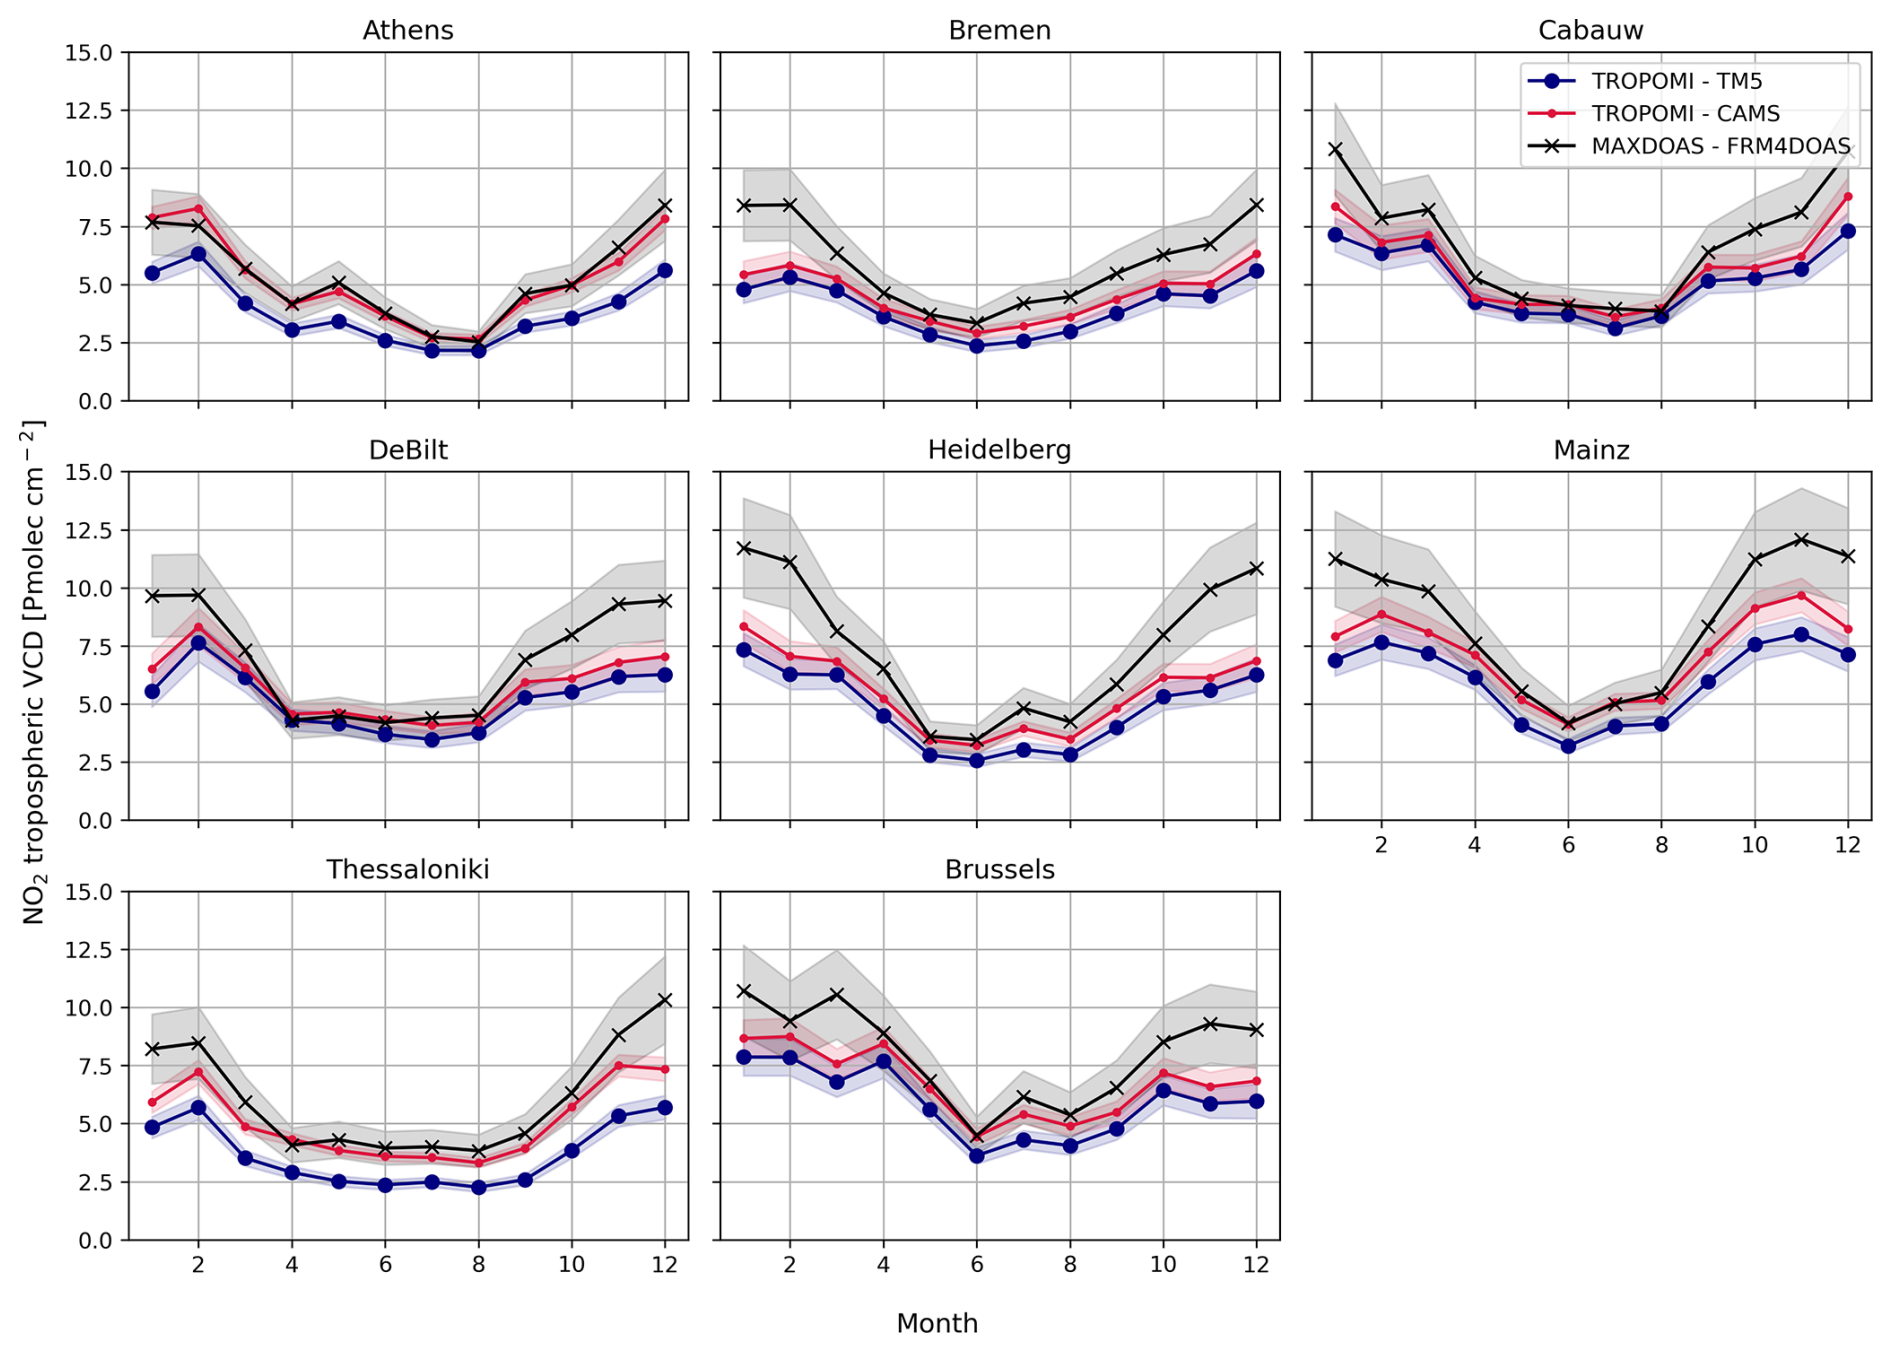
Figure 15Monthly-averaged seasonal cycle comparison between the TROPOMI tropospheric column with MAX-DOAS FRM4DOAS tropospheric NO2 column observations. Shaded areas around the lines represent the total uncertainty for each measurement type.
The distribution of differences between TROPOMI and MAX-DOAS measurements (Fig. B11) indicates that the fitted deviations exceed those expected from the reported uncertainties at all stations. The fitted deviations at Bremen, Brussels, Cabauw, De Bilt, and Mainz are less than 25 % higher than expected, while Heidelberg shows an excess of approximately 40 %. The largest discrepancies are observed at Athens and Thessaloniki, where the fitted deviations are more than 60 % higher than expected.
An alternative approach for comparing MAX-DOAS and TROPOMI data, and for reducing the smoothing error arising from differences in a-priori profiles and vertical sensitivities, is to reproduce the retrieval of one instrument by adjusting the retrieval of the other (Rodgers and Connor, 2003). In Fig. B12, we apply the TROPOMI AKs to the retrieved MAX-DOAS NO2 profiles to construct a MAX-DOAS tropospheric column that reflects the a-priori information and vertical sensitivity used by TROPOMI. This transformation yields a MAX-DOAS product that is effectively independent of the original MAX-DOAS a-priori profile shape, allowing a more consistent comparison with the TROPOMI retrievals. We find an improved correspondence between TROPOMI and MAX-DOAS when using the modified retrieval, particularly during the summer months. However, even after applying the modification, the bigger differences in winter between the two instruments persist.
5.5 Summary of comparisons and uncertainties
TROPOMI demonstrates good agreement with both total and tropospheric NO2 columns measured by Pandora in direct-sun and sky-scan modes, with high correlation coefficients (0.79) and a clear representation of seasonal variability. In contrast, comparisons with MAX-DOAS tropospheric columns reveal larger biases during winter. In general, TROPOMI with the standard TM5-MP a-priori exhibits a negative bias relative to ground-based instruments. Replacing the TM5-MP a-priori with CAMS substantially reduces this bias. On a station-by-station basis (Fig. 16 for absolute values and Fig. B13 for relative values), the agreement between TROPOMI and both Pandora total columns and MAX-DOAS tropospheric columns improves at all stations, while for Pandora-derived tropospheric columns, the agreement improves at most of the analyzed stations.
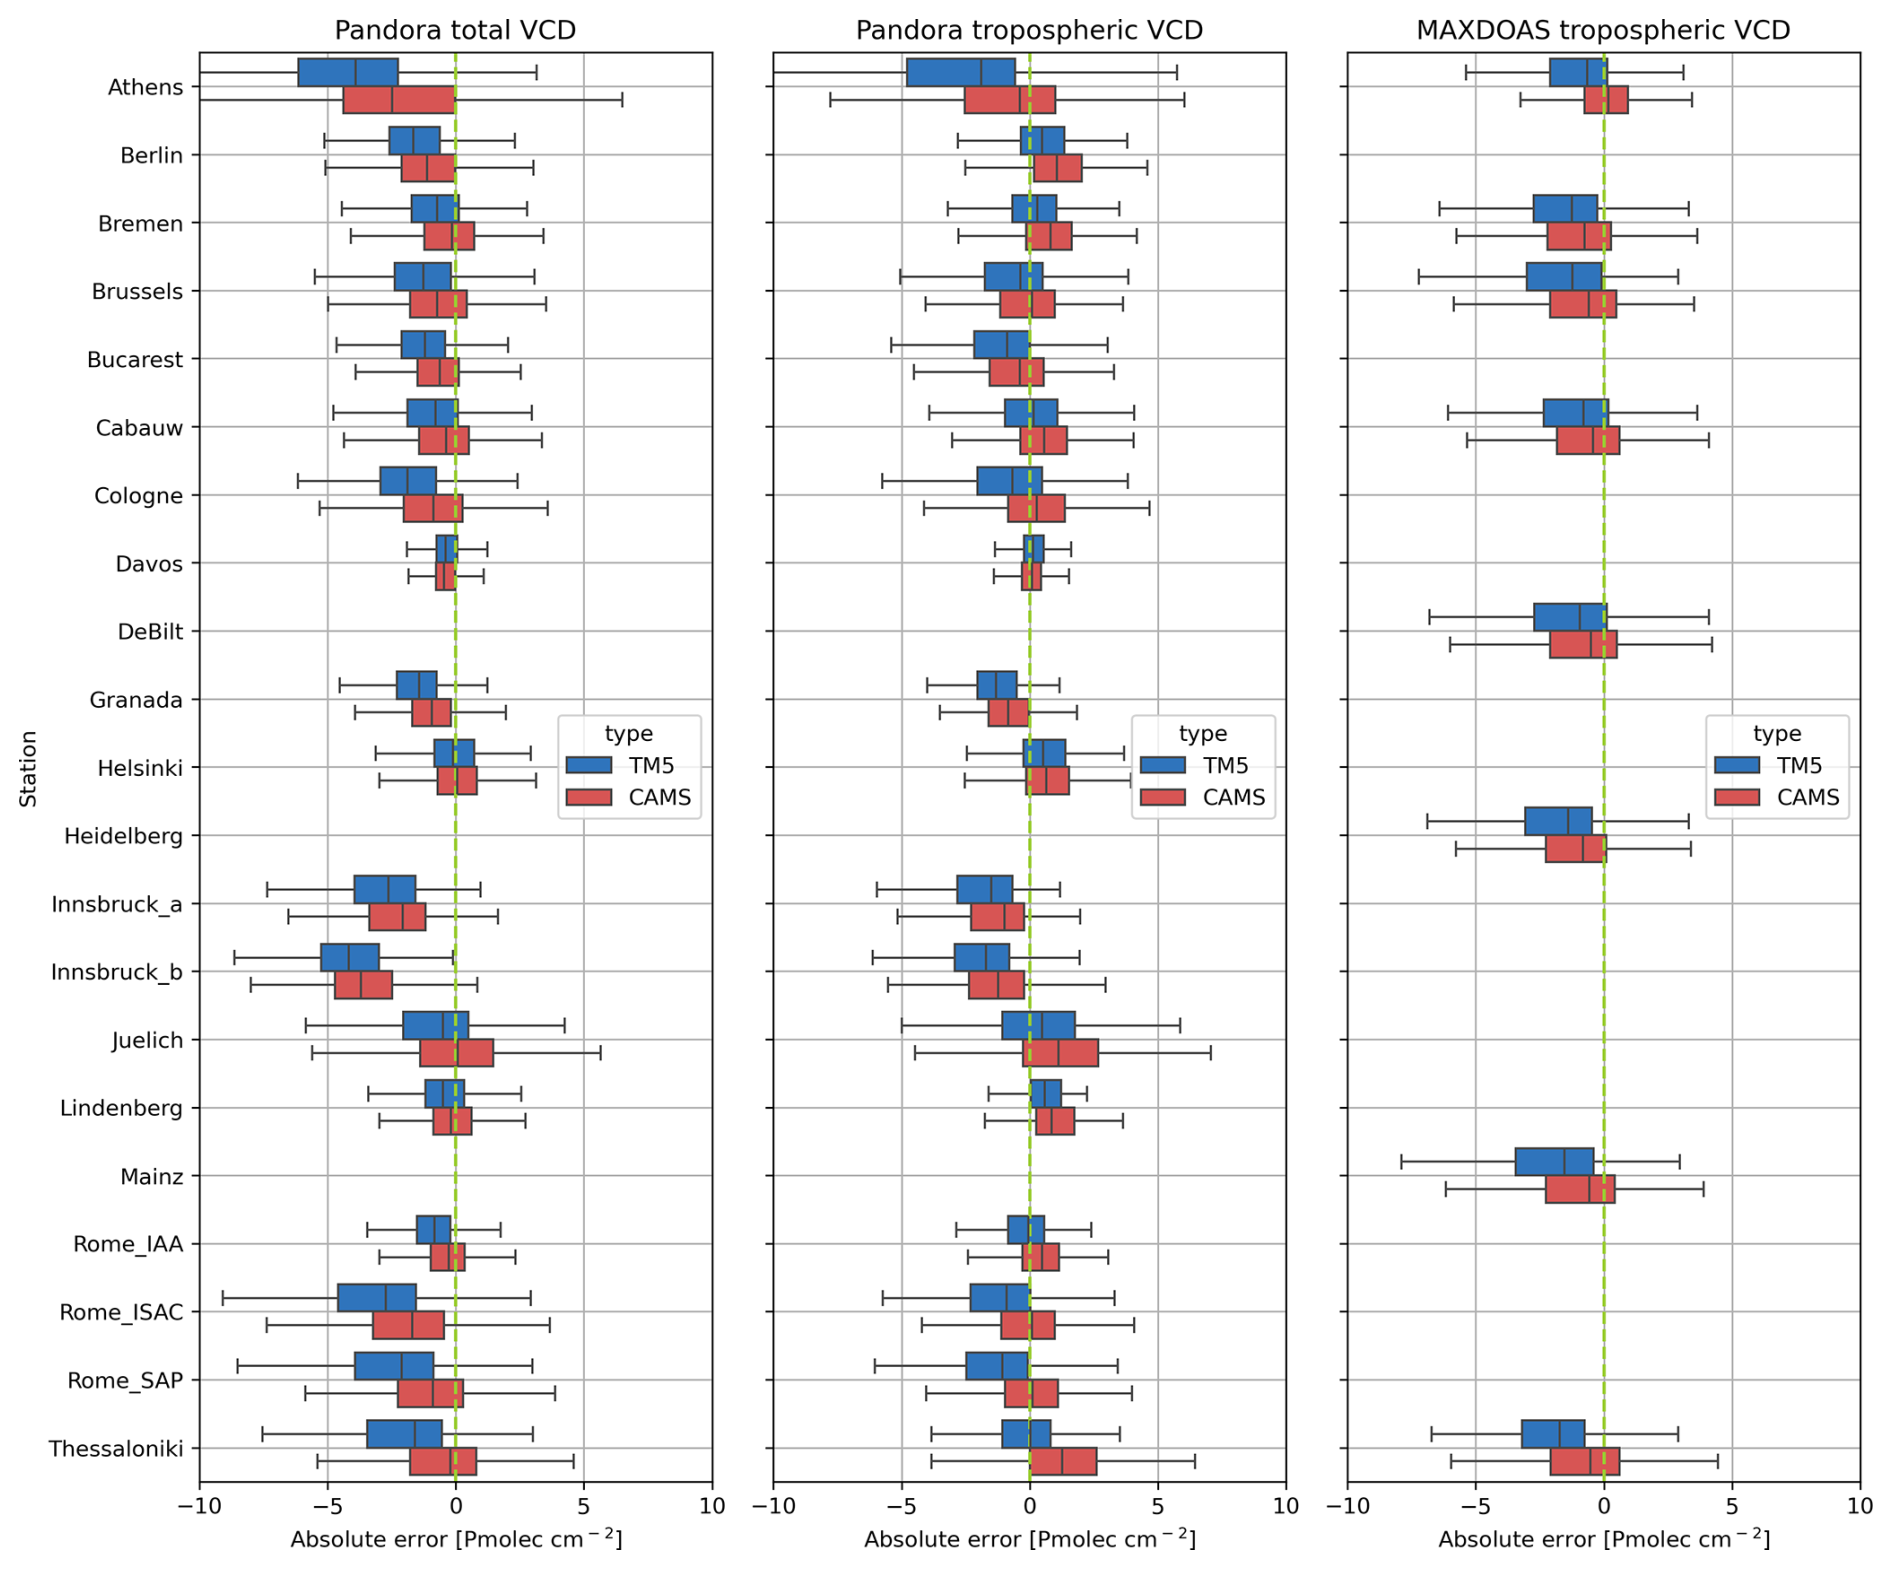
Figure 16Distributions of the absolute differences between TROPOMI and ground-based observations, using TM5-MP (blue) and CAMS (red) a-priori profiles. Results are shown for individual stations (vertical) for the Pandora total column (left), tropospheric column (middle), and MAX-DOAS FRM4DOAS (right) comparisons.
The uncertainties derived from the differences between TROPOMI and the ground-based instruments, summarized in Fig. 17, are generally higher than the expected uncertainties calculated using Eq. (4). This suggests that the uncertainties in TROPOMI, ground-based measurements, and representation may be somewhat optimistic, or that additional factors contributing to the overall uncertainty have not been accounted for. For example, residual errors may still arise from the representation uncertainty. Due to the limited spatial coverage of our high-resolution CTM simulations, which are restricted to the Netherlands domain, the impact of sub-pixel variability within a TROPOMI pixel was estimated only for the De Bilt station and subsequently generalized to the other stations included in this study. However, station-specific geographical and emission characteristics may lead to different representation uncertainty estimates. We therefore strongly recommend estimating this uncertainty parameter individually for each station when the necessary information is available. In addition, one aspect not addressed in this study is the directional sampling of the ground-based instruments (MAX-DOAS and Pandora operating in sky-scan mode). At most stations, the viewing azimuth angle (VAA) remains fixed, which limits the ability to characterize the horizontal distribution of NO2 around the measurement site. Dual-scan MAX-DOAS observations that vary the VAA can better capture this horizontal variability and thereby improve comparisons with satellite measurements (Dimitropoulou et al., 2020). In addition, the uncertainty estimates for individual TROPOMI retrievals rely on simplified assumptions regarding errors in surface albedo and cloud parameters used as inputs to the retrieval algorithm. These assumptions are likewise approximate and could be refined. Moreover, errors in albedo and cloud properties are treated as uncorrelated contributions, whereas in reality they exert a correlated influence on NO2 retrievals, an effect that is only partially accounted for in the current methodology.
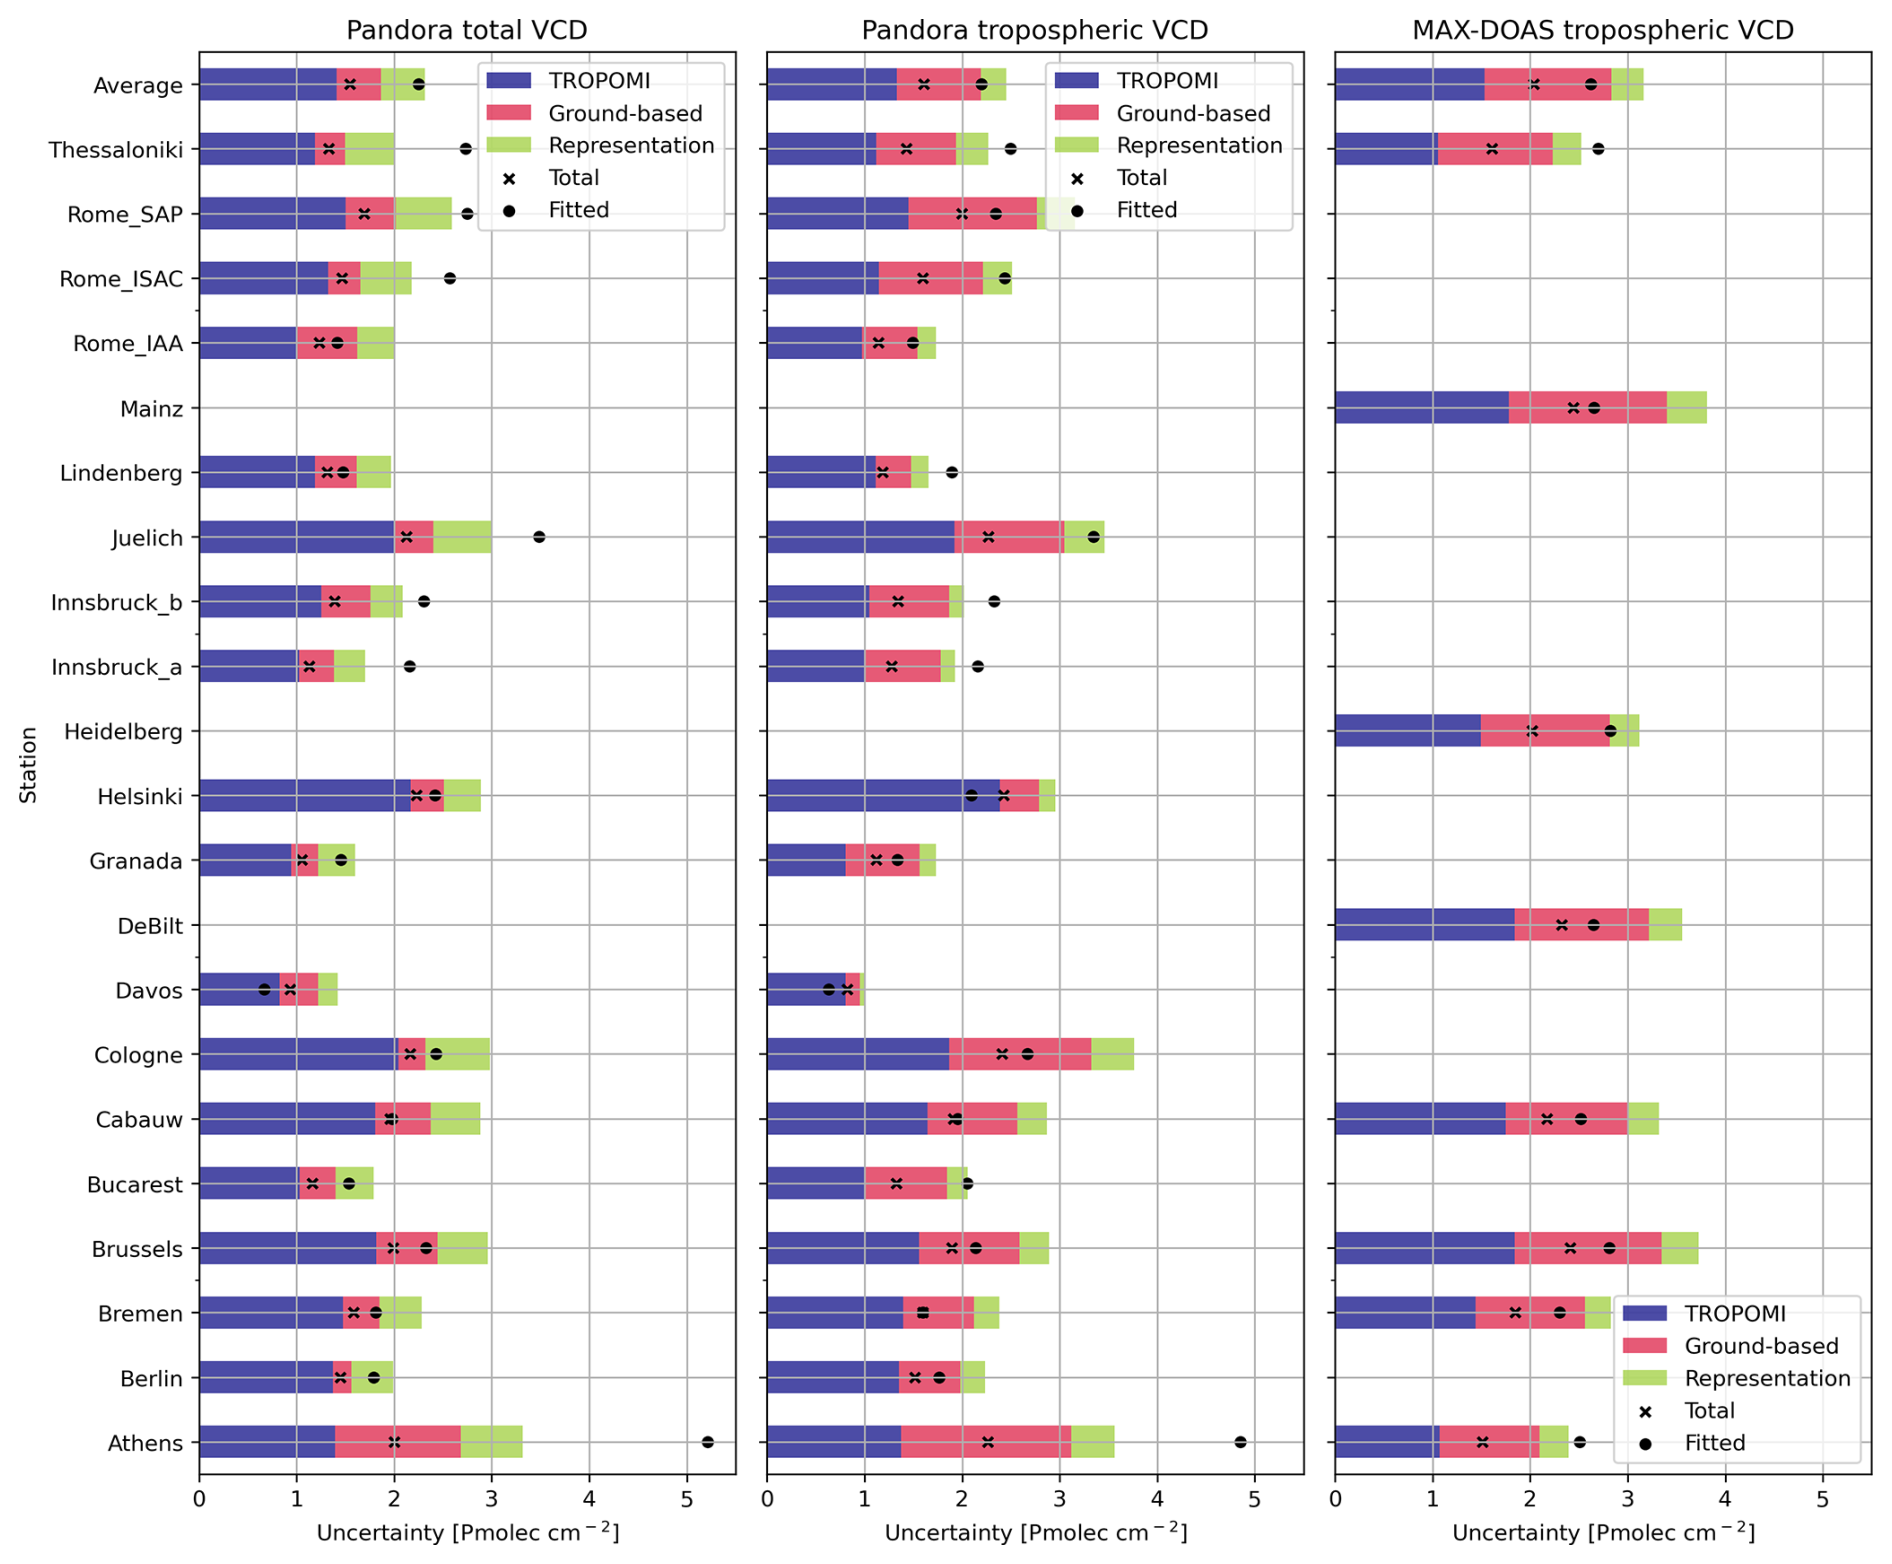
Figure 17TROPOMI, ground-based and representation uncertainties for the intercomparisons. The combined uncertainties are estimated as shown in Eq. (4). The fitted uncertainties correspond to the standard deviation obtained from a Gaussian fit to the distribution of differences between TROPOMI (with CAMS a-priori) and the ground-based measurements.
Despite the optimistic uncertainty estimated the agreement is good for most of the analyzed stations, with notable exceptions at Athens, Innsbruck, and Thessaloniki. The complex topography surrounding these sites is a likely contributor to the increased uncertainty. Athens is enclosed by mountains to the north (Parnitha, Penteli), east (Hymettos), and west (Egaleo), while the Saronic Gulf to the south restricts air-mass dispersion within the basin (Skoulidou et al., 2021; Grivas et al., 2008). Furthermore, the local MAX-DOAS instrument is also installed on one of these surrounding hills, introducing additional representativeness differences relative to the satellite footprint. Thessaloniki combines coastal terrain along the Thermaic Gulf with mountainous influences from Mount Hortiatis, creating pronounced sea–land breezes and valley–mountain circulations that produce strong horizontal gradients and rapidly varying air masses (Skoulidou et al., 2021; Moussiopoulos et al., 2009). Innsbruck is located in the narrow Inn Valley, where steep mountain walls tightly constrain atmospheric flow and favor strong spatial heterogeneity in pollutant distributions. Such complex orography generates concentration gradients at scales smaller than TROPOMI’s spatial resolution, and the semi-random pixel location of TROPOMI on each orbit can result in retrievals that alternately emphasize coastal, urban, or mountainous sectors (Thessaloniki, for example). Ground-based instruments, by contrast, are highly sensitive to local inhomogeneities within their line of sight, further amplifying differences with the coarse satellite footprint. Additionally, the chemical transport models used to provide a-priori vertical profiles for TROPOMI, whether standard TM5-MP (1° × 1°) or based on higher-resolution CAMS (0.1° × 0.1°), cannot adequately resolve fine-scale variability in emissions, land-use patterns, meteorology, and pollutant dispersion. As a result, the a-priori information used in the retrievals is suboptimal in these complex environments, contributing to the observed inconsistencies between satellite and ground-based NO2.
In this study, we present a comparison between TROPOMI NO2 retrievals and ground-based measurements from Pandora direct-sun, Pandora sky-scan, and MAX-DOAS retrievals. The analysis focuses on Europe and the Netherlands, because of the availability of high-resolution modelling data used as a-priori profiles in the TROPOMI retrievals. Our main findings are:
-
Importance of using high-spatial-resolution a-priori profiles. The replacement of the default TM5-MP a-priori profiles (1° × 1° resolution) with high-resolution CAMS European forecasts (0.1° × 0.1°) substantially improves the agreement between TROPOMI and ground-based observations. On average, the bias between TROPOMI and Pandora total column measurements decreases from 23 % to 12 %, while the bias for Pandora tropospheric columns is reduced from 20 % to nearly 0 %. Similarly, the bias between TROPOMI and MAX-DOAS FRM4DOAS tropospheric columns decreases from 30 % to 15 %. The use of high-resolution a-priori profiles provides a more realistic representation of three-dimensional concentration gradients near emission hotspots. For validation studies over Europe, we recommend using the European TROPOMI NO2 product (Douros et al., 2023), available at https://www.temis.nl/airpollution/no2_cams.php (last access: 9 April 2026). If feasible, using an a-priori profile with even higher spatial resolution could further improve the validation. As demonstrated for the Cabauw station, the bias between TROPOMI and Pandora DS observations further decreases when high-resolution kilometer-scale LOTOS-EUROS a-priori profiles are applied. In fact, the enhancement obtained when moving from CAMS to LOTOS-EUROS is comparable to the improvement achieved when replacing TM5-MP with CAMS. It should be noted that relative comparisons between models and TROPOMI NO2 using AKs are independent of the a-priori profile shape; therefore, either the operational global TROPOMI product or the European CAMS product can be used for a model evaluation that is retrieval a-priori independent.
-
Results from the various ground-based instruments and retrievals differ. We find substantial differences among the various ground-based products, as demonstrated at sites hosting both Pandora and MAX-DOAS instruments. In particular, the MAX-DOAS FRM4DOAS product exhibits a more pronounced seasonal cycle than the other retrievals (and than TROPOMI), with notably larger wintertime columns. The Pandora direct-sun product is especially suitable as a reference, as its AMFs are simpler and more stable than those of the sky-scan and MAX-DOAS techniques, as indicated by the smaller estimated retrieval uncertainties presented in Table 2. Significant differences are also observed in the TROPOMI–ground-based comparisons across locations, suggesting that local setup and topography influence the results. To achieve quantitative validation, it is therefore essential to better understand the discrepancies among instruments, retrieval methods, and site characteristics.
-
Closure of the error budget. The total uncertainty in the comparisons arises from three main sources: the TROPOMI retrieval, the ground-based retrievals, and representation effects. The combined uncertainty from these components is compared with the width of the observed histogram of differences. Overall, we find that the differences between TROPOMI and the ground-based instruments generally exceed the estimated uncertainties. This suggests that the individual uncertainty estimates for TROPOMI, the ground-based measurements, and representation effects may be too optimistic, or that additional factors have not yet been accounted for. The largest discrepancies between fitted and expected uncertainties are observed at Athens, Innsbruck, and Thessaloniki, indicating the presence of site-dependent systematic effects.
-
Spatial representation error. High-resolution model simulations over the Netherlands were used to quantify representation errors arising from the different air masses sampled by TROPOMI and the ground-based instruments. Over Cabauw and De Bilt, the representation errors are estimated to be 4.7 % and 6.0 %, respectively, when evaluated on an orbit-by-orbit basis. For comparison, the representation error between OMI and the ground-based instruments at De Bilt was estimated at approximately 14 %.
-
Kernel differences and a-priori dependence. The comparison between satellite and ground-based measurements is complicated by their markedly different averaging kernel profiles. Consequently, the results are highly sensitive to the shape of the a-priori profile, a quantity that remains largely uncertain due to the limited availability of vertical NO2 profile measurements. We analysed the resulting smoothing errors for the comparison between TROPOMI (using TM5-MP a-priori profiles) and the MAX-DOAS FRM4DOAS retrievals, finding associated uncertainties of up to 20 % and highest in winter.
-
Wintertime bias over NW Europe. We investigated one source of systematic uncertainty in the TROPOMI NO2 retrieval, namely the stratospheric bias. We found that positive biases in the stratospheric column are most pronounced during the winter months at higher northern latitudes, on the order of 0.15 Pmolec cm−2. This error likely arises from limitations of the TM5-MP assimilation during winter, when the lack of observational constraints reduces the model accuracy. Errors in the stratosphere propagate into the estimation of the tropospheric column later on and can reach up to 1.5 Pmolec cm−2.
Although the analysis presented in this study focuses on the European domain, primarily due to the availability of a long-term alternative TROPOMI product with an improved retrieval, the conclusions are expected to be broadly applicable to other regions. In particular, our results highlight the importance of improving the spatial resolution of the a-priori profiles used in satellite retrievals. Replacing the standard profiles derived from TM5 with higher-resolution information can substantially enhance the representation of localized emission hotspots and horizontal gradients in trace-gas columns. Such improvements lead to better agreement between satellite-derived columns and ground-based remote-sensing measurements, and we therefore recommend implementing higher-resolution a-priori information whenever feasible. Furthermore, the methodologies described here for estimating both vertical and horizontal representation errors are transferable and can be applied in other regions or observational networks, provided that high-quality, high-spatial-resolution model simulations are available. Finally, the seasonal dependence of the errors identified in this study is likely to differ among regions; further investigation at regional and site-specific scales is required to fully characterize these seasonal effects and to determine how the uncertainties identified here translate to other geographical contexts.
This appendix presents the mathematical formulations used to compute key performance metrics for validating TROPOMI product. The metrics used are mean bias (MB), normalized MB (NMB) and root mean squared error (RMSE), and their formulations are provided below.
where n represents the total number of collocated observations, T is the TROPOMI observation, and G is the ground-based observation.
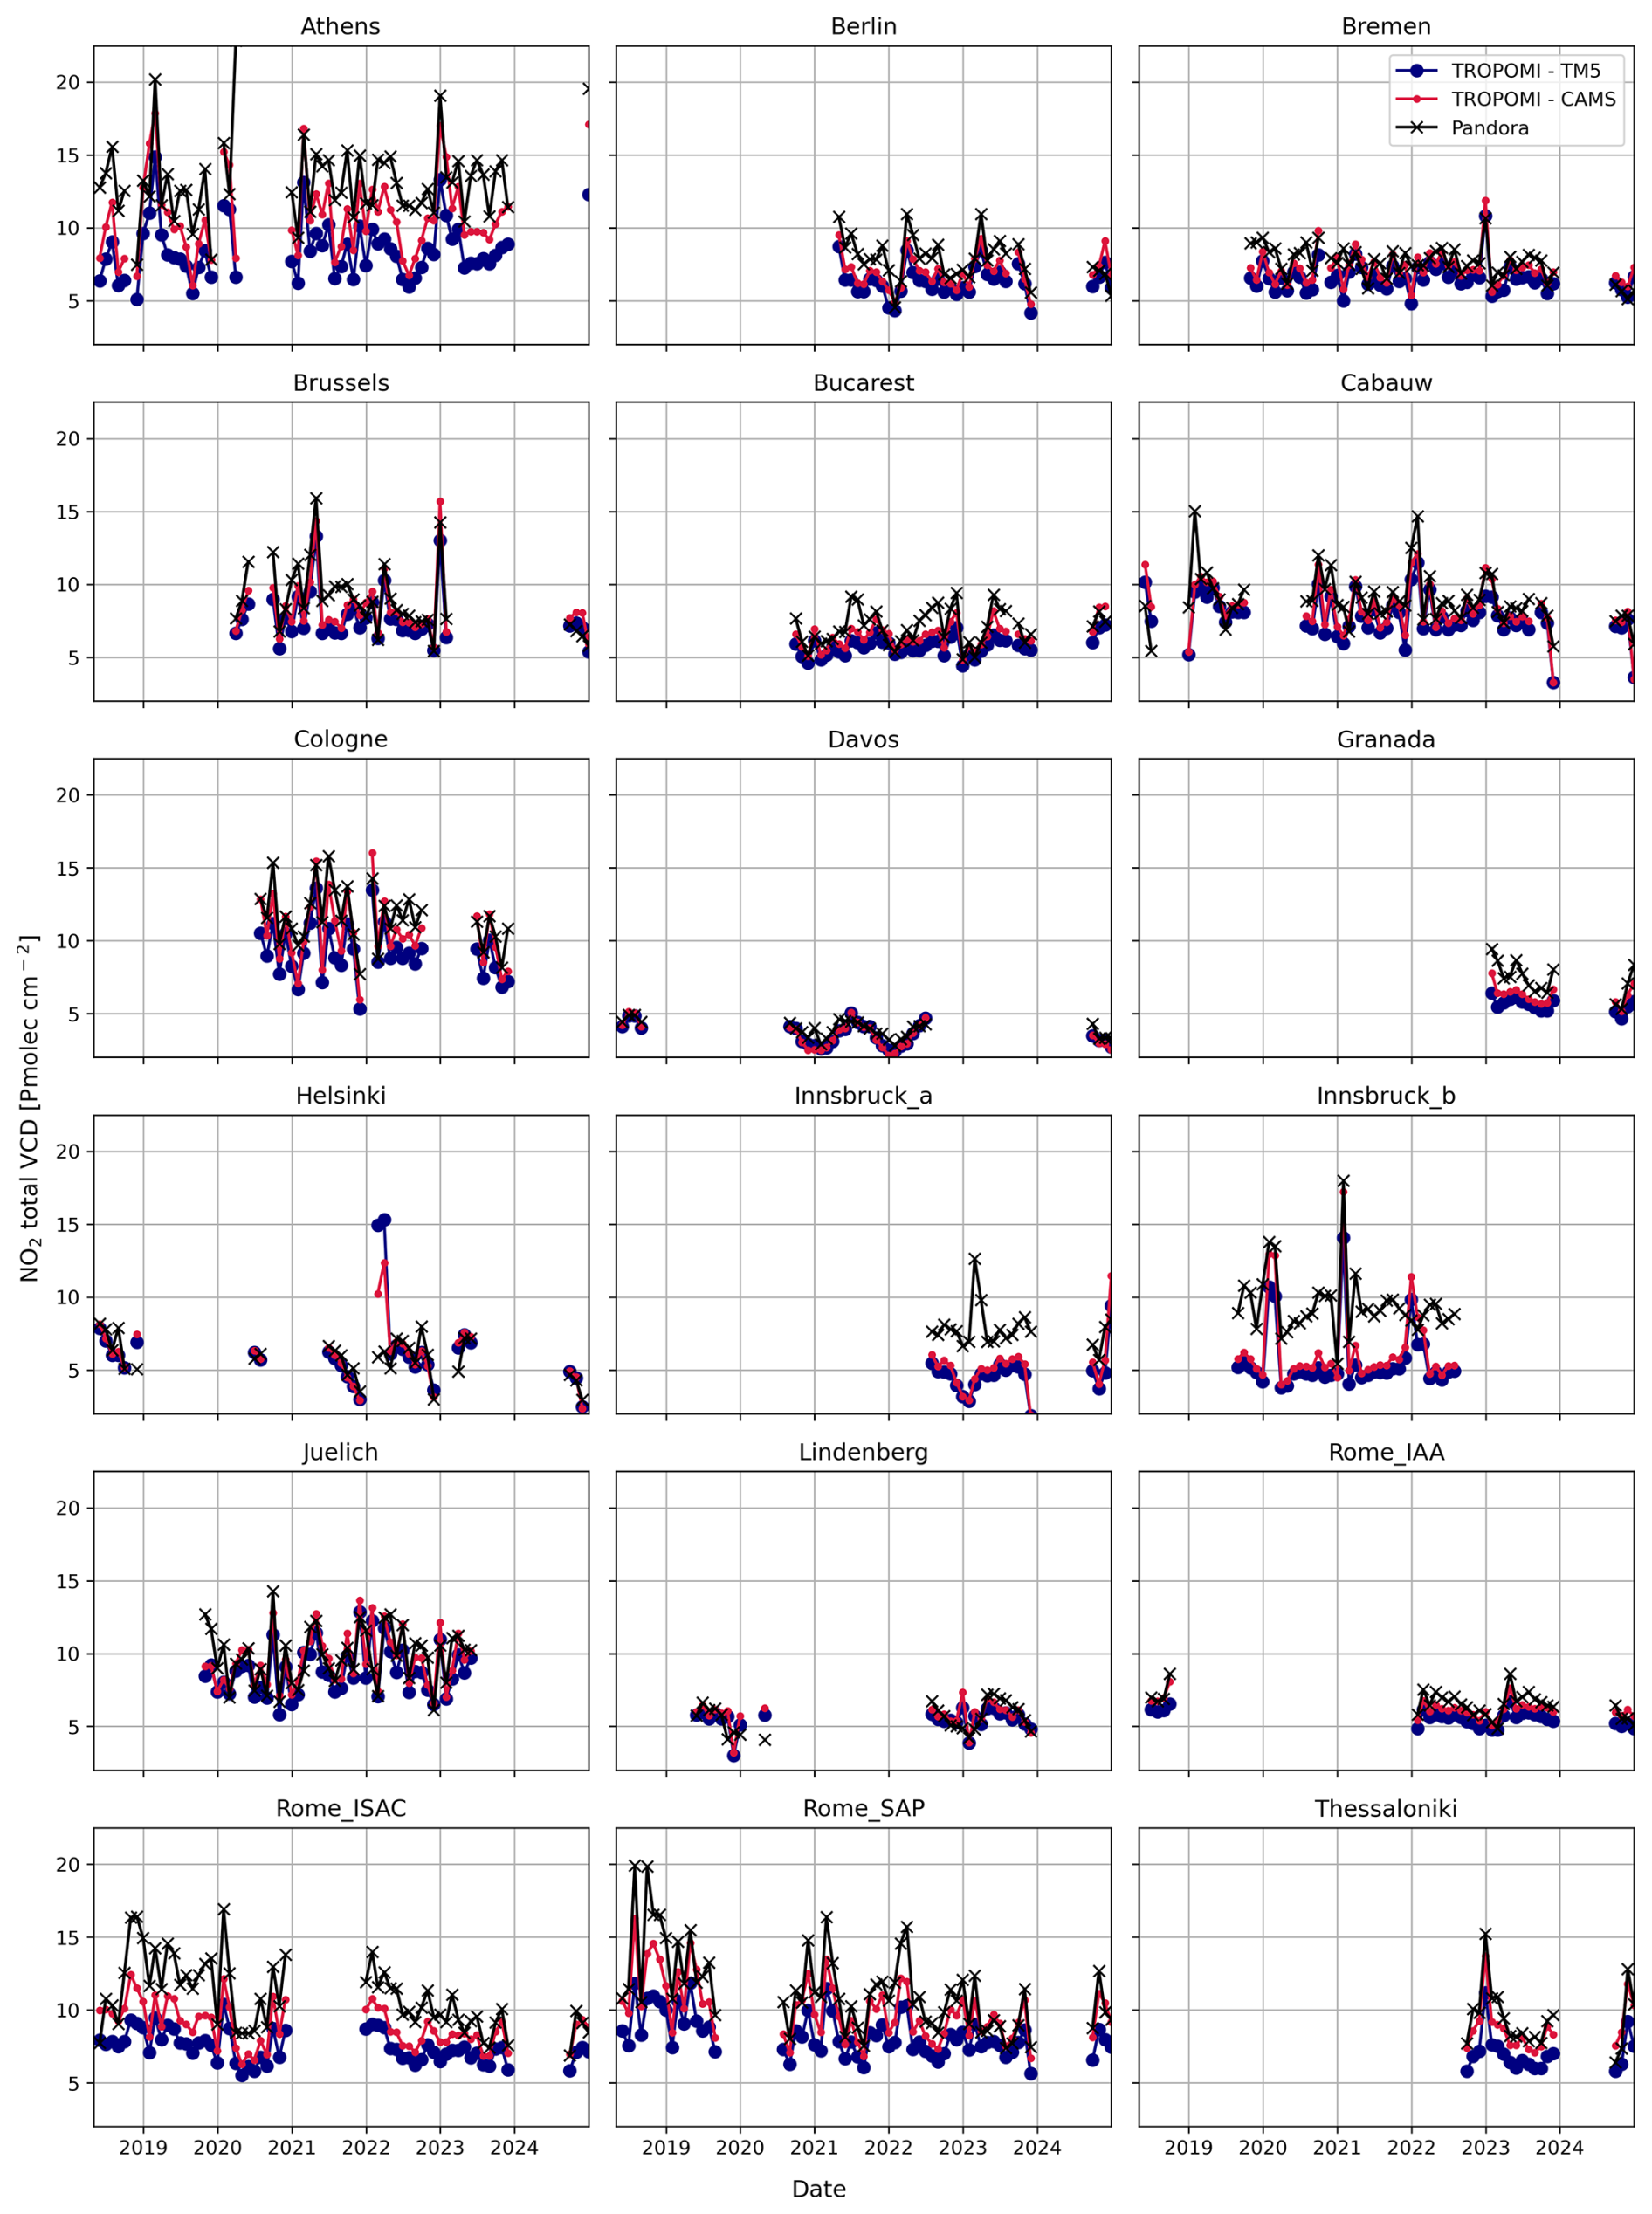
Figure B1Monthly mean time series of collocated Pandora DS and TROPOMI total column observations at the stations analyzed in this study.
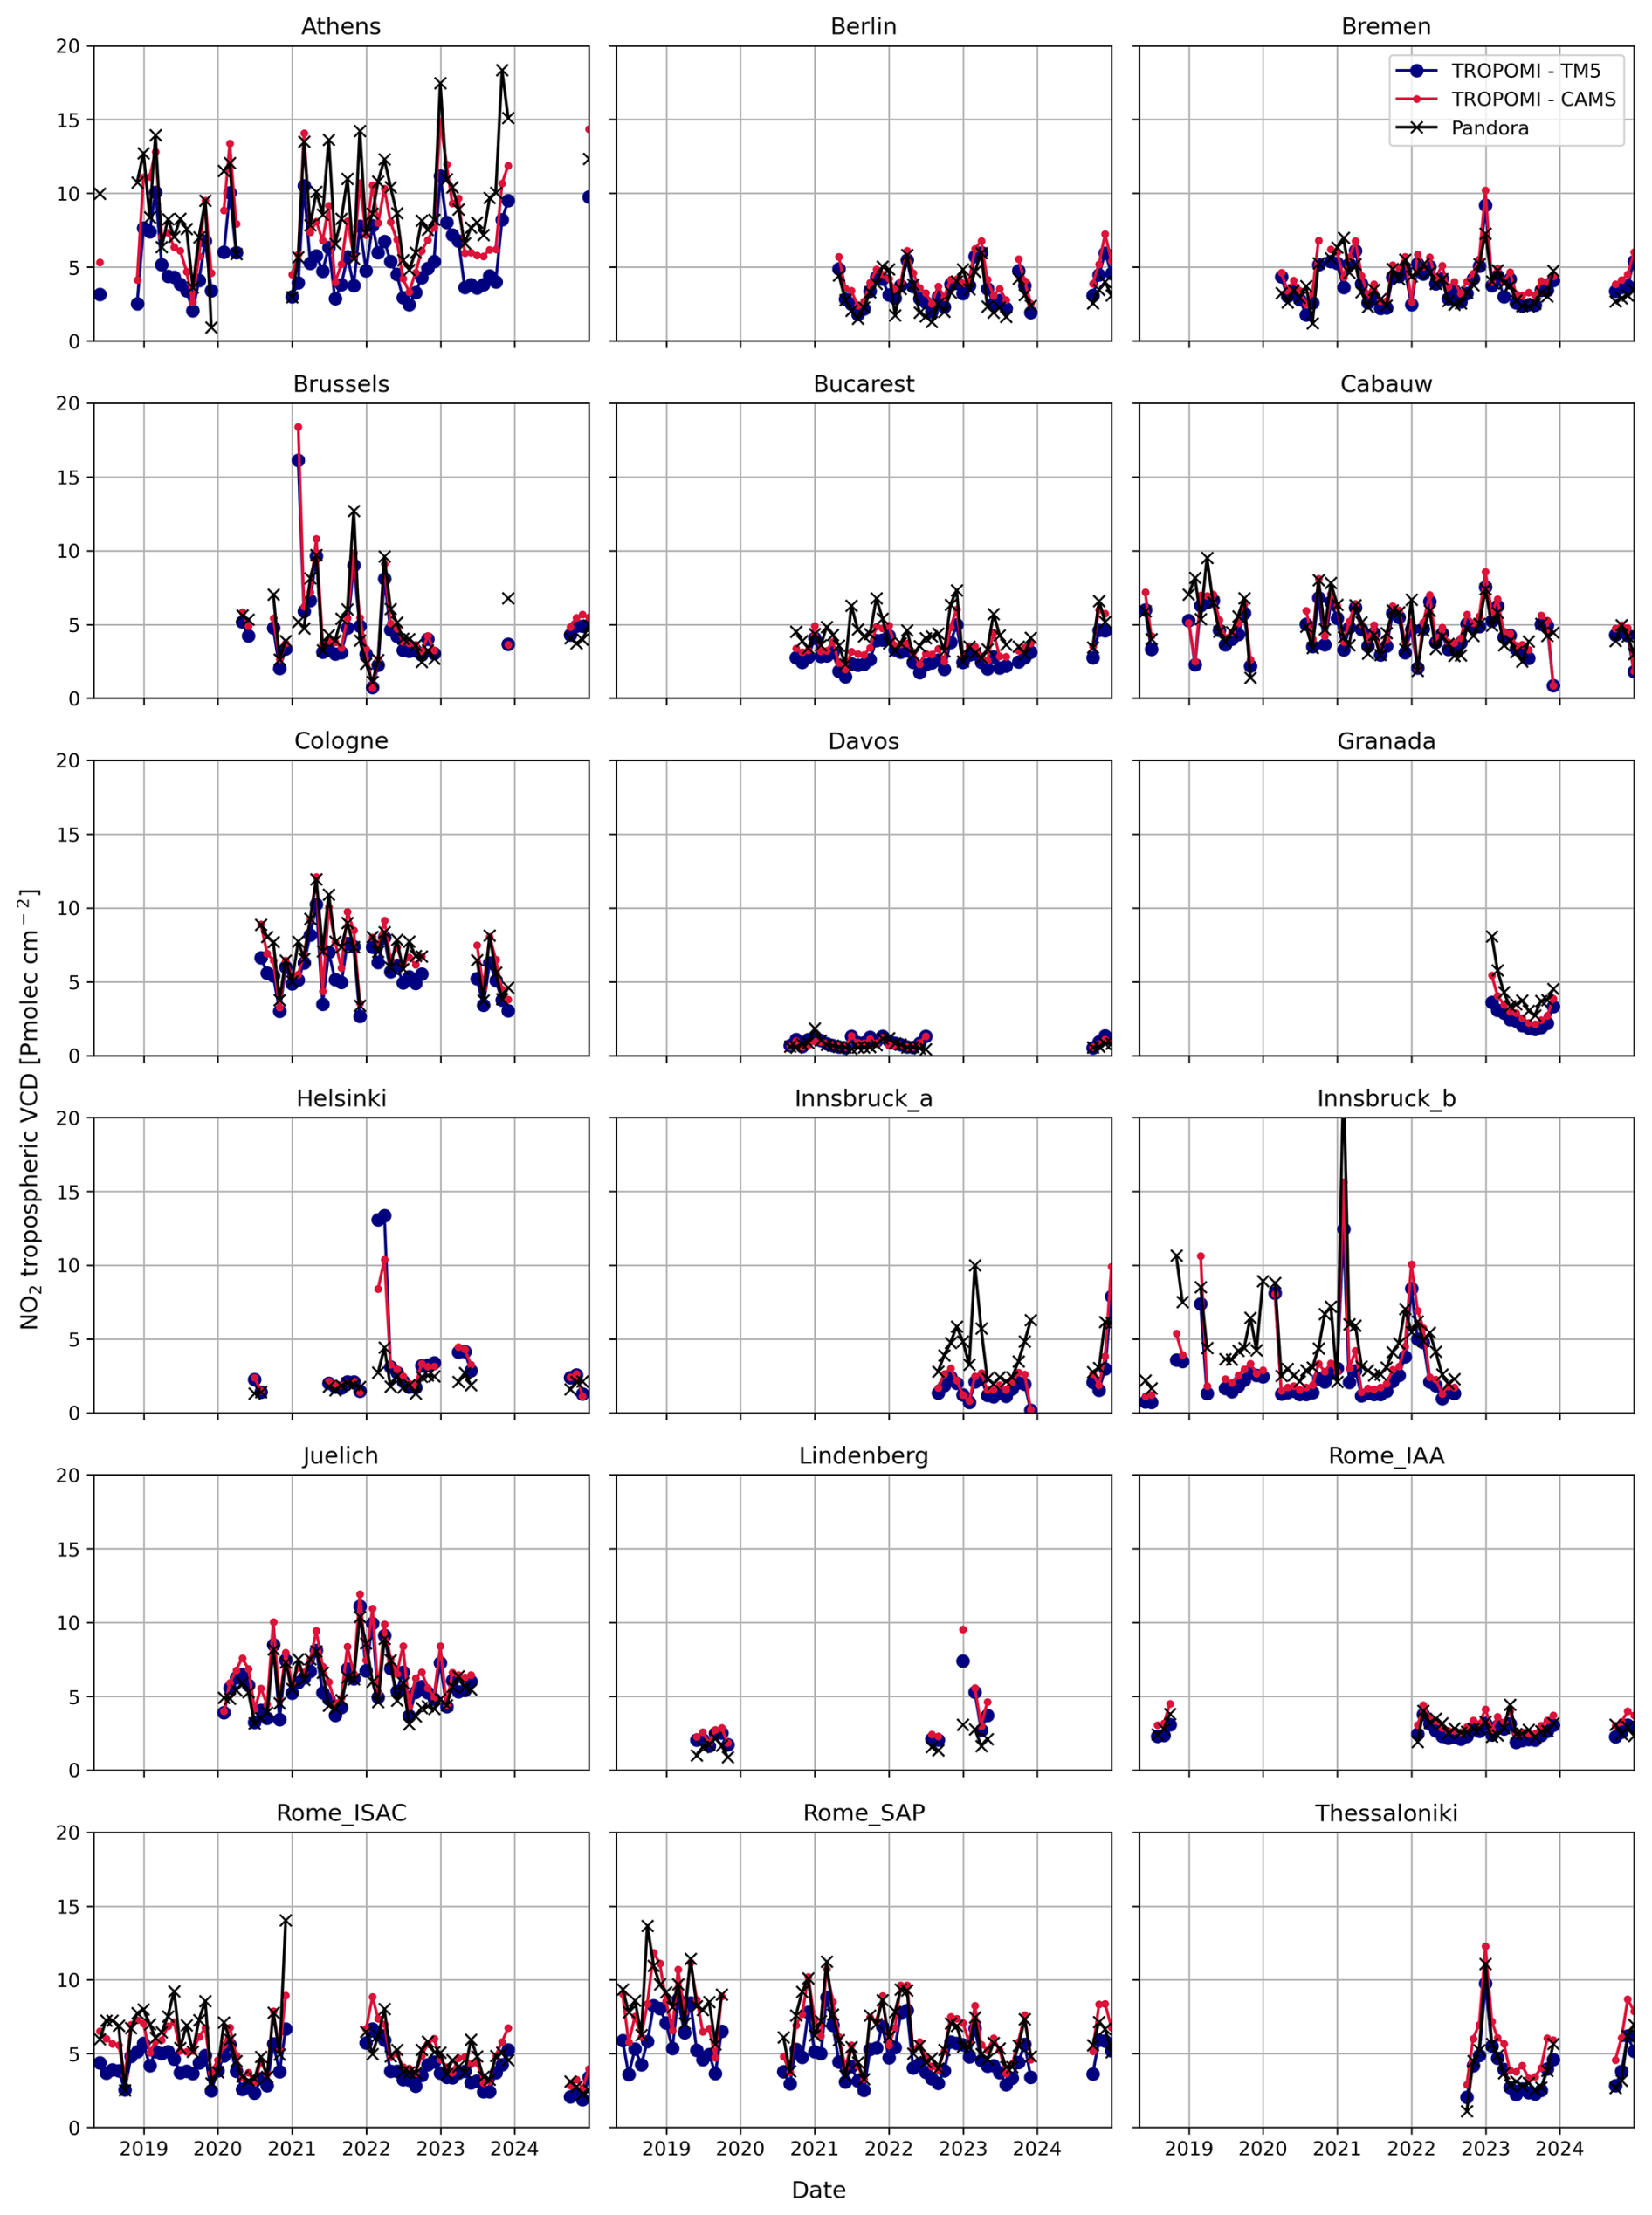
Figure B2Monthly mean time series of collocated Pandora sky-scan and TROPOMI tropospheric column observations at the stations analyzed in this study.
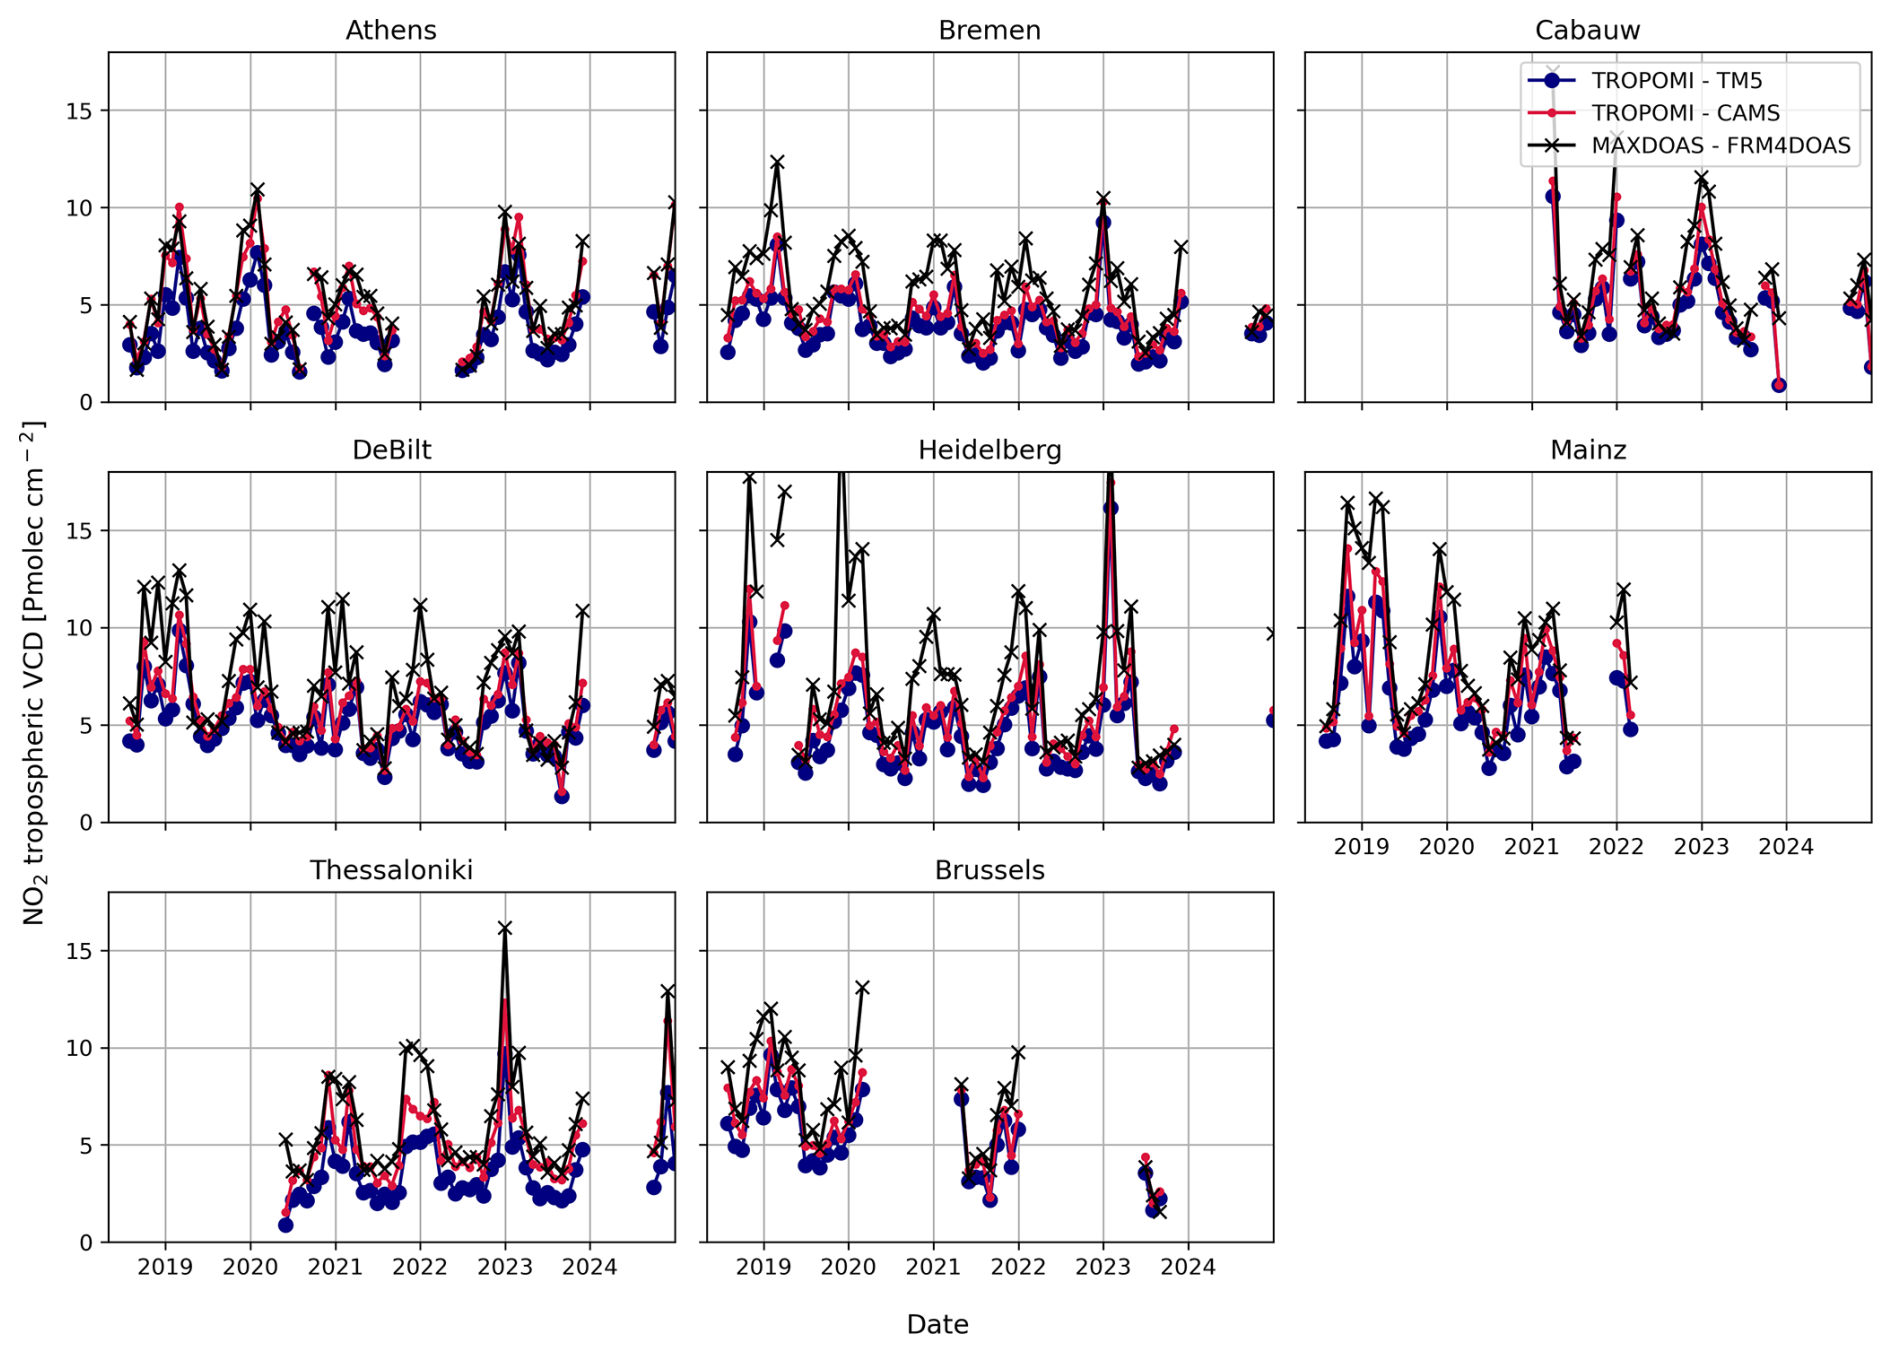
Figure B3Monthly mean time series of collocated MAX-DOAS FRM4DOAS and TROPOMI tropospheric column observations at the stations analyzed in this study.
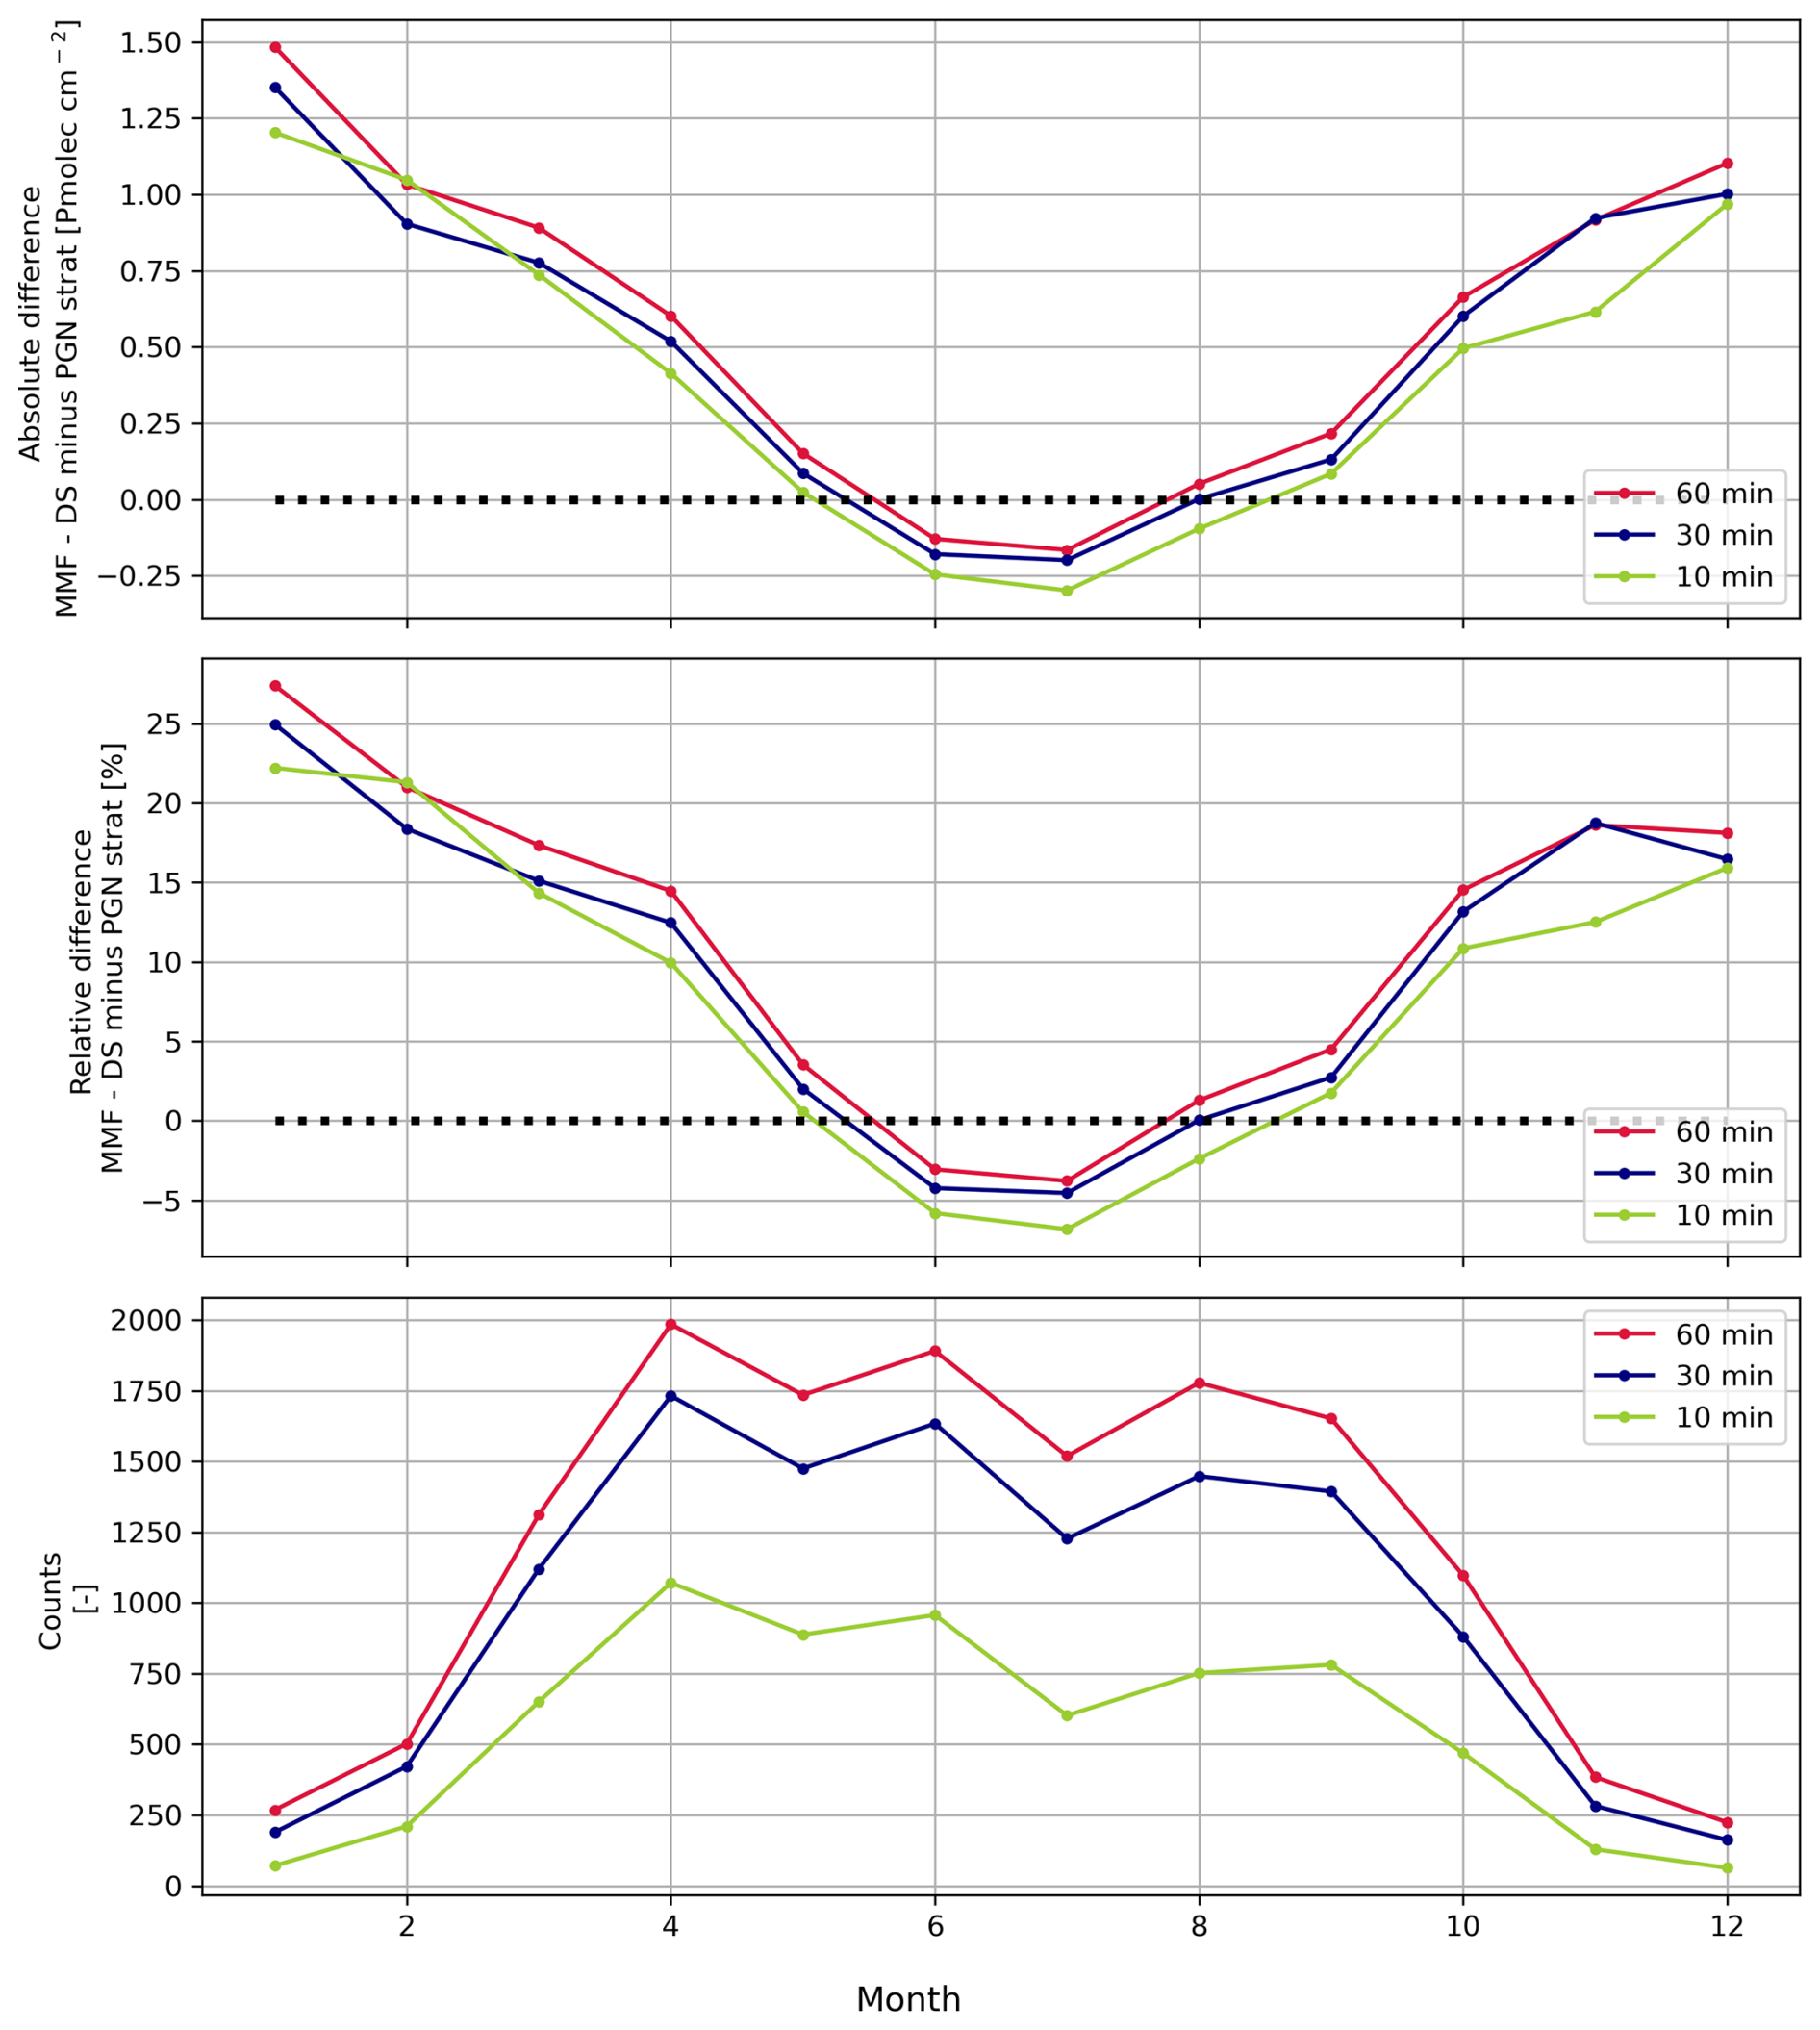
Figure B4Differences between MAX-DOAS FRM4DOAS NO2 tropospheric columns and Pandora direct-sun observations (with the PGN stratospheric component subtracted) as a function of the time window used for temporal alignment at the Bremen station for the period 2018–2024.
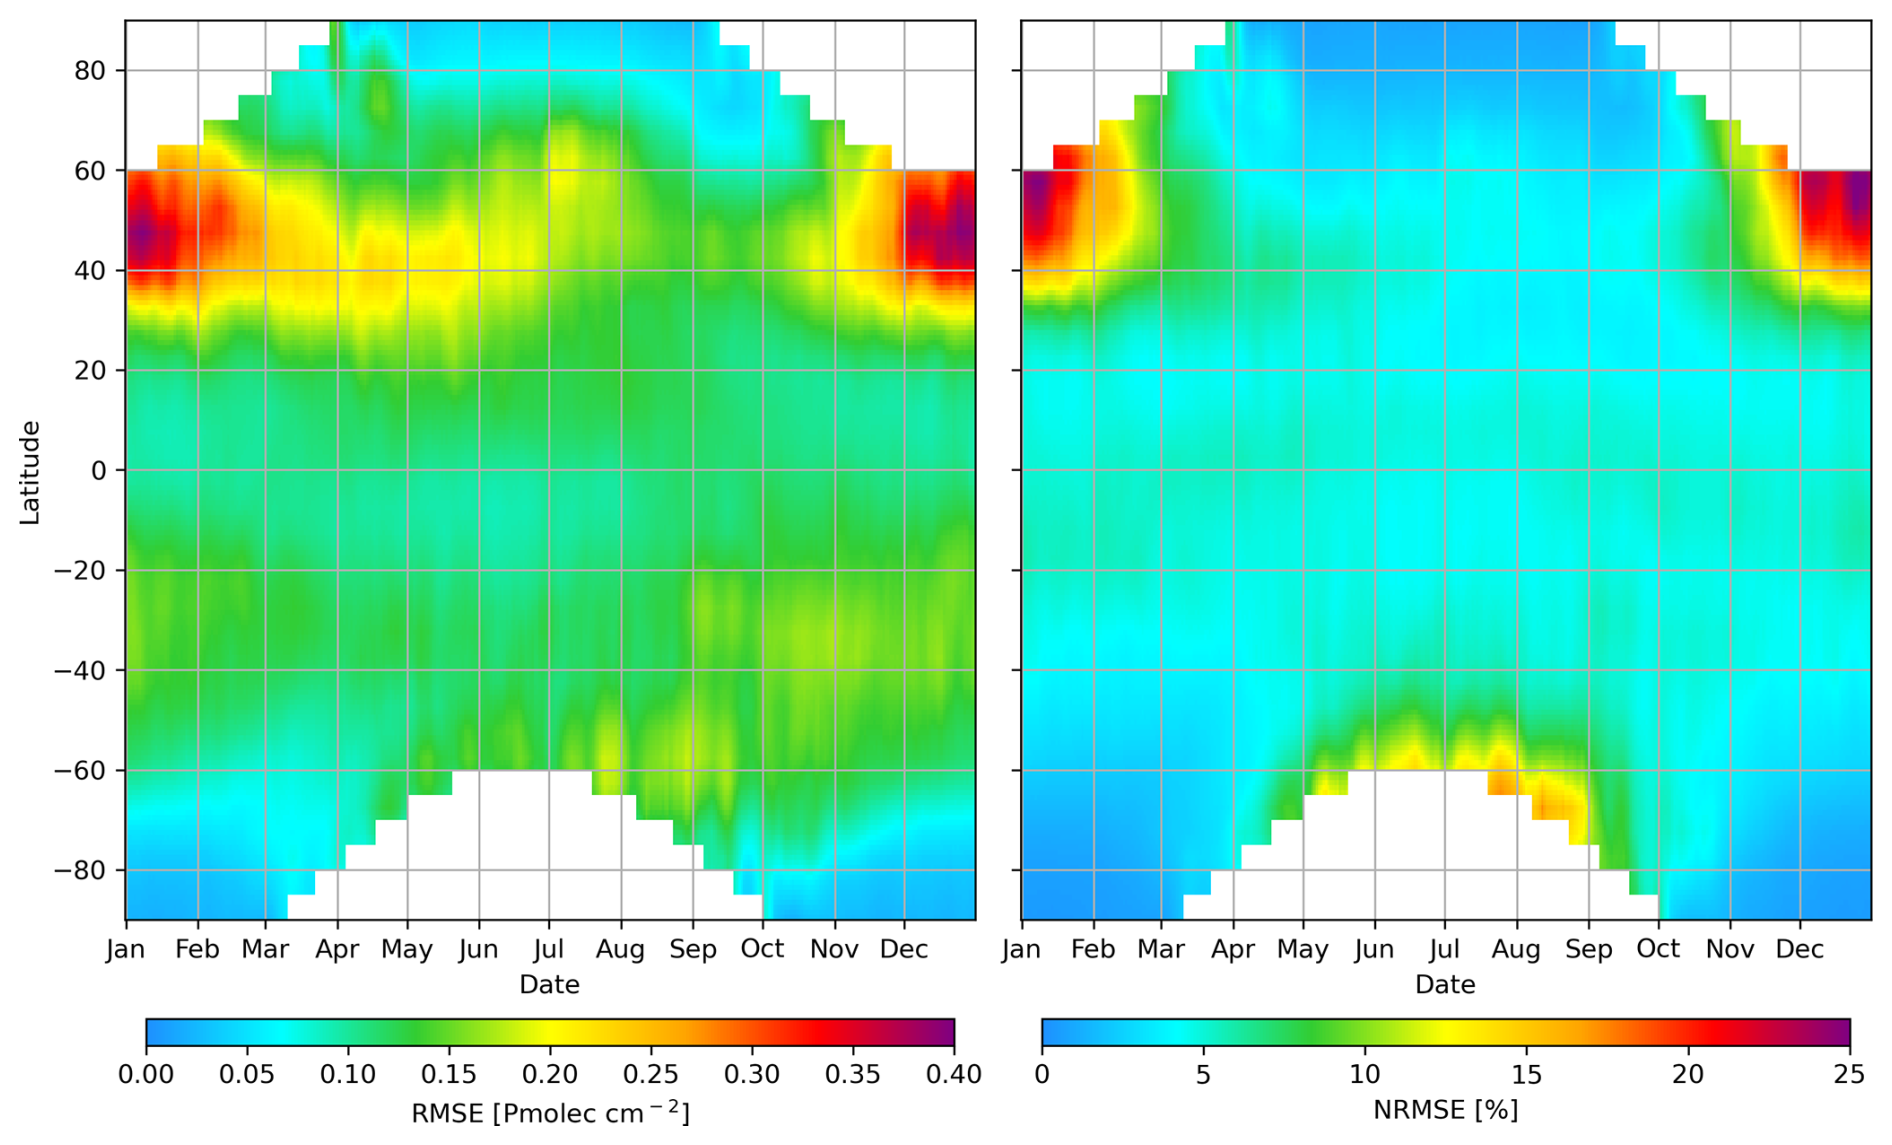
Figure B5Zonal average of the root-mean-square error (RMSE, left) and Normalized RMSE (NRMSE, right) in the TROPOMI total column observation minus forecast over multiple years (2019–2021).
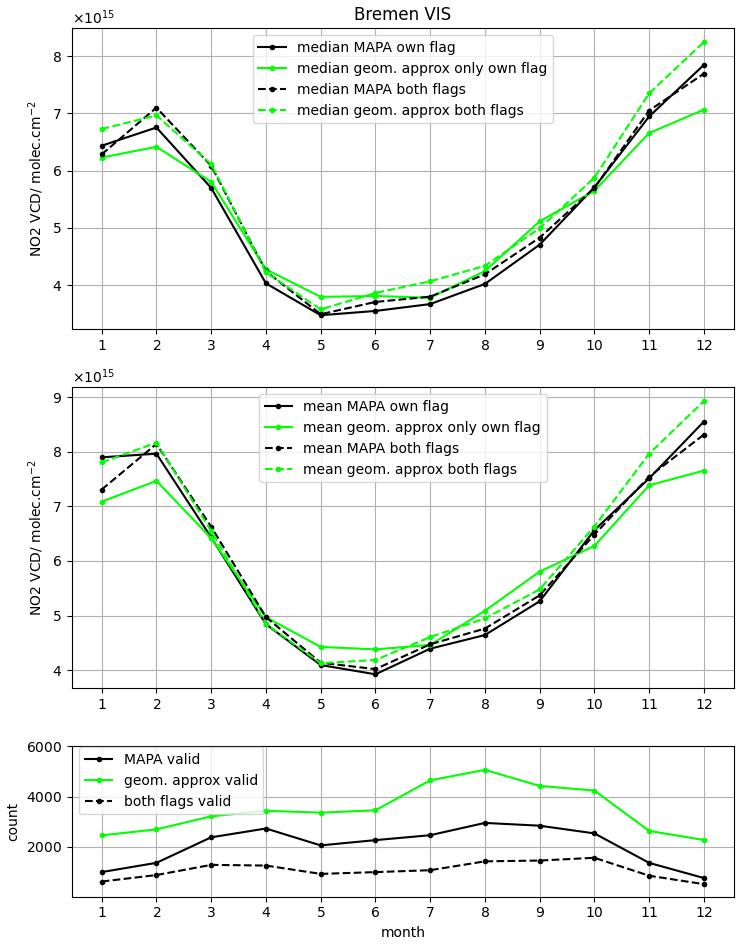
Figure B6Monthly MAX-DOAS NO2 vertical column densities retrieved using either a geometrical approximation or MAPA, under different flagging criteria. The geometrical approximation own flagging refers to retaining only measurements for which twice the absolute difference between the VCD at 30 and 15°, normalized by their sum, is less than 15 %. The top panel shows comparisons based on monthly data aggregated by the median, the middle panel shows aggregation using the mean, and the bottom panel presents the number of collocated observations for each applied flagging scheme.
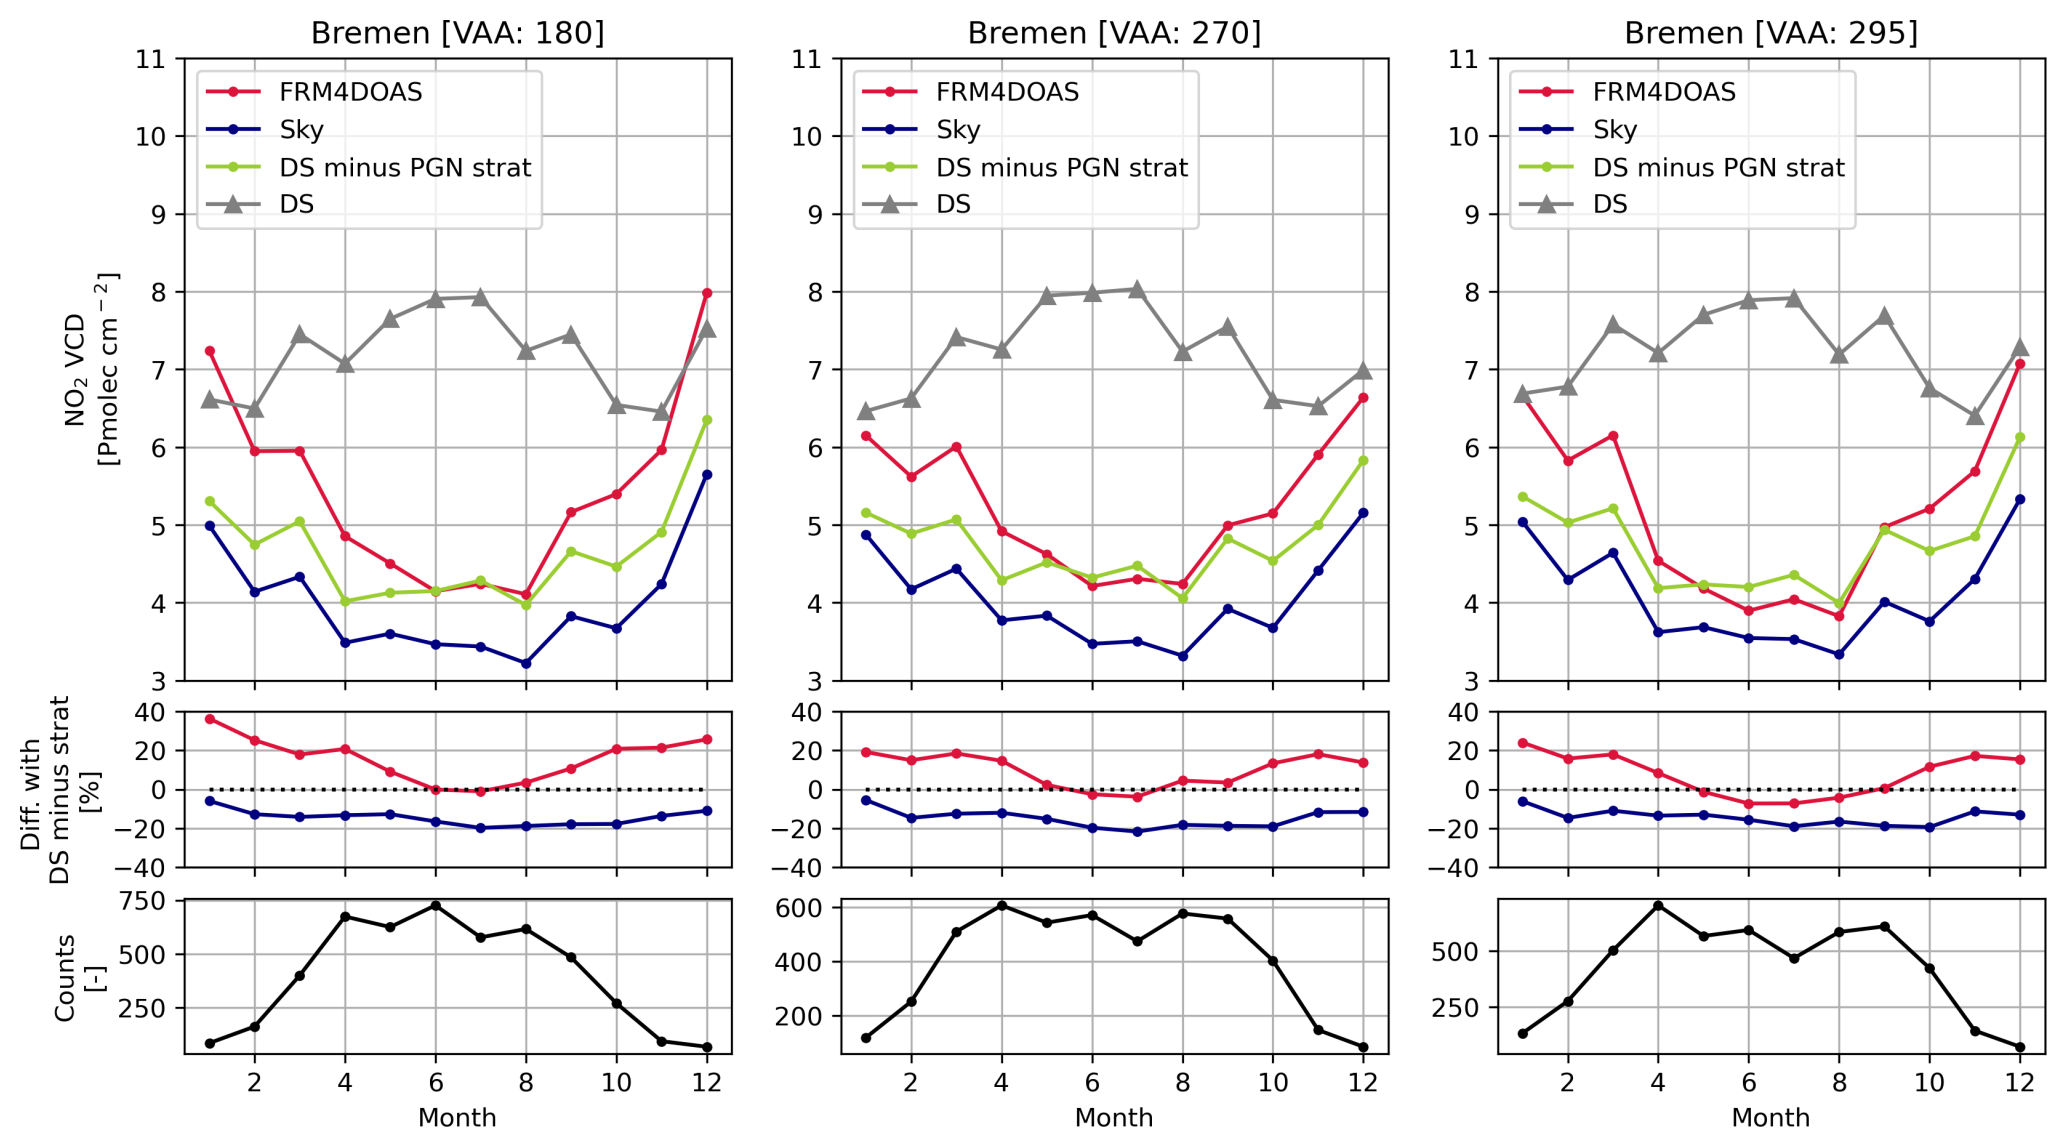
Figure B7Monthly mean comparison of tropospheric and total NO2 ground-based observations at Bremen, discriminated by viewing azimuth angle (VAA). The upper panels show MAX-DOAS FRM4DOAS tropospheric columns (FRM4DOAS, red), Pandora sky-scan tropospheric columns (Sky, blue), Pandora direct-sun tropospheric columns obtained by subtracting the stratospheric component from the Pandora climatology (DS minus PGN strat, green), and Pandora direct-sun total columns (DS, gray). The middle panels show the relative differences between Pandora direct-sun tropospheric columns (DS minus PGN strat) and MAX-DOAS FRM4DOAS (red) and Pandora sky-scan (blue) tropospheric measurements. The lower panels show the number of collocated observations for each analyzed station.
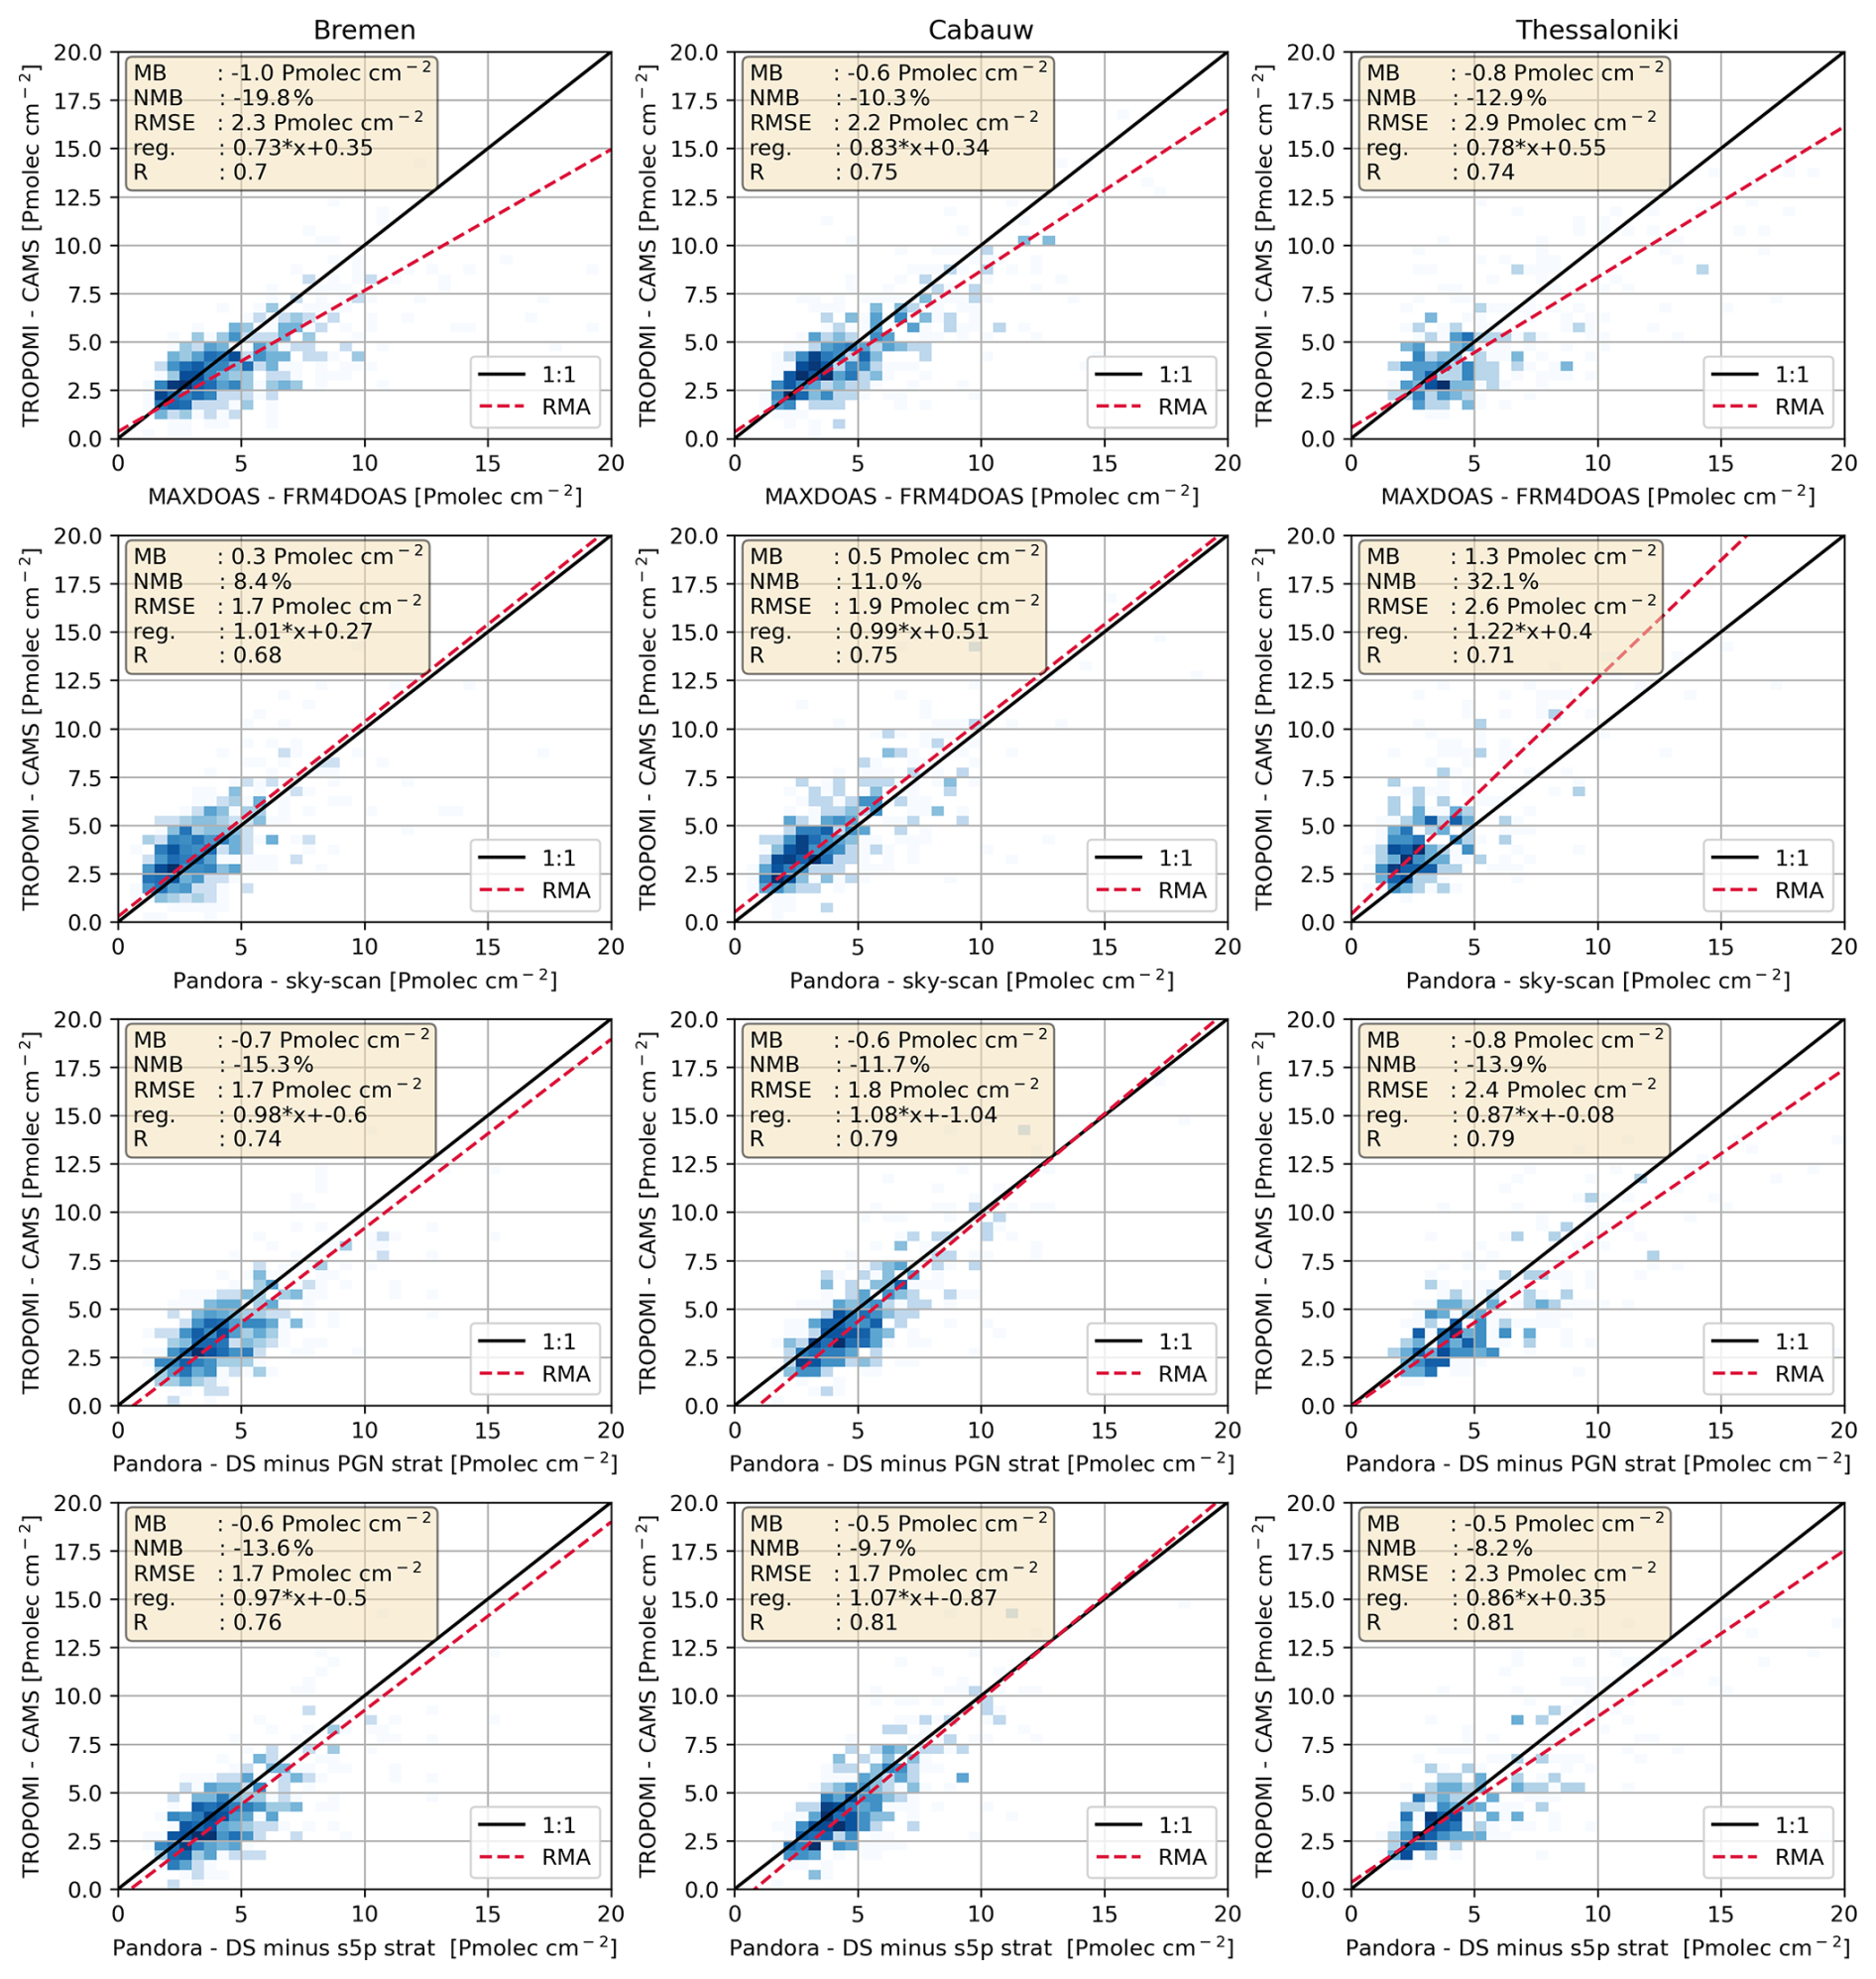
Figure B8Scatter plot intercomparing TROPOMI tropospheric NO2 retrievals using CAMS a-priori profiles and four different ground-based retrieval methods. Ground-based methods are MAX-DOAS FRM4DOAS, Pandora sky-scan, Pandora DS minus PGN L2 stratospheric NO2, and Pandora DS minus TROPOMI S5P L2 stratospheric NO2.
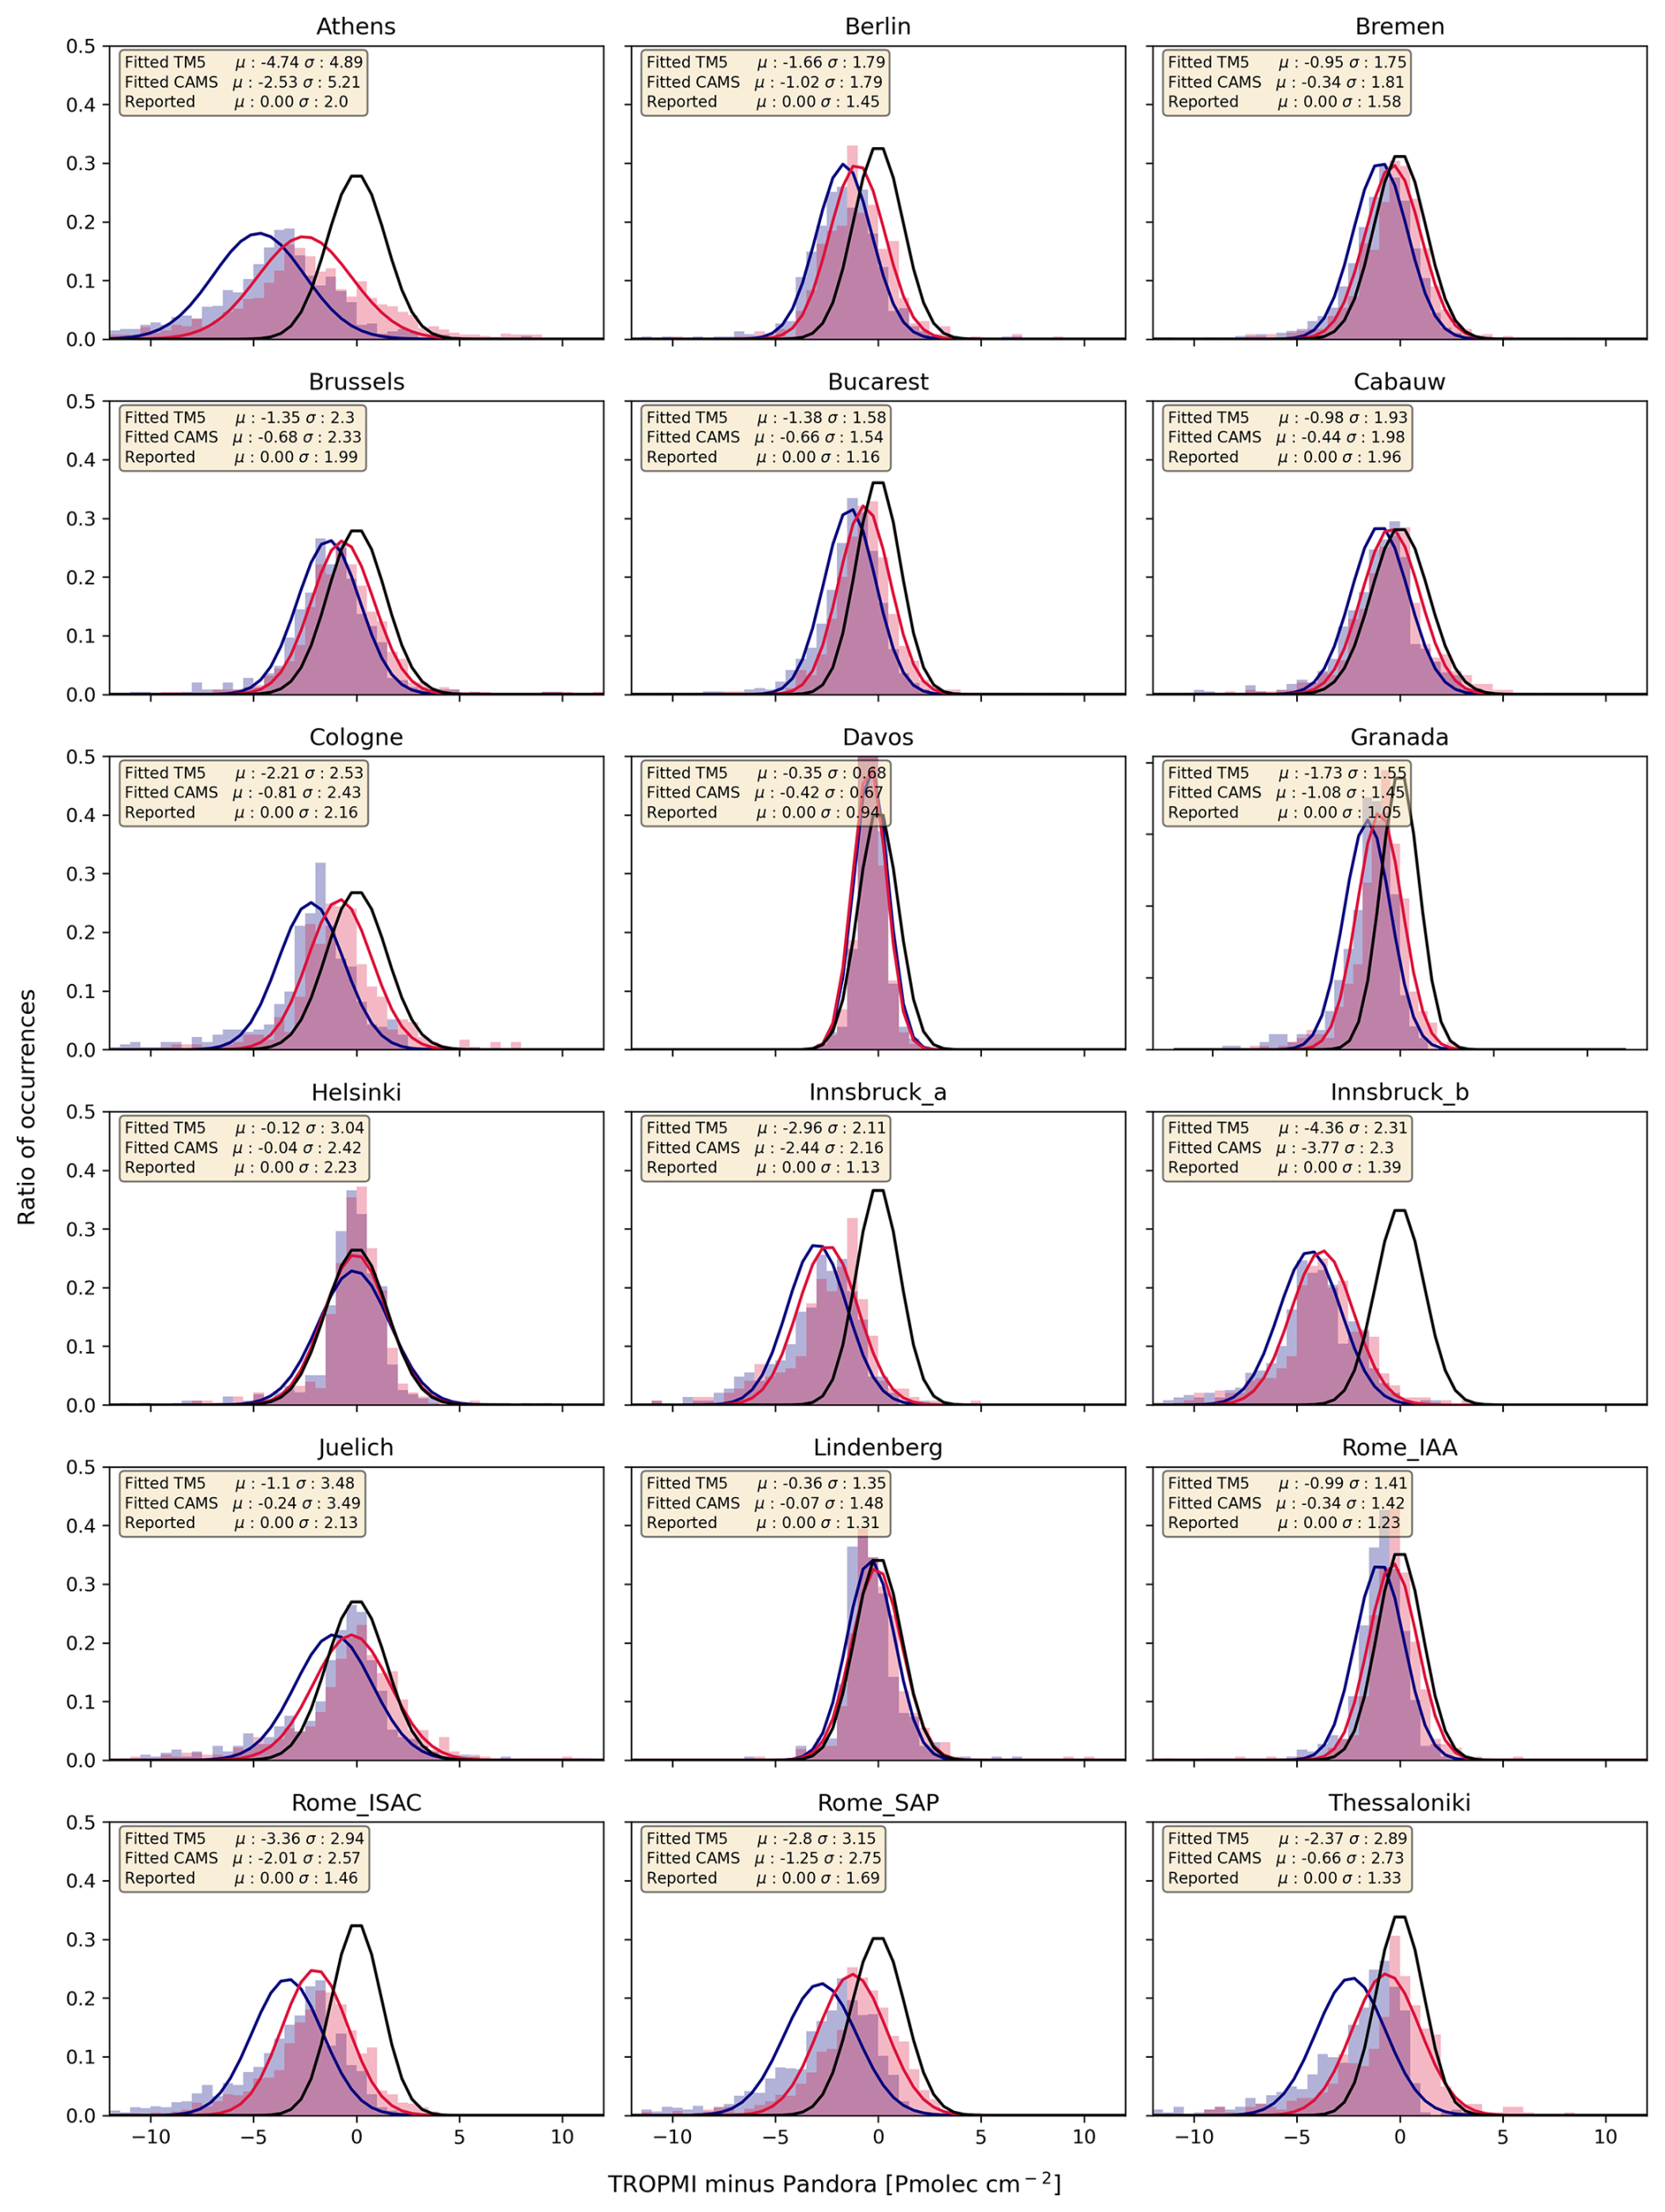
Figure B9Histograms of differences between TROPOMI and Pandora total NO2 column observations. The black line shows the expected difference distribution (from combined uncertainties; Eq. 4), while the blue and red lines show Gaussian-fitted observed differences for TROPOMI using TM5-MP and CAMS a-priori profiles, respectively.
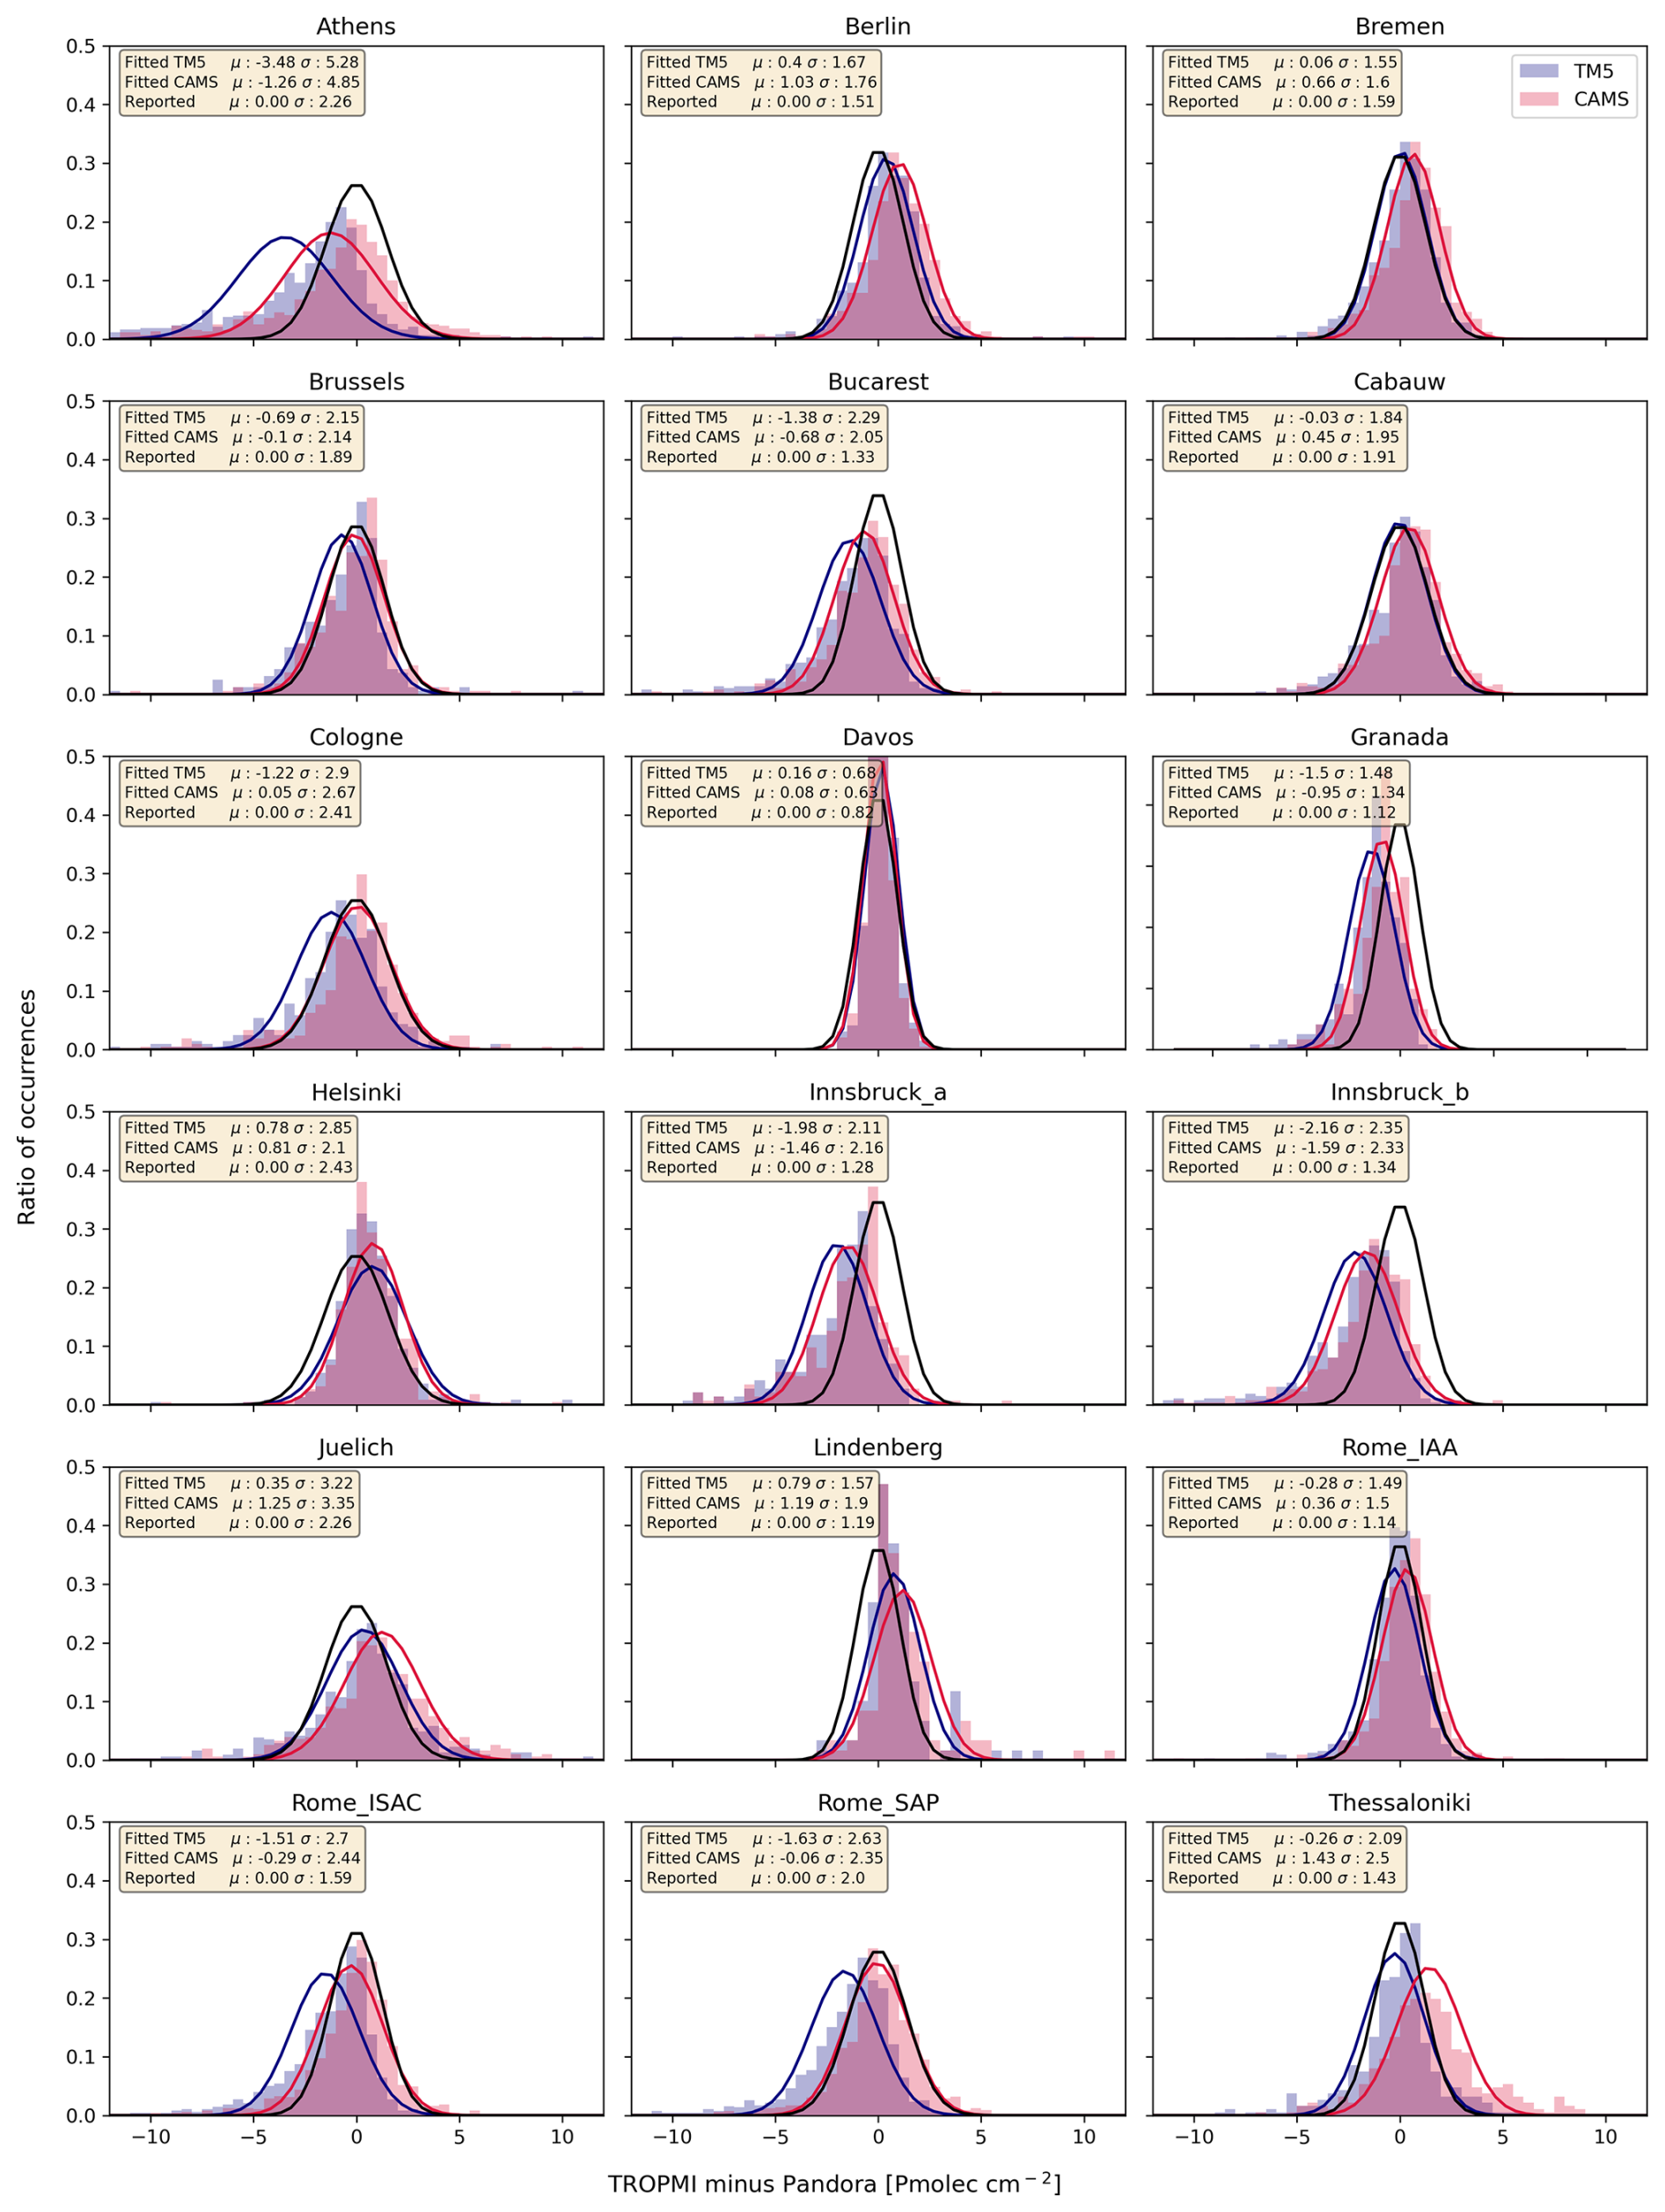
Figure B10Histogram of differences between TROPOMI and Pandora tropospheric NO2 column observations. The black line shows the expected difference distribution (from combined uncertainties; Eq. 4), while the blue and red lines show Gaussian-fitted observed differences for TROPOMI using TM5-MP and CAMS a-priori profiles, respectively.
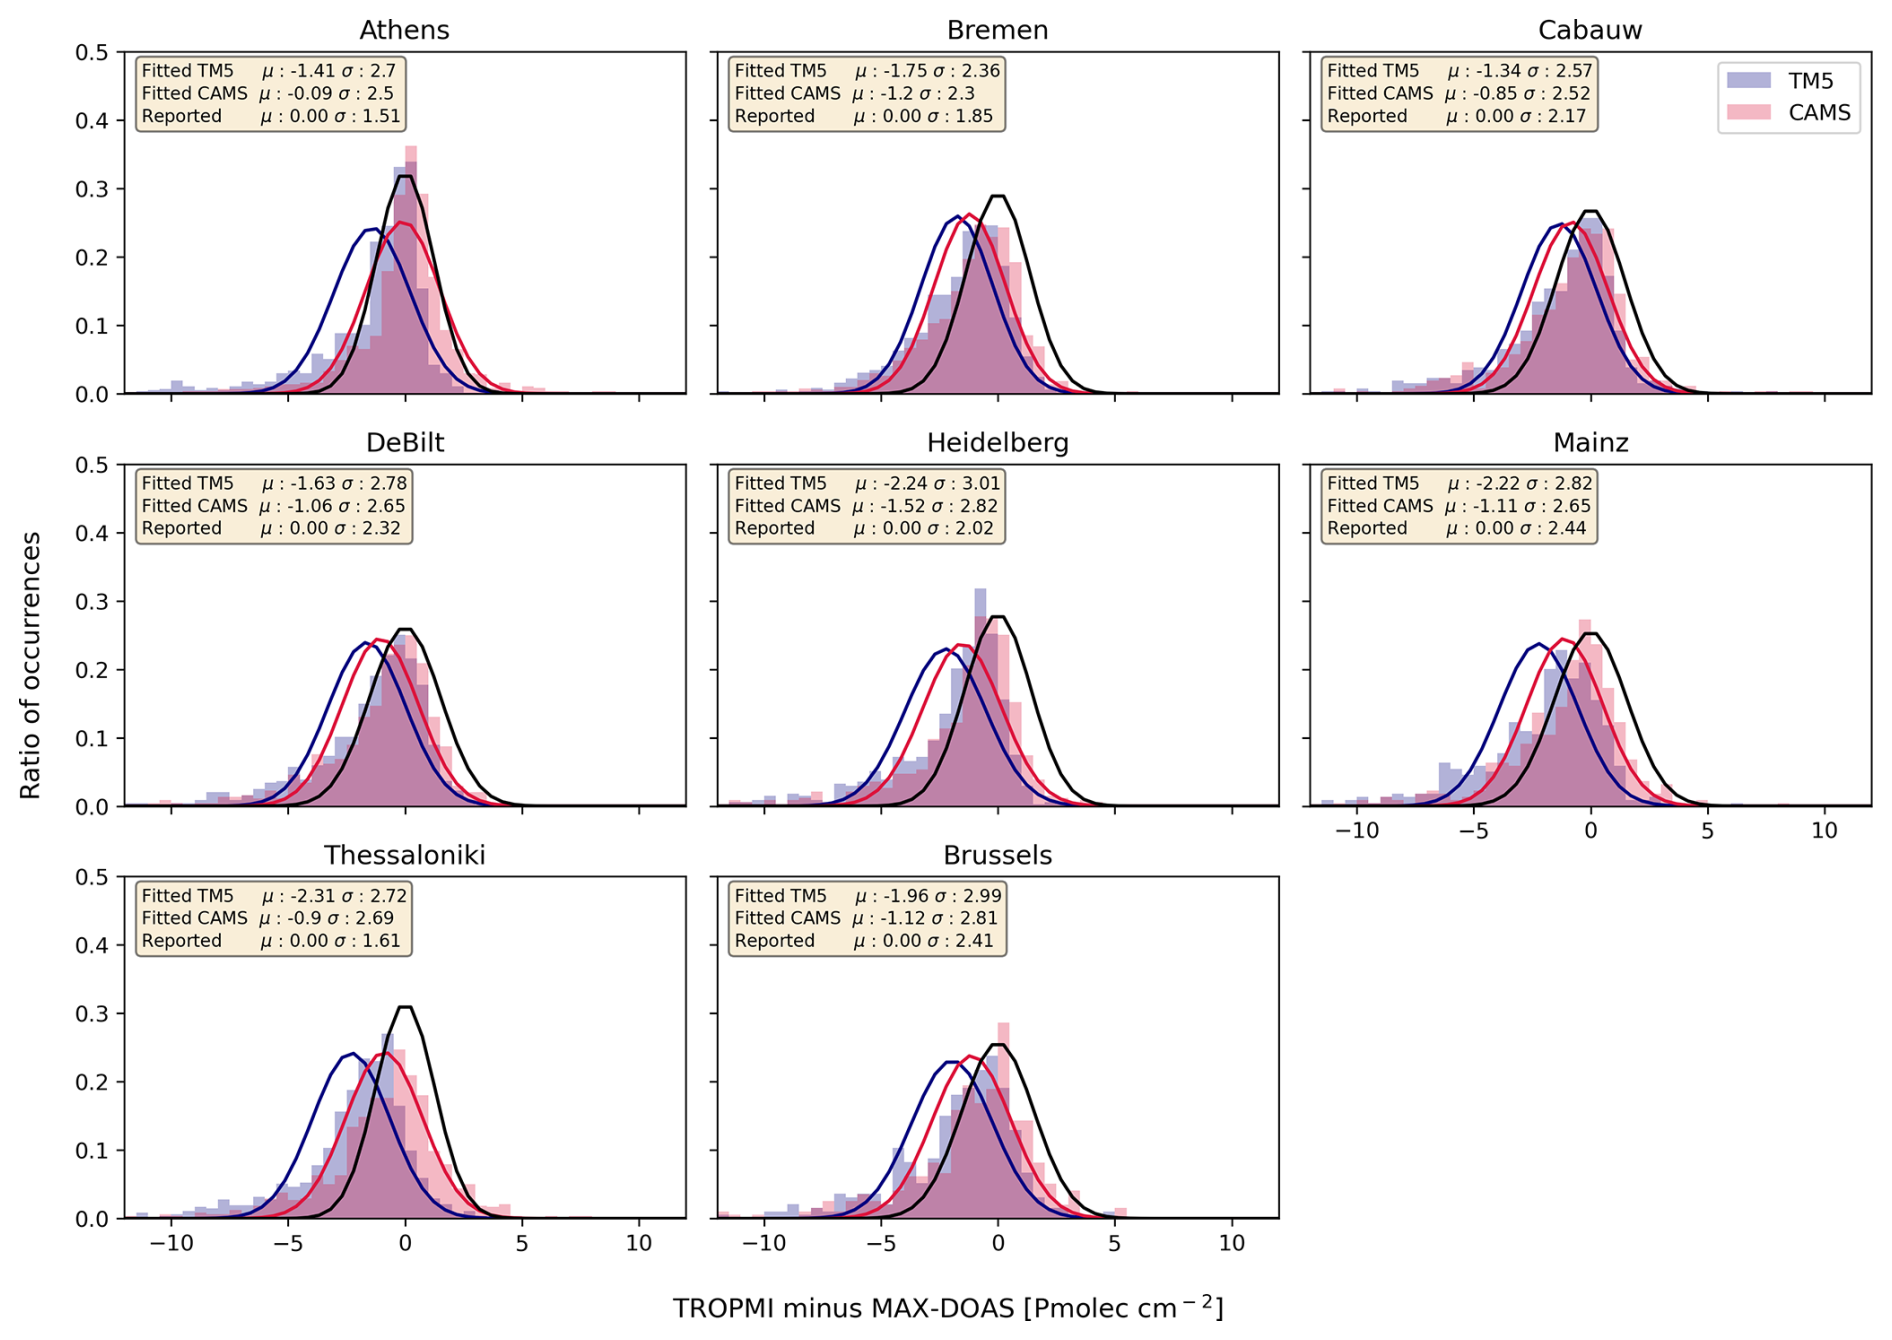
Figure B11Histogram of differences between TROPOMI and MAX-DOAS FRM4DOAS tropospheric NO2 column observations. The black line shows the expected difference distribution (from combined uncertainties; Eq. 4), while the blue and red lines show Gaussian-fitted observed differences for TROPOMI using TM5-MP and CAMS a-priori profiles, respectively.
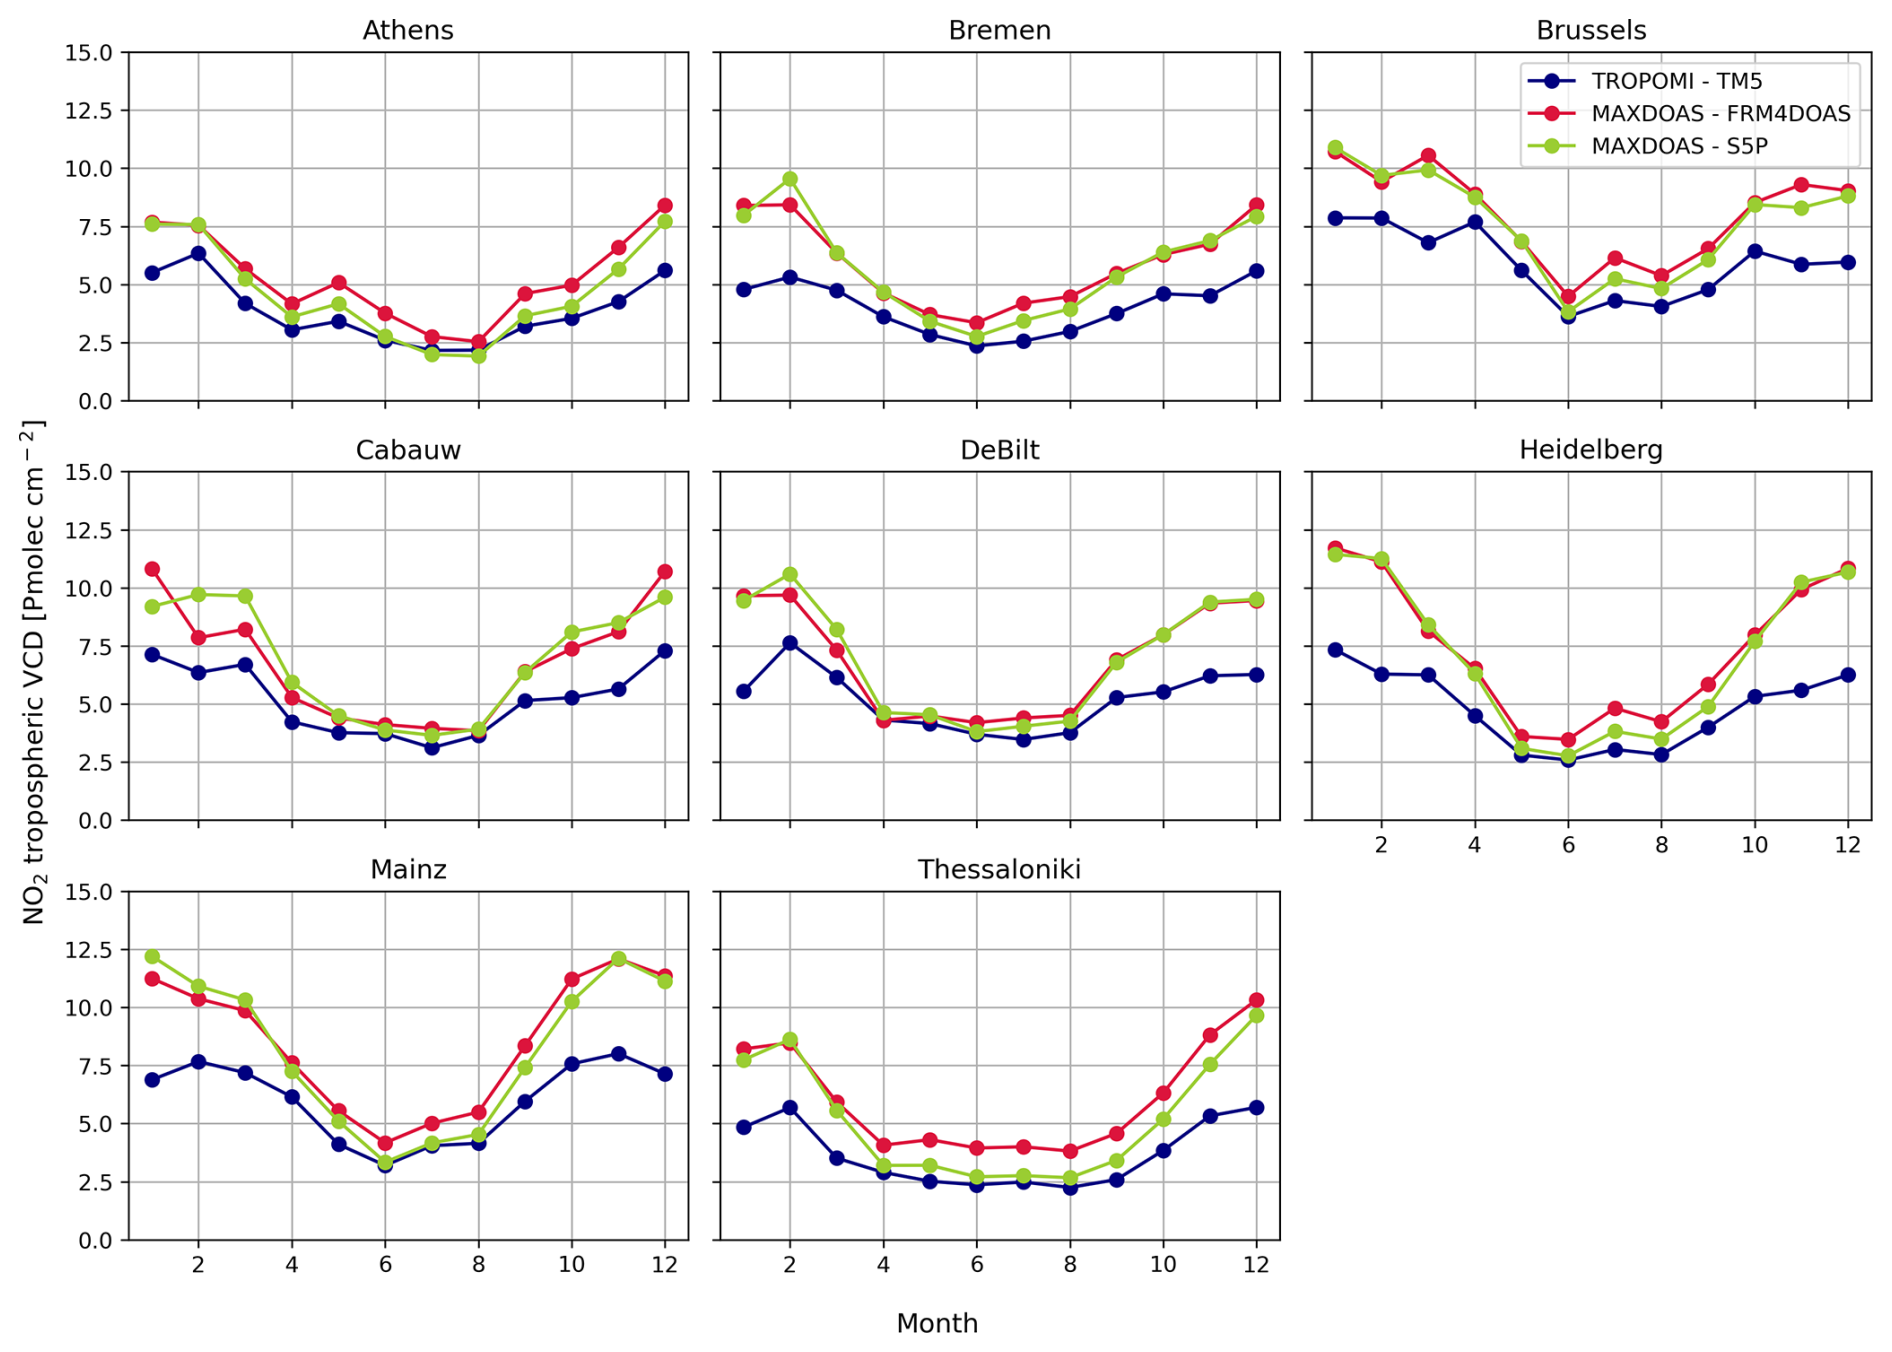
Figure B12Monthly mean NO2 column comparison: default MAX-DOAS FRM4DOAS retrieval (red) and MAX-DOAS retrieval smoothed with TROPOMI AKs (green), versus TROPOMI retrievals using the TM5-MP a-priori (blue).
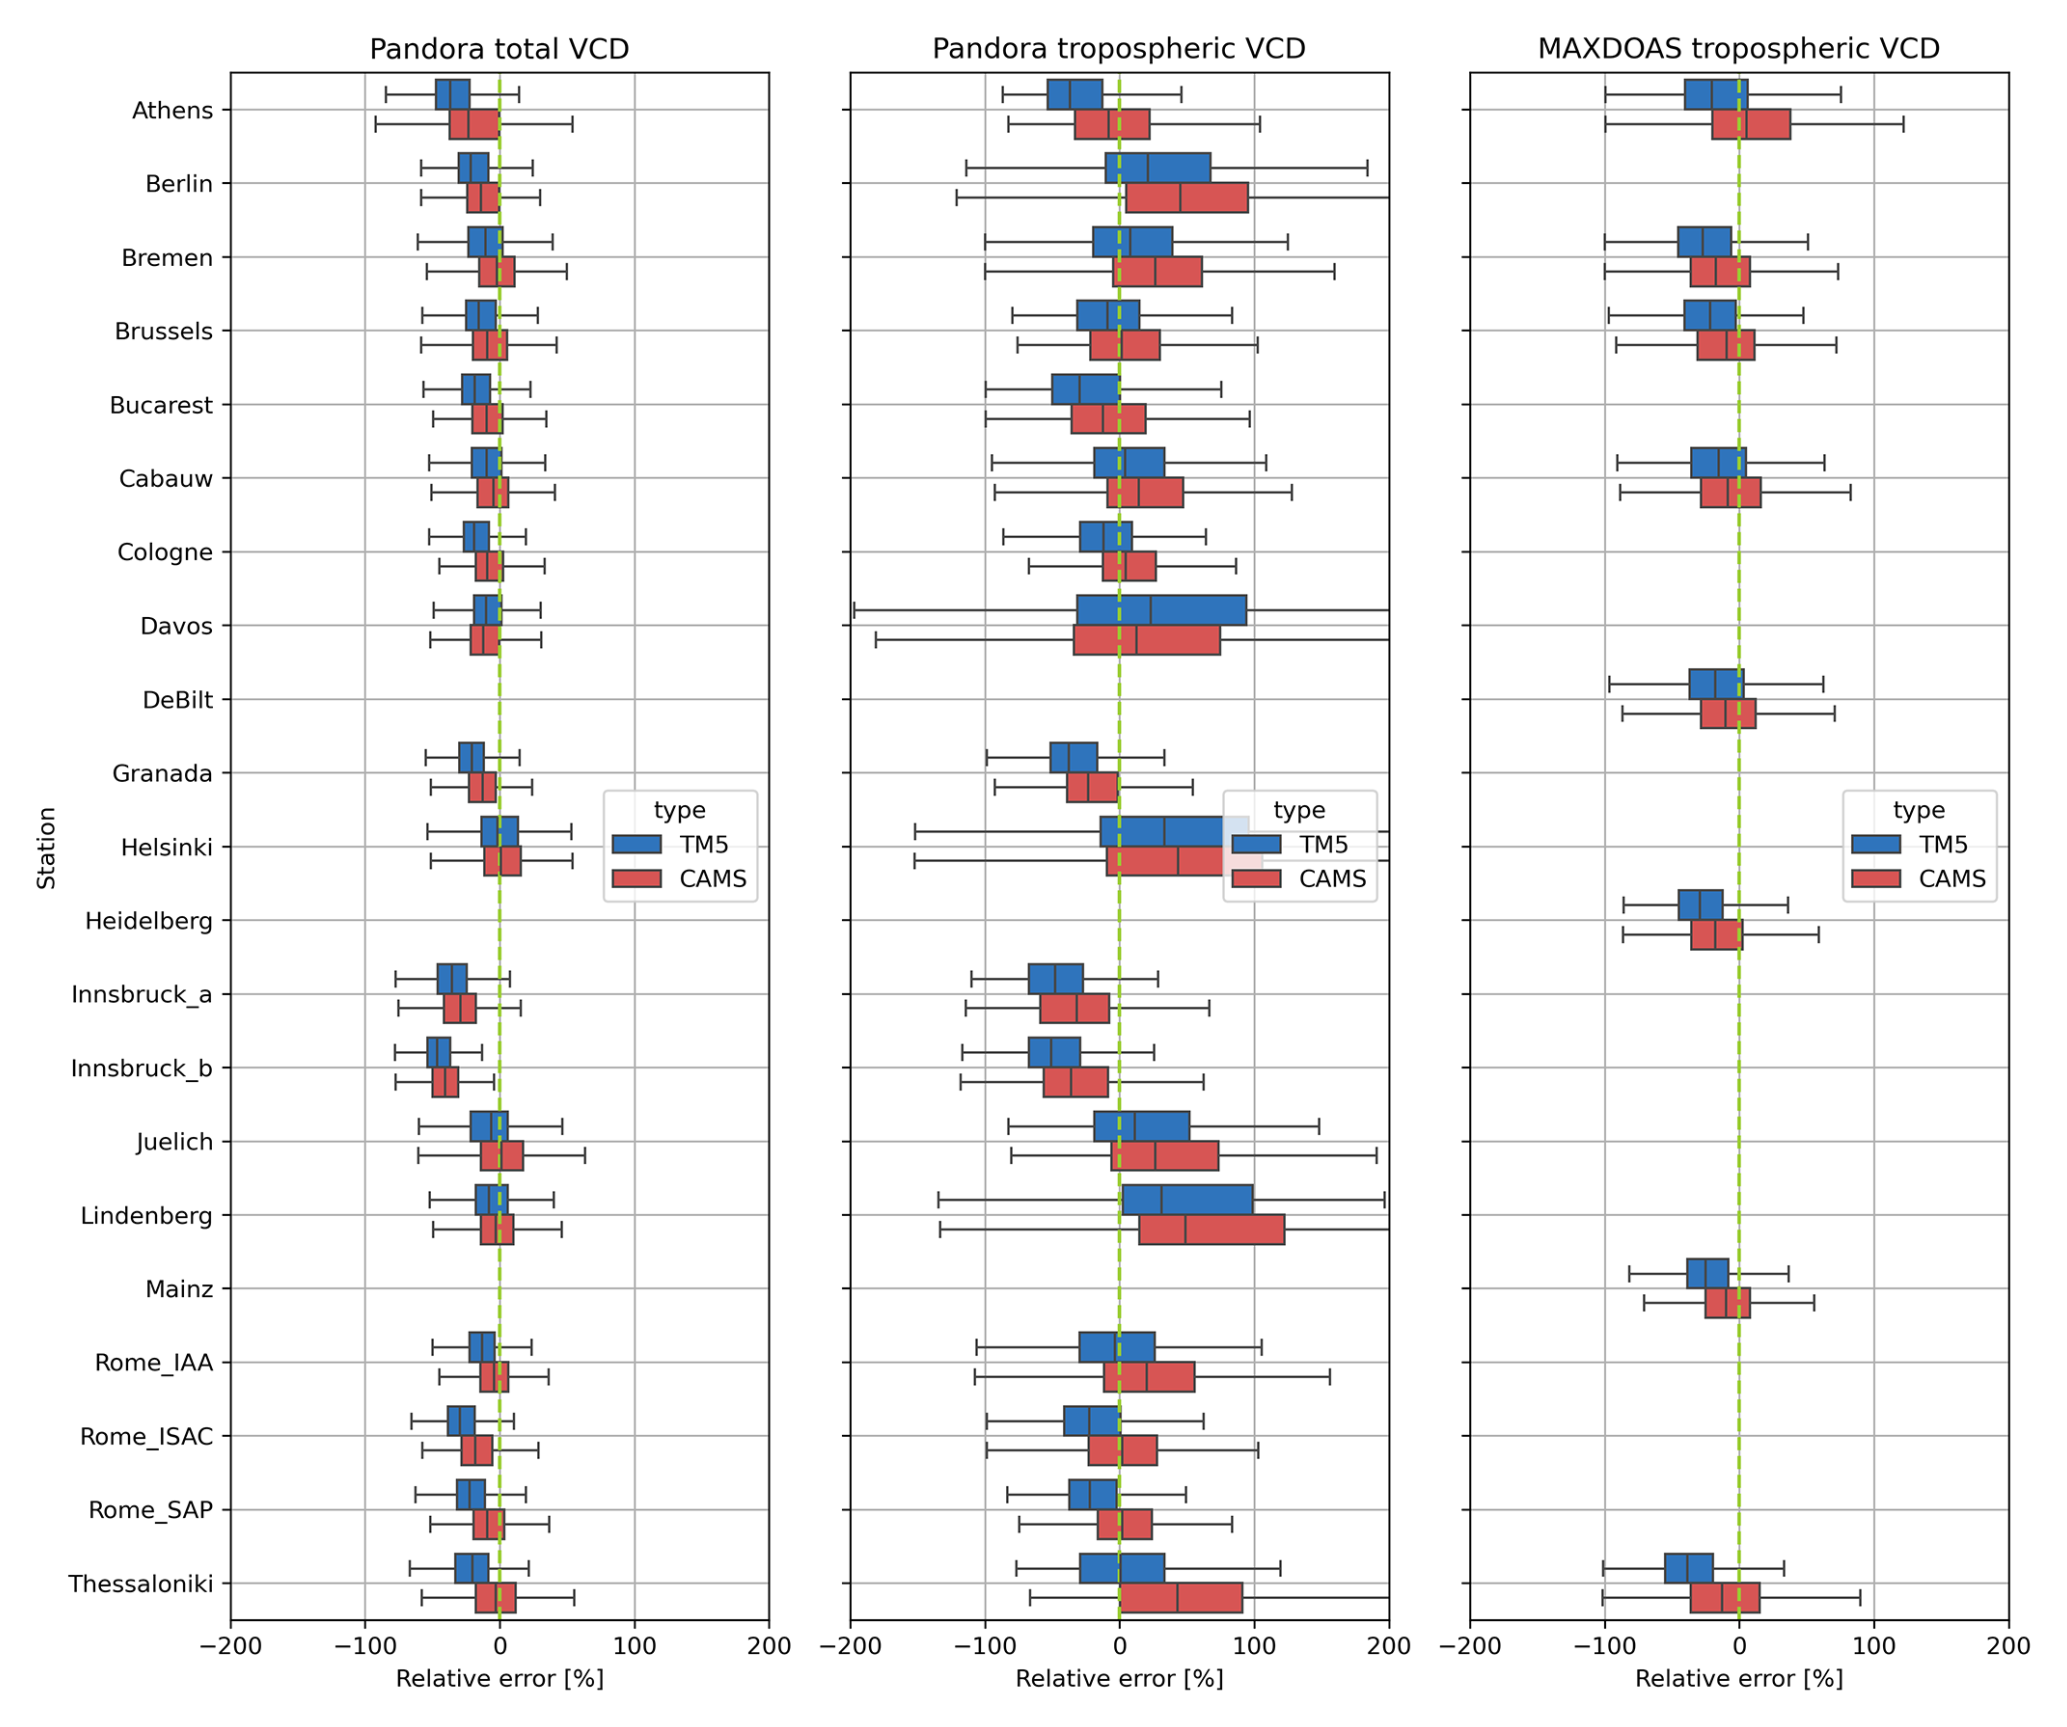
Figure B13Distributions of the relative differences between TROPOMI and ground-based observations, using TM5-MP (blue) and CAMS (red) a-priori profiles. Results are shown for individual stations (vertical) for the Pandora total column (left), tropospheric column (middle), and MAX-DOAS FRM4DOAS (right) comparisons.
Table C1Representation uncertainty between OMI and ground-based instruments due to horizontal gradients.
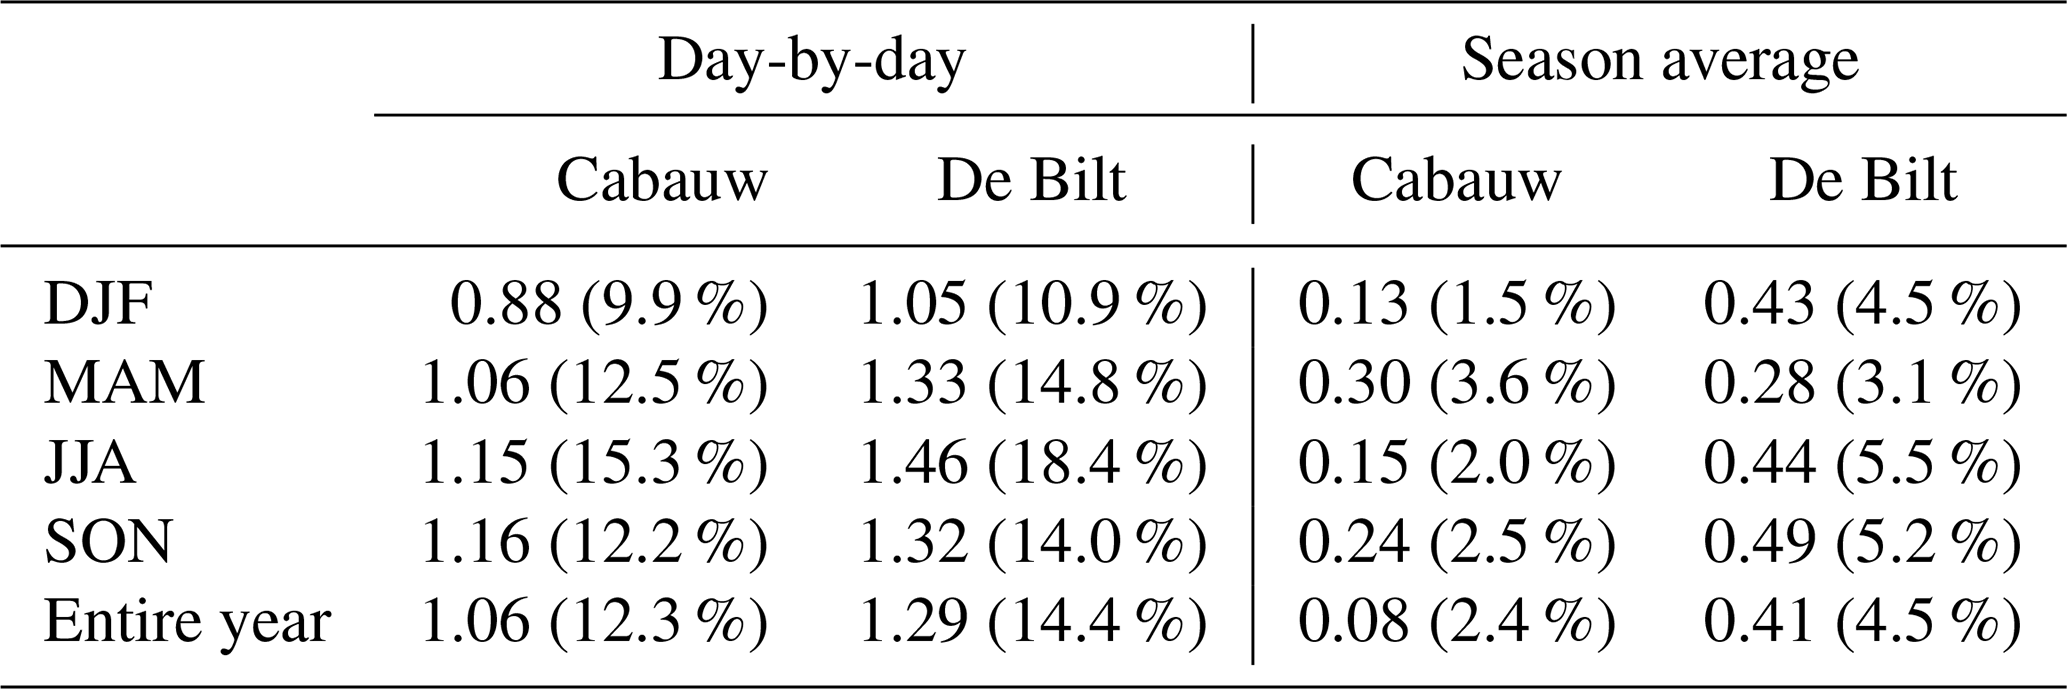
Uncertainty values are provided in Pmolec cm−2 and in percentage between brackets
The TROPOMI L2 NO2 datasets are publicly accessible. The default product, which uses TM5-MP a-priori data, can be obtained via the Copernicus Data Space Ecosystem (https://doi.org/10.5270/S5P-9bnp8q8, Copernicus Sentinel-5P, 2021), while the version incorporating CAMS a-priori data is available through the Tropospheric Emission Monitoring Internet Service (TEMIS) portal (https://www.temis.nl/airpollution/no2_cams.php, last access: 9 April 2026). PGN data can be obtained from the Pandonia data archive (http://data.pandonia-global-network.org/, last access: 9 April 2026) or via API for Python-based queries (https://api.pandonia-global-network.org/docs, last access: 9 April 2026). MAX-DOAS observations, centrally processed according to the FRM4DOAS specifications, are publicly available through the NDACC RD Data Host Facility (https://www-air.larc.nasa.gov/missions/ndacc/, last access: 9 April 2026). Modeling outputs from LOTOS-EUROS can be provided upon request.
FC: methodology, software, formal analysis, writing - original draft, visualization. HE: conceptualization, validation, writing - review and editing, supervision, project administration, funding acquisition. AP: methodology, data curation. JG: software, data curation. JD: data curation. GP: methodology, data curation. MMF: methodology, data curation. ED: data curation. MG: data curation. FB: conceptualization, validation, writing – review and editing, supervision.
At least one of the (co-)authors is a member of the editorial board of Atmospheric Measurement Techniques. The peer-review process was guided by an independent editor, and the authors also have no other competing interests to declare.
Publisher's note: Copernicus Publications remains neutral with regard to jurisdictional claims made in the text, published maps, institutional affiliations, or any other geographical representation in this paper. The authors bear the ultimate responsibility for providing appropriate place names. Views expressed in the text are those of the authors and do not necessarily reflect the views of the publisher.
Sentinel-5 Precursor is a European Space Agency (ESA) mission on behalf of the European Commission (EC). The TROPOMI payload is a joint development by ESA and the Netherlands Space Office (NSO). The Sentinel-5 Precursor ground segment development has been funded by ESA and with national contributions from the Netherlands, Germany, and Belgium. This work contains modified Copernicus Sentinel-5P TROPOMI data, processed by KNMI. We thank the principal investigators (PIs) of the FRM4DOAS instrument sites of Bremen and Athens (Andreas Richter, Institut für Umweltphysik, Universität Bremen), Uccle (Michel Van Roozendael, Royal Belgian Institute for Space Aeronomy), Cabauw and DeBilt (Ankie Piters, Royal Netherlands Meteorological Institute), Heidelberg (Udo Frieß, University of Heidelberg), Mainz (Thomas Wagner, Max-Planch Institute for Chemistry) and Thessaloniki (Alkis Bais, Aristotle University of Thessaloniki, Laboratory of Atmospheric Physics), as well as the support staff, and funding agencies for establishing and maintaining the MAX-DOAS and PGN sites used in this study. The PGN is a bilateral initiative supported by NASA and ESA funding. FRM4DOAS is a MAX-DOAS central data processing service supported by ESA and EU/ACTRIS.
This research has been supported by the Ministerie van Landbouw, Natuur en Voedselkwaliteit (National Nitrogen Knowledge Programme (NKS), project NKS-SAGEN, on satellite observations and ensemble modeling).
This paper was edited by Sandip Dhomse and reviewed by two anonymous referees.
Bae, K., Song, C.-K., Van Roozendael, M., Richter, A., Wagner, T., Merlaud, A., Pinardi, G., Friedrich, M. M., Fayt, C., Dimitropoulou, E., Lange, K., Bösch, T., Zilker, B., Latsch, M., Behrens, L. K., Ziegler, S., Ripperger-Lukosiunaite, S., Kuhn, L., Lauster, B., Reischmann, L., Uhlmannsiek, K., Cede, A., Tiefengraber, M., Gebetsberger, M., Park, R. J., Lee, H., Hong, H., Chang, L.-S., and Jeon, K.: Validation of GEMS operational v2.0 total column NO2 and HCHO during the GMAP/SIJAQ campaign, Sci. Total Environ., 974, 179190, https://doi.org/10.1016/j.scitotenv.2025.179190, 2025. a
Beirle, S., Borger, C., Dörner, S., Li, A., Hu, Z., Liu, F., Wang, Y., and Wagner, T.: Pinpointing nitrogen oxide emissions from space, Science Advances, 5, https://doi.org/10.1126/SCIADV.AAX9800, 2019a. a
Beirle, S., Dörner, S., Donner, S., Remmers, J., Wang, Y., and Wagner, T.: The Mainz profile algorithm (MAPA), Atmos. Meas. Tech., 12, 1785–1806, https://doi.org/10.5194/amt-12-1785-2019, 2019b. a
Bessagnet, B., Pirovano, G., Mircea, M., Cuvelier, C., Aulinger, A., Calori, G., Ciarelli, G., Manders, A., Stern, R., Tsyro, S., García Vivanco, M., Thunis, P., Pay, M.-T., Colette, A., Couvidat, F., Meleux, F., Rouïl, L., Ung, A., Aksoyoglu, S., Baldasano, J. M., Bieser, J., Briganti, G., Cappelletti, A., D'Isidoro, M., Finardi, S., Kranenburg, R., Silibello, C., Carnevale, C., Aas, W., Dupont, J.-C., Fagerli, H., Gonzalez, L., Menut, L., Prévôt, A. S. H., Roberts, P., and White, L.: Presentation of the EURODELTA III intercomparison exercise – evaluation of the chemistry transport models' performance on criteria pollutants and joint analysis with meteorology, Atmos. Chem. Phys., 16, 12667–12701, https://doi.org/10.5194/acp-16-12667-2016, 2016. a
Boersma, K. F., Bucsela, E., Brinksma, E., and Gleason, J. F.: OMI Algorithm Theoretical Basis Document Vol. 4: OMI Trace Gas Algorithms, ATBD-OMI-02 Vers. 2.0, https://eospso.nasa.gov/sites/default/files/atbd/ATBD-OMI-04.pdf (last access: 9 April 2026), 2002. a
Boersma, K. F., Eskes, H. J., and Brinksma, E. J.: Error analysis for tropospheric NO2 retrieval from space, J. Geophys. Res.-Atmos., 109, https://doi.org/10.1029/2003JD003962, 2004. a, b
Cede, A.: Manual for Blick Software Suite 1.8, Manual version 1.8-6, https://www.pandonia-global-network.org/assets/manuals/BlickSoftwareSuite_Manual_v1-8-6.pdf (last access: 9 April 2026), 21 November 2024. a, b, c
Cede, A., Tiefengraber, M., Gebetsberger, M., and Lind, E. S.: Pandonia Global Network Data Products Readme Document, Version 1.8-10, https://www.pandonia-global-network.org/assets/manuals/PGN_DataProducts_Readme_v1-8-10.pdf (last access: 9 April 2026), 20 January 2025. a, b, c
Chan, K. L., Wiegner, M., van Geffen, J., De Smedt, I., Alberti, C., Cheng, Z., Ye, S., and Wenig, M.: MAX-DOAS measurements of tropospheric NO2 and HCHO in Munich and the comparison to OMI and TROPOMI satellite observations, Atmos. Meas. Tech., 13, 4499–4520, https://doi.org/10.5194/amt-13-4499-2020, 2020. a, b
Cifuentes, F., Eskes, H., Dammers, E., Bryan, C., and Boersma, F.: Accurate space-based NOx emission estimates with the flux divergence approach require fine-scale model information on local oxidation chemistry and profile shapes, Geosci. Model Dev., 18, 621–649, https://doi.org/10.5194/gmd-18-621-2025, 2025. a
Clark, C. M., Bai, Y., Bowman, W. D., Cowles, J. M., Fenn, M. E., Gilliam, F. S., Phoenix, G. K., Siddique, I., Stevens, C. J., Sverdrup, H. U., and Throop, H. L.: Nitrogen Deposition and Terrestrial Biodiversity, in: Encyclopedia of Biodiversity, 2nd edn., edited by: Levin, S. A., Academic Press, 519–536, https://doi.org/10.1016/B978-0-12-384719-5.00366-X, 2013. a
Colette, A., Andersson, C., Manders, A., Mar, K., Mircea, M., Pay, M.-T., Raffort, V., Tsyro, S., Cuvelier, C., Adani, M., Bessagnet, B., Bergström, R., Briganti, G., Butler, T., Cappelletti, A., Couvidat, F., D'Isidoro, M., Doumbia, T., Fagerli, H., Granier, C., Heyes, C., Klimont, Z., Ojha, N., Otero, N., Schaap, M., Sindelarova, K., Stegehuis, A. I., Roustan, Y., Vautard, R., van Meijgaard, E., Vivanco, M. G., and Wind, P.: EURODELTA-Trends, a multi-model experiment of air quality hindcast in Europe over 1990–2010, Geosci. Model Dev., 10, 3255–3276, https://doi.org/10.5194/gmd-10-3255-2017, 2017. a
Colette, A., Collin, G., Besson, F., Blot, E., Guidard, V., Meleux, F., Royer, A., Petiot, V., Miller, C., Fermond, O., Jeant, A., Adani, M., Arteta, J., Benedictow, A., Bergström, R., Bowdalo, D., Brandt, J., Briganti, G., Carvalho, A. C., Christensen, J. H., Couvidat, F., D'Elia, I., D'Isidoro, M., Denier van der Gon, H., Descombes, G., Di Tomaso, E., Douros, J., Escribano, J., Eskes, H., Fagerli, H., Fatahi, Y., Flemming, J., Friese, E., Frohn, L., Gauss, M., Geels, C., Guarnieri, G., Guevara, M., Guion, A., Guth, J., Hänninen, R., Hansen, K., Im, U., Janssen, R., Jeoffrion, M., Joly, M., Jones, L., Jorba, O., Kadantsev, E., Kahnert, M., Kaminski, J. W., Kouznetsov, R., Kranenburg, R., Kuenen, J., Lange, A. C., Langner, J., Lannuque, V., Macchia, F., Manders, A., Mircea, M., Nyiri, A., Olid, M., Pérez García-Pando, C., Palamarchuk, Y., Piersanti, A., Raux, B., Razinger, M., Robertson, L., Segers, A., Schaap, M., Siljamo, P., Simpson, D., Sofiev, M., Stangel, A., Struzewska, J., Tena, C., Timmermans, R., Tsikerdekis, T., Tsyro, S., Tyuryakov, S., Ung, A., Uppstu, A., Valdebenito, A., van Velthoven, P., Vitali, L., Ye, Z., Peuch, V.-H., and Rouïl, L.: Copernicus Atmosphere Monitoring Service – Regional Air Quality Production System v1.0, Geosci. Model Dev., 18, 6835–6883, https://doi.org/10.5194/gmd-18-6835-2025, 2025. a
Copernicus Sentinel-5P: TROPOMI Level 2 Nitrogen Dioxide total column products, Version 02, European Space Agency (ESA) [data set], https://doi.org/10.5270/S5P-9bnp8q8, 2021. a
Dammers, E., Wizenberg, T., Eskes, H., Cifuentes, F., van der A, R., Ding, J., Wichink Kruit, R., van der Graaf, S., Li, S., and Kros, H.: Technical Report: Using Satellite Observations for Assessing the Spatial and Temporal Variation of Nitrogen Emissions and Deposition in the Netherlands, https://www.knmi.nl/research/publications/using-satellite-obser vations-for-assessing-the-spatial-and-temporal-variation-of-nitr ogen-emissions-and-deposition-in-the-netherlands (last access: 9 April 2026), 2026. a
de Vries, W.: Impacts of nitrogen emissions on ecosystems and human health: A mini review, Current Opinion in Environmental Science & Health, 21, 100249, https://doi.org/10.1016/J.COESH.2021.100249, 2021. a
Dimitropoulou, E., Hendrick, F., Pinardi, G., Friedrich, M. M., Merlaud, A., Tack, F., De Longueville, H., Fayt, C., Hermans, C., Laffineur, Q., Fierens, F., and Van Roozendael, M.: Validation of TROPOMI tropospheric NO2 columns using dual-scan multi-axis differential optical absorption spectroscopy (MAX-DOAS) measurements in Uccle, Brussels, Atmos. Meas. Tech., 13, 5165–5191, https://doi.org/10.5194/amt-13-5165-2020, 2020. a, b, c
Dimitropoulou, E., Hendrick, F., Friedrich, M. M., Tack, F., Pinardi, G., Merlaud, A., Fayt, C., Hermans, C., Fierens, F., and Van Roozendael, M.: Horizontal distribution of tropospheric NO2 and aerosols derived by dual-scan multi-wavelength multi-axis differential optical absorption spectroscopy (MAX-DOAS) measurements in Uccle, Belgium, Atmos. Meas. Tech., 15, 4503–4529, https://doi.org/10.5194/amt-15-4503-2022, 2022. a
Dirksen, R. J., Boersma, K. F., Eskes, H. J., Ionov, D. V., Bucsela, E. J., Levelt, P. F., and Kelder, H. M.: Evaluation of stratospheric NO2 retrieved from the Ozone Monitoring Instrument: Intercomparison, diurnal cycle, and trending, J. Geophys. Res.-Atmos., 116, https://doi.org/10.1029/2010JD014943, 2011. a
Douros, J., Eskes, H., van Geffen, J., Boersma, K. F., Compernolle, S., Pinardi, G., Blechschmidt, A.-M., Peuch, V.-H., Colette, A., and Veefkind, P.: Comparing Sentinel-5P TROPOMI NO2 column observations with the CAMS regional air quality ensemble, Geosci. Model Dev., 16, 509–534, https://doi.org/10.5194/gmd-16-509-2023, 2023. a, b, c, d, e, f, g, h, i, j
Eskes, H., van Geffen, J., Boersma, K., Eichmann, K.-U., Apituley, A., Pedergnana, M., Sneep, M., Veefkind, J. P., and Loyola, D.: Sentinel-5 precursor/TROPOMI Level 2 Product User Manual Nitrogendioxide, Tech. Rep. S5P-KNMI-L2-0021-MA, Koninklijk Nederlands Meteorologisch Instituut (KNMI), issue 4.3.0, processor version 2.7.1, CI-7570-PUM, https://sentiwiki.copernicus.eu/web/s5p-products#S5P-Products-L2 (last access: 9 April 2026), 4 April 2024. a, b
Eskes, H., Eichmann, K., Lambert, J. C., Loyola, D., Stein-Zweers, D., Dehn, A., and Zehner, C.: ATM-MPC Mission Performance Cluster Nitrogen Dioxide Readme, Tech. Rep. S5P-MPC-KNMI-PRF-NO2, issue 2.8, processor version 2.8.0, https://sentiwiki.copernicus.eu/web/s5p-products#S5P-Products-L2 (last access: 9 April 2026), 19 March 2025. a, b, c
Fan, C., Li, Z., Li, Y., Dong, J., van der A, R., and de Leeuw, G.: Variability of NO2 concentrations over China and effect on air quality derived from satellite and ground-based observations, Atmos. Chem. Phys., 21, 7723–7748, https://doi.org/10.5194/acp-21-7723-2021, 2021. a
Friedrich, M. M., Rivera, C., Stremme, W., Ojeda, Z., Arellano, J., Bezanilla, A., García-Reynoso, J. A., and Grutter, M.: NO2 vertical profiles and column densities from MAX-DOAS measurements in Mexico City, Atmos. Meas. Tech., 12, 2545–2565, https://doi.org/10.5194/amt-12-2545-2019, 2019. a, b, c
Glissenaar, I., Boersma, K. F., Anglou, I., Rijsdijk, P., Verhoelst, T., Compernolle, S., Pinardi, G., Lambert, J.-C., Van Roozendael, M., and Eskes, H.: TROPOMI Level 3 tropospheric NO2 dataset with advanced uncertainty analysis from the ESA CCI+ ECV precursor project, Earth Syst. Sci. Data, 17, 4627–4650, https://doi.org/10.5194/essd-17-4627-2025, 2025. a, b, c, d
Goldberg, D. L., Anenberg, S. C., Kerr, G. H., Mohegh, A., Lu, Z., and Streets, D. G.: TROPOMI NO2 in the United States: A Detailed Look at the Annual Averages, Weekly Cycles, Effects of Temperature, and Correlation With Surface NO2 Concentrations, Earth's Future, 9, e2020EF001665, https://doi.org/10.1029/2020EF001665, 2021. a
Griffin, D., Zhao, X., McLinden, C. A., Boersma, F., Bourassa, A., Dammers, E., Degenstein, D., Eskes, H., Fehr, L., Fioletov, V., Hayden, K., Kharol, S. K., Li, S.-M., Makar, P., Martin, R. V., Mihele, C., Mittermeier, R. L., Krotkov, N., Sneep, M., Lamsal, L. N., Linden, M. t., Geffen, J. v., Veefkind, P., and Wolde, M.: High-Resolution Mapping of Nitrogen Dioxide With TROPOMI: First Results and Validation Over the Canadian Oil Sands, Geophys. Res. Lett., 46, 1049–1060, https://doi.org/10.1029/2018GL081095, 2019. a, b
Grivas, G., Chaloulakou, A., and Kassomenos, P.: An overview of the PM10 pollution problem, in the Metropolitan Area of Athens, Greece. Assessment of controlling factors and potential impact of long range transport, Sci. Total Environ., 389, 165–177, https://doi.org/10.1016/j.scitotenv.2007.08.048, 2008. a
Herman, J., Cede, A., Spinei, E., Mount, G., Tzortziou, M., and Abuhassan, N.: NO2 column amounts from ground-based Pandora and MFDOAS spectrometers using the direct-sun DOAS technique: Intercomparisons and application to OMI validation, J. Geophys. Res.-Atmos., 114, https://doi.org/10.1029/2009JD011848, 2009. a, b, c
Herman, J., Abuhassan, N., Kim, J., Kim, J., Dubey, M., Raponi, M., and Tzortziou, M.: Underestimation of column NO2 amounts from the OMI satellite compared to diurnally varying ground-based retrievals from multiple PANDORA spectrometer instruments, Atmos. Meas. Tech., 12, 5593–5612, https://doi.org/10.5194/amt-12-5593-2019, 2019. a
Hönninger, G., von Friedeburg, C., and Platt, U.: Multi axis differential optical absorption spectroscopy (MAX-DOAS), Atmos. Chem. Phys., 4, 231–254, https://doi.org/10.5194/acp-4-231-2004, 2004. a, b
Ialongo, I., Virta, H., Eskes, H., Hovila, J., and Douros, J.: Comparison of TROPOMI/Sentinel-5 Precursor NO2 observations with ground-based measurements in Helsinki, Atmos. Meas. Tech., 13, 205–218, https://doi.org/10.5194/amt-13-205-2020, 2020. a, b, c
Irie, H., Takashima, H., Kanaya, Y., Boersma, K. F., Gast, L., Wittrock, F., Brunner, D., Zhou, Y., and Van Roozendael, M.: Eight-component retrievals from ground-based MAX-DOAS observations, Atmos. Meas. Tech., 4, 1027–1044, https://doi.org/10.5194/amt-4-1027-2011, 2011. a
Judd, L. M., Al-Saadi, J. A., Szykman, J. J., Valin, L. C., Janz, S. J., Kowalewski, M. G., Eskes, H. J., Veefkind, J. P., Cede, A., Mueller, M., Gebetsberger, M., Swap, R., Pierce, R. B., Nowlan, C. R., Abad, G. G., Nehrir, A., and Williams, D.: Evaluating Sentinel-5P TROPOMI tropospheric NO2 column densities with airborne and Pandora spectrometers near New York City and Long Island Sound, Atmos. Meas. Tech., 13, 6113–6140, https://doi.org/10.5194/amt-13-6113-2020, 2020. a, b
Kuenen, J., Dellaert, S., Visschedijk, A., Jalkanen, J.-P., Super, I., and Denier van der Gon, H.: CAMS-REG-v4: a state-of-the-art high-resolution European emission inventory for air quality modelling, Earth Syst. Sci. Data, 14, 491–515, https://doi.org/10.5194/essd-14-491-2022, 2022. a
Kun, C., Li, S., Lai, J., Xia, Y., Wang, Y., Hu, X., and Li, A.: Evaluation of TROPOMI and OMI Tropospheric NO2 Products Using Measurements from MAX-DOAS and State-Controlled Stations in the Jiangsu Province of China, Atmosphere, 13, 886, https://doi.org/10.3390/atmos13060886, 2022. a
Lambert, J.-C., Keppens, A., Compernolle, S., Eichmann, K.-U., de Graaf, M., Hubert, D., Langerock, B., Ludewig, A., Sha, M., Verhoelst, T., Wagner, T., Ahn, C., Argyrouli, A., Balis, D., Chan, K., Coldewey-Egbers, M., De Smedt, I., Eskes, H., Fjæraa, A., Garane, K., Gleason, J., Goutail, F., Granville, J., Hedelt, P., Heue, K.-P., Jaross, G., Kleipool, Q., Koukouli, M., Lutz, R., Martinez-Velarte, M., Michailidis, K., Pseftogkas, A., Nanda, S., Niemeijer, S., Pazmiño, A., Pinardi, G., Richter, A., Rozemeijer, N., Sneep, M., Stein Zweers, D., Theys, N., Tilstra, G., Torres, O., Valks, P., van Geffen, J., Vigouroux, C., Wang, P., and Weber, M.: Quarterly Validation Report of the Copernicus Sentinel-5 Precursor Operational Data Products 27: April 2018–May 2025, https://s5p-mpc-vdaf.aeronomie.be/ProjectDir/reports//pdf/S5P-MPC-IASB-ROCVR-27.01.00_FINAL_signed.pdf (last access: 9 April 2026), 2025. a, b, c, d
Liu, M., Lin, J., Kong, H., Boersma, K. F., Eskes, H., Kanaya, Y., He, Q., Tian, X., Qin, K., Xie, P., Spurr, R., Ni, R., Yan, Y., Weng, H., and Wang, J.: A new TROPOMI product for tropospheric NO2 columns over East Asia with explicit aerosol corrections, Atmos. Meas. Tech., 13, 4247–4259, https://doi.org/10.5194/amt-13-4247-2020, 2020. a
Liu, O., Li, Z., Lin, Y., Fan, C., Zhang, Y., Li, K., Zhang, P., Wei, Y., Chen, T., Dong, J., and de Leeuw, G.: Evaluation of the first year of Pandora NO2 measurements over Beijing and application to satellite validation, Atmos. Meas. Tech., 17, 377–395, https://doi.org/10.5194/amt-17-377-2024, 2024. a
Manders, A. M. M., Builtjes, P. J. H., Curier, L., Denier van der Gon, H. A. C., Hendriks, C., Jonkers, S., Kranenburg, R., Kuenen, J. J. P., Segers, A. J., Timmermans, R. M. A., Visschedijk, A. J. H., Wichink Kruit, R. J., van Pul, W. A. J., Sauter, F. J., van der Swaluw, E., Swart, D. P. J., Douros, J., Eskes, H., van Meijgaard, E., van Ulft, B., van Velthoven, P., Banzhaf, S., Mues, A. C., Stern, R., Fu, G., Lu, S., Heemink, A., van Velzen, N., and Schaap, M.: Curriculum vitae of the LOTOS–EUROS (v2.0) chemistry transport model, Geosci. Model Dev., 10, 4145–4173, https://doi.org/10.5194/gmd-10-4145-2017, 2017. a
Manders, A. M. M., Segers, A. J., and Jonkers, S.: LOTOS-EUROS v2.2.002 Reference Guide, https://airqualitymodeling.tno.nl/publish/pages/3175/lotos-euros-reference-guide.pdf (last access: 9 April 2026), 2021. a
Marais, E. A., Roberts, J. F., Ryan, R. G., Eskes, H., Boersma, K. F., Choi, S., Joiner, J., Abuhassan, N., Redondas, A., Grutter, M., Cede, A., Gomez, L., and Navarro-Comas, M.: New observations of NO2 in the upper troposphere from TROPOMI, Atmos. Meas. Tech., 14, 2389–2408, https://doi.org/10.5194/amt-14-2389-2021, 2021. a
Moussiopoulos, N., Vlachokostas, C., Tsilingiridis, G., Douros, I., Hourdakis, E., Naneris, C., and Sidiropoulos, C.: Air quality status in Greater Thessaloniki Area and the emission reductions needed for attaining the EU air quality legislation, Sci. Total Environ., 407, 1268–1285, https://doi.org/10.1016/j.scitotenv.2008.10.034, 2009. a
Peuch, V.-H., Engelen, R., Rixen, M., Dee, D., Flemming, J., Suttie, M., Ades, M., Agusti-Panareda, A., Ananasso, C., Andersson, E., Armstrong, D., Barré, J., Bousserez, N., Dominguez, J., Garrigues, S., Inness, A., Jones, L., Kipling, Z., Letertre-Danczak, J., Parrington, M., Razinger, M., Ribas, R., Vermoote, S., Yang, X., Simmons, A., and Thépaut, J.-N.: The Copernicus Atmosphere Monitoring Service: From Research to Operations, B. Am. Meteorol. Soc., 103, https://doi.org/10.1175/BAMS-D-21-0314.1, 2022. a
Pinardi, G., Van Roozendael, M., Hendrick, F., Theys, N., Abuhassan, N., Bais, A., Boersma, F., Cede, A., Chong, J., Donner, S., Drosoglou, T., Dzhola, A., Eskes, H., Frieß, U., Granville, J., Herman, J. R., Holla, R., Hovila, J., Irie, H., Kanaya, Y., Karagkiozidis, D., Kouremeti, N., Lambert, J.-C., Ma, J., Peters, E., Piters, A., Postylyakov, O., Richter, A., Remmers, J., Takashima, H., Tiefengraber, M., Valks, P., Vlemmix, T., Wagner, T., and Wittrock, F.: Validation of tropospheric NO2 column measurements of GOME-2A and OMI using MAX-DOAS and direct sun network observations, Atmos. Meas. Tech., 13, 6141–6174, https://doi.org/10.5194/amt-13-6141-2020, 2020. a, b
Riess, T. C. V., Boersma, K. F., Prummel, A., van Stratum, B. J., de Laat, J., and van Vliet, J.: Estimating NOx emissions of individual ships from TROPOMI NO2 plumes, Remote Sens. Environ., 324, 114734, https://doi.org/10.1016/j.rse.2025.114734, 2025. a
Riess, T. C. V. W., Boersma, K. F., Van Roy, W., de Laat, J., Dammers, E., and van Vliet, J.: To new heights by flying low: comparison of aircraft vertical NO2 profiles to model simulations and implications for TROPOMI NO2 retrievals, Atmos. Meas. Tech., 16, 5287–5304, https://doi.org/10.5194/amt-16-5287-2023, 2023. a
Rijsdijk, P., Eskes, H., Dingemans, A., Boersma, K. F., Sekiya, T., Miyazaki, K., and Houweling, S.: Quantifying uncertainties in satellite NO2 superobservations for data assimilation and model evaluation, Geosci. Model Dev., 18, 483–509, https://doi.org/10.5194/gmd-18-483-2025, 2025. a, b, c, d, e, f, g
Rodgers, C. D.: Inverse Methods for Atmospheric Sounding, World Scientific, https://doi.org/10.1142/3171, 2000. a
Rodgers, C. D. and Connor, B. J.: Intercomparison of remote sounding instruments, J. Geophys. Res.-Atmos., 108, https://doi.org/10.1029/2002JD002299, 2003. a, b, c
Seinfeld, J. H. and Pandis, S. N.: Atmospheric Chemistry and Physics: From Air Pollution to Climate Change, John Wiley & Sons, Hoboken, New Jersey, 2nd edn., ISBN 978-1-118-94740-1, 2006. a
Skoulidou, I., Koukouli, M.-E., Manders, A., Segers, A., Karagkiozidis, D., Gratsea, M., Balis, D., Bais, A., Gerasopoulos, E., Stavrakou, T., van Geffen, J., Eskes, H., and Richter, A.: Evaluation of the LOTOS-EUROS NO2 simulations using ground-based measurements and S5P/TROPOMI observations over Greece, Atmos. Chem. Phys., 21, 5269–5288, https://doi.org/10.5194/acp-21-5269-2021, 2021. a, b, c
Streets, D. G., Canty, T., Carmichael, G. R., de Foy, B., Dickerson, R. R., Duncan, B. N., Edwards, D. P., Haynes, J. A., Henze, D. K., Houyoux, M. R., Jacob, D. J., Krotkov, N. A., Lamsal, L. N., Liu, Y., Lu, Z., Martin, R. V., Pfister, G. G., Pinder, R. W., Salawitch, R. J., and Wecht, K. J.: Emissions estimation from satellite retrievals: A review of current capability, Atmos. Environ., 77, 1011–1042, https://doi.org/10.1016/j.atmosenv.2013.05.051, 2013. a
Tack, F., Merlaud, A., Iordache, M.-D., Pinardi, G., Dimitropoulou, E., Eskes, H., Bomans, B., Veefkind, P., and Van Roozendael, M.: Assessment of the TROPOMI tropospheric NO2 product based on airborne APEX observations, Atmos. Meas. Tech., 14, 615–646, https://doi.org/10.5194/amt-14-615-2021, 2021. a
Tzortziou, M., Loughner, C. P., Goldberg, D. L., Judd, L., Nauth, D., Kwong, C. F., Lin, T., Cede, A., and Abuhassan, N.: Intimately tracking NO2 pollution over the New York City – Long Island Sound land-water continuum: An integration of shipboard, airborne, satellite observations, and models, Sci. Total Environ., 897, 165144, https://doi.org/10.1016/j.scitotenv.2023.165144, 2023. a
van Geffen, J., Boersma, K. F., Eskes, H., Sneep, M., ter Linden, M., Zara, M., and Veefkind, J. P.: S5P TROPOMI NO2 slant column retrieval: method, stability, uncertainties and comparisons with OMI, Atmos. Meas. Tech., 13, 1315–1335, https://doi.org/10.5194/amt-13-1315-2020, 2020. a, b
van Geffen, J., Eskes, H., Compernolle, S., Pinardi, G., Verhoelst, T., Lambert, J.-C., Sneep, M., ter Linden, M., Ludewig, A., Boersma, K. F., and Veefkind, J. P.: Sentinel-5P TROPOMI NO2 retrieval: impact of version v2.2 improvements and comparisons with OMI and ground-based data, Atmos. Meas. Tech., 15, 2037–2060, https://doi.org/10.5194/amt-15-2037-2022, 2022. a, b, c
van Geffen, J. H. G. M., Eskes, H. J., Boersma, K. F., Veefkind, J. P., Sneep, M., and ter Linden, M.: TROPOMI ATBD of the total and tropospheric NO2 data products, Tech. Rep. S5P-KNMI-L2-0005-RP, Koninklijk Nederlands Meteorologisch Instituut (KNMI), CI-7430-ATBD, issue 2.8.0, processor version 2.8.0, https://sentiwiki.copernicus.eu/web/s5p-products#S5P-Products-L2 (last access: 9 April 2026), 18 November 2024. a, b, c, d, e, f, g, h
Van Roozendael, M., Hendrick, F., Friedrich, M. M., Fayt, C., Bais, A., Beirle, S., Bösch, T., Navarro Comas, M., Friess, U., Karagkiozidis, D., Kreher, K., Merlaud, A., Pinardi, G., Piters, A., Prados-Roman, C., Puentedura, O., Reischmann, L., Richter, A., Tirpitz, J.-L., Wagner, T., Yela, M., and Ziegler, S.: Fiducial Reference Measurements for Air Quality Monitoring Using Ground-Based MAX-DOAS Instruments (FRM4DOAS), Remote Sensing, 16, https://doi.org/10.3390/rs16234523, 2024. a, b
Veefkind, J., Aben, I., McMullan, K., Förster, H., de Vries, J., Otter, G., Claas, J., Eskes, H., de Haan, J., Kleipool, Q., van Weele, M., Hasekamp, O., Hoogeveen, R., Landgraf, J., Snel, R., Tol, P., Ingmann, P., Voors, R., Kruizinga, B., Vink, R., Visser, H., and Levelt, P.: TROPOMI on the ESA Sentinel-5 Precursor: A GMES mission for global observations of the atmospheric composition for climate, air quality and ozone layer applications, Remote Sens. Environ., 120, 70–83, https://doi.org/10.1016/j.rse.2011.09.027, 2012. a, b
Verhoelst, T., Compernolle, S., Pinardi, G., Lambert, J.-C., Eskes, H. J., Eichmann, K.-U., Fjæraa, A. M., Granville, J., Niemeijer, S., Cede, A., Tiefengraber, M., Hendrick, F., Pazmiño, A., Bais, A., Bazureau, A., Boersma, K. F., Bognar, K., Dehn, A., Donner, S., Elokhov, A., Gebetsberger, M., Goutail, F., Grutter de la Mora, M., Gruzdev, A., Gratsea, M., Hansen, G. H., Irie, H., Jepsen, N., Kanaya, Y., Karagkiozidis, D., Kivi, R., Kreher, K., Levelt, P. F., Liu, C., Müller, M., Navarro Comas, M., Piters, A. J. M., Pommereau, J.-P., Portafaix, T., Prados-Roman, C., Puentedura, O., Querel, R., Remmers, J., Richter, A., Rimmer, J., Rivera Cárdenas, C., Saavedra de Miguel, L., Sinyakov, V. P., Stremme, W., Strong, K., Van Roozendael, M., Veefkind, J. P., Wagner, T., Wittrock, F., Yela González, M., and Zehner, C.: Ground-based validation of the Copernicus Sentinel-5P TROPOMI NO2 measurements with the NDACC ZSL-DOAS, MAX-DOAS and Pandonia global networks, Atmos. Meas. Tech., 14, 481–510, https://doi.org/10.5194/amt-14-481-2021, 2021. a, b
Vivanco, M. G., Theobald, M. R., García-Gómez, H., Garrido, J. L., Prank, M., Aas, W., Adani, M., Alyuz, U., Andersson, C., Bellasio, R., Bessagnet, B., Bianconi, R., Bieser, J., Brandt, J., Briganti, G., Cappelletti, A., Curci, G., Christensen, J. H., Colette, A., Couvidat, F., Cuvelier, C., D'Isidoro, M., Flemming, J., Fraser, A., Geels, C., Hansen, K. M., Hogrefe, C., Im, U., Jorba, O., Kitwiroon, N., Manders, A., Mircea, M., Otero, N., Pay, M.-T., Pozzoli, L., Solazzo, E., Tsyro, S., Unal, A., Wind, P., and Galmarini, S.: Modeled deposition of nitrogen and sulfur in Europe estimated by 14 air quality model systems: evaluation, effects of changes in emissions and implications for habitat protection, Atmos. Chem. Phys., 18, 10199–10218, https://doi.org/10.5194/acp-18-10199-2018, 2018. a
Vlemmix, T., Eskes, H. J., Piters, A. J. M., Schaap, M., Sauter, F. J., Kelder, H., and Levelt, P. F.: MAX-DOAS tropospheric nitrogen dioxide column measurements compared with the Lotos-Euros air quality model, Atmos. Chem. Phys., 15, 1313–1330, https://doi.org/10.5194/acp-15-1313-2015, 2015. a
von Clarmann, T.: Smoothing error pitfalls, Atmos. Meas. Tech., 7, 3023–3034, https://doi.org/10.5194/amt-7-3023-2014, 2014. a
Wang, C., Wang, T., Wang, P., and Rakitin, V.: Comparison and Validation of TROPOMI and OMI NO2 Observations over China, Atmosphere, 11, 636, https://doi.org/10.3390/atmos11060636, 2020. a, b
Wang, C., Wang, T., Wang, P., and Wang, W.: Assessment of the Performance of TROPOMI NO2 and SO2 Data Products in the North China Plain: Comparison, Correction and Application, Remote Sensing, 14, 214, https://doi.org/10.3390/rs14010214, 2022. a
Williams, J. E., Boersma, K. F., Le Sager, P., and Verstraeten, W. W.: The high-resolution version of TM5-MP for optimized satellite retrievals: description and validation, Geosci. Model Dev., 10, 721–750, https://doi.org/10.5194/gmd-10-721-2017, 2017. a
Zara, M., Boersma, K. F., Eskes, H., Denier van der Gon, H., Vilà-Guerau de Arellano, J., Krol, M., van der Swaluw, E., Schuch, W., and Velders, G. J.: Reductions in nitrogen oxides over the Netherlands between 2005 and 2018 observed from space and on the ground: Decreasing emissions and increasing O3 indicate changing NOx chemistry, Atmospheric Environment: X, 9, 100104, https://doi.org/10.1016/j.aeaoa.2021.100104, 2021. a
Zhao, X., Griffin, D., Fioletov, V., McLinden, C., Cede, A., Tiefengraber, M., Müller, M., Bognar, K., Strong, K., Boersma, F., Eskes, H., Davies, J., Ogyu, A., and Lee, S. C.: Assessment of the quality of TROPOMI high-spatial-resolution NO2 data products in the Greater Toronto Area, Atmos. Meas. Tech., 13, 2131–2159, https://doi.org/10.5194/amt-13-2131-2020, 2020. a, b, c
- Abstract
- Introduction
- Measurement datasets, models, and uncertainties
- Methodology to estimate uncertainties and intercomparison approach
- Results of the uncertainty assessment
- TROPOMI NO2 inter-comparison with ground-based observations
- Conclusions
- Appendix A: Statistical performance metrics
- Appendix B: Supporting figures
- Appendix C: Supporting tables
- Data availability
- Author contributions
- Competing interests
- Disclaimer
- Acknowledgements
- Financial support
- Review statement
- References