the Creative Commons Attribution 4.0 License.
the Creative Commons Attribution 4.0 License.
 | 17 Apr 2026
Using formvar to capture atmospheric ice crystals and retrieve roughness parameters
Andrew R. D. Smedley
Paul Connolly
Ann R. Webb
Atmospheric ice crystal roughness is a poorly observed and understood parameter, yet it significantly influences ice crystal scattering properties and consequently impacts radiative transfer in the atmosphere, contributing to uncertainties in climate forecasting. We introduce a novel approach, as a proof-of-concept, to obtain high-resolution roughness measurements, building on the traditional formvar method for capturing ice crystals and validated through comparison of the roughness parameters of salt crystals and salt crystal replicas. In this study, ice crystals were grown in the Manchester Ice Cloud Chamber, collected, and subsequently imaged using a scanning optical profilometer, which enabled the identification of roughness features as small as 0.8 µm. This approach has potential to provide critical insights into roughness characteristics that are significant for improving radiative transfer models and forecasts.
- Article
(2551 KB) - Full-text XML
- BibTeX
- EndNote


The mean equilibrium surface temperature of Earth is significantly affected by clouds that are responsible for both trapping terrestrial radiation as well as reflecting solar radiation back to space. The balance between these processes determines the change in surface temperature due to changes in the cloud (Baran et al., 2016). As indicated in the IPCC (2013), the variability in the prediction models for climate changes can reach up to between 1.5 and 2.0 °C. This range of variability is attributed in the report as primarily being due to model representations of cloud feedback (IPCC, 2013). The lack of understanding of the physical properties of clouds is particularly acute for ice clouds, as their complex microphysical structure and variability across a wide range of scales introduce significant challenges for observation and modelling. As they cover large portions of the globe, this uncertainty propagates to global climate predictions, leading to significant errors in climate change projections. These uncertainties have been substantially constrained through focused, joint efforts to better understand cloud feedback mechanisms across cloud types (IPCC, 2023). As the scientific community has worked to address these uncertainties, our focus here is on issues that can be further mitigated through a deeper understanding of the microscopic properties of ice crystals. This comprises backscattering properties of ice crystals based on their microphysical properties, including shape, orientation, complexity, and roughness.
Accurately representing the microphysics of real clouds in models is enormously challenging and there have been many efforts over the last 80 years (Bailey and Hallett, 2009) to understand ice crystal habit formation as a function of environmental conditions, enabling the input to cloud models to be as accurate as possible. In one of the earliest systematic investigations, Magono and Lee (1966) developed a comprehensive classification of natural snow crystal types, creating a foundational framework that has since guided research in snowflake morphology. More recently, Libbrecht (2005) explained the mechanism that creates a general hexagonal prism shape for ice crystal growth when their sizes are between 10 and 100 µm. Also, in the same year, Connolly et al. (2005) studied the correlation between the electric field and aggregation of ice crystals and also made observations of chains of ice crystals during fieldwork into deep convective outflows. It was found that the electric field can alter the alignment and aggregation of ice crystals, which influences their microphysical properties. The results of the study also compared with the work done by Saunders and Wahab (1975) since their field data were similar. Together, these studies provide empirical evidence that the electric field can contribute to ice crystal aggregation in natural clouds, which can ultimately affect cloud albedo.
As the habit of the ice crystal varies under different conditions, its contribution to scattering behaviour and overall cloud reflection capacity varies. For example, Smith et al. (2015a) investigated scattering by hollow columnar crystals. These types of column crystals have indented end faces which alters the scattering behaviour. It was found that the phase functions are changed for angles less than 23° and higher 160°, and there is a difference in asymmetry parameters of about 1 % as a result of different reflections occurring around the indentations (Smith et al., 2015a).
As technology has developed so have methods to image ice crystals, both in the laboratory and in real clouds. Ice crystal replicas can be captured for analysis with a solution often referred to as “formvar”. Formvar is a solution of polyvinyl formal resin (formvar) dissolved in ethylene dichloride (Schaefer, 1941). The solution is used to coat a surface and then the solvent evaporates leaving behind a plastic coating, or in the case of an ice crystal that melts, a plastic replica. Formvar, often combined with electron microscopy or other imaging techniques, has found widespread application. For example, Kahler et al. (1952) used formvar to coat copper screens for visualizing copper-cystine fibres under electron microscopy. In atmospheric science, following on from Schaefer (1941), Rucklidge (1965) conducted an experiment that involved the use of the formvar solution to create replicas and examine the size and shape of ice crystals under an electron microscope. The work of Griggs and Jayaratne (1986) led to improvements in the capture quality, as well as precautions during the application of the procedure. Since then, the method has frequently been used to create and then image replicas, sometimes using high-resolution optical microscopy, as in Smith et al. (2015b) who used this technique to classify and explain the habit of crystals grown in different conditions. Finnegan and Pitter (1988) investigated the replica process to explain aggregation and secondary ice formation. In the study of Miloshevich and Heymsfield (1997), formvar was used to collect cloud particles as a part of the process for a balloon-borne cloud particle replicator to measure the vertical profile of ice particles. Another replicator was designed and used by Warburton et al. (1983) for the study of transmission of snowfall. This replicator also included formvar to capture crystals by creating a thin film and allowing crystals to impact it to produce detailed imprints on the film. More recently, the use of formvar for crystal habit classification has been largely superseded by optical imaging probes that offer automatic sizing and shape determination but at a lower resolution than that available from standard optical imaging of formvar replicas. These probes provide fast and in-situ imaging, but the resolution of the images is not adequate to analyse the surface details or roughness.
The development of the small ice detector (SID-3) has allowed surface roughness to be inferred indirectly from light scattering patterns of cloud particles (Ulanowski et al., 2014). This technique measures the combined effect of small-scale surface roughness and the crystal complexity as the overall practical impact of `roughness' on scattering but does not provide direct measurements of the surface topography. Nevertheless, this method, and variations of SID-3, have been used to measure cirrus (Ulanowski et al., 2014; Järvinen et al., 2018), and in the laboratory to determine the impact of growth conditions on crystal roughness (Voigtländer et al., 2018). Meanwhile Magee et al. (2014) grew ice crystals in the low-pressure chamber of an Environmental Scanning Electron Microscope (ESEM) and observed a wide range of surface features on scales from 100 nm to more than 10 µm on both these and externally grown crystals transferred to the chamber. Butterfield et al. (2017) extended such observations to understand the impact of surface features on light scattering. In addition, Collier et al. (2016) used a sand particle scanned with an Atomic Force Microscope (AFM) as an analogue for an ice particle to retrieve roughness parameters expressed in terms of correlation length and height standard deviation. The AFM-derived roughness values from the sand grains were found to be similar to ice crystal roughness parameters inferred for sand particles from SID-3 diffraction patterns (Ulanowski et al., 2014).
Direct measurement of the surface roughness of ice crystals remains challenging, yet the traditional formvar technique has the potential to enable such measurements, as it does in other areas of study. A pioneering study investigated the formvar replica process and its ability to capture roughness details (Agar and Revell, 1956). Their study used formvar solution to coat metal alloys, and an interferometer microscope was used to conduct further roughness measurements. The thickness of the formvar solution achieved was around 700 Å. After the coating process, scans of the reverse of the replica and the original material were compared, and the difference between them was found to be negligible, thus providing further validation that formvar can be used to determine roughness.
Here we show how by combining optical profilometry with formvar techniques used to capture ice crystals, in a modified version of the work of Smith et al. (2015a), the surface topography of transient ice crystals can also be preserved and quantified.
The formvar replica technique has traditionally been an efficient way of capturing ice crystals and preserving their surface structure, which is particularly important for ice crystals which would otherwise melt once collected and brought (Smith et al., 2015a) to room temperature. While it has successfully been used for determining crystal habits and features such as hollowness, identifying roughness of a crystal requires evidence that the formvar can accurately reproduce the necessary high-resolution detail. We present the methodology developed to determine the scale of roughness of ice crystals. The results section will also illustrate some of the intervening stages in developing the technique, for example the imaging of salt crystals to demonstrate that the formvar replicas preserve the crystal structure and roughness value derived from it.
The initial step of the traditional method is the placement of a solution of 0.6 wt % polyvinyl formal resin in chloroform (CHCl3) by using a brush onto a glass slide that is then used to capture the ice crystals. Once the formvar solution has subsequently dried out, a replica of the ice crystal is left in the solid formvar which can be investigated under microscopy to retrieve features of the crystal.
The brush leaves a thin layer of solution after it is applied to the slide. This has the advantage of drying rapidly but the crystals cannot be covered fully. This results in imprints of crystals which are suitable for habit identification but not ideal for roughness detection. A more effective approach involves capturing the entire crystal by suspending and encasing it in formvar, thereby ensuring that all surface cavities remain filled during the solidification of the solution and the sublimation or ablation of the crystal. As most of the crystals generated in the Manchester Ice Cloud Chamber (MICC) are under 1 mm in size, a depth of solution of 1 mm was targeted for the experiment. However, this also brought practical challenges that had to be overcome.
In order to achieve the increased thickness of formvar solution required, aluminium foil was used to create a wall around the glass slide, allowing a pool of the solution to be filled to the desired thickness. It is critical to have enough depth for ice crystals to submerge fully but the evaporation of the chloroform solvent from a thicker layer of formvar, at the low temperatures required for crystal formation, proved too slow at standard atmospheric pressure. Early trials found that the chloroform could not completely evaporate before the crystals deformed or ablated.
The study of Kawamura and Mackay (1987) shows the evaporation rate per unit area is calculated following Eq. (1):
Where k is the mass transfer coefficient, M is the molecular weight, P(Ts) is the vapour pressure at Ts which is the temperature of the solution surface, while R and T are the gas constant and absolute temperature of air respectively. The evaporation rate is directly proportional to vapour pressure, thus at a given temperature increasing the vapour pressure increases the evaporation rate. As seen in Fig. 1 at a temperature of −20 °C, the vapour pressure of chloroform decreases by a factor of at least 8 when compared to room temperature.
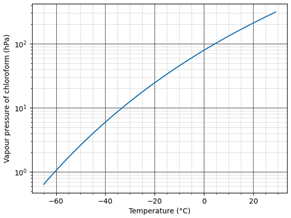
Figure 1Vapour pressure of chloroform (hPa) vs. temperature (°C) adapted from Linstrom and Mallard (2026).
Since k is inversely proportional to pressure, reducing the external pressure on the slide should increase the evaporation rate, E. Accordingly, the formvar slide, with its captured ice crystals was sealed inside a bell jar and air slowly pumped from within, as illustrated schematically in Fig. 2. As the saturation reduced by a factor of 8, we aimed to increase k by a factor of 8 to compensate. The target pressure was 140 to 200 hPa achieved at a flowrate (set to 10 m3 min−1) that would not disturb the sample contained within the bell jar.
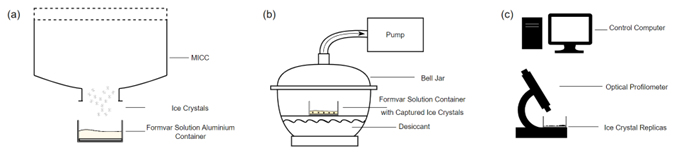
Figure 2Schematic (not to scale) showing steps described in methodology: (a) sample collection, (b) evaporation process, and (c) optical profilometer scanning.
At this flowrate, it took a few minutes to reach the desired pressure level, and once it was reached, the evaporation was visually monitored: as the evaporation occurs, the colour of the solution goes from transparent to opaque. After the sample first appeared opaque, it was left to evaporate for a further 10 min to ensure complete evaporation.
Before the experiment, the bell jar was placed within the outer room of the cloud chamber at −20 °C, and the pressure later reduced at this temperature to encourage the formvar to solidify. Once the replicas were formed and hardened, they were brought to room temperature to allow ice particles to melt. After that, the samples were immediately taken for imaging to ensure that the crystal replicas remained intact with no deformation over time.
Samples were initially examined using an optical profilometer, specifically the Keyence X200K 3D Laser Microscope which is capable of providing a lateral resolution less than 10 nm and vertical resolution less than 5 nm. Preliminary inspection, which was done at lower resolutions (above 100 nm), enabled the identification of areas of interest for more detailed analysis. Once selected, these areas were thoroughly surface scanned using the same instrument, and the resulting scan data was stored for further evaluation. The primary advantage of utilizing the optical profilometer over earlier imaging techniques lies in its dual functionality. It offers a rapid initial optical assessment, followed by a highly detailed 3D surface scan that captures intricate topographical features with precision. The optical profilometer, otherwise known as a laser scanning confocal microscope, utilizes non-contact techniques to measure surface profiles, roughness, and thickness across different materials. It employs both laser and white light sources to simultaneously capture laser intensity, colour, and height data, allowing for the generation of fully focused colour images and detailed 3D height profiles. In contrast to traditional methods like scanning electron microscopy, which may distort samples due to electron beam interaction, the profilometer maintains sample integrity while delivering high-resolution data. This capability makes it well-suited for both quick assessments and comprehensive surface analysis, providing excellent versatility and accuracy, compared to other methods used in the early stages of technique development. After the scanning data was retrieved, it was examined and analysed using the Gwyddion (2004) software package. This program allows users to import surface scanning data and to focus on extracting detailed data from a specified area of the scanned surface, in this case the crystal replicas and not the surrounding formvar, though background areas of formvar were scanned to provide a baseline roughness value. It enables parameters such as mean roughness to be calculated following Eq. (2) which was applied in both x and y directions over the selected area and averaged to yield a more generalised roughness value:
Where L is evaluation length either in x- or y-direction and Z(x) is the height profile defined relative to the mean surface height over L (Gadelmawla et al., 2002) and root mean square (rms) roughness is calculated following Eq. (3):
Where L is evaluation length either in x- or y-direction and Z(x) is the height profile (Gadelmawla et al., 2002). For both, the final values represent the average of the x- and y-direction results.
The methodology outlined in the previous section was developed to demonstrate that it is possible to extract roughness information directly from ice crystals formed within clouds. It was inspired by the observation that traditional optical microscope images are not sufficiently detailed to provide information on roughness as the required high image resolution cannot be achieved (Fig. 3).
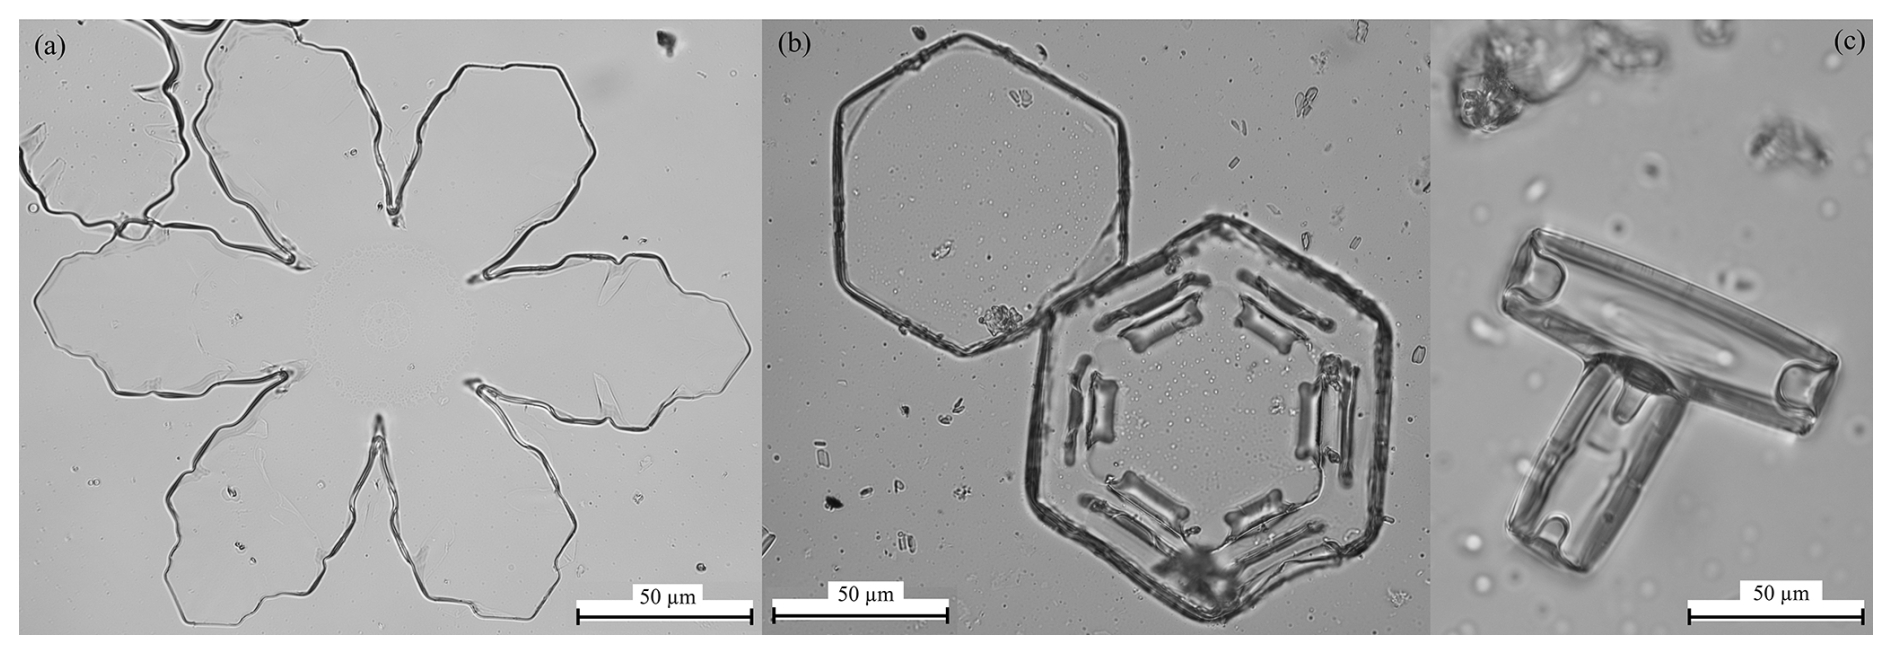
Figure 3Optical microscope images of formvar replicas of random crystals with a shape of: (a) stellar plate, (b) hexagon and (c) column.
Initially, scanning electron microscopy (SEM) was employed to capture the high-resolution images necessary for the analysis by scanning the surface of the material with a focused beam of electrons, which theoretically provides sufficient detail to meet the 100 nm roughness measurement goal.
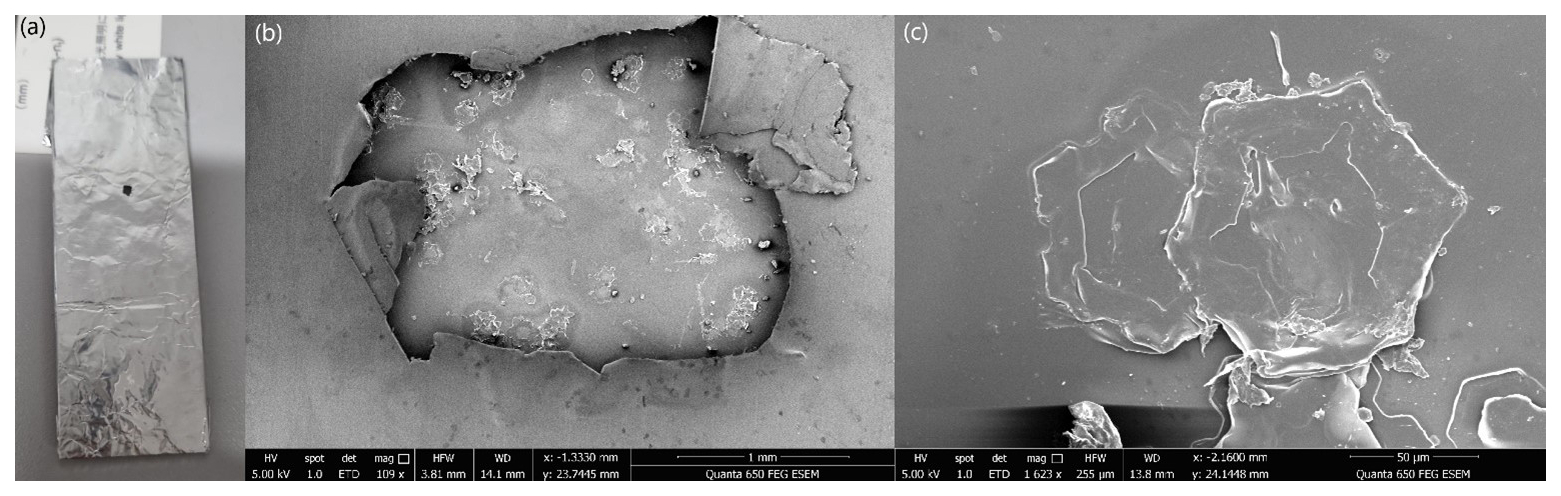
Figure 4SEM imaging steps described: (a) sample 73 covered with foil with an opening in it, (b) the selected area's SEM image and (c) close-up image of two hexagonal plates that overlap.
In order to distinguish artefacts from actual microstructural features, small areas of interest were chosen from the optical microscope examination and prepared for SEM imaging. Once each area was chosen, the whole slide was covered with foil, leaving a small hole approximately ∼ 1 mm2 in size in the foil, defining the area of interest (Fig. 4). This area was prepared by coating with gold, and the selected feature imaged.
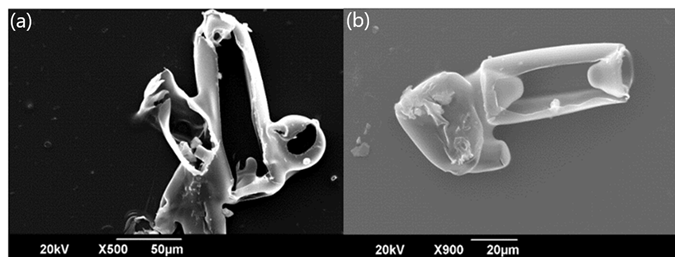
Figure 5SEM images of the ice crystals which did not sink fully into the formvar solution and consequently each replica is missing much of its upper surface.
In total, eight samples were prepared for this preliminary investigation, and were imaged with varying zoom scales during three different SEM sessions. It was observed that a significant portion of the features are artefacts of the formvar process (Fig. 5). That is the crystals did not form complete 3-dimensional replicas. One reason for this was considered to be the thin layer of formvar delivered by brushing it onto the slide, so there was insufficient depth for the crystals to be fully covered, or the crystal morphology prevented it sinking sufficiently for full cover. Finally, we had to consider whether the formvar material might start to deform after or whilst the ice crystals evaporated. A relatively simple workaround for many of these problems was to increase the depth of the formvar solution layer by constructing a container to enable a pool of formvar to cover the slide, deep enough to capture the majority of single crystals, though this has consequences in terms of the evaporation rate.
3.1 Validation using salt crystals
Though the procedure described in Sect. 2 allows us to measure the roughness of ice crystals, an essential step was to ensure that the roughness values obtained from a replica are the same as would be measured from the crystal itself, that is to confirm that the formvar replica did not deform. To this end, the process was repeated with table salt (sodium chloride) crystals as a validation source, though with slight adaptations. Initially, the brush technique was employed to create replicas to investigate surface structure. However, after analysis with the optical profilometer, we found that the remaining surface details were incomplete or degraded as shown in Fig. 6. These features did not provide any useful information about the surface characteristics, leading us to refine our approach. Therefore, we applied the formvar pool method discussed in the methodology to produce further samples.
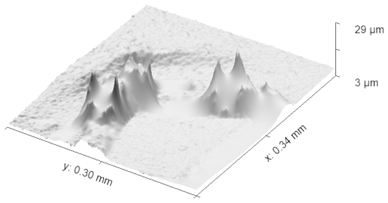
Figure 6Surface scanning, using an optical profilometer, of a replica of salt crystal created by using brush technique. The image reveals incomplete or distorted surface details due to limitations of the brush technique, which failed to capture fine structural features accurately. This led to the refinement of the replication method.
Once the chloroform had evaporated from the formvar solution, the formvar left behind a replica of the salt crystal. At this stage though, the salt crystals remain and so must be removed by being dissolved in water. For this, the sample the slide was gently placed in a water bath and left for 15 min until the salt dissolved and could be washed away. With the salt removed from the sample, only the replica shell remained, and it was scanned with the optical profilometer. In addition, salt crystals from the same container were placed directly on a microscope slide and imaged and analysed in the same manner.
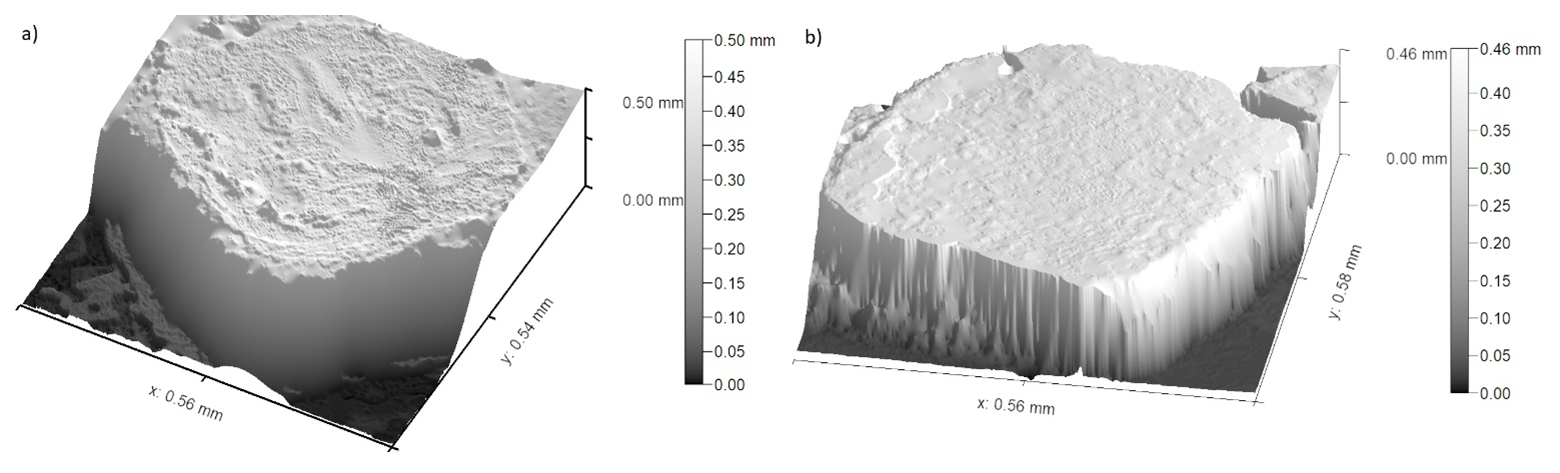
Figure 7(a) Scan of a randomly chosen salt crystal without formvar solution application. (b) Scan of a randomly chosen formvar shell after salt crystal removal. Both were taken with an optical profilometer.
The image in Fig. 7a, shows the result scanning of a sample salt crystal without the application of formvar whereas Fig. 7b shows the result of the replica formvar process. In a comparison of both images, it can be seen that a sufficient depth of formvar allowed the full surface of the crystal to be imaged and complete scan of the surface retrieved. This demonstrates our method's ability to capture the surface features effectively and provides a clear comparison of replicated surfaces despite the fact the sample salt crystals were not those subsequently covered in formvar and were randomly chosen. This random choice is due to the granular and indistinguishable nature of table salt, and therefore, it was not possible to precisely identify the exact same salt samples to reuse them for replication process. Despite this, the low variation between the two sets of results indicates that this method yields consistent and reliable results across different salt crystals. The results of the comparative roughness analysis of four salt crystals and four independent replicas are shown in Table 1.
Table 1One-dimensional roughness parameters of four salt crystals and four salt crystal replica samples.
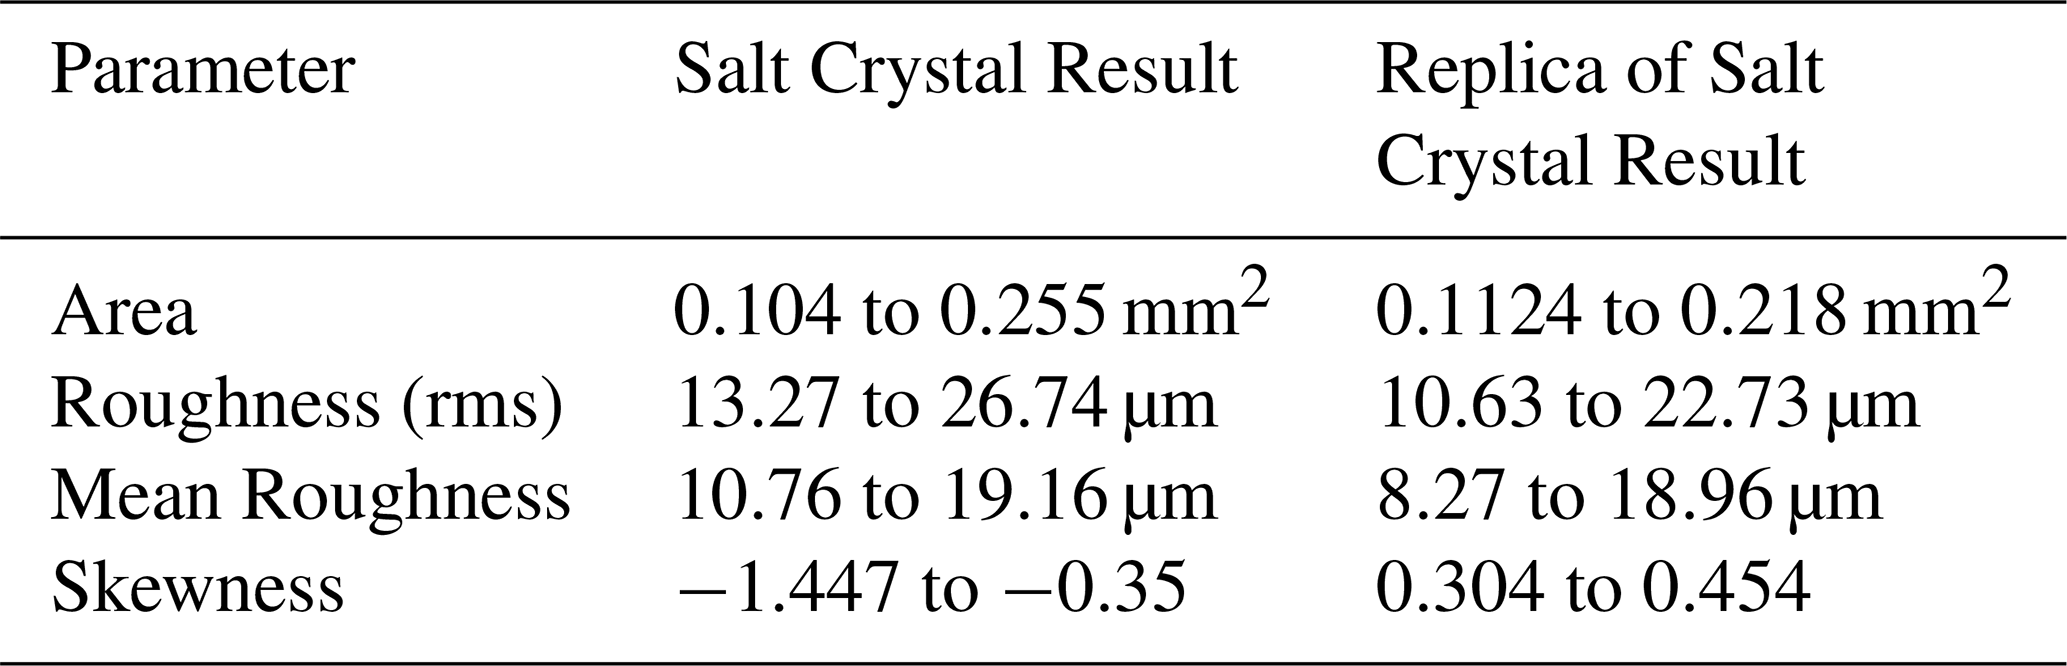
From Table 1, we can see that the formvar replica process retains the roughness parameter measurement of the original salt crystal with a good level of accuracy. The deviation between the two samples is less than 5 % when scanning of similar-sized surface regions are compared, which gives confidence that the measurement technique can represent underlying roughness parameters when it is applied to ice crystals. It should also be noted that salt crystals exhibit a range of roughness values, with the largest being approximately twice as large as the smallest in our samples. This variability in roughness is also reflected in the replicas, despite the random selection of salt particles for measurement. These results provide confidence that the formvar replica technique can be applied effectively to characterize roughness parameters of ice crystals.
The linear profiles used for roughness measurement were selected from full surface scans of each crystal, to make sure that all surface features were included. Although increasing the sample size would provide more robust statistical confidence, the use of four randomly chosen salt crystals provide a reasonable basis for comparison as they covered a full range of surface features. Skewness was measured using Gwyddion software, which calculated the surface asymmetry based on the height distribution of the features across the scanned profile, providing additional insight into the surface texture. A positive skewness indicates a surface dominated by peaks, while a negative skewness suggests deeper valleys. The observed skewness differences highlight variations in surface texture, which may influence properties such as adhesion, wettability, or mechanical interactions. In addition, as the formvar replica represents a negative imprint of the original crystal surface, peaks and valleys are interchanged which can naturally result in opposite signs of the skewness. Also, as a final check to make sure that these values are not significantly affected by the presence of formvar itself, a formvar surface with no crystals present was also scanned and analysed, the rms roughness in this case being found to be 175 nm. This is orders of magnitude less than the values obtained in Table 1, supporting our assertion that the parameters retrieved from replicas are close to those for the original crystals.
3.2 Retrieval of Ice Crystal Roughness Parameters
Roughness parameters for ice crystals produced in the Manchester Ice Cloud Chamber (MICC) were explored following the procedures described in the methodology section. As a proof of concept for an experimental technique, rather than a full treatise of ice crystal roughness, a single temperature (−20 °C) was chosen for cloud formation and an ice cloud was produced. In the cloud generation chamber, temperature is carefully controlled and then nucleation initiated via adiabatic expansion of a compressed air line controlled by a solenoid valve (Smith et al., 2015a), allowing water vapor to condense and form ice crystals. Throughout this study, only one set of environmental conditions is used. These crystals then fall and exit through an opening at the bottom of the chamber, where they were captured, and replicas were created. The replicas were inspected with an optical profilometer rather than the SEM described for early investigations due to improved speed, access and non-contact aspects of the method.
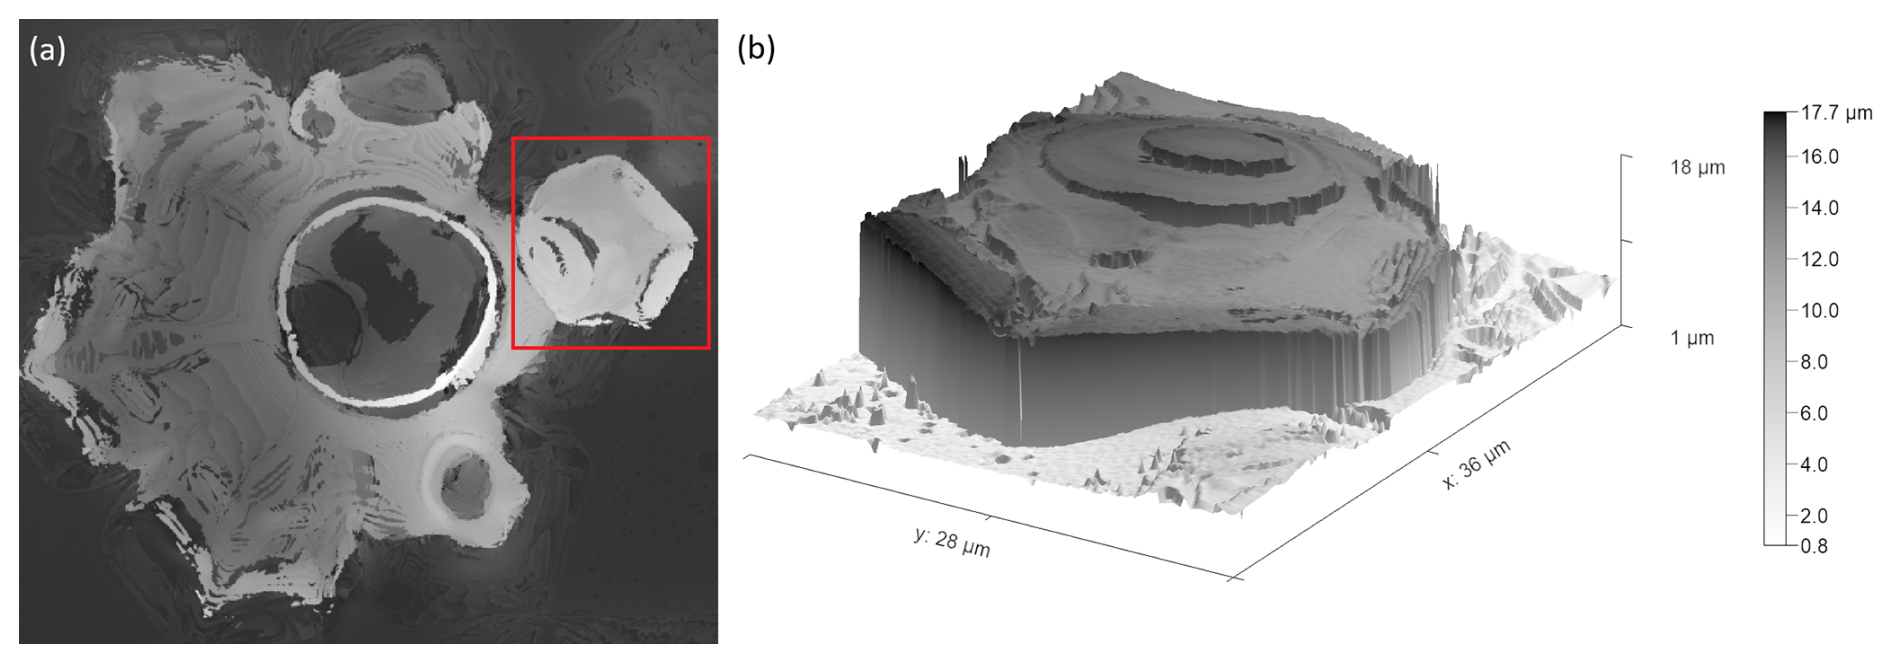
Figure 8(a) One plate sits on another crystal marked with a red square. (b) Detail of surface scan of crystal highlighted by red square. Both scans were taken with an optical profilometer.
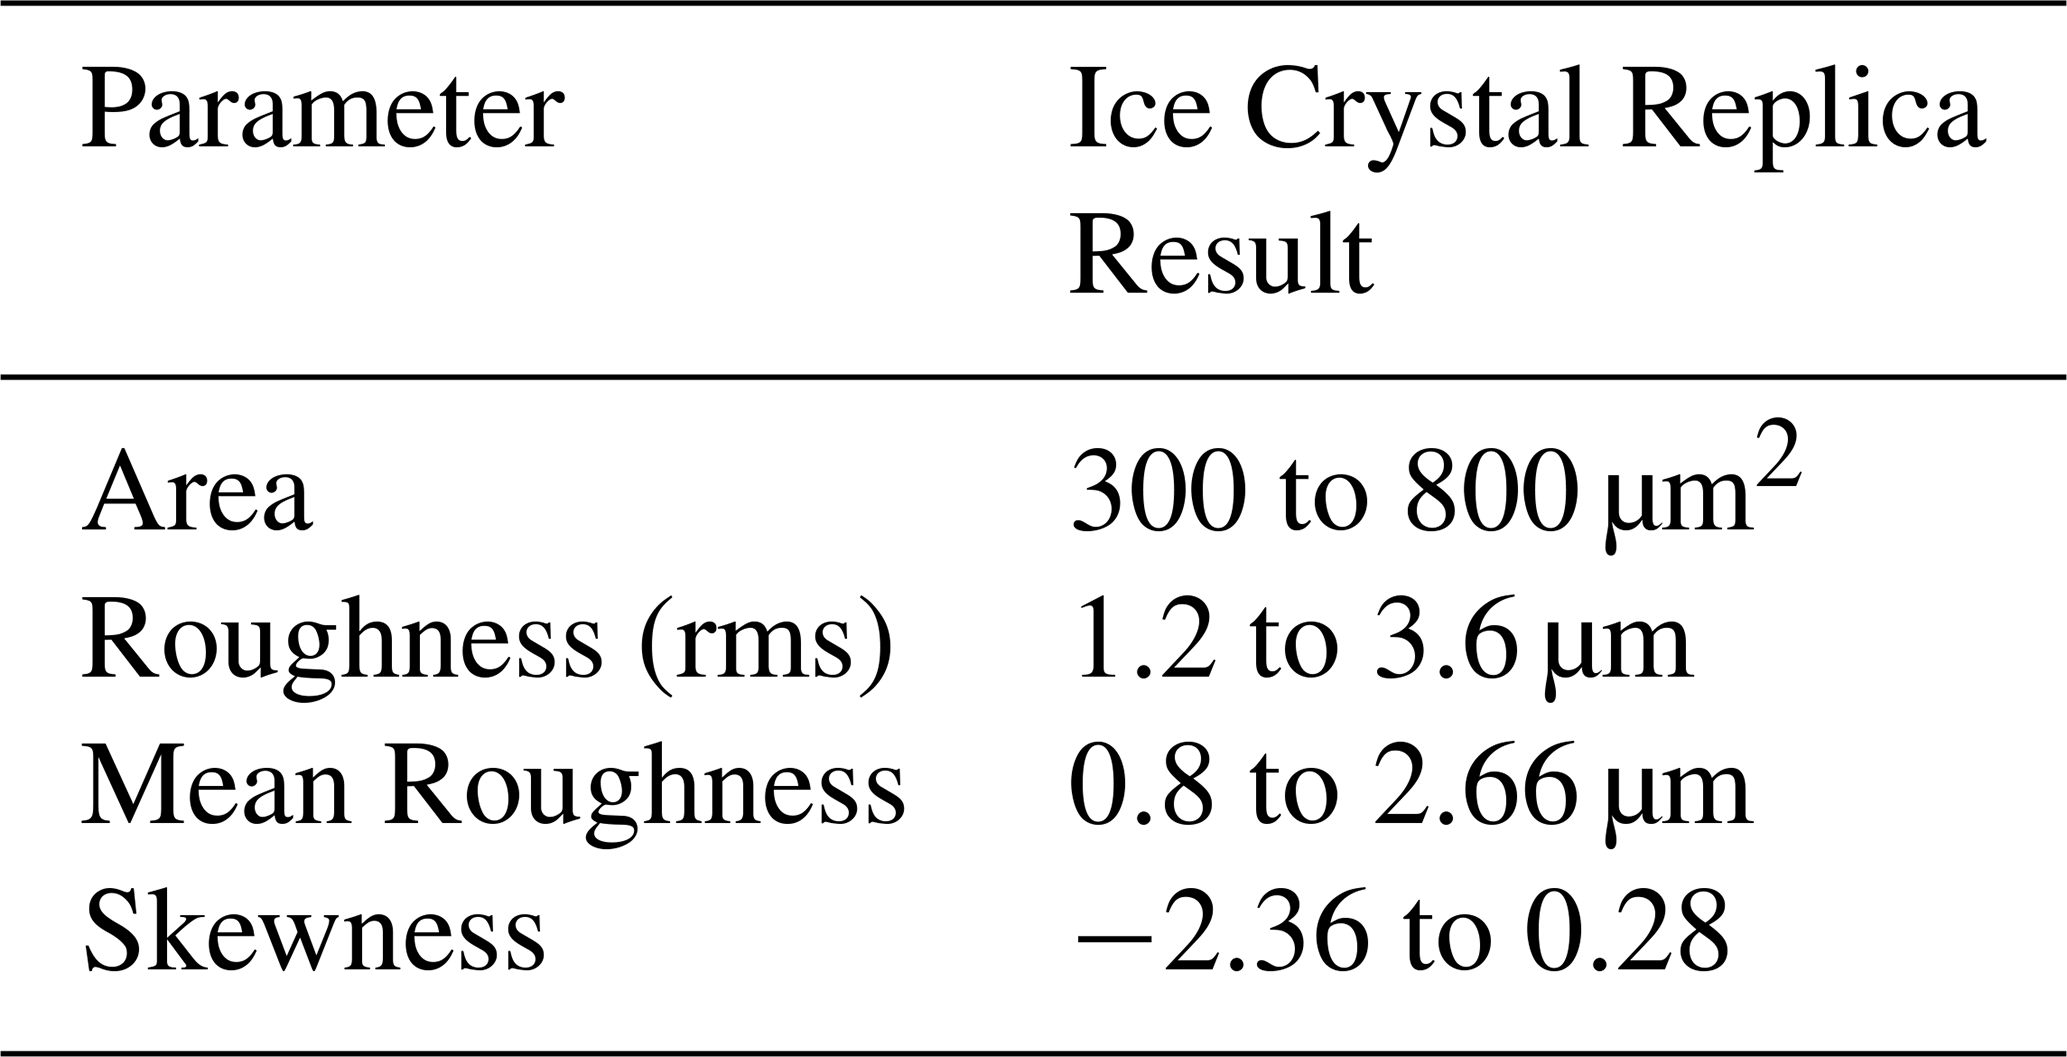
An example crystal replica is shown in Fig. 8, visually demonstrating that it is possible to capture the detailed surface features and shape of ice crystals with formvar. Multiple ice crystals were analysed using the same software, Gwyddion, to calculate roughness parameters and ascertain a range for the different variables. These results are shown in Table 2.
In using formvar to create ice crystal replicas, we were aware of the process of chemical etching which has been recognized as a potential source of error in formvar replicas, as discussed in the previous studies (Sinha, 1977, 1978). This occurs when water molecules which are weakly bonded can go into the formvar solution and leave artefacts called “etch-pits” that could then be erroneously identified as crystal roughness. While we acknowledge these artefacts as a critical potential factor, we did not observe etching pits in our analysis. Lastly, occasional cracks and small holes were observed in the formvar, and so roughness measurements were taken from the regions where such features were not present. These imperfections may have provided a pathway for the melted water to escape as fully enclosed replicas were not observed.
Roughness parameters were then compared over 35 randomly chosen areas from four different crystal surface scans to establish a correlation with the length parameter, L (side length of the area scanned). By selecting various regions of the ice crystal surface, roughness can be analysed at different scales to provide a more detailed assessment of surface variability. In this study, multiple areas of different length parameter were chosen to capture localized variations, and their roughness values were statistically compared in order to consider different types of structural feature. The results, presented as a box and whiskers plot in Fig. 9, demonstrate the roughness distributions for each selected area, highlighting trends and potential correlations with the length parameter.
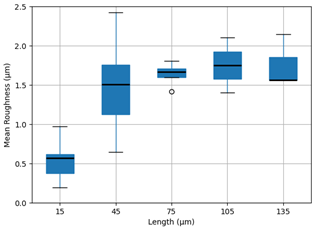
Figure 9Statistical comparison of length (µm) vs. mean-roughness values (µm) across multiple selected areas of multiple ice crystals' surfaces (n = 7 for each size bin). Circle indicates outlier.
In general, this distribution can be further simplified to show the correlation between length and roughness parameters. As the length increases, less frequent and larger features on the ice crystal surface are more likely to be captured and contribute to higher roughness values. The mean roughness plateaus at about 1.7 µm, indicating a limit to the small-scale roughness, with larger surface areas not capturing any greater roughness features.
As before with the salt crystal analysis a range of roughness values are seen in the samples, though the range among mean-roughness for each size bin (side length of chosen area) is not quite so large for our ice samples, only varying by a factor of 1.5 to 1.8 over most of the size bins. However, we acknowledge that the environmental conditions are expected to have a significant effect on the roughness of ice crystals, particularly the supersaturation of the environment in which they form, and we have presented results from a single set of controlled conditions in developing this technique. Collier et al. (2016) used the roughness parameters of sand particles as a proxy for model work for asymmetry parameter calculations, yet it is encouraging that findings are relatively close to the parameters in that work. Their two-scale roughness approach was applied to crystals with a size of 32.5 µm, which lies between our lengths 15 and 45 µm. The mean roughness of sand particles from Collier et al. (2016) for the large-scale features was measured at 1.08 µm, while the mean roughness for the small-scale features was measured at 0.13 µm which is approximately the lowest value that we observed from ice crystal replicas with our smallest length scale of 15 µm. In any event roughness will significantly affect the scattering behaviour of the crystals (Collier et al., 2016), and this is often an underappreciated effect. In simple terms it can explain the relatively rare observance of halos in thin cirrus (Smedley, 2003; Forster and Mayer, 2022).
We stress that our study is a proof-of-concept study, and we anticipate that ice crystal roughness will vary with temperature, habit, and supersaturation. This variability is especially significant in high-altitude cirrus clouds and turbulent cumulus clouds, where the irregularities in ice crystals can lead to increased roughness, significantly impacting light scattering and the overall optical properties of the clouds. Increased roughness can lead to higher scattering efficiencies and smaller asymmetry parameters (Ulanowski et al., 2006), affecting the amount of solar radiation reflected back into space and complicating satellite retrievals of cloud properties. The method presented here can be repeated under varying conditions which would provide an effective way to map the surface characteristics of ice crystals across different environmental conditions. By applying this technique to varying atmospheric settings, we can better understand how roughness evolves, which is essential for improving satellite observations, enhancing cloud property retrievals, and refining climate models that rely on precise knowledge of cloud dynamics.
While this method was developed in a laboratory setting, it could potentially be adapted for airborne campaigns, once challenges of delivering the cloud particles to a protected formvar slide are overcome. The lower pressure available at altitude will assist rapid enough drying of the formvar and could be aided by slightly thinner coatings. Additionally, this method can be employed at high-altitude ground-based stations often situated within cloud, allowing for the collection of samples directly from natural clouds. Such efforts are essential, as they can improve our understanding of cloud feedback mechanisms and the intricate details of roughness, ultimately contributing to a more comprehensive understanding of the net energy balance in the atmosphere.
This method offers high-resolution and provides detailed structural information on ice crystal surface roughness despite the manual input required and the relatively limited ice crystal samples, compared with optical instruments like SID-3. While SID-3 is effective for airborne measurements, it gives an indirect measure of structure and roughness (Ulanowski et al., 2014), while our offline approach allows for more precise analysis of surface roughness in a controlled environment. The two methods complement each other, with laboratory work providing detailed insight into ice crystal surface structure that can enhance future airborne studies.
Lastly, in terms of general roughness, observing similar results between salt crystals and their replicas is important to ensure that this method can be used as a reliable proof-of-concept for future studies. While our current analysis simply uses one-dimensional roughness data, this study demonstrates the potential of this method to be improved and expanded to capture more comprehensive roughness characteristics. The consistency in roughness trends observed, despite the 1D measurement limitations, suggests that this method can be the basis for understanding ice crystal surface roughness. By building upon these results, we anticipate that future modifications in this technique will enable more precise evaluations by extracting detailed roughness information to express crystal surface complexity under varying conditions.
According to the IPCC report (2013), cloud models are inadequate for informing climate change models, which hinders the ability of models to provide accurate climate change predictions. Improvements are necessary in many aspects, especially with regard to cloud microphysical properties. The microphysical properties directly impact scattering characteristics. By representing the conditions of ice clouds accurately within models, reliability in predictions can be enhanced. While previous studies have extensively examined the shape and habits of ice particles, this study solely concentrates on a method for roughness parameter retrieval, leaving exploration of the effect of environmental conditions on roughness formation to future investigations.
In calculating roughness parameters, this formvar technique, combined with modern imaging opportunities, offers novel possibilities for direct measurement of the roughness, despite its being based on an older technique (Agar and Revell, 1956). Roughness makes a critical contribution to scattering properties (Ulanowski et al., 2014). Therefore, accurately determining roughness parameters can improve the prediction of scattering outcomes, which in turn can enhance cloud models and make their feedback to climate models more precise. Our method has resulted in the successful creation of ice crystal replicas, and their imaging and analysis at roughness scales by profilometer. The accuracy of the roughness parameters derived was validated through a comparative analysis using salt crystals, where the integrity of the crystals could be maintained independently of the formvar. This indicated that the roughness parameters found with our methodology have an uncertainty of no more than 5 % to 6 % between the similar-size areas, where some of this uncertainty may be natural variation in the salt crystals.
A critical aspect of this study lies in its innovative integration of established techniques with cutting-edge instruments, which enables the extraction of valuable information on ice crystal roughness parameters. This research provides a detailed method for capturing and visualizing ice crystals captured in formvar using an optical profilometer, ensuring that key surface characteristics are preserved. Through comprehensive scanning, we have measured the mean roughness parameter for crystals created at −20 °C, which converges to a value of 1.7 µm as area increases, corresponding to length scales greater than 45 µm, in agreement with earlier work by Collier et al. Future studies may expand the surface measurement of replicas to provide additional roughness descriptors used in radiative-transfer and scattering simulations.
The current work has shown that ice crystals representative of those in cirrus can be replicated and imaged in a manner that can identify and quantify roughness scale-features on the surface, thus far one-dimensionally. Further developing the imaging and analysis techniques would enable retrieval of roughness parameters that represent two-dimensional anisotropic rough surfaces, to be used in scattering simulations (e.g., using ray tracing or discrete-dipole approximations) to evaluate the effect of roughness on phase functions and asymmetry parameters. Further comparison with both laboratory data and in-situ measurements of scattering, will confirm the relevance of roughness to scattering behaviour. This work provides a method to not only enhances our understanding of cloud microphysics but also contribute to improvement of models that simulate radiative transfer of ice clouds, one of the crucial components for weather prediction and climate analysis. By bridging the gap between theoretical models and real-world observations, this technique can play a key role in advancing our comprehension of cloud dynamics and their influence on the Earth's climate system.
The Python code used to in this study is available from the corresponding author upon request.
The data used to support the findings of this study are available from the corresponding author upon request.
Omer Celebi conceptualized and designed the study, conducted all data collection, analysis, and interpretation, and drafted the manuscript. Ann R. Webb, Paul Connolly and Andrew R. D. Smedley provided guidance, supervision, and critical revisions of the manuscript.
The contact author has declared that none of the authors has any competing interests.
Publisher's note: Copernicus Publications remains neutral with regard to jurisdictional claims made in the text, published maps, institutional affiliations, or any other geographical representation in this paper. The authors bear the ultimate responsibility for providing appropriate place names. Views expressed in the text are those of the authors and do not necessarily reflect the views of the publisher.
This research was supported by a scholarship from the Ministry of National Education, Türkiye. The authors would like to thank Isa Guleryuz for his valuable support and guidance throughout the PhD and scholarship programme. The first author wrote the manuscript and improved the language with the help of generative AI. All other authors, who are native English speakers, reviewed and further improved the language of the manuscript.
This paper was edited by Maximilian Maahn and reviewed by Alexey Kiselev and one anonymous referee.
Agar, A. W. and Revell, R. S.: A study of the formvar replica process, British Journal of Applied Physics, https://doi.org/10.1088/0508-3443/7/1/305, 1956.
Bailey, M. P. and Hallett, J.: A comprehensive habit diagram for atmospheric ice crystals: confirmation from the laboratory, AIRS II, and other field studies, J. Atmos. Sci., 66, 2888–2899, https://doi.org/10.1175/2009JAS2883.1, 2009.
Baran, A. J., Hill, P., Walters, D., Hardiman, S. C., Furtado, K., Field, P. R., and Manners, J.: The impact of two coupled cirrus microphysics–radiation parameterizations on the temperature and specific humidity biases in the tropical tropopause layer in a climate model, J. Climate, 29, 5299–5316, https://doi.org/10.1175/JCLI-D-15-0821.1, 2016.
Butterfield, N., Rowe, P. M., Stewart, E., Roesel, D., and Neshyba, S.: Quantitative three-dimensional ice roughness from scanning electron microscopy, Journal of Geophysical Research: Atmospheres, 122, 3023–3041, https://doi.org/10.1002/2016JD026094, 2017.
Collier, C., Hesse, E., Taylor, L., Ulanowski, Z., Penttila, A., and Nousiainen, T.: Effects of surface roughness with two scales on light scattering by hexagonal ice crystals large compared to the wavelength: DDA results, J. Quant. Spectrosc. Radiat. Transf., 182, 225–239, https://doi.org/10.1016/j.jqsrt.2016.06.007, 2016.
Connolly, P. J., Saunders, C. P. R., Gallagher, M. W., Bower, K. N., Flynn, M. J., Choularton, T. W., Whiteway, J., and Lawson, R. P.: Aircraft observations of the influence of electric fields on the aggregation, Quarterly Journal of the Royal Meteorological Society, 131, 1695–1712, https://doi.org/10.1256/qj.03.217, 2005.
Finnegan, W. G. and Pitter, R. L.: Atmospheric ice crystal processes. Nonlinear Optical Beam Manipulation, Beam Combining, and Atmospheric Propagation, SPIE, Los Angeles, https://doi.org/10.1117/12.943866, 1988.
Forster, L. and Mayer, B.: Ice crystal characterization in cirrus clouds III: retrieval of ice crystal shape and roughness from observations of halo displays, Atmos. Chem. Phys., 22, 15179–15205, https://doi.org/10.5194/acp-22-15179-2022, 2022.
Gadelmawla, E. S., Koura, M. M., Maksoud, T. M., Elewa, I. M., and Soliman, H. H.: Roughness parameters, Journal of Material Processing Technology, 123, 133–145, https://doi.org/10.1016/S0924-0136(02)00060-2, 2002.
Griggs, D. and Jayaratne, E.: The replication of ice crystals using formvar: techniques and precautions, J. Atmos. Ocean. Technol., 3, 547–551, https://doi.org/10.1175/1520-0426(1986)003<0547:TROICU>2.0.CO;2, 1986.
Gwyddion: Free SPM data analysis software, https://gwyddion.net/ (last access: 26 March 2026), 2004.
Intergovernmental Panel on Climate Change (IPCC): Climate change 2013, Cambridge University Press, Cambridge, https://doi.org/10.1017/CBO9781107415324, 2013. Intergovernmental Panel on Climate Change (IPCC): Climate Change 2023: Synthesis Report, IPCC, Geneva, https://doi.org/10.59327/IPCC/AR6-9789291691647, 2023.
Järvinen, E., Wernli, H., and Schnaiter, M.: Investigations of Mesoscopic Complexity of Small Ice Crystals in Midlatitude Cirrus, Geophys. Res. Lett., 45, 11, https://doi.org/10.1029/2018GL079079, 2018.
Kahler, H., Lloyd, B. J., and Eden, M.: Electron microscopic and other studies on a copper-cystine complex, J. Phys. Chem., 56, 768–770, https://doi.org/10.1021/j150498a029, 1952.
Kawamura, P. I. and Mackay, D.: The evaporation of volatile liquids, J. Hazard Mater., 15, 343–364, https://doi.org/10.1016/0304-3894(87)85034-3, 1987.
Libbrecht, K. G.: The physics of snow crystals, Reports on Progress in Physics, 68, 855–895, https://doi.org/10.1088/0034-4885/68/4/R03, 2005.
Linstrom, P. J. and Mallard, W. G.: NIST Chemistry WebBook, NIST Standard Reference Database Number 69, National Institute of Standards and Technology, https://webbook.nist.gov/cgi/cbook.cgi?ID=C67663, last access: 26 March 2026.
Magee, N. B., Miller, A., Amaral, M., and Cumiskey, A.: Mesoscopic surface roughness of ice crystals pervasive across a wide range of ice crystal conditions, Atmos. Chem. Phys., 14, 12357–12371, https://doi.org/10.5194/acp-14-12357-2014, 2014.
Magono, C. and Lee, C. W.: Meteorological classification of natural snow crystals, Journal of the Faculty of Science, Hokkaido University, Series, 7, Geophysics, 2, 321–335, 1966.
Miloshevich, L. M. and Heymsfield, A. J.: A balloon-borne continuous cloud particle replicator for measuring vertical profiles of cloud microphysical properties: instrument design, performance, and collection efficiency analysis, J. Atmos. Ocean. Technol., 14, 753–768, 1997.
Rucklidge, J.: The examination by electron microscope of ice crystal nuclei from cloud chamber experiments, J. Atmos. Sci., 301–308, https://doi.org/10.1175/1520-0469(1965)022<0301:TEBEMO>2.0.CO;2, 1965.
Saunders, C. P. and Wahab, N. M.: The influence of electric fields on the aggregation of ice crystals, Journal of the Meteorological Society of Japan, Ser., I, 2, https://doi.org/10.2151/jmsj1965.53.2_121, 1975.
Schaefer, V. J.: A method for making snowflake replicas, Science, 93, 239–240, https://doi.org/10.1126/science.93.2410.239, 1941.
Sinha, N.: Dislocations in ice as revealed by etching, Philosophical Magazine, 36, 1385–1404, https://doi.org/10.1080/14786437708238524, 1977.
Sinha, N.: Observation of Basal Dislocations in Ice by Etching and Replicating, Journal of Glaciology, 21, 385–395, https://doi.org/10.3189/S0022143000033554, 1978.
Smedley, A. R. D.: Spectral scattering properties of cloud types, PhD thesis, University of Manchester, Manchester, UK, 2003.
Smith, H. R., Connolly, P. J., Baran, A. J., Hesse, E., Smedley, A. R. D., and Webb, A. R.: Cloud chamber laboratory investigations into scattering properties of hollow ice particles, J. Quant. Spectrosc. Radiat. Transf., 157, 106–118, https://doi.org/10.1016/j.jqsrt.2015.02.015, 2015a.
Smith, H. R., Connolly, P. J., Webb, A. R., and Baran, A. J.: Exact and near backscattering measurements of the linear depolarisation ratio of various ice crystal habits generated in a laboratory cloud chamber, J. Quant. Spectrosc. Radiat. Transf., 178, 361–378, https://doi.org/10.1016/j.jqsrt.2016.01.030, 2015b.
Ulanowski, Z., Hesse, E., Kaye, P. H., and Baran, A. J.: Light scattering by complex ice-analogue crystals, J. Quant. Spectrosc. Radiat. Transf., 100, 1–3, https://doi.org/10.1016/j.jqsrt.2005.11.052, 2006.
Ulanowski, Z., Kaye, P. H., Hirst, E., Greenaway, R. S., Cotton, R. J., Hesse, E., and Collier, C. T.: Incidence of rough and irregular atmospheric ice particles from Small Ice Detector 3 measurements, Atmos. Chem. Phys., 14, 1649–1662, https://doi.org/10.5194/acp-14-1649-2014, 2014.
Voigtländer, J., Chou, C., Bieligk, H., Clauss, T., Hartmann, S., Herenz, P., Niedermeier, D., Ritter, G., Stratmann, F., and Ulanowski, Z.: Surface roughness during depositional growth and sublimation of ice crystals, Atmos. Chem. Phys., 18, 13687–13702, https://doi.org/10.5194/acp-18-13687-2018, 2018.
Warburton, J. A., Keyser, G., and Purcell, R. G.: A Portable Ice Crystal Replicator For Use In Snowfall Transmission Studies, Optical Engineering for Cold Environments, 0414, Arlington, https://doi.org/10.1117/12.935862, 1983.