the Creative Commons Attribution 4.0 License.
the Creative Commons Attribution 4.0 License.
 | 22 Apr 2026
Evaluation of different sampling methods to determine the ice-nucleating particle concentration in the atmosphere using the GRAnada Ice Nuclei Spectrometer (GRAINS)
Olga Ruiz-Galera
Lucas Alados-Arboledas
Alexander Böhmländer
Kristina Höhler
Najin Kim
Larissa Lacher
Ottmar Möhler
Frascisco José Olmo
German Perez Fogwill
Ana A. Piedehierro
Nsikanabasi Silas Umo
André Welti
Alberto Cazorla
This work deals with the analysis of different filter sampling methods to obtain INP concentration spectra using the GRAnada Ice Nuclei Spectrometer (GRAINS), a droplet freezing array based on the design of the Colorado State University Ice Spectrometer (CSU-IS) but with droplet volumes of 100 µL. GRAINS was first validated with NX Illite, showing spectra consistent with literature, and also compared with FrESH (Freezing Experiment Setup Helsinki), INSEKT (Ice Nucleation Spectrometer of the Karlsruhe Institute of Technology), and PINE (Portable Ice Nucleation Experiment) for aerosol standards as well as ambient samples, with results generally within confidence intervals or a factor of 5. To assess the filter sampling methods, we simultaneously sampled ambient aerosol on polycarbonate filters (commonly used for INP analysis) and microfiber quartz filters (used for chemical analysis) over three months, with 27 filters of each type. Three analysis approaches were tested: washing the polycarbonate filters (Polycarbonate method), randomly punching the quartz filters (Quartz 96-punch method), and washing a larger punch of the quartz filter (Quartz punch washed method). Our results showed a good performance of the three methods, obtaining similar results for the INP concentrations, with approximately 89 % of the data within a factor of 5. Differences between methods become more evident at lower temperatures, with higher INP concentrations detected with both Quartz methods compared to the Polycarbonate method, which could be related to the particle extraction efficiency of this method. Differences between the three methods varied depending on the sample, with general good agreement for polluted and background conditions and different levels of agreement for dust particles. Still, there is a clear correlation between the three methods, with Spearman's coefficients of around 0.9 (p<0.05). The Quartz punch washed method allows to perform sample dilutions similar to the Polycarbonate method, making it a potential alternative to the Quartz 96-punch method for analyzing INP concentrations using quartz filters.
- Article
(3249 KB) - Full-text XML
-
Supplement
(1975 KB) - BibTeX
- EndNote


Atmospheric aerosol particles can affect the Earth's radiative budget by means of their interaction with radiation and with clouds (Boucher et al., 2013). Aerosol-cloud interactions (ACI) cover the ability of aerosol particles to act as cloud condensation nuclei (CCN) or ice-nucleating particles (INPs), allowing the formation of droplets and ice crystals in clouds. The different properties of aerosol particles regarding their origin, size or chemical composition have a direct impact on cloud properties, affecting their albedo and lifetime and influencing the precipitation ability of the cloud. Therefore, the large variability in aerosol particles that become effective CCN and INP causes large uncertainties in the ACI's radiative forcing (Forster et al., 2021), making the study of these aerosol particles essential for a better characterization of climate predictions. In fact, INPs play a crucial role in cloud properties, since the ice phase is responsible for the majority of precipitation over land in mixed-phase clouds (Heymsfield et al., 2020; Lau and Wu, 2003; Mülmenstädt et al., 2015). Several mechanisms have been described for ice crystal formation aided by an INP, with immersion freezing being the one that predominates in mixed-phase clouds (de Boer et al., 2010; Hoose et al., 2010; Kanji et al., 2017; Murray et al., 2012; Westbrook and Illingworth, 2013). Thus, the characterization of the INP concentration in the atmosphere by immersion freezing is essential to improve the understanding of cloud formation.
Over the past years, there have been many developments in immersion freezing instruments for the study of INPs in the atmosphere. Some of them are online techniques, such as Continuous Flow Diffusion Chambers (CFDC; Rogers, 1988) or cloud expansion chambers like the Portable Ice Nucleation Experiment (PINE; Möhler et al., 2021), in which the INP concentration can be measured in real time with a high temporal resolution. However, the majority of instruments to study INPs are offline techniques, mainly due to the simpler and less expensive instrumentation involved. In particular, one of these offline techniques are droplet freezing arrays, which cool down droplets of an aqueous solution containing INPs until they freeze (Creamean et al., 2025; David et al., 2019; Ladino et al., 2022; Wang et al., 2025; Wieber et al., 2024). Although these techniques have a lower temporal resolution, they allow for the study of INP concentrations at higher temperatures. For the study of INPs with the use of droplet freezing arrays, the aerosol particles are commonly sampled onto filters prior to the analysis of the INP concentration (e.g., Córdoba et al., 2021; Schneider et al., 2021). Since these techniques quantify the INP concentration via analysis with different instruments, each instrument operates with different settings, such as droplet volume and cooling rate, it is necessary to assure the equivalence between offline instruments. To test the agreement between instruments, the ice nucleation ability of standard samples is often studied, such as K-Feldspar (Atkinson et al., 2013) or Snomax® (Wex et al., 2015). More recently, NX Illite was used as a reference sample for the validation of newly developed droplet freezing arrays (David et al., 2019; Wieber et al., 2024) or the intercomparison of several ice nucleation instruments (DeMott et al., 2018; Hiranuma et al., 2015). Several studies have also focused on the comparability of different instruments when quantifying INP concentrations in the atmosphere (DeMott et al., 2025; Lacher et al., 2024). DeMott et al. (2025) compared six different devices (two online devices and four offline devices), obtaining agreement between instruments with comparison factors between 5 and 10, but which could lead to substantial differences in freezing temperatures. On the other hand, Lacher et al. (2024) performed an intercomparison of ten devices (three online instruments and seven offline instruments), where the majority of INP concentration data was within a comparison factor of 5, which makes the instruments suitable to derive model-relevant INP data. Therefore, for new instruments, which are typically developed by each research team, it is essential to properly characterize the ice nucleation activity of well-known samples as well as to perform intercomparison campaigns with well-established ice nucleation instruments to ensure a proper characterization of the INP concentration in the atmosphere.
In addition to the device itself, the sample substrate and the extraction technique used for subsequent analysis also require evaluation to ensure harmonized INP measurements. Among offline techniques, different methods are carried out for particle sampling. Among the most common methodologies for INP concentration determination is the sampling of particles on polycarbonate filters that are later washed in the laboratory with ultrapure water to create the suspensions. In the case of droplets freezing arrays that use Polymerase Chain Reaction (PCR) plates, this suspension is pipetted into the PCR plate wells (e.g., Garcia et al., 2012; Hill et al., 2014, 2016). This method allows to create dilutions of the sample in order to extend the measurable INP concentration range. Many studies also used quartz filters, typically used for chemical analysis, to obtain the INP concentration (e.g., Conen et al., 2012; Wex et al., 2019). To do so, quartz filters are randomly punched (∼1–2 mm diameter), and each small section of the filter is introduced in each well of the PCR plate and then filled with ultrapure water. This method, which is more time consuming for preparation and analysis than the polycarbonate filter washing method, does not allow for dilutions, so the temperature range is restricted to the activation properties of the most active INPs in the sample. Lacher et al. (2024) compared both approaches obtaining good agreement when sampling ambient aerosol particles, but the comparison was limited to only 4 samples. Additionally, some studies (Bras et al., 2024; Lacher et al., 2024) have also calculated INP concentration from quartz filters by washing a bigger punch (1.2 cm diameter) in water, with the use of the LINDA (LED-based Ice Nucleation Detection Apparatus; Stopelli et al., 2014) instrument. A comprehensive and extensive comparison of all three techniques is currently lacking in order to evaluate potential differences between filter substrates and particle extraction analysis methods.
In this work we evaluate different sampling and particle extraction methods for the analysis of INP concentrations with offline techniques in the laboratory. For that, we have simultaneously sampled ambient aerosol particles onto polycarbonate and quartz filters for a period of three months. The INP analysis was performed with the GRAnada Ice Nuclei Spectrometer (GRAINS), a new droplet freezing array developed at the Andalusian ObseRvatory of the Atmosphere (AGORA), based on the design of the Colorado State University Ice Spectrometer (CSU-IS; Hill et al., 2014, 2016). Prior to this, we evaluate the performance of GRAINS by analyzing the ice nucleation ability of NX Illite and running two inter-laboratory comparisons with well-established ice nucleation instruments, such as the Ice Nucleating particle Spectrometer of the Karlsruhe Institute of Technology (INSEKT; Schneider et al., 2021), the Freezing Experiment Setup Helsinki (FrESH; Perez Fogwill et al., 2024) and PINE (Möhler et al., 2021). Section 2 presents the description and technical details of GRAINS. Section 3 presents the methodological aspects involved in the sample preparation and the intercomparisons details. In Sect. 4 the main results are presented, starting with the performance of GRAINS for measuring the INP activity of NX Illite, followed by an intercomparison between GRAINS and FrESH, INSEKT and PINE, and also presenting the evaluation of different filter substrates (polycarbonate versus quartz) and extraction technique (96-punch or single punch). Finally, Sect. 5 presents the main conclusions and take-home messages for future intercomparisons exercises.
2.1 Description of the instrument
GRAINS is an offline immersion freezing device used to obtain the freezing spectra of aerosol particles immersed in small volumes of water. The instrument's design is based on the CSU-IS (Creamean et al., 2025; Hill et al., 2014, 2016) and the INSEKT (Schneider et al., 2021).
The main part of GRAINS (Figs. 1 and S1 in the Supplement) consists of an aluminum block that has space for two 96-well PCR plates (VWR®, Cat. no. 732-3762), in which the samples are pipetted. The usual droplet volume of GRAINS is 100 µL, which was selected for a better detection of the freezing events. Compared to other lower volumes used in many devices, this volume has implications in the limit of detection (LOD) of the instruments and, hence, the probability of detecting rare INPs. The aluminum block has a cavity inside that ends with two outlets of 3 cm in diameter, which are connected to a thermostat (LAUDA RP 250 E) that uses ethanol as a working fluid. The block is filled with ethanol, as well as the space between the block and the PCR plate wells, so it ensures an efficient heat transfer to the PCR plates. The block is placed inside a polymethyl methacrylate (PMMA) box, with a transparent lid on top to maintain the temperature around the block and the PCR plates. The space between the box and the aluminum block is covered with sheets of XPS extruded polystyrene foam (DANOPREN 500) for thermal isolation. The temperature during a typical experiment is monitored with a Pt100 probe (RTD PT100 RS PRO, Cat. no. 123-5595), which is placed inside the block in the region between both PCR plates. The remaining space between the block and the Pt100 sensor is filled with thermal silicone, ensuring an enhanced heat transfer. GRAINS has a camera (ELP USB8MP02G-SFV (5-50)) placed perpendicular to the block and the PCR plates to monitor the freezing events by taking pictures of the wells with the decreasing temperature. Both the thermostat and the camera are controlled by a custom-made Python program. The frequency at which the temperature and the images are registered is adjustable. In a typical experiment it is set to a frequency of 0.2 Hz and a cooling rate of 1 K min−1.
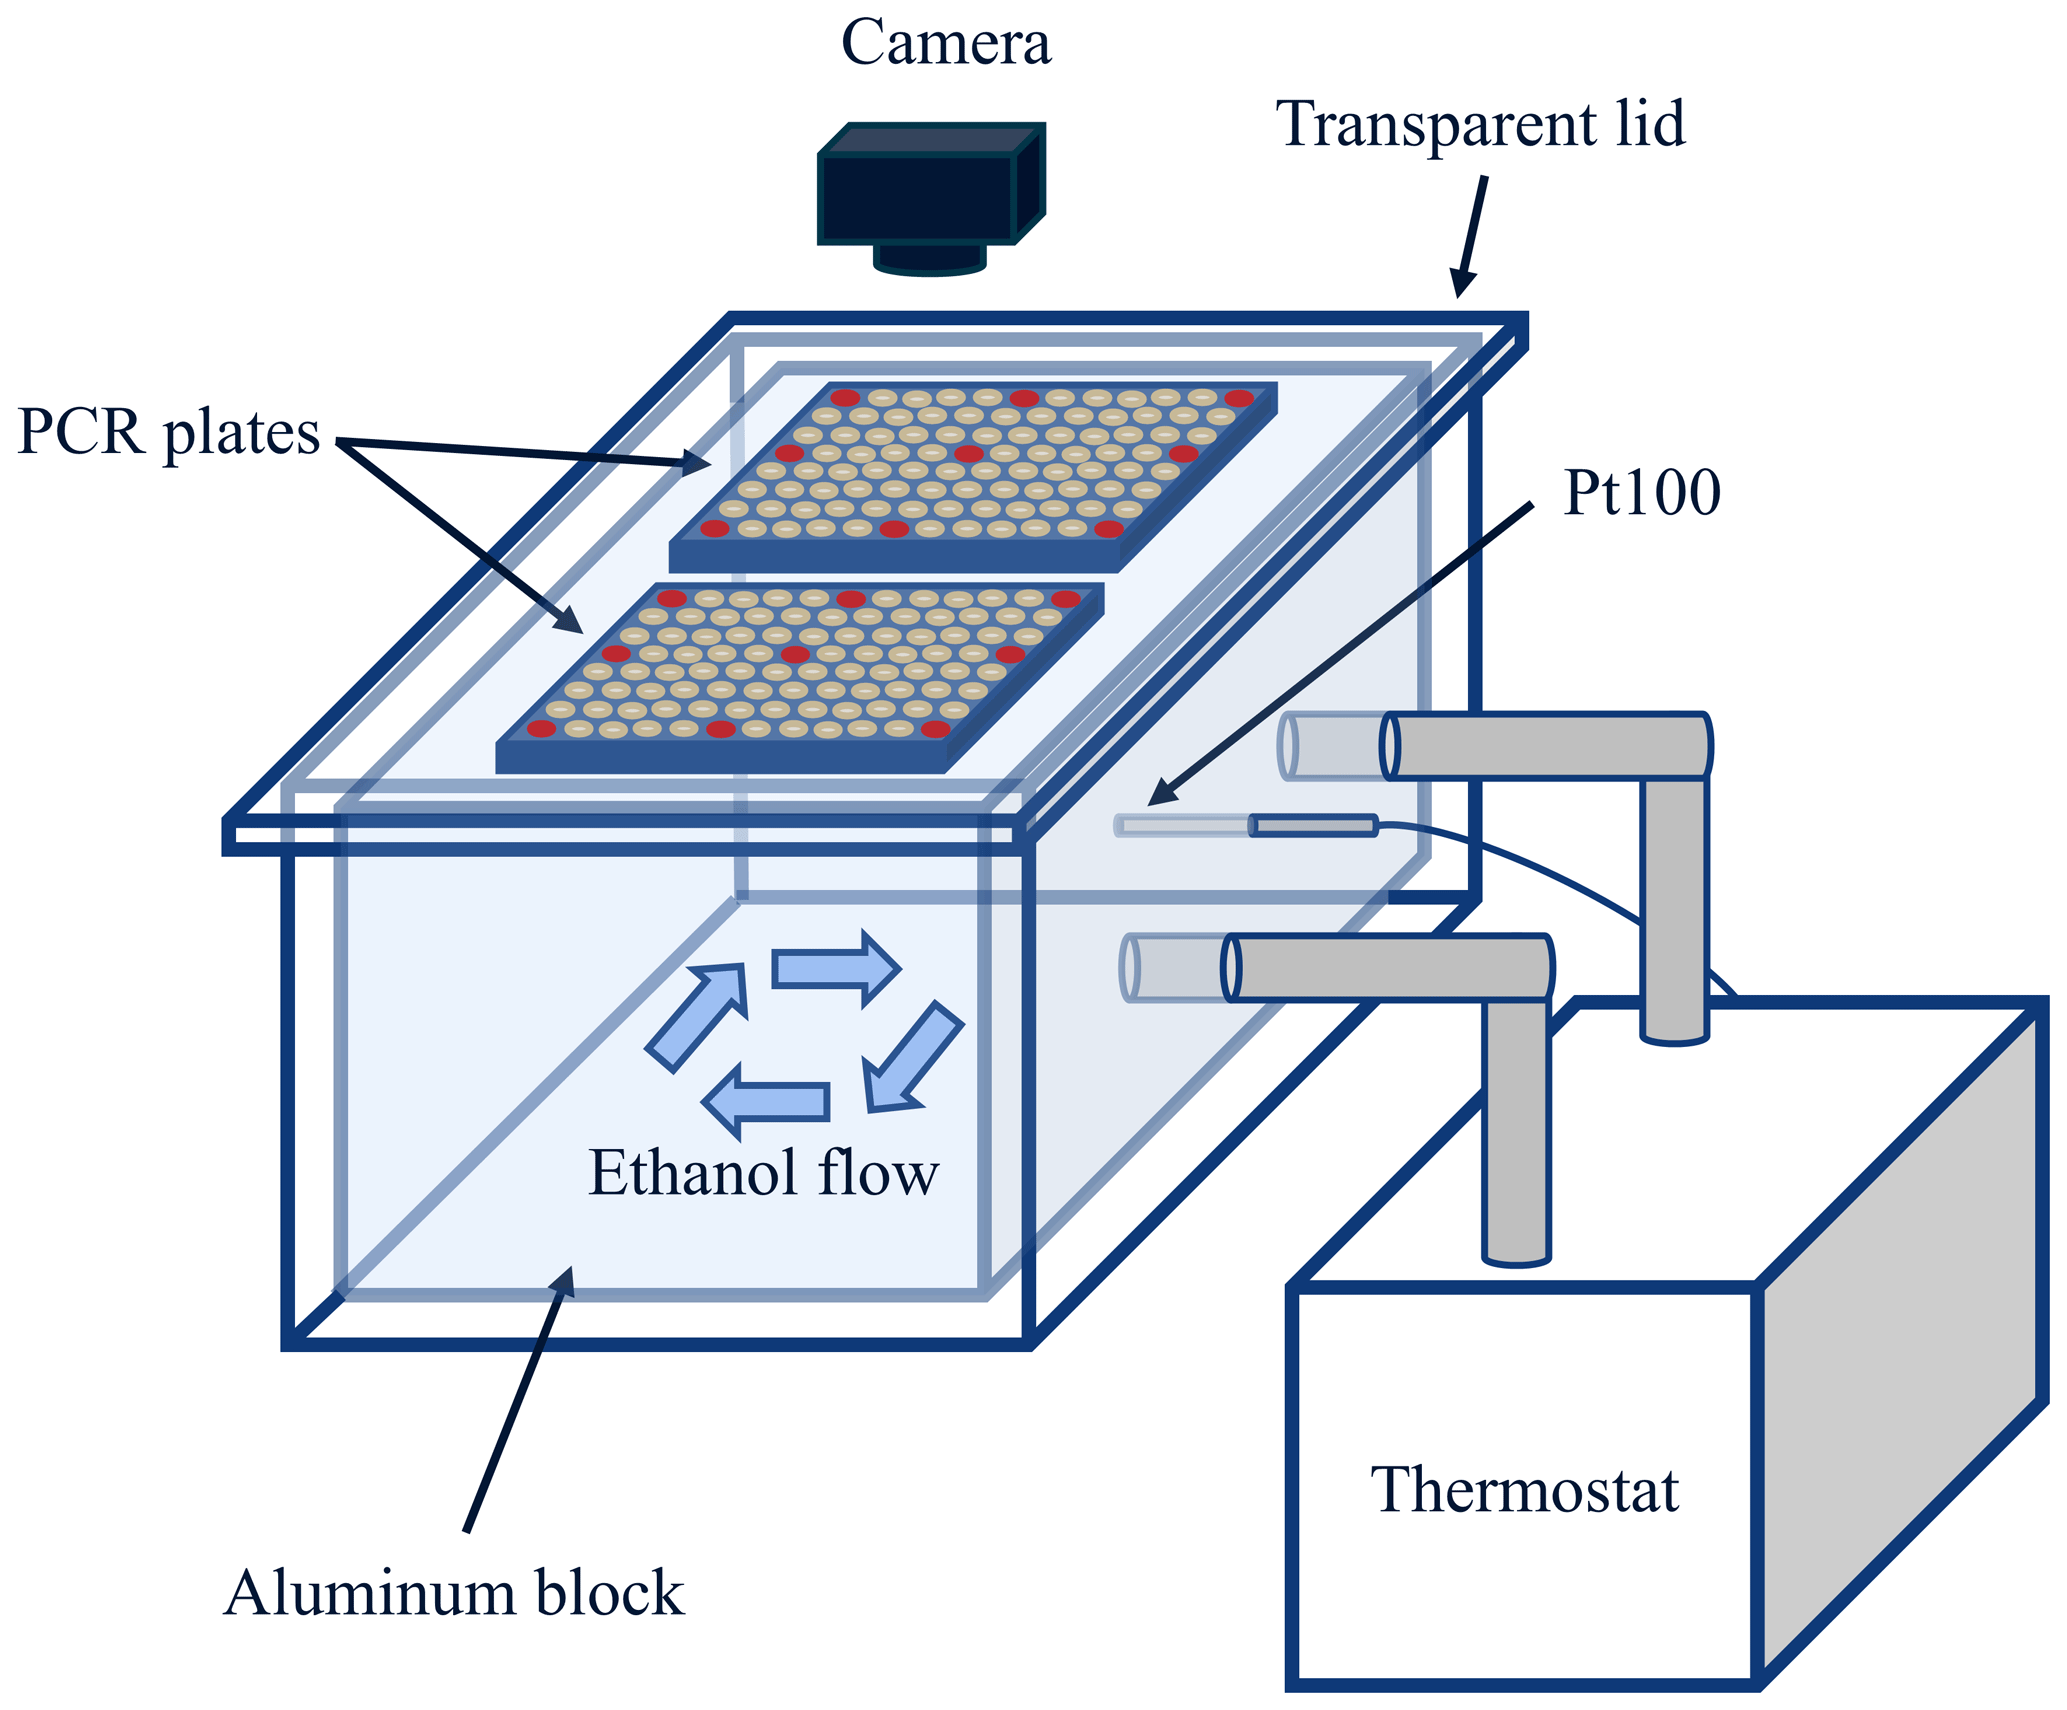
Figure 1Schematic of the GRAINS instrument. Red wells correspond to the ones used for temperature characterization described in Sect. 2.3.
2.2 Freezing event detection and INP concentration calculation
The detection of the freezing events of the samples is done by identifying a change of brightness in the images, specifically of the wells of the PCR plates, which are filled with the sample suspension. For that, we first identify the regions in the picture that correspond to the wells, by finding a convex contour in a binary image, where the wells are black (0) and the rest of the instrument, including the PCR plates, is white (255). Once the position and radius of the wells are found, the grayscale value evolution of the wells is monitored throughout the sequence of images. When the sample inside the well freezes, its brightness, i.e., grayscale, changes immediately towards higher values. After nucleation occurs, the latent heat released during the phase change slows the freezing process, resulting in a continuous change in the optical signal until the droplet is fully frozen. This behavior can produce multiple features in the grayscale signal, corresponding to nucleation and subsequent solidification, as observed in other immersion freezing setups (David et al., 2019). To clearly identify the point at which freezing occurs in the well, the histograms of the grayscale values of the images are equalized based on the average grayscale of all the wells in each image taken, in a range covering three times the standard deviation of this average grayscale. By doing this, the grayscale difference at the freezing event is more pronounced, as seen in Fig. 2a, assuring the correct identification of the freezing of the well. Next, we apply a convolution function to this equalized grayscale value time series, resulting in a flat signal when the droplet is unfrozen and a sharp peak at the moment of freezing, allowing us to accurately detect the freezing event (Fig. 2b). Once all the freezing events are identified, one can calculate the fraction of frozen sample volumes at a specific temperature (FF(T)):
where N0 is the total number of wells filled with the sample suspension and Nf(T) is the number of wells with a frozen sample at temperature T (Vali, 1971). The frozen fraction is directly related to the cumulative spectrum K(T). This function assumes that the freezing only depends on temperature and not time, and it represents the number of INPs active above temperature T per unit of sample volume Vdrop in each well:
In the case of particles sampled on filters that are then washed, the INP concentration (CINP) per standard liter of sampled air can be calculated as:
where Vsuspension is the volume of water used to wash the filter and Vair is the proportional volume of air at standard conditions (0 °C and 1013.25 hPa) that passed through the portion of filter washed. For the case of punches of filters that are introduced in the well of the PCR plates, the INP concentration is calculated as:
where Vpunch is the volume of air that passed through one punch of the filter (Tatzelt et al., 2022). It is important to highlight that this technique has limitations in determining the freezing spectra of a sample, since the temperature range is dominated by the most active INPs. That is, the most active INP in each well will be dominant in the spectra, and the INPs active at lower temperatures will be masked. In order to study the influence of these INPs, it is necessary to analyze dilutions of the sample, allowing to extend the concentration range of study. Based on Eq. (2), one can also calculate the number of ice-nucleation-active sites (INAS) density per unit of mass or surface, nm and ns, respectively:
where Df is the dilution factor of the suspension, Cm is the mass concentration of the suspension and Stotal is the total surface area of the particles sampled.
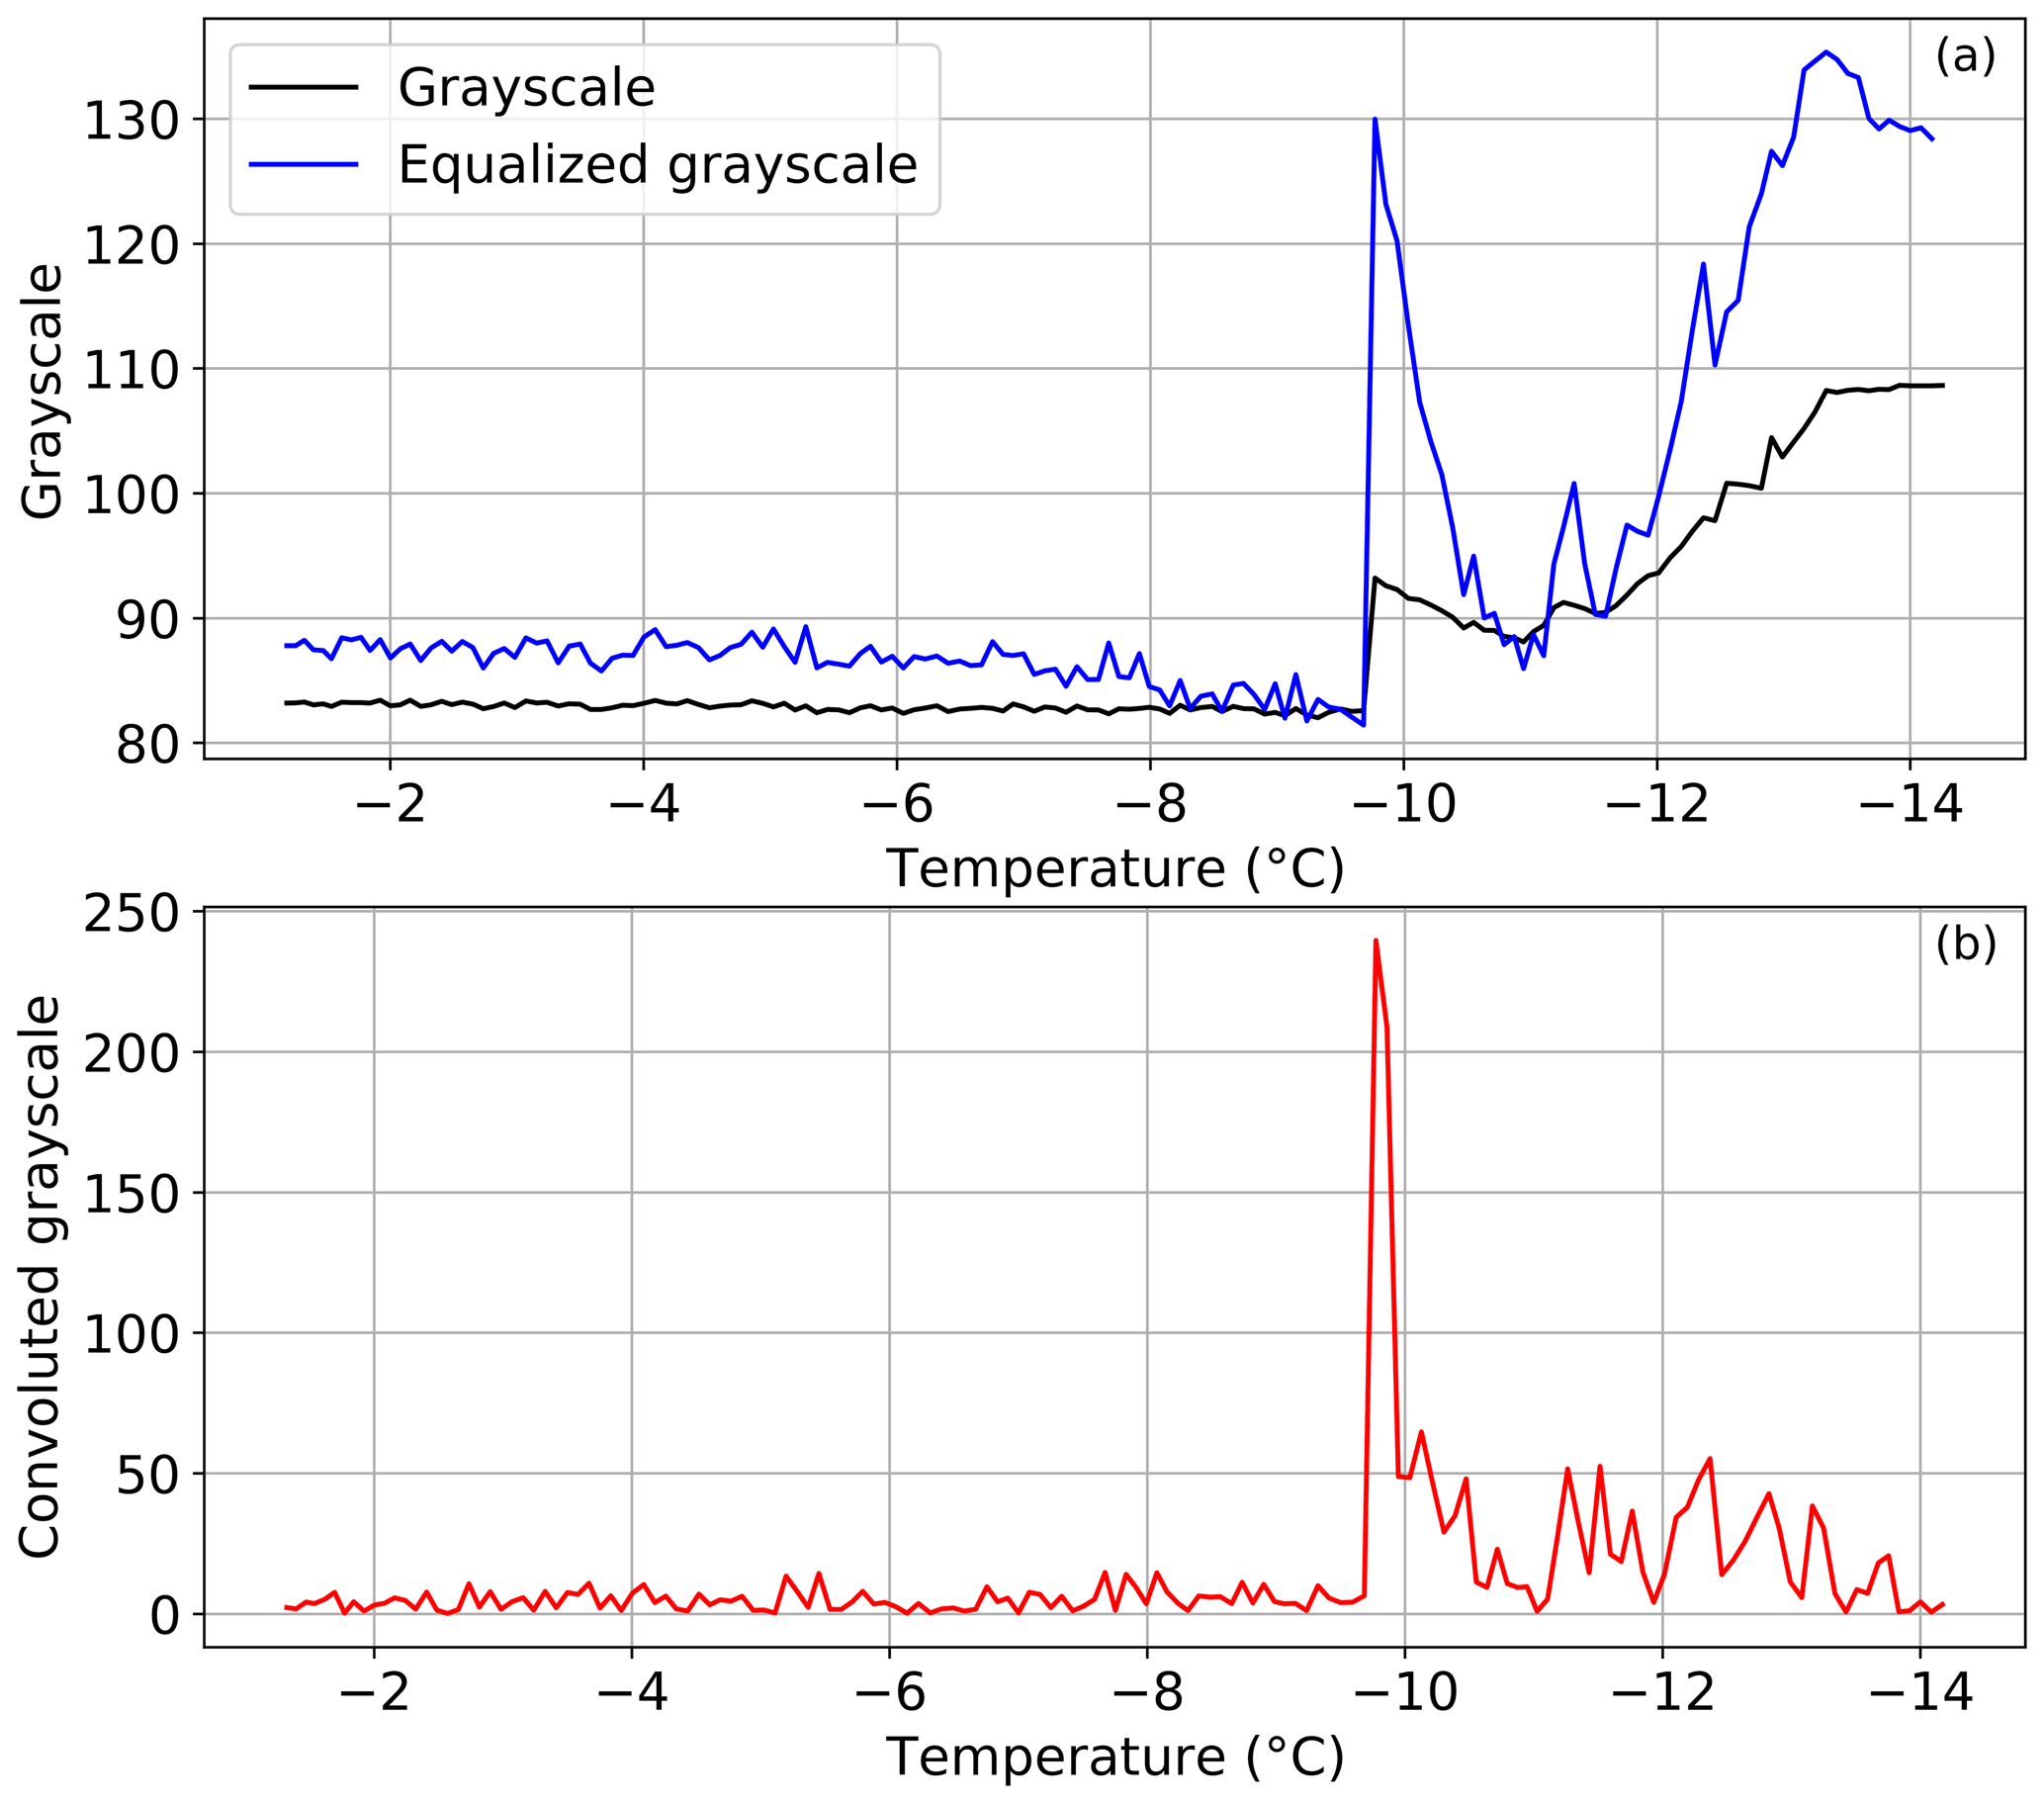
Figure 2(a) Evolution of the grayscale (black line) and the equalized grayscale (blue line) of a well with decreasing temperature in a typical experiment. (b) Convoluted grayscale, where the peak marks the freezing of the well.
2.3 Temperature characterization
A correct determination of the temperature is crucial in immersion freezing devices (e.g., David et al., 2019; Kunert et al., 2018; Miller et al., 2021), since inaccurate measurements of the temperature can lead to significant differences in the obtained INP concentration (e.g., Schrod and Bingemer, 2025). Therefore, in this section, we present the temperature characterization of the GRAINS instrument.
For temperature characterization, a total of four Pt100 probes were used: one probe continuously monitored the temperature of the aluminum block, while three additional probes (RTD PT100 RS PRO, Cat. no. 262-3278) were positioned in the PCR plate wells to measure the temperature inside the wells. To check the precision of the temperature measurements among sensors we performed a comparison between the four Pt100 probes and the temperature reported by the LAUDA thermostat, measured with a built-in Pt1000 probe. This was carried out by immersing the Pt100 probes in the ethanol bath of the thermostat at 0 °C for 15 min. Then, the stability of the temperature reading at decreasing temperature was studied, to check the accuracy of the probe at the usual temperature range of an experiment. For that, we again introduced the Pt100 sensors in the ethanol bath and measured at seven different temperatures from 0 to −30 °C in steps of 5 °C. At each temperature, we recorded the temperatures measured by the Pt100 probes and the one reported by the LAUDA thermostat for 5 min. The results showed an excellent agreement, following a 1:1 relationship for the entire temperature range. This intercomparison is performed annually to ensure a correct reading of the temperature in the experiments.
Then, to characterize the temperature measurements in GRAINS, we established a relationship between the temperature of the aluminum block measured by the main Pt100 sensor and the temperature inside the wells of the PCR plates. For that, we used the three extra Pt100 probes that have dimensions of 2 mm × 10 mm and are small enough to be completely introduced in the wells. To find the differences in temperature between block and the sample volumes in the wells, we completely fill the PCR wells with ethanol, as well as the space between the aluminum block and the PCR plate to eliminate any air insulation and to ensure a more efficient heat transfer. We select specific wells of both PCR plates depending on their distance from the main Pt100 sensor inside the block and on the flow of the ethanol inside the block, since this can affect the temperature measured by the probes. The selected wells are in rows A, D, H and columns 1, 6, 12 of the plate, having a total of nine wells for each PCR plate (see red wells in Fig. 1). Temperature differences between the block and the ethanol inside the wells are up to approximately 5 °C at −30 °C. However, if the space between the aluminum block and the PCR plate is filled with ethanol, these differences decrease to approximately 1.5 °C at −30 °C, so this procedure is followed in all GRAINS experiments.
Each experiment consists of measuring the temperature inside the three wells (Twells) in a column as well as the temperature reported by the probe in the block (Tblock). For this we use a cooling rate of 1 K min−1, covering a temperature range from 0 to −32 °C. We perform nine experiments per PCR plate (three experiments per well), having a total of 18 experiments. The difference in temperature for the nine wells, located in different regions of the PCR plate, did not show a clear trend in terms of distance from the main Pt100 probe or the distance to the point where the ethanol enters the aluminum block (Fig. S2). The same was observed when trying to differentiate between both PCR plates in terms of temperature difference (Fig. S3). For that reason, we apply the same correction function to all wells in GRAINS. To obtain it, we first perform the averages of Twells and Tblock and calculate the errors in each one considering the combination of the error in the reading of the Pt100 probe and the standard error of the averages. Then, we calculate the correction function from the orthogonal distance regression (ODR) of the difference between the mean Twells and the mean Tblock (Fig. S4). To estimate the temperature uncertainty in GRAINS, we performed error propagation and combined the uncertainty of the Pt100 probe, which increases with decreasing temperature, and the error of the ODR in Fig. S4. According to this, we report a temperature uncertainty below 0.5 °C.
To validate the performance of GRAINS and ensure its reliability for INP characterization, we conducted a series of comparative tests with both commercial and ambient samples. These tests included:
-
Reference material validation: The freezing behavior of NX Illite, a widely used material for INP studies, was analyzed with GRAINS and compared to results reported in the literature (e.g., Hiranuma et al., 2015).
-
Ambient sample intercomparison: Two different sets of ambient aerosol samples were analyzed with GRAINS and with two additional immersion freezing devices: the FrESH (Perez Fogwill et al., 2024) and the INSEKT (Schneider et al., 2021).
-
Aerosol and reference material samples collected at AIDAd chamber: Different dust samples, such as K-Feldspar, Arizona Test Dust (ATD), Soil Dust South Africa (SDSA01) and Saharan Dust (SD), collected on filters from the AIDAd chamber (Möhler et al., 2024) were analyzed using both GRAINS and INSEKT for direct comparison. Also, these results were compared with measurements obtained with PINE during the AIDAd experiments.
We evaluated the operation and effectiveness of GRAINS as an INP instrument and assessed the influence of filter substrate and extraction method in the INP concentration determination. A summary of the methodology described here can be found in Table S1 in the Supplement. In the following Sections we give a detailed description of the methodology carried out for each analysis.
3.1 Filter preparation and analysis in GRAINS
Since GRAINS is an offline immersion freezing device, analysis of INP concentrations is performed in the laboratory after the particles are sampled on the filters. The suspensions are prepared by washing the different filters in ultrapure water (type 1, conductivity of 0.055 µS cm−1) passed through a 0.1 µm syringe filter (Acrodisc®). Then, the suspensions are pipetted into the PCR wells, always with a volume of 100 µL per drop, and introduced in GRAINS for the freezing experiment, usually at a freezing rate of 1 K min−1. The volume of water used to wash the filters, and the time and method used for creating the suspension varied between different experiments and will be specified in each Section. All the INP concentration data have been corrected by the background from the freezing spectra of the filtered ultrapure water used to make the suspensions, using the procedure described in Vali (2019).
3.2 Validation using NX Illite
To test the performance and reproducibility of the GRAINS instrument, the ice nucleation ability of NX Illite has been studied, similarly to other experiments before (DeMott et al., 2018; Hiranuma et al., 2015). Since a standardized protocol does not exist, we have followed two different approaches to obtain the NX Illite suspension pipetted into the PCR wells. The first approach, which we define as wet suspension, is to create the suspension by directly mixing the NX Illite powder with filtered ultrapure water, with concentrations ranging from 1 to , which allows to calculate nm(T) according to Eq. (4). To obtain ns(T) we have divided nm(T) by a mass conversion factor of 6.54 m2 g−1 (Hiranuma et al., 2015).
The second approach, dry dispersion, consisted of aerosolizing the NX Illite powder and sampling it on a 25 mm membrane polycarbonate filters with 0.2 µm pore size (Whatman®) at a flowrate of 5 L min−1. To this end, we used a particle atomizer (SwisensAtomizer, Swisens) in which the particles are introduced in a cuvette that is placed on top of a vibrating plate, with a blower inside the cuvette that pushes air into the tube. Both the vibration and the air flow are adjustable to allow an optimal concentration of particles that are aerosolized (around 100 cm−3 on average). Additionally, an Aerodynamic Particle Sizer (APS, TSI 3321) was used to measure the size distribution of aerosolized particles from 0.5 to 20 µm (aerodynamic diameter). This instrument also works at 5 L min−1 (further details on the working principle of this instrument can be found in Pfeifer et al., 2016). The use of the APS allows to calculate the surface area (Stotal in Eq. 5) from experimental data. However, due to the measurement range of the APS, the surface area of particles below 0.5 µm in diameter will not be accounted for in Stotal. To calculate the surface area, we performed a conversion from aerodynamic diameter to volume-equivalent diameter assuming a density of 2.65 g cm−3 and a dynamic shape factor of 1.49, which is appropriate for NX Illite particles (Hiranuma et al., 2015). Each experiment (aerosolization and co-located filter sampling and measurements of the size distribution) lasted 90 min. For these experiments, the filters were washed in 20 mL of filtered ultrapure water and manually agitated for one minute for particle extraction. 10-fold and 100-fold dilutions of the washing water were created to extend the INP concentration range. Then the experiments were performed at a freezing rate of 1 K min−1 using GRAINS.
3.3 Intercomparison of GRAINS with other INP devices
We have also tested the performance of GRAINS by comparing the ice nucleation ability of ambient aerosol samples determined with different immersion freezing devices. In particular, we have compared GRAINS with FrESH (Perez Fogwill et al., 2024), deployed at the Finnish Meteorological Institute (FMI) in Helsinki (Finland), and INSEKT (Schneider et al., 2021), deployed at the Karlsruhe Institute of Technology (KIT) in Karlsruhe (Germany). FrESH and INSEKT are offline immersion freezing techniques, so the working principles are equivalent to the ones described in Sect. 2. Unlike GRAINS, in FrESH the PCR plates are placed directly in an ethanol bath, being similar to the device described in David et al. (2019). In the case of FrESH, droplet volumes are 50 µL, the ultrapure water used for preparing the suspensions is filtered through a 0.02 µm syringe filter and the cooling rate is 1 K min−1. On the other hand, INSEKT consists of an aluminum block connected to a thermostat (like GRAINS) that operates at a cooling rate of 0.33 K min−1. The droplet volumes of INSEKT are 50 µL and ultrapure water, filtered through a 0.1 µm syringe filter, is used to prepare the suspensions.
For the comparison of GRAINS and FrESH, 47 mm polycarbonate filters with 0.2 µm pore size (Whatman®) that were sampled in different stations in Finland were cut in half and then analyzed in each instrument. We have analyzed six different filters: three of them were sampled at the Helsinki station (HEL, 60.20° N, 24.96° E, 71 m a.s.l.), while the other three were sampled in the Kuopio (KUO, 62.91° N, 27.66° E. 306 m a.s.l.), Utö (UTO, 59.78° N, 21.38° E, 70 m a.s.l.) and Pallas (PAL, 67.97° N, 24.12° E, 565 m a.s.l.) stations. The sampling time was 24 h for all filters, operating at a flowrate of approximately 16.6 L min−1. The total air volume that passed through the filters was registered based on the time of sampling and the flow rate measured. Transportation of the filters from Finland to Granada was done at ambient conditions, and the remaining half of the filters stayed at FMI unfrozen during the time of transport so that both sets were exposed to similar conditions. After transport, both sets of half-filters (one set in Granada and one at FMI) were again stored frozen at −20 °C until the time of analysis (approximately six months from the time of transportation). The analysis of the half-filters with both instruments was performed on the same day and in the same order. The filter washing for GRAINS consisted of manually agitating the tube for one minute, whereas for FrESH the tube was placed on a vortex agitator for 30 s. For each filter, a 10-fold dilution was also prepared and analyzed to extend the concentration range of the INP concentrations.
For the comparison of GRAINS and INSEKT, two different types of sampling were performed. For ambient particles, two sets of two 47 mm polycarbonate filters with 0.2 µm pore size, one for each instrument, were sampled at KIT (49.10° N, 8.43° E, 114 m a.s.l.) for 24 h at a flowrate of 5 L min−1. All filters were pre-cleaned with 10 % H2O2. The filters were immediately stored frozen (−20 °C) after sampling and until the time of analysis by INSEKT (around one week after sampling time), but the ones analyzed by GRAINS were first stored frozen and then transported to Granada in cold conditions. Once the filters arrived in Granada, they were again stored frozen until the time of analysis (approximately two months from the sampling time). In this case, 15-fold and 225-fold dilutions were also analyzed and the cooling rate in GRAINS was set to 0.5 K min−1 to have a similar cooling rate as INSEKT (0.33 K min−1). The filter washing for both INSEKT and GRAINS consisted of placing the tube in a rotating agitator at 60 rpm for 20 min.
For the experiments at the AIDAd chamber (Möhler et al., 2024), we performed experiments for K-Feldspar (BCS-CRM 376/1), Arizona Test Dust (ATD), Soil Dust South Africa (SDSA01) collected from the Succulent Karoo biome and deposited Saharan Dust (SD) collected in Granada during an extreme dust event (Bazo et al., 2025; Rodríguez and López-Darias, 2024). Each dust sample was injected into AIDAd using a 2.5 µm cutoff cyclone to reject larger particles and sampled on pre-cleaned (10 % H2O2) 47 mm polycarbonate filters with 0.2 µm pore size for 60 min at a flowrate of 5 L min−1. Several instruments were connected to the AIDAd chamber, including the PINE (Möhler et al., 2021) that allows to obtain the INP concentration for a temperature range between −20 and −30 °C. The analysis with INSEKT was immediately performed after each AIDAd experiment, whereas the filters analyzed with GRAINS were stored frozen, transported to Granada in cold conditions and frozen again until analysis in GRAINS. As before, the filter washing consisted of placing the tube in a rotating agitator at 60 rpm for 20 min, cooling rate in GRAINS and INSEKT were 0.5 and 0.33 K min−1, respectively. In this case, 10-fold and 100-fold dilutions were analyzed instead.
3.4 Testing different filter substrates and analytical methods with GRAINS
Finally, we have used GRAINS to evaluate different sampling methods often used for the study of INP concentrations. To do that, we have performed a regular aerosol sampling at the urban background station UGR (37.16° N, 3.61° W, 680 m a.s.l.) of the Andalusian Global ObseRvatory of the Atmosphere (AGORA; https://atmosphere.ugr.es/en, last access: 21 October 2025), in the city of Granada for the period September 2024–January 2025. Road traffic is the main source of aerosol particles in the station (Titos et al., 2014), with enhanced contribution of biomass burning during winter (Titos et al., 2017). The presence of long-range transported dust is also very frequent (Cazorla et al., 2017), while marine aerosols have minimal influence (Titos et al., 2012, 2014).
We have carried out two types of sampling strategies. The first one consists of sampling aerosol particles on 47 mm polycarbonate filters with 0.2 µm pore size using a custom-made low-volume sampler, the GRAnada Sampling System (GRASS). It consists of a stainless steel 47 mm filter holder (Pall Corporation) connected to a flowmeter and a vacuum pump. During the sampling period the flowrate was set to 9 L min−1, and sampling was performed with no impactor. For the second sampling strategy, we have used 150 mm quartz fiber filters sampled with a high-volume sampler (CAV-A/Mb, MCV) equipped with a PM10 inlet. The flowrate in this case was set to 500 L min−1. The first one is more widely used in the INP community while the second one is regularly used for PM10 determination and chemical analysis. For each sampling strategy, we have six field blank filters to test the potential contamination during handling of the filters. Frozen fractions of all field blank filters were very close to those of filtered ultrapure water (Fig. S5), therefore only water background subtraction has been applied to the measurements. These results suggest a low contribution of the quartz fibers to the total INP concentration, which was also found by Conen et al. (2012).
For both sets of filters (polycarbonate and quartz), aerosol particles were sampled for 24 h, starting at midnight, every 4 d. The sampling period started in mid-September 2024 and lasted until January 2025, with a total of 27 filters for each method. Polycarbonate filters were stored at −20 °C immediately after sampling until the time of analysis in GRAINS and no pre-sampling treatment was performed to the filters. On the other hand, quartz filters were conditioned and treated pre- and post-sampling following the procedure described in Titos et al. (2014). Filters were heated to 205 °C for 6 h and stored at stable conditions until sampling. After sampling, the filters were stored in the refrigerator until weighting using gravimetric techniques. Then, a quarter of the filter was stored in the freezer at −20 °C until its analysis in GRAINS.
After sample collection, polycarbonate filters were analyzed in the laboratory as explained in Sect. 3.1 (Polycarbonate method). The extraction of the particles was done by manually agitating the tube containing the filter immersed in 20 mL of filtered ultrapure water for 1 min. The recommended protocol established by the ACTRIS Center for Ice Nucleation (CCIce) for particle extraction consists in rotating the tube with the suspension in a rotating agitator for 20 min at 60 r.p.m (CCIce 4th QAQC workshop). To ensure the equivalence of the INP concentrations obtained by manual and rotating agitation, several tests were performed, leading to very similar results. For quartz filters, we followed two approaches. For the first approach (Quartz 96-punch), we punched a region of the filter 96 times with the use of a biopsy punch of 1 mm diameter, we introduced each punched region into the wells of the PCR and then we filled them with 100 µL of filtered ultrapure water. This approach is chosen in many INP studies (Tatzelt et al., 2022; Welti et al., 2018; Wex et al., 2019), since it only requires a small fraction of the quartz filter and the rest of it can be used for additional analyses. The second approach (Quartz punch washed) consisted of punching a portion of the filter with a 1 cm diameter biopsy punch and then washing it in filtered ultrapure water in a similar way as typically done with polycarbonate filters, by manually agitating the tube. This approach was followed in Bras et al. (2024) and Lacher et al. (2024) for obtaining INP concentrations with the LINDA instrument (Stopelli et al., 2014). Again, we performed several tests to verify the similarity between manual and rotating agitation and to assess the reproducibility of manual agitation, obtaining equivalent results. To obtain the INP concentration with the Quartz 96-punch method we have used Eq. (6), whereas for the Polycarbonate and Quartz punch washed methods we calculated the INP concentration using Eq. (3)
4.1 Freezing ability of NX Illite
NX Illite is a commercial powder composed mainly of illite, with some traces of kaolinite, quartz, calcite and feldspar (Broadley et al., 2012), which has been used for the validation of immersion freezing devices (DeMott et al., 2018; Hiranuma et al., 2015). However, differences in the freezing ability of NX Illite can occur (e.g., Hiranuma et al., 2015) which might be related to slight variations in the mineralogical composition and measurement techniques. However, no certified reference standard for immersion freezing devices was identified so far, therefore, we evaluate the freezing spectrum of NX Illite obtained with GRAINS and intercompare with data from other immersion freezing instruments in this section.
Figure S6 shows the number and surface size distributions for NX Illite obtained with the APS for the dry dispersed method. The number size distribution reveals the abundance of fine mode particles (volume-equivalent diameters <1 µm), although their contribution to the surface size distribution is not large. On the other hand, the number concentration of coarse mode particles (volume-equivalent diameters >1 µm) is high, and, as observed in Fig. S6b, the surface size distribution has a mode at around 2 µm diameter, so the NX Illite sample is mostly characterized by particles around this size. Super-coarse mode particles do not contribute greatly either to the number concentration nor the surface concentration. In fact, the surface concentration of the fine mode is greater than the surface concentration of the super-coarse mode. These size distributions are only representative of the dry dispersions, since the low presence of super-coarse mode particles might be due to effects in the aerosolization process that prevent larger particles in the sample from aerosolizing.
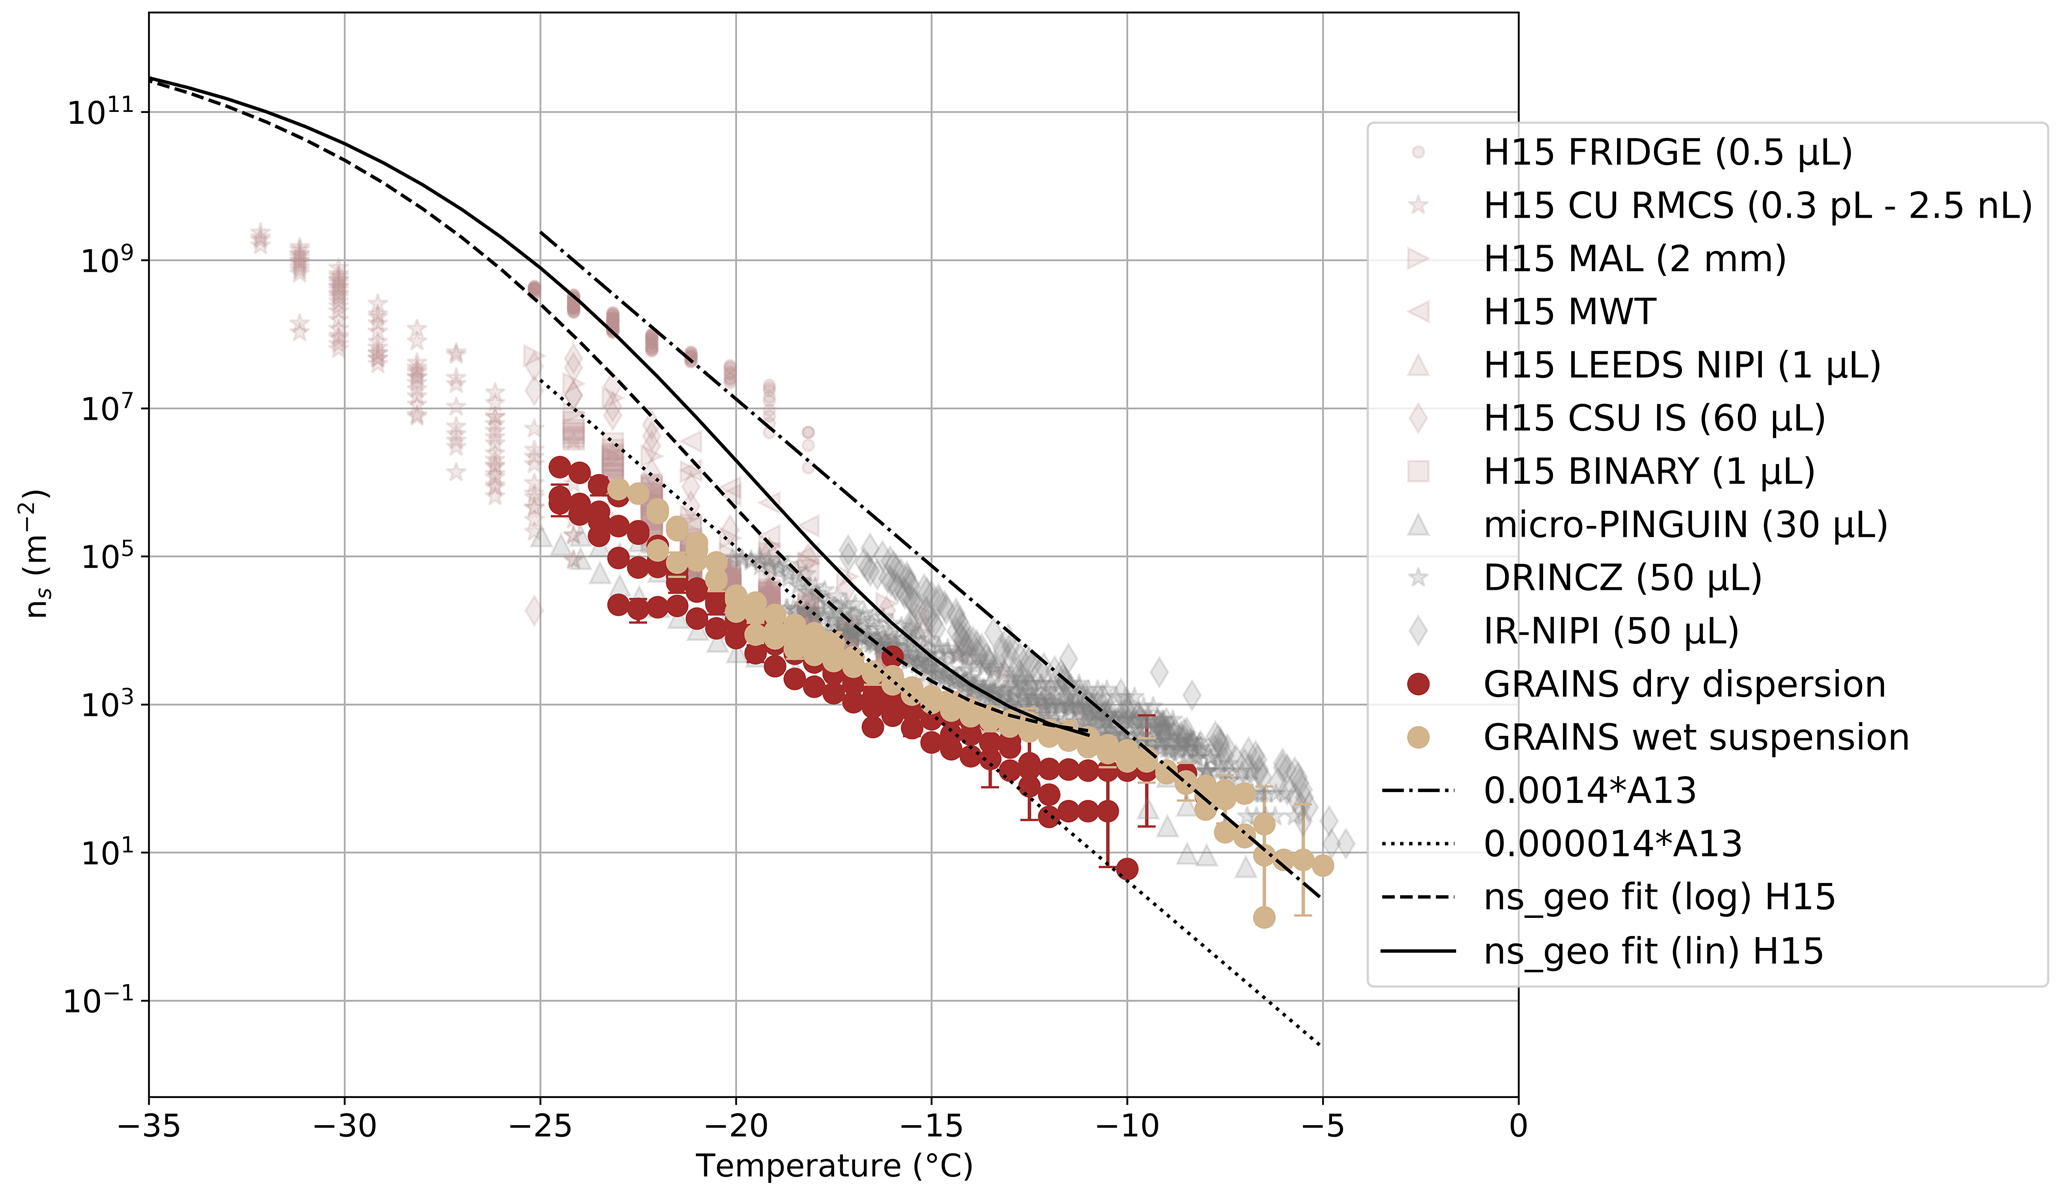
Figure 3Ns(T) of NX Illite obtained with the GRAINS instrument. Data and parametrizations from Hiranuma et al. (2015) are indicated as H15. Parametrizations from Atkinson et al. (2013) for K-Feldspar are indicated as A13 in the legend. Data from micro-PINGUIN (Wieber et al., 2024), DRINCZ (David et al., 2019) and IR-NIPI (Harrison et al., 2018) are also shown. Uncertainties (shown every 6th data point) were obtained by evaluating the analytical expression of ns at the lower and upper confidence limits of the frozen fraction, which were calculated based on Agresti and Coull (1998).
Figure 3 shows the ns(T) of NX Illite measured with GRAINS, as well as different data and parametrizations reported in the literature. In particular, we show data from Hiranuma et al. (2015), which appear in the legend of Fig. 3 as H15 followed by the instrument used to perform the measurements. For information on the different instrumentation, we refer to the Supplement from Hiranuma et al. (2015). We also show data from micro-PINGUIN (Wieber et al., 2024), DRINCZ (David et al., 2019) and IR-NIPI (Harrison et al., 2018). All the instruments that appear in the legend of Fig. 3 are immersion freezing devices. Note that these data are reported in the literature as ns,BET(T), that is, normalized by the specific surface area (SSA) of the sample, obtained with the Brunauer-Emmett-Teller (BET) method (Brunauer et al., 1938). To convert from ns,BET(T) to ns,geo(T) (INAS density based on geometric size, from now on ns(T)) we have used a SSA of 124.4 m2 g−1 and a mass conversion factor of 6.54 m2 g−1 for all data (Hiranuma et al., 2015). Parametrizations shown correspond to the ones in Hiranuma et al. (2015). In particular, we show fractions of the one presented in Atkinson et al. (2013) (A13 in the legend) for K-Feldspar, as well as the ones proposed by Hiranuma et al. (2015) for suspension measurements of NX Illite.
Figure 3 shows seven different curves obtained with GRAINS, four of them corresponding to dry dispersions and three of them corresponding to wet suspensions, and all of them binned to temperature steps of 0.5 °C. Uncertainties for the frozen fractions were calculated from the 95 % confidence interval for binomial sampling, following Agresti and Coull (1998), whereas uncertainties in derived variables were obtained by evaluating the analytical expressions at the lower and upper confidence limits of the frozen fraction. Additionally, Fig. S7 shows a better visualization of the NX Illite spectra obtained with GRAINS. In general, GRAINS measurements fall in the region of the other freezing spectra, spanning over 5 orders of magnitude in ns(T) from around −7 °C, where ns(T) is around 101 m−2, to −25 °C, where it reaches values around 106 m−2. As seen in Figs. 3 and S7, wet suspensions tend to activate earlier than dry dispersions, probably due to the fact that in dry dispersions the predominance of larger particles is lower due to the aerosolization of the sample. Activation of the particles varies between experiments, ranging between −5 and −7 °C for wet suspensions, and between −8 and −12 °C for dry dispersions, but ns(T) values at these temperatures are within the uncertainty range. In general, the freezing spectra of NX Illite measured by GRAINS spans around one order of magnitude for a given temperature for each of the methods, except one of the dry dispersions (Dry dispersion 2) that deviates from the rest at the higher temperatures. GRAINS' results cover the ns(T) values reported by the parametrizations and other instruments, although the variability among instruments/studies is high. Focusing on the temperature range from −20 to −25 °C, the ns(T) shows a steeper slope than for the rest of the spectra, being parallel to the A13 parametrization. This feature was also observed in suspension measurements presented in Hiranuma et al. (2015). Hiranuma et al. (2015) also found that the ns(T) of NX Illite is weakly dependent on the experimental conditions of each instrument (i.e. droplet size, cooling rate, mass of NX Illite in the sample, etc.). In this sense, results obtained with GRAINS in Fig. 3 support this finding, since the droplet size in GRAINS is larger than in other devices. For instance, wet suspension results show activation at similar temperatures as the IR-NIPI or the micro-PINGUIN instruments (Harrison et al., 2018; Wieber et al., 2024), which use droplet sizes of 50 and 30 µL respectively. On the contrary, despite the differences in the two methods used with GRAINS (dry dispersions and wet suspensions), and different mass concentrations in each of the experiments, we obtained very similar results to those reported in the literature, showing consistency in the reproducibility of the spectra obtained with the newly built droplet freezing array GRAINS.
4.2 Freezing ability of ambient and dust samples: intercomparison of GRAINS with FrESH, INSEKT and PINE
In this section we evaluate the ability of GRAINS to reproduce the INP concentration from ambient samples by comparing the freezing spectra measured with GRAINS with those measured with FrESH (Perez Fogwill et al., 2024) and INSEKT (Schneider et al., 2021), using polycarbonate filters sampled under varying conditions (aerosol types and concentrations). Figure 4 shows the comparison of the INP concentrations obtained by GRAINS and by FrESH/INSEKT for the eight samples (six for FrESH and two for INSEKT). The INP concentration values for GRAINS and FrESH have been binned in steps of 0.5 °C. Additionally, Fig. 4 shows a 1:1 line that represents perfect agreement between both instruments, as well as a line that represents a comparison factor of 5 between INP concentrations. Filled markers represent data points that fall inside the 95 % confidence interval of the 1:1 line, calculated as stated in Agresti and Coull (1998); whereas hollow markers represent data points that fall outside this region.
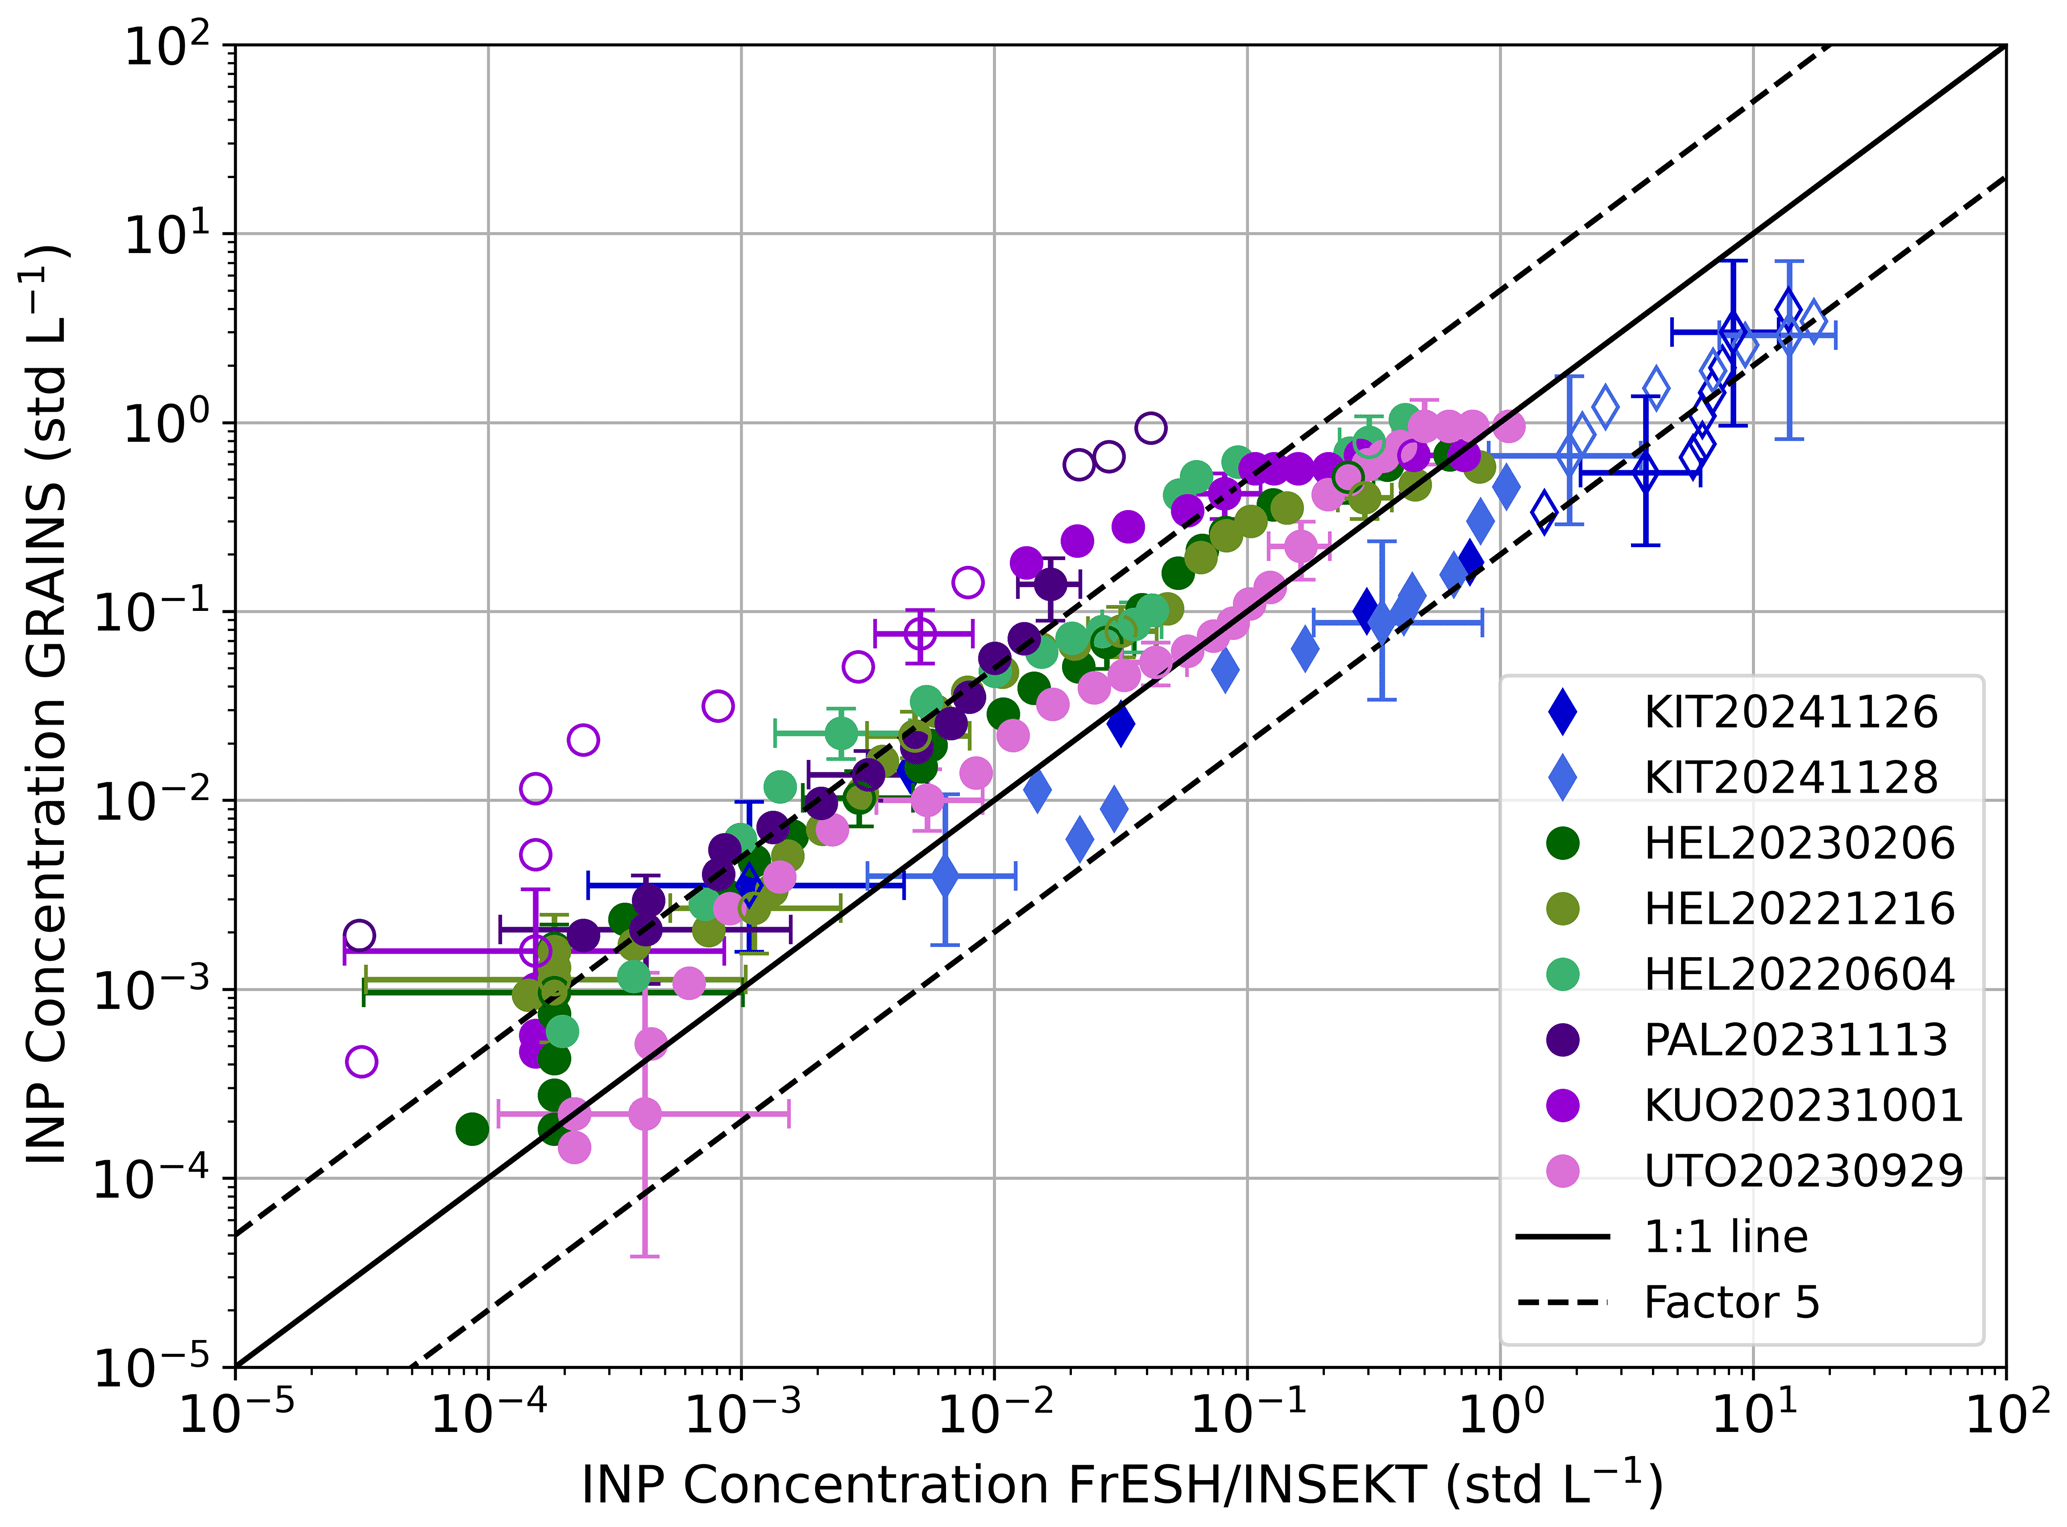
Figure 4INP concentration obtained with GRAINS compared to INP concentration obtained with FrESH (round markers) and INSEKT (diamond markers) for the eight different filters sampled at ambient conditions in FMI and KIT stations. The name of the sample reflects the measurement site and the date. The black solid line represents the 1:1 line and the black dashed lines represent a factor of 5 between INP concentrations. Filled markers (hollow markers) correspond to data points inside (outside) 95 % confidence interval of the 1:1 line, based on Agresti and Coull (1998). Uncertainties (shown every 6th data point) were obtained by evaluating the analytical expression of the INP concentration at the lower and upper confidence limits of the frozen fraction, which were calculated based on Agresti and Coull (1998).
In general, INP concentrations shown in Fig. 4 fall near the 1:1 line, with most of the samples within the 95 % confidence interval. Lacher et al. (2024) performed an intercomparison of different online and offline freezing devices, establishing a difference factor between INP spectra of 5 as agreeable (shown in Fig. 4), and a factor of 2 as a good agreement. In this case, differences are within a factor of 5 for 83 % of the data, and within a factor of 2 for 33 % of the data, with the largest differences up to one order of magnitude. On average, absolute INP concentration differences increase with decreasing temperature, ranging from 10−4– at the highest temperatures (i.e. −6 to −10 °C) to 100–101 L−1 at the lowest range (from −13 to −25 °C).
The GRAINS-FrESH intercomparison shows that the first device tends to measure higher INP concentrations at the same temperature. In fact, there is one sample in the GRAINS-FrESH intercomparison that shows substantial differences between both instruments, KUO20231001, being the INP concentrations obtained with GRAINS around one order of magnitude higher than those obtained with FrESH. Figure S8, that contains the individual GRAINS and FrESH INP spectra obtained from each sample, shows that the behavior in the INP concentration spectra obtained with both devices is mostly the same, but with a shift in temperature, which may be due to the fact that FrESH does not yet account for a temperature correction of the wells of the PCR plates. In general, there is an increased scattering of the data for lower INP concentrations, while the opposite occurs for higher INP concentrations, where most of the data is closer to the 1:1 line. For these samples, Fig. S8 shows that the behavior of the freezing spectra obtained with the two droplet freezing arrays is quite similar and this temperature shift is less pronounced. However, the temperature difference in the KUO20231001 sample is higher than in the rest of the samples, which causes larger difference in the comparison of INP concentrations from Fig. 4. On the other hand, an early activation in GRAINS compared to FrESH, which occurs in almost every sample, could be associated with the size of the droplets in the PCR plates, i.e. 100 µL for GRAINS and 50 µL for FrESH.
For the samples analyzed with INSEKT, the trend between the INP concentrations obtained with GRAINS and INSEKT is linear, but it deviates from the 1:1 line, especially for higher INP concentrations at lower temperatures. Still, most of the data are within the region that corresponds to a factor of 5. The INP concentrations obtained with INSEKT are higher for both samples. This feature can be clearly observed in Fig. S9, which shows the individual INP spectra obtained by each instrument. As in Fig. S8, the activation on GRAINS happens at higher temperatures likely due to the larger droplet volume used or to the temperature uncertainty. Additionally, Fig. S9 shows that the slope of the INP spectra differs for the KIT20241126 filter at lower temperatures, which corresponds to the data points in Fig. 4 that are not within a factor of 5. These differences are due to the fact that the 225-fold dilution analyzed with INSEKT deviates from the rest at the beginning of its spectrum. If we discard that part of the 225-fold dilution spectrum to obtain the complete INP spectrum, differences would reduce to a factor of 2 in this temperature range. For the KIT20241128 sample, activation occurs 1.5 °C earlier in GRAINS than in INSEKT, but the shape of the spectra in the overlapping temperatures is very similar for both devices.
Concerning the potential sources of disagreement between GRAINS and FrESH/INSEKT that might be contributing to the observed differences, there are intrinsic differences in the instruments themselves like the larger droplet volume in GRAINS compared to the other two devices and differences in the filter handling. Lower INP concentrations obtained with GRAINS might be caused by the transportation of the filters, that can lead to loss of highly active INP (Beall et al., 2020). Also, KIT filters analyzed with GRAINS stayed frozen for a longer time than those analyzed with INSEKT, although storage at −20 °C is expected to have small changes in INP concentrations (Beall et al., 2020). Nevertheless, the measured INP concentrations are in general within a factor of 5, which can be considered as acceptable.
Figure 5 shows the comparison of the INP concentrations obtained with GRAINS, INSEKT and PINE for the different dust particles sampled from the AIDAd chamber, that was used as an aerosol reservoir, following the methodology explained in Sect. 3.3. As in Fig. 4, the 1:1 line and a factor of 5 have been plotted together with the experimental data. In this case, the agreement between INSEKT and GRAINS is better than for the ambient samples (Fig. 4), with most data following the 1:1 line. In fact, 98 % of the INP concentration data fall inside the region delimited by a comparison factor of 5, whereas 72 % of the data are within a factor of 2, showing good agreement between GRAINS and INSEKT. For the comparison of GRAINS and PINE, 62 % of the INP concentration data fall inside the region delimited by a factor of 5, being affected by the values obtained for K-Feldspar, that differ by more than two orders of magnitude. For this experiment, the INP concentration was likely too high for the offline techniques, and a higher dilution should have been applied. Figure S10 shows the ns spectra obtained with the three instruments. For the calculation of the total surface area necessary to obtain ns from INP data, we applied a lognormal fit of the size distribution, as done in similar studies (e.g. Hiranuma et al., 2015), which was obtained with a combination of measurements from the Scanning Mobility Particle Sizer (SMPS) and the APS that operated at AIDAd. As shown in Fig. S10, activation in GRAINS happens at higher temperatures likely due to the larger droplet size compared to INSEKT. Figure S10 shows that, in general, the ns spectra obtained with INSEKT spans a wider temperature range compared to the ns spectra obtained with GRAINS. This feature, more evident for the ATD sample, is due to the fact that during the GRAINS experiments there was some contamination of the ultrapure water used to wash the filters. This caused the water background corrected values of the third dilution to be very similar to the water background, so they had to be discarded. Still, the ns spectra obtained with both droplet freezing arrays show similar values for the overlapping temperatures. The comparison of GRAINS and INSEKT with PINE shows better agreement for SDSA01 and Saharan Dust than for ATD, and with the largest differences for K-Feldspar, likely due to the ice activity of the sample, resulting in lower ns values. For SDSA01, INP concentration values obtained with PINE (ranging from −18 to −28 °C) overlap with the INP spectra from GRAINS and INSEKT, with some deviation at around −19 °C. For Saharan Dust, ns spectra from PINE cover the temperature range from −18 to −29 °C. For the overlapping temperatures with the droplet freezing arrays (−19 to −23 °C) the trend of the three ns spectra is quite similar, but the values from PINE are higher than the ones obtained with INSEKT and GRAINS, with differences of around one order of magnitude. For ATD this feature is more evident, since ns values from PINE and INSEKT differ more than one order of magnitude for the lower temperatures (). This shows the opposite behavior to what was studied in Lacher et al. (2024) for ambient samples, where INP concentrations obtained with online instruments were mostly lower than those obtained with offline techniques. Nevertheless, for higher temperatures in the ATD ns spectra (from −17.5 to −22 °C), the ns values from PINE, INSEKT and GRAINS are in agreement. Figure S10 also shows parametrizations reported in the literature for ATD (Niemand et al., 2012 – N12), K-Feldspar (Atkinson et al., 2013 – A13) and dust (Niemand et al., 2012 – N12; Ullrich et al., 2017 – U17). In general, the slopes of the ns spectra for ATD, SDSA01 and Saharan dust follow the same trend as the dust parametrizations, but the experimental data shows slightly lower values of ns, especially for both droplet freezing arrays. For K-Feldspar the two spectra overlap for the majority of the temperature range, but PINE ns values are larger than the ones obtained with the two droplet freezing arrays, by more than two orders of magnitude. In fact, PINE data shows ns values similar to those corresponding to the A13 parametrization, whereas INSEKT and GRAINS show the same slope of the spectra as the parametrization by Atkinson et al. (2013), but with a difference of two order of magnitude in the values. This could be due to the fact that the working principle of INSEKT and GRAINS assumes that there is a single INP per droplet in the PCR wells (Vali, 2019), and since K-Feldspar is a highly ice-active substance the ns obtained with both droplet freezing arrays could be underestimated. Another possibility could be that the ice nucleation activity of K-Feldspar is degraded due to being immersed in water. This is something observed by Harrison et al. (2016), although the degradation occurred after the sample was immersed in water for months. Also, Kumar et al. (2018) stated that when K-Feldspar is immersed in water there are interactions between the water and the sample's surface, which could explain the difference between the ice nucleation ability obtained with droplet freezing arrays compared to PINE and the A13 parametrization. Apart from the case of K-Feldspar, the results shown in Figs. 5 and S10 confirm the similarity of the two droplet freezing arrays and the PINE instrument, confirming that GRAINS can reproduce the freezing behavior of mineral dust samples when compared to INSEKT and PINE.
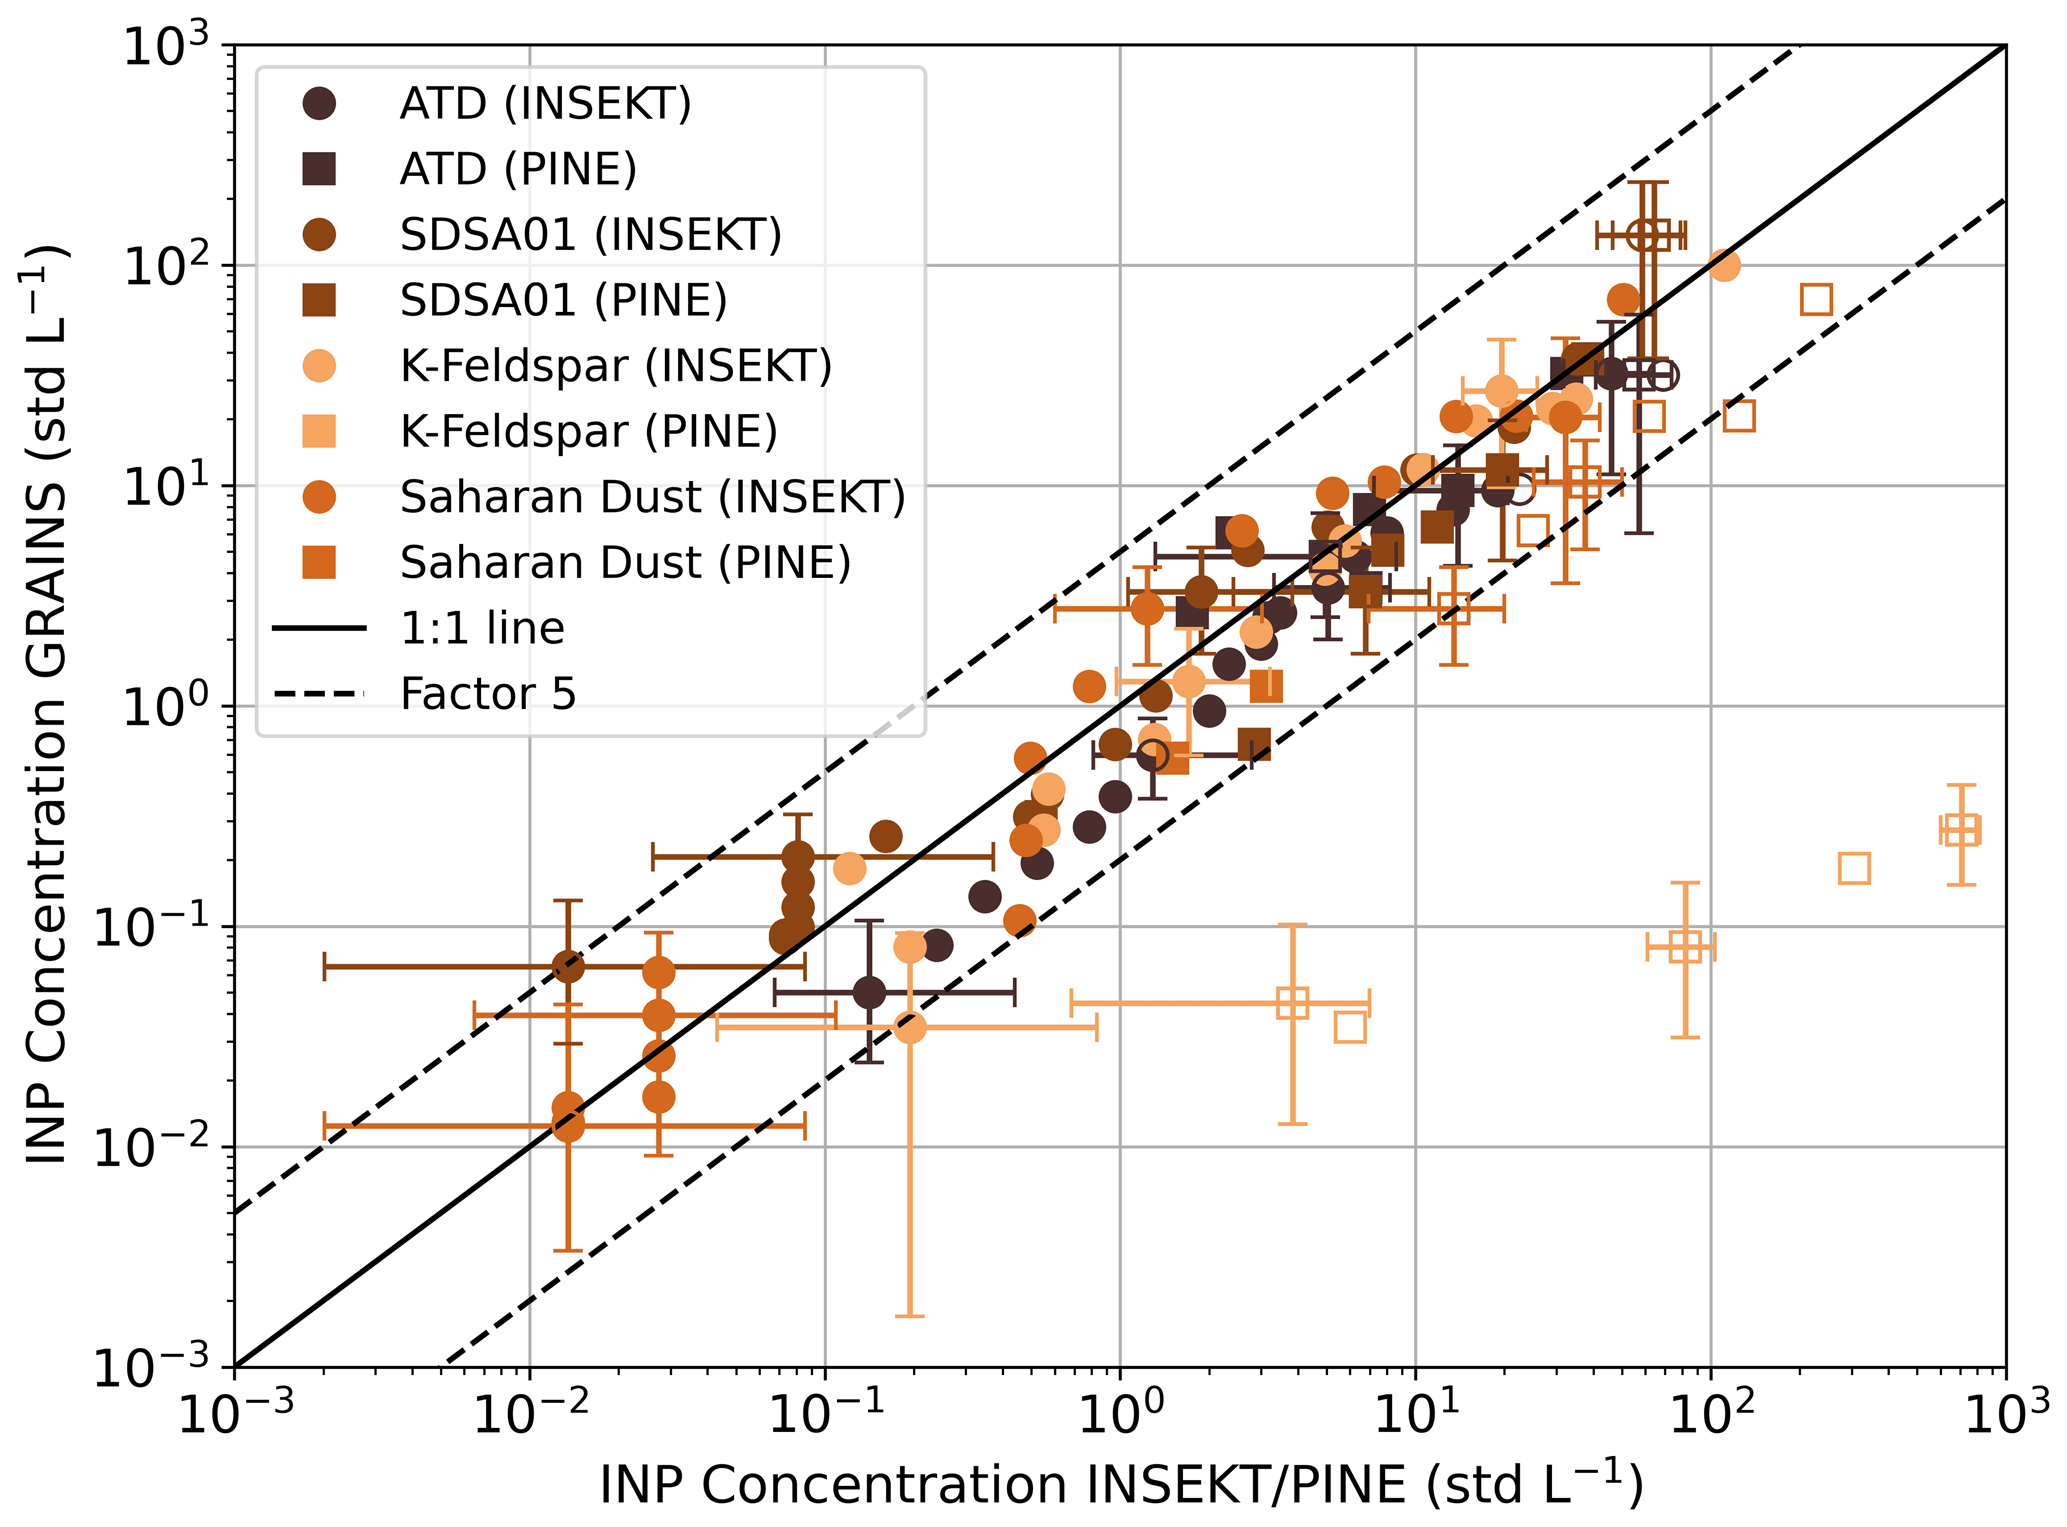
Figure 5INP concentration obtained with GRAINS compared to INP concentration obtained with INSEKT and PINE for the different dust particles sampled from the AIDAd chamber. The black solid line represents the 1:1 line and the black dashed lines represent a factor of 5 between INP concentrations. Filled markers (hollow markers) correspond to data points inside (outside) 95 % confidence interval of the 1:1 line, based on Agresti and Coull (1998). Uncertainties (shown every 6th data point for the INSEKT/GRAINS comparison and every 3rd data point for the PINE/GRAINS comparison) were obtained by evaluating the analytical expression of the INP concentration at the lower and upper confidence limits of the frozen fraction, which were calculated based on Agresti and Coull (1998) for GRAINS/INSEKT and as a combination of a 10 % of the INP concentration and the square root of the number of ice crystals for PINE.
4.3 Study of sampling and extraction methods for different filter substrates
In addition to the performance of GRAINS, both the filter substrate and the extraction method might influence the measured concentration of INPs in ambient samples. In this section, we evaluate the suitability of polycarbonate and quartz filter substrates, as well as two different extraction methods applied to the quartz filters. To do so, we make use of polycarbonate and quartz filter samples collected simultaneously at UGR urban background station (see Sect. 3.4 for further details). Figure 6 shows the average INP concentration spectra for each sampling method for the whole measurement period, where the shaded areas correspond to the standard error of each average spectrum. Overall, the freezing spectra derived from the three methods agree at temperatures above −15 °C, and measurements are mostly within standard error. In the range −10 to −7.5 °C the INP concentrations derived from the Quartz methods are lower than those from the Polycarbonate method. When looking at the individual spectra in Fig. S11 one can see that this feature is present during some specific days of the sampling period, where most of them correspond to pollution days and others to dust events. At temperatures below −15 °C, differences between the Quartz punch washed and the Polycarbonate methods are observed. Figure 6 (and specific spectra from Fig. S11) shows that the spectrum obtained from the polycarbonate filters tends to activate at higher temperatures (approximately 2 °C). This might be related to the fact that no aerosol size-cut was used to sample these filters, whereas the quartz filters were sampled using a PM10 inlet. Therefore, INP concentrations at higher temperatures could be related to the presence of larger particles on the polycarbonate filters, that are known to be highly efficient INPs (Chen et al., 2021; DeMott et al., 2009; Knopf and Alpert, 2023). However, due to the inlet design the presence of particles larger than 10 µm is not large, even under dusty conditions, so the differences might be related to the extraction efficiency of coarse mode particles depending on the filter type. Nevertheless, this should be tested with standard aerosol particles in the laboratory to confirm the hypothesis. Still, maximum absolute differences at −20 °C are around 0.12 L−1 between Quartz punch washed and Polycarbonate methods, and around 0.05 L−1 between the Quartz 96-punch and Polycarbonate methods. Since the INP concentrations from the Quartz 96-punch and Quartz punch washed methods are obtained from the same filter, it is expected that the differences between these two methods are small. In fact, maximum differences in INP concentration between these two methods are around 0.09 L−1 at −20 °C. Lacher et al. (2024) reported that lower INP concentrations in polycarbonate filters can be explained by the fact that maybe not all particles are released during the washing of polycarbonate filters, but they did not find any substantial differences when comparing polycarbonate filters with quartz filters (Quartz 96-punch method). Next to different sampling locations, the filters from Lacher et al. (2024) were collected at a mountain site in central France and thus likely contained different particle types, they only compared four samples and here we extend the comparison to 27 samples.
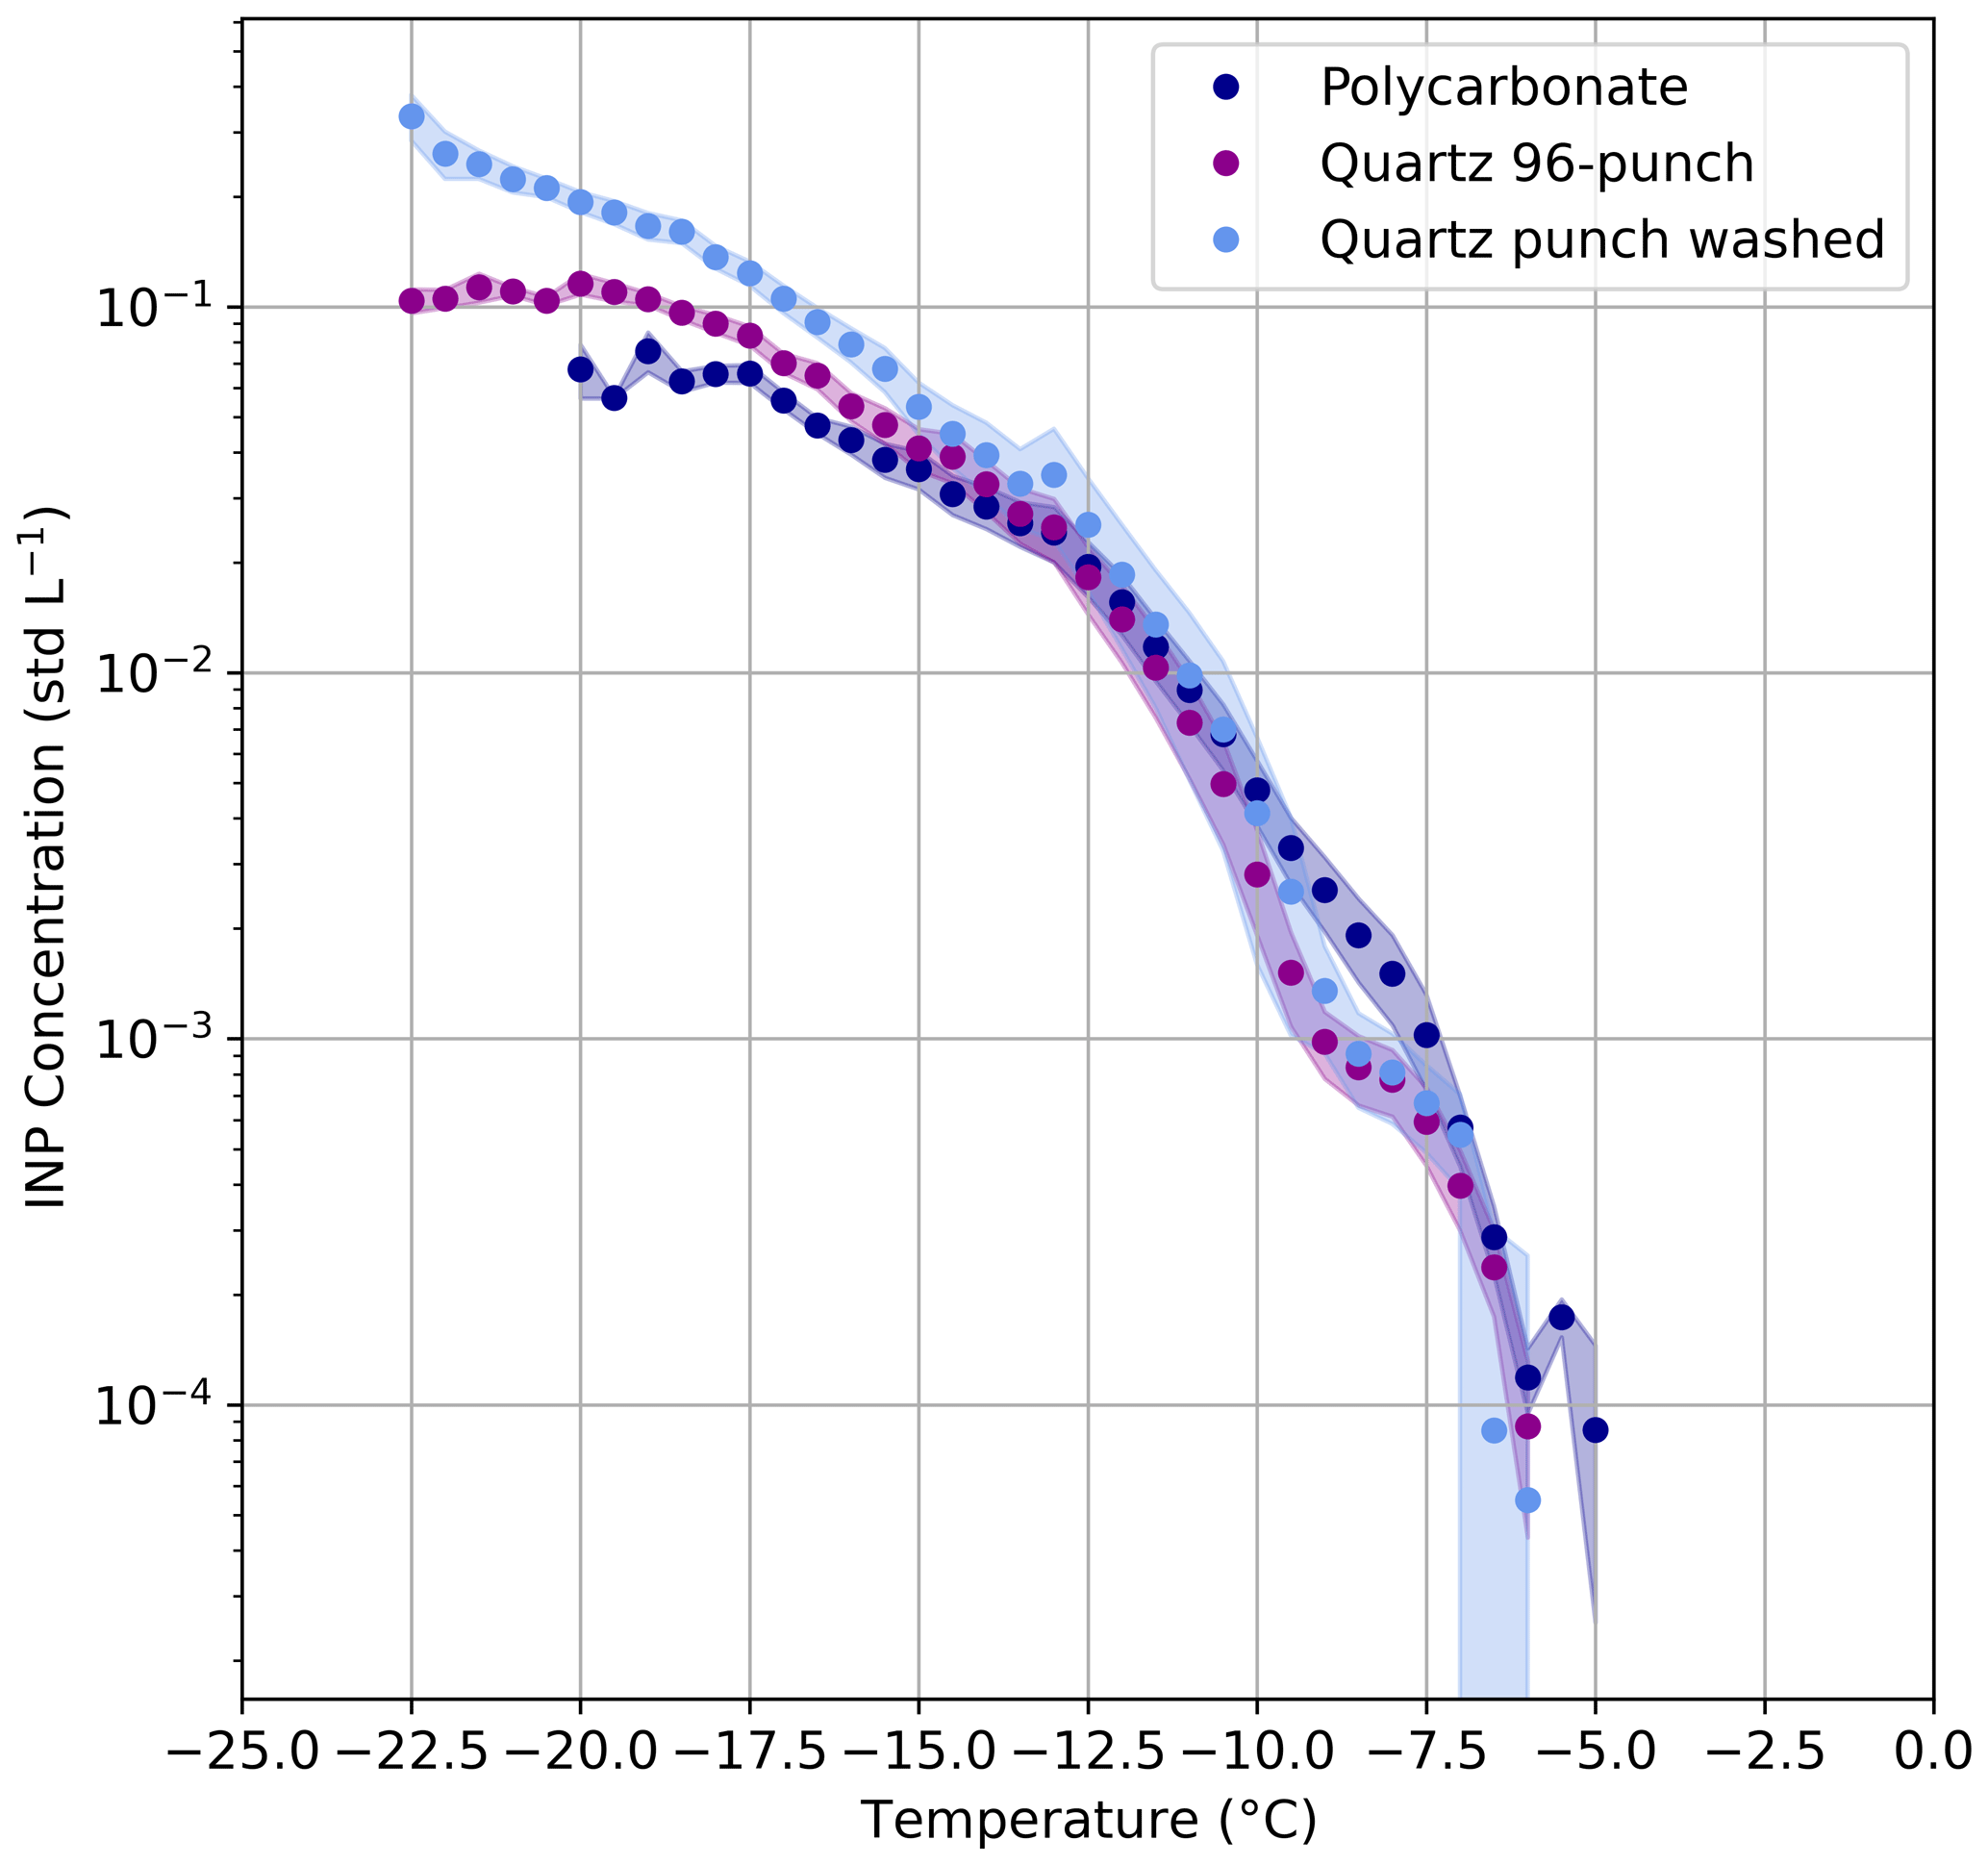
Figure 6Comparison of the different methods for sampling and analyzing INP. Data shown correspond to the average of the individual spectra. Shaded area represents the standard error of each method.
The individual comparison of the INP concentrations (shown in Fig. S11) involved in the average from Fig. 6 shows that the agreement between methods differs from day to day, which could originate from the nature of the particles in the sample. To assess this, we identified the dominant particle type on each sampling day based on aerosol optical and microphysical properties measured at the same station. We have analyzed the equivalent black carbon concentration (eBC), the ratio of concentration of fine and coarse particles, the scattering coefficients and the scattering Ångström exponent (SAE) at the surface, which are shown in Fig. S12. The analysis of the optical properties revealed that the majority of the sampling days corresponded to pollution days, with a few cases of cleaner/background conditions at the station. Additionally, there are several dust events and a biomass burning event (transported from Portugal) happening in the measurement period. Even though the city of Granada is near the Mediterranean Sea, the orographic situation limits the contribution of marine aerosol to the aerosol population (Titos et al., 2012, 2014), so the results shown are only representative of these aerosol conditions. We found that there is a general good agreement for most pollution events, with some differences during specific days where the INP concentration from the Polycarbonate method shows larger values at high temperatures. The biomass burning event shows a very good comparison of the three methods, as happened in most of the pollution days. For background conditions, there is also good agreement between methods apart from one day where the Polycarbonate method shows systematically lower INP concentrations. Lastly, concerning dust events, the comparison of the three methods shows different levels of agreement depending on the day. When the dust concentration is very high, we find that there is some disagreement between the methods at high temperatures, with higher INP concentrations for the Polycarbonate method. Even though this might be related to the differences in size cutoff in the sampling line, which can be especially relevant for dust, we did not observe a large contribution of particles larger than 10 µm in diameter in the size distribution measurements, so these differences might be related to a more efficient extraction of the dust particles with polycarbonate filters compared to quartz filters. Overall, results presented do not seem dependent on aerosol type and might be of general applicability under the specific aerosol conditions covered in this study (pollution/biomass burning, background conditions and dust events). However, since dust particles might differ from one event to another, further characterization of the methods with dust particles that are well characterized in size and chemical composition is necessary.
Since the Polycarbonate method is the most common method for studying INP concentrations in the atmosphere in an offline manner (e.g., Barry et al., 2021; Chen et al., 2021; Gong et al., 2022; Schneider et al., 2021) it will be considered as the reference method for the following statistical analysis. We have calculated the root mean squared errors (RMSE) of the Quartz 96-punch and Quartz punch washed methods with respect to the Polycarbonate method, as well as the Quartz 96-punch method with respect to the Quartz punch washed method, obtaining RMSE of 0.012, 0.036 and 0.024, respectively. The absolute differences between the techniques are low but dependent on the temperature (see Fig. S13). Ratios of the Quartz punch washed and the Polycarbonate methods range between 0.5 and 2.5, with an average factor (through all temperatures) of 1.30. For the comparison of the Quartz 96-punch and the Polycarbonate methods, the ratio ranges between 0.5 and 1.5, with an average of 0.95. Therefore, the three methods show good agreement between each other, indicating that quartz filters, typically used for chemical analysis, could potentially be used to extend global coverage of INP measurements. Still, further laboratory measurements are necessary to fully test the method with additional particle types, as the current study only covers some specific aerosol conditions, mainly with presence of pollution particles and dust.
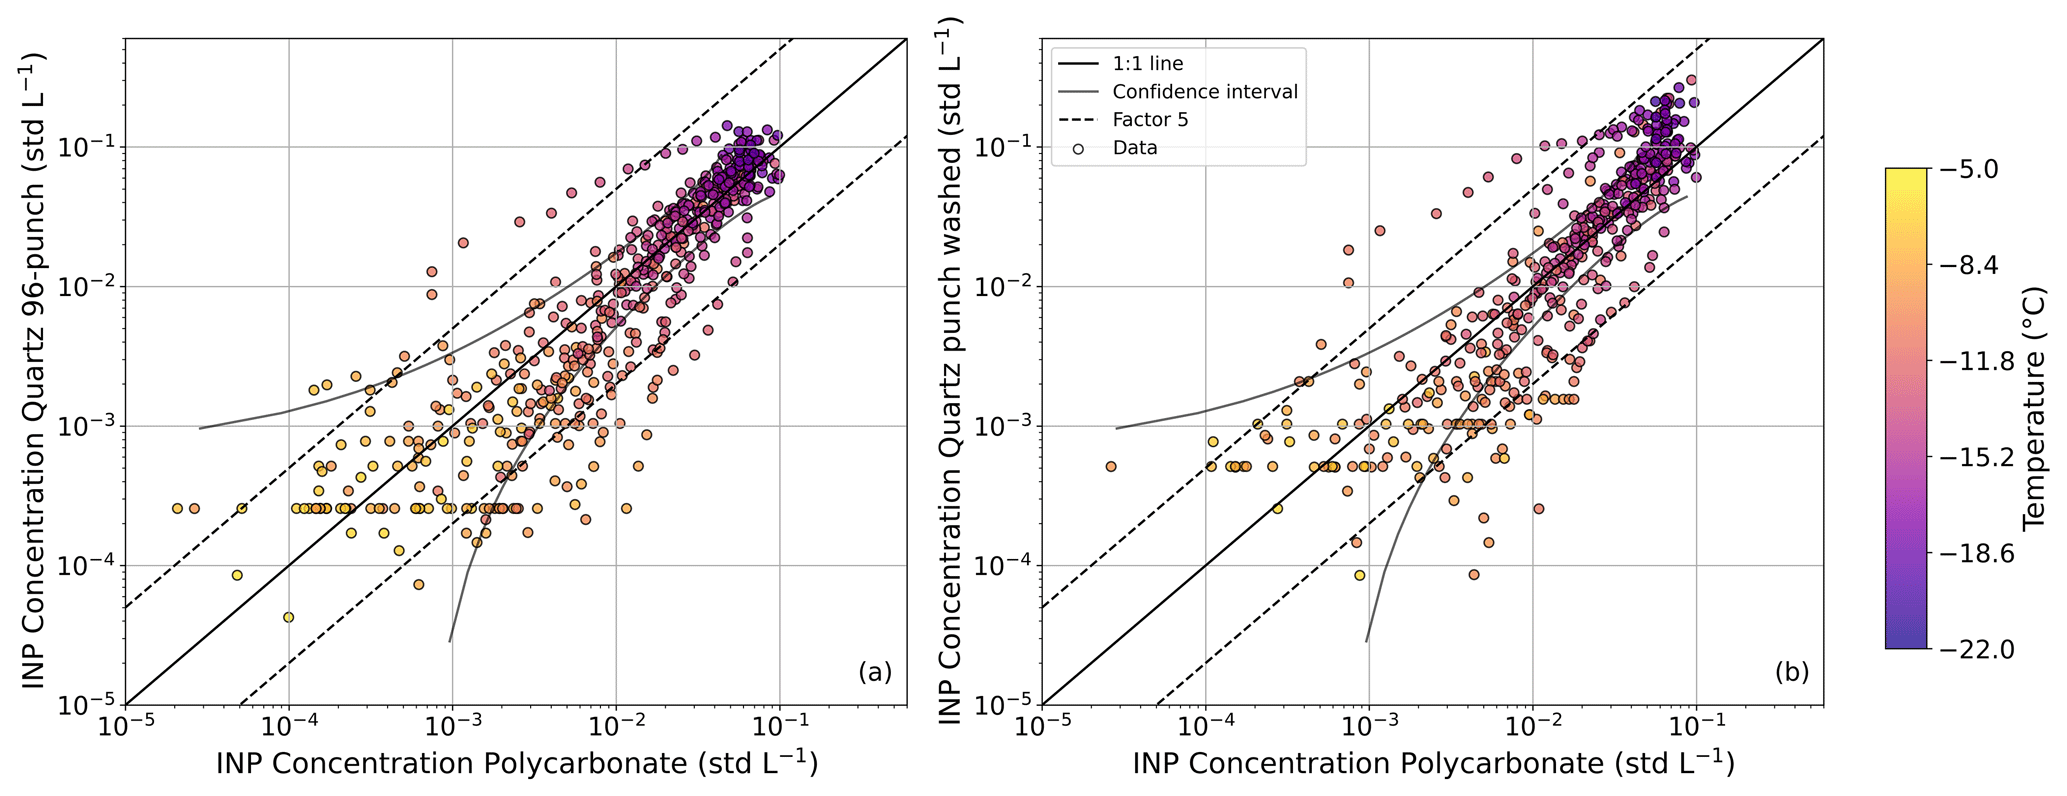
Figure 7INP concentrations obtained with the Quartz 96-punch method (a) and the Quartz punch washed method (b) compared to the INP concentrations from the Polycarbonate method. Color bar represents the activation temperature for the measured INPs. The black solid line represents the 1:1 line, the gray solid line corresponds to the confidence interval based on Agresti and Coull (1998) and the black dashed lines correspond to a factor of 5.
To observe the data in a more complete way for the entire measurement period, Fig. 7 represents the INP concentrations obtained from the quartz filters with respect to the one obtained with the polycarbonate filters. The color scale is representative of the temperature at which each INP concentration is obtained. In general, the INP concentrations obtained are close to the 1:1 line, with 88 % of the data points within a factor of 5 for the different methods. Both panels in Fig. 7 also show some deviation depending on the temperature range. At higher temperatures, the data mostly fall within the confidence intervals. These values correspond to the temperatures at which the aerosol particles start to activate, and from the individual spectra used to obtain Fig. 6 we have observed that this activation temperature changes depending on the sample analyzed, being higher for the polycarbonate filters than for the quartz filters. Also, in both panels of Fig. 7, there are constant values in the INP concentrations from quartz filters for varying INP concentrations from polycarbonate filters. Rather than coming from one specific sample, these values are a combination of several INP spectra from quartz filters that present constant values. This is due to the fact that the number of frozen samples can stay constant for a changing temperature, leading to a flat INP spectra (see for example the UTO INP spectra in Fig. S8). As the temperature decreases, the trend of the data does not exactly follow the 1:1 line, but shows a steeper slope. This was expected by looking at Fig. 6, where the average INP concentrations obtained with the quartz samples were higher than those obtained with the polycarbonate samples. According to Conen et al. (2012), the fibers from quartz filters do not contribute to the INP concentration at temperatures higher than −12 °C. On the other hand, from Harrison et al. (2019) one could expect that the quartz fibers could act as INP at lower temperatures, and this could explain the differences observed in our results for the Quartz methods as compared to the Polycarbonate method. However, as observed in Fig. S5, the average frozen fraction curves of the handling filters (6 experiments per method) show lower values for both Quartz methods, so in our case it seems that there is very little contribution of the quartz fibers to the total INP concentration, as extracted from Figs. 6 and S11. Still, the background signals of the filters should always be analyzed to guarantee the accuracy of the INP measurements.
Figure S14 shows boxplots of the absolute and relative differences of the INP concentration of quartz filter methods compared to the Polycarbonate method at twelve different temperatures, ranging from −18 to −7 °C in steps of 1 °C. Since the extreme temperatures (−5 and −22 °C) might not be representative for all the samples (some samples might activate at temperatures below −5 °C or reach maximum INP concentrations at temperatures above −22 °C), we have only considered temperatures for which there is a sufficient number of samples (Fig. S14). As anticipated, Fig. S14 shows that the median of the absolute differences in INP concentration increase with decreasing temperature. For relative differences this increase is also present for temperatures between −12 and −18 °C, but at higher temperatures the relative differences reach very high values due to the small values of the INP concentrations at these temperatures. Even though there is a clear increase in the differences in INP concentration, this increase is more pronounced when comparing the Quartz punch washed with the Polycarbonate method, especially for absolute differences. In fact, absolute differences between the Quartz punch washed and Polycarbonate methods at low temperatures can reach the same order of magnitude as the INP concentration itself. This is something that was already observed in previous intercomparison studies (DeMott et al., 2025), where differences between INP spectra reached up to one order of magnitude, which can have an impact on model predictions (Phillips et al., 2003).
Figures 6, 7 and S14 show that the three methods present no differences (mostly within standard error) at temperatures higher than −15 °C. However, the methods start to show differences towards lower temperatures, with INP concentration values obtained with the Quartz punch washed and Quartz 96-punch higher than those obtained with the Polycarbonate method. These differences could be related to the contribution to the INP concentration of quartz fibers, but from the frozen fractions of the handling filters for each method (Fig. S5) we do not expect this to be the cause. Another reason could be that the INP concentration obtained with the Polycarbonate method might be underestimated due to sampling losses or due to an inefficient particle extraction during the filter washing for some types of particles. Still, at lower temperatures there are fewer individual spectra involved in the final averages because of the ice nucleation ability of the individual samples, so further laboratory studies with different types of particles are necessary to evaluate the differences between methods in a broader temperature/concentration range. Nevertheless, there seems to be good correlation between both data sets throughout the entire temperature range measured in this study. We have calculated Spearman's correlation coefficient, obtaining values of 0.910 for the Quartz 96-punch and Polycarbonate data sets, and of 0.906 for the Quartz punch washed and Polycarbonate data sets (p<0.05). Therefore, the methods are clearly related, with a slightly higher positive correlation between the Quartz 96-punch method and the Polycarbonate method. Again, these differences between the substrates need to be investigated in more detail, by sampling well-known particles that are characterized in composition and size. This would potentially allow to extend the existing INP database by using standard PM10 quartz filters that are commonly and regularly sampled at many atmospheric observatories, allowing a more comprehensive characterization of atmospheric ice nucleation in different environments. Also, the Quartz punch washed method is less time consuming than the Quartz 96-punch method reducing operational costs at the laboratory. Additionally, the Quartz punch washed method allows to perform dilutions of the sample as for the Polycarbonate method, so it could become a better option for analyzing INP concentration in Quartz filters, due to the extension of the concentration range towards lower temperatures.
This study presents the development, characterization and validation experiments of a new droplet freezing array deployed in the AGORA Observatory in Southern Spain, the GRAnada Ice Nuclei Spectrometer (GRAINS), which is based on the design of the Colorado State University Ice Spectrometer (CSU-IS). After conducting experiments to accurately determine the temperature measurements in GRAINS, we report a temperature uncertainty below 0.5 °C. In order to test the performance of GRAINS, we have applied different approaches, consisting of comparing the ice nucleation ability of well-known samples to the INP concentrations obtained with GRAINS. First, we confirmed that GRAINS is capable of consistently reproducing the freezing spectra of NX Illite, a mineral powder that was used as a sample for intercomparison studies of immersion freezing devices before. Experiments were performed using two different aerosol generation methods: direct wet suspension and dry dispersion with atomization of the particles and subsequent filter sampling. Despite differences in sample generation and mass concentration, the density of ice nucleation active sites (ns(T)) obtained with GRAINS showed good reproducibility and is within the range reported by other instruments in the literature and parametrizations proposed for NX Illite. Then, the ability of GRAINS to characterize ambient samples was evaluated through a comparison with two well-established droplet freezing arrays: the Freezing Experiment Setup Helsinki (FrESH) and the Ice Nucleation Spectrometer of the Karlsruhe Institute of Technology (INSEKT), which is also a re-built of CSU-IS. Overall, the INP concentration spectra obtained with GRAINS are in agreement with those obtained with FrESH and INSEKT, with 83 % of the data falling within the region delimited by a comparison factor of 5, which is satisfactory given the differences in the protocols of the immersion freezing devices, such as droplet volume or cooling rate, as well as the transportation of filters and filters handling. To finalize with the evaluation of GRAINS, it was also compared with INSEKT and with the Portable Ice Nucleation Experiment (PINE) by evaluating the ice nucleation ability of dust particles sampled from the AIDAd (Aerosol Interaction and Dynamics in the Atmosphere – dynamic) chamber. Experiments were conducted using two commercially available dust samples, ATD and K-Feldspar, and two dust samples from the Sahara Desert and from South Africa. Again, the measurements from GRAINS showed good agreement with INSEKT and, in most cases, also with PINE. In this sense, the ns of K-Feldspar differed in two orders of magnitude between PINE and the droplet freezing arrays, probably because the offline methods underestimate the ice nucleation ability of this highly active sample. Still, further study is necessary to understand these differences.
Furthermore, we have used GRAINS to evaluate different sampling and particle extraction methods to determine the INP concentration in the atmosphere. The Polycarbonate method, the most common, consists of sampling particles on polycarbonate filters and then washing them in ultrapure water. The other two methods involved sampling quartz filters, commonly used for chemical analysis. The Quartz 96-punch consists of punching the filter 96 times with a biopsy punch of 1 mm of diameter and placing each punch into one PCR plate well filled with ultrapure water. The Quartz punch washed method consists of punching a larger region of the quartz filter (1 cm of diameter) and then washing it in ultrapure water similarly to the Polycarbonate method. The results show consistency among the three methods, especially at high temperatures (), where the absolute differences are smaller and within the standard error. At lower temperatures, the discrepancies increase slightly, being most noticeable in the Quartz punch washed method compared to the Polycarbonate method, from which higher INP concentrations are derived. These differences could be related to the possible contribution of fiber quartz to the measured INP concentration, although based on the blank filters of the Quartz method this is unlikely, and to a possible underestimation of the INP concentration with the Polycarbonate method, either due to sampling losses or due to particle extraction efficiency during filter washing, although to confirm this, further laboratory tests should be performed. Statistical analyses revealed Spearman's correlation coefficients of 0.910 (Quartz 96-punch and Polycarbonate) and 0.906 (Quartz punch washed and Polycarbonate), so despite the differences observed, the high positive correlation indicates that the three methods provide consistent information on the INP concentrations. Still, more experiments regarding the different sampling substrates should be conducted involving different types of particles that cover a wider range of INP concentration and thus, temperature. This is especially necessary given the fact that the results in this study are only representative of some aerosol conditions, mainly involving pollution and dust particles. Laboratory experiments with particles that are well characterized in composition and size would shed further light on the differences between the different methods evaluated here. With this, the Quartz punch washed method could become a good alternative to evaluate the INP concentration from quartz filters, as it allows the possibility of performing dilutions and extend the INP concentration range with a less time-consuming procedure than the Quartz 96-punch. Furthermore, it allows the use of quartz filters already present in many atmospheric observation networks dedicated to chemical analysis, thus expanding the potential for INP monitoring without the need for additional infrastructure. Again, these differences between the substrates need to be further investigated by sampling well-known particles, so that any potential differences in the INP concentrations can be entirely attributed to the different methods used.
Overall, these results demonstrate that GRAINS is an accurate instrument for determining INP concentrations in the atmosphere, similarly to existing offline immersion freezing devices. Furthermore, we have evaluated that quartz filters, which are commonly used for chemical analysis, can also be used to determine the INP concentration in the atmosphere, especially when washing a punch of the filter in ultrapure water because it allows to perform dilutions and extend the concentration range. Even though further laboratory studies are needed to evaluate the difference between methods in controlled conditions, these findings open up new opportunities to expand INP datasets by making use of existing monitoring networks that already collect quartz filters for other analyses, which would allow a more comprehensive characterization of atmospheric ice nucleation in different environments.
Code and data will be available upon request.
The supplement related to this article is available online at https://doi.org/10.5194/amt-19-2695-2026-supplement.
EB and ORG analyzed the data. EB wrote the manuscript. GT and AC defined the structure of the paper, conceptualized the investigation, supervised the writing of the manuscript and were responsible for the project administration and funding acquisition. NK and NSU designed the AIDAd experiments and operated AIDAd. AB, KH, NK, LL, OM and NSU assisted in the AIDAd experiments and in the data analysis of INSEKT, PINE and AIDAd. GPF, AAP and AW supported EB in the INP analysis protocol and assisted in the data analysis of FrESH. All authors contributed to the discussion of the results and provided comments on the paper.
The contact author has declared that none of the authors has any competing interests.
Publisher's note: Copernicus Publications remains neutral with regard to jurisdictional claims made in the text, published maps, institutional affiliations, or any other geographical representation in this paper. The authors bear the ultimate responsibility for providing appropriate place names. Views expressed in the text are those of the authors and do not necessarily reflect the views of the publisher.
This work was supported by MIX/DUST project (PID2024.160280NB.I00) and NU/CLEUS project (PID2021-128757OB-I00) funded by MCIU/ AEI/10.13039/501100011033 and “ERDF/EU”, BIOD22_001 and BIOD22_002, funded by Consejería de Universidad, Investigación e Innovación and Gobierno de España and Unión Europea – NextGenerationEU, by the European Union`s Horizon 2020 research and innovation program through project ACTRIS.IMP (grant agreement no. 871115), ATMO_ACCESS (grant agreement no. 101008004) and IRISCC(HORIZON-INFRA-2023-SERV-01-01_RIA, Grant Agreement no.: 101131261) the MICIU strategic network ACTRIS-España (RED2022-134824-E and RED2024-153821-E) and by University of Granada Plan Propio through Excellence Research Unit Earth Science (UCE-PP2017-02) and Singular Laboratory AGORA (LS2022-1) program). E. Bazo received funding from MCIN/AEI/10.13039/ 501100011033 and the FSE + (ref. PRE2022-101272). G. Perez Fogwill, A. Welti and A. A. Piedehierro thank the Research Council of Finland for the funding 342227 (DASI), 336557 and 345125 (MEDICEN). N.S. Umo acknowledges Research Funding from the University of North Carolina Wilmington, USA. N. Kim acknowledges Research Funding from the Korea Institute of Science and Technology, Republic of Korea. We thank N. Hiranuma, T. Santl-Temkiv, C. Wieber, R. O. David and N. Borduas-Dedekind for providing the NX Illite data from Fig. 3.
This work was supported by MIXDUST project (PID2024.160280NB.I00) funded by MCIU/AEI/10.13039/501100011033 and ERDF, EU.
This paper was edited by Mingjin Tang and reviewed by two anonymous referees.
Agresti, A. and Coull, B. A.: Approximate is Better than “Exact” for Interval Estimation of Binomial Proportions, Am. Stat., 52, 119–126, https://doi.org/10.1080/00031305.1998.10480550, 1998.
Atkinson, J. D., Murray, B. J., Woodhouse, M. T., Whale, T. F., Baustian, K. J., Carslaw, K. S., Dobbie, S., O'Sullivan, D., and Malkin, T. L.: The importance of feldspar for ice nucleation by mineral dust in mixed-phase clouds, Nature, 498, 355–358, https://doi.org/10.1038/nature12278, 2013.
Barry, K. R., Hill, T. C. J., Levin, E. J. T., Twohy, C. H., Moore, K. A., Weller, Z. D., Toohey, D. W., Reeves, M., Campos, T., Geiss, R., Schill, G. P., Fischer, E. V., Kreidenweis, S. M., and DeMott, P. J.: Observations of Ice Nucleating Particles in the Free Troposphere From Western US Wildfires, J. Geophys. Res.-Atmos., 126, https://doi.org/10.1029/2020JD033752, 2021.
Bazo, E., Pérez-Ramírez, D., Valenzuela, A., Martins, J. V., Titos, G., Cazorla, A., Rejano, F., Patrón, D., Díaz-Zurita, A., García-Izquierdo, F. J., Fuertes, D., Alados-Arboledas, L., and Olmo, F. J.: Phase matrix characterization of long-range-transported Saharan dust using multiwavelength-polarized polar imaging nephelometry, Atmos. Chem. Phys., 25, 6325–6352, https://doi.org/10.5194/acp-25-6325-2025, 2025.
Beall, C. M., Lucero, D., Hill, T. C., DeMott, P. J., Stokes, M. D., and Prather, K. A.: Best practices for precipitation sample storage for offline studies of ice nucleation in marine and coastal environments, Atmos. Meas. Tech., 13, 6473–6486, https://doi.org/10.5194/amt-13-6473-2020, 2020.
Boucher, O., Randall, D., Artaxo, P., Bretherton, C., Feingold, G., Forster, P., Kerminen, V.-M., Kondo, Y., Liao, H., Lohmann, U., Rasch, P., Satheesh, S. K., Sherwood, S., Stevens, B., and Zhang, X. Y.: Clouds and aerosols, in: Climate Change 2013: The Physical Science Basis. Contribution of Working Group I to the Fifth Assessment Report of the Intergovernmental Panel on Climate Change, edited by: Stocker, T. F., Qin, D., Plattner, G.-K., Tignor, M., Allen, S. K., Doschung, J., Nauels, A., Xia, Y., Bex, V., and Midgley, P. M., Cambridge University Press, 571–657, https://doi.org/10.1017/CBO9781107415324.016, 2013.
Bras, Y., Freney, E., Canzi, A., Amato, P., Bouvier, L., Pichon, J., Picard, D., Minguillón, M. C., Pérez, N., and Sellegri, K.: Seasonal Variations, Origin, and Parameterization of Ice-Nucleating Particles at a Mountain Station in Central France, Earth Space Sci., 11, https://doi.org/10.1029/2022EA002467, 2024.
Broadley, S. L., Murray, B. J., Herbert, R. J., Atkinson, J. D., Dobbie, S., Malkin, T. L., Condliffe, E., and Neve, L.: Immersion mode heterogeneous ice nucleation by an illite rich powder representative of atmospheric mineral dust, Atmos. Chem. Phys., 12, 287–307, https://doi.org/10.5194/acp-12-287-2012, 2012.
Brunauer, S., Emmett, P. H., and Teller, E.: Adsorption of Gases in Multimolecular Layers, J. Am. Chem. Soc., 60, 309–319, https://doi.org/10.1021/ja01269a023, 1938.
Cazorla, A., Casquero-Vera, J. A., Román, R., Guerrero-Rascado, J. L., Toledano, C., Cachorro, V. E., Orza, J. A. G., Cancillo, M. L., Serrano, A., Titos, G., Pandolfi, M., Alastuey, A., Hanrieder, N., and Alados-Arboledas, L.: Near-real-time processing of a ceilometer network assisted with sun-photometer data: monitoring a dust outbreak over the Iberian Peninsula, Atmos. Chem. Phys., 17, 11861–11876, https://doi.org/10.5194/acp-17-11861-2017, 2017.
Chen, J., Wu, Z., Chen, J., Reicher, N., Fang, X., Rudich, Y., and Hu, M.: Size-resolved atmospheric ice-nucleating particles during East Asian dust events, Atmos. Chem. Phys., 21, 3491–3506, https://doi.org/10.5194/acp-21-3491-2021, 2021.
Conen, F., Henne, S., Morris, C. E., and Alewell, C.: Atmospheric ice nucleators active can be quantified on PM10 filters, Atmos. Meas. Tech., 5, 321–327, https://doi.org/10.5194/amt-5-321-2012, 2012.
Córdoba, F., Ramírez-Romero, C., Cabrera, D., Raga, G. B., Miranda, J., Alvarez-Ospina, H., Rosas, D., Figueroa, B., Kim, J. S., Yakobi-Hancock, J., Amador, T., Gutierrez, W., García, M., Bertram, A. K., Baumgardner, D., and Ladino, L. A.: Measurement report: Ice nucleating abilities of biomass burning, African dust, and sea spray aerosol particles over the Yucatán Peninsula, Atmos. Chem. Phys., 21, 4453–4470, https://doi.org/10.5194/acp-21-4453-2021, 2021.
Creamean, J. M., Hume, C. C., Vazquez, M., and Theisen, A.: Long-term measurements of ice nucleating particles at Atmospheric Radiation Measurement (ARM) sites worldwide, Earth Syst. Sci. Data, 17, 6943–6963, https://doi.org/10.5194/essd-17-6943-2025, 2025.
David, R. O., Cascajo-Castresana, M., Brennan, K. P., Rösch, M., Els, N., Werz, J., Weichlinger, V., Boynton, L. S., Bogler, S., Borduas-Dedekind, N., Marcolli, C., and Kanji, Z. A.: Development of the DRoplet Ice Nuclei Counter Zurich (DRINCZ): validation and application to field-collected snow samples, Atmos. Meas. Tech., 12, 6865–6888, https://doi.org/10.5194/amt-12-6865-2019, 2019.
de Boer, G., Hashino, T., and Tripoli, G. J.: Ice nucleation through immersion freezing in mixed-phase stratiform clouds: Theory and numerical simulations, Atmos. Res., 96, 315–324, https://doi.org/10.1016/j.atmosres.2009.09.012, 2010.
DeMott, P. J., Petters, M. D., Prenni, A. J., Carrico, C. M., Kreidenweis, S. M., Collett, J. L., and Moosmüller, H.: Ice nucleation behavior of biomass combustion particles at cirrus temperatures, J. Geophys. Res.-Atmos., 114, https://doi.org/10.1029/2009JD012036, 2009.
DeMott, P. J., Möhler, O., Cziczo, D. J., Hiranuma, N., Petters, M. D., Petters, S. S., Belosi, F., Bingemer, H. G., Brooks, S. D., Budke, C., Burkert-Kohn, M., Collier, K. N., Danielczok, A., Eppers, O., Felgitsch, L., Garimella, S., Grothe, H., Herenz, P., Hill, T. C. J., Höhler, K., Kanji, Z. A., Kiselev, A., Koop, T., Kristensen, T. B., Krüger, K., Kulkarni, G., Levin, E. J. T., Murray, B. J., Nicosia, A., O'Sullivan, D., Peckhaus, A., Polen, M. J., Price, H. C., Reicher, N., Rothenberg, D. A., Rudich, Y., Santachiara, G., Schiebel, T., Schrod, J., Seifried, T. M., Stratmann, F., Sullivan, R. C., Suski, K. J., Szakáll, M., Taylor, H. P., Ullrich, R., Vergara-Temprado, J., Wagner, R., Whale, T. F., Weber, D., Welti, A., Wilson, T. W., Wolf, M. J., and Zenker, J.: The Fifth International Workshop on Ice Nucleation phase 2 (FIN-02): laboratory intercomparison of ice nucleation measurements, Atmos. Meas. Tech., 11, 6231–6257, https://doi.org/10.5194/amt-11-6231-2018, 2018.
DeMott, P. J., Mirrielees, J. A., Petters, S. S., Cziczo, D. J., Petters, M. D., Bingemer, H. G., Hill, T. C. J., Froyd, K., Garimella, S., Hallar, A. G., Levin, E. J. T., McCubbin, I. B., Perring, A. E., Rapp, C. N., Schiebel, T., Schrod, J., Suski, K. J., Weber, D., Wolf, M. J., Zawadowicz, M., Zenker, J., Möhler, O., and Brooks, S. D.: Field intercomparison of ice nucleation measurements: the Fifth International Workshop on Ice Nucleation Phase 3 (FIN-03), Atmos. Meas. Tech., 18, 639–672, https://doi.org/10.5194/amt-18-639-2025, 2025.
Forster, P., Storelvmo, T., Armour, K., Collins, W., Dufresne, J.-L., Frame, D., Lunt, D. J., Mauritsen, T., Palmer, M. D., Watanabe, M., Wild, M., and Zhang, H.: The Earth's Energy Budget, Climate Feedbacks, and Climate Sensitivity, in: Climate Change 2021: The Physical Science Basis. Contribution of Working Group I to the Sixth Assessment Report of the Intergovernmental Panel on Climate Change, edited by: Masson-Delmotte, V., Zhai, P., Pirani, A., Connors, S. L., Péan, C., Berger, S., Caud, N., Chen, Y., Goldfarb, L., Gomis, M. I., Huang, M., Leitzell, K., Lonnoy, E., Matthews, J. B. R., Maycock, T. K., Waterfield, T., Yelekçi, O. , Yu, R., and Zhou, B., Cambridge University Press, 953–1054, https://doi.org/10.1017/9781009157896.009, 2021.
Garcia, E., Hill, T. C. J., Prenni, A. J., DeMott, P. J., Franc, G. D., and Kreidenweis, S. M.: Biogenic ice nuclei in boundary layer air over two U. S. High Plains agricultural regions, J. Geophys. Res., 117, D18209, https://doi.org/10.1029/2012JD018343, 2012.
Gong, X., Radenz, M., Wex, H., Seifert, P., Ataei, F., Henning, S., Baars, H., Barja, B., Ansmann, A., and Stratmann, F.: Significant continental source of ice-nucleating particles at the tip of Chile's southernmost Patagonia region, Atmos. Chem. Phys., 22, 10505–10525, https://doi.org/10.5194/acp-22-10505-2022, 2022.
Harrison, A. D., Whale, T. F., Carpenter, M. A., Holden, M. A., Neve, L., O'Sullivan, D., Vergara Temprado, J., and Murray, B. J.: Not all feldspars are equal: a survey of ice nucleating properties across the feldspar group of minerals, Atmos. Chem. Phys., 16, 10927–10940, https://doi.org/10.5194/acp-16-10927-2016, 2016.
Harrison, A. D., Whale, T. F., Rutledge, R., Lamb, S., Tarn, M. D., Porter, G. C. E., Adams, M. P., McQuaid, J. B., Morris, G. J., and Murray, B. J.: An instrument for quantifying heterogeneous ice nucleation in multiwell plates using infrared emissions to detect freezing, Atmos. Meas. Tech., 11, 5629–5641, https://doi.org/10.5194/amt-11-5629-2018, 2018.
Harrison, A. D., Lever, K., Sanchez-Marroquin, A., Holden, M. A., Whale, T. F., Tarn, M. D., McQuaid, J. B., and Murray, B. J.: The ice-nucleating ability of quartz immersed in water and its atmospheric importance compared to K-feldspar, Atmos. Chem. Phys., 19, 11343–11361, https://doi.org/10.5194/acp-19-11343-2019, 2019.
Heymsfield, A. J., Schmitt, C., Chen, C.-C.-J., Bansemer, A., Gettelman, A., Field, P. R., and Liu, C.: Contributions of the Liquid and Ice Phases to Global Surface Precipitation: Observations and Global Climate Modeling, J. Atmos. Sci., 77, 2629–2648, https://doi.org/10.1175/JAS-D-19-0352.1, 2020.
Hill, T. C. J., Moffett, B. F., DeMott, P. J., Georgakopoulos, D. G., Stump, W. L., and Franc, G. D.: Measurement of Ice Nucleation-Active Bacteria on Plants and in Precipitation by Quantitative PCR, Appl. Environ. Microb., 80, 1256–1267, https://doi.org/10.1128/AEM.02967-13, 2014.
Hill, T. C. J., DeMott, P. J., Tobo, Y., Fröhlich-Nowoisky, J., Moffett, B. F., Franc, G. D., and Kreidenweis, S. M.: Sources of organic ice nucleating particles in soils, Atmos. Chem. Phys., 16, 7195–7211, https://doi.org/10.5194/acp-16-7195-2016, 2016.
Hiranuma, N., Augustin-Bauditz, S., Bingemer, H., Budke, C., Curtius, J., Danielczok, A., Diehl, K., Dreischmeier, K., Ebert, M., Frank, F., Hoffmann, N., Kandler, K., Kiselev, A., Koop, T., Leisner, T., Möhler, O., Nillius, B., Peckhaus, A., Rose, D., Weinbruch, S., Wex, H., Boose, Y., DeMott, P. J., Hader, J. D., Hill, T. C. J., Kanji, Z. A., Kulkarni, G., Levin, E. J. T., McCluskey, C. S., Murakami, M., Murray, B. J., Niedermeier, D., Petters, M. D., O'Sullivan, D., Saito, A., Schill, G. P., Tajiri, T., Tolbert, M. A., Welti, A., Whale, T. F., Wright, T. P., and Yamashita, K.: A comprehensive laboratory study on the immersion freezing behavior of illite NX particles: a comparison of 17 ice nucleation measurement techniques, Atmos. Chem. Phys., 15, 2489–2518, https://doi.org/10.5194/acp-15-2489-2015, 2015.
Hoose, C., Kristjánsson, J. E., Chen, J.-P., and Hazra, A.: A Classical-Theory-Based Parameterization of Heterogeneous Ice Nucleation by Mineral Dust, Soot, and Biological Particles in a Global Climate Model, J. Atmos. Sci., 67, 2483–2503, https://doi.org/10.1175/2010JAS3425.1, 2010.
Kanji, Z. A., Ladino, L. A., Wex, H., Boose, Y., Burkert-Kohn, M., Cziczo, D. J., and Krämer, M.: Overview of Ice Nucleating Particles, Meteor. Mon., 58, 1.1–1.33, https://doi.org/10.1175/amsmonographs-d-16-0006.1, 2017.
Knopf, D. A. and Alpert, P. A.: Atmospheric ice nucleation, Nat. Rev. Phys., 5, 203–217, https://doi.org/10.1038/s42254-023-00570-7, 2023.
Kumar, A., Marcolli, C., Luo, B., and Peter, T.: Ice nucleation activity of silicates and aluminosilicates in pure water and aqueous solutions – Part 1: The K-feldspar microcline, Atmos. Chem. Phys., 18, 7057–7079, https://doi.org/10.5194/acp-18-7057-2018, 2018.
Kunert, A. T., Lamneck, M., Helleis, F., Pöschl, U., Pöhlker, M. L., and Fröhlich-Nowoisky, J.: Twin-plate Ice Nucleation Assay (TINA) with infrared detection for high-throughput droplet freezing experiments with biological ice nuclei in laboratory and field samples, Atmos. Meas. Tech., 11, 6327–6337, https://doi.org/10.5194/amt-11-6327-2018, 2018.
Lacher, L., Adams, M. P., Barry, K., Bertozzi, B., Bingemer, H., Boffo, C., Bras, Y., Büttner, N., Castarede, D., Cziczo, D. J., DeMott, P. J., Fösig, R., Goodell, M., Höhler, K., Hill, T. C. J., Jentzsch, C., Ladino, L. A., Levin, E. J. T., Mertes, S., Möhler, O., Moore, K. A., Murray, B. J., Nadolny, J., Pfeuffer, T., Picard, D., Ramírez-Romero, C., Ribeiro, M., Richter, S., Schrod, J., Sellegri, K., Stratmann, F., Swanson, B. E., Thomson, E. S., Wex, H., Wolf, M. J., and Freney, E.: The Puy de Dôme ICe Nucleation Intercomparison Campaign (PICNIC): comparison between online and offline methods in ambient air, Atmos. Chem. Phys., 24, 2651–2678, https://doi.org/10.5194/acp-24-2651-2024, 2024.
Ladino, L. A., Juaréz-Pérez, J., Ramírez-Díaz, Z., Miller, L. A., Herrera, J., Raga, G. B., Simpson, K. G., Cruz, G., Pereira, D. L., and Córdoba, F.: The UNAM-droplet freezing assay: An evaluation of the ice nucleating capacity of the sea-surface microlayer and surface mixed layer in tropical and subpolar waters, Atmosfera, 35, 127–141, https://doi.org/10.20937/ATM.52938, 2022.
Lau, K. M. and Wu, H. T.: Warm rain processes over tropical oceans and climate implications, Geophys. Res. Lett., 30, https://doi.org/10.1029/2003GL018567, 2003.
Miller, A. J., Brennan, K. P., Mignani, C., Wieder, J., David, R. O., and Borduas-Dedekind, N.: Development of the drop Freezing Ice Nuclei Counter (FINC), intercomparison of droplet freezing techniques, and use of soluble lignin as an atmospheric ice nucleation standard, Atmos. Meas. Tech., 14, 3131–3151, https://doi.org/10.5194/amt-14-3131-2021, 2021.
Möhler, O., Adams, M., Lacher, L., Vogel, F., Nadolny, J., Ullrich, R., Boffo, C., Pfeuffer, T., Hobl, A., Weiß, M., Vepuri, H. S. K., Hiranuma, N., and Murray, B. J.: The Portable Ice Nucleation Experiment (PINE): a new online instrument for laboratory studies and automated long-term field observations of ice-nucleating particles, Atmos. Meas. Tech., 14, 1143–1166, https://doi.org/10.5194/amt-14-1143-2021, 2021.
Möhler, O., Deng, Z., Umo, N. S., and Wagner, R.: Development and operation of AIDA cloud simulation chambers for atmospheric research, ACTRIS Science Conference, https://virtual.oxfordabstracts.com/event/4890/submission/309 (last access: 9 April 2026), 2024.
Mülmenstädt, J., Sourdeval, O., Delanoë, J., and Quaas, J.: Frequency of occurrence of rain from liquid-, mixed-, and ice-phase clouds derived from A-Train satellite retrievals, Geophys. Res. Lett., 42, 6502–6509, https://doi.org/10.1002/2015GL064604, 2015.
Murray, B. J., O'sullivan, D., Atkinson, J. D., and Webb, M. E.: Ice nucleation by particles immersed in supercooled cloud droplets, Chem. Soc. Rev., 41, 6519–6554, https://doi.org/10.1039/c2cs35200a, 2012.
Niemand, M., Möhler, O., Vogel, B., Vogel, H., Hoose, C., Connolly, P., Klein, H., Bingemer, H., DeMott, P., Skrotzki, J., and Leisner, T.: A Particle-Surface-Area-Based Parameterization of Immersion Freezing on Desert Dust Particles, J. Atmos. Sci., 69, 3077–3092, https://doi.org/10.1175/JAS-D-11-0249.1, 2012.
Perez Fogwill, G., Nontasin, P., Piedehierro, A. A., Mustonen, L., Welti, A.: The Sample Volume Effect on Observations of Ice Nucleating Particle Concentrations, European Aerosol Conference 2024, Tampere, Finland, 25–30 August 2024, 2024.
Pfeifer, S., Müller, T., Weinhold, K., Zikova, N., Martins dos Santos, S., Marinoni, A., Bischof, O. F., Kykal, C., Ries, L., Meinhardt, F., Aalto, P., Mihalopoulos, N., and Wiedensohler, A.: Intercomparison of 15 aerodynamic particle size spectrometers (APS 3321): uncertainties in particle sizing and number size distribution, Atmos. Meas. Tech., 9, 1545–1551, https://doi.org/10.5194/amt-9-1545-2016, 2016.
Phillips, V. T. J., Choularton, T. W., Illingworth, A. J., Hogan, R. J., and Field, P. R.: Simulations of the glaciation of a frontal mixed-phase cloud with the Explicit Microphysics Model, Q. J. Roy. Meteor. Soc., 129, 1351–1371, https://doi.org/10.1256/qj.02.100, 2003.
Rodríguez, S. and López-Darias, J.: Extreme Saharan dust events expand northward over the Atlantic and Europe, prompting record-breaking PM10 and PM2.5 episodes, Atmos. Chem. Phys., 24, 12031–12053, https://doi.org/10.5194/acp-24-12031-2024, 2024.
Rogers, D. C.: Development of a continuous flow thermal gradient diffusion chamber for ice nucleation studies, Atmos. Res., 22, 149–181, https://doi.org/10.1016/0169-8095(88)90005-1, 1988.
Schneider, J., Höhler, K., Heikkilä, P., Keskinen, J., Bertozzi, B., Bogert, P., Schorr, T., Umo, N. S., Vogel, F., Brasseur, Z., Wu, Y., Hakala, S., Duplissy, J., Moisseev, D., Kulmala, M., Adams, M. P., Murray, B. J., Korhonen, K., Hao, L., Thomson, E. S., Castarède, D., Leisner, T., Petäjä, T., and Möhler, O.: The seasonal cycle of ice-nucleating particles linked to the abundance of biogenic aerosol in boreal forests, Atmos. Chem. Phys., 21, 3899–3918, https://doi.org/10.5194/acp-21-3899-2021, 2021.
Schrod, J. and Bingemer, H. G.: A view on recent ice-nucleating particle intercomparison studies: why the uncertainty of the activation temperature matters, Atmos. Meas. Tech., 18, 2591–2605, https://doi.org/10.5194/amt-18-2591-2025, 2025.
Stopelli, E., Conen, F., Zimmermann, L., Alewell, C., and Morris, C. E.: Freezing nucleation apparatus puts new slant on study of biological ice nucleators in precipitation, Atmos. Meas. Tech., 7, 129–134, https://doi.org/10.5194/amt-7-129-2014, 2014.
Tatzelt, C., Henning, S., Welti, A., Baccarini, A., Hartmann, M., Gysel-Beer, M., van Pinxteren, M., Modini, R. L., Schmale, J., and Stratmann, F.: Circum-Antarctic abundance and properties of CCN and INPs, Atmos. Chem. Phys., 22, 9721–9745, https://doi.org/10.5194/acp-22-9721-2022, 2022.
Titos, G., Foyo-Moreno, I., Lyamani, H., Querol, X., Alastuey, A., and Alados-Arboledas, L.: Optical properties and chemical composition of aerosol particles at an urban location: An estimation of the aerosol mass scattering and absorption efficiencies, J. Geophys. Res., 117, D04206, https://doi.org/10.1029/2011JD016671, 2012.
Titos, G., Lyamani, H., Pandolfi, M., Alastuey, A., and Arboledas, L.: Identification of fine (PM1) and coarse (PM10−1) sources of particulate matter in an urban environment, Atmos. Environ., 89, 593–602, https://doi.org/10.1016/j.atmosenv.2014.03.001, 2014.
Titos, G., del Águila, A., Cazorla, A., Lyamani, H., Casquero-Vera, J. A., Colombi, C., Cuccia, E., Gianelle, V., Močnik, G., Alastuey, A., Olmo, F. J., and Alados-Arboledas, L.: Spatial and temporal variability of carbonaceous aerosols: Assessing the impact of biomass burning in the urban environment, Sci. Total Environ., 578, 613–625, https://doi.org/10.1016/j.scitotenv.2016.11.007, 2017.
Ullrich, R., Hoose, C., Möhler, O., Niemand, M., Wagner, R., Höhler, K., Hiranuma, N., Saathoff, H., and Leisner, T.: A New Ice Nucleation Active Site Parameterization for Desert Dust and Soot, J. Atmos. Sci., 74, 699–717, https://doi.org/10.1175/JAS-D-16-0074.1, 2017.
Vali, G.: Quantitative Evaluation of Experimental Results an the Heterogeneous Freezing Nucleation of Supercooled Liquids, J. Atmos. Sci., 28, 402–409, https://doi.org/10.1175/1520-0469(1971)028<0402:QEOERA>2.0.CO;2, 1971.
Vali, G.: Revisiting the differential freezing nucleus spectra derived from drop-freezing experiments: methods of calculation, applications, and confidence limits, Atmos. Meas. Tech., 12, 1219–1231, https://doi.org/10.5194/amt-12-1219-2019, 2019.
Wang, K., Bi, K., Chen, S., Hartmann, M., Wu, Z., Gao, J., Xu, X., Cheng, Y., Huang, M., Chen, Y., Xue, H., Wang, B., Hu, Y., Zhang, X., Ma, X., Li, R., Tian, P., Möhler, O., Wex, H., Stratmann, F., Chen, J., and Gong, X.: An improved Freezing Ice Nucleation Detection Analyzer (FINDA) for droplet immersion freezing measurement, Atmos. Meas. Tech., 18, 5823–5840, https://doi.org/10.5194/amt-18-5823-2025, 2025.
Welti, A., Müller, K., Fleming, Z. L., and Stratmann, F.: Concentration and variability of ice nuclei in the subtropical maritime boundary layer, Atmos. Chem. Phys., 18, 5307–5320, https://doi.org/10.5194/acp-18-5307-2018, 2018.
Westbrook, C. D. and Illingworth, A. J.: The formation of ice in a long-lived supercooled layer cloud, Q. J. Roy. Meteor. Soc., 139, 2209–2221, https://doi.org/10.1002/qj.2096, 2013.
Wex, H., Augustin-Bauditz, S., Boose, Y., Budke, C., Curtius, J., Diehl, K., Dreyer, A., Frank, F., Hartmann, S., Hiranuma, N., Jantsch, E., Kanji, Z. A., Kiselev, A., Koop, T., Möhler, O., Niedermeier, D., Nillius, B., Rösch, M., Rose, D., Schmidt, C., Steinke, I., and Stratmann, F.: Intercomparing different devices for the investigation of ice nucleating particles using Snomax® as test substance, Atmos. Chem. Phys., 15, 1463–1485, https://doi.org/10.5194/acp-15-1463-2015, 2015.
Wex, H., Huang, L., Zhang, W., Hung, H., Traversi, R., Becagli, S., Sheesley, R. J., Moffett, C. E., Barrett, T. E., Bossi, R., Skov, H., Hünerbein, A., Lubitz, J., Löffler, M., Linke, O., Hartmann, M., Herenz, P., and Stratmann, F.: Annual variability of ice-nucleating particle concentrations at different Arctic locations, Atmos. Chem. Phys., 19, 5293–5311, https://doi.org/10.5194/acp-19-5293-2019, 2019.
Wieber, C., Rosenhøj Jeppesen, M., Finster, K., Melvad, C., and Šantl-Temkiv, T.: Micro-PINGUIN: microtiter-plate-based instrument for ice nucleation detection in gallium with an infrared camera, Atmos. Meas. Tech., 17, 2707–2719, https://doi.org/10.5194/amt-17-2707-2024, 2024.