the Creative Commons Attribution 4.0 License.
the Creative Commons Attribution 4.0 License.
 | 28 Apr 2026
Flow cytometry and machine learning enable identification of allergenic urban tree pollen
Maria Raquel Kanieski
Gauthier Lapa
Grégoire Bonnamour
Rita Sousa-Silva
Isabelle Laforest-Lapointe
Alain Paquette
Exposure to allergenic pollen is a major public health concern, as it is a key trigger for respiratory allergies, including seasonal allergic rhinitis, which affects approximately 20 % of the global population. Monitoring airborne pollen is essential for prevention and clinical management, yet traditional identification methods, such as light microscopy, are time-consuming and often limited to genus- or family-level resolution. Here, we present a high-throughput approach combining flow cytometry with machine learning to identify pollen from urban environments. We collected a reference database of pollen from 97 species across 34 genera, representing the dominant allergenic trees and other common airborne taxa in Montreal, Canada. Using flow cytometry, we measured particle size, granularity, and fluorescence intensity across multiple excitation and emission channels, and applied a Random Forest classifier to distinguish pollen taxa. At the species level, the model achieved a mean F1-score of 0.76, while genus-level classification reached 0.90, with misclassifications largely occurring among closely related species. Granularity and fluorescence parameters from the violet and blue lasers were the most distinctive features. Our results demonstrate that flow cytometry combined with machine learning provides an efficient, scalable alternative to microscopy, with potential for large-scale urban pollen monitoring.
- Article
(5828 KB) - Full-text XML
-
Supplement
(633 KB) - BibTeX
- EndNote


Exposure to allergenic pollen is a major public health concern, as it is a key risk factor for respiratory allergies. Seasonal allergic rhinitis affects approximately 20 % of the global population (Savouré et al., 2022) and is expected to worsen with climate change, which is projected to lengthen pollen seasons (Anderegg et al., 2021; Mousavi et al., 2024; Zhang and Steiner, 2022; Ziska et al., 2019). Rising temperatures and CO2 levels stimulate plant growth, increasing pollen levels (Kim et al., 2018; Ladeau and Clark, 2006) and the allergenicity of pollen grains (Ahlholm et al., 1998; Kim et al., 2018). For allergy sufferers and healthcare providers, reliable pollen information, including which plant species and pollen traits contribute to different allergenicity properties, is essential for prevention and effective treatment, but remains scarce (Dunker et al., 2022; Medek et al., 2025; Sousa-Silva et al., 2020).
Expanding pollen monitoring networks in urban areas, which host most of the world's population, is increasingly recognized as essential (Tummon et al., 2024), yet this also requires processing a large number of pollen samples and thus highlights a clear need for efficient, accurate, and high temporal resolution identification methods. Over the past decades, several analytical techniques have been developed for pollen detection and classification, each having advantages and limitations. Light microscopy remains the standard method used worldwide for pollen identification, but it is time-consuming and requires highly trained specialists (Brennan et al., 2019; Dunker et al., 2021, 2022; Gierlicka et al., 2022; De Weger et al., 2013). Although pollen morphology, defined by size, shape, apertures, and texture (Ogden et al., 1974; Smith, 1984), supports taxonomic identification, subtle interspecific differences restrict identification to genus or family level in most cases. Automated slide scanning, sometimes coupled with a machine learning algorithm, has improved efficiency but still faces limitations in distinguishing species from the same genus or family (Dunker et al., 2021; Holt and Bennett, 2014). Advanced imaging techniques, such as scanning electron microscopy (SEM), transmission electron microscopy (TEM), and optical diffraction tomography (ODT), provide much higher resolution for detailed analysis of pollen structures, but are costly or impractical for large-scale monitoring (Gierlicka et al., 2022). Molecular biology techniques, particularly metabarcoding and PCR-based methods, have the potential to enable species-level identification yet face challenges such as high costs, the presence of DNA inhibitors that can limit sensitivity and cause false negative, the limitations of taxonomic resolution, and the inability to quantify pollen abundance (Dunker et al., 2021; Gierlicka et al., 2022).
More recently, fluorescence spectroscopy and flow cytometry have emerged as promising approaches (Gierlicka et al., 2022; Šaulienė et al., 2019). These methods are based on the size and autofluorescence properties of particles, such as the pollen grains, and when combined with holographic images and machine or deep learning, they can improve classification accuracy and enable automated (Dunker et al., 2022; Erb et al., 2024; Sikoparija et al., 2024; Swanson et al., 2023) and high-throughput identification (≈ 5000 grains s−1) (Dunker et al., 2021; Gierlicka et al., 2022). Because each species has a specific fluorescence and granularity signature, it is possible to distinguish even morphologically similar taxa (Dunker et al., 2021).
Our study aims to develop a classification model capable of identifying pollen from urban environments at species and genus levels. Here we present the necessary first step in the development of a broader methodological pipeline for the analysis of airborne pollen. We built a reference collection representing the main tree species found across the city of Montreal, Canada. Unlike previous studies that rely on microscopic or imaging data, our approach relies exclusively on flow cytometry measurements, i.e. fluorescence intensity, particle size, and granularity to characterize pollen. This choice is motivated by the fact that most cytometers routinely used in healthcare and clinical settings are limited to these parameters. Consequently, developing a model based on these features enhances its applicability and ensures compatibility with the most widely implemented cytometry platforms. We then evaluated the performance of the machine-learning classification model trained on these flow cytometry parameters and identified those that contribute most to differentiating pollen species and genera.
2.1 Pollen collection
To train the machine learning classification model, we created a reference database of pollen grains collected directly from plants of known species (mostly trees). The reference collection included pollen from both common urban tree species as well as widely planted hybrid cultivars.
Tree species were selected based on three criteria: (1) their relative abundance on the Island of Montreal, ensuring representation of the dominant urban taxa; (2) their anemophilous nature, since wind-pollinated species are typically the most allergenic (D'Amato et al., 2007; Falagiani, 1989); and (3) the inclusion of multiple species within each genus, to enable species-level discrimination where possible. Other species such as from the Rosaceae family were also included to increase resolution. For each selected species, pollen was collected from three individual trees from the Montreal Botanical Garden (for ease of identification) or among public trees across the city. At flowering time, ten floral units (flowers, catkins or male cones) were collected per tree, sampling different parts of the crown to capture intra-individual variation among pollen grains. We also included pollen from the Poaceae family (grasses) and the genus Ambrosia (ragweed), given their well-known allergenic potential (D'Amato et al., 2007; Falagiani, 1989). Their inclusion enabled the model to learn to discriminate tree pollen from other common airborne particle types, as real-world environmental samples typically comprise a heterogeneous mix of tree, grass, and weed pollen, along with various non-pollen particulates. In the laboratory, floral units were placed in pre-labelled paper bags with desiccant gel. Pollen was extracted from the floral units using a filtration system that retained only particles between 5 and 100 µm in diameter, a size range that includes pollen grains but also particles of similar size. Filtration also prevents clogging of the flow cytometer because, as is generally recommended, particles should not exceed one-third to one-fifth of the width of the flow cell, which limits particle size to approximately 100 µm on the CytoFLEX instrument we used. The filtrate was then suspended in Dulbecco's phosphate-buffered saline (PBS) solution, a standard neutral isotonic buffer commonly used in flow cytometry to minimize aggregation (Aloisi et al., 2015; Dunker et al., 2021) (see detailed protocol in the Supplement). A subsample was examined under a light microscope to confirm the presence of pollen grains. If pollen was present, the sample was retained; if not, sampling was repeated, including filtration, and if necessary, additional flowers were collected.
2.2 Flow cytometry
Each pollen sample was analysed using flow cytometry (Fig. 1). Measurements were performed with a CytoFLEX cytometer (Beckam Coulter, Inc.), equipped with three excitation lasers at wavelengths of 405 nm (violet), 488 nm (blue), and 640 nm (red). Due to a hydrodynamic flow stream, each pollen grain passes sequentially through each laser, which excites fluorescent phenolic compounds present in the sporopollenin of the pollen grain's outer wall. Depending on their peptide composition, these fluorophores absorb light at a certain wavelength and emit light radiation at a different wavelength in return producing a characteristic fluorescence signature that varies among species. For each laser, avalanche photodiode (APD) detectors measure the intensity of light emitted at different wavelengths using ten filters: 450/45, 525/40, 610/20 (violet laser), 525/40, 585/42, 690/50, 780/60 (blue laser), 660/10, 712/25, 780/60 nm (red laser). Each filter value, such as 450/45, follows a simple convention: the first value corresponds to the central wavelength (in nanometers, nm), which is the midpoint of the light allowed to pass through the filter; the second corresponds to the bandwidth, i.e., the width of this “window” of light. Thus, a 450/45 filter transmits light between 427.5 and 472.5 nm (i.e., 450 ± 22.5 nm). In addition to fluorescence, two scatter parameters were recorded to describe particle morphology: grain size and granularity. The forward scatter (FSC) detects light scattered at low angles in the forward direction, which correlates with the cross-sectional area of the particle, equivalent to a spherical diameter. For non-spherical particles like pollen (prolate, oblate, tricolporate, etc.), FSC reflects an average optical cross-section as the particle passes through the laser in a random orientation. The sidewards scatter (SSC) detects light scattered at ∼ 90° (orthogonal) to the laser beam, which is sensitive to internal complexity and surface irregularities. In pollen, this captures internal granularity, wall sculpturing, apertures, vacuoles/pollen sacs. The more complex the structure and texture of the pollen grain, the higher the granularity values will be.
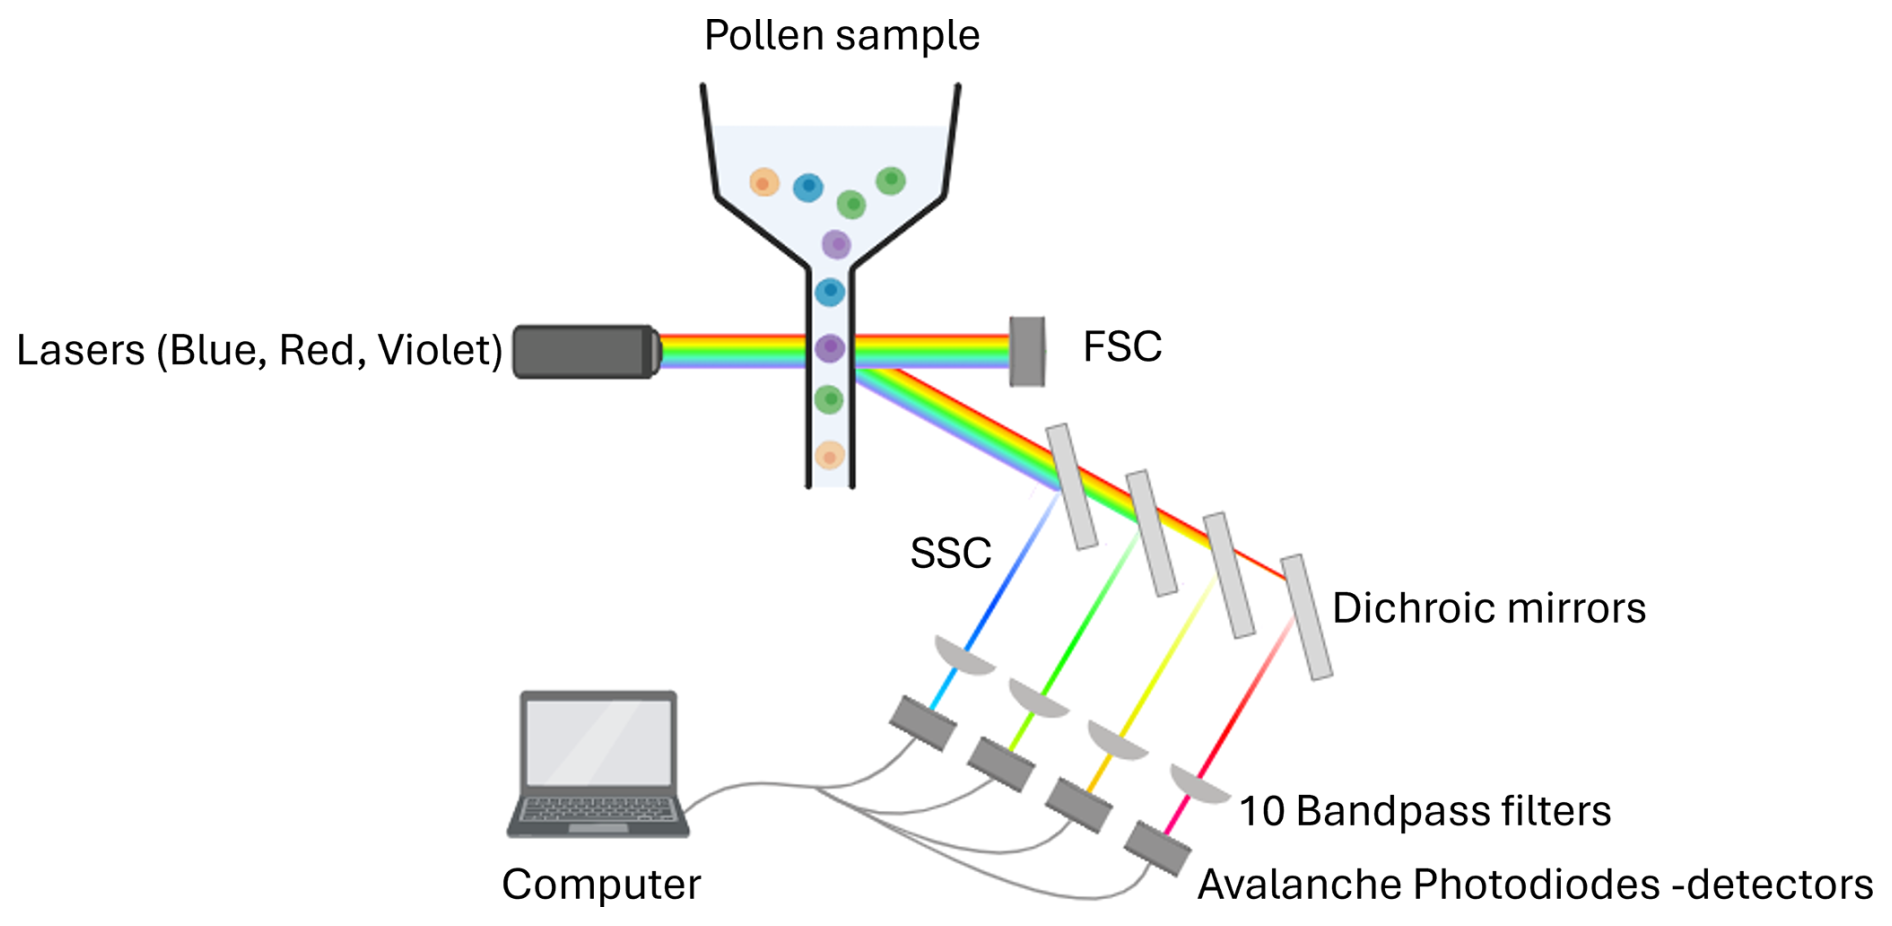
Figure 1Flow cytometry workflow on the CytoFLEX (Beckman Coulter, Inc.). Sample containing pollen enters at the top, and then is excited by three lasers in the blue (λ = 488 nm), red (λ = 640 nm) and violet (λ = 405 nm) wavelengths, 10 dichroic mirrors, bandpass filters and detectors in different wavelength ranges (λ = 450/45, 525/40, 610/20, 585/42, 525/40, 690/50, 780/60, 660/10, 712/25 and 780/60 nm). There are two additional detectors for size and granularity: forward scatter (FSC) and side scatter (SSC). Created with BioRender.
2.3 Data cleaning
Although the samples were filtered to retain only particles within the size range of pollen grains (5–100 µm), some non-pollen particles, such as dust or plant debris, were still present. To distinguish pollen from debris, that is non-pollen particles, we used the recorded size, granularity, and fluorescence parameters for each particle. These include one value for size (FSC), one for granularity (SSC), and ten values for fluorescence, each with two components, the maximum peak height and the peak area except size which has also a width component. This resulted in three values for size, two for granularity, and 20 for fluorescence, with a total of 25 parameter values per particle.
Data cleaning was performed using Cytexpert software version 2.4.28 (Beckman Coulter, Inc.). For each species, pollen grains were manually separated from debris using scatter density plots (size vs. granularity) and histograms of all fluorescence features. This selection relied primarily on the PB450 (λ = 450/45 nm) and Violet610 (λ = 610/20 nm) fluorescence histograms, while cross-checking against the other recorded parameters to ensure consistency. Adjustments were made as needed to ensure that only true pollen grains were retained (Fig. A1). This excitation/emission range is characteristic of sporopollenin which contains the fluorophores specific to pollen grains (Pöhlker et al., 2013). The final training dataset included all cleaned pollen data from each species along with a separate category, “OTHER”, which combined all debris data from the cleaning step and the particles from certain species for which it was impossible to distinguish pollen from debris, such as those in the Thuja genus. The final reference database used to train the model comprised 97 species from 34 different genera. A detailed list of species is presented in Table A1 and the complete training datasets are available on figshare (Tardif, 2025).
2.4 Machine learning algorithm
Four supervised classification algorithms were initially tested: Random Forest (Breiman, 2001), Gradient Boosting, Extreme Gradient Boosting and Neuronal Network. Among these, the Random Forest algorithm showed the best performance using F1-scores and was therefore selected for subsequent analysis. In our training dataset, the number of pollen grains varies across taxa (Table A3). This caused the model to more frequently predict taxa with more training examples (Chawla, 2010). To address this class imbalance, we used the synthetic minority over-sampling technique (Chawla, 2010), resulting in a balanced dataset with 1000 pollen grains per species for the species-level classification model and 10 000 pollen grains per genus for the genus-level classification model. Only four taxa were oversampled (Acer saccharum, Gramineae spp, Juglans cinerea, and Picea abies). The purpose of balancing data was to provide the classifier with a balanced training set to prevent it from being biased toward the majority class. Each dataset was randomly split into two subsets: 70 % for training and 30 % for validation. The validation set, was not used for model training. The Random Forest classifier was trained exclusively on the 70 % training portion. Models were trained using the train() function from the caret package in R software (version 4.4.0), calling the rf() function for the random forest model. Model robustness was assessed using 10-fold cross-validation implemented via the trainControl() function with the “cv” method (nine repetitions for training and one for validation). We trained the models using the default value of 500 trees. The parameter mtry, representing the number of variables randomly selected at each node split, was set to 5, based on prior testing across values from 1 to 10. We assessed the models' performance using the F1-score: F1 = . Precision is the proportion of correctly predicted positives out of all predicted positives and recall is the proportion of correctly predicted positives out of all actual positives (Grandini et al., 2020). Variable importance was assessed using the mean decrease in Gini coefficient, which quantifies each variable's contribution to reducing classification error by decreasing node impurity during tree construction. The trained models are available on figshare (Tardif, 2025).
3.1 Classification performance
At the species level, the model achieved a mean F1-score of 0.76 (n = 97 species; Fig. 2a). Most species perform very well, with 75 % of species achieving a F1-score above 0.70. The lowest F1-scores were obtained for Quercus rubra (0.44), Salix × pendulina f. tristis. (Salix alba tristis hereafter) (0.43) and Ulmus minor (0.44). Several other species also showed reduced accuracy, with F1-scores ranging between 0.5 and 0.65. These included Acer × freemanii, Acer ukurunduense, Fagus grandifolia, Fraxinus nigra, Pinus banksiana, and Syringa villosa, as well as several species of the Betulaceae family (Betula papyrifera, Carpinus caroliniana, and Corylus colurna), the Juglandaceae family (Carya ovata, Juglans nigra, and Juglans virginiana), and the Ulmus genus (Ulmus davidiana, Ulmus propinqua, and Ulmus pumila) (Fig. 2a).
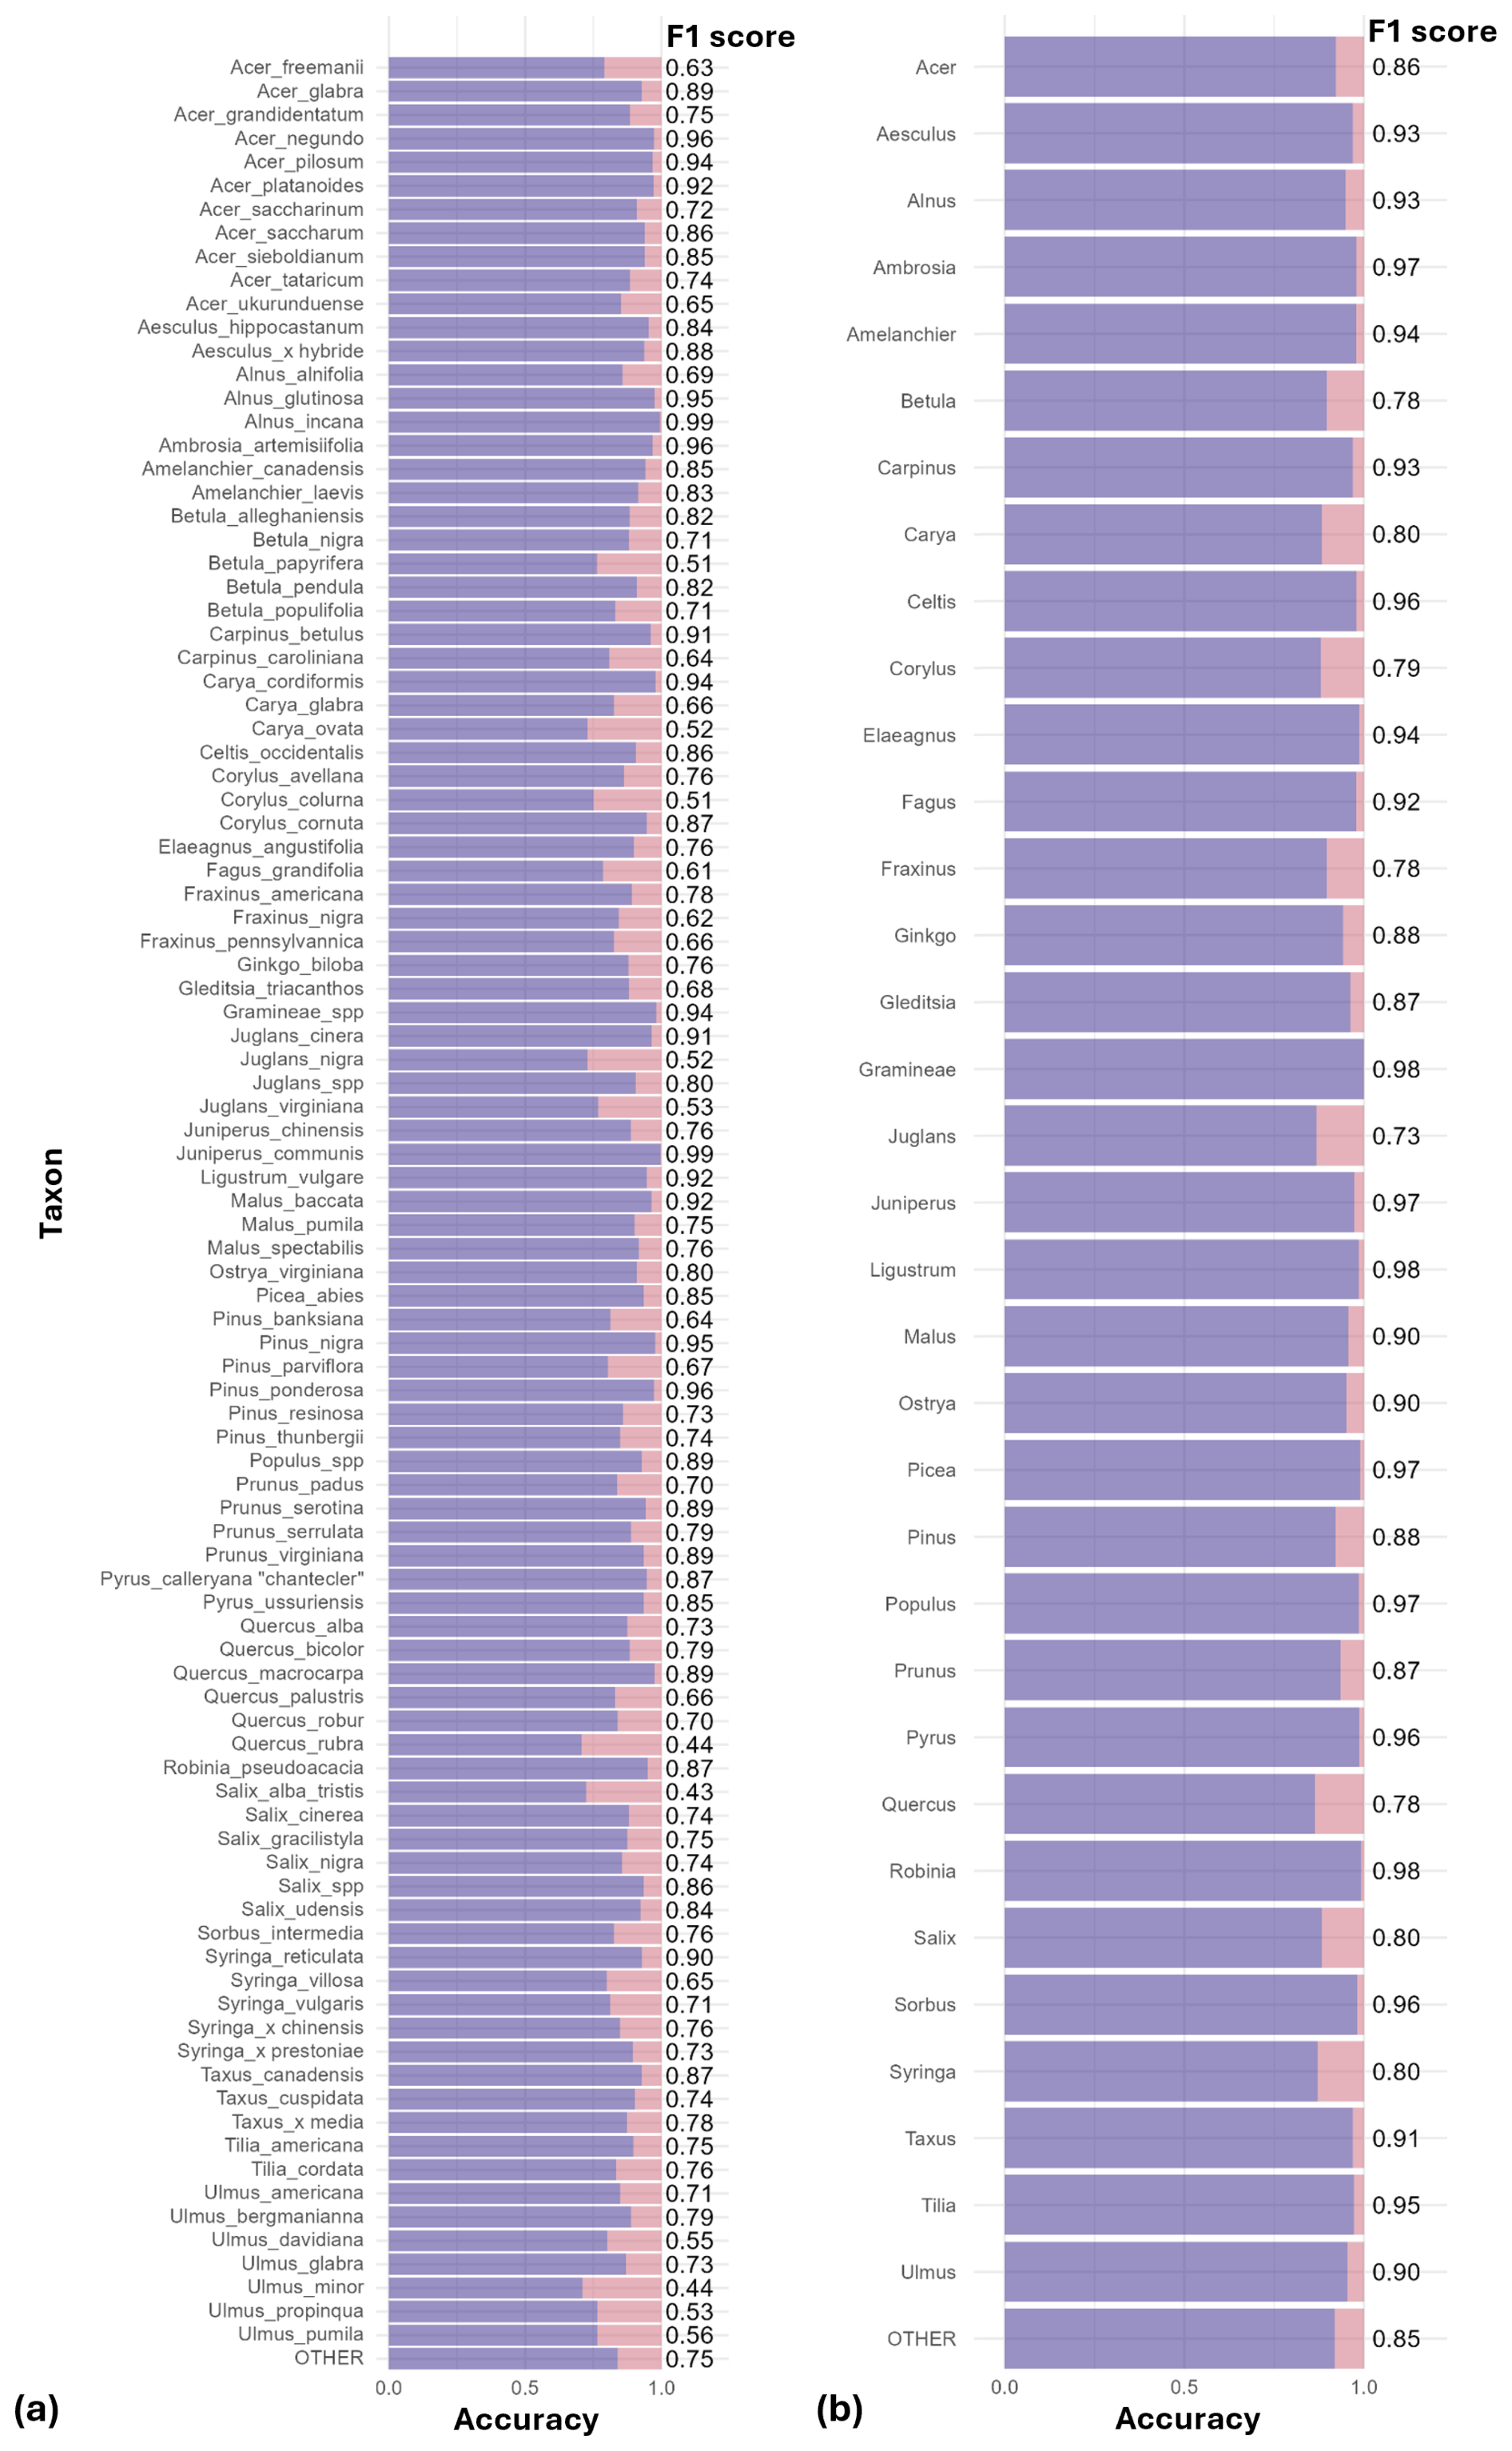
Figure 2Performance of the classification models at the species (a) and genus levels (b). For each taxon, purple bars represent correct classifications (accuracy) and pink represents misclassifications (1-accuracy). F1-scores are shown as labels to the right of each bar. Mean F1-scores were 0.76 for the species-level model and 0.90 for the genus-level model.
When trained at the genus level, model performance improved across the 34 genera, reaching a mean F1-score of 0.90 (Fig. 2b). The only notable exception was Juglans, with an F1-score of 0.73. All other genera achieved F1-scores close to or above 0.8. Taxa with relatively lower accuracy at the species level, such as those in the genera Betula, Quercus and Ulmus, showed marked improvement at the genus level. Most misclassifications occurred between species within the same genus, as is evident for species from the genus Ulmus (see confusion matrices in Appendix B and in Tables S1 and S2 in the Supplement).
3.2 Variables contribution
The ranking of predictors using the Gini index shows that the most important variables for distinguishing pollen grains among taxa were granularity (SSC), two fluorescence variables from the violet laser (PB450 and Violet610) and one from the blue laser (FITC). These variables exhibited the highest mean decrease in Gini, indicating a major contribution to the homogeneity of nodes and consequently, to overall classification accuracy in the Random Forest model (Fig. 3).
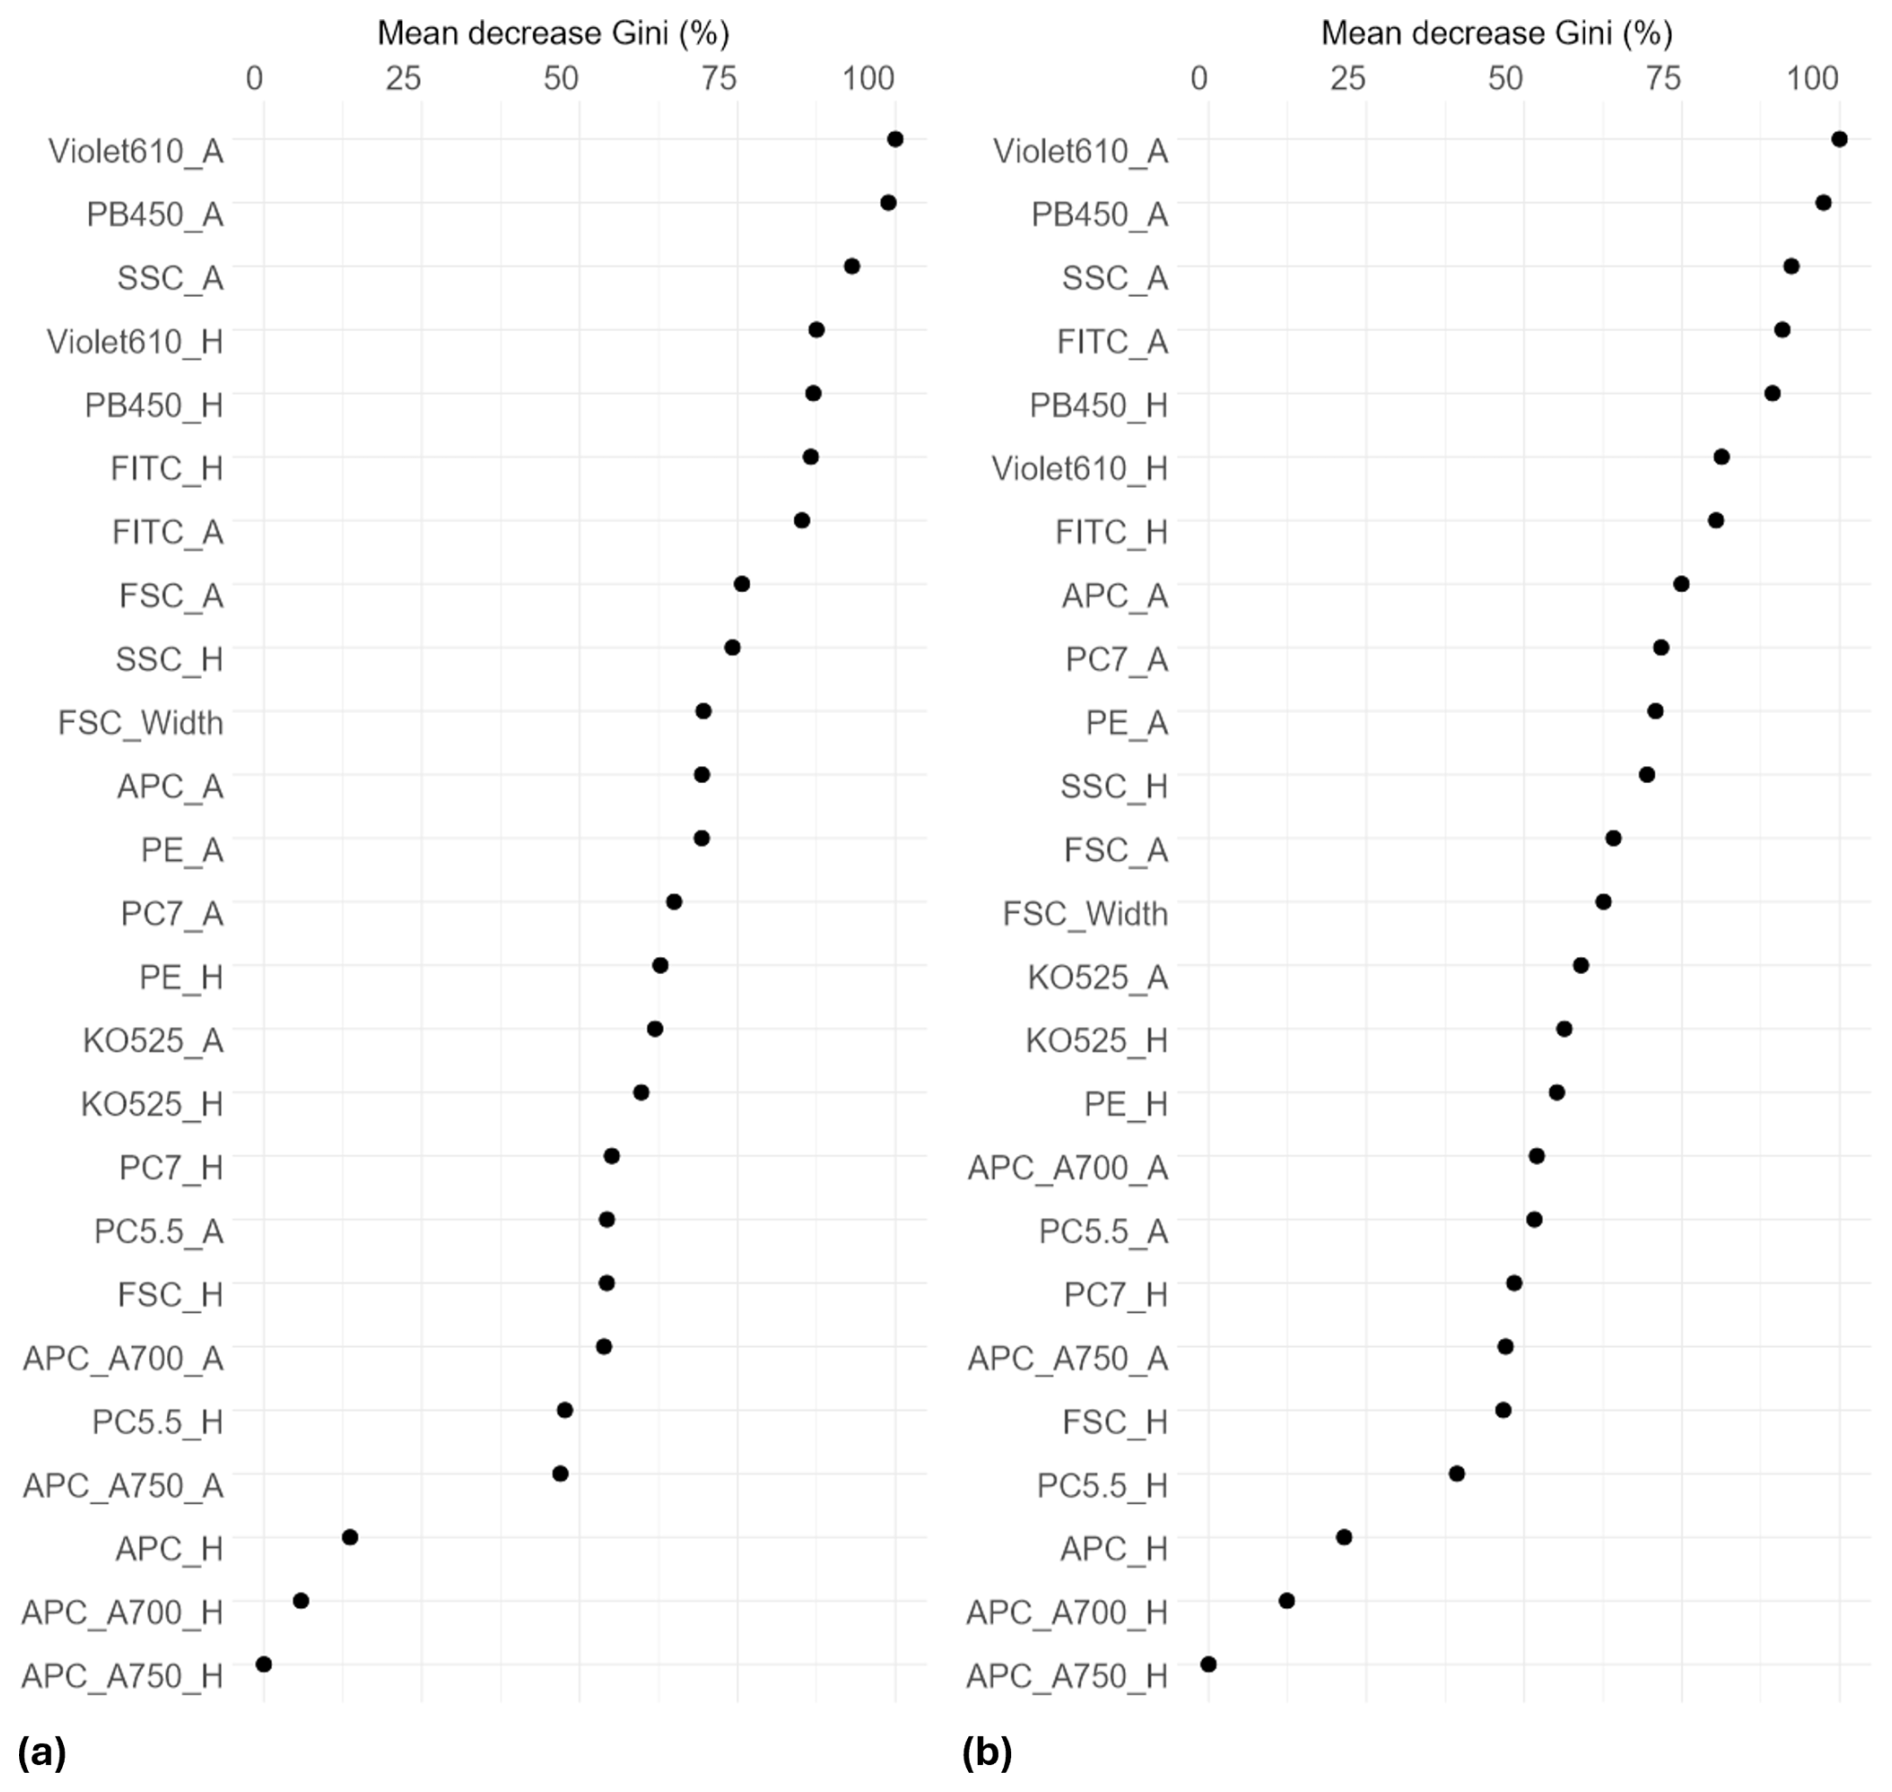
Figure 3Variable contributions to node and leaf purity in the Random Forest classification model, measured by mean decrease in Gini index. Higher values indicate greater importance. Results are shown for species-level (a) and genus-level (b) models. Each variable includes two metrics: maximum peak height (H) and peak area (A). Explanation of variable names in Table A2.
Analysis of the variables contributing most to pollen differentiation revealed that size (FSC) and granularity (SSC) varied more among genera than among species within a given genus, whereas fluorescence parameters primarily accounted for the variation observed among species within genera (Fig. 4 and Appendix C). Figure 4 illustrates the distributions for six genera known to be allergenic (see Appendix C for more details). Pollen grains from the Pinus genus were larger than those from other genera and also had a specific granularity pattern. For these two parameters, FSC and SSC, intra-genus variation for all genera was very small or absent. In contrast, fluorescence parameters showed more pronounced differences among species within the same genus. For example, Alnus species presented distinct values across all three fluorescence channels (FITC, Violet610, PB450), while Corylus species differed mainly in the Violet610 channel. For other genera, only certain species, such as Betula nigra, Quercus macrocarpa, and Salix spp., showed distinct fluorescence profiles (Fig. 4).
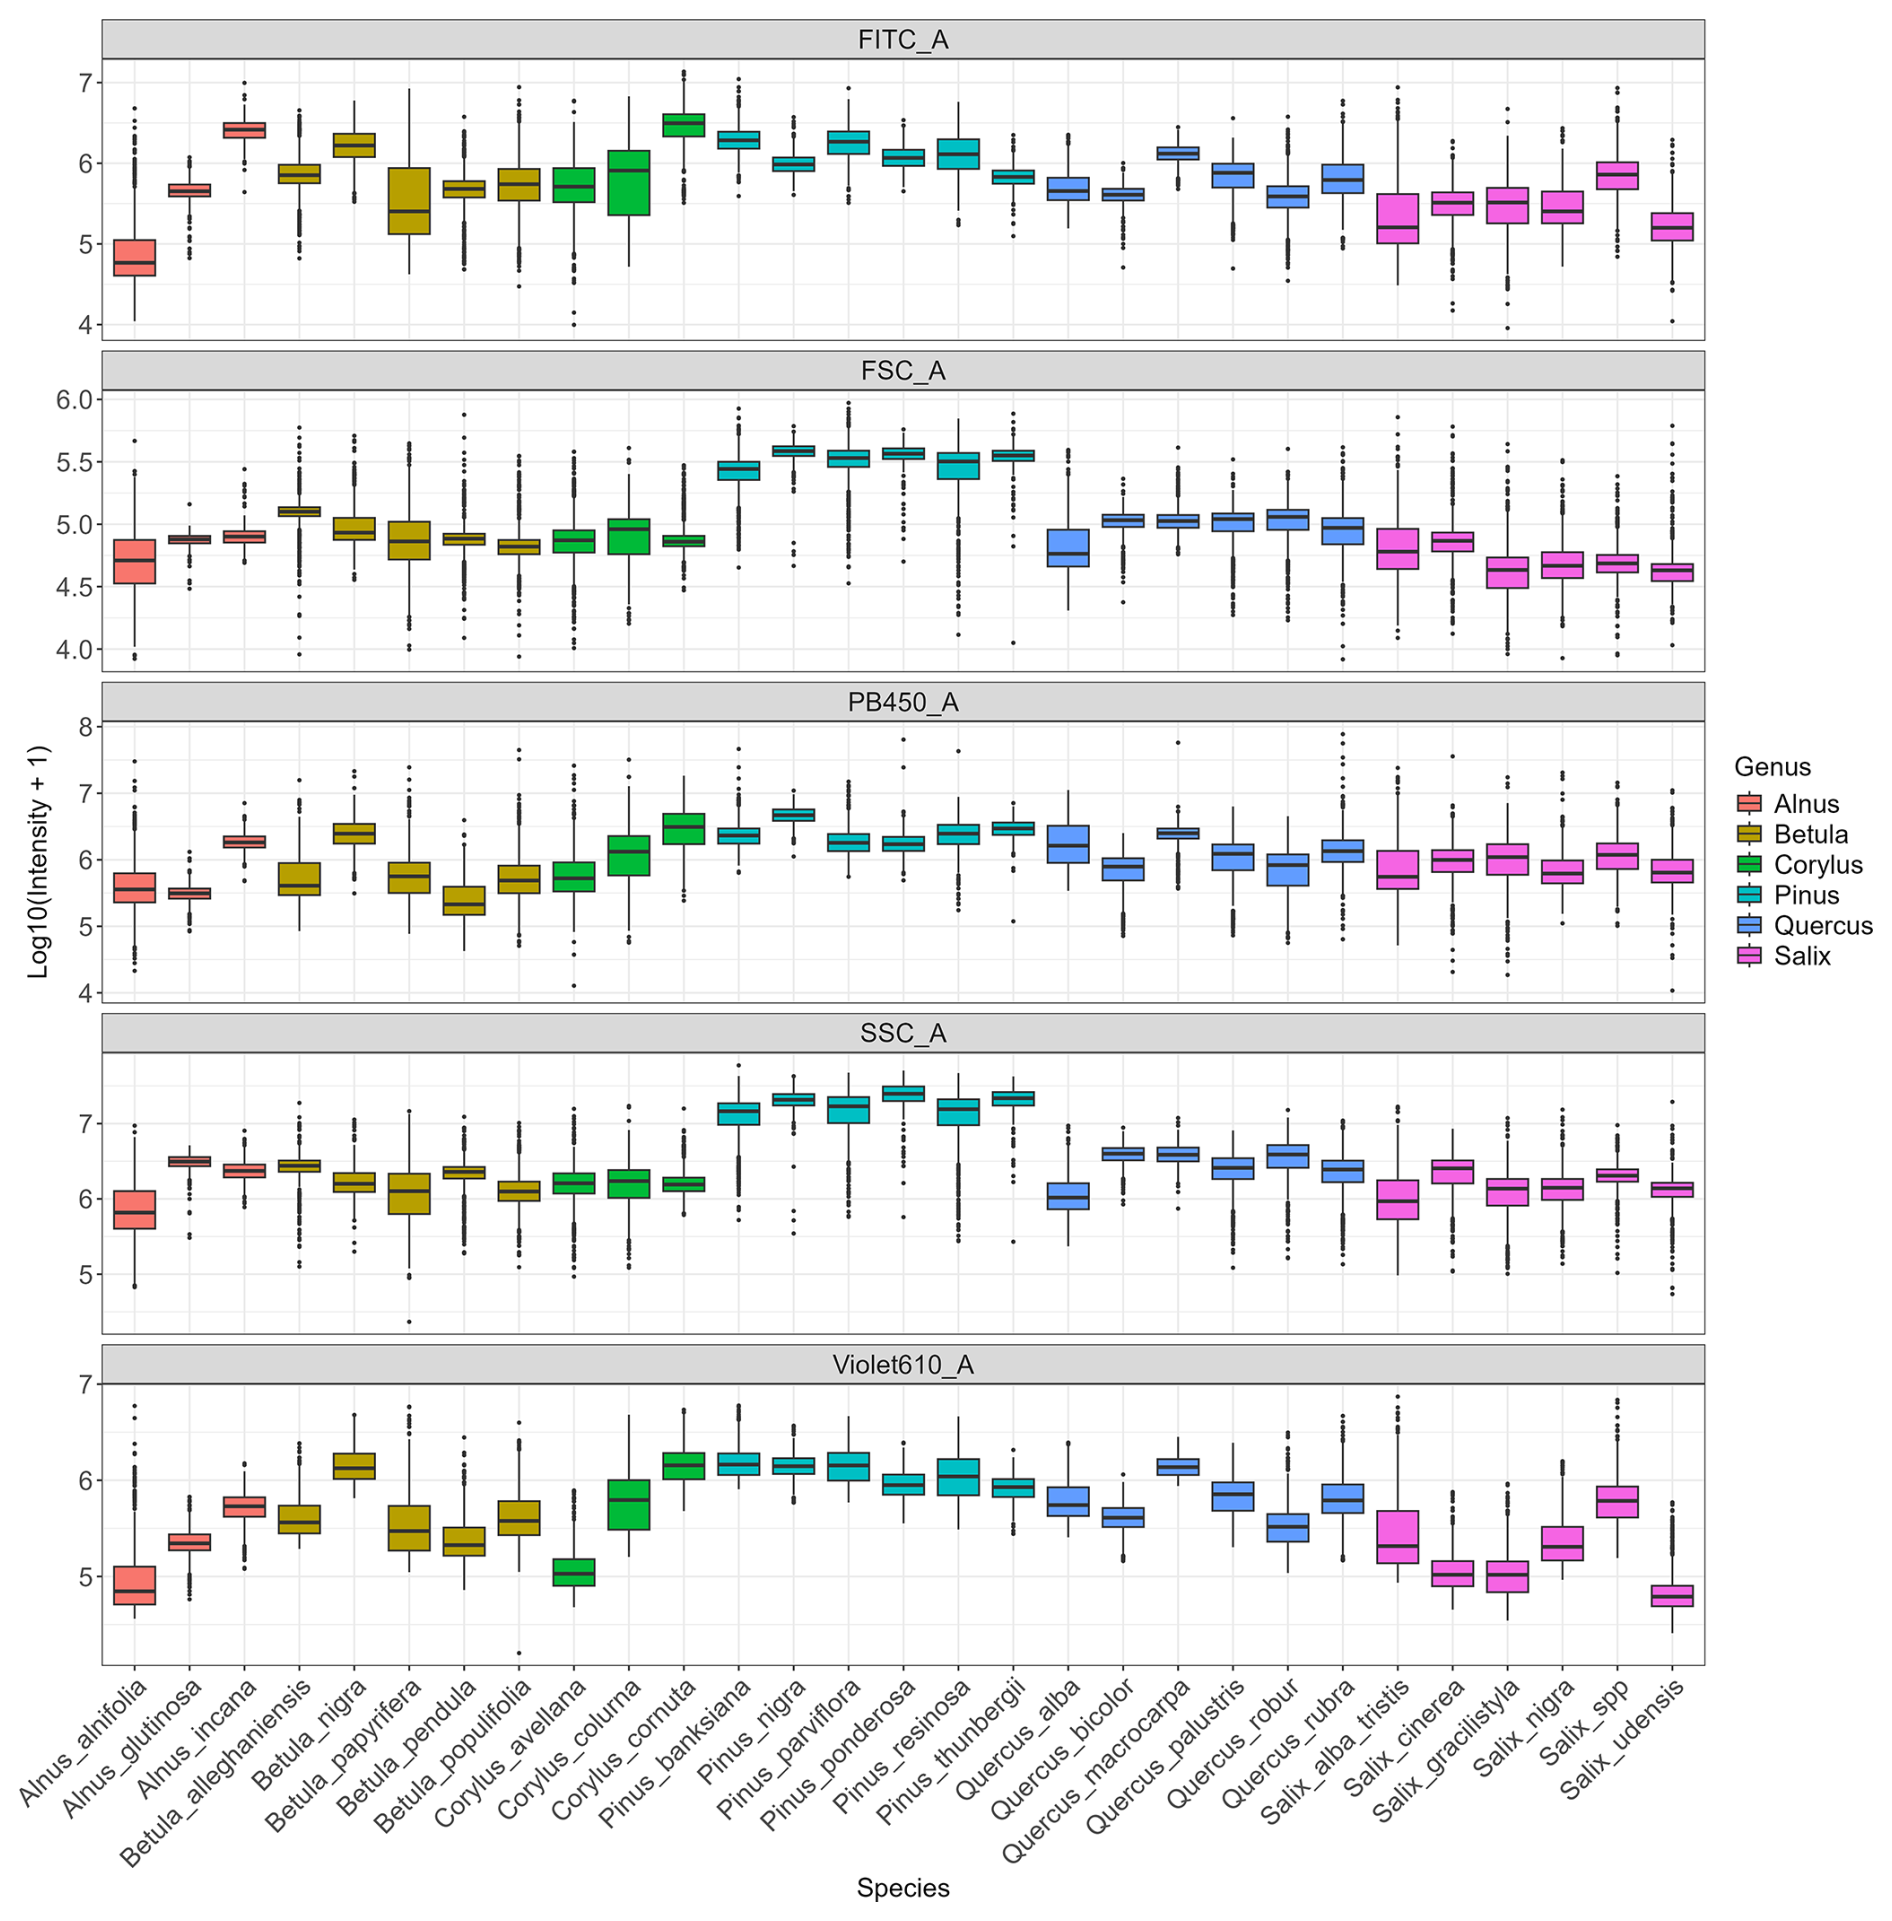
Figure 4Distribution of log-transformed values for the five variables that contributed the most to distinguish species. Fluorescence channels: FITC_A (excitation: 488 nm with emission: 525 nm), PB450_A (excitation: 405 nm with emission: 450 nm), Violet610_A (excitation: 405 nm with emission: 610 nm); scatter parameters: SSC_A (granularity) and FSC_A (size). The suffix_A indicates that we consider the signal's peak area. Only species from six known allergenic genera (Alnus, Betula, Corylus, Pinus, Quercus, Salix) are shown and coloured. For all species see Appendix C.
Our results demonstrate that flow cytometry combined with machine learning can reliably identify pollen across a wide range of taxa. The models achieved high classification performance (F1 = 0.76 at the species level and 0.90 at the genus level) highlighting the potential of this approach as a scalable alternative to traditional microscopy for pollen identification. This represents a significant improvement over conventional methods, such as microscopy, which typically only resolve pollen to the genus or family level. The improved performance of the genus-level model over the species-level model most likely reflects biological and structural similarities among species within the same genus. This was particularly evident for species in the Betulaceae family, which are wind-pollinated and considered highly allergenic (D'Amato et al., 2007; Falagiani, 1989), but also for other genera especially abundant in Montreal, such as Acer, Syringa, and Ulmus. While these findings are promising, they were obtained using reference pollen grains collected directly on trees; further validation using atmospheric samples will be necessary before implementation in an airborne pollen monitoring network.
The advantage of flow cytometry coupled with machine learning lies not only in its performance in classifying at the genus or species level, but especially in its ability to enable automated, high-throughput identification (≈ 5000 grains s−1) while avoiding the lengthy and costly training required for human specialists. Accurate monitoring is clinically important, as even low pollen concentrations (10–50 grains m−3) can trigger allergic symptoms (Steckling-Muschack et al., 2021). From a public health perspective, the genus-level model is therefore appropriate, as it provides higher accuracy for the taxa most relevant to allergy monitoring.
The fluorescence variables that contributed most to pollen classification were associated with blue and violet excitation lasers, with emission detected in the blue (PB450), red-orange (Violet610), and green (FITC) channels. This pattern is consistent with the known autofluorescence properties of sporopollenin, the main biopolymer in the pollen exine, which emits strongly near 475 nm (Pöhlker et al., 2013). Additional emissions likely originate from secondary compounds such as flavonoids, carotenoids, and terpenes located in the exine or pollenkitt coating (Donaldson, 2020; Pöhlker et al., 2013). The distribution of the most discriminative variables indicates that size and granularity primarily differentiate genera, while blue, red-orange and green fluorescence channels capture species-level differences within genera. This pattern explains the model's higher accuracy at the genus-level and its partial success in distinguishing closely related species. The misclassifications at species-level likely stem from the high similarity in pollen shape and fluorescence spectra among closely related species, which makes them harder to distinguish. In addition, because our classification relied on size and fluorescence alone, without complementary morphological data such as holography images (Erb et al., 2024; Gierlicka et al., 2022; Zhang and Abdulla, 2023), the model's performance may have been constrained by limited representation of some taxa in the reference dataset. Increasing both the number of pollen grains per species and the diversity of species within each genus would help train more robust models. Future research should prioritize expanding reference datasets, ideally through the creation of a global database of pollen fluorescence signatures, which represent the emission spectrum for given excitation wavelengths. Such a resource, similar to The Global Pollen Project, for microscopic images (Martin and Harvey, 2017), would provide a valuable foundation for machine learning and deep leaning applications in aerobiology, but also ecology, palynology, paleoecology, and other pollen related fields.
Another factor that may explain the reduced model accuracy is that some species in our reference collection could not be included in the model's training dataset due to the impossibility to distinguish pollen from debris during the data cleaning, even though we had visually confirmed the presence of intact pollen grains in our samples. These data were included in the training dataset under the category “OTHER” rather than assigned to individual taxa. Such was the case for Thuja, a genus abundant in Montreal (Paquette et al., 2026), likely due to the small size of its pollen grains, which can easily mix with debris or because pollen grains included in our dataset may have been limited in quantity or had not fully matured. Indeed, distinguishing male from female Thuja cones and assessing the phenological stage to collect mature pollen is difficult, and the small size of the cones is another challenge for pollen extraction. Improving collection and extraction protocols for this genus could help reduce debris contamination in future sampling.
A crucial next step is to adapt these models for use on complex airborne samples collected in urban environments. Such samples often contain large amounts of debris as during atmospheric transport, pollen grains may remain airborne for days or weeks, during which they can fold, crack, or adhere to air pollutants (De Weger et al., 2024). They are also exposed to ultraviolet radiation and humidity fluctuations that can alter fluorescence properties. These factors complicate the discrimination of true pollen grains from other particles and represent a major challenge for operational implementation.
Because small pollen grains, folded grains and debris can have overlapping size distributions, misclassification remains a possibility, with pollen occasionally identified as debris, and vice versa. Future research could therefore explore multidimensional hierarchical classification frameworks, especially when complementarity data such as holographic images are available for validation. For example, when classification confidence is high, the model could assign a species-level label, but default to a broader taxonomic category such as genus or family when uncertainty is greater (Hernández et al., 2014). This flexibility would prevent incorrect fine-level classifications and improve overall reliability under complex environmental conditions.
Another limitation of flow cytometry-based models concerns their device dependency, as fluorescence intensity values are typically linked to the specific cytometer used during model training, which limits model transferability across instruments and comparison to other measurement. However, deployment within harmonized analyzers is feasible under standard bead-based daily QC protocols (CS&T/Application Settings for conventional analyzers; SpectroFlo QC beads for spectral systems), which have been shown to control inter-instrument MFI drift within single-digit percentages (Cornel et al., 2020; Omana-Zapata et al., 2019; Solly et al., 2013). Channel-wise normalization during data processing further reduces residual variability, and a lightweight domain-adaptation step, based on acquiring a small reference pollen set on the target instrument, can re-anchor feature distributions prior to inference. FSC and SSC parameters remain more sensitive to flow-rate and optical alignment and should therefore be monitored carefully. Where direct comparison between instruments is required, ERF/MESF calibration from NIST's Flow Cytometry Standards Consortium allows comparing fluorescence results between different instruments (Wang and Hoffman, 2017). Standardization procedures, such as calibrating cytometers using Rainbow beads and Quality Control beads could help ensure consistent signal outputs across different instruments (Solly et al., 2013). The present work was carried out using a conventional cytometer with three lasers and ten filters; using equipment with more lasers and detectors could refine the detection of fluorescent signatures and detect more of them. Spectral cytometry also opens up new possibilities for analyzing fluorescent signatures on a larger scale (Konecny et al., 2024), which could enable even better characterization of pollen based on its fluorescence.
The combination of flow cytometry and a Random Forest classification model proves to be a highly promising approach for the identification of airborne pollen in urban environments. By relying exclusively on routinely measured cytometric parameters, rather than images, this method ensures broad applicability and compatibility with standard healthcare and clinical cytometers. Integrating this approach into existing aerobiological monitoring networks could enable faster identification and quantification of allergenic pollen. We also built an extensive reference pollen collection comprising 97 species across 34 genera. For each species, we have several floral units (flower, catkins, cones) containing pollen, microscopic slides, and flow cytometry data for all pollen grains. This reference collection could be reused for different purposes such as future model training.
This study demonstrates a significant advancement in pollen identification by combining flow cytometry with a Random Forest classification model. This approach achieved high accuracy at both the genus (F1 = 0.90) and species levels (F1 = 0.76), surpassing several limitations of traditional microscopy. While species-level classification remains challenging for certain taxa, the results highlight the method's robustness and potential for large-scale implementation. With continued refinement and standardization, this approach could enable faster cheap, high throughput pollen identification and broaden its applications in aerobiological monitoring, while supporting public health applications and advancing research in pollen ecology worldwide.
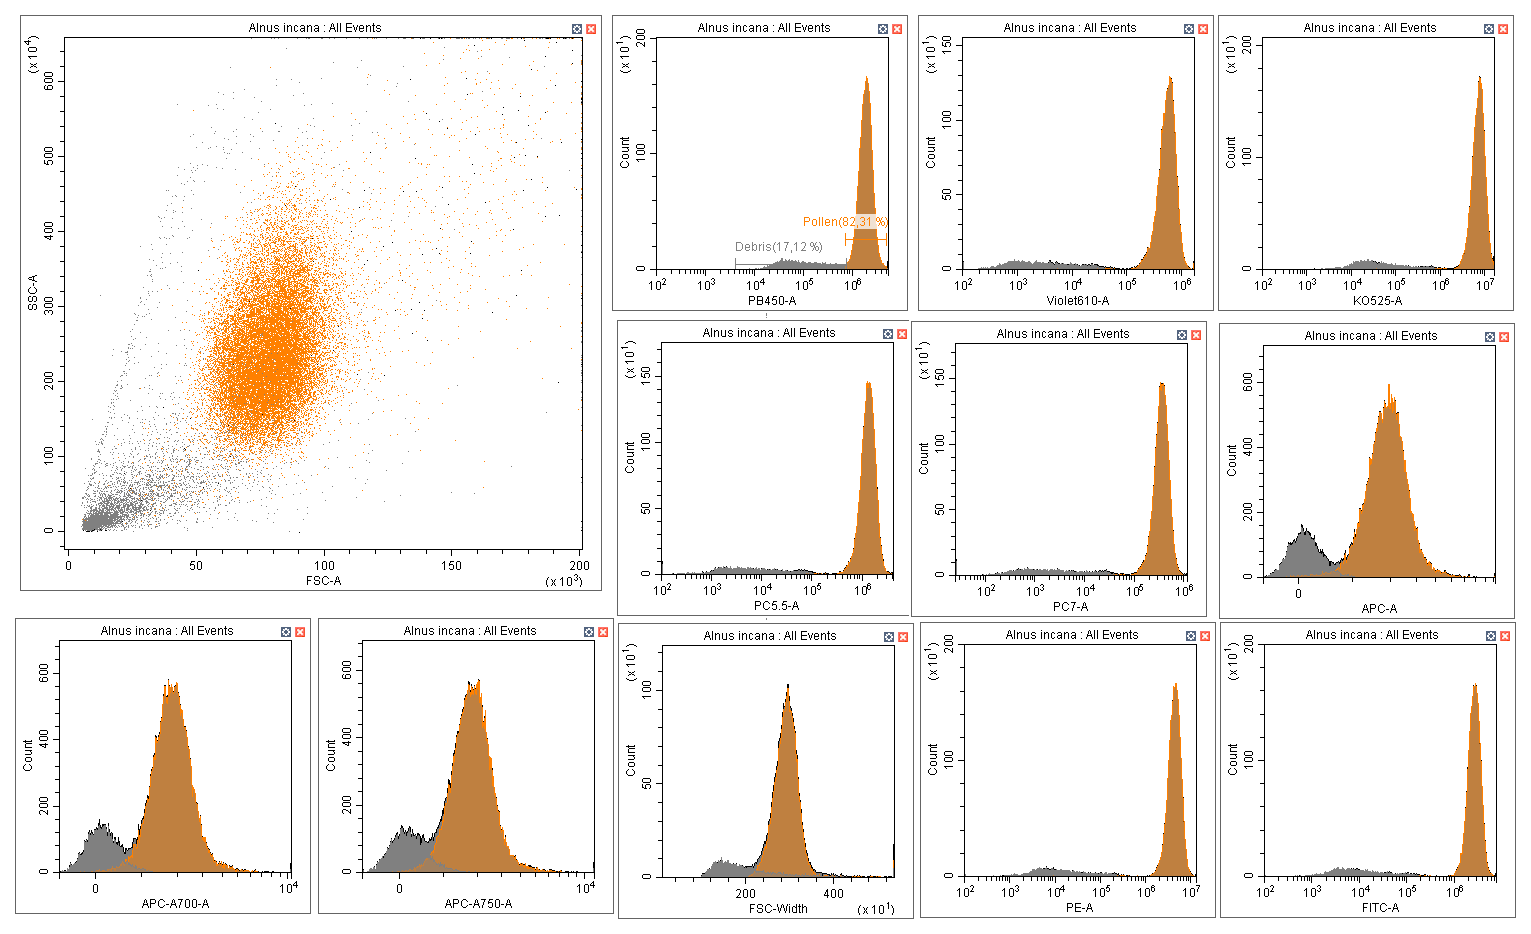
Figure A1Distinction pollen (orange) versus debris (grey) on CytExpert software: Example of Alnus incana.
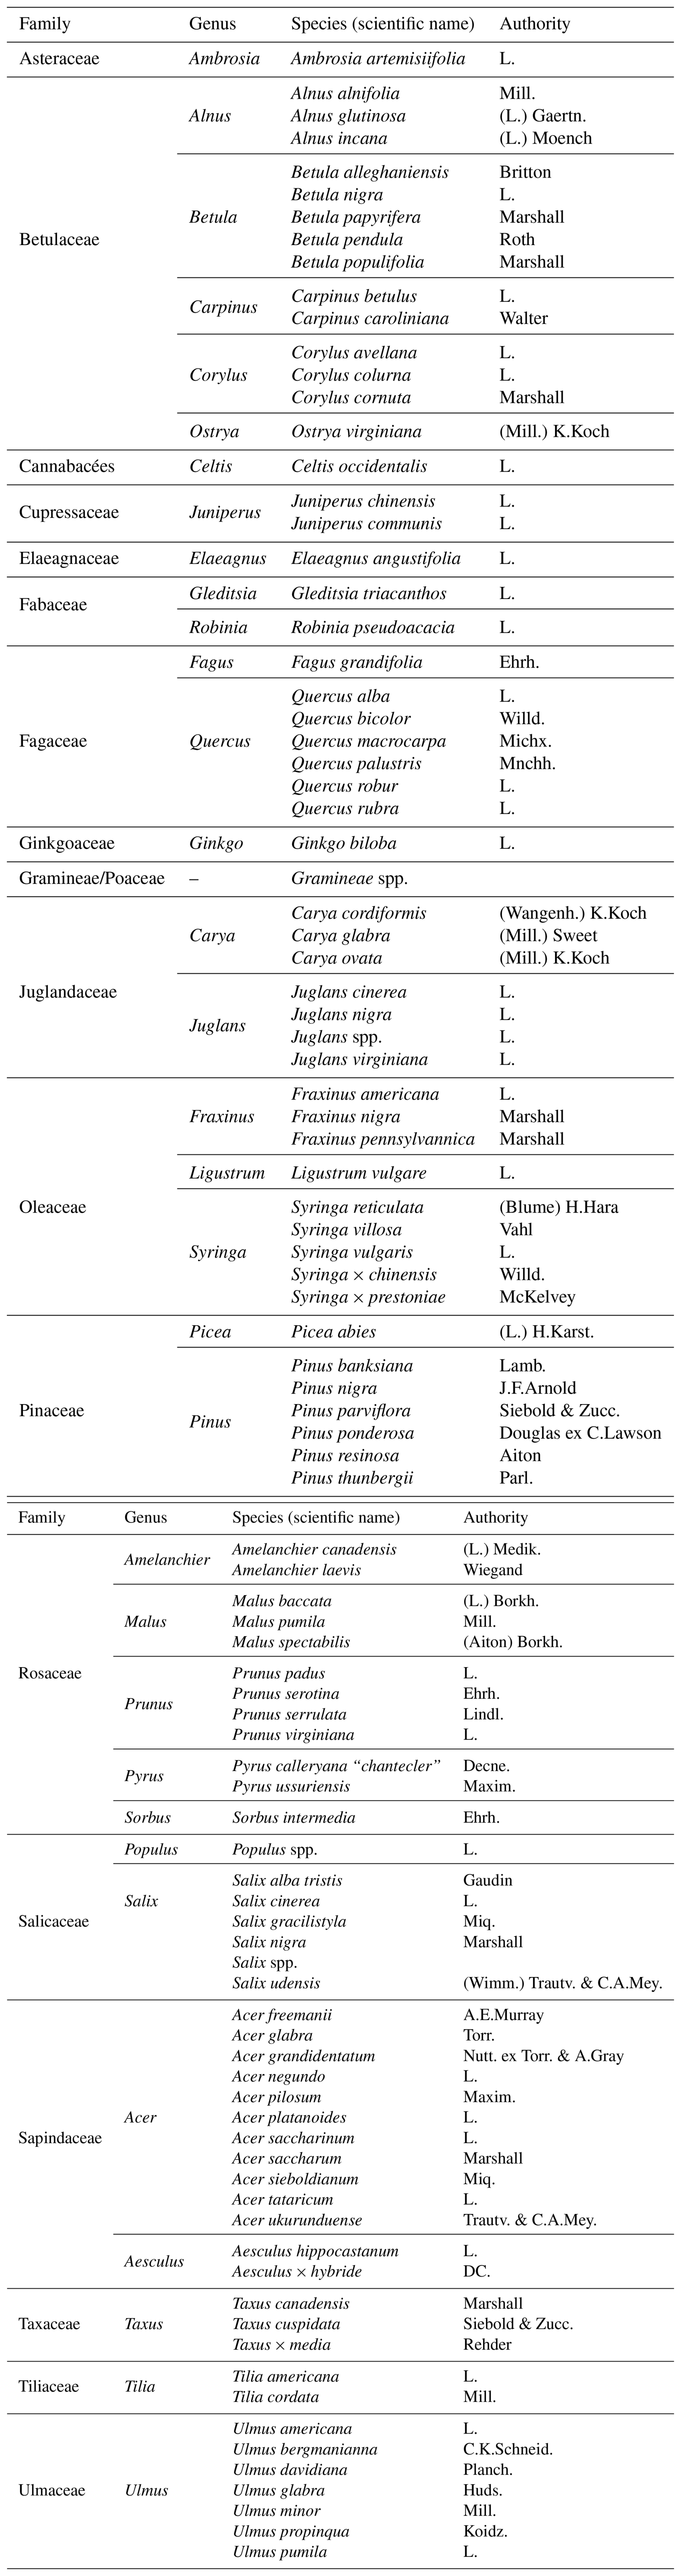
Table A2Explanation of cytometry variable names, showing the respective excitation lasers and emission detectors with their wavelengths and associated colors.
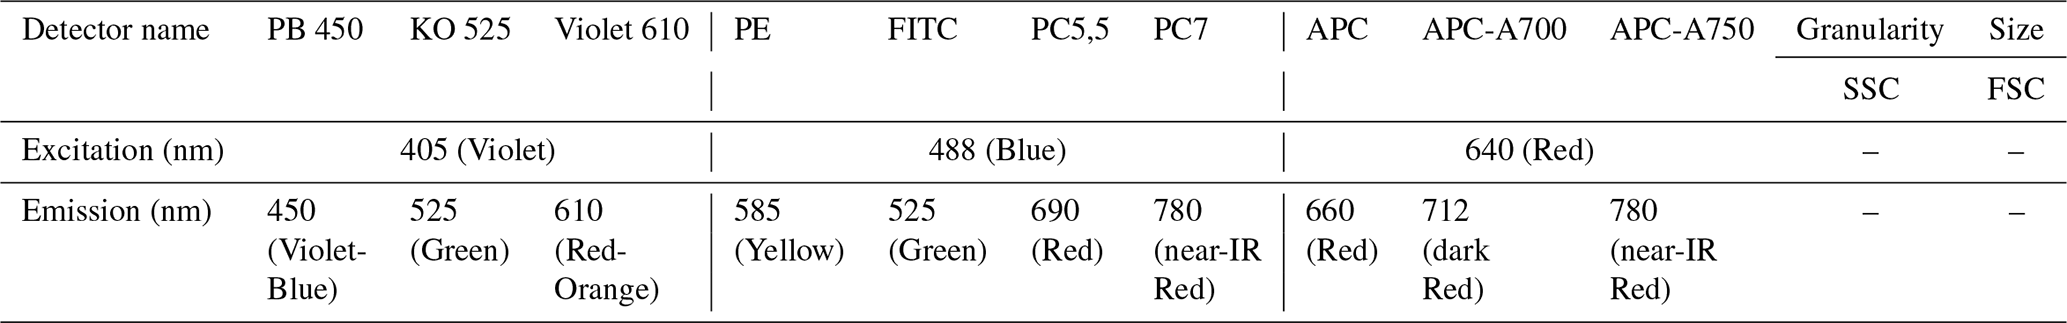
Table A3Number of pollen grains per species in the training dataset before balancing data.
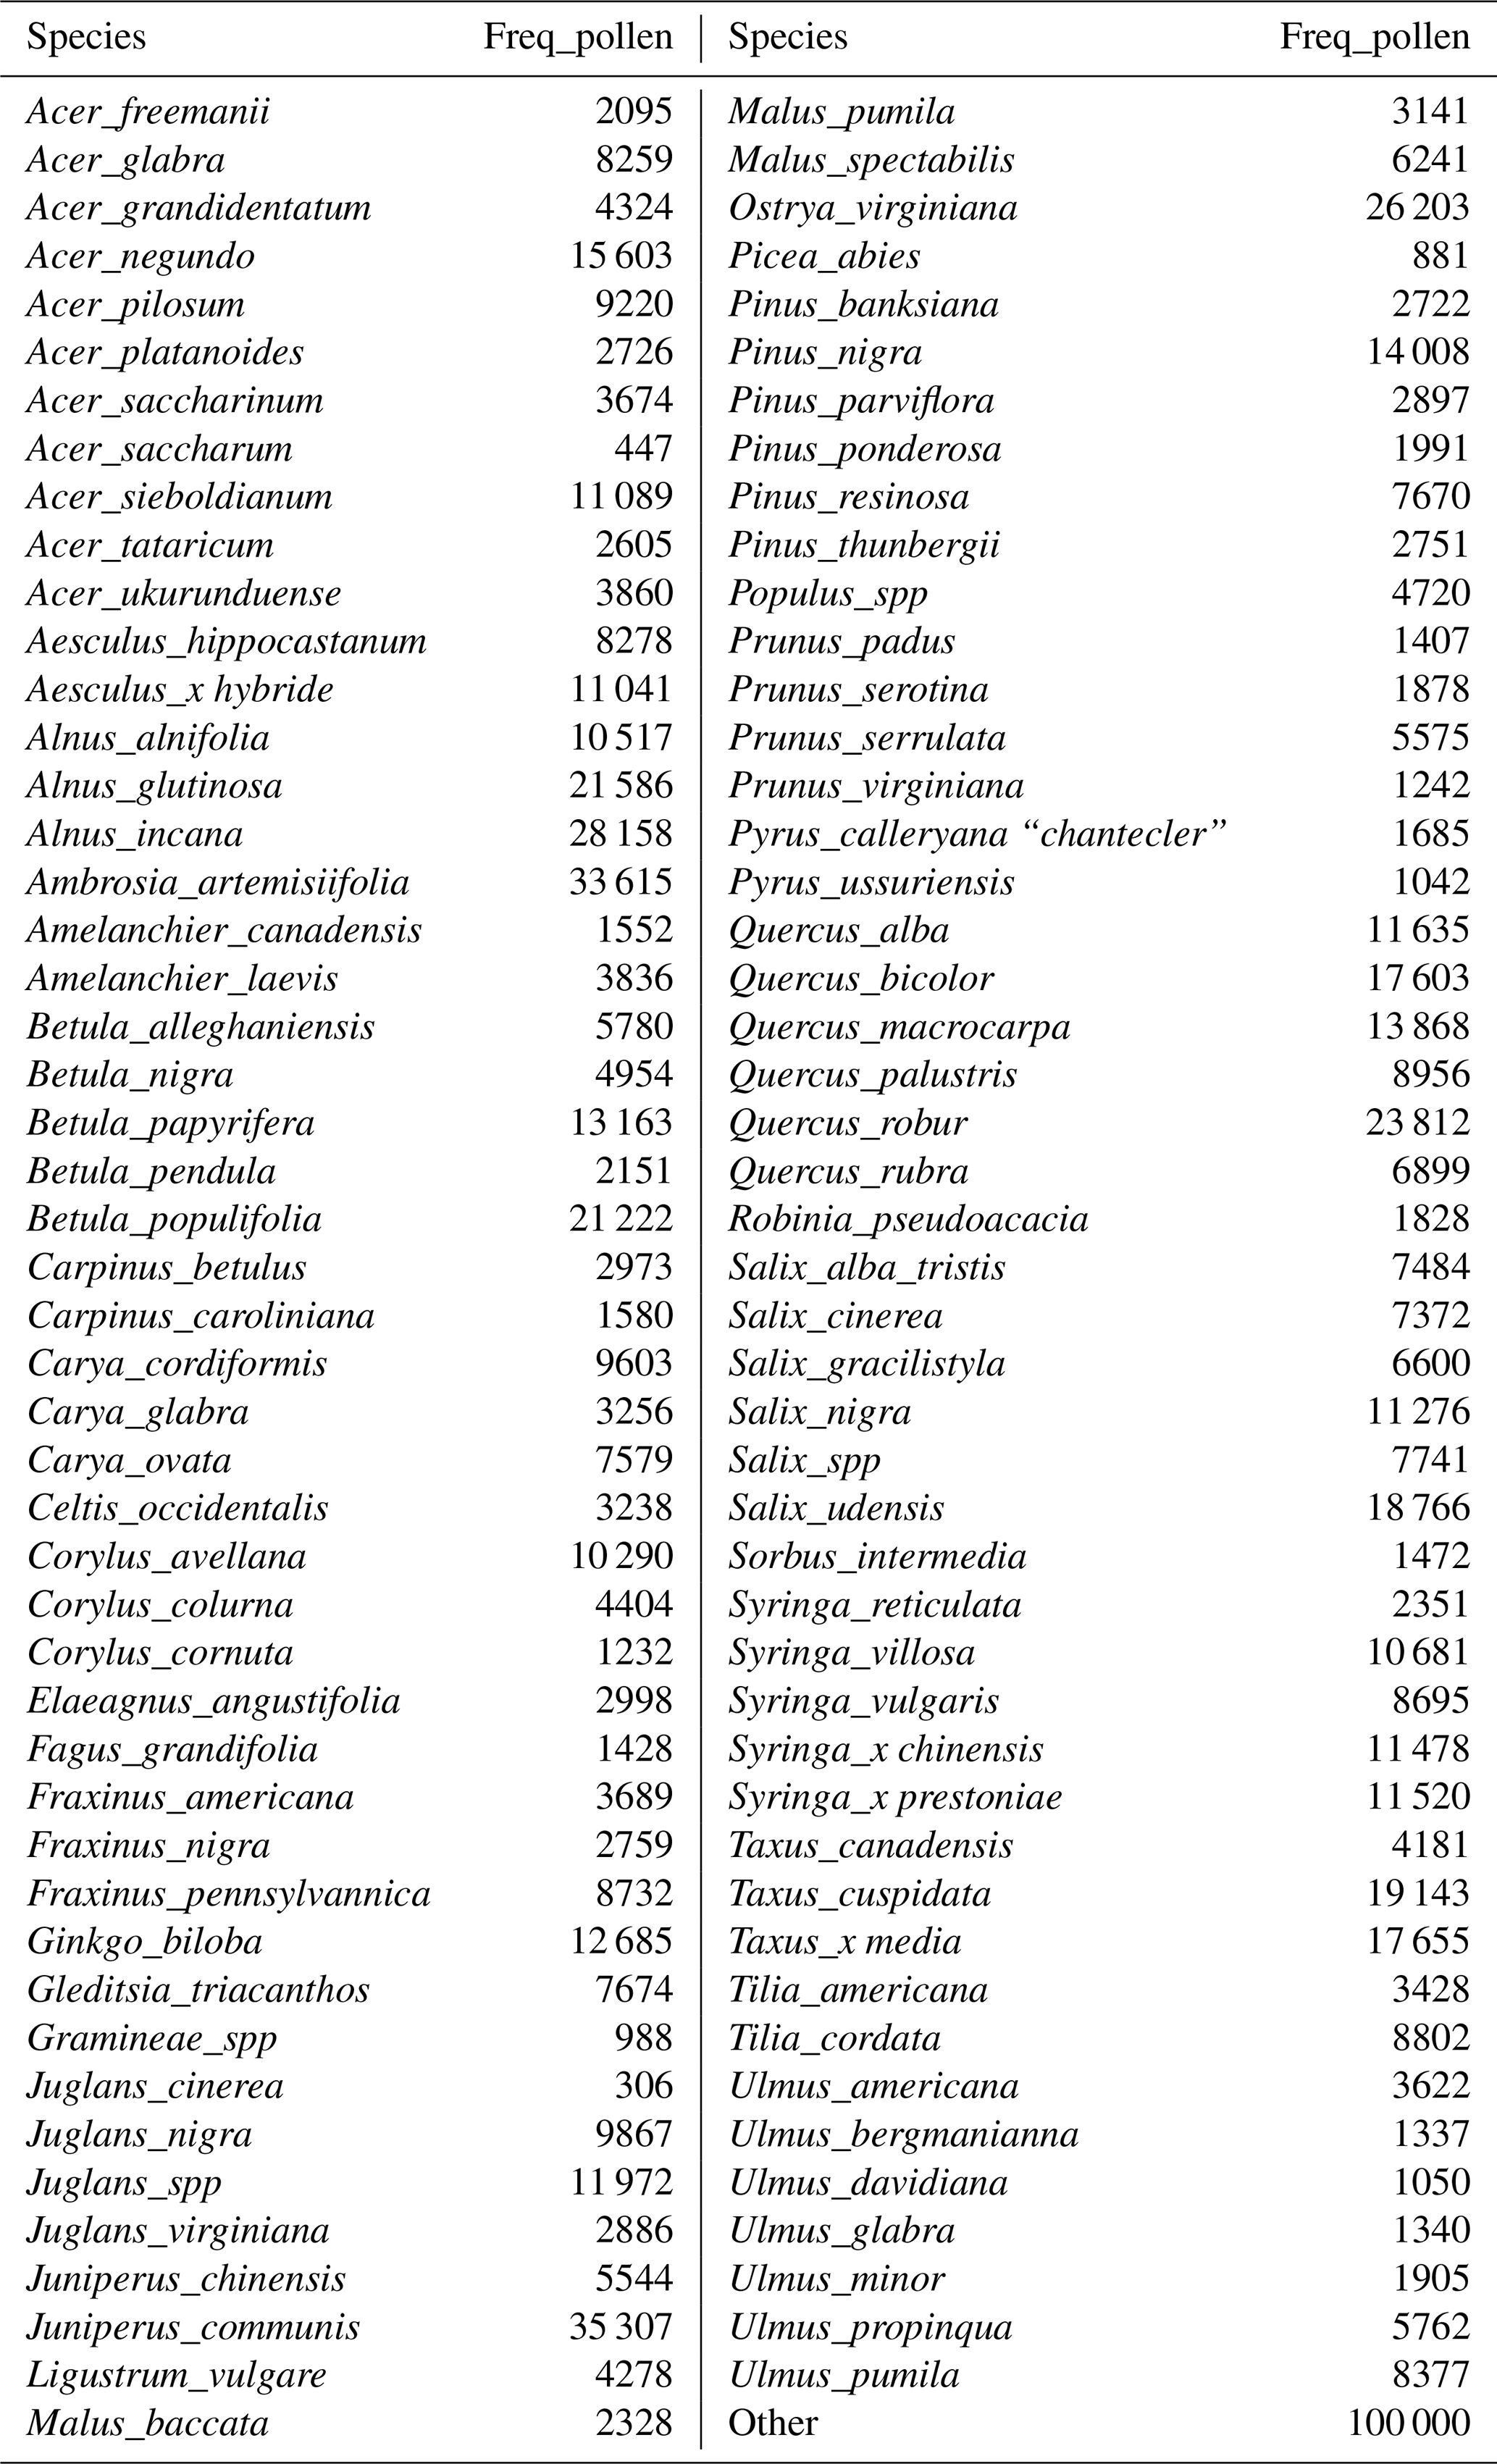
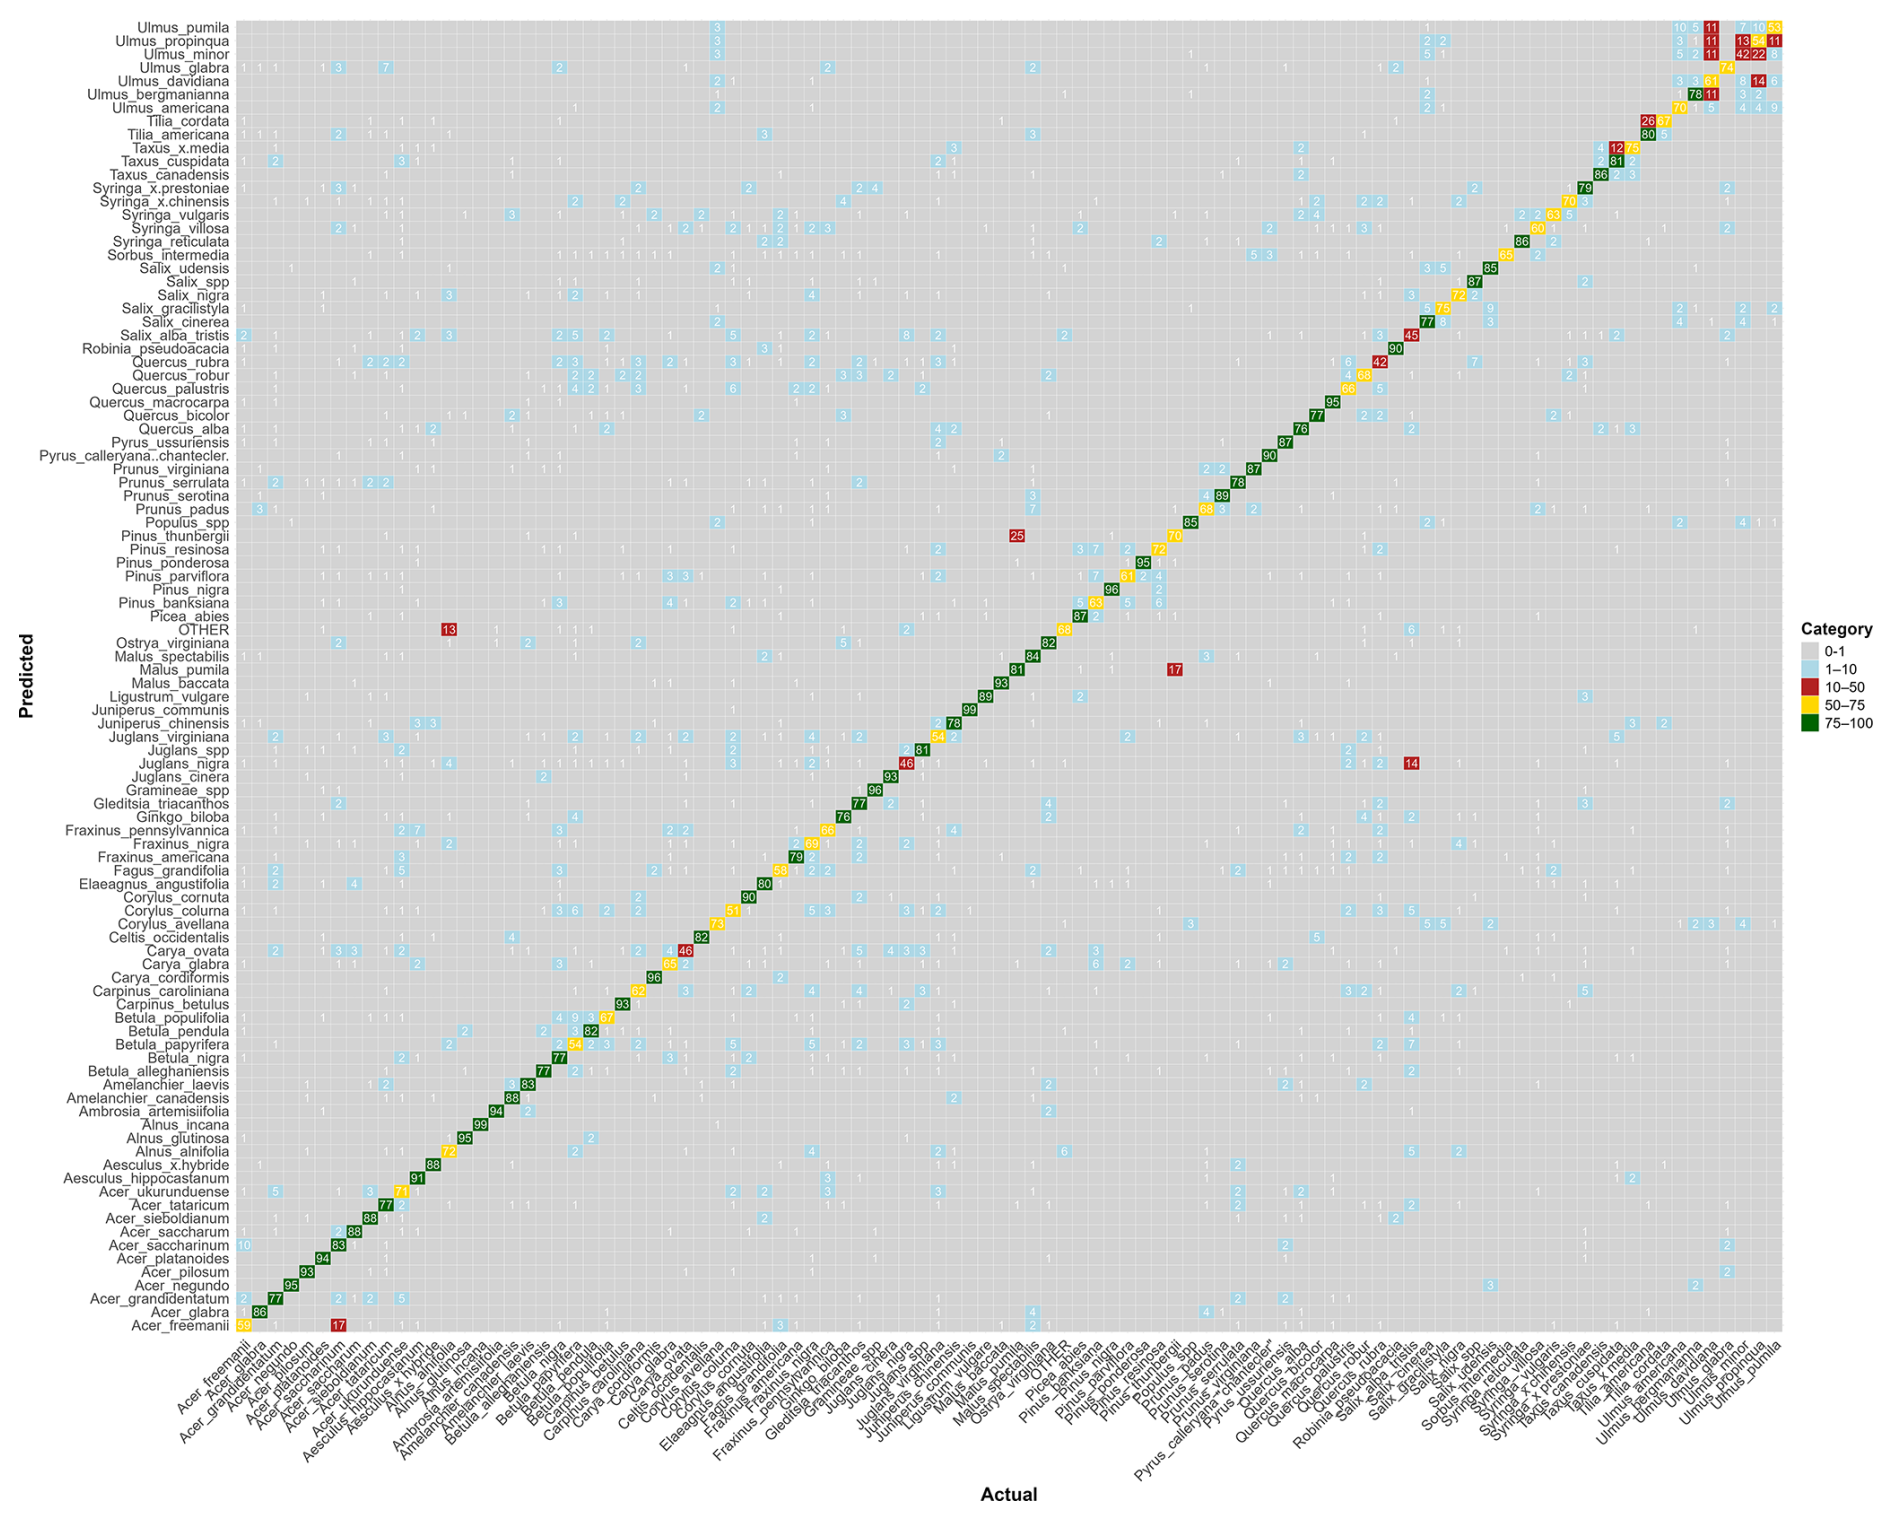
Figure B1Confusion matrix for the species-level model. The values represent, for each species, the percentage of pollen grains correctly classified (on the diagonal) and misclassified with the actual corresponding species (on the x axis). Colors correspond to categories (0 %–1 % in gray, 1 %–10 % in blue, 10 %–50 % in red, 50 %–75 % in yellow, and 75 %–100 % in green). Raw data are provided in Table S1.
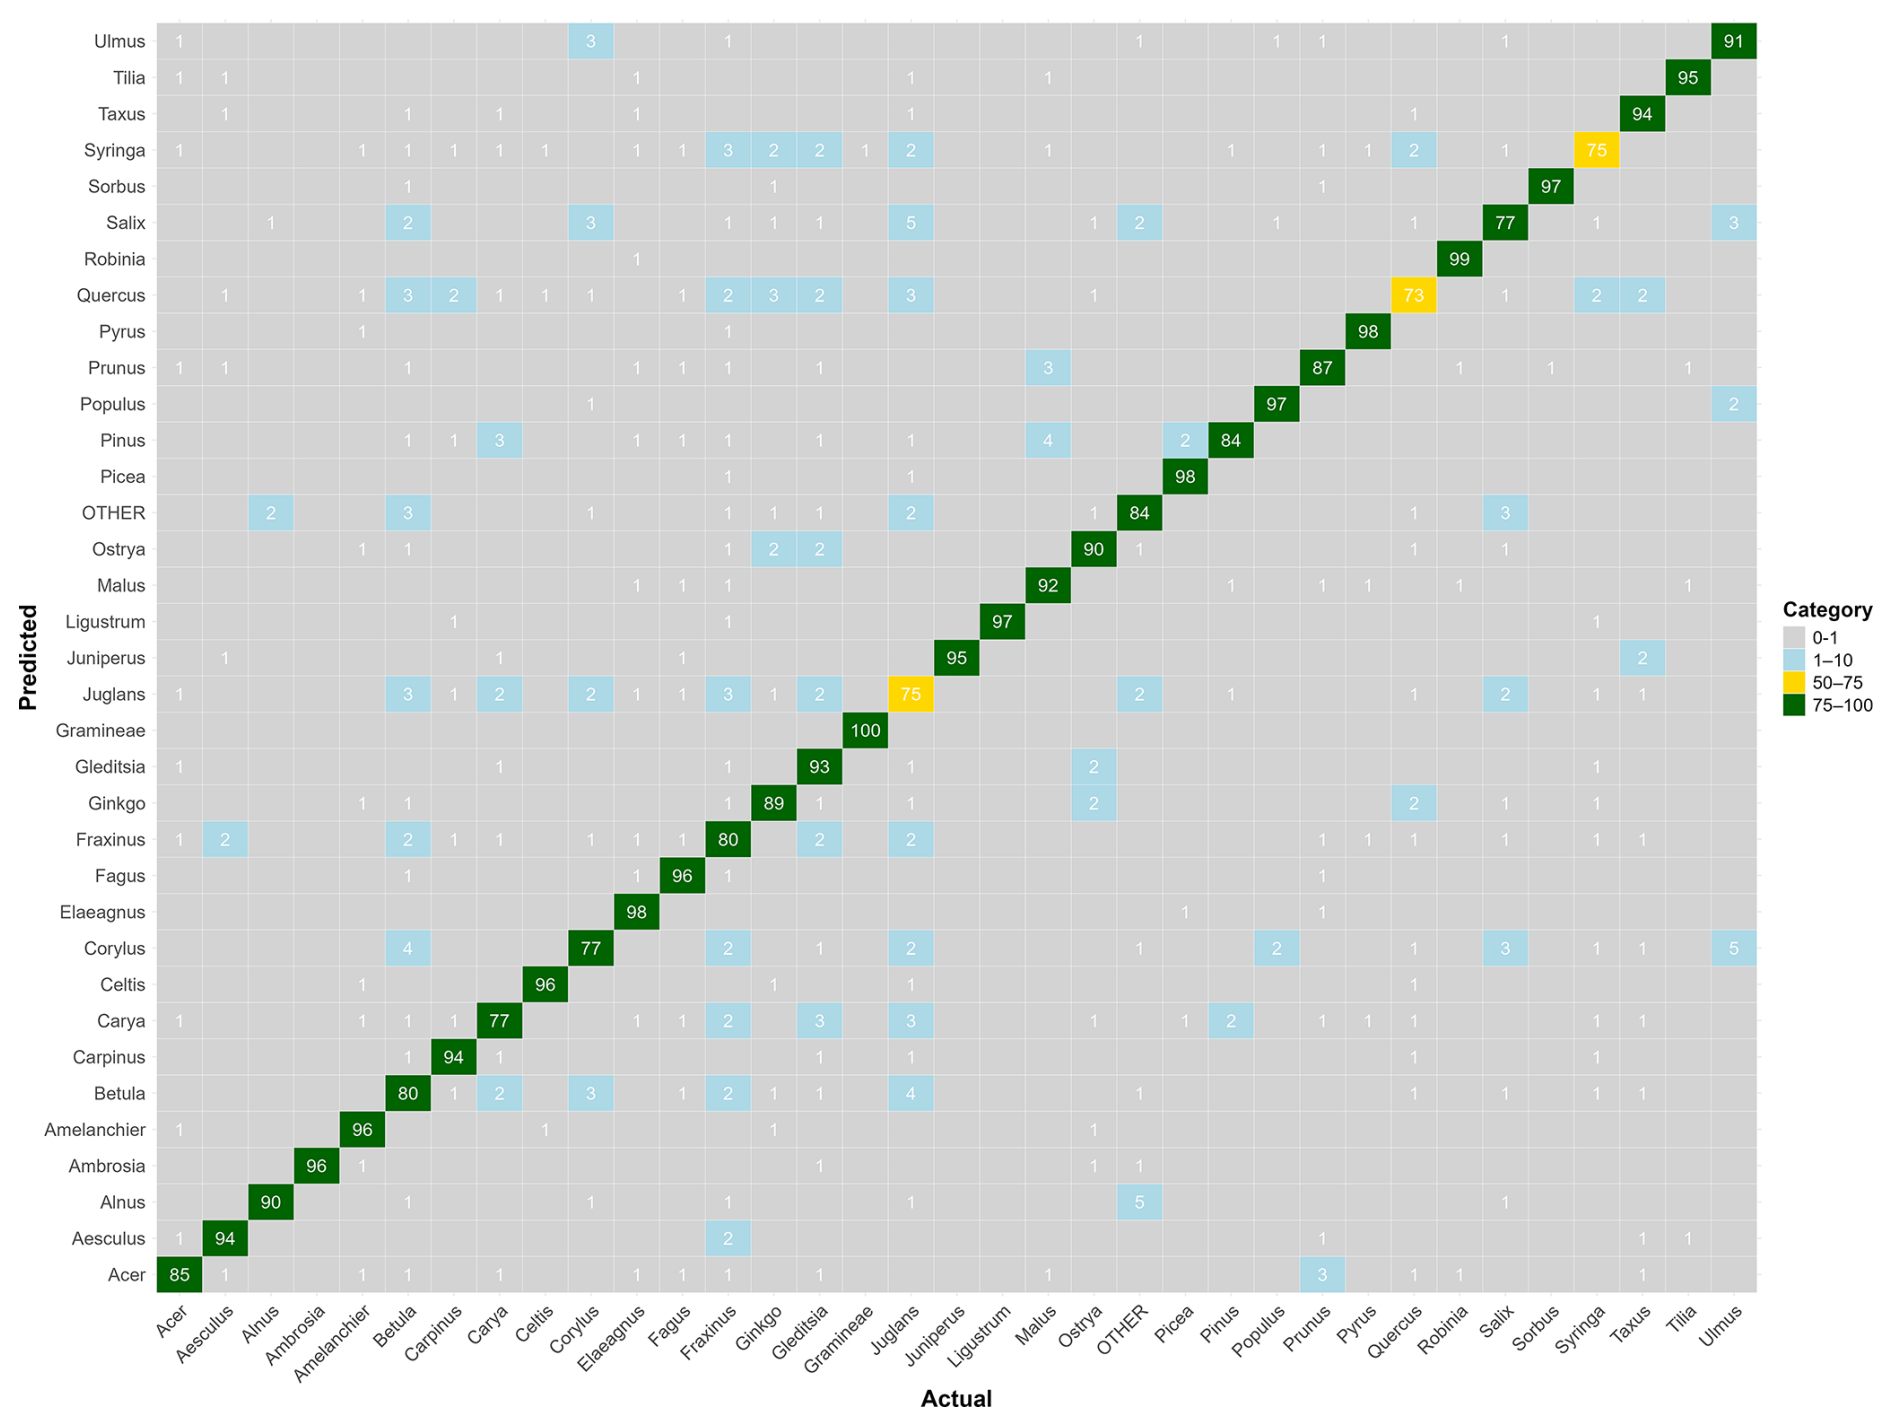
Figure B2Confusion matrix for the genus-level model. The values represent, for each genus, the percentage of pollen grains correctly classified (on the diagonal) and misclassified with the actual corresponding genus (on the x axis). Colors correspond to categories (0 %–1 % in gray, 1 %–10 % in blue, 10 %–50 % in red, 50 %–75 % in yellow, and 75 %–100 % in green). Raw data are provided in Table S2.
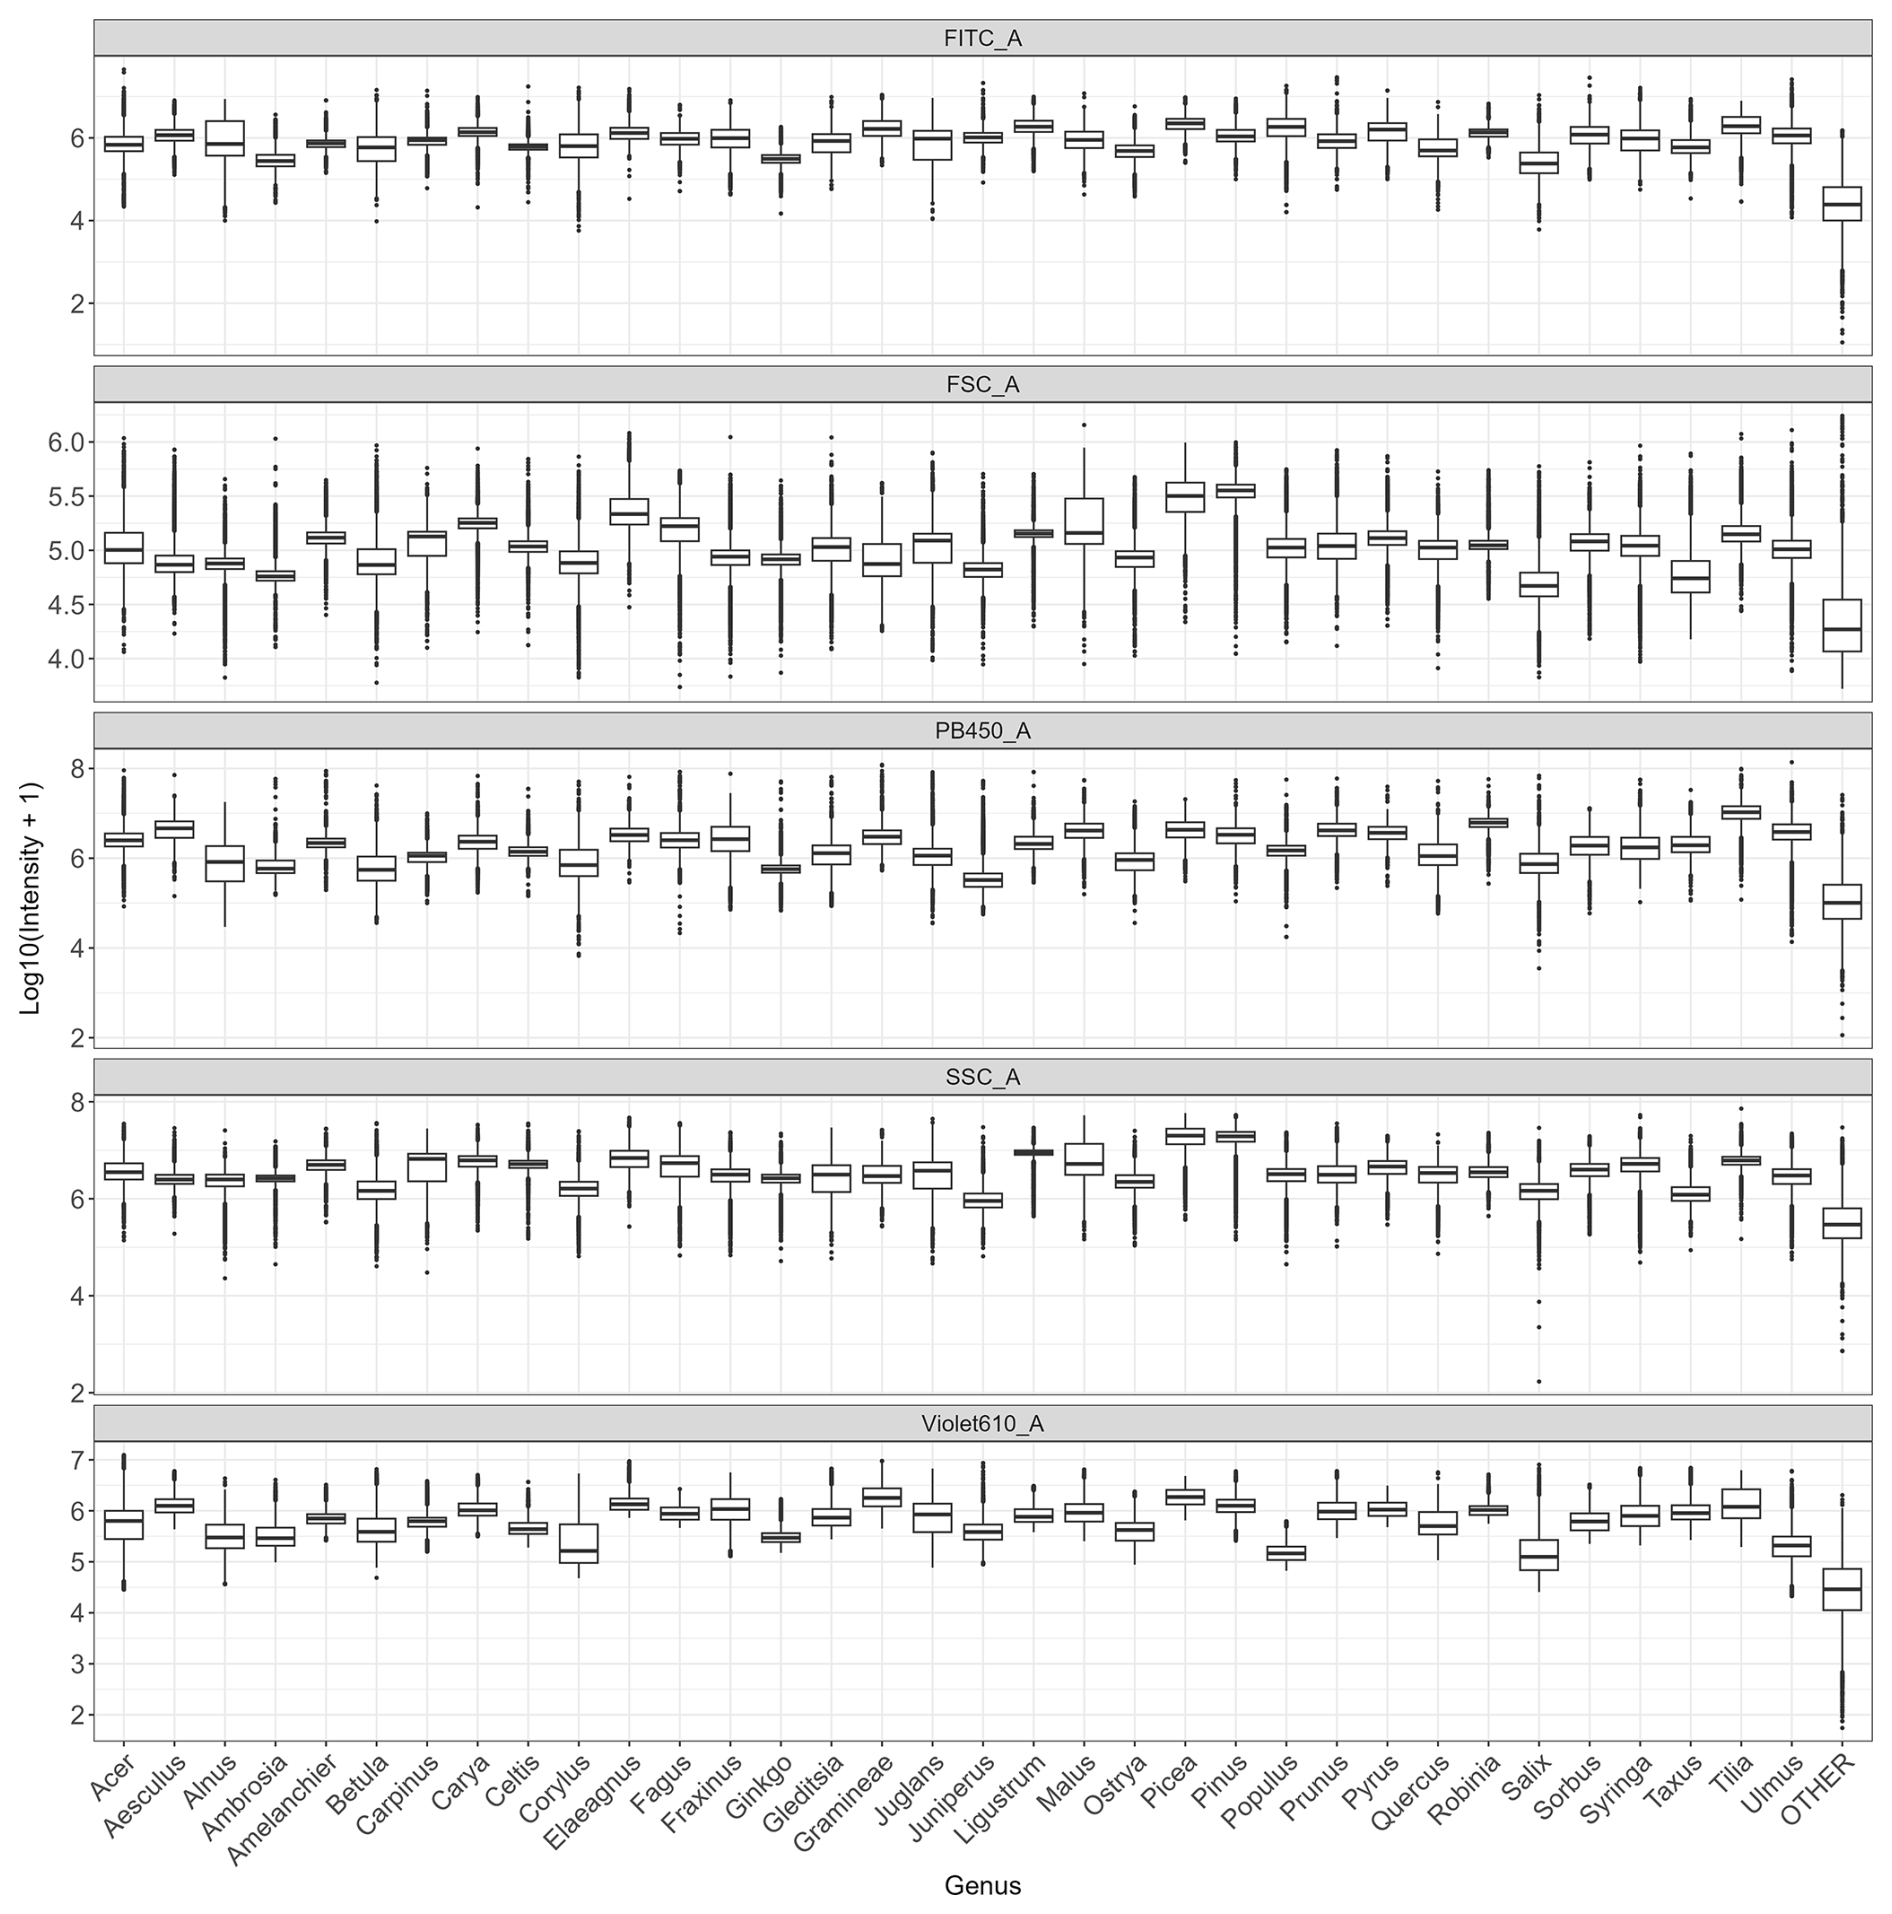
Figure C1Distribution of log-transformed values for the variables that contribute the most to distinguish taxa (FITC, FSC, SSC, Violet610, PB450) across all genera.
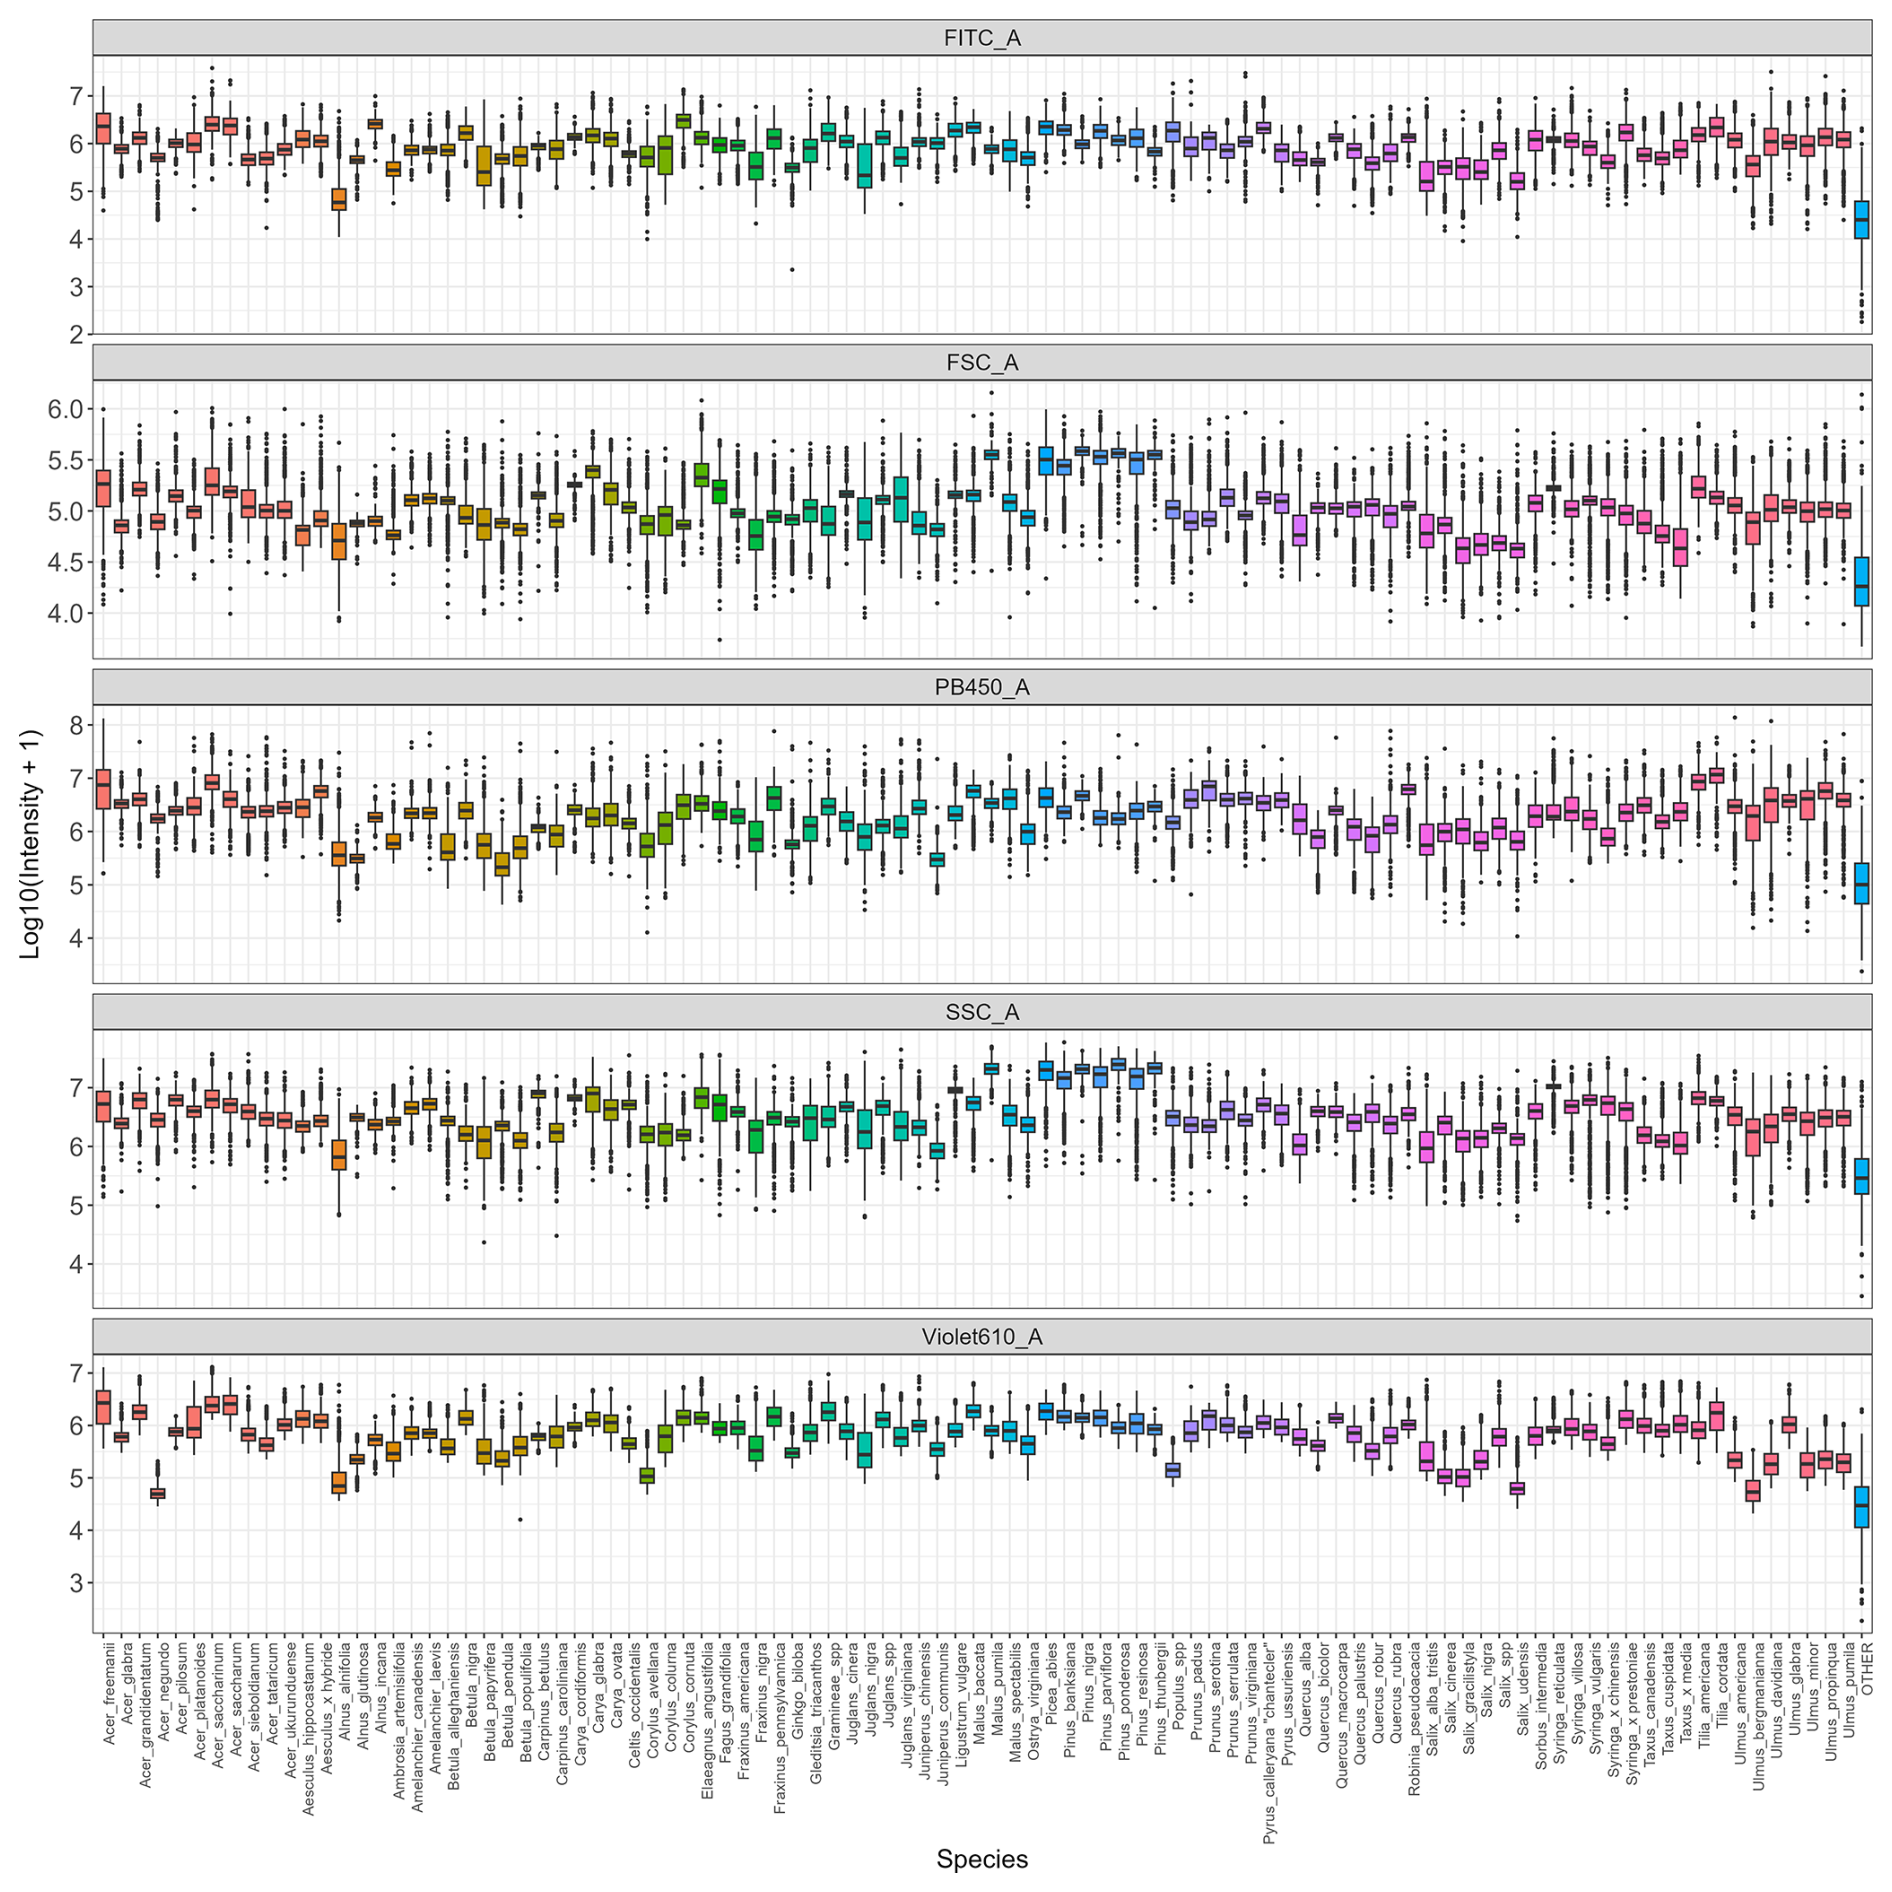
Figure C2Distribution of log-transformed values for the variables that contribute the most to distinguish taxa (FITC, FSC, SSC, Violet610, PB450) across all species. Colors indicate genus.
The code is available on a figshare repository (https://doi.org/10.6084/m9.figshare.32058084, Tardif, 2026).
Training datasets and trained models are available on a figshare repository (https://doi.org/10.6084/m9.figshare.30870641, Tardif, 2025). More data can be provided upon request.
The supplement related to this article is available online at https://doi.org/10.5194/amt-19-2817-2026-supplement.
ST: conceptualization, data collection, analyses, writing – original draft; AP, ILL, and RSS: conceptualization, funding acquisition, supervision, validation, support, writing – review and editing; GB: methodology (cytometry), writing – review and editing; MRK: methodology (lab protocols), writing – review and editing; GL: methodology (initial algorithm for the machine learning model), writing – review and editing.
The contact author has declared that none of the authors has any competing interests.
Publisher's note: Copernicus Publications remains neutral with regard to jurisdictional claims made in the text, published maps, institutional affiliations, or any other geographical representation in this paper. The authors bear the ultimate responsibility for providing appropriate place names. Views expressed in the text are those of the authors and do not necessarily reflect the views of the publisher.
We thank the CERMO-UQAM Imaging Platform and the Aerobiology Research Laboratories for their technical support. We are grateful for the precious help of Kira Safranova, Emily Ducharme, Maya Héon, and Kim Florentin in sampling, filtering, and running fresh pollen through the cytometer. We thank the Montreal Botanical Garden for permitting pollen collection from tree flowers. Model training was performed on supercomputers managed by Calcul Québec and the Digital Research Alliance of Canada.
This work was funded by NSERC-Alliance ALLRP 554373 – 21 and Fonds vert dans le cadre du Plan d'action 2013-2020 sur les changements climatiques du gouvernement québécois awarded to AP. ST also received funding from the Urban forestry program NSERC-CREATE-543300-20.
This paper was edited by Yoshiteru Iinuma and reviewed by three anonymous referees.
Ahlholm, Helander, and Savolainen: Genetic and environmental factors affecting the allergenicity of birch (Betula pubescens ssp. czerepanovii [Orl.] Hämet-Ahti) pollen, Clin. Exp. Allergy, 28, 1384–1388, https://doi.org/10.1046/j.1365-2222.1998.00404.x, 1998.
Aloisi, I., Cai, G., Tumiatti, V., Minarini, A., and Del Duca, S.: Natural polyamines and synthetic analogs modify the growth and the morphology of Pyrus communis pollen tubes affecting ROS levels and causing cell death, Plant Sci., 239, 92–105, https://doi.org/10.1016/j.plantsci.2015.07.008, 2015.
Anderegg, W. R. L., Abatzoglou, J. T., Anderegg, L. D. L., Bielory, L., Kinney, P. L., and Ziska, L.: Anthropogenic climate change is worsening North American pollen seasons, P. Natl. Acad. Sci. USA, 118, e2013284118, https://doi.org/10.1073/pnas.2013284118, 2021.
Breiman, L.: Random Forests, Mach. Learn., 45, 5–32, https://doi.org/10.1023/A:1010933404324, 2001.
Brennan, G. L., Potter, C., de Vere, N., Griffith, G. W., Skjøth, C. A., Osborne, N. J., Wheeler, B. W., McInnes, R. N., Clewlow, Y., Barber, A., Hanlon, H. M., Hegarty, M., Jones, L., Kurganskiy, A., Rowney, F. M., Armitage, C., Adams-Groom, B., Ford, C. R., Petch, G. M., and Creer, S.: Temperate airborne grass pollen defined by spatio-temporal shifts in community composition, Nature Ecology & Evolution, 3, 750–754, https://doi.org/10.1038/s41559-019-0849-7, 2019.
Chawla, N. V.: Data Mining for Imbalanced Datasets: An Overview, in: Data Mining and Knowledge Discovery Handbook, edited by: Maimon, O. and Rokach, L., Springer, Boston, MA, https://doi.org/10.1007/978-0-387-09823-4_45, 2010.
Cornel, A. M., Van Der Burght, C. A. J., Nierkens, S., and Van Velzen, J. F.: FACSCanto II and LSRFortessa flow cytometer instruments can be synchronized utilizing single-fluorochrome–conjugated surface-dyed beads for standardized immunophenotyping, J. Clin. Lab. Anal., 34, e23361, https://doi.org/10.1002/jcla.23361, 2020.
D'Amato, G., Cecchi, L., Bonini, S., Nunes, C., Annesi-Maesano, I., Behrendt, H., Liccardi, G., Popov, T., and van Cauwenberge, P.: Allergenic pollen and pollen allergy in Europe, Allergy, 62, 976–990, https://doi.org/10.1111/j.1398-9995.2007.01393.x, 2007.
De Weger, L. A., Bergmann, K. Ch., Rantio-Lehtimäki, A., Dahl, A., Buters, J., Déchamp, C., Belmonte, J., Thibaudon, M., Cecchi, L., Besancenot, J.-P., Galán, C., and Waisel, Y.: Impact of Pollen, in: Allergenic Pollen: A Review of the Production, Release, Distribution and Health Impacts, edited by: Sofiev, M. and Bergmann, K. C., Springer, Dordrecht 161–203, https://doi.org/10.1007/978-94-007-4881-1_6, 2013.
De Weger, L. A., Verbeek, C., Markey, E., O'Connor, D. J., and Gosling, W. D.: Greater difference between airborne and flower pollen chemistry, than between pollen collected across a pollution gradient in the Netherlands, Sci. Total Environ., 934, 172963, https://doi.org/10.1016/j.scitotenv.2024.172963, 2024.
Donaldson, L.: Autofluorescence in Plants, Molecules, 25, 2393, https://doi.org/10.3390/molecules25102393, 2020.
Dunker, S., Motivans, E., Rakosy, D., Boho, D., Mäder, P., Hornick, T., and Knight, T. M.: Pollen analysis using multispectral imaging flow cytometry and deep learning, New Phytol., 229, 593–606, https://doi.org/10.1111/nph.16882, 2021.
Dunker, S., Boyd, M., Durka, W., Erler, S., Harpole, W. S., Henning, S., Herzschuh, U., Hornick, T., Knight, T., Lips, S., Mäder, P., Švara, E. M., Mozarowski, S., Rakosy, D., Römermann, C., Schmitt-Jansen, M., Stoof-Leichsenring, K., Stratmann, F., Treudler, R., Virtanen, R., Wendt-Potthoff, K., and Wilhelm, C.: The potential of multispectral imaging flow cytometry for environmental monitoring, Cytometry A, 101, 782–799, https://doi.org/10.1002/cyto.a.24658, 2022.
Erb, S., Graf, E., Zeder, Y., Lionetti, S., Berne, A., Clot, B., Lieberherr, G., Tummon, F., Wullschleger, P., and Crouzy, B.: Real-time pollen identification using holographic imaging and fluorescence measurements, Atmos. Meas. Tech., 17, 441–451, https://doi.org/10.5194/amt-17-441-2024, 2024.
Falagiani, P.: Pollinosis, CRC Press, 288 pp., ISBN 978-0-8493-6482-2, 1989.
Gierlicka, I., Kasprzyk, I., and Wnuk, M.: Imaging Flow Cytometry as a Quick and Effective Identification Technique of Pollen Grains from Betulaceae, Oleaceae, Urticaceae and Asteraceae, Cells, 11, 598, https://doi.org/10.3390/cells11040598, 2022.
Grandini, M., Bagli, E., and Visani, G.: Metrics for Multi-Class Classification: an Overview, arXiv [preprint], https://doi.org/10.48550/arXiv.2008.05756, 2020.
Hernández, J., Sucar, L. E., and Morales, E. F.: Multidimensional hierarchical classification, Expert Syst. Appl., 41, 7671–7677, https://doi.org/10.1016/j.eswa.2014.05.054, 2014.
Holt, K. A. and Bennett, K. D.: Principles and methods for automated palynology, New Phytol., 203, 735–742, https://doi.org/10.1111/nph.12848, 2014.
Kim, K. R., Oh, J.-W., Woo, S.-Y., Seo, Y. A., Choi, Y.-J., Kim, H. S., Lee, W. Y., and Kim, B.-J.: Does the increase in ambient CO2 concentration elevate allergy risks posed by oak pollen?, Int. J. Biometeorol., 62, 1587–1594, https://doi.org/10.1007/s00484-018-1558-7, 2018.
Konecny, A. J., Mage, P. L., Tyznik, A. J., Prlic, M., and Mair, F.: OMIP-102: 50-color phenotyping of the human immune system with in-depth assessment of T cells and dendritic cells, Cytom. Part A, 105, 430–436, https://doi.org/10.1002/cyto.a.24841, 2024.
Ladeau, S. L. and Clark, J. S.: Pollen production by Pinus taeda growing in elevated atmospheric CO2, Funct. Ecol., 20, 541–547, https://doi.org/10.1111/j.1365-2435.2006.01133.x, 2006.
Martin, A. C. and Harvey, W. J.: The Global Pollen Project: a new tool for pollen identification and the dissemination of physical reference collections, Methods Ecol. Evol., 8, 892–897, https://doi.org/10.1111/2041-210X.12752, 2017.
Medek, D. E., Katelaris, C. H., Milic, A., Beggs, P. J., Lampugnani, E. R., Vicendese, D., Erbas, B., and Davies, J. M.: Aerobiology matters: Why people in the community access pollen information and how they use it, Clinical and Translational All, 15, e70031, https://doi.org/10.1002/clt2.70031, 2025.
Mousavi, F., Oteros, J., Shahali, Y., and Carinanos, P.: Impacts of climate change on allergenic pollen production: A systematic review and meta-analysis, Agr. Forest Meteorol., 349, 109948, https://doi.org/10.1016/j.agrformet.2024.109948, 2024.
Ogden, E. C., Raynor, G. S., Hayes, J. V., Lewis, D. M., and Haines, J. H.: Manual for Sampling Airborne Pollen, Hafner Press, New York, ISBN 0028498208, 1974.
Omana-Zapata, I., Mutschmann, C., Schmitz, J., Gibson, S., Judge, K., Aruda Indig, M., Lu, B., Taufman, D., Sanfilippo, A. M., Shallenberger, W., Graminske, S., McLean, R., Hsen, R. I., d'Empaire, N., Dean, K., and O'Gorman, M.: Accurate and reproducible enumeration of T-, B-, and NK lymphocytes using the BD FACSLyric 10-color system: A multisite clinical evaluation, PLoS ONE, 14, e0211207, https://doi.org/10.1371/journal.pone.0211207, 2019.
Paquette, A., Sousa-Silva, R., Fernandez, M., Faticov, M., Schillé, L., Bacon, E., Cameron, E., Fraysse, J., gagnon Koudji, E., Poirier, S., Rondeau-Leclaire, J., Tardif, S., Handa, T., Laforest-Lapointe, I., Puric-Mladenovic, D., and Ziter, C.: Montreal Urban Observatory: research platform to monitor urban forest ecosystems for global change adaptation and health, bioRxiv [preprint], https://doi.org/10.64898/2026.02.07.704556, 2026.
Pöhlker, C., Huffman, J. A., Förster, J.-D., and Pöschl, U.: Autofluorescence of atmospheric bioaerosols: spectral fingerprints and taxonomic trends of pollen, Atmos. Meas. Tech., 6, 3369–3392, https://doi.org/10.5194/amt-6-3369-2013, 2013.
Šaulienė, I., Šukienė, L., Daunys, G., Valiulis, G., Vaitkevičius, L., Matavulj, P., Brdar, S., Panic, M., Sikoparija, B., Clot, B., Crouzy, B., and Sofiev, M.: Automatic pollen recognition with the Rapid-E particle counter: the first-level procedure, experience and next steps, Atmos. Meas. Tech., 12, 3435–3452, https://doi.org/10.5194/amt-12-3435-2019, 2019.
Savouré, M., Bousquet, J., Jaakkola, J. J. K., Jaakkola, M. S., Jacquemin, B., and Nadif, R.: Worldwide prevalence of rhinitis in adults: A review of definitions and temporal evolution, Clinical and Translational All, 12, e12130, https://doi.org/10.1002/clt2.12130, 2022.
Sikoparija, B., Matavulj, P., Simovic, I., Radisic, P., Brdar, S., Minic, V., Tesendic, D., Kadantsev, E., Palamarchuk, J., and Sofiev, M.: Classification accuracy and compatibility across devices of a new Rapid-E+ flow cytometer, Atmos. Meas. Tech., 17, 5051–5070, https://doi.org/10.5194/amt-17-5051-2024, 2024.
Smith, E. G.: Sampling and identifying allergenic pollens and molds. An illustrated manual for physicians and lab technicians, Sampling and identifying allergenic pollens and molds. An illustrated manual for physicians and lab technicians, Blewstone Press, ISBN 0930961005, 1984.
Solly, F., Rigollet, L., Baseggio, L., Guy, J., Borgeot, J., Guérin, E., Debliquis, A., Drenou, B., Campos, L., Lacombe, F., and Béné, M. C.: Comparable flow cytometry data can be obtained with two types of instruments, Canto II, and Navios. A GEIL study, Cytometry A, 83, 1066–1072, https://doi.org/10.1002/cyto.a.22404, 2013.
Sousa-Silva, R., Smargiassi, A., Paquette, A., Kaiser, D., and Kneeshaw, D.: Exactly what do we know about tree pollen allergenicity?, The Lancet Respiratory Medicine, 8, e10, https://doi.org/10.1016/S2213-2600(19)30472-2, 2020.
Steckling-Muschack, N., Mertes, H., Mittermeier, I., Schutzmeier, P., Becker, J., Bergmann, K.-C., Böse-O'Reilly, S., Buters, J., Damialis, A., Heinrich, J., Kabesch, M., Nowak, D., Walser-Reichenbach, S., Weinberger, A., Zamfir, M., Herr, C., Kutzora, S., and Heinze, S.: A systematic review of threshold values of pollen concentrations for symptoms of allergy, Aerobiologia, 37, 395–424, https://doi.org/10.1007/s10453-021-09709-4, 2021.
Swanson, B., Freeman, M., Rezgui, S., and Huffman, J. A.: Pollen classification using a single particle fluorescence spectroscopy technique, Aerosol Sci. Tech., 57, 112–133, https://doi.org/10.1080/02786826.2022.2142510, 2023.
Tardif, S.: Pollen Flow Cytometry Datasets and Classification Models, Version v1, figshare [data set], https://doi.org/10.6084/m9.figshare.30870641, 2025.
Tardif, S.: Pollen-classification-model, Version v1, figshare [Software], https://doi.org/10.6084/m9.figshare.32058084, 2026.
Tummon, F., Adams-Groom, B., Antunes, C. M., Bruffaerts, N., Buters, J., Cariñanos, P., Celenk, S., Choël, M., Clot, B., Cristofori, A., Crouzy, B., Damialis, A., Fernández, A. R., González, D. F., Galán, C., Gedda, B., Gehrig, R., Gonzalez-Alonso, M., Gottardini, E., Gros-Daillon, J., Hajkova, L., O'Connor, D., Östensson, P., Oteros, J., Pauling, A., Pérez-Badia, R., Rodinkova, V., Rodríguez-Rajo, F. J., Ribeiro, H., Sauliene, I., Sikoparija, B., Skjøth, C. A., Spanu, A., Sofiev, M., Sozinova, O., Srnec, L., Visez, N., and De Weger, L. A.: The role of automatic pollen and fungal spore monitoring across major end-user domains, Aerobiologia, 40, 57–75, https://doi.org/10.1007/s10453-024-09820-2, 2024.
Wang, L. and Hoffman, R. A.: Standardization, Calibration, and Control in Flow Cytometry, Current Protocols in Cytometry, 79, https://doi.org/10.1002/cpcy.14, 2017.
Zhang, G. and Abdulla, W.: Identifying Pollen Species Using Multispectral Imaging Flow Cytometry and Neural Networks, SSRN [preprint], https://doi.org/10.2139/ssrn.4375939, 2023.
Zhang, Y. and Steiner, A. L.: Projected climate-driven changes in pollen emission season length and magnitude over the continental United States, Nat. Commun., 13, 1234, https://doi.org/10.1038/s41467-022-28764-0, 2022.
Ziska, L. H., Makra, L., Harry, S. K., Bruffaerts, N., Hendrickx, M., Coates, F., Saarto, A., Thibaudon, M., Oliver, G., Damialis, A., Charalampopoulos, A., Vokou, D., Heiđmarsson, S., Guđjohnsen, E., Bonini, M., Oh, J.-W., Sullivan, K., Ford, L., Brooks, G. D., Myszkowska, D., Severova, E., Gehrig, R., Ramón, G. D., Beggs, P. J., Knowlton, K., and Crimmins, A. R.: Temperature-related changes in airborne allergenic pollen abundance and seasonality across the northern hemisphere: a retrospective data analysis, The Lancet Planetary Health, 3, e124–e131, https://doi.org/10.1016/S2542-5196(19)30015-4, 2019.
- Abstract
- Introduction
- Methodology
- Results
- Discussion
- Conclusion
- Appendix A: Reference pollen collection
- Appendix B: Confusion matrices
- Appendix C: Distributions of values for the main discriminant variables
- Code availability
- Data availability
- Author contributions
- Competing interests
- Disclaimer
- Acknowledgements
- Financial support
- Review statement
- References
- Supplement