the Creative Commons Attribution 4.0 License.
the Creative Commons Attribution 4.0 License.
 | 04 May 2026
Characterizing thermodynamic observations from unshielded multirotor drone sensors
Jennie Bukowski
Leah D. Grant
Peter J. Marinescu
J. Minnie Park
Stacey M. Hitchcock
Christine A. Neumaier
Susan C. van den Heever
Multirotor drones (part of the category of small Uncrewed Aerial Systems [sUAS] or small Uncrewed Aerial Vehicles [sUAV]) are used in atmospheric research to make measurements of the lower atmosphere, and their use is poised to increase in the future. New drone atmospheric sensing opportunities, such as ride-along applications and drone swarms, are emerging. These opportunities, which may not allow room for specialized shielding or aspiration equipment, together with increased drone usage, necessitate the characterization of the performance of unshielded sensors mounted to drones if the accuracy of such observations is to be understood. In this work, we characterize the accuracy of thermodynamic measurements, specifically temperature and water vapor mixing ratio, based on the sensor mounting position onboard multirotor drones. To assess the influence of the drone mechanics on the measurements, ninety-eight individual drone flights with eight distinct thermodynamic sensor positions were performed next to an instrumented flux tower and a tethersonde carrying identical sensors, where the tower and tethersonde measurements are assumed as truth. The flights were at least nine minutes in length, and nine of the flights were conducted at night. At the best position, absolute daytime temperature errors were between −0.83 and +0.61 K at the 95 % confidence interval, while nighttime temperature errors were smaller, ranging from −0.28 and +0.48 K. Water vapor mixing ratio errors are within −0.22 and +0.66 g kg−1. We conclude that measurements in field campaigns are more accurate when sensors are placed away from the main body of the drone and are sufficiently aspirated, such as a position near, but not directly under, a spinning propeller.
- Article
(6337 KB) - Full-text XML
- BibTeX
- EndNote


Small drones (hereafter referred to as drones; also known as small Uncrewed Aerial Systems [sUAS or UAS], small Uncrewed Aerial Vehicles [sUAV or UAV], or small Uncrewed Aircraft [sUA or UA]) have been used for atmospheric science research since 1956 (Vorontsov et al., 1958; Humphrey, 1961). Until the 2010s, the drones utilized were exclusively fixed-wing drones (e.g., Schafer et al., 2001; Houston et al., 2011; Elston et al., 2014; Riganti and Houston, 2017). Since then, multirotor drones have been introduced into atmospheric science research and have increased in popularity (e.g., Brady et al., 2016; Lee et al., 2017; Geerts et al., 2017, 2018; Vömel et al., 2018; van den Heever et al., 2021; Meier et al., 2022). The enhanced popularity of multirotor drones is due in part to their ability to take off and land vertically, rapid maneuverability, hovering capability, low cost, and relative ease of piloting.
A wide body of research has investigated the accuracy of measurements made on fixed-wing drones (e.g., Spiess et al., 2007; Houston et al., 2016), on sensor housings for multirotor drones (Barbieri et al., 2019; Greene et al., 2019; Islam et al., 2019; de Boer et al., 2024), and on purpose-built multirotor drones (Bell et al., 2020; Segales et al., 2020; Hervo et al., 2023). However, relatively less work has examined the accuracy of thermodynamic measurements made from commercial, off-the-shelf multirotor drones without additional housing. While many deployments of drones for atmospheric science research have used housings for their thermodynamic probes (e.g., Greene et al., 2019; Bell et al., 2020; Segales et al., 2020; Hervo et al., 2023; de Boer et al., 2024), others have relied on the shielding or aspiration provided by the drone and atmosphere (Bailey et al., 2020; Tikhomirov et al., 2021; van den Heever et al., 2021; Quesada-Moreno et al., 2024). Furthermore, some future applications of drones in atmospheric science may not be conducive to the additional weight and volume added by sensor shielding. These deployment opportunities are increasing, including “ride-along” deployments, where a sensor is added to an existing drone platform used for another purpose, such as package delivery, and in drone swarm operations which can use mini and micro drones.
Little prior work has focused on the accuracy of thermodynamic measurements from drones that are without purpose-built ducts or housings. Several previous studies (Greene et al., 2018; Inoue and Sato, 2022) have examined sensor placements immediately below the spinning propellers, finding that placements close to the propeller tip tend to produce results with the least amount of bias. Kimball et al. (2020a) examined the accuracy of unshielded thermodynamic sensors in various positions on a small (55 cm across) quadrotor drone platform, finding relatively small (< 0.5 K) differences in the accuracy of temperature measurements between positions on the drone when compared to a shielded temperature sensor on a mesonet tower. Their analysis found a sensitivity in temperature measurements from exhaust vents on their platform, resulting in warm biases in sensors positioned within the exhaust path. Kimball et al. (2020a, b), along with other previous work quantifying the characteristics of drone-based thermodynamic measurements, primarily focus on absolute temperature measurements. While this is clearly an important measurement, drones have also been used to measure temporal changes in thermodynamics, characteristic of thunderstorm outflow boundaries and frontal boundaries (van den Heever et al., 2021). Quantifying the properties of relative temporal changes in thermodynamic measurements is therefore necessary to enhance confidence in these drone-based measurements.
These previous studies have provided important steps toward understanding the errors induced by measuring thermodynamic variables onboard multirotor drones. However, separating the solar radiative effects on sensors on the accuracy of thermodynamic measurements from those effects specifically due to multirotors, has not yet been investigated. As such, observations from multiple sensor positions on board multirotor drones have, for the first time, been made during both day and night to address these impacts. In the present study, we compare drone-based temperature and water vapor mixing ratio measurements from eight different sensor positions to measurements made on a tethersonde and a flux tower located sufficiently far from the direct influence of the drone's propellers. These comparisons are conducted in a variety of meteorological and solar radiation conditions. Our goal is to analyze the errors in the measurements of each of these fundamental atmospheric variables induced by the multirotor platform itself. Further, by investigating these errors, we aim to provide field campaigns with a characterization of drone-based temperature and water vapor mixing ratio measurements, both for absolute measurements and the temporal changes in these measurements. Finally, we include recommendations for sensor placement for future field campaigns that employ multirotor drones that are incapable of carrying separate shielding.
To assess the accuracy of thermodynamic measurements made from multirotor drones, a comprehensive experiment suite was designed using a hexacopter drone (a multirotor with six rotors). The suite consisted of two parts. The first was conducted from October 2018 to January 2019 adjacent to an instrumented tethered balloon (hereafter tethersonde) and the second from June to July 2022 next to an instrumented flux tower. In total, 98 outdoor flights were conducted, 9 of which were flown at night, producing approximately 15 h of total sampling time, with 82 flights (12.5 h) being tethersonde tests and 16 flights (3 h) being flux tower tests.
2.1 Drone and Sensor Setup
The DJI Matrice 600 Pro (SZ DJI Technology Co., Ltd., Shenzhen, China) hexacopter was employed in these experiments. The Matrice 600 Pro, pictured in Fig. 1a–d, has been used in atmospheric science field campaigns and published literature (e.g., Islam et al., 2019; van den Heever et al., 2021). The Matrice 600 Pro is powered by six batteries positioned at the center of the drone platform, which is also the location of the avionics and flight computers. Six arms extend radially from the center. Each arm contains an independently spinning motor and an attached 53 cm propeller. The drone dimensions are 1.668 m × 1.518 m × 0.727 m when in takeoff and landing configuration. After takeoff, the drone switches to cruise configuration and its landing legs fold upwards to the sides, reducing the height of the drone (Fig. 1a). The legs remain retracted until the drone is configured for landing.
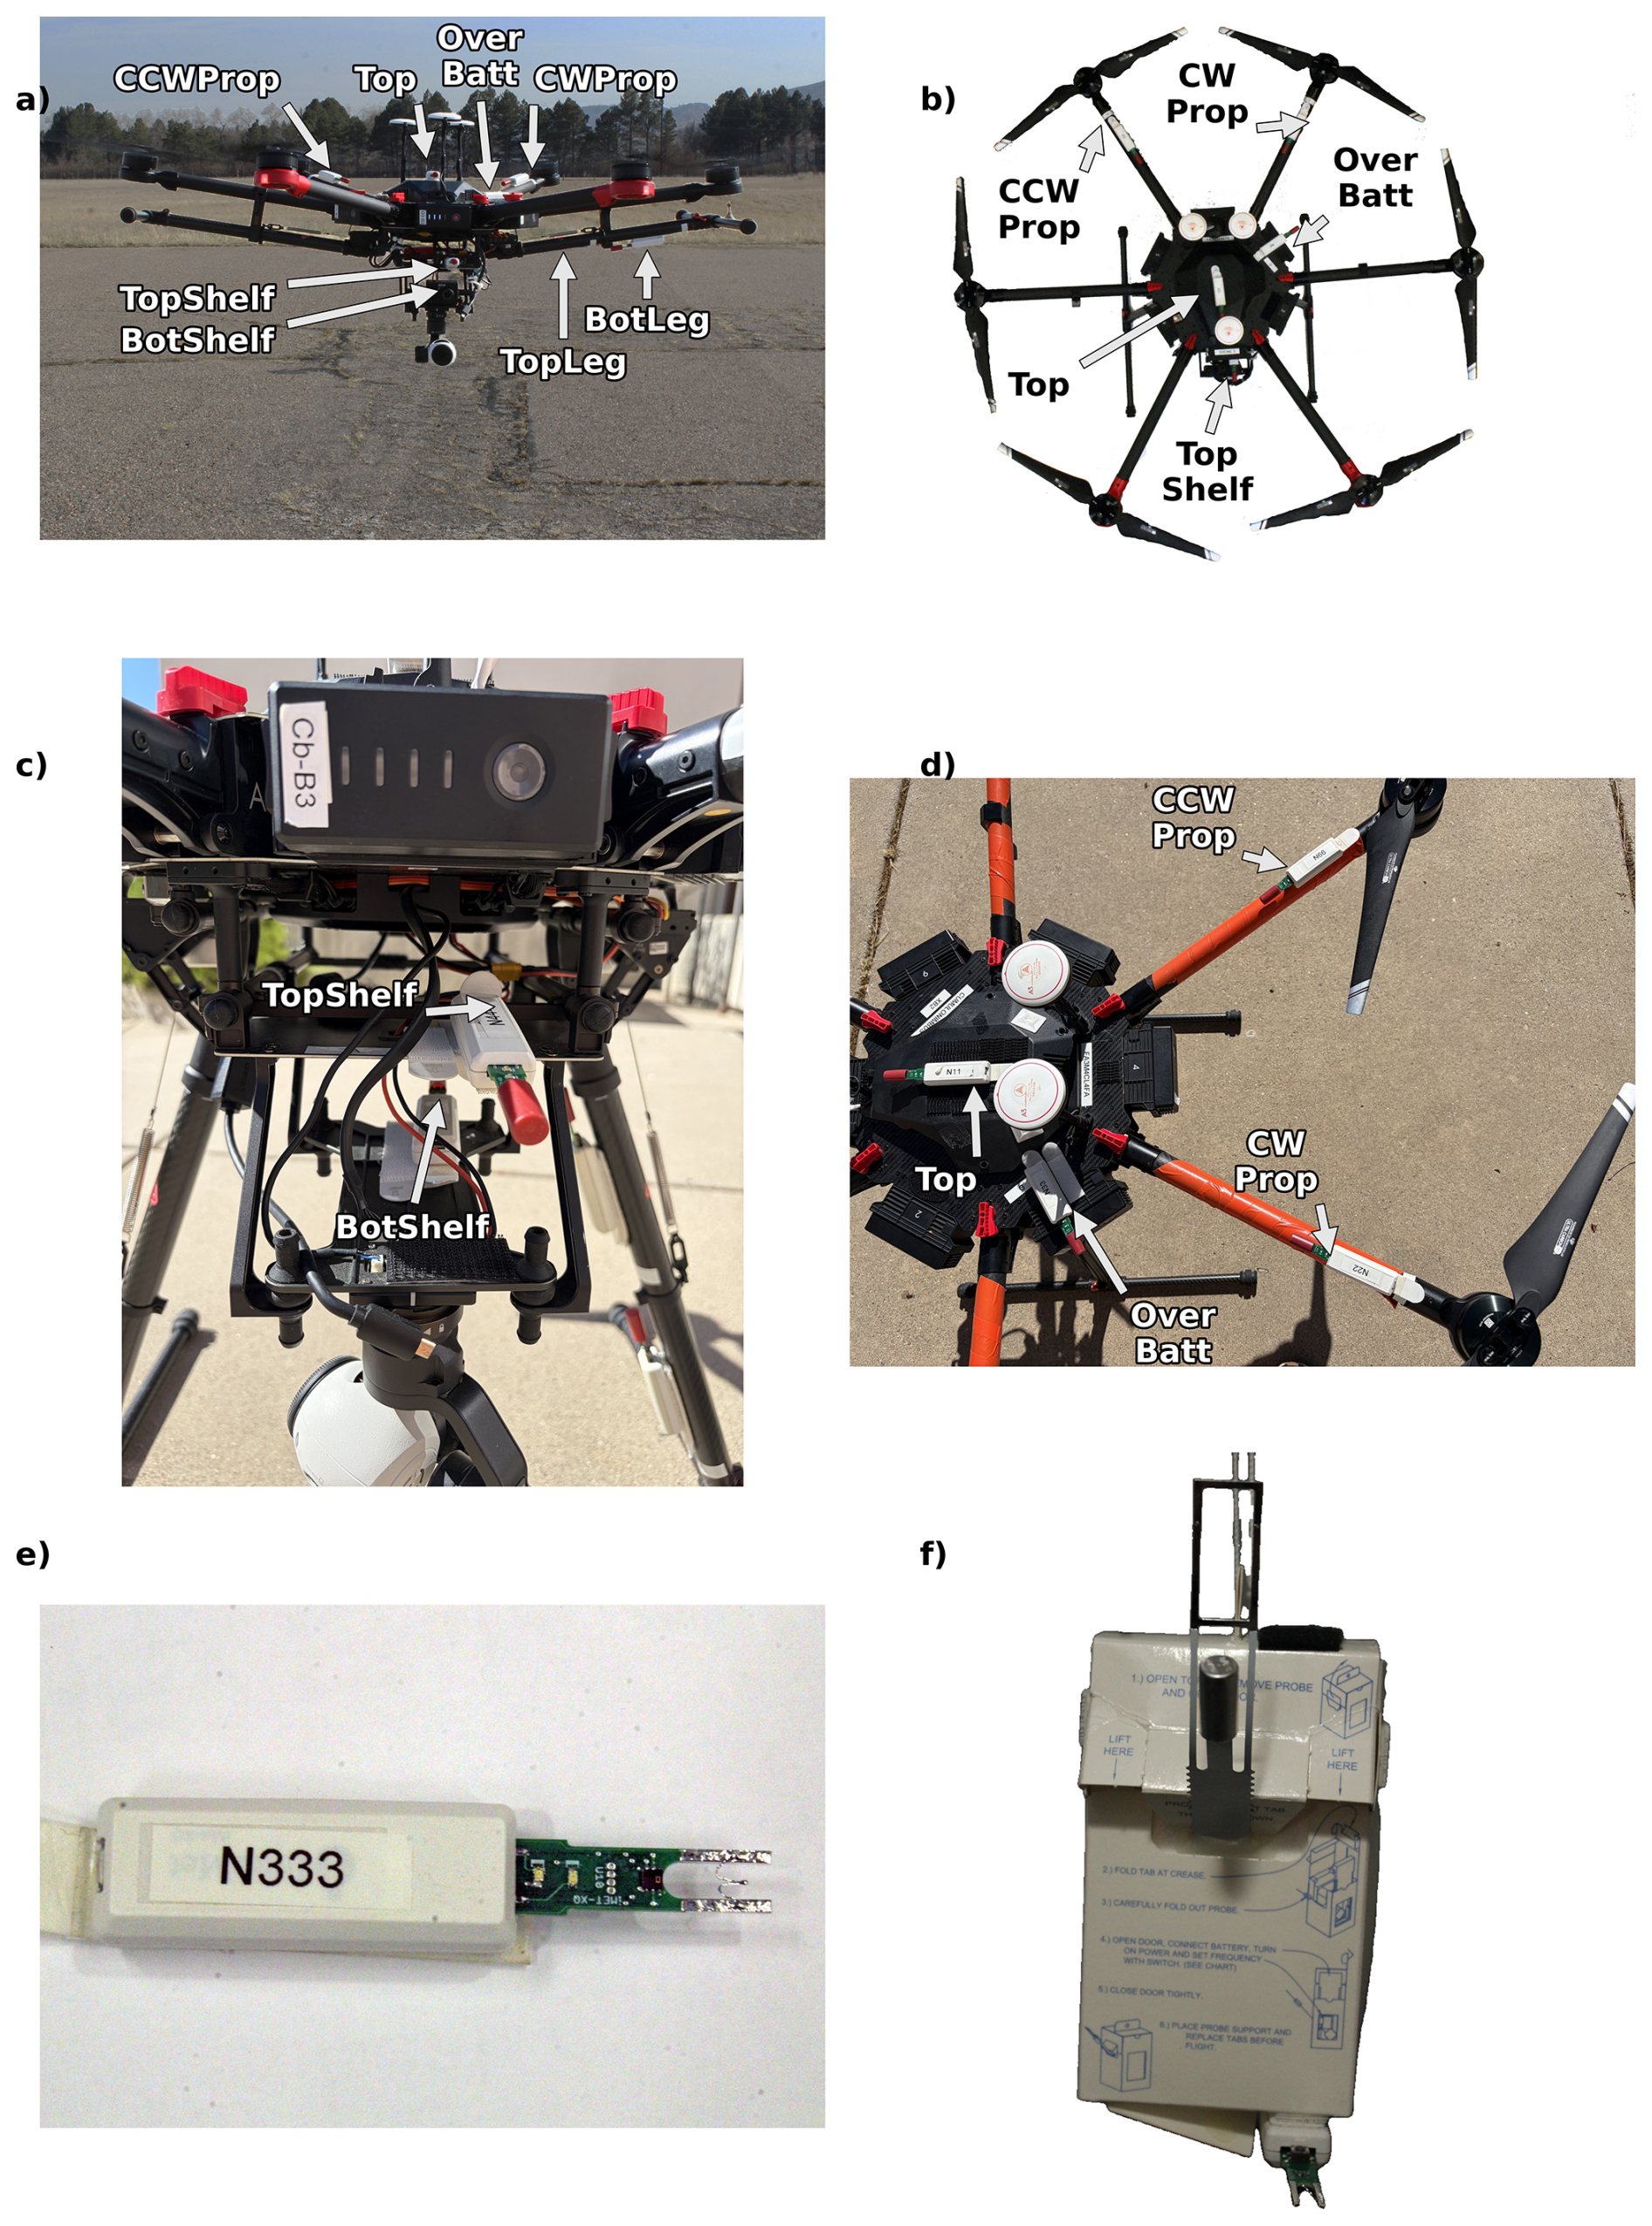
Figure 1(a) Front-view picture of the DJI Matrice 600 Pro drone in flight with the legs folded up. The 8 sensor positions are labeled. (b) Top-down photo of the drone with the legs down; the positions of all visible sensors are labeled. (c) Side profile of the drone, showing a close-up of the two shelf positions. (d) Close top-down profile of the drone, showing the four positions on the drone's top. (e) Photograph of an iMet XQ sensor. (f) Photograph of the iMet-1 radiosonde with an iMet XQ sensor attached to the bottom.
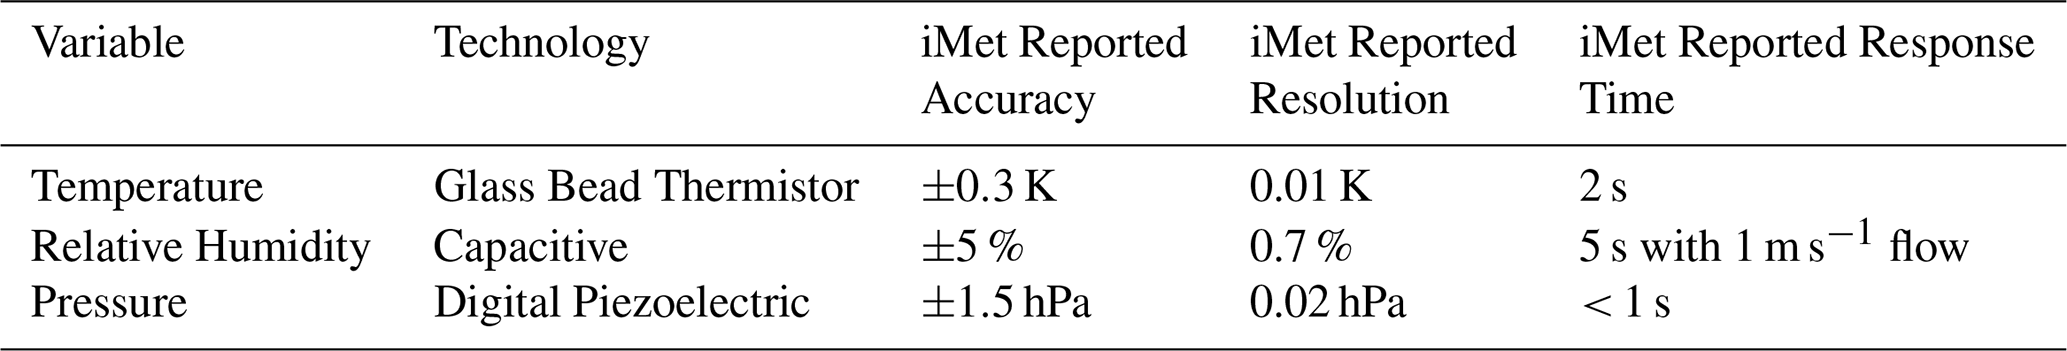
The International Met Systems iMet XQ (Grand Rapids, MI, USA) sensor was used to make the thermodynamic measurements for this study. This particular sensor (Fig. 1e) has been used previously to make thermodynamic measurements from multirotor drones (e.g., Hemingway et al., 2017; Themistocleous, 2017; Dexheimer et al., 2018; Lee et al., 2019; Kimball et al., 2020a, b; van den Heever et al., 2021). The iMet XQ measures pressure, temperature, and relative humidity (RH) at 1 Hz. The specifications and sensor technologies of the temperature, RH, and pressure measurements are detailed in Table 1. The RH measurements were converted to water vapor mixing ratio using the temperature reported by the RH sensor, and the pressure measured by the iMet XQ for this study, as recommended in the iMet XQ manual and as previously done with these sensors in other campaigns (Leung et al., 2025). The conversion from RH to water vapor mixing ratio was performed using MetPy 1.7.0 (May et al., 2022). Although analyzing the data using the original RH measurements does not qualitatively change the results (not shown), the conversion was performed to minimize potential impacts of temperature biases on the RH sensors. This is because RH, without conversion to a temperature-independent measure of water vapor, depends not only on accurate temperature measurements but also on the assumption that the temperatures of the drone and the comparison sensor are the same – an assumption we investigate in this study. Nine of the 12 sensors employed in these tests saved the temperature of the RH sensor in addition to the other three variables, while three of the older sensors did not report the RH sensor's temperature and are therefore excluded from the analysis of RH. None of the sensors used in these experiments have a shield covering the temperature or RH sensor, although the temperature sensor's reflective coating helps mitigate radiation error during daytime flights.
Table 1Specifications of the iMet XQ sensor as reported by International Met Systems (International Met Systems 2018).
To examine the impacts of different sensor placements on thermodynamic measurements, eight different sensor sites onboard the drone were chosen for these experiments. The sensor sites are shown from various angles in Fig. 1a–d. These eight sensor sites represent what we believe are the most common and/or logical locations for sensors onboard multirotor drones, and several are similar to those tested in previous studies (Greene et al., 2018; Kimball et al., 2020a). Two of the positions, CWProp and CCWProp (CW for a ClockWise-rotating propeller and CCW for a CounterClockWise-rotating propeller) are approximately 2 cm underneath the propellers and 5.5 cm inside the tip of the propeller when the propeller and arm are parallel. This distance is located away from the propeller tip by approximately 1/3 of the length of the propeller (8.8 cm on this platform), as recommended by Greene et al. (2018), and will be expected to get the most forced aspiration. The Top and OverBatt positions are situated on top of the drone and receive some aspiration from the drone airflow. Top is located at the highest point atop the avionics bay but below the three upward pointing GPS antennae, and the OverBatt position is located on top of a battery bay with the temperature sensor extended away from the central portion of the drone by approximately 2 cm. A similar placement to the OverBatt position was also used by Lee et al. (2019). One of the landing legs of the aircraft contain two positions, TopLeg and BotLeg, which are approximately 8 cm below one of the drone arms when in cruise configuration (Fig. 1a). As BotLeg is directly below a propeller, it receives a high amount of forced aspiration from the propeller, while TopLeg receives relatively less forced aspiration as it is further from the propeller. The TopShelf and BotShelf positions are on platforms mounted below the main electronics bay by approximately 7 and 15 cm, respectively, and receive relatively little drone-based aspiration. In all flights, the drone was flown such that its “front” (the same direction that the TopShelf sensor points) was facing south. In all daytime flights, this resulted in the front-facing sensors being directed into the sun and other sensors potentially being shaded by the drone. This uncertainty is mitigated by the range in solar radiations of the flights, which are discussed below. These data have been uploaded to Zenodo (Freeman et al., 2025).
2.2 Experiment Methodology: Tethersonde Tests
In the first part of this experiment, we flew the drone adjacent to a tethersonde during both daytime and nighttime hours during several operating periods in October and November 2018 and January 2019. All night flights were conducted after nautical twilight. The tethersonde was anchored in dead scrubland at the now-retired Christman Field Airport (hereafter Christman Field) in Fort Collins, CO (40.59077° N, 105.14389° W, 1572 m above mean sea level (a.m.s.l.)). The meteorological station at Christman Field was used to quantify the spread in local meteorological conditions for each of the flights, and to validate that the measured insolation during nighttime flights was 0.0 W m−2. The Christman Field weather station is a permanent weather station that measures temperature at 2 m above the surface and winds 10 m above the surface.
The anchor point of the tethersonde was at least 50 m from roads, fences, and other objects that could inadvertently influence the observations. The tethersonde was initially raised to a height of at least 50 m above the surface during the day and 30 m at night using a rope, but it was then allowed to change its horizontal and vertical position through advection. The altitude for the tethersonde was chosen to be high enough to be above the surface layer but low enough to reduce the required drone battery power to climb and manoeuvre the drone, thereby allowing longer sampling time on a single battery set.
After takeoff, the drone was flown directly upwards until the altitudes of the tethersonde and the drone were within a few meters of each other, as determined by the onboard GPS of both platforms. Despite this initial check, the tethersonde was on average 9.13 m higher than the drone for the 82 tethersonde flights (9.71 m during the day flights and 4.2 m for the night flights). This mean altitude bias does not substantially affect the thermodynamic errors measured. When comparing the data from only those flights when the drone was located higher in altitude than the tethersonde, the thermodynamic measurement errors are similar, with average temperature error across all sensors increasing by 0.06 K, which is well within the sensor accuracy. While the tethersonde's horizontal position and altitude were allowed to vary in flight with the changing winds, the drone's position was fixed in space for each of the 82 flights using the drone's autopilot function.
The tethersonde instrumentation was mounted approximately 50 cm below the base of the balloon. This instrumentation consisted of an International Met Systems iMet-1 radiosonde with an iMet XQ sensor of the same type as that onboard the drone (Fig. 1f). Although both the iMet-1 radiosonde and iMet XQ record GPS and thermodynamic variables, the GPS from the iMet-1 radiosonde is used as the tethersonde's location value because the iMet XQ's GPS antenna was directed at the surface, causing degraded accuracy. On the other hand, the iMet XQ is used for the thermodynamic measurements to remove any error that may potentially be caused by differences in instrument technology between the iMet XQ and the iMet-1 radiosonde. The tethersonde was launched at the beginning of each flight day and allowed to remain airborne for the entire duration of the flights held on any single day. The tethersonde was, however, occasionally raised or lowered in order to avoid interference with crewed aircraft traffic or to change the attached iMet XQ sensor halfway through the flight day as part of the iMet XQ drone sensor rotations (see below). It should be noted that, similar to the sensors aboard the drone, the iMet XQ aboard the tethersonde was not shielded. While this means that the tethersonde may also have errors in the temperature measurement arising from solar radiation, these should be similar to those on the drone. Further, the tests described in the next section, which include shielded, aspirated sensors and nine night flights with the tethersonde, help to separate out this potential source of uncertainty.
Every flight had at least nine consecutive minutes of sampling time, not including the additional flight time necessary for takeoff, transit, and landing. After each flight, the sensors attached to each of the positions on the drone were sequentially rotated to a different position. The sensor rotation was performed to remove any potential bias caused by a specific sensor-position combination. While the sensors aboard the drone were rotated after each flight, the sensor aboard the tethersonde was only changed either between flight days or halfway through the flights on a given day. The sensor onboard the tethersonde each day was drawn from the set of sensors used in the drone rotations and was rotated between the tethersonde and the drone between flight days. In total, there were N = 38 593 individual samples during daytime flights and N = 4872 individual samples during nighttime flights.
2.3 Experiment Methodology: Flux Tower Tests
The second part of the experiment was to conduct additional flights in June and July 2022 at the National Ecological Observatory Network (NEON) North Sterling, CO site (Metzger et al., 2019; NEON, 2024a–e; 40.461894° N, −103.02929° W, 1365 m a.m.s.l. The tests at this site were conducted at the same altitude (10 m above ground level) and 5 m downwind of the flux tower. At this location, the temperature measurements were compared with both an unshielded, unaspirated iMet XQ sensor mounted to the flux tower (not shown), and the triple aspirated, 1 min-averaged air temperature (NEON, 2024a) and humidity measurements (NEON, 2024b) taken at the top of the flux tower. The iMet XQ sensor was mounted to the railing at the top of the tower, near the existing NEON temperature measurements, with the sensor oriented parallel to the ground and pointed away from the tower such that airflow to the sensor was as unimpeded as possible. Because of the delay between these flights and the Tethersonde tests caused by impacts from the COVID-19 pandemic, several of the iMet XQ sensors employed in the tethersonde tests were replaced by updated iMet XQ2 sensors, which use the same temperature sensor as the iMet XQ. However, because the RH sensor changed between the two versions of the instrument, only the RH results from the tethersonde study are examined here. Further, because the XQ2 sensors were physically larger than the XQ sensors, only five of the eight positions tested in the tethersonde experiments are used for the flux tower tests (BotLeg, CWProp, OverBatt, TopLeg, TopShelf). The NEON flux tower measurements are quality controlled, maintained, and, for temperature, made up of three independent platinum resistance temperature sensors forcefully aspirated by a fan (NEON, 2024a). However, these measurements are only available at a lower, 1 min resolution compared with the 1 Hz resolution on the drone. This leads to a total sample size N = 228, versus the substantially larger sample size from the tethersonde measurements (N = 43 465). Therefore, we use these measurements primarily to validate the tethersonde comparison experiments, ensuring that the tethersonde flights yield robust results when compared to flights conducted with gold-standard, forcefully aspirated temperature measurements. Like the tethersonde flights, the flux tower flights lasted at least nine minutes. However, due to logistical reasons, the sensors on the flux tower validation flights were not rotated between each flight as for the tethersonde flights, but rather on a daily basis. Despite the more limited changing cadence, no sensor on the drone was kept the same position between days.
2.4 Sampling Conditions
The 82 tethersonde and 16 flux tower flights were conducted in a variety of non-precipitating meteorological conditions sampled by the co-located Christman Field weather station (tethersonde station) and the NEON flux tower instrumentation (flux tower). The range of observed pressure (Fig. 2c) is limited to between 830 and 855 hPa at the Christman Field site and 860 and 870 hPa at the NEON site due to the differences in the site's elevations (1573 m a.m.s.l. at Christman Field; 1365 m a.m.s.l. at the NEON site). Like the pressure, the water vapor mixing ratio conditions observed (Fig. 2b) are also bounded by the dry climate in Colorado. The experiments were performed primarily in low wind conditions, particularly with the tethersonde flights at Christman Field, as is evident from the distribution of sustained wind (Fig. 2e) and gusts (Fig. 2f). Low wind conditions were necessary to limit the motion of the tethersonde, and thus limit its altitude variability with respect to the drone. The wide range of temperature, water vapor mixing ratio, and solar radiation (Fig. 2d) conditions tested in this study significantly extend all of the previous studies described in Sect. 1.
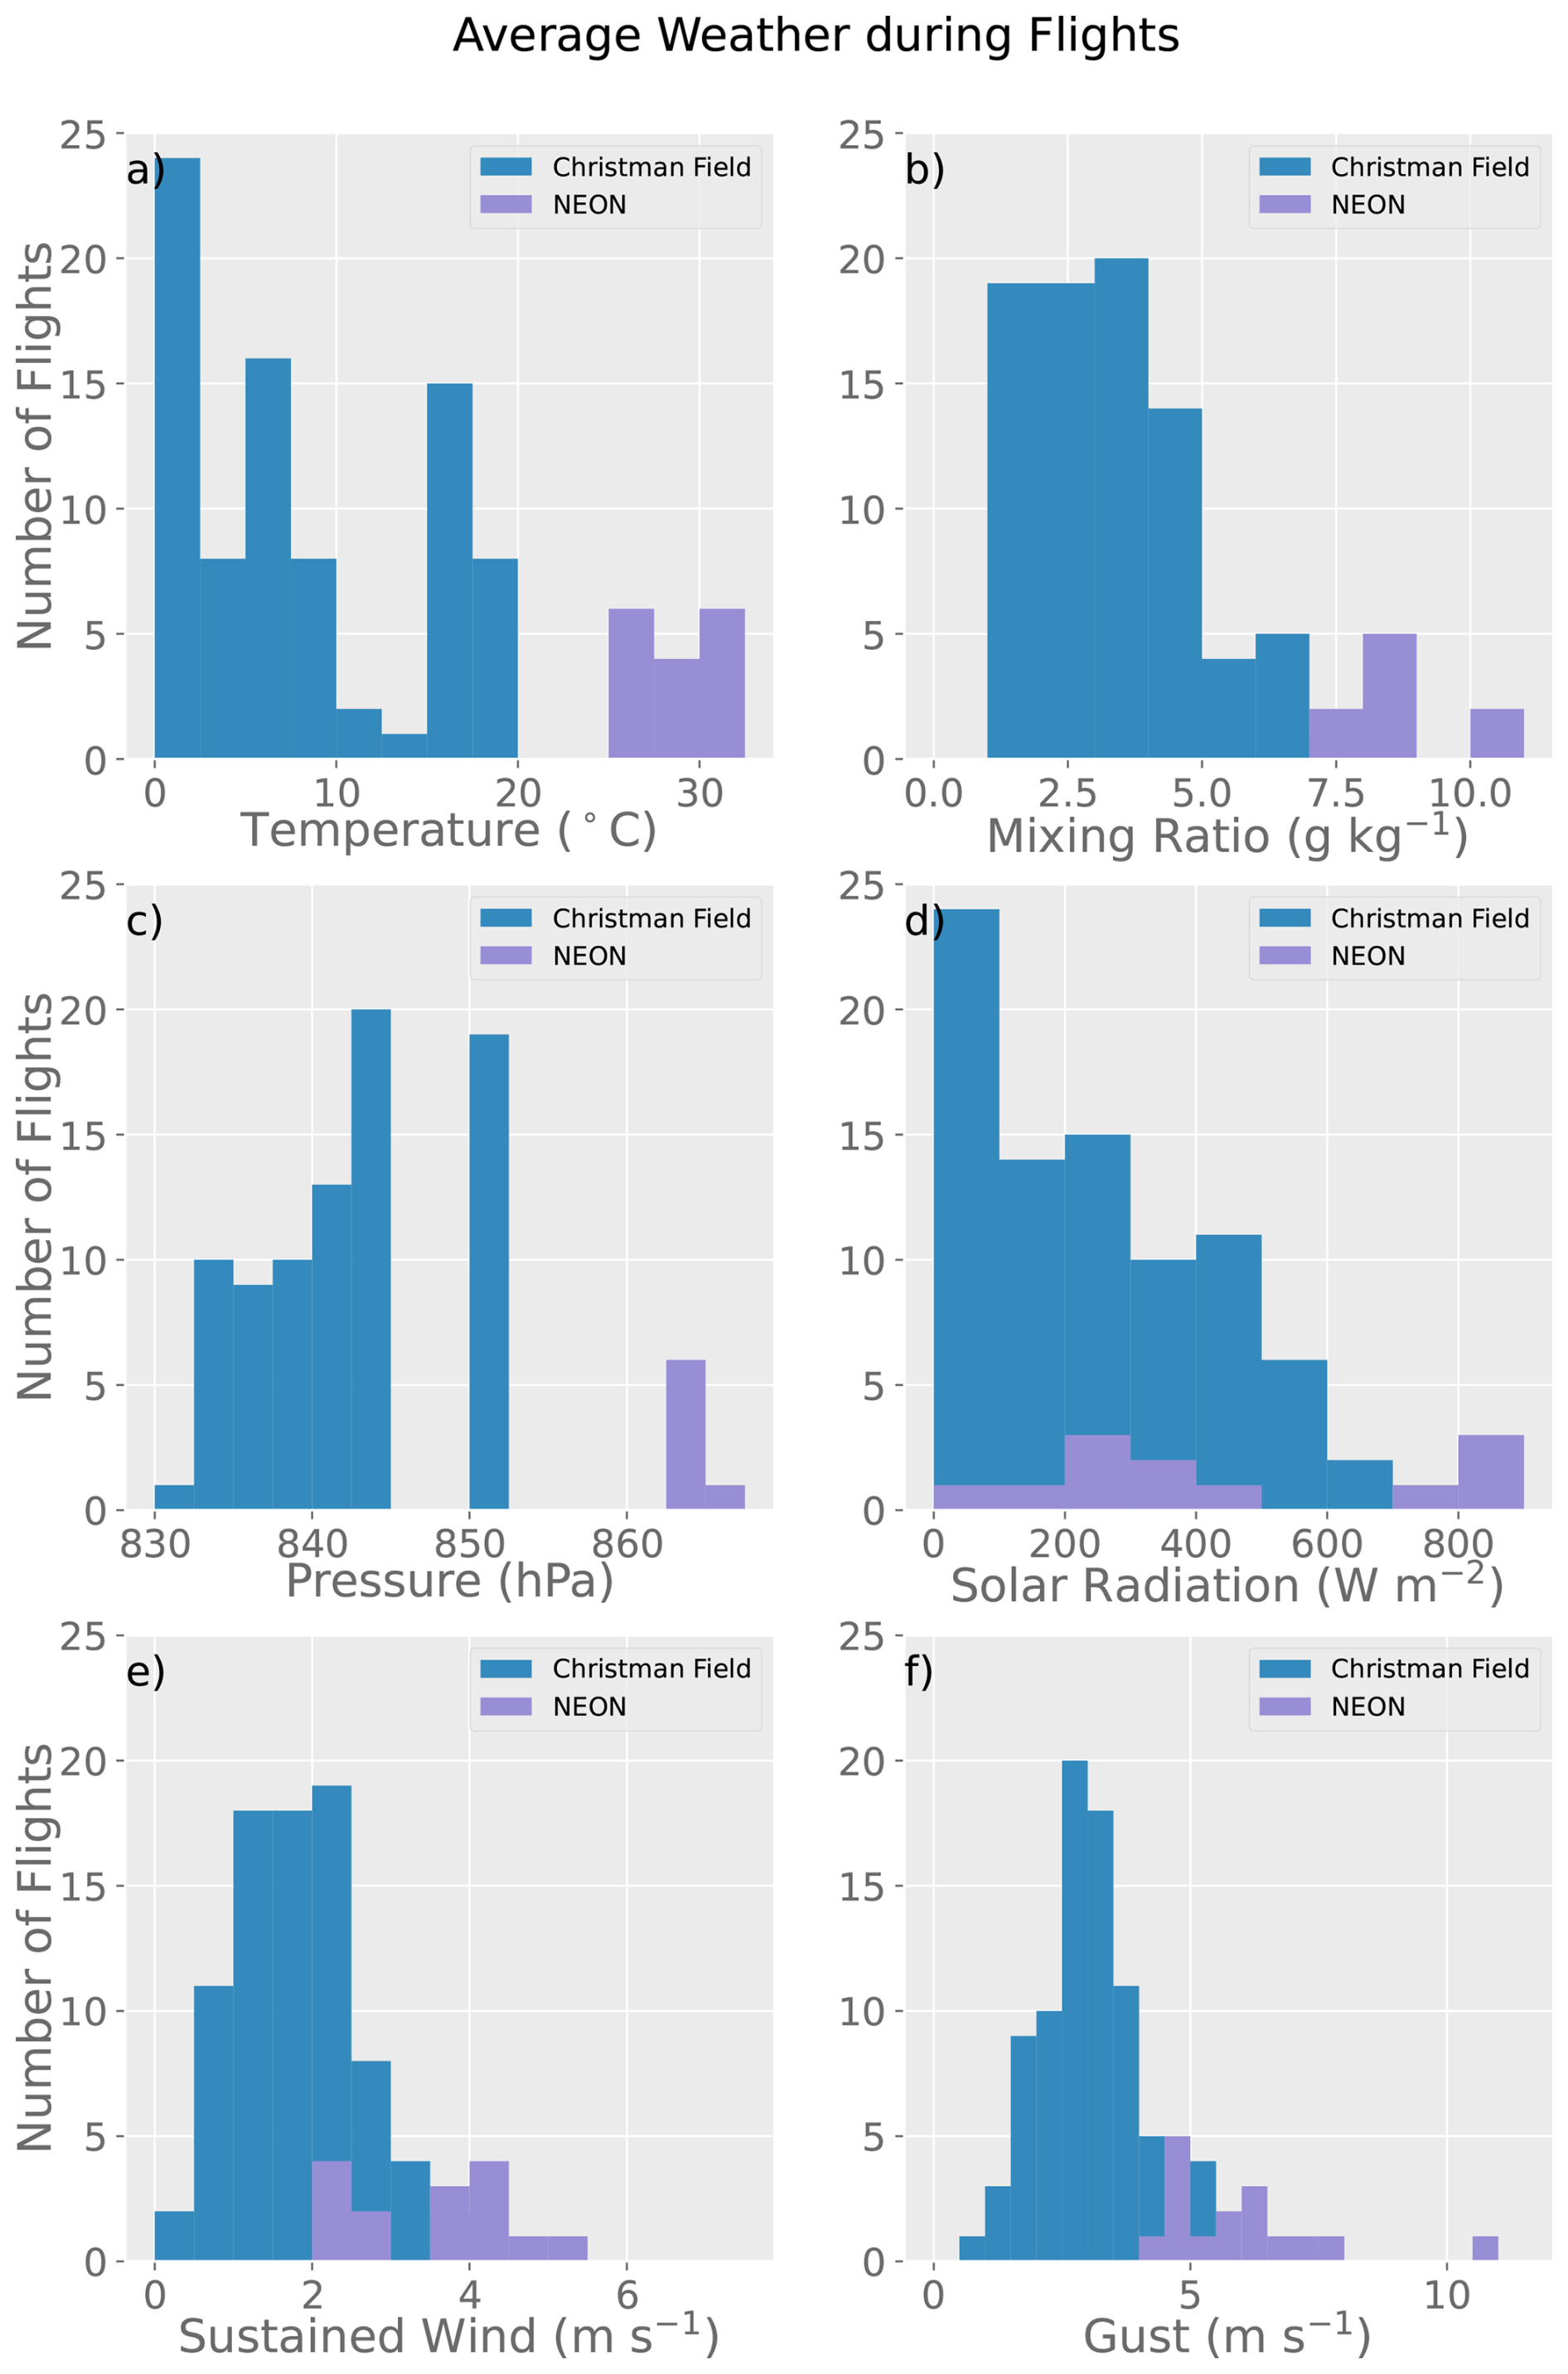
Figure 2Histograms of conditions observed by the weather stations during all flights from Christman Field (blue) and the NEON Flux Tower (purple; NEON, 2024a, b, c, d, e). The conditions are averaged over the duration of each flight. Shown are surface (a) temperature, (b) mixing ratio, (c) pressure, (d) solar radiation, (e) sustained wind speed, and (f) wind gust, which is determined by taking the average station-reported wind gusts at the 1 min sampling interval of both surface weather stations.
2.5 Data Quality Control
Several steps were taken to quality control both the tethersonde and drone thermodynamic data. Only those measurements for which the drone's measured altitude is within 30 m (50 m) in the vertical (horizontal) of the tethersonde's measured altitude were used in order to enhance the likelihood that the tethersonde and drone measured air with similar thermodynamic properties. The 30 m vertical threshold was chosen because the nominal accuracy of the GPS aboard the iMet-1 radiosonde is ±15 m. The 50 m horizontal threshold was selected as a compromise between the two instruments being as far apart as possible while measuring as close to the same air as possible, as the length scale of boundary layer eddies is proportional to the height above the surface (Arya, 2001). Because these two are proportional, rather than equal, this may result in these two instruments potentially measuring different eddies, and therefore actual differences in temperature. It is assumed, however, that any difference due to potentially measuring different eddies is small and mitigated by the large number of samples. As the flux tower is a non-moving platform and lower in altitude than the tethersonde, the flux tower results use a quality control threshold of 3 m in the vertical and 10 m in the horizontal. The results of this study are not sensitive to the specific distance thresholds (not shown). In addition to removing data points where the drone and tethersonde were too far apart, data points were also removed when any sensor recorded unphysical (e.g., negative relative humidity, negative or zero pressure) data. No averaging was performed on the data except as described in Sect. 3.4.
For both temperature and mixing ratio, we examined the differences at each time between the measurements taken aboard the drone and the measurements taken aboard the tethersonde or flux tower. We define this difference as the error. The error is comprised of three potential sources: instrument error, drone-induced error, and radiative error. The instrument error is defined as any error caused by fluctuations in the instrument itself other than the calibration biases that have already been corrected, and are typically centered around 0 after mean biases are corrected. The drone-induced error is any error directly associated with the drone that would not exist if the instrument was mounted to the tethersonde or flux tower. Possible sources of drone-induced error include heat dissipated by the drone motors, avionics, and batteries, and airflow perturbations (i.e., rotorwash) induced by the rapidly spinning rotors which mix the air. The radiative error component is defined as any error resulting from the effects of solar radiation, including heating of the sensor itself by the sun, heating of the surface of the drone below the sensor, or any other error that does not exist at night.
3.1 Daytime Temperature
We separate our discussions of temperature into daytime and nighttime, and we begin by examining the daytime results. The temperature error, defined as the temperature measured by the tethersonde or flux tower subtracted from the temperature measured by the drone at each time, was calculated separately for each sensor position (i.e., Tdrone, sensor location − Ttethersonde or Tdrone, sensor location − Tflux tower; where T is the temperature in K). The temperature error for each sensor location on the drone is shown in Fig. 3 for the 73 daytime tethersonde flights (a total of approximately 40 000 individual temperature observations for each sensor position). The mean errors between the drone and tethersonde are less than ±0.42 K for all eight siting locations tested, although the spread between the 2.5th and 97.5th percentiles reaches 2.79 K, with the largest spread being −0.91 K ≤ T ≤ +1.88 K for TopShelf (Fig. 3). The BotLeg position, which is approximately 8 cm below the propeller and is shielded from the direct downward air forced from the propeller by the leg it is mounted on, has the smallest magnitude mean error (−0.07 K). This is in contrast to TopLeg, which has the largest magnitude mean error (+0.42 K) despite being located only ∼ 10 cm horizontally from the BotLeg position.
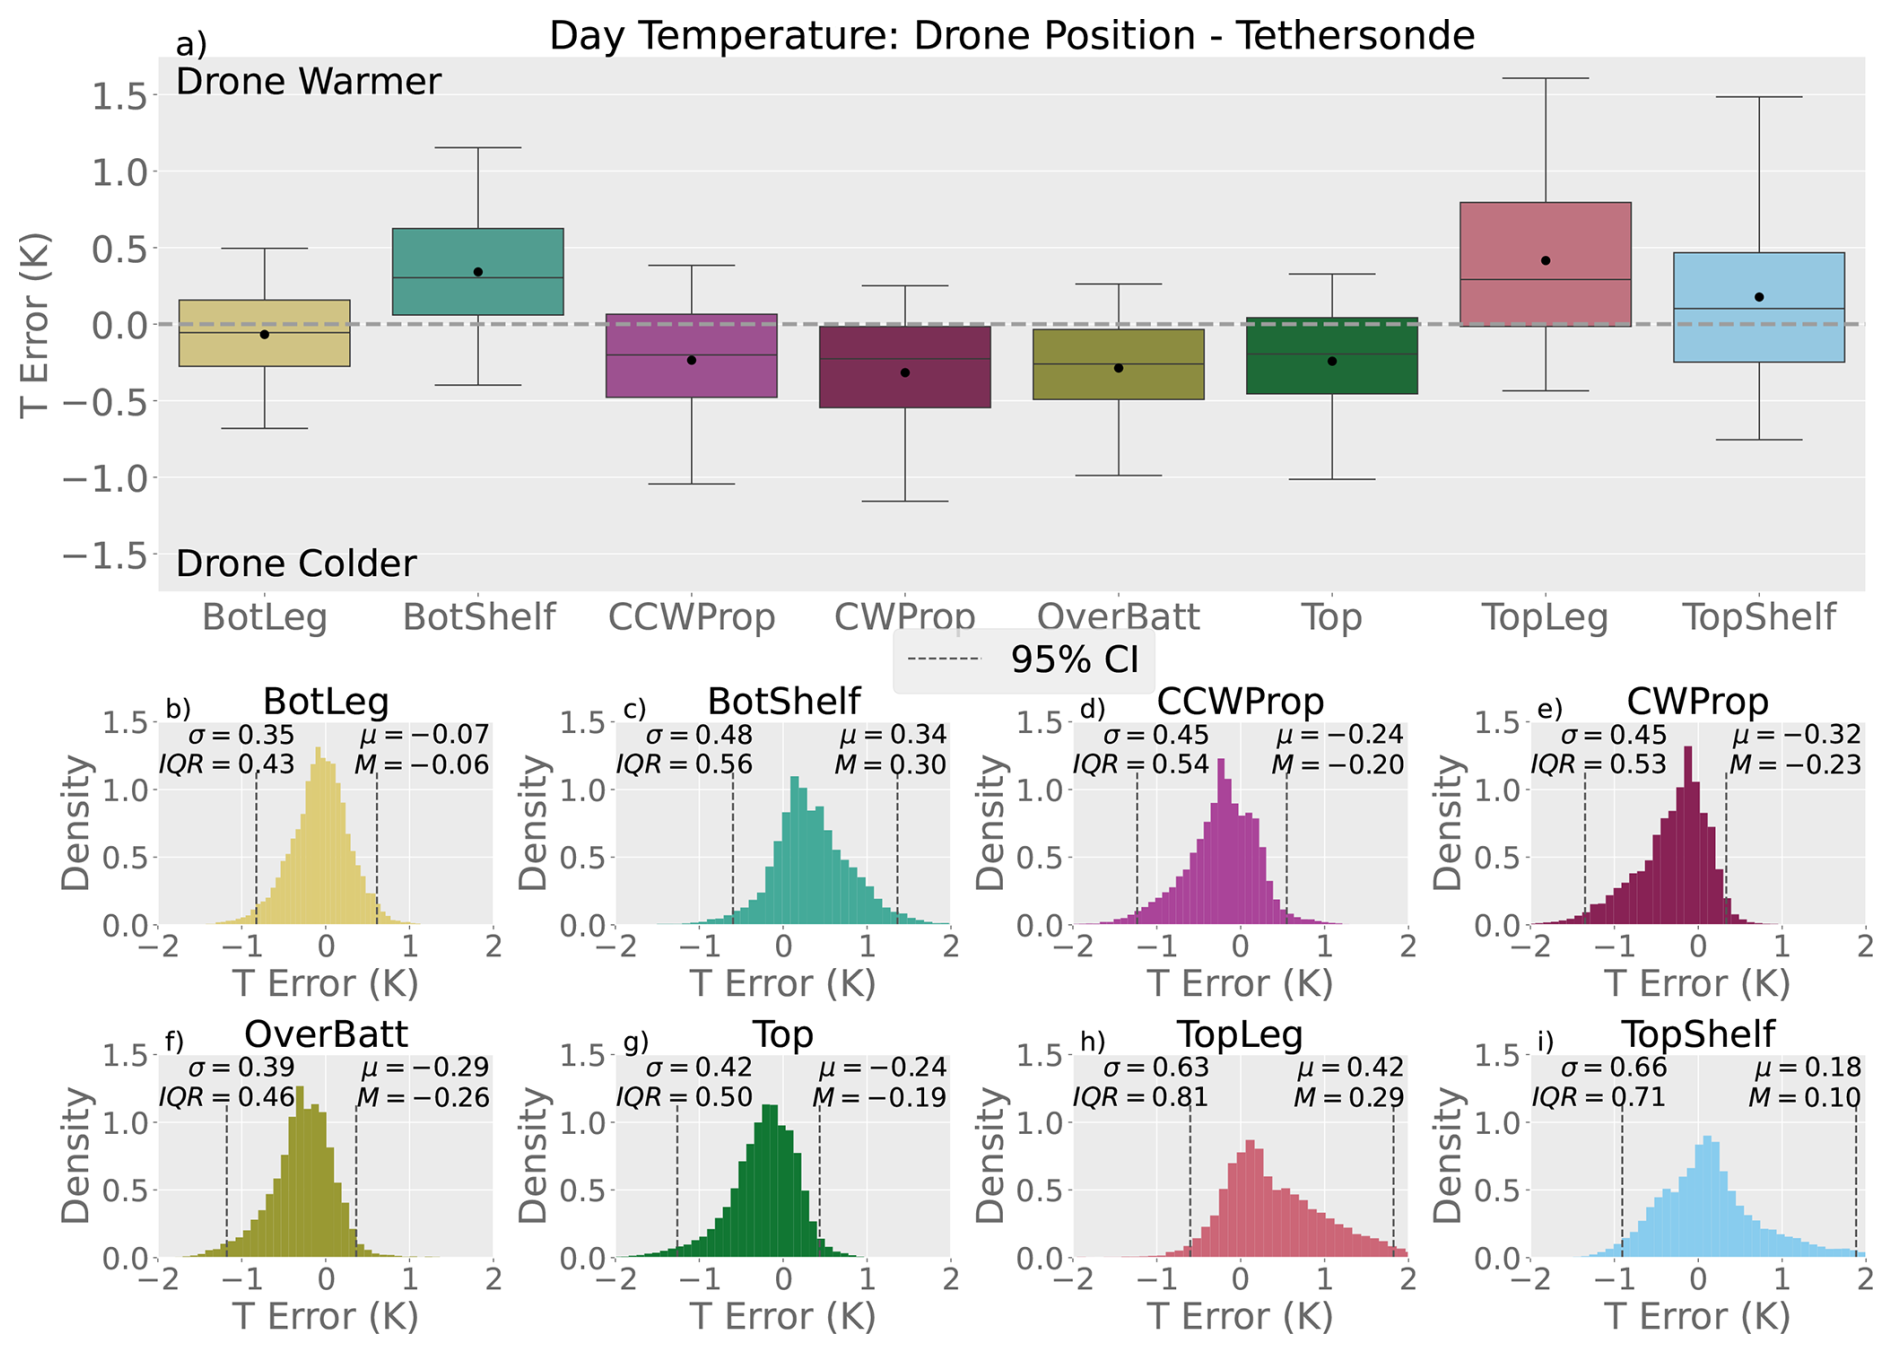
Figure 3(a) Box plots of the drone sensor temperature minus the tethersonde sensor temperature, i.e. the “errors” (positive values indicate that the drone is warmer than the tethersonde), for all daytime flights. The box outlines denote the 25th, 50th, and 75th percentiles, whiskers extend to the 5th and 95th percentiles, and the dots indicate the distribution means. (b–i) Density histograms of the daytime flight temperature errors for each individual drone sensor as labeled on each panel. The 2.5th and 97.5th percentiles are marked with dashed vertical black lines to indicate the 95 % confidence interval. The error standard deviation (σ), mean (μ), median (M), and interquartile range (IQR) of the error are labelled at the top of each panel.
One can categorize the eight sensors shown in Fig. 3a into two main groups: those sensors that have a cold mean bias and lower error standard deviations (BotLeg, CCWProp, CWProp, OverBatt, Top), and those positions that have a warm mean bias and higher error standard deviations (BotShelf, TopLeg, TopShelf). These differences can also be seen in Fig. 3b–i, which show histograms of the errors for each of the eight sensor positions. The three sensor positions with the warm mean bias and higher errors (Fig. 3c, h, and i) can be characterized as non-normal distributions that are skewed towards warmer temperatures relative to the tethersonde data. Most of the remaining positions (Fig. 3d–g) are similarly non-normal, but have smaller error standard deviations and negative tails, indicating a large cold bias relative to the tethersonde.
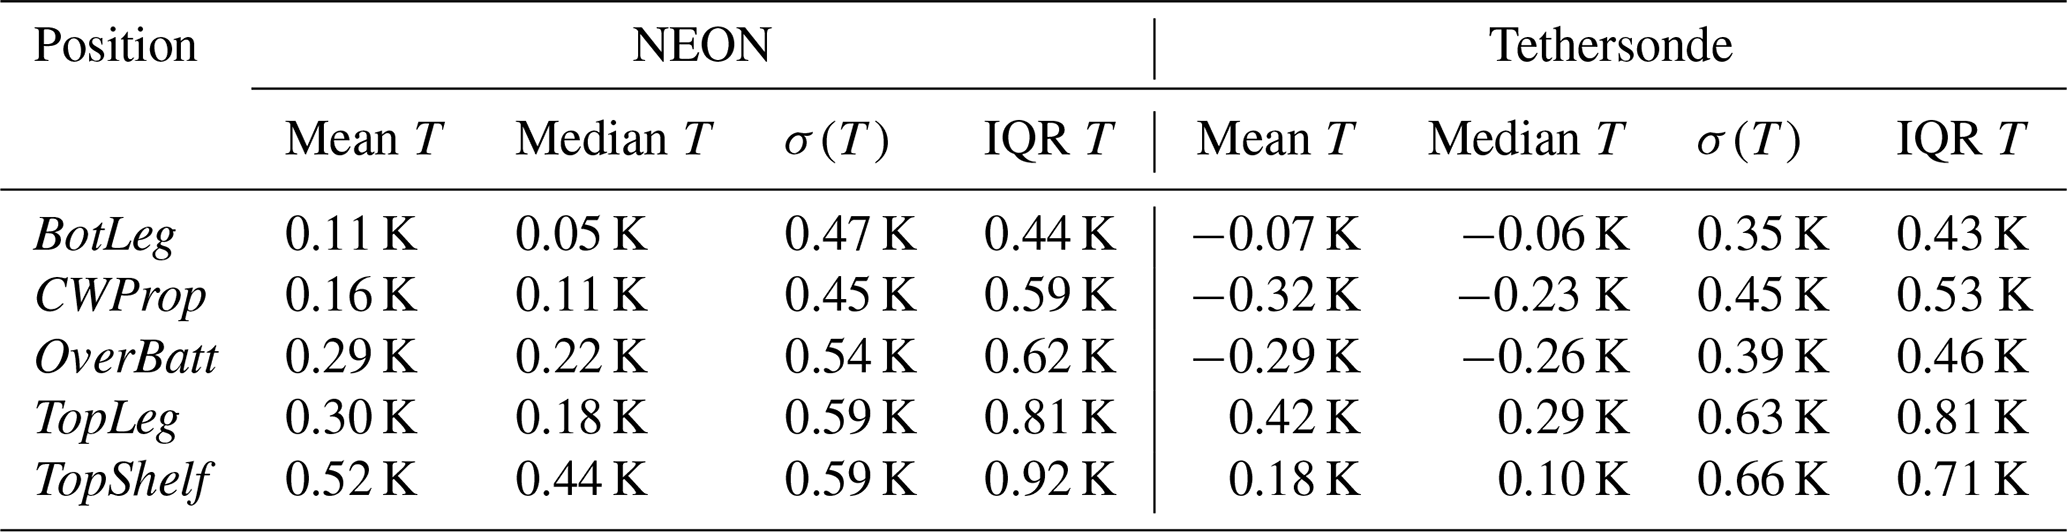
To validate the tethersonde measurements, we examine the change in temperature errors in several of the positions between the tethersonde experiments and the flux tower experiments (Table 2), since the flux tower instrumentation is aspirated, quality-controlled, and frequently calibrated (NEON, 2024a). In each position except for TopLeg, the mean and median biases of the drone sensor compared to the control sensor is warmer in the flux tower experiments than the tethersonde experiments. However, the change in bias is within the accuracy range (±0.3 K for one sensor; a maximum of ±0.6 K for a sensor pair) specified by the iMet XQ and XQ2 documentation (Table 1). Further, the standard deviations and interquartile ranges between each pair of experiments are quite similar, with each standard deviation being within 0.15 K of its pair. This indicates that the error between the drone measurements and the shielded, aspirated flux tower are largely comparable to the error between the drone measurements and the unshielded, unaspirated (other than natural aspiration from wind) tethersonde. Given the similarities between the experiments, we will focus on the larger dataset of tethersonde observations for the remainder of the manuscript.
Table 2Comparisons between the Tethersonde daytime tests and NEON Flux Tower Tests for temperature. T represents the difference between drone temperature measured per position from the control sensor. σ(T) represents the standard deviation of this value, and IQR T represents the interquartile range of this value.
We now assess the three components of error (instrument, drone, and radiation) to understand the causes of the mean temperature errors. The substantial sampling time during daytime (11 h; ∼ 200 000 data points total), and the fact that random instrument errors are typically symmetric around zero after being corrected for any mean bias, suggests that the random instrument errors are largely mitigated and thus play a trivial role in the mean thermodynamic errors. Therefore, the mean observation errors are primarily caused by drone-induced errors, radiative errors, or both.
To better characterize the radiative error present during the daytime flights, the flights are stratified by the average solar radiation that is observed at the surface weather station (Fig. 4). Each of the solar radiation bins shown in Fig. 4 contains observations obtained from between eight and ten flights. With increasing insolation, the median bias generally becomes colder for those sensors receiving a larger amount of aspiration (BotLeg, CCWProp, CWProp, OverBatt, Top). For those sensors receiving less aspiration (BotShelf, TopLeg, TopShelf), the mean bias typically becomes warmer with more insolation (BotShelf, TopLeg) and/or the error bars become substantially larger (TopLeg, TopShelf). The reason for these opposite trends appears to be twofold: (1) the reflective coating onboard the iMet sensors is likely inadequate to reflect all of the incoming solar energy; and (2) since the tethersonde does not receive forced aspiration unlike the drone which is aspirated by the propellers, the temperature measured on the tethersonde might be biased warm relative to the true environmental temperature, thus leading to a perceived cold bias on the drone for the five positions receiving more aspiration. This hypothesis is supported by the flux tower experiments, in which all unshielded positions on the drone that were tested were warmer than the shielded, aspirated flux tower sensor. Figure 4 further shows that the spread of the error generally increases with increasing solar radiation for all sensor positions. This suggests that simply placing sensors underneath propellers may not be sufficient to counteract the solar radiative error. Rather, Fig. 4 suggests that efforts to properly shield sensors could be worthwhile. However, such shields can block ambient airflow, including airflow produced by the drone, thereby reducing sensor aspiration and inducing a lag to the sensor measurements. Such effects should therefore be taken into consideration when designing sensor shields. The impacts of radiative error on the mean thermodynamic errors and how we can separate this source of error from drone-induced error are further examined in Sect. 3.2.
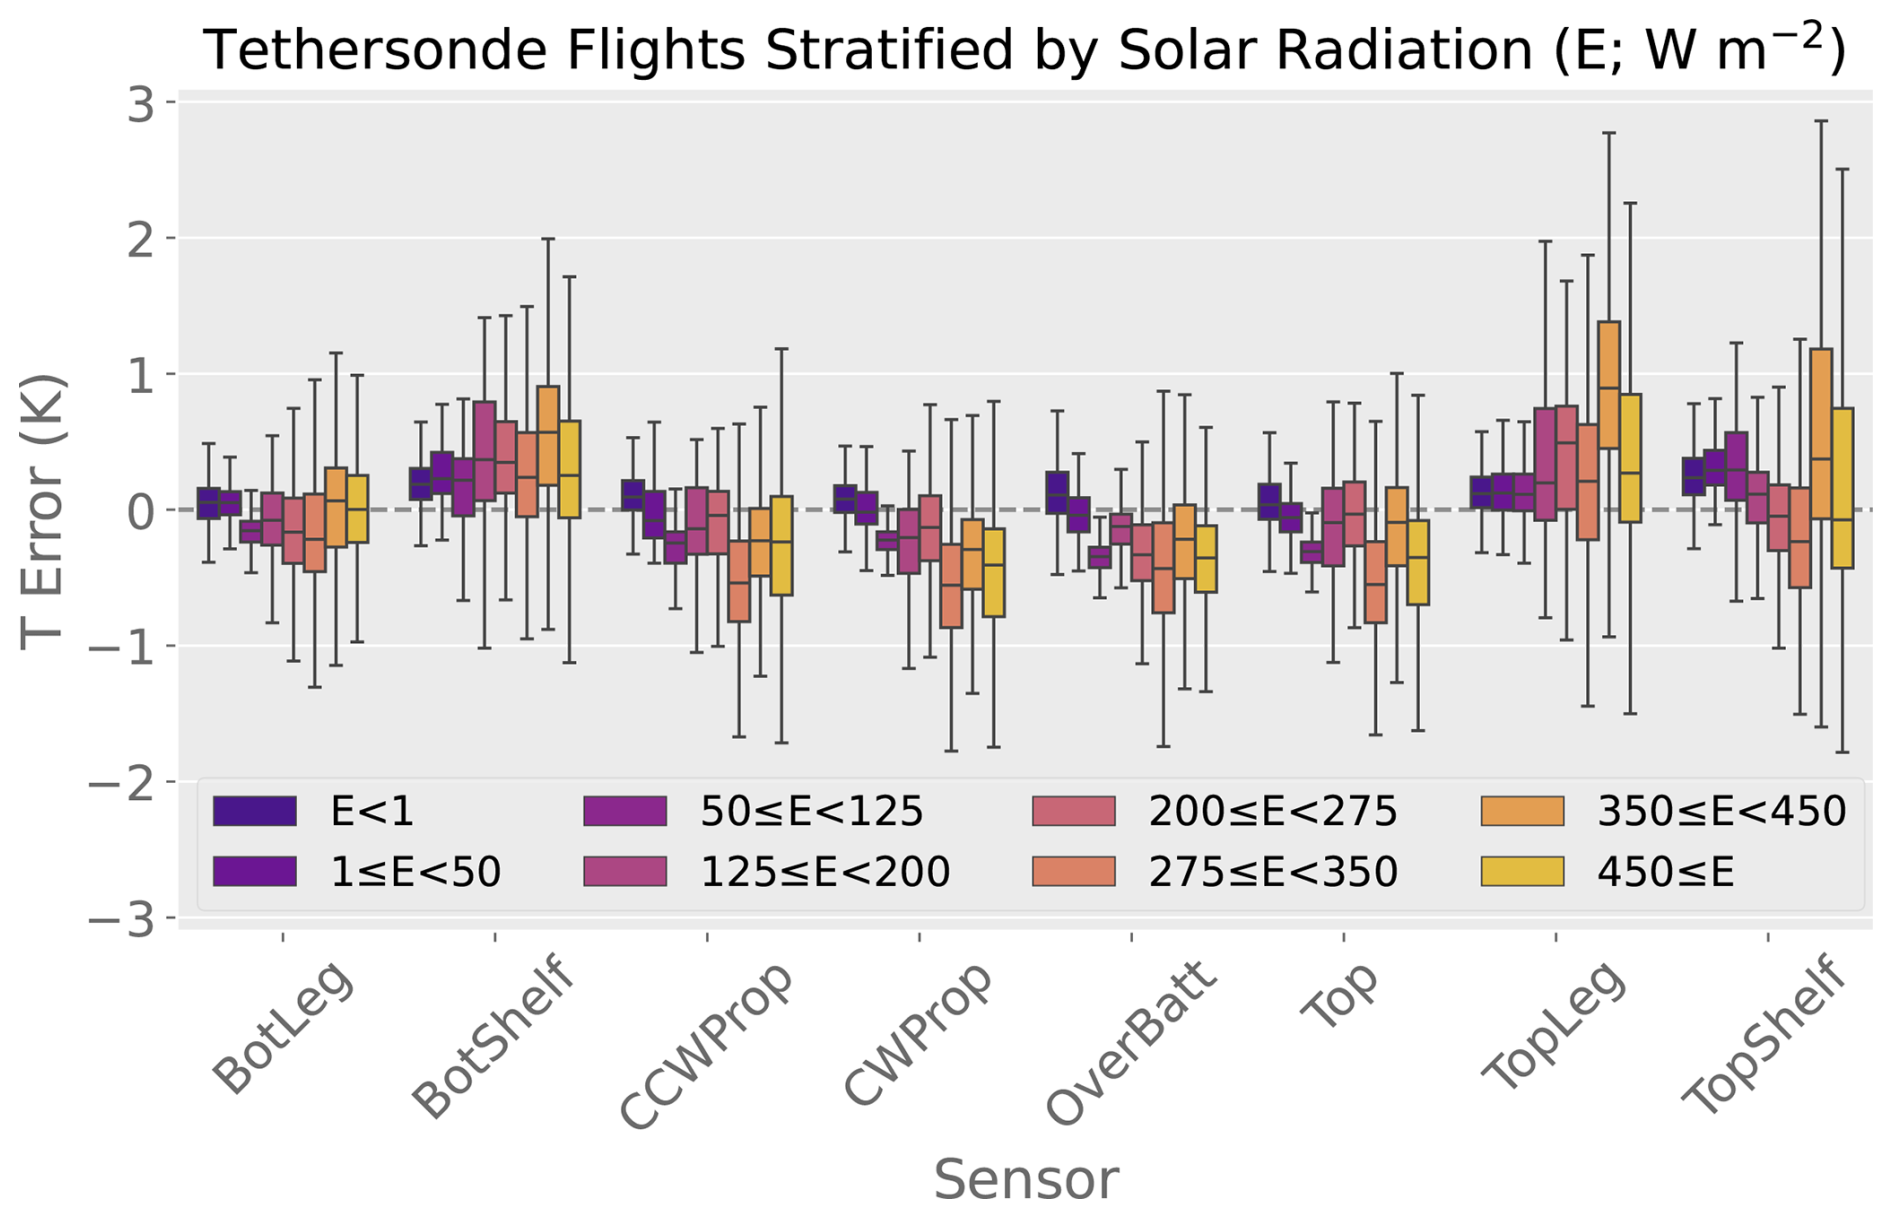
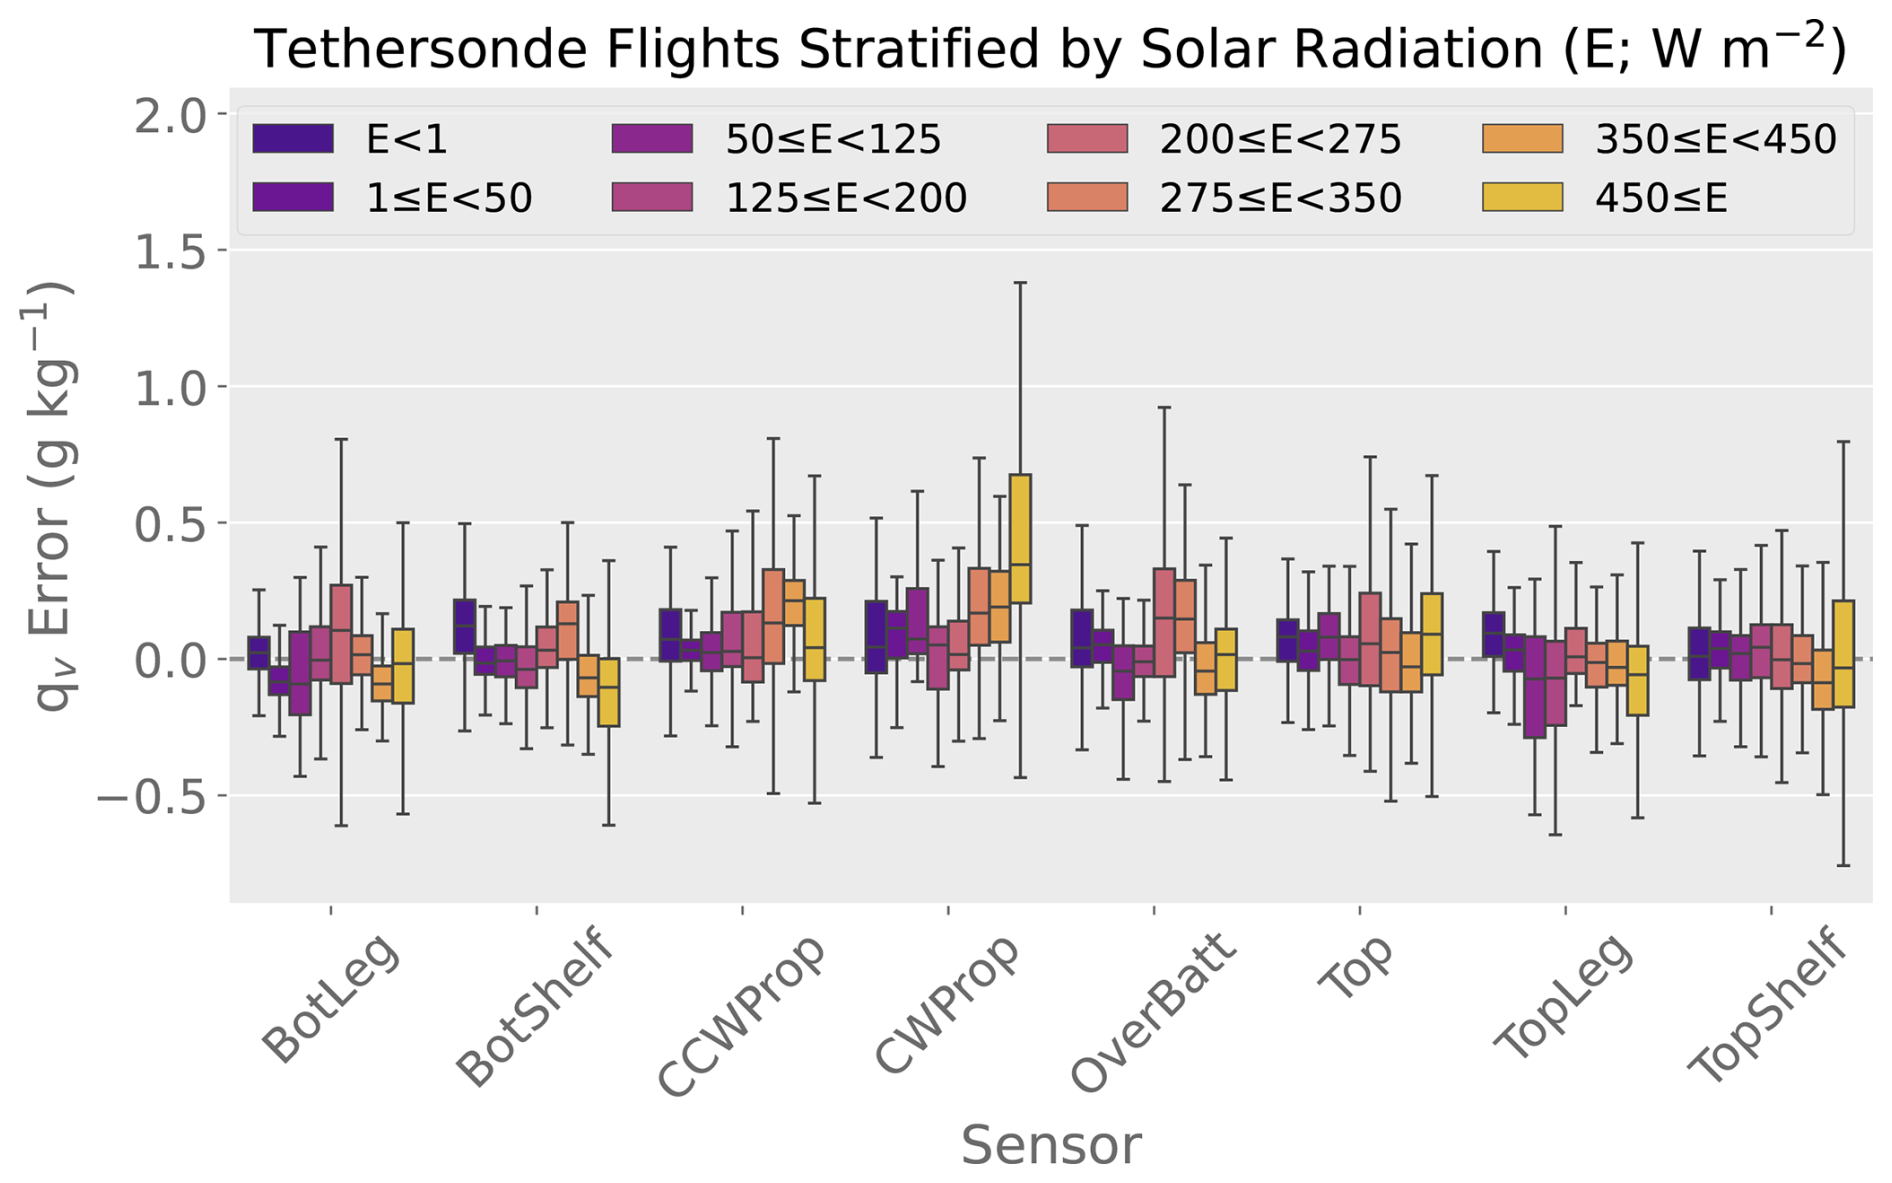
Figure 4As in Fig. 3a, except that for each sensor position, the tethersonde data is stratified by solar radiation, E (W m−2), observed by the surface weather station.
The temperature results demonstrate for the worst-case scenario for any single temperature measurement made during the daytime that the accuracy at a 95 % confidence interval (hereafter CI), from the smallest 2.5 % to the largest 97.5 % has a range of −1.34 K ≤ T ≤ +1.88 K when not removing the mean biases (Fig. 3b–i). The sensor position with the narrowest CI is BotLeg, which had a 95 % CI of −0.75 K ≤ T ≤ +0.65 K. While we examined absolute temperature measurements in this section, Sect. 3d contains an analysis of the errors when measurements of temporal changes in temperature are sought instead of measurements of absolute temperature values.
3.2 Nighttime Temperature
Nighttime flights were conducted with the tethersonde to understand the effects of radiative error and to separate the radiative error from the drone-induced error. Figure 5 shows the analyses of temperature using only the 9 nighttime flights (approximately 1.5 total flight hours). The errors in measured temperature are notably smaller at night than during the day. The largest mean bias in temperature decreases from 0.42 K during the day to 0.24 K at night, and the largest 95 % CI range decreases from 2.75 to 1.5 K. This indicates that radiative errors, either due to the heating of the sensor itself or as a result of heating the drone body, are substantial contributors to the total errors observed in the daytime flights.
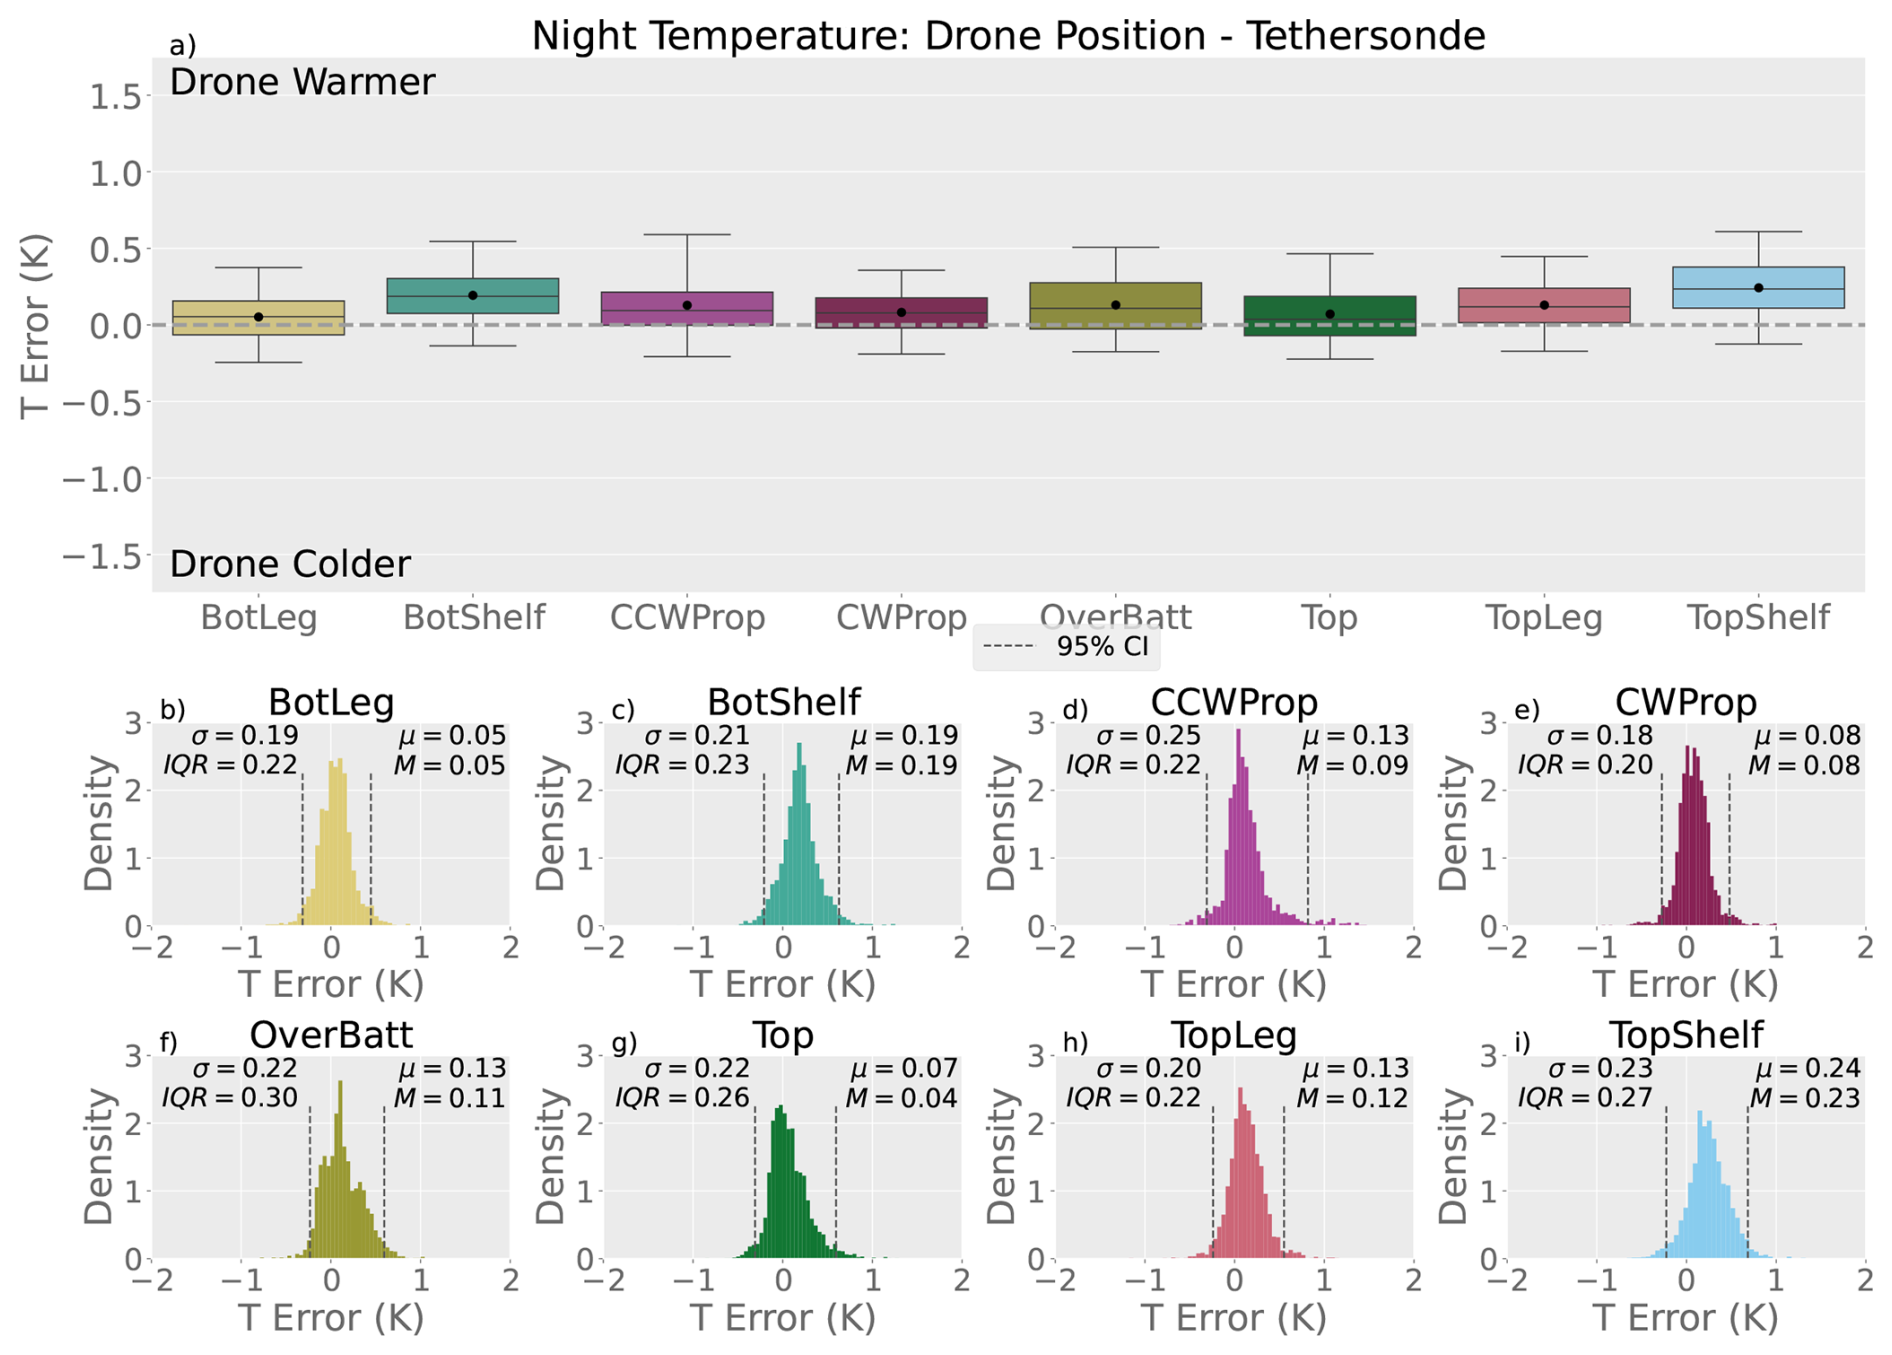
Recall that for the daytime flights, the various drone sensor positions either have a warm or cold mean bias depending on the amount of aspiration they receive. In contrast, at night, all eight tested positions have a warm bias (Fig. 5), and the magnitude of the warm bias ranges from +0.05 to +0.24 K. This could be due to a combination of two factors: the mean altitude bias between the drone and tethersonde (4.2 m) and the heat generated by the drone. However, a 4.2 m mean altitude bias is unlikely to result in a warm bias on the order of 0.1 K. Even if a dry-adiabatic lapse rate is assumed in the near-surface boundary layer (an unrealistically strong lapse rate at night), a 4.2 m altitude difference only translates to a mean bias of +0.04 K. We therefore speculate that the primary cause of the temperature bias is that the drone, unlike the tethersonde, is a significant source of heating. The batteries' onboard temperature sensors indicate that each battery can increase its temperature by up to 25 K while in flight. The TopShelf position has the greatest mean bias, which is likely due to its position directly below the main electronics and battery bay. The BotLeg has the smallest mean bias, similar to the daytime temperature results. The small bias for the BotLeg position is once again likely because this sensor position is farthest from the main electronics bay and motors. Even the two positions that are located directly below the propellers (CWProp and CCWProp), which should receive the most aspiration among the sensor positions, have warm biases at night. The warm biases for the under-propeller positions are likely due to the heat generated by the motors in flight or by the propellers circulating air warmed over the main body of the drone to these positions. Overall, the nighttime flight results demonstrate that even if sensors are properly shielded from radiation error during the day, drone-induced errors are present and must be accounted for during daytime and nighttime flights.
When comparing the nighttime distributions of error (Fig. 5b–i) to those of the daytime position errors (Fig. 3b–i), the nighttime distributions are narrower (Fig. 5b–i). For the nighttime flights, the 95 % CI of all the sensor siting locations is at worst −0.31 K ≤ T ≤ +0.82 K when not adjusting for the mean bias. Although these data are not normally distributed, the smaller tails and narrower distributions characteristic of the nighttime flights suggest that shielding the temperature sensor aboard the drone could improve data quality and reduce error for the daytime measurements for all the sensor siting locations tested.
3.3 Water Vapor Mixing Ratio
The water vapor mixing ratio measurements (abbreviated here as qv) from all 82 tethersonde flights are analyzed together (Fig. 6). All sensor positions except CWProp have mixing ratio mean bias magnitudes of at most 0.1 g kg−1, with six positions having a mean bias against the tethersonde of less than 0.05 g kg−1 (Fig. 6). Furthermore, the non-propeller positions (i.e., all but CWProp and CCWProp) have unimodal distributions with 95 % CIs of less than ±0.3 g kg−1 (Fig. 6b–i). This is in contrast to the sensor siting locations under the propellers (CWProp and CCWProp), which have a total 95 % CI of −0.22 g kg−1 ≤ qv ≤ +0.66 g kg−1 (Fig. 6d, e).
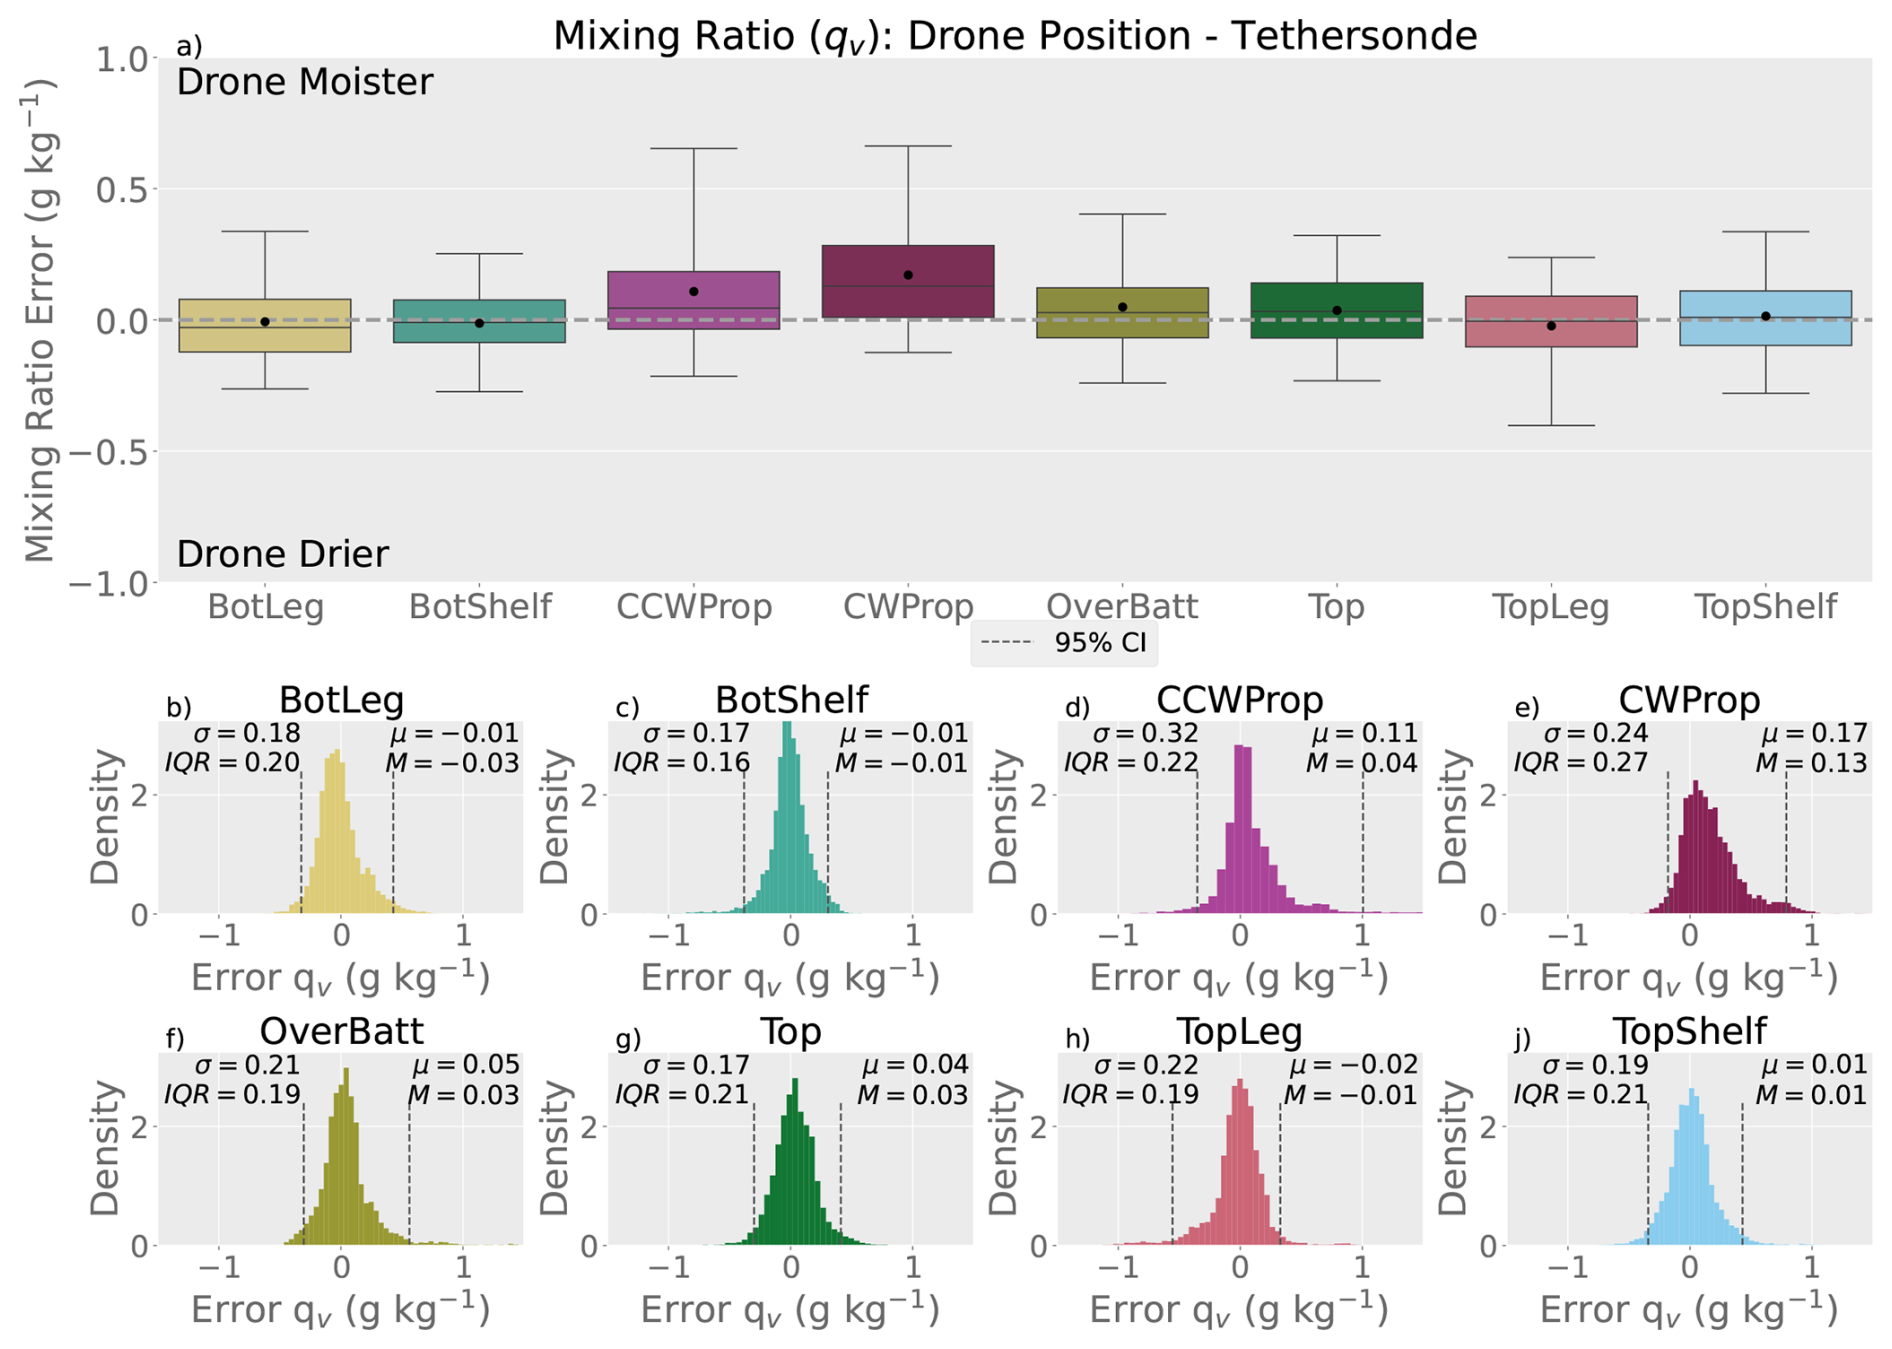
The wide 95 % CIs of the CCWProp and CWProp positions compared with the other positions merit investigation. In each of these cases (Fig. 6d–f), the wider CIs are caused by relatively longer tails on the positive side of the distribution (where the drone is moister than the tethersonde). As the drone does not carry any water onboard and does not produce water in flight, the unequal water vapor mixing ratio distributions must be a result of error induced either by the drone or by solar radiation.
The 82 tethersonde flights are stratified by solar radiation (Fig. 7), as in Sect. 3a for temperature, to determine the contribution of solar radiation to the water vapor mixing ratio error. This figure shows that, for some positions (e.g., CWProp, CCWProp), the errors (spread and mean bias) in water vapor mixing ratio increase with increasing solar radiation. However, this signal is unclear for other positions (e.g., BotShelf, BotLeg), and there are even trends that stay approximately constant for some positions (e.g., TopShelf). The mean biases for all positions are less variable than the standard deviations, however. The changes in standard deviation with varying solar radiation suggest that there is a contribution of radiative error to the total water vapor mixing ratio error. This is despite the fact that the RH sensor measures the temperature that the RH is based on and this temperature is used in the calculation of the water vapor mixing ratio. However, it is impossible to conclusively determine the exact cause of the radiative error with the data collected. Future work should explore this issue further.
3.4 Temperature and Water Vapor Mixing Ratio Relative Temporal Change
Several field campaigns that have utilized multirotor drones, such as C3LOUD-Ex (van den Heever et al., 2021) and LAFE (Wulfmeyer et al., 2018), have been interested in measuring relative temporal or spatial changes in the thermodynamic variables rather than singular or absolute measurements of these variables. In this section, we examine the accuracy of the drone measurements when considering temporal changes in temperature or water vapor mixing ratio, where the relative magnitudes in a variable, as opposed to the absolute magnitudes, are important to the scientific investigation of interest.
Before examining temporal changes in temperature or water vapor mixing ratio, we first apply a moving average to these data, as is commonly done with temperature and water vapor mixing ratio measurements. We apply a 20 s moving average to the temperature and water vapor mixing ratio data. This interval is chosen because it is longer than the e-folding times of error autocorrelation for all sensor positions in daytime temperature and water vapor mixing ratio (see Appendix A and Fig. A1 for further discussion of this interval). While some of the positions in nighttime temperature have longer e-folding intervals, 20 s is still used across the experiments for the purpose of consistency and as most of the data during these two example campaigns were taken during daytime. We specify that only 75 % of the data points contained in the moving average window must be valid data points after our quality control to provide a balance between capturing sufficient data points and data accuracy. This requirement means that for a single 20 s period, there must be 15 valid data points for a moving average to be calculated. If there are fewer than 15 valid data points, the moving average is not calculated, and the 20 s period is flagged as invalid. The filtered data are notated with an overbar for the remainder of this discussion (e.g. , ).
To characterize the measurement error expected when sampling some temporal change, such as , where t is time, an appropriate time interval (Δt) must first be chosen. We consider time intervals of 9 min (the total time of each flight) or less for this analysis. Increasingly large Δts reduce the number of usable data points. To provide a compromise between a sufficiently long Δt such that it is larger than the moving average time, and a sufficiently short Δt to allow as large a sample size as possible, a time interval of 60 s is chosen. Testing reveals that the main findings are not qualitatively sensitive to the exact Δt used (not shown). The filtered temperature () is subtracted from the filtered temperature 60 seconds later (i.e. − , notated here as ) (Fig. 8). It is evident from this figure that for the daytime temporal temperature change, the errors at each sensor siting location are smaller than the errors in the absolute temperature measurements (Fig. 3), with a worst-case error of (−1.08 K, +1.12 K) at a 95 % CI (Fig. 9). Unlike the absolute measurements of temperature, the biases in are all near zero.
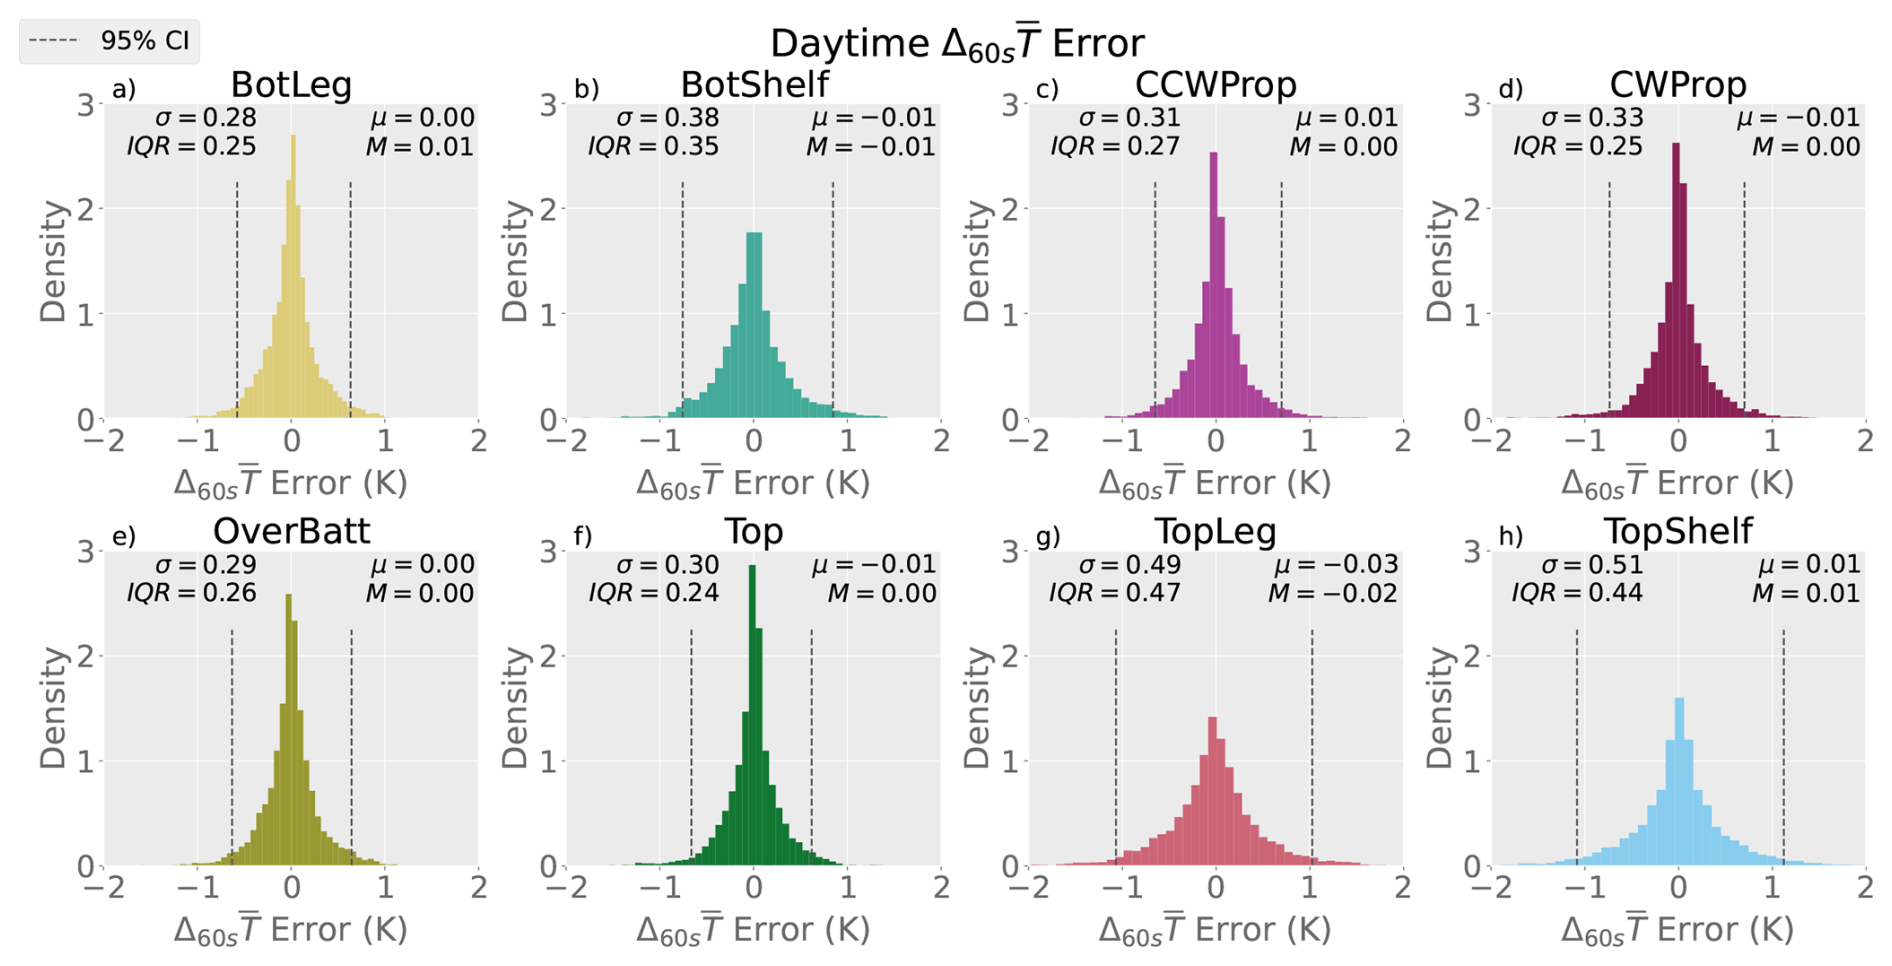
Figure 8As in Fig. 3b–i, but showing the quantity , as defined in the text, for all daytime flights.
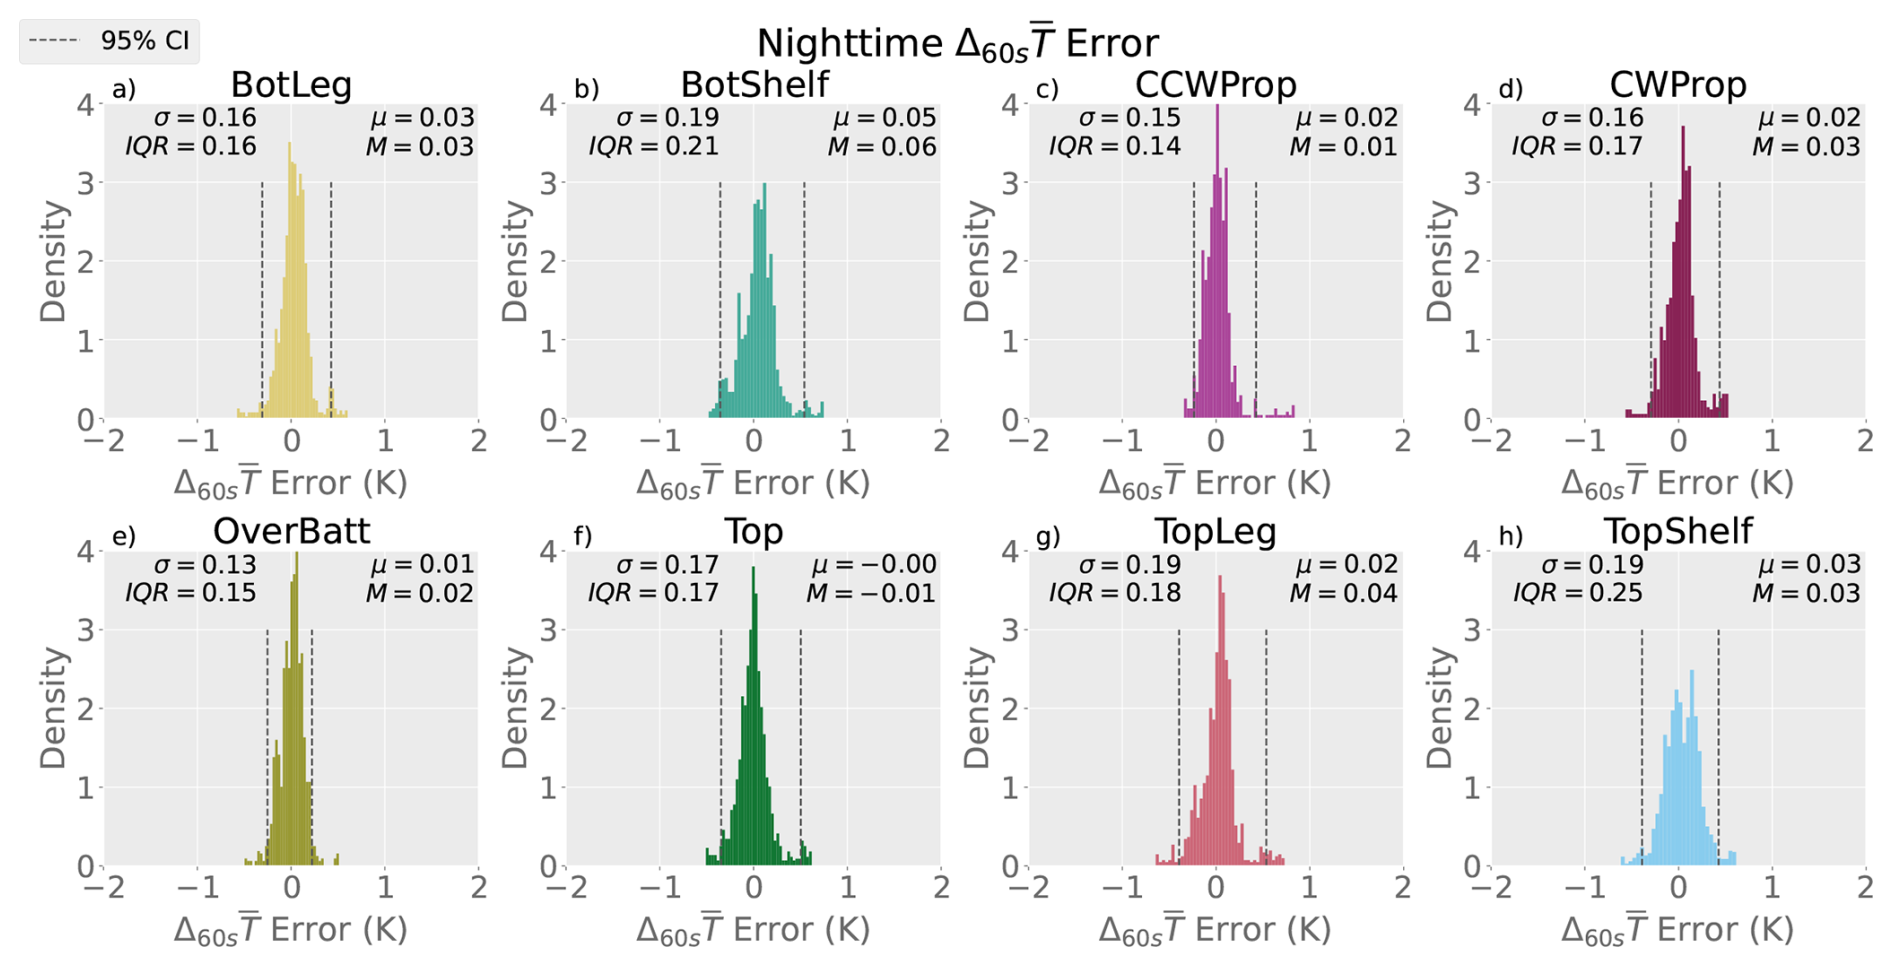
As shown in Sect. 3a and b, the daytime and nighttime temperature accuracies differ due to the impacts of solar radiation. With that in mind, an analysis of error is conducted for the nighttime flights. The 95 % confidence error for temporal changes in temperature at night (Fig. 9) is approximately the same as each independent nighttime temperature measurement (Fig. 5). This result suggests that when measuring temporal change in temperature during the day, the accuracy may differ if there are variations in the incoming solar radiation, such as might ensue from changing cloud properties as the error in the measurement may change with changing cloud cover.
We performed a similar analysis for the NEON flux tower days to validate the temperature difference results from the tethersonde. For this, we conducted an experiment measuring the mean absolute difference between the drone Δ60 sT and the NEON site Δ60 sT (i.e., ∑ | Δ60 sTDrone − Δ60 sTNEON | . The values for each of the sensors were between 0.33 and 0.36 K, within the combined accuracy range of the two instruments (±0.3 K for the iMet XQ2s on the drone, an average of ±0.08 K for the NEON site), demonstrating that the measurements of temperature changes over time are valid.
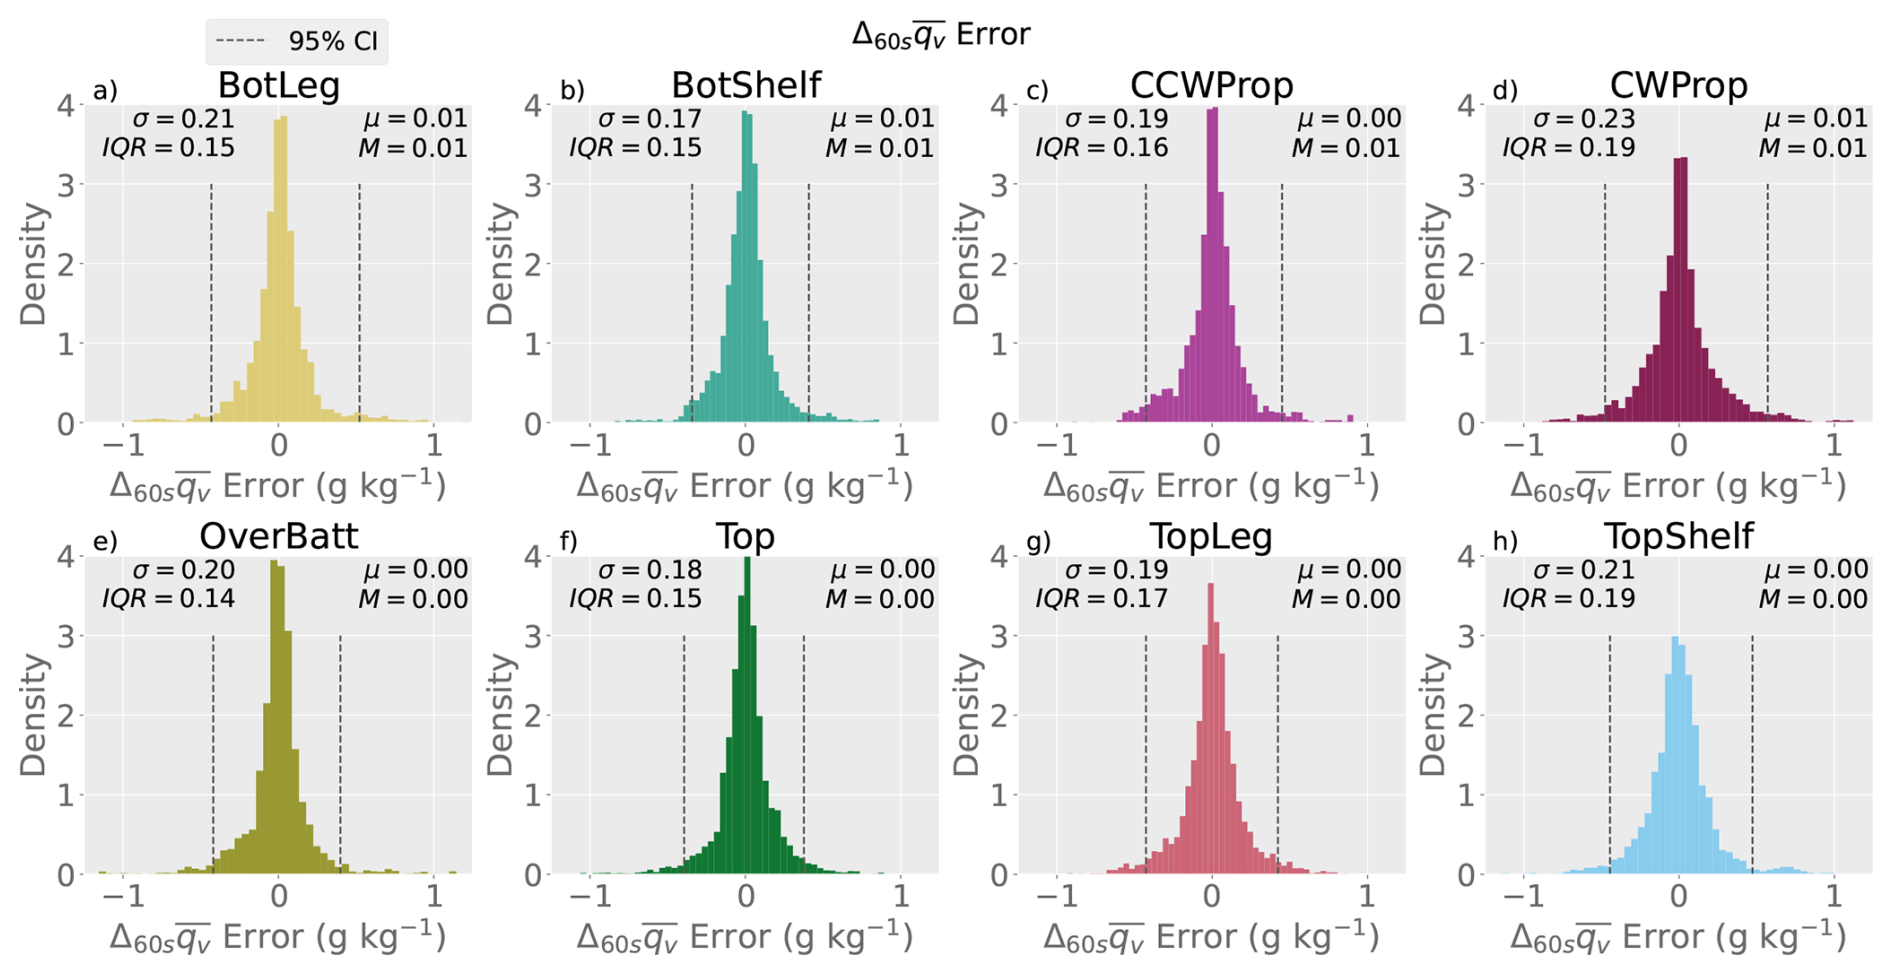
We also examine the error in measurements of temporal change of water vapor mixing ratio (keeping the symbology identical to that for temperature). Figure 10 shows the error distributions for all eight sensor siting locations for . In all eight sensor siting locations, the maximum relative water vapor mixing ratio error is ±0.50 g kg−1 at the 95 % confidence level, lower than many of the absolute value water vapor mixing ratio errors. Furthermore, the mean water vapor mixing ratio relative error is approximately zero for all sensor positions. For field campaigns interested in changes over time, unshielded sensors onboard drones can provide added value at accuracy ranges smaller than for absolute measurements. The implications of our results for field campaign measurements are now explored in the next section.
The results presented here characterize the accuracy of thermodynamic measurements made from unshielded sensors in eight different sensor siting locations on one multirotor drone platform. To understand the implications of these findings for the use of drone platforms in field campaigns, two campaigns that used unshielded sensors to measure thermodynamics from multirotor drones are now discussed. The C3LOUD-Ex field campaign (van den Heever et al., 2021) was conducted in July of 2016 and May–June of 2017 and employed a suite of instruments to measure storm updrafts and surface outflows using targeted observations. C3LOUD-Ex utilized six multirotor drones to measure storm-produced cold pools, areas of evaporatively-cooled dense air in contact with the ground and identified via temperature gradients near their edges. The results for temperature and water vapor mixing ratio temporal changes outlined in this study (Sect. 3d) are therefore particularly relevant for C3LOUD-Ex. The drones used in this campaign were identical to the drone used in the present study, and the C3LOUD-Ex drone sensors were placed in the TopShelf position. Continental cold pools produced by deep convection, the focus of C3LOUD-Ex, typically have near-surface temperature differences ranging from −2 to −20 K relative to the environment (Engerer et al., 2008). The results presented here indicate that errors onboard the drone for the TopShelf position are at worst −1.08 K ≤ ≤ +1.12 K at the 95 % confidence level, representing the largest range possible in error. We therefore conclude that most unshielded drone temperature measurements described here are sufficient to successfully measure most mid-latitude continental cold pools produced by deep convection.
The Land-Atmosphere Feedback Experiment (LAFE; Wulfmeyer et al., 2018) was a field campaign completed in August 2017 in central Oklahoma. LAFE used a suite of instruments to observe land-atmosphere feedbacks over different soil types and soil moisture conditions. During LAFE, two multirotor drones with thermodynamic instruments were operated, including at least one drone that had an in situ thermodynamic sensor near the OverBatt position tested in this work (Wulfmeyer et al., 2018; Lee et al., 2019). The drones were used to measure vertical and horizontal profiles of temperature and humidity over different soil types and soil moisture to identify the spatial structures that may exist in these variables. Lee et al. (2019) reported that during the transects, the temperature varied by ±0.5 K and the dewpoint temperature by approximately ±1 K. Our study indicates that the magnitudes of the variance in temperature measured by the drones in the LAFE campaign are likely to be real atmospheric features at the 90 % confidence level, as half of the sensor siting locations (BotLeg, CWProp, OverBatt, Top) had a 90 % confidence interval for < ±0.5 K.
Multirotor drones have enabled new types of observational strategies and sampling in atmospheric science field campaigns. This work provides new insights into understanding the measurements made onboard multirotor drones. We have examined temperature and water vapor mixing ratio measurements made from drones and have characterized the biases and errors induced by placing unshielded, unaspirated sensors in different positions on multirotor drones. Eight sensor positions, representing the most common locations utilized in field campaigns to date, were tested by flying a multirotor drone for 98 flights (15.5 total flight hours), including 9 flights at night. The multirotor drone was flown in close proximity to a tethersonde carrying the same sensors and located at a similar altitude, as well as next to an instrumented flux tower. Temperature and water vapor mixing ratio measurements at each sensor siting location were compared with those from the tethersonde. Flux tower measurements were used to validate the temperature results from the tethersonde. The errors were defined as the difference between the drone sensor measurements and the tethersonde measurements.
The results from the observational experiments indicate that when sampling temperature during the day using a sensor unshielded from incoming solar radiation, measurement errors at a 95 % confidence level range from −0.83 K ≤ T ≤ +0.61 K for the sampling position with the lowest spread, to −0.91 K ≤ T ≤ +1.88 K for the position with the greatest spread. When making measurements at night without the impacts of incoming solar radiation, the location with the greatest spread is reduced to −0.31 K ≤ T ≤ +0.82 K. However, at night, there is nevertheless a warm mean bias in temperature due to the heat generated by the batteries and avionics onboard the drone. If temporal changes in temperature rather than absolute temperature measurements are of interest, the expected 95 % confidence interval (CI) for daytime temperature relative errors range from −0.57 K ≤ T ≤ +0.63 to −1.08 K ≤ T ≤ +1.12 K, depending on sensor location.
Our analysis of water vapor mixing ratio indicates that solar radiative error impacts the water vapor measurements made onboard the drone because the reported accuracies vary when stratified by solar radiation. The largest error in water vapor mixing ratio was found to be ±0.30 g kg−1, except for the sensor position below the two propellers and the position directly over a battery, where the largest 95 % CI was −0.22 g kg−1 ≤ qv ≤ +0.66 g kg−1. The error when sampling a temporal change in water vapor mixing ratio had a 95 % CI of approximately ±0.50 g kg−1, regardless of sensor position.
Our results place a narrower CI on thermodynamic measurements made from drones than those presented by Barbieri et al. (2019). This is most likely because we focused on the results from single drone platform rather than an ensemble of different drones. In field campaigns where multiple drones of different types are to be deployed, understanding the platform-specific differences in drone-induced errors would be critical. The results presented here suggest that the error bounds for drone thermodynamic measurements can be greatly reduced by placing the sensor in certain positions and conducting error characterization flights for each drone platform used. Further, we found that relative measurements of temperature and water vapor have smaller errors than absolute measurements of those quantities.
The results demonstrated here also elucidate some of the best practices when sampling temperature and water vapor with multirotor drones. In general, the smallest error spread and mean bias in temperature and water vapor mixing ratio were found for the siting location furthest away from the main body, including the batteries and avionics. For the specific drone used in the present study, the BotLeg position best meets these criteria, although this position can be challenging to mount sensors on. Future developments in drone sensor engineering should also focus on ways to extend the sensors away from the main body of the drone without substantially increasing the weight or changing the aerodynamic characteristics and balance. For drone platforms where a probe or extension is not possible, measurement errors are likely to be higher due to the heat generated by the drone itself. Even aspiration and shielding may not be sufficient to remove the errors induced by drone heating, as suggested by the nighttime results presented here. Many test flights should also be completed to better understand the errors and biases when introducing an aspirated shield. For field projects that have already completed their sampling phase with unshielded sensors onboard, the error values and biases that have been characterized in this work should be accounted for when analyzing the data collected.
Future work should examine the impacts of small, lightweight sensor aspiration and shielding on the measurements on a variety of drone platforms and seek to understand whether the potential benefit of such aspiration and/or shields outweighs the weight and cost. Our analysis of the nighttime flights conducted to eliminate the impacts of solar radiative error suggest that sensor shielding may not entirely eliminate errors in temperature measurements, because heat from the drone batteries and avionics can still bias the measurements. The biases in shielded sensors should therefore be investigated before shielding is employed in future campaigns. Additionally, errors associated with measurements on board a smaller drone platform may not be identical to the errors on our larger platform because different drone platforms produce varying amounts of heating and propellor wash. Finally, this research provides characterizations of measurement errors based on sensor siting locations that are useful both to already-completed field campaigns and to future “ride-along” deployments where sensor positioning may not be selectable by researchers. We suggest that in future campaigns employing drones for thermodynamic measurements, thermodynamic sensors should be sited as far away from the main body of the drone (and hence the batteries and avionics) as possible and should be shielded from the impacts of insolation.
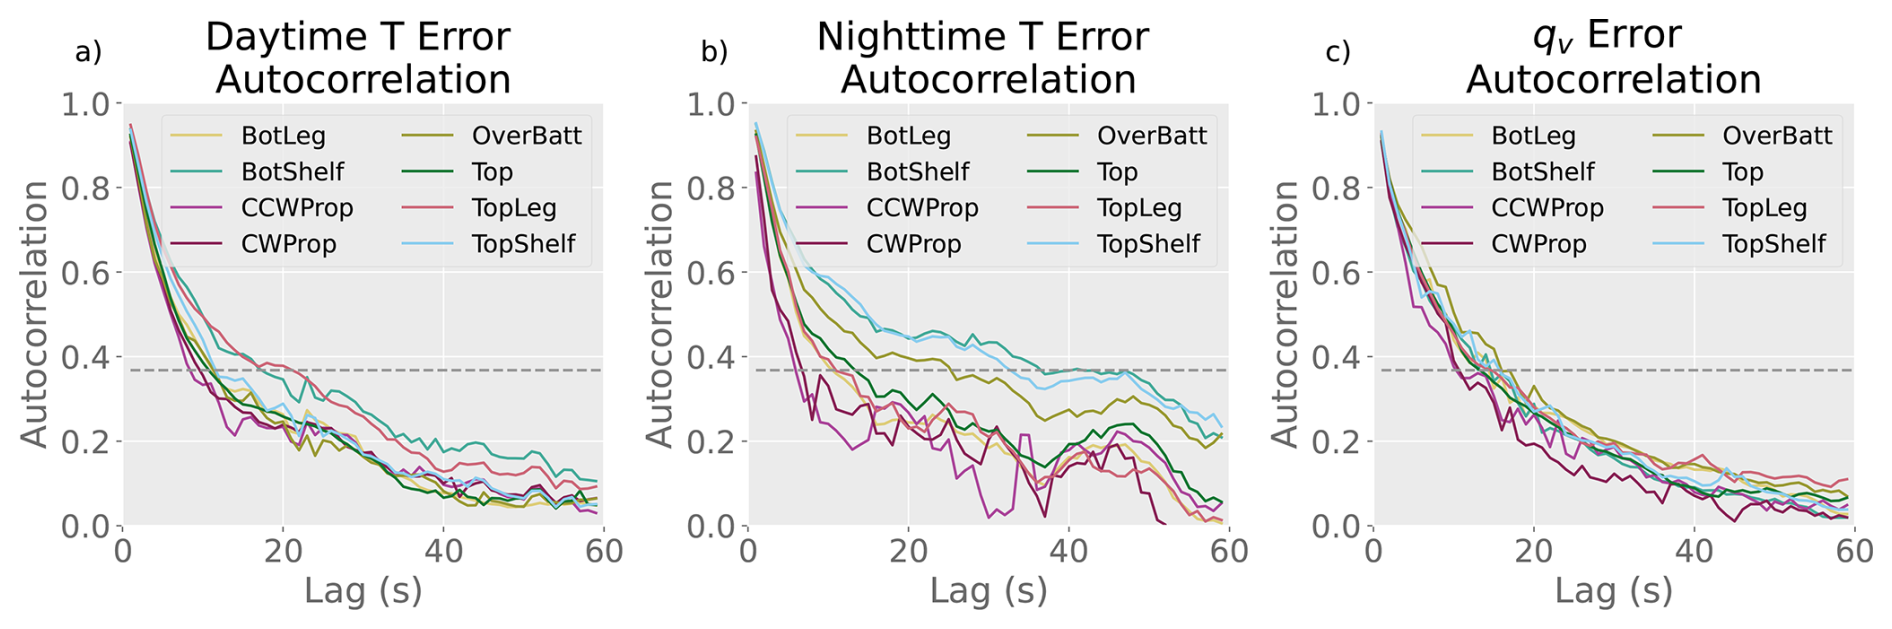
Figure A1Autocorrelation by sensor position from the tethersonde experiments of (a) daytime temperature error, (b) nighttime temperature error, and (c) water vapor mixing ratio. The grey dashed line shows the e-folding line (i.e., ).
To determine the appropriate length of the moving average such that noise is removed but the signal is preserved, we calculate the autocorrelation of the error for each position. Here, we use the e-folding time (i.e., the time at which the error autocorrelation is lower than ) as a metric to determine the length of the moving average. The e-folding time of the error autocorrelation is greater than 1 s for all positions for daytime temperature, nighttime temperature, and water vapor mixing ratio (Fig. A1). In general, the positions receiving the most forced aspiration from the drone (i.e., CWProp and CCWProp) have the smallest error autocorrelation for a given lag time, indicating a relatively higher level of noise in the measurements. In all cases during the daytime, the e-folding time is at most 20 s, while at night, the positions with the least aspiration (i.e., BotShelf and TopShelf) have longer e-folding times.
The National Ecological Observatory Network flux tower data are available under DOIs https://doi.org/10.48443/YEX7-7Z81 (NEON, 2024a), https://doi.org/10.48443/K9VK-5K27 (NEON, 2024c), https://doi.org/10.48443/pde7-k607 (NEON, 2024e), https://doi.org/10.48443/rt4v-kz04 (NEON, 2024b), and https://doi.org/10.48443/9qpc-5v70 (NEON, 2024d). Drone data and tethersonde data have been uploaded to Zenodo, https://doi.org/10.5281/zenodo.17497401 (Freeman et al., 2025).
SWF, LDG, and SCvdH conceptualized the idea. SWF, LDG, and JB designed the experiments, and SWF, LDG, JB, PJM, JMP, SMH, and CAN carried them out. SWF, JB, LDG, CAN, and SCvdH analysed the results. SWF, LDG, and SCvdH obtained the funding. SCvdH provided project administration. SWF drafted the manuscript with edits from all coauthors.
The contact author has declared that none of the authors has any competing interests.
Publisher's note: Copernicus Publications remains neutral with regard to jurisdictional claims made in the text, published maps, institutional affiliations, or any other geographical representation in this paper. The authors bear the ultimate responsibility for providing appropriate place names. Views expressed in the text are those of the authors and do not necessarily reflect the views of the publisher.
Funding from the Monfort Excellence Fund provided to Susan C. van den Heever as a Monfort Professor at Colorado State University is acknowledged, as well as funding from NSF grant nos. AGS-1409686, AGS-2446864, and AGS-2105938. Sean W. Freeman was supported by NSF grant nos. DGE-1321845 and AGS-2446865 and funding from The University of Alabama in Huntsville Office of the Vice President for Research and Economic Development. Peter J. Marinescu was supported by NSF Grant DGE-1840343. Access to the tethersonde equipment was provided by Patrick Kennedy at the Colorado State University CHILL radar facility. The National Ecological Observatory Network is a program sponsored by the National Science Foundation and operated under cooperative agreement by Battelle. This material is based in part upon work supported by the National Science Foundation through the NEON Program. Data collected/used in this research were obtained through the NEON Assignable Assets program. We acknowledge the Colorado State University Convective Cloud Outflows and Updrafts Experiment (C3LOUD-Ex) and BioAerosols and Convective Storms (BACS) drone teams for their involvement in the project, including conducting some of the flights analyzed as part of this work. We thank the two anonymous reviewers and Associate Editor Troy Thornberry for their helpful comments on the manuscript.
This research has been supported by the National Science Foundation (grant nos. AGS-1409686, AGS-2105938, AGS-2446864, AGS-2446865 and DGE-1840343, and DGE-1321845) and the University of Alabama in Huntsville (grant no. NRF 2023).
This paper was edited by Troy Thornberry and reviewed by two anonymous referees.
Arya, S. P.: Introduction to micrometeorology, 2nd edn., Academic Press, San Diego, 420 pp., ISBN 9780120593545, 2001.
Bailey, S. C. C., Sama, M. P., Canter, C. A., Pampolini, L. F., Lippay, Z. S., Schuyler, T. J., Hamilton, J. D., MacPhee, S. B., Rowe, I. S., Sanders, C. D., Smith, V. G., Vezzi, C. N., Wight, H. M., Hoagg, J. B., Guzman, M. I., and Smith, S. W.: University of Kentucky measurements of wind, temperature, pressure and humidity in support of LAPSE-RATE using multisite fixed-wing and rotorcraft unmanned aerial systems, Earth Syst. Sci. Data, 12, 1759–1773, https://doi.org/10.5194/essd-12-1759-2020, 2020.
Barbieri, L., Kral, S. T., Bailey, S. C. C., Frazier, A. E., Jacob, J. D., Reuder, J., Brus, D., Chilson, P. B., Crick, C., Detweiler, C., Doddi, A., Elston, J., Foroutan, H., González-Rocha, J., Greene, B. R., Guzman, M. I., Islam, A. L. H. A., Kemppinen, O., Lawrence, D., Pillar-Little, E. A., Ross, S. D., Sama, M., Iii, D. G. S., Schuyler, T. J., Shankar, A., Smith, S. W., Waugh, S., Dixon, C., Borenstein, S., and de Boer, G.: Intercomparison of Small Unmanned Aircraft System (sUAS) Measurements for Atmospheric Science during the LAPSE-RATE Campaign, Sensors, 19, 2179, https://doi.org/10.3390/s19092179, 2019.
Bell, T. M., Greene, B. R., Klein, P. M., Carney, M., and Chilson, P. B.: Confronting the boundary layer data gap: evaluating new and existing methodologies of probing the lower atmosphere, Atmos. Meas. Tech., 13, 3855–3872, https://doi.org/10.5194/amt-13-3855-2020, 2020.
Brady, J. M., Stokes, M. D., Bonnardel, J., and Bertram, T. H.: Characterization of a Quadrotor Unmanned Aircraft System for Aerosol-Particle-Concentration Measurements, Environ. Sci. Technol., 50, 1376–1383, https://doi.org/10.1021/acs.est.5b05320, 2016.
de Boer, G., Butterworth, B. J., Elston, J. S., Houston, A., Pillar-Little, E., Argrow, B., Bell, T. M., Chilson, P., Choate, C., Greene, B. R., Islam, A., Martz, R., Rhodes, M., Rico, D., Stachura, M., Lappin, F. M., Segales, A. R., Whyte, S., and Wilson, M.: Evaluation and Intercomparison of Small Uncrewed Aircraft Systems Used for Atmospheric Research, J. Atmos. Ocean. Tech., 41, 127–145, https://doi.org/10.1175/JTECH-D-23-0067.1, 2024.
Dexheimer, D., Apple, M., Bendure, A., Callow, D., Longbottom, C., Novick, D., and Wilson, C.: Joint UAS-Balloon Activities (JUBA) Field Campaign Report, ARM Climate Research Facility, Pacific Northwest National Laboratory, Richland, WA, https://www.osti.gov/biblio/1422521 (last access: 23 February 2026), 2018.
Elston, J., Argrow, B., Stachura, M., Weibel, D., Lawrence, D., and Pope, D.: Overview of Small Fixed-Wing Unmanned Aircraft for Meteorological Sampling, J. Atmos. Ocean. Tech., 32, 97–115, https://doi.org/10.1175/JTECH-D-13-00236.1, 2014.
Engerer, N. A., Stensrud, D. J., and Coniglio, M. C.: Surface Characteristics of Observed Cold Pools, Mon. Weather Rev., 136, 4839–4849, https://doi.org/10.1175/2008MWR2528.1, 2008.
Freeman, S., Bukowski, J., Grant, L., Marinescu, P., Park, J., Hitchcock, S., Neumaier, C., and van den Heever, S. C.: Unshielded Drone Sensor Data from Tethersondes and NEON Flux Towers, Version v1, Zenodo [data set], https://doi.org/10.5281/zenodo.17497401, 2025.
Geerts, B., Raymond, D., Barth, M., Detwiler, A., Klein, P., Lee, W.-C., Markowski, P., Mullendore, G., and Geerts, B.: Community Workshop on Developing Requirements for In Situ and Remote Sensing Capabilities in Convective and Turbulent Environments (C-RITE), UCAR/NCAR Earth Observing Laboratory, https://doi.org/10.5065/d6db80kr, 2017.
Geerts, B., Raymond, D. J., Grubišić, V., Davis, C. A., Barth, M. C., Detwiler, A., Klein, P. M., Lee, W.-C., Markowski, P. M., Mullendore, G. L., and Moore, J. A.: Recommendations for In Situ and Remote Sensing Capabilities in Atmospheric Convection and Turbulence, B. Am. Meteorol. Soc., 99, 2463–2470, https://doi.org/10.1175/BAMS-D-17-0310.1, 2018.
Greene, B. R., Segales, A. R., Waugh, S., Duthoit, S., and Chilson, P. B.: Considerations for temperature sensor placement on rotary-wing unmanned aircraft systems, Atmos. Meas. Tech., 11, 5519–5530, https://doi.org/10.5194/amt-11-5519-2018, 2018.
Greene, B. R., Segales, A. R., Bell, T. M., Pillar-Little, E. A., and Chilson, P. B.: Environmental and Sensor Integration Influences on Temperature Measurements by Rotary-Wing Unmanned Aircraft Systems, Sensors, 19, 1470, https://doi.org/10.3390/s19061470, 2019.
Hemingway, B. L., Frazier, A. E., Elbing, B. R., and Jacob, J. D.: Vertical Sampling Scales for Atmospheric Boundary Layer Measurements from Small Unmanned Aircraft Systems (sUAS), Atmosphere, 8, 176, https://doi.org/10.3390/atmos8090176, 2017.
Hervo, M., Romanens, G., Martucci, G., Weusthoff, T., and Haefele, A.: Evaluation of an Automatic Meteorological Drone Based on a 6-Month Measurement Campaign, Atmosphere, 14, 1382, https://doi.org/10.3390/atmos14091382, 2023.
Houston, A. L., Argrow, B., Elston, J., Lahowetz, J., Frew, E. W., and Kennedy, P. C.: The Collaborative Colorado–Nebraska Unmanned Aircraft System Experiment, B. Am. Meteorol. Soc., 93, 39–54, https://doi.org/10.1175/2011BAMS3073.1, 2011.
Houston, A. L., Laurence, R. J., Nichols, T. W., Waugh, S., Argrow, B., and Ziegler, C. L.: Intercomparison of Unmanned Aircraftborne and Mobile Mesonet Atmospheric Sensors, J. Atmos. Ocean. Tech., 33, 1569–1582, https://doi.org/10.1175/JTECH-D-15-0178.1, 2016.
Humphrey, P. A.: An Evaluation of the Aerometric Probe, J. Air Pollut. Control Assoc., 11, 362–383, https://doi.org/10.1080/00022470.1961.10468009, 1961.
Inoue, J. and Sato, K.: Toward sustainable meteorological profiling in polar regions: Case studies using an inexpensive UAS on measuring lower boundary layers with quality of radiosondes, Environ. Res., 205, 112468, https://doi.org/10.1016/j.envres.2021.112468, 2022.
Islam, A., Houston, A. L., Shankar, A., and Detweiler, C.: Design and Evaluation of Sensor Housing for Boundary Layer Profiling Using Multirotors, Sensors, 19, 2481, https://doi.org/10.3390/s19112481, 2019.
Kimball, S. K., Montalvo, C. J., and Mulekar, M. S.: Assessing iMET-XQ Performance and Optimal Placement on a Small Off-the-Shelf, Rotary-Wing UAV, as a Function of Atmospheric Conditions, Atmosphere, 11, 660, https://doi.org/10.3390/atmos11060660, 2020a.
Kimball, S. K., Montalvo, C. J., and Mulekar, M. S.: Evaluating Temperature Measurements of the iMET-XQ, in the Field, under Varying Atmospheric Conditions, Atmosphere, 11, 335, https://doi.org/10.3390/atmos11040335, 2020b.
Lee, T. R., Buban, M., Dumas, E., and Baker, C. B.: A New Technique to Estimate Sensible Heat Fluxes around Micrometeorological Towers Using Small Unmanned Aircraft Systems, J. Atmos. Ocean. Tech., 34, 2103–2112, https://doi.org/10.1175/JTECH-D-17-0065.1, 2017.
Lee, T. R., Buban, M., Dumas, E., and Baker, C. B.: On the Use of Rotary-Wing Aircraft to Sample Near-Surface Thermodynamic Fields: Results from Recent Field Campaigns, Sensors, 19, 10, https://doi.org/10.3390/s19010010, 2019.
Leung, G. R., Ascher, B. D., Barbero, T. W., Davis, C. M., Escobedo, J. A., Falk, N. M., Freeman, S. W., Heffernan, B., Mazurek, A. C., Neumaier, C., Nieto-Caballero, M., Sherman, E. A., Veloso-Aguila, D., van den Heever, S. C., Grant, L., Stone, E. A., DeMott, P. J., Kreidenweis, S., and Perkins, R. J.: BACS: Drone Stack Meteorological Data, Version 1.0, NSF NCAR Earth Observing Laboratory [data set], https://doi.org/10.26023/XXPF-333X-R105, 2025.
May, R. M., Goebbert, K. H., Thielen, J. E., Leeman, J. R., Camron, M. D., Bruick, Z., Bruning, E. C., Manser, R. P., Arms, S. C., and Marsh, P. T.: MetPy: A Meteorological Python Library for Data Analysis and Visualization, B. Am. Meteorol. Soc., 103, E2273–E2284, https://doi.org/10.1175/BAMS-D-21-0125.1, 2022.
Meier, K., Hann, R., Skaloud, J., and Garreau, A.: Wind estimation with multirotor UAVs, Atmosphere-Basel, 13, 551, https://doi.org/10.3390/atmos13040551, 2022.
Metzger, S., Ayres, E., Durden, D., Florian, C., Lee, R., Lunch, C., Luo, H., Pingintha-Durden, N., Roberti, J. A., SanClements, M., Sturtevant, C., Xu, K., and Zulueta, R. C.: From NEON Field Sites to Data Portal: A Community Resource for Surface–Atmosphere Research Comes Online, B. Am. Meteorol. Soc., 100, 2305–2325, https://doi.org/10.1175/BAMS-D-17-0307.1, 2019.
NEON (National Ecological Observatory Network): 2D wind speed and direction (DP1.00001.001), NEON [data set], https://doi.org/10.48443/yex7-7z81, 2024a.
NEON (National Ecological Observatory Network): Barometric pressure (DP1.00004.001), NEON [data set], https://doi.org/10.48443/rt4v-kz04, 2024b.
NEON (National Ecological Observatory Network): Relative humidity (DP1.00098.001), NEON [data set], https://doi.org/10.48443/k9vk-5k27, 2024c.
NEON (National Ecological Observatory Network): Shortwave and longwave radiation (net radiometer) (DP1.00023.001), NEON [data set], https://doi.org/10.48443/9qpc-5v70, 2024d.
NEON (National Ecological Observatory Network): Triple aspirated air temperature (DP1.00003.001), NEON [data set], https://doi.org/10.48443/pde7-k607, 2024e.
Quesada-Moreno, J. A., Martínez-Ibarra, E., and Ortiz, J. L.: Use of a drone equipped with microthermal sensors to estimate the quality of the atmosphere for astronomical observation, Weather, 79, 331–337, https://doi.org/10.1002/wea.4551, 2024.
Riganti, C. J. and Houston, A. L.: Rear-Flank Outflow Dynamics and Thermodynamics in the 10 June 2010 Last Chance, Colorado, Supercell, Mon. Weather Rev., 145, 2487–2504, https://doi.org/10.1175/MWR-D-16-0128.1, 2017.
Schafer, R., May, P. T., Keenan, T. D., McGuffie, K., Ecklund, W. L., Johnston, P. E., and Gage, K. S.: Boundary Layer Development over a Tropical Island during the Maritime Continent Thunderstorm Experiment, J. Atmos. Sci., 58, 2163–2179, https://doi.org/10.1175/1520-0469(2001)058<2163:BLDOAT>2.0.CO;2, 2001.
Segales, A. R., Greene, B. R., Bell, T. M., Doyle, W., Martin, J. J., Pillar-Little, E. A., and Chilson, P. B.: The CopterSonde: an insight into the development of a smart unmanned aircraft system for atmospheric boundary layer research, Atmos. Meas. Tech., 13, 2833–2848, https://doi.org/10.5194/amt-13-2833-2020, 2020.
Spiess, T., Bange, J., Buschmann, M., and Vörsmann, P.: First application of the meteorological Mini-UAV “M2AV”, Meteorol. Z., 16, 159–169, https://doi.org/10.1127/0941-2948/2007/0195, 2007.
Themistocleous, K.: The use of UAVs for monitoring land degradation, in: Earth Resources and Environmental Remote Sensing/GIS Applications VIII, 104280E, https://doi.org/10.1117/12.2279512, 2017.
Tikhomirov, A. B., Lesins, G., and Drummond, J. R.: Drone measurements of surface-based winter temperature inversions in the High Arctic at Eureka, Atmos. Meas. Tech., 14, 7123–7145, https://doi.org/10.5194/amt-14-7123-2021, 2021.
van den Heever, S. C., Grant, L. D., Freeman, S. W., Marinescu, P. J., Barnum, J., Bukowski, J., Casas, E., Drager, A. J., Fuchs, B., Herman, G. R., Hitchcock, S. M., Kennedy, P. C., Nielsen, E. R., Minnie Park, J., Rasmussen, K., Razin, M. N., Riesenberg, R., Dellaripa, E. R., Slocum, C. J., Toms, B. A., and van den Heever, A.: The Colorado State University Convective CLoud Outflows and UpDrafts Experiment (C3LOUD-Ex), B. Am. Meteorol. Soc., 102, E1283–E1305, https://doi.org/10.1175/BAMS-D-19-0013.1, 2021.
Vömel, H., Argrow, B. M., Axisa, D., Chilson, P. B., Ellis, S., Fladeland, M., Frew, E. W., Jacob, J., Lord, M., Moore, J., Oncley, S., Roberts, G., Schoenung, S., and Wolff, C.: The NCAR/EOL Community Workshop on Unmanned Aircraft Systems for Atmospheric Research, Final Report, University Corporation For Atmospheric Research (UCAR), National Center For Atmospheric Research (NCAR) Earth Observing Laboratory (EOL), https://doi.org/10.5065/d6x9292s, 2018.
Vorontsov, P. A., Mikhel, V. M., and Erler, A. A.: Ispolzovanie radioupravlyaemykh aviamodeley samolyotov dlya aerologicheskikh issledovaniy nizhnikh sloev atmosfery [Use of radio-controlled model aircraft for aerological investigations of the lower layers of the atmosphere], Trudy Glavnoi Geofizicheskoi Observatorii, 73, 107–115, 1958 (in Russian).
Wulfmeyer, V., Turner, D. D., Baker, B., Banta, R., Behrendt, A., Bonin, T., Brewer, W. A., Buban, M., Choukulkar, A., Dumas, E., Hardesty, R. M., Heus, T., Ingwersen, J., Lange, D., Lee, T. R., Metzendorf, S., Muppa, S. K., Meyers, T., Newsom, R., Osman, M., Raasch, S., Santanello, J., Senff, C., Späth, F., Wagner, T., and Weckwerth, T.: A New Research Approach for Observing and Characterizing Land–Atmosphere Feedback, B. Am. Meteorol. Soc., 99, 1639–1667, https://doi.org/10.1175/BAMS-D-17-0009.1, 2018.