the Creative Commons Attribution 4.0 License.
the Creative Commons Attribution 4.0 License.
Performance and longevity of compact all-in-one weather stations – the good, the bad and the ugly
Christopher Walker Brown
Marin Schadee
Marijn de Haij
Theo Brandsma
We provide a long-term evaluation of compact, all-in-one automatic weather stations (AiOWS) compared to professional-grade Automatic Weather Stations (AWS). We examine the performance, longevity, and degradation of six AiOWS models over several years of non-serviced use. The objective was to determine how closely these low-cost stations meet World Meteorological Organization (WMO) performance standards for temperature, humidity, wind, and precipitation, and to identify their weaknesses and maintenance needs.
Previous studies show the potential value of AiOWS when data are properly quality-controlled, yet long-term reliability remains uncertain. To address this we deployed six AiOWS units – Davis VVue, Davis VP2, METER ATMOS41, Lufft WS601, and Vaisala WXT520, alongside two collocated reference AWS meeting WMO standards. Before field installation, each unit was tested in the calibration lab of the Royal Netherlands Meteorological Institute (KNMI) for baseline validation. The stations were then operated in open terrain for multiple years without any servicing, simulating worst-case-scenario end-user neglect.
Initially, all AiOWS met manufacturer specifications. After long-term exposure, however, sensors displayed varied durability. The Vaisala unit operated continuously for over 13 years, while others failed between 4 and 10 years due to corrosion, component wear, and sensor drift. The METER and Davis VVue remained mostly functional but with degraded performance, whereas both Davis VP2 rain gauges failed early due to reed switch damage.
Temperature measurements were the most robust. In climate chamber tests, new and aged sensors maintained accuracy within ± 0.3 °C across −15 °C to 30 °C, drifting slightly (underestimating by 0.5–0.7 °C) above 30 °C. Field data confirmed these results, though strong solar radiation caused overestimations during summer. The Vaisala and Davis VVue units remained within WMO Class B limits after multiple years. Relative humidity showed consistent deterioration. Most sensors overestimated low humidity and underestimated above 90 %, particularly the METER unit, whose bias grew markedly after 5 years. Wind speed accuracy degraded due to mechanical wear. Cup anemometers underreported low winds and failed completely in some cases. Sonic sensors (Vaisala, METER) produced erratic readings after several years, highlighting their fragility outdoors. Precipitation performance was weakest across all models. Tipping bucket designs suffered from clogging, internal corrosion, and undercatch errors, while haptic or drip-based sensors became inaccurate as components aged or fouled.
We concluded that compact AiOWS can provide scientifically useful temperature data if properly managed but fall short for humidity, wind, and particularly precipitation unless regularly serviced. Long-term unattended operation severely limits reliability, yet moderate maintenance can potentially restore performance close to WMO Class A/B standards, extending their utility for dense observation networks.
- Article
(4282 KB) - Full-text XML
- BibTeX
- EndNote
Over the past decades, compact Personal Weather Stations (PWSs)/All-in-One automatic Weather Stations (AiOWSs) have become widespread, offering meteorological measurements at low costs compared to conventional Automatic Weather Stations (AWSs) operated by National Meteorological Services (NMSs). NMSs, such as the Royal Netherlands Meteorological Institute (KNMI) are using this data in tiered networks, where it is combined with AWS data to improve numerous products ranging from rainfall to temperature nowcasting and numerical weather prediction (Demortier et al., 2024). Their affordability and ease of deployment have enabled a rapid expansion of observational networks, particularly in data-sparse regions and citizen science initiatives. Many peer-reviewed studies have demonstrated the scientific value of AiOWSs in varied research applications. These low-cost, rapidly deployable instruments have been used for urban climate monitoring (Meier et al., 2017), air quality and heat stress exposure assessments (Chapman et al., 2017), and enhancements of meteorological networks beyond a backbone of AWS sites (Overeem et al., 2013); de Vos et al. (2017) showed that crowdsourced data from hundreds of AiOWSs across the Netherlands could be statistically corrected to produce high-resolution rainfall maps comparable to those from official networks. Similarly, Meier et al. (2017) validated temperature data from citizen-operated stations in Zurich, finding them suitable for detecting spatial variations in urban heat islands. These studies highlight that, when properly calibrated and quality-controlled, data from AiOWSs can meaningfully contribute to scientific research, particularly in applications where high spatial density is prioritised over individual sensor quality. AiOWSs have also shown promise in observing deep-convective processes near the ground (Mandement and Caumont, 2020), monitoring urban heat islands (Wolters and Brandsma, 2012), filling precipitation observation gaps from official monitoring networks (de Vos et al., 2023; Rombeek et al., 2025), quantifying wind patterns in urban environments (Droste et al., 2020), and capturing complex dynamical processes in cities (Brousse et al., 2022).
The World Meteorological Organization (WMO) provides guidance for the deployment and operation of AiOWSs through its Guide to Instruments and Methods of Observation (WMO-No. 8). While AiOWS systems are not typically formally certified to meet WMO performance standards, their measurement principles, and operational concepts often align closely with those applied to AWSs in professional networks. These include instrument characteristics such as measurement accuracy, long-term reliability, structural durability and ease of maintenance. The WMO also emphasizes the importance of routine inspection and preventive maintenance, particularly for sensors exposed to outdoor conditions. Proper siting (away from buildings, trees and shading) is important, with problematic AiOWS placement locations requiring to be noted in metadata. Furthermore, the WMO promotes quality control procedures, metadata management, and intercomparison testing to ensure interoperability and scientific utility. For AiOWSs to contribute meaningfully to research or operational monitoring, alignment with an agreed global set of standards is (in our opinion) the best option to encourage greater use of AiOWS observations amongst the science community.
Although well-managed networks of AiOWSs are useful for research and can adhere to WMO guidance on siting, operation and servicing, many networks or individual AiOWSs are likely not maintained according to WMO guidelines. As a result, this has prompted numerous studies evaluating their accuracy and reliability. Vučković and Schmidt (2023) analysed city-wide data and found a “substantial amount of erroneous occurrences” (gaps and faulty signals), especially in humidity readings. This shows broader concerns with the equipment when compared to official AWSs; AiOWSs often have suboptimal siting, and exhibit unmonitored and uncorrected instrument drifts. Hahn et al. (2022) similarly note that some AiOWSs have temperature biases in excess of WMO guidelines often caused by solar heating or non-standard placement such as indoors or shielded locations. These issues have motivated the development of rigorous quality control (QC) methods (e.g., statistical bias corrections) to vet AiOWS observations prior to use (Nipen et al., 2020; Nipen et al., 2020). Nevertheless, confidence in raw data quality is lowered by these issues, underscoring the need to benchmark AiOWSs against reference instruments under real-world conditions.
The influence of solar radiation on temperature measurements from unaspirated radiation shields represents one of the most widely documented sources of positive temperature bias in AiOWSs. Unlike professional AWSs, which use active ventilation, and/or large multi-plate radiation shields, compact AiOWSs typically use small passive, unventilated housings that can trap solar energy and warm the sensor above ambient air temperature. Under high solar irradiance and low-wind conditions, this radiation-induced bias can exceed 1–2 °C (Nakamura and Mahrt, 2005; Huwald et al., 2009), with the magnitude strongly dependent on wind speed: still-air conditions eliminate convective heat loss from the shield and maximise the warm bias. Cornes et al. (2020) demonstrated that statistical post-processing can substantially reduce this radiation-induced bias from crowdsourced temperature data, but such corrections require concurrent measurements of solar irradiance and wind speed, which are not always available from AiOWSs deployed in citizen-science networks.
Systematic humidity sensor drift is a well-documented characteristic of the polymer-film capacitive sensors used in virtually all compact AiOWSs. Bell (2015) conducted an in-service drift study and found that AiOWS humidity sensors exposed continuously to outdoor conditions developed increasing positive bias at low-to-mid range humidity values, alongside growing negative bias at near-saturation conditions (> 90 % RH). The mechanism involves progressive contamination of the polymer film, heat-induced degradation of the hygroscopic coating, and thermal cycling of the capacitive element. Ingleby et al. (2013) identified similar drift signatures in operational surface weather station networks and recommended at minimum annual recalibration for humidity sensors exposed to maritime or humid continental climates. These findings are particularly relevant for the Netherlands, where RH frequently exceeds 90 % and maritime air masses dominate. Lower-cost sensor designs, such as those found in the Netatmo weather station, are particularly susceptible: moisture can ingress into the sensor housing and temporarily oversaturate the capacitive element, causing the instrument to report near 100 % RH for extended periods even after conditions have returned to ambient (Bell, 2015). This failure mode has implications not only for RH accuracy itself, but also for derived meteorological quantities such as Wet Bulb Globe Temperature (WBGT), which is of particular importance in tropical and sub-tropical environments where heat stress monitoring is critical.
Long-term precipitation measurement reliability in unattended AiOWSs has received comparatively less systematic attention than temperature or humidity. Segovia-Cardozo et al. (2023) provide a comprehensive review of tipping-bucket rain gauge uncertainties, identifying wind-induced undercatch, evaporation losses, and mechanical wear as primary error sources in unattended instruments.
The aim of this work is to quantify how closely compact AiOWSs approach WMO performance guidelines, and to assess their sensor longevity and failure modes observed both in our experiment and also reported in the literature. This paper publishes data from an opportunistic AiOWS evaluation experiment conducted at the test field of KNMI in De Bilt, the Netherlands using the following AiOWSs: Davis VP2, Davis VVue, METER ATMOS41, Lufft WS601, Vaisala WXT520. By directly benchmarking compact AiOWSs against standard meteorological instruments, our aim is to understand the practical accuracy and longevity limits of a selection of commonly used AiOWS models. We report observations on sensor accuracy and long-term drift from the literature and from our long-term field experiment, focusing on temperature, humidity, wind, and precipitation measurements.
2.1 AiOWSs included in study
We test seven AiOWS units comprising five distinct models: Davis VP2 (two instruments, TX1 and TX2), Davis VVue (TX7 and TX8), METER ATMOS41, Lufft WS601, and Vaisala WXT520.
An overview of the technical specifications of each AiOWS, including power source, temporal resolution, and precipitation measurement principle, is provided in Tables 1 and 2.
Table 1WMO classification of measurement accuracy for AiOWSs, adapted from World Meteorological Organization (2018).
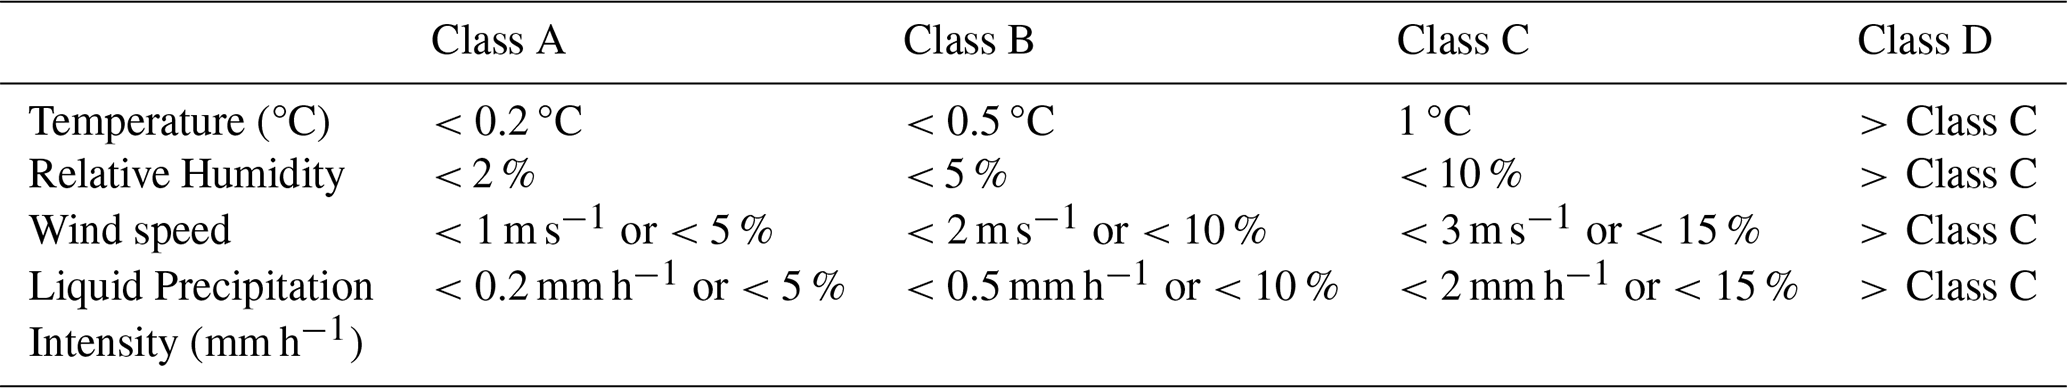
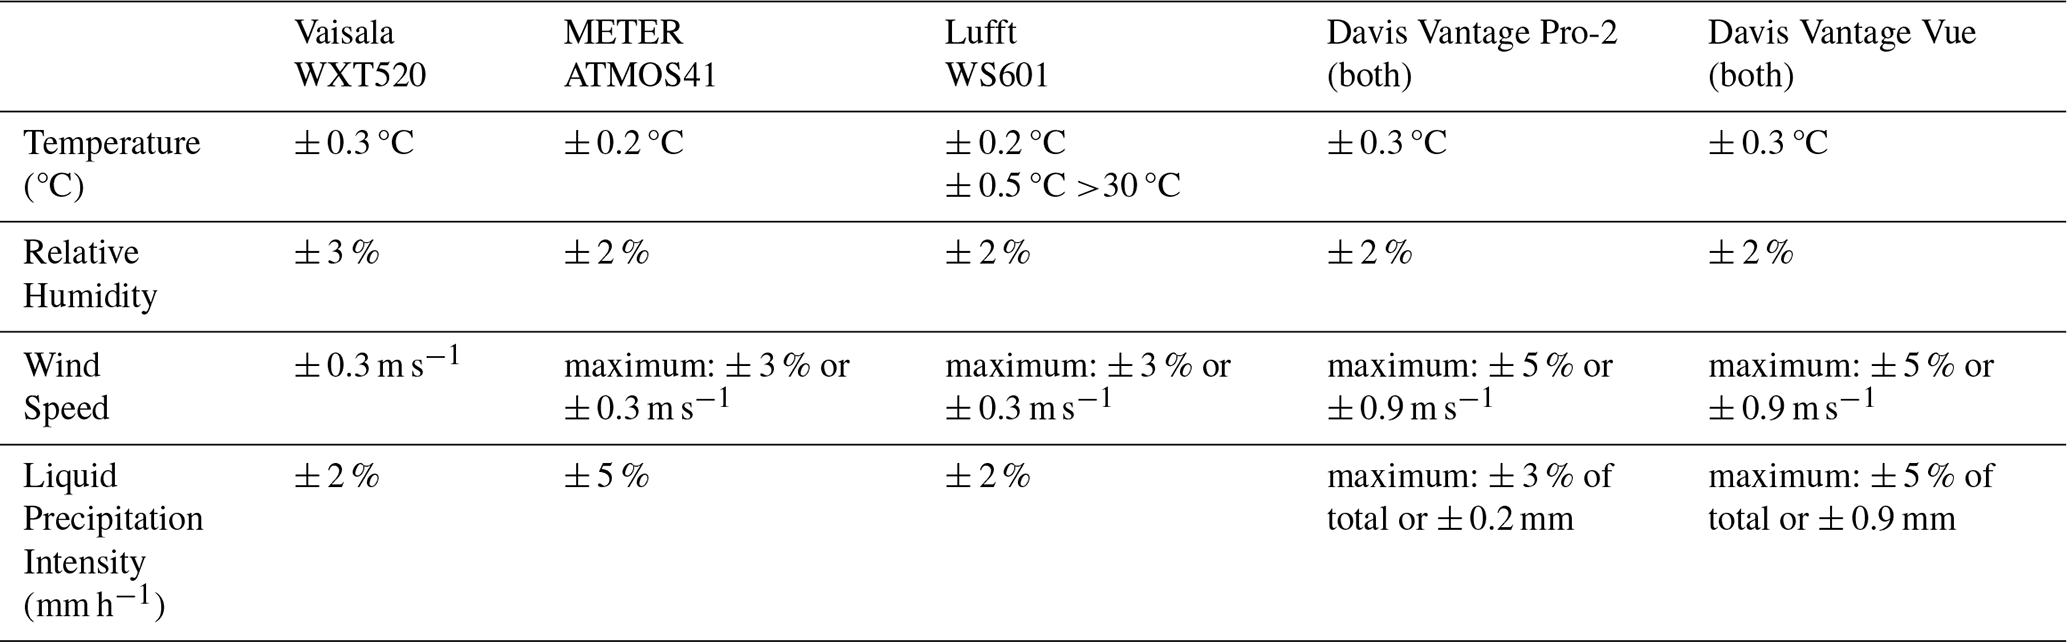
Table 2AiOWS measurement accuracy, as specified by the manufacturers' and confirmed at initial calibration laboratory testing.
2.2 AiOWS placement and AWS co-location
The opportunistic AiOWS evaluation experiment was conducted at KNMI's test field in De Bilt, the Netherlands (Fig. 1). Each AiOWS was initially assessed in the KNMI calibration laboratory – using a climate chamber, wind tunnel, and rain simulator – before being deployed in the field with minimal maintenance for multiple years. The AiOWS models mounted in open terrain at heights between 1.2 and 1.6 m. The study represents a “worst-case” scenario typical of many end users: no instrument maintenance, cleaning, or mid-deployment recalibration was performed.
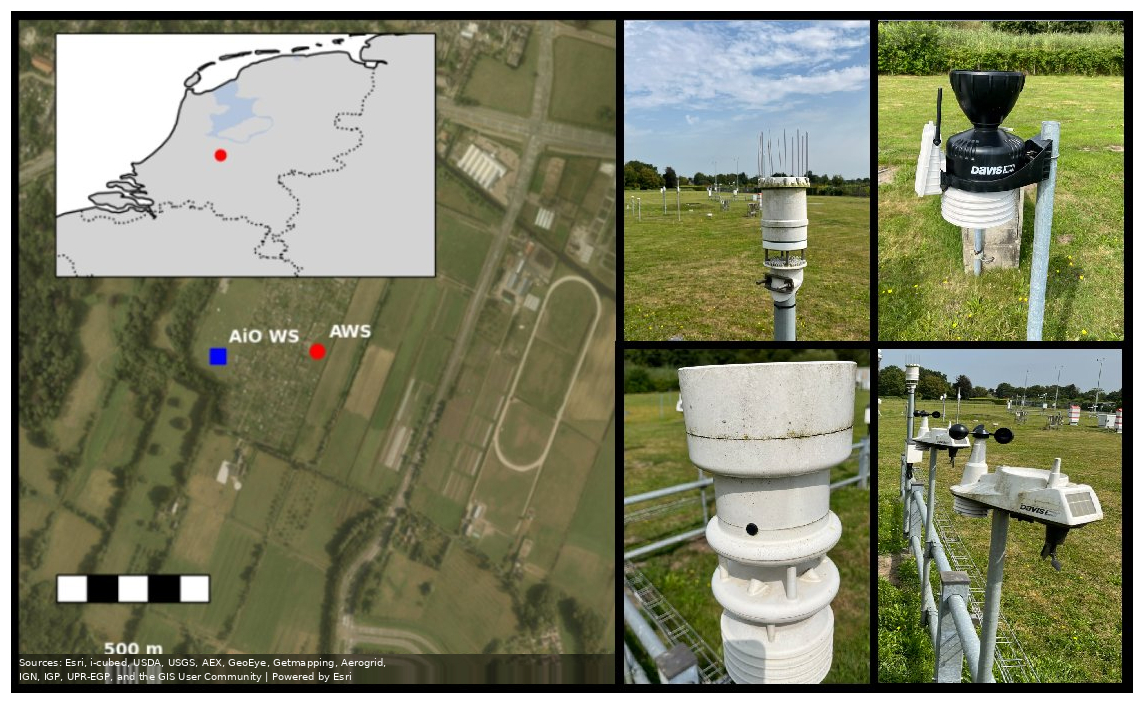
Figure 1Left: Satellite image of the KNMI testfield. The AiOWSs, and AWS 06261, are indicated with a blue square; AWS 06260 is indicated with a red circle (approx. 200 m apart). Inset shows a map of the Netherlands indicating the location the testfield (52.099° N, 5.176° E). Right: Photographs of the aged AiOWSs at the testfield. Satellite imagery: Esri, Maxar, Earthstar Geographics, and the GIS User Community
Throughout the multi-year deployment, we compared colocated AiOWS data with high-quality AWS measurements to detect biases, sensor drift, and data gaps. All observations from AWS 06260 are fully calibrated to WMO AWS standards.
This approach follows prior field comparisons of AiOWS, such as Jenkins (2014) and Bell (2015) who co-located Davis and Fine Offset stations for 1 year, and Bell (2015), whose multi-month comparisons tested amateur rain gauges against certified Hellmann gauges.
2.3 Laboratory Calibration
Prior to deployment, each AiOWS underwent calibration laboratory testing to quantify baseline accuracy, operational range, and to verify consistency with manufacturer specifications. All AiOWSs tested initially met manufacturer specifications (Table 2). After being deployed in the field for a minimum of 5 years, the AiOWS were removed and reassessed in the calibration laboratory.
Temperature sensors were tested in a climate chamber using 5 °C incremental steps from −15 to +50 °C under 20 % relative humidity with no wind or irradiation. Each step is held for 1 h to reach full equilibrium and noting the 1 min average measurement at the end of the hour. Relative Humidity (RH) testing involved making 10 % RH step increments between 17 % and 97 % RH at a constant 20 °C temperature and no wind or irradiation. Equilibrium procedure as was done for temperature. Assessment of wind speed accuracy was completed within a wind tunnel, where the wind speed was adjusted from 1 to 19 m s−1 in 2 m s−1 increments. Measurement was taken after 1 to 2 min at stable reference speed. Finally, 10 mm of simulated rainfall was applied three times to each of the functioning AiOWS, to assess precipitation measurement accuracy.
3.1 AiOWS Life Span
Both Davis VVue units (TX7 and TX8), and the METER Atmos41 remained functional at the end of deployment (10 years TX7 and TX8, 5 years for the METER). The Vaisala remained active for >13 years in the field, eventually failing in July 2024 and prompting the finalisation of this research.
In contrast, both Davis VP2 units (after 7 years, 4 months TX1, 6 years, 8 months TX2) and the Lufft WS601 (after 4 years, 2 months) ceased transmitting data. The Davis VP2 both had rain gauge failures very early on in deployment, and no reliable rainfall information was collected for the entire deployment. Both Davis VP2s (TX7 and TX8) solar panel covering plastic had become discoloured, and upon removal of this plastic covering and insertion of a new battery, both became partially functional again. The Lufft WS601 partially recovered functionality in the lab, transmitting only rain gauge data. Evidence of substantial internal corrosion was found in the Lufft WS601 (Fig. 2d), possibly due to moisture intrusion. The Vaisala remained functional for temperature and humidity until the final month of operation on the test field. The unit failed, and could not be revived for subsequent testing in the calibration laboratory. However, we note that the Vaisala had operated for more than 13 years without maintenance, showing the potential lifespan of AiOWSs, as well as the risk of “zombie” instruments (i.e. those that have been uncalibrated for many years but still actively broadcasting data), potentially increasing uncertainty in data quality for networks of AiOWS.
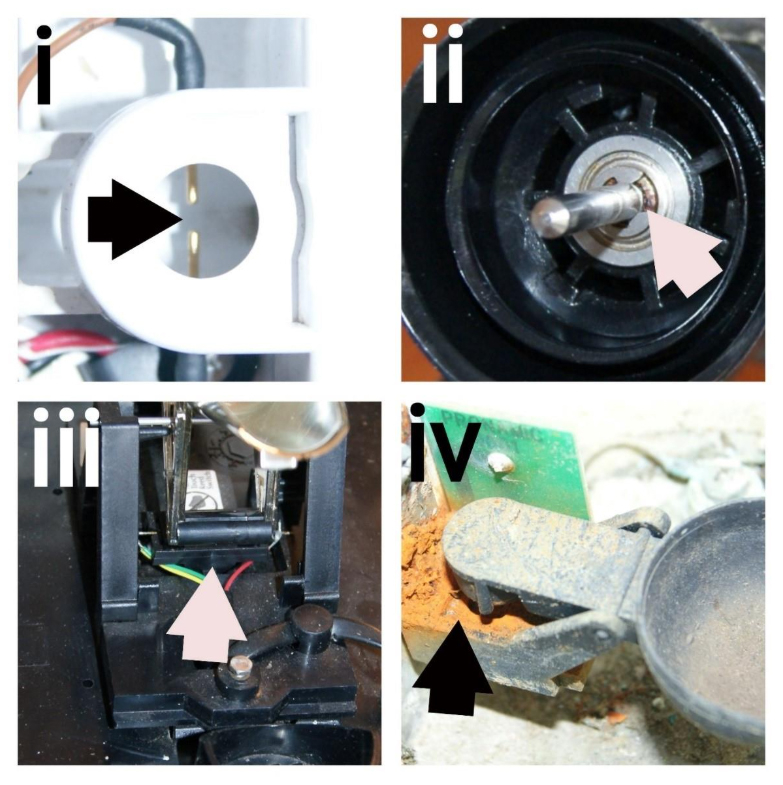
Figure 2Photographs of AiOWS at the end of their deployment, showing failed or damaged parts. (i) METER's drop counter system, using two gold plated electrodes. (ii) Corrosion of the sealed ball bearing supporting the cup anemometer on the Davis VP2 instrument. (iii) Failed reed switch on the Davis VP2. (iv) Corrosion on circuit boards and tipping bucket rain gauge in the Lufft.
Both Davis VP2 units continued to transmit temperature, humidity, and wind speed data, but their tipping bucket rain gauges' magnetic reed switches failed (Fig. 2c), a known fragile component in outdoor environments (Segovia-Cardozo et al., 2023). Newer Davis VVue and updated VP2 models utilise more robust Hall-effect sensors in their tipping bucket rain gauges, perhaps resulting in the longer life spans observed in TX7 and TX8. Although the METER provided temperature, relative humidity, rainfall, and wind speed at deployment's end, only temperature and humidity measurements were considered reliable; wind speed and rainfall data were implausible.
At the end of the deployment, it was found that no signal was able to be generated from either reed switch, potentially indicating failure or corrosion of the Davis VP2's wiring and soldered connectors (Fig. 2c).
3.2 Laboratory Calibration Post-Deployment
For all aged AiOWSs that remained functional, Fig. 3 shows the laboratory observed measurement accuracy (see also Table 2 for initial quality/manufacturer's specifications).
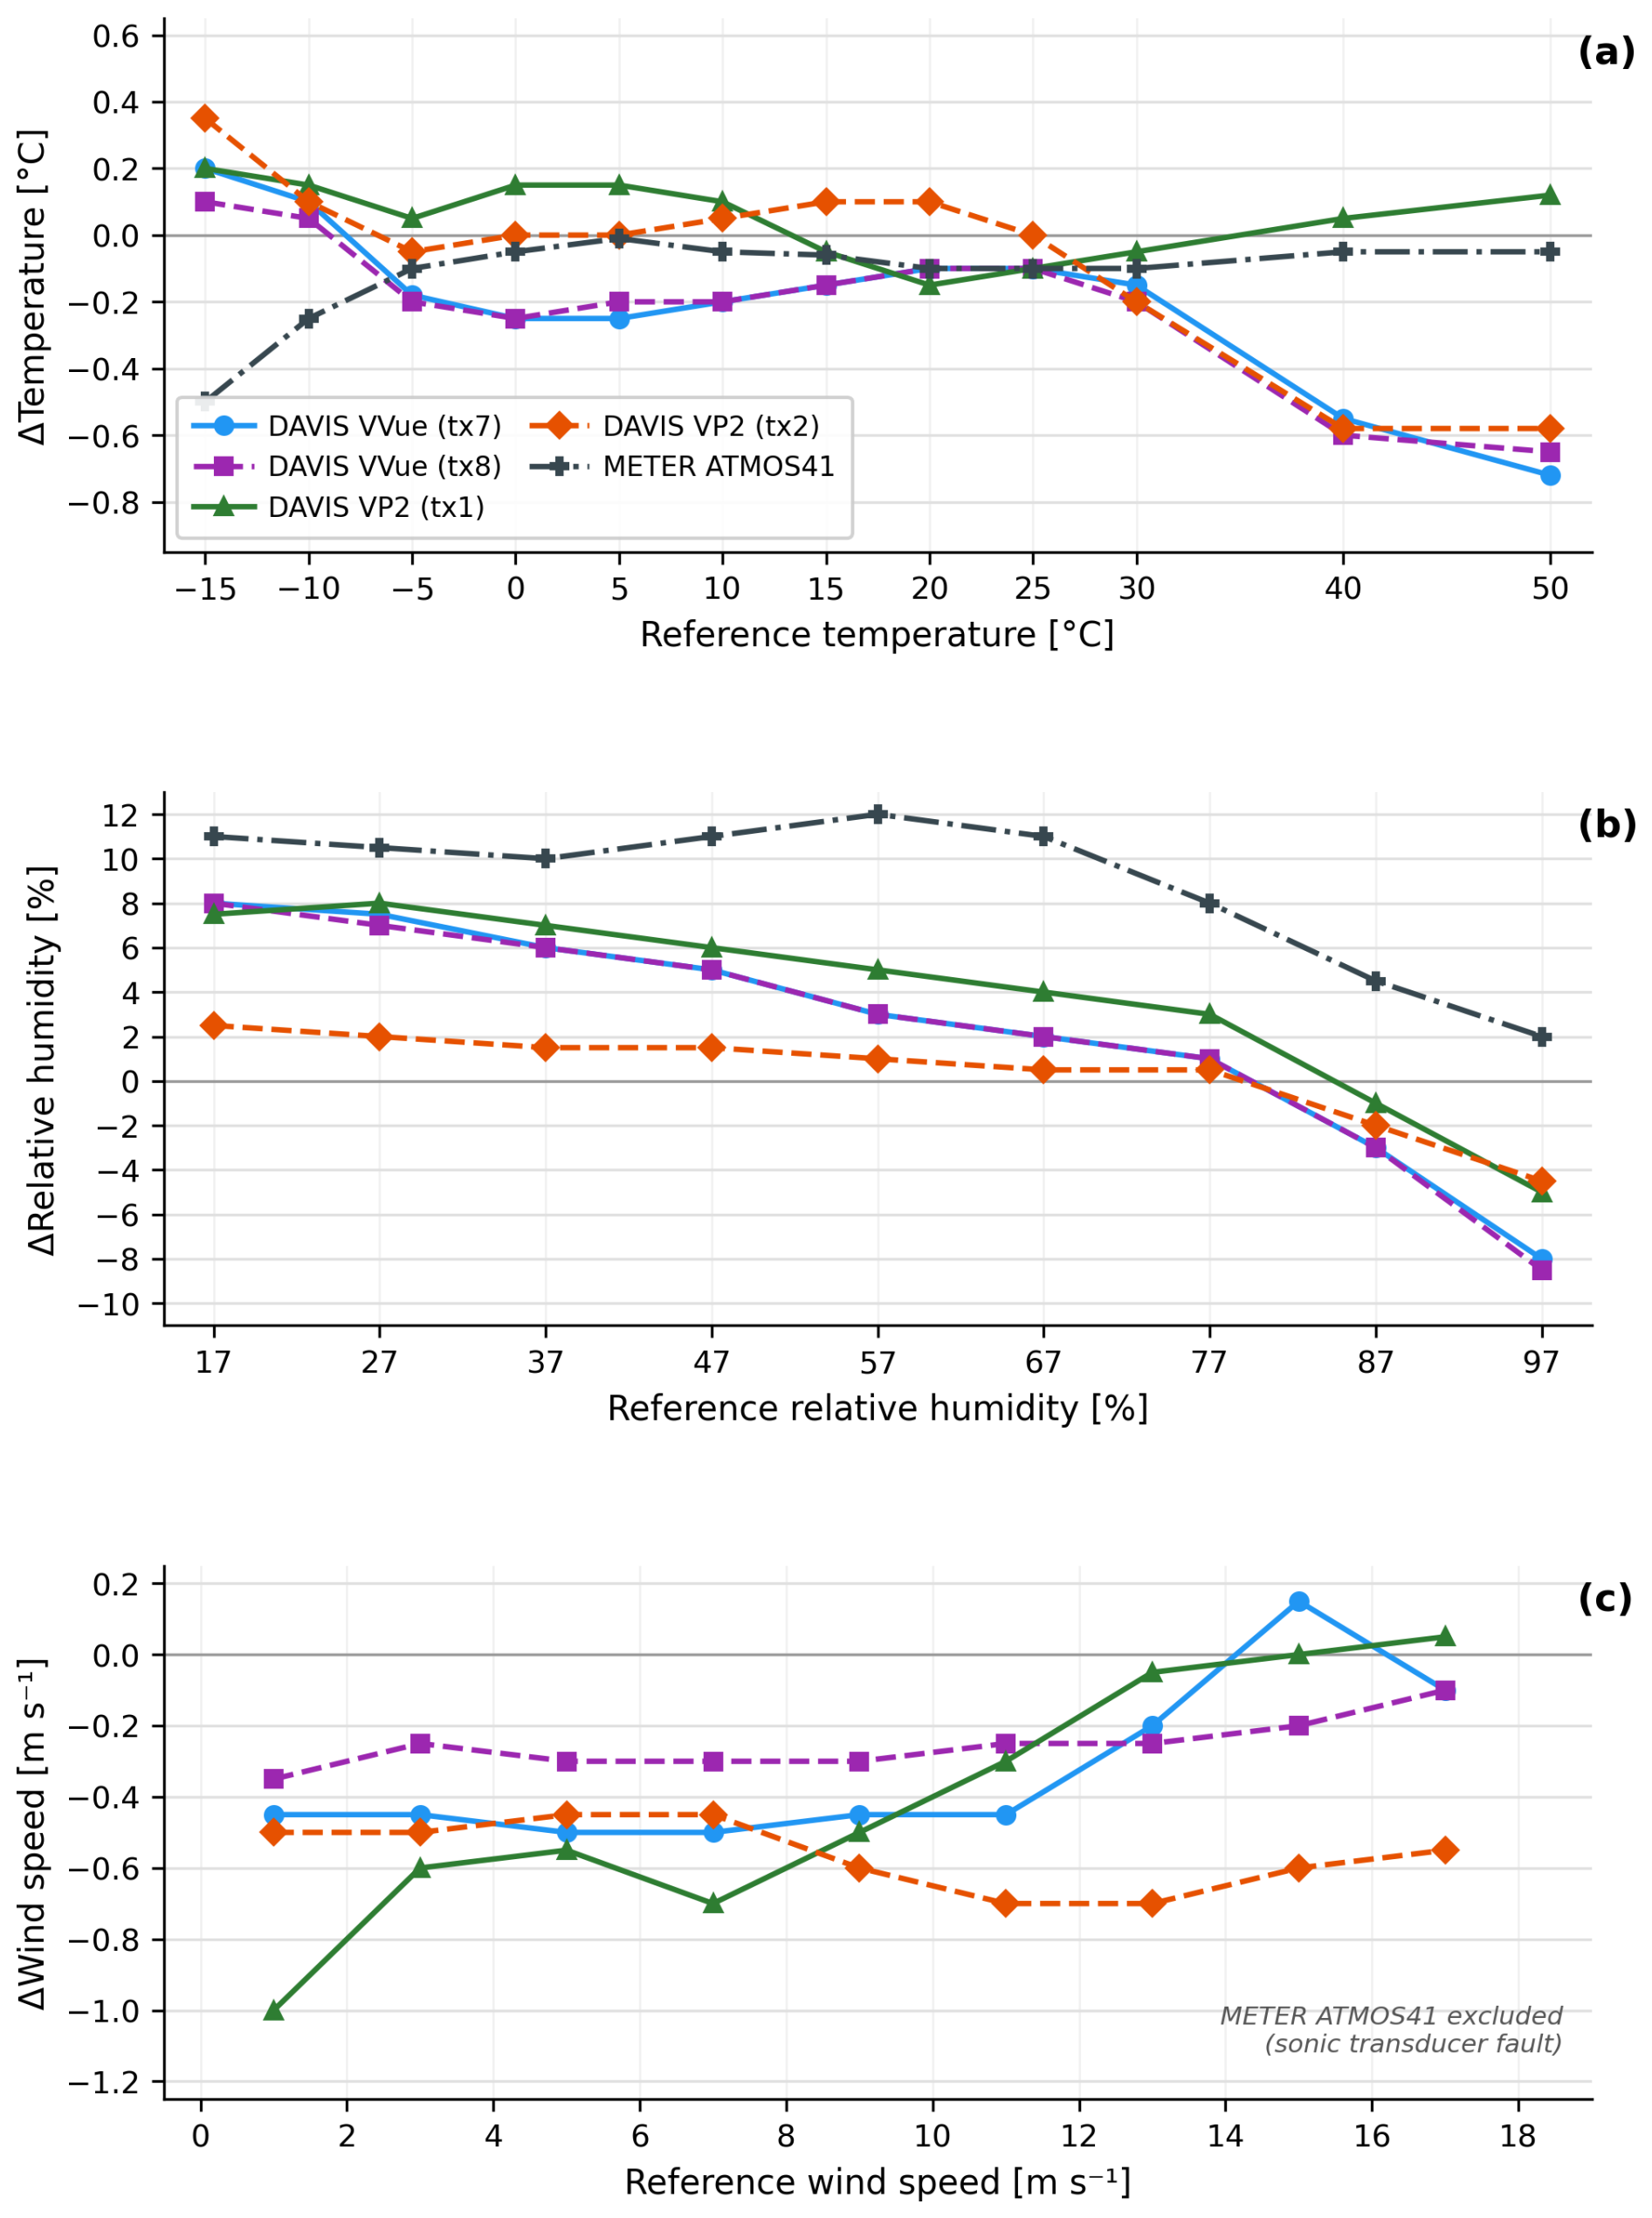
Figure 3Measurement difference of each AiOWS from the laboratory reference. (a) Temperature (°C), (b) relative humidity (%), (c) wind speed (m s−1).
3.2.1 Air Temperature
All AiOWSs adhered closely to specifications within the 0–30 °C band (Table 2). The aged AiOWS showed best performance within −15 to 30 °C, but above 30 °C, temperature was typically underestimated (Fig. 3a). All Davis AiOWSs (TX1, 2, 7 and 8) had less than 0.3 °C errors between −15 to 30 °C, whilst above 30 °C all Davis and the METER AiOWS underestimated by 0.5 to 0.7 °C. Although laboratory tests for the aged Lufft AiO WS were unavailable, Fenner et al. (2021) reported good precision (± 0.1 °C) for Lufft WS700UMB, consistent with the new unit tests prior to deployment in this study. Due to non-operation status, the Vaisala (and aforementioned Lufft) were not tested post-deployment for air temperature.
3.2.2 Relative Humidity (RH)
Post deployment, all AiOWSs demonstrated similar trends: measured RH started to drop relative to the reference above ∼ 60 % to 70 % RH. The METER performed poorest at low RH but accuracy improved at higher RH values (Fig. 3b). Davis TX1, 2, 7 and 8 RH sensors transition from slight overestimation at low RH to underestimation above 70 %, mirroring findings with Bell (2015) in their 2-year drift study.
Due to non operation status, the Lufft and Vaisala were not tested post-deployment.
3.2.3 Wind Speed
Post-deployment, all Davis VVue (TX7, 8) and VP2 (TX1, 2) anemometers underestimated wind speed, particularly below 3 m s−1. One of the METER sonic transducer pairs malfunctioned, recording constant 2 m s−1 easterly wind at zero real wind speed, and was excluded from further tests (Fig. 3c).
Davis VVue TX7 and TX8 improved accuracy at higher wind speeds (>10 m s−1). The two Davis VP2 units performed differently compared to each other: TX2 worsened with increasing speed, attributed to a rusted bearing evident in the wind tunnel run-up test (Fig. 2b), while TX1 slightly improved, similarly to the TX7 and TX8, indicating that aging of the cup and vane does not result in a consistent drift or offset that can be corrected at a later data processing stage. Lufft, METER and Vaisala AiOWS were not tested, due to aforementioned malfunction.
Low-wind bias agrees with Droste et al. (2020), who found AiOWS cup anemometers often fail to register light breezes. Davis VVue and VP2 devices slightly improved at mid-range speeds (5 to 12 m s−1), whereas Vaisala WXT520 showed a steady −0.5 m s−1 offset. After 8 years, no aged units provided reliable wind data, confirming mechanical wear and bearing corrosion degrade cup/vane accuracy, while sonic anemometers suffer from transducer failures.
3.2.4 Precipitation
The two Davis VVue units performed within specifications, with the VVue TX7 performing with a −1 % error (TX7 measurement vs applied rainfall amount), and the TX8 performed with a −5 % error. Although the reed-switch mechanism worked moderately well when initially assessed (−5 % error for TX8), both Davis VP2 units failed almost immediately in the field.
The Lufft AiOWS displayed good accuracy (3 % error), but we did observe some sticking within the tipping bucket mechanism during the test; where water overflowed the bucket and hence was not counted as part of the measurement. Interior corrosion of the tipping bucket was evident upon disassembly (Fig. 2d).
The METER AiOWS uses a drip counting mechanism; with the number of drips counted per second relating directly to liquid precipitation entering the funnel. Initial tests conform to WMO standards. However, upon removing the aged METER from the testfield, we observed that the funnel was clogged with dust and insect debris, resulting in a delay in rain being fed into the drip counting mechanism (Fig. 2a). We attempted to clear the debris, and lightly clean the contacts within the drip counting mechanism. However, this did not resolve the issue, and the unit continued to report inaccurate rainfall. The mechanism is calibrated to form drips of a precise volume; if the drip volume deviates from specification – whether through fouling of the nozzle, partial blockage, or sensor aging – the counted drips will no longer accurately represent the rainfall rate, resulting in systematic under- or overestimation.
3.3 Field Performance
3.3.1 Temperature
In the field, all AiOWSs showed systematic temperature biases relative to the co-located KNMI AWS (Fig. 4). To isolate the contribution of solar radiation to these biases, hourly temperature differences (AiO minus AWS) were stratified by global solar radiation measured at the AWS and by concurrent wind speed, following the technique described by Bell (2015). Under all wind conditions, the two Davis VVue units (TX7 and TX8) showed a clear radiation-dependent warm bias: below 100 W m−2 the bias was near-neutral (≈ +0.1 °C), rising to +0.4–0.7 °C at irradiances exceeding 600 W m−2. This pattern is consistent with solar heating of the compact, passive radiation shields used in these instruments, as documented by Nakamura and Mahrt (2005), Huwald et al. (2009) and Bell (2015). Under low-wind conditions (≤ 1.5 m s−1), the warm bias at high irradiance intensified by a further 0.1–0.2 °C, confirming that convective ventilation from wind substantially mitigates radiation-induced heating of the radiation shield.
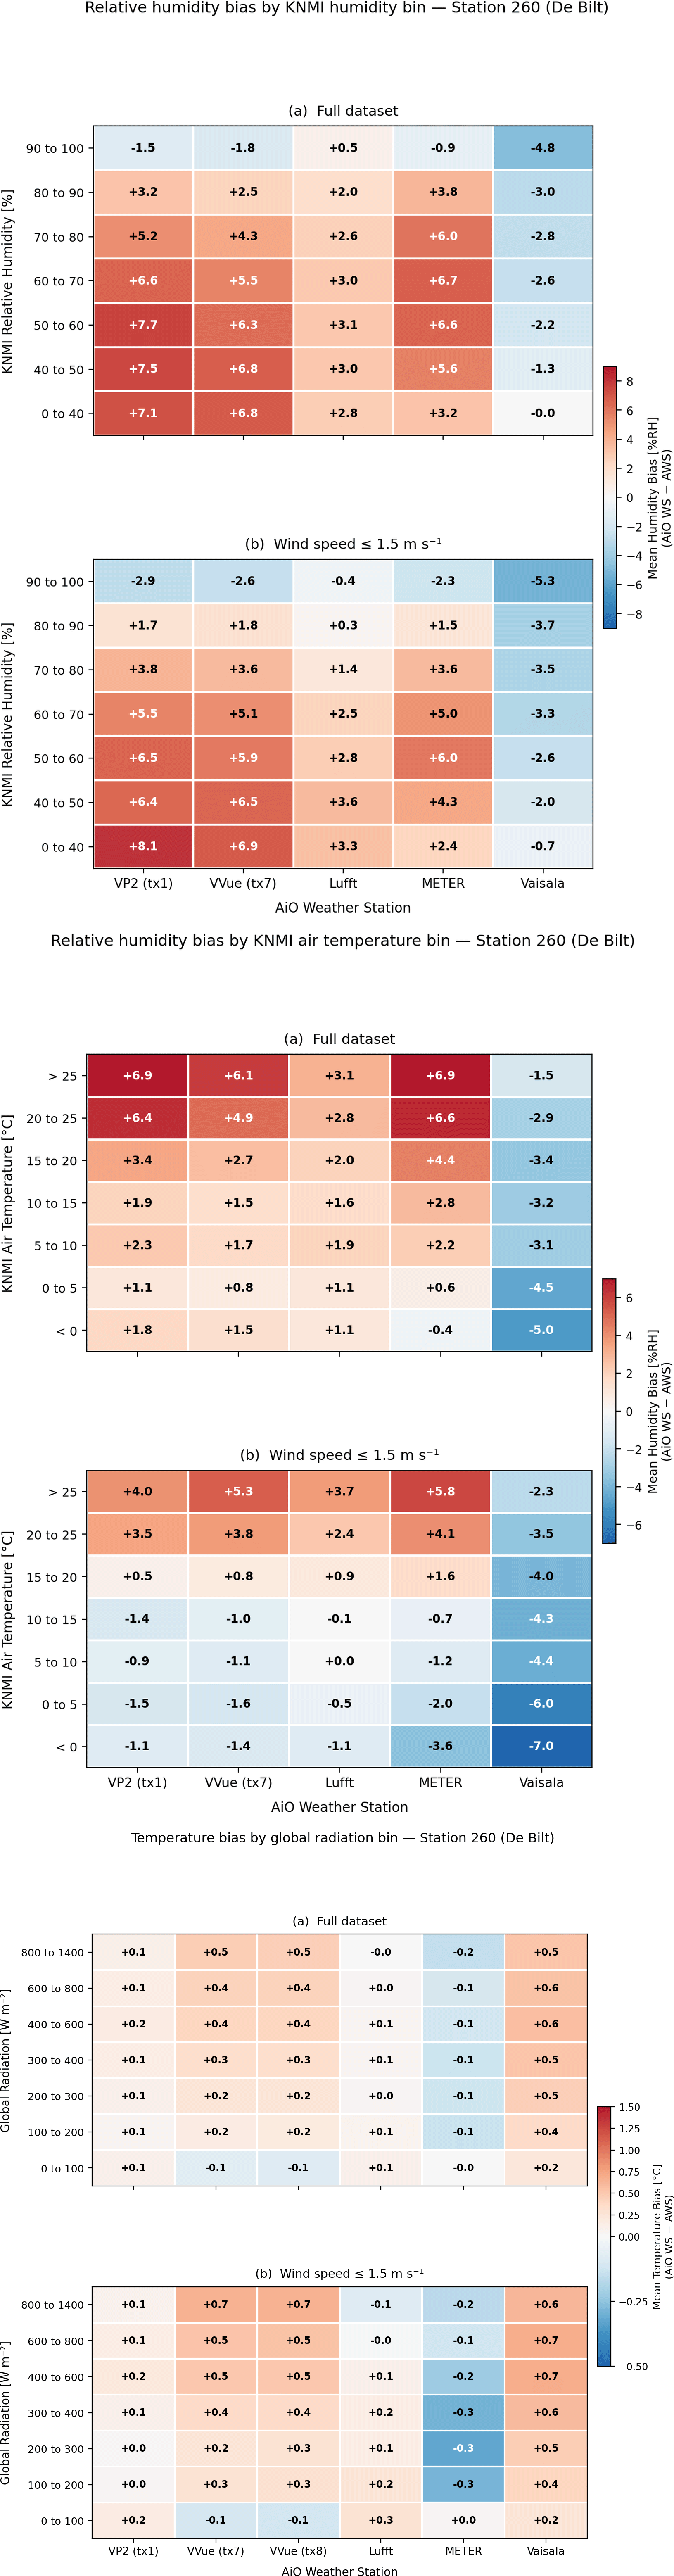
Figure 4Top: Relative humidity bias from the AiOWSs relative to the collocated AWS, stratified by KNMI reference Relative humidity in 10 % bins (full dataset above; low-wind subset ≤1.5 m s−1 below). Middle: Relative humidity bias stratified by KNMI reference air temperature in 5 °C bins (full dataset and low-wind subset as above). Lower: Temperature bias from the AiOWSs stratified by AWS global radiation (full dataset and low-wind subset as above).
The Vaisala WXT520 showed a warm bias across all radiation bins (approximately +0.2–0.6 °C), largely independent of solar irradiance. This suggests a stable instrumental offset rather than a radiation-induced artifact. The METER AiOWS, whose temperature data is subject to an internal algorithmic processing correction, showed a slight cold bias under calm conditions (−0.1 to −0.5 °C), perhaps suggesting that METER's processing correction is not entirely optimised for this particular instrument siting or not performing as intended.
The Lufft WS601 and Davis VP2 (TX1) were the most accurate, with biases generally within ± 0.2 °C across all irradiance bins. This is likely due to the large radiation shield fitted to the Davis VP2, and the active (fan driven) ventilation of the temperature and humidity sensors within the Lufft WS601.
3.3.2 Relative Humidity
Relative humidity biases in the field showed clear dependence on air temperature and wind speed conditions. For the Davis VP2 (TX1), Davis VVue (TX7), Lufft, and METER, a systematic positive RH bias was observed at moderate to high air temperatures: biases reached +4 % to 10 % RH in the 15–25 °C temperature range under calm-wind conditions (≤ 1.5 m s−1), compared to +2 %–6 % RH across the full wind speed range. This wet bias is consistent with passive radiation-shield warming of the sensor housing: at higher air temperatures and lower wind speeds, reduced convective ventilation allows the sensor enclosure to warm above ambient, causing the capacitive humidity element to report a RH value consistent with a warmer, drier air parcel than is actually present (Cornes et al., 2020). The effect is amplified under calm conditions because natural ventilation – the primary cooling mechanism in unaspirated shields – is insufficient to prevent heat accumulation.
The Vaisala WXT520 showed the opposite pattern: a persistent dry bias of approximately −2 % to −5 % RH, which remained stable across all temperature and wind speed bins. This systematic dry offset is consistent with an instrument-level sensor offset and an aging effect in the Vaisala's capacitive RH element, rather than a ventilation artifact which is discussed below. Stratification by KNMI reference RH (Fig. 4a) confirms this interpretation: the Vaisala's dry bias is consistent across all humidity bands from 0 %–40 % to 80 %–90 %, irrespective of the prevailing temperature or wind conditions.
A particularly important feature is observed in the 90 %–100 % RH bin (Fig. 4a): all stations show a reversal to a negative (dry) bias under near-saturated conditions, most strongly in the Vaisala (−4.8 % RH in the full dataset, −5.3 % RH under calm-wind conditions). This reversal is consistent with the known saturation-lag failure mode of polymer-film capacitive sensors described by Bell (2015): under near-saturated conditions, passive sensors tend to lag behind rapidly changing RH, underreading as conditions approach saturation and overreading once saturation events have passed.
Laboratory climate chamber results corroborated the field findings: all instruments underrecorded RH above 90 % and overrecorded RH below 70 %, consistent with the field-observed sign reversal at high humidity. A progressive worsening of the METER RH observations was noted across all RH bands during the later deployment years, suggesting that sensor deterioration may accelerate non-linearly with instrument age (Fig. 4; see also Sect. 3.4).
3.3.3 Precipitation
Daily precipitation totals from all AiOWSs with functioning rain gauges (VP2 TX1, Lufft, METER, Vaisala) were compared against the KNMI AWS daily total. Only days with AWS rainfall of at least 0.2 mm were included to exclude dry-day noise. The percentage difference relative to the AWS reference, stratified by daily rainfall amount, is shown in Fig. 5.
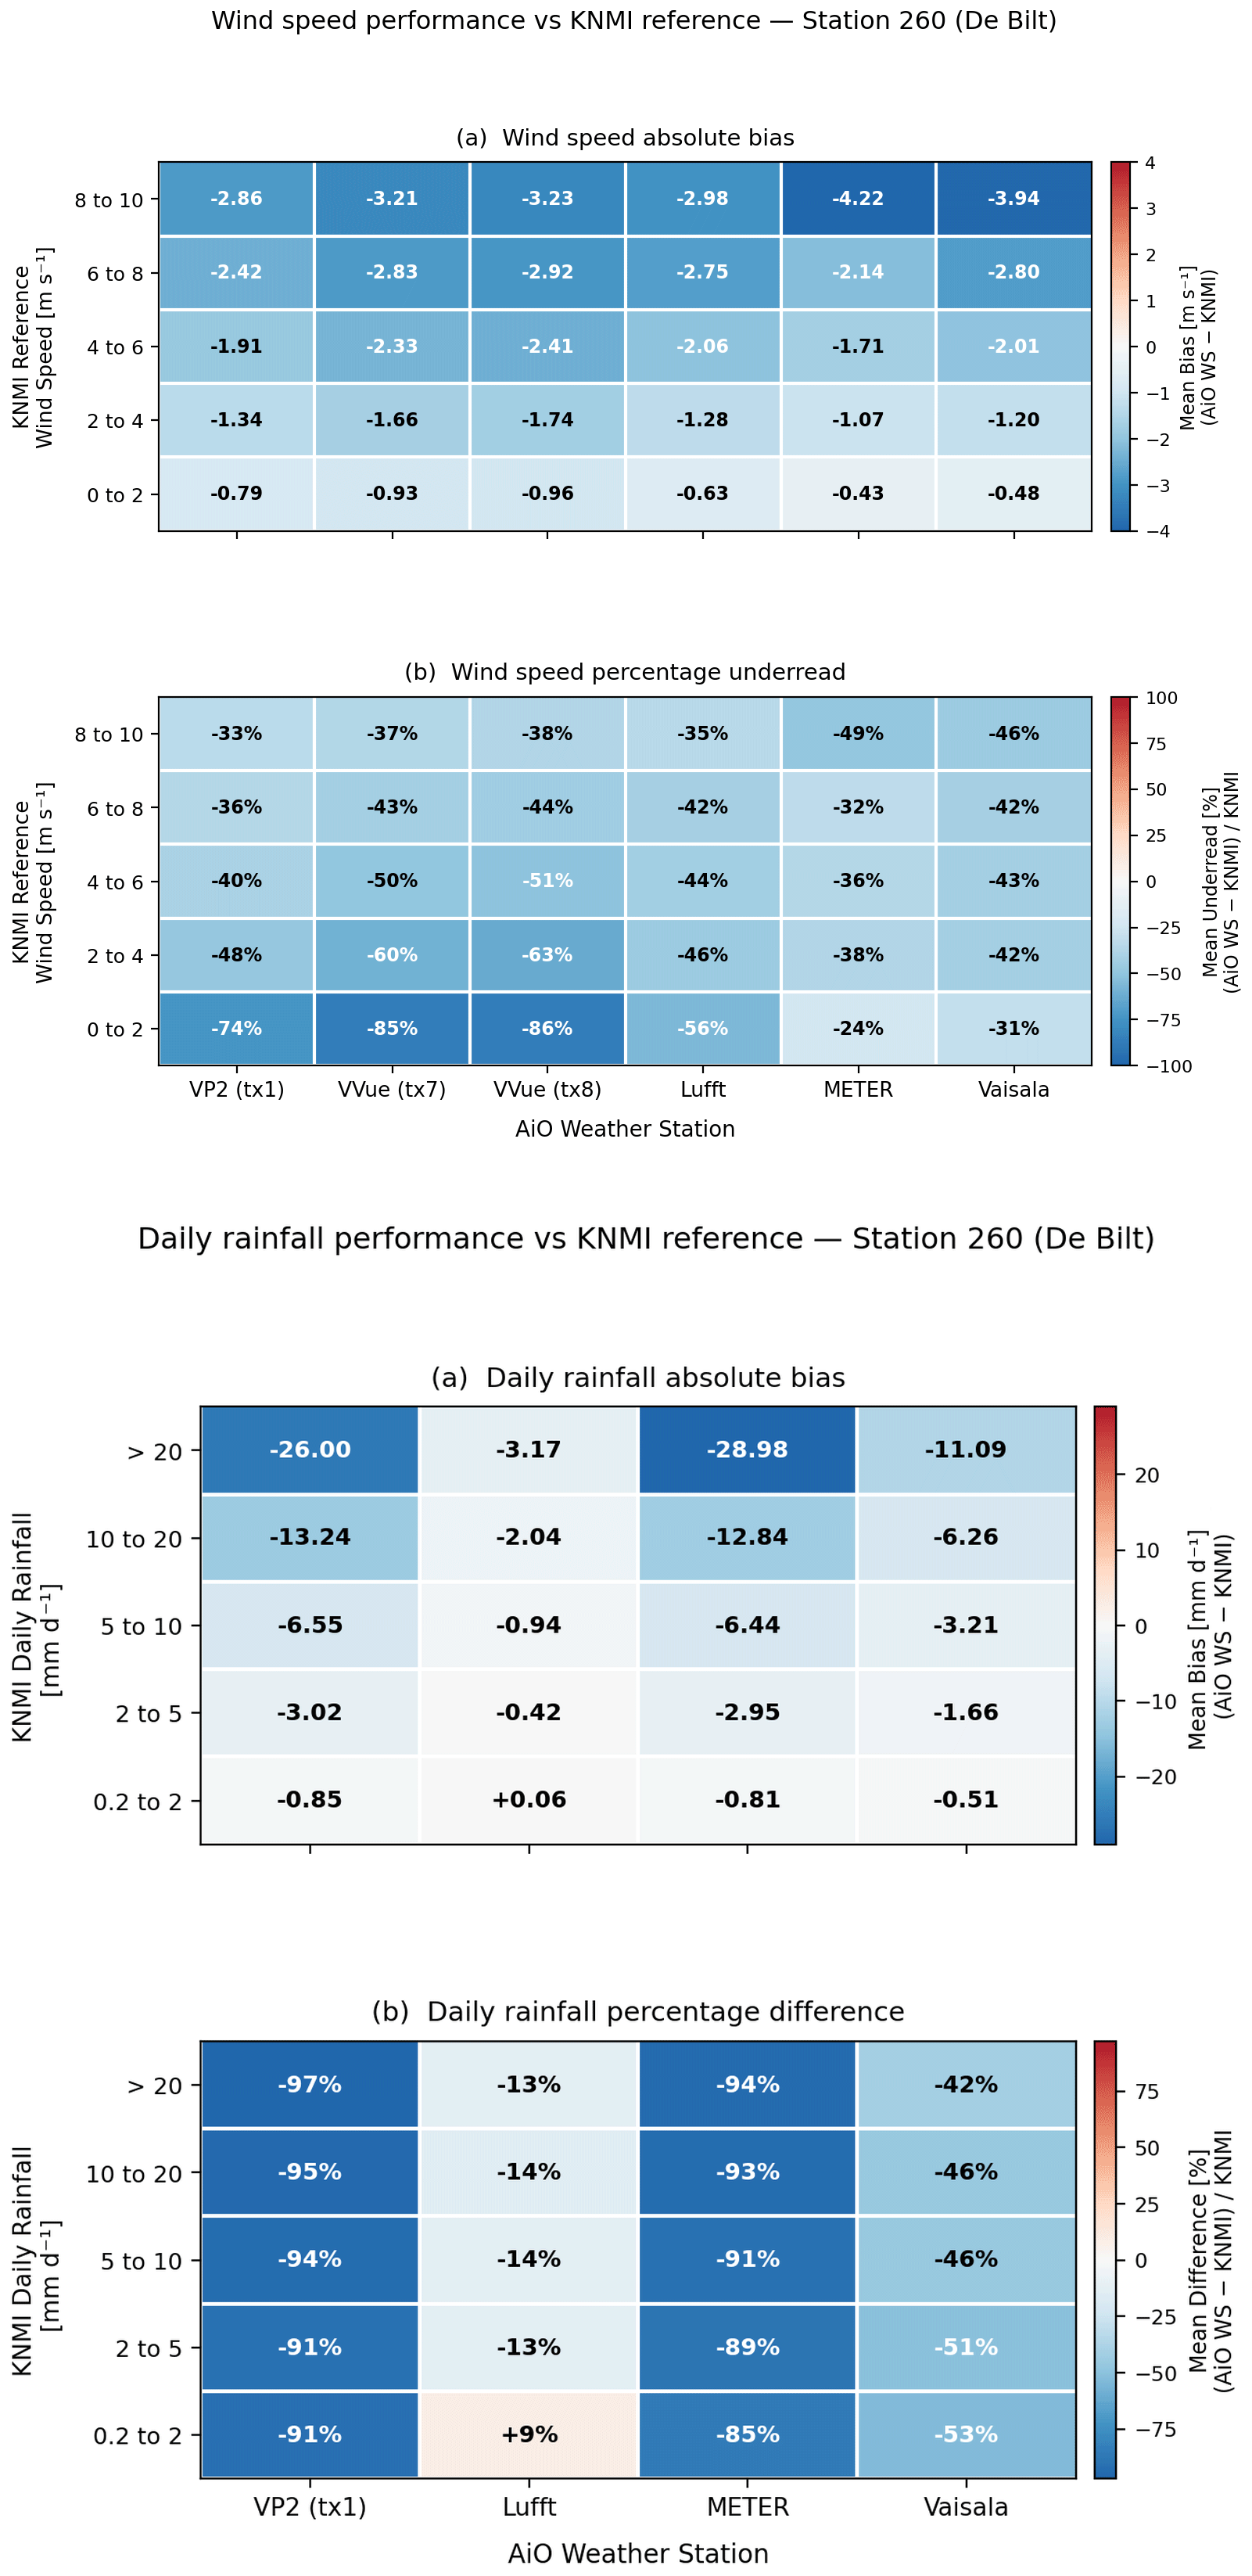
Figure 5Upper: wind speed bias observed in the AiOWS operating <2 m from the ground vs the collocated AWS operating at 10 m above the ground. Biases calculated for 2 m s−1 wind speed bins (with windspeed observed by the AWS anemometer). Lower: rainfall bias observed in the AiOWS versus the AWS rain gauge.
The Lufft WS601 was the best-performing station, with a mean percentage underread of −13 % to −14 % across all rainfall intensity bins. A slight positive difference (+9 %) was observed for the lightest events (0.2–2 mm d−1), possibly reflecting inaccuracies in counting tipping bucket events at low rainfall accumulations. The Vaisala WXT520 showed consistent undercatch of 42 %–53 %, largely independent of rainfall intensity, consistent with the known sensitivity of optical and haptic rain sensors to drop-size distribution effects and nozzle fouling (Segovia-Cardozo et al., 2023).
Both the Davis VP2 (TX1) and the METER showed near-total rainfall failure throughout most of their deployments respectively across all intensity bins. For the VP2, this reflects the early reed-switch failure described in Sect. 3.1, after which the instrument registered effectively zero rainfall on rainy days. For the METER, the values are consistent with failure of the drip-counting mechanism (Fig. 6). Event-based analysis confirmed low probability of detection for all instruments: Vaisala detected the majority of events but with large magnitude errors, while METER and VP2 detected very few events after the first year of deployment.
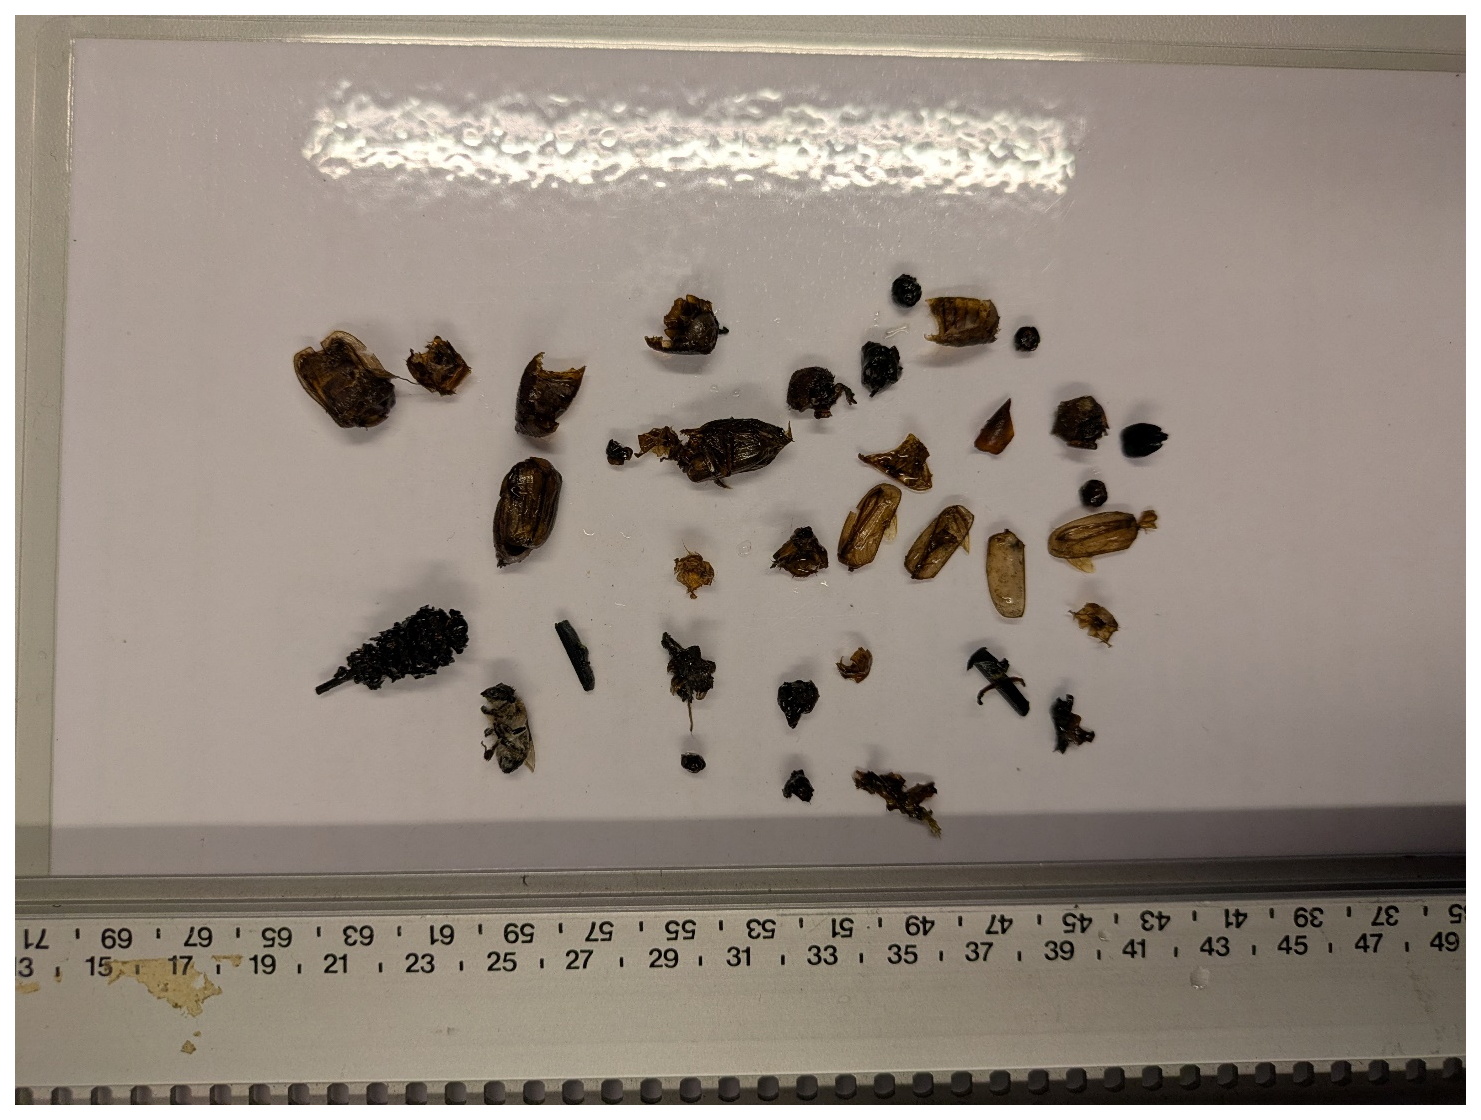
Figure 6Detritus found in Davis VP2 tipping bucket rain gauge after 7 years of operation. For scale a ruler (cm) is shown along the bottom.
3.3.4 Wind Speed
Direct comparison of AiOWS wind speed observations with the co-located KNMI AWS is complicated by the substantial height difference between the AiOWSs (approximately 1.5 m) and the AWS cup anemometer (10 m). Wind speed increases logarithmically with height under neutral stability, and the heterogeneous surface roughness of the KNMI test field precludes reliable analytical correction of the AWS observations to 1.5 m height (Stull, 1988). Nonetheless, the binned bias analysis shown in Fig. 5 provides useful information about the relative performance and degradation of each AiOWS anemometer across the wind speed distribution.
As is to be expected, all AiOWSs systematically underestimated wind speed relative to the 10 m AWS reference across all wind speed bins (Fig. 5), as anticipated given the height difference and surface roughness effects. The absolute bias ranged from −0.4 to −1.0 m s−1 at low winds (0–2 m s−1) to −3 to −4 m s−1 at the highest wind speeds (8–10 m s−1). The percentage underread was largest at low wind speeds (24 %–86 % at 0–2 m s−1) and converged towards a more consistent 33 %–49 % at 8–10 m s−1. The Davis VVue units (TX7 and TX8) consistently showed the largest underread across all wind bins, while the METER performed best at low wind speeds, consistent with the lower starting-threshold of its sonic anemometer compared to the cup-and-vane designs used in the Davis units (Droste et al., 2020).
Given the difficulty in comparing wind speeds recorded at differing heights, the most reliable assessment of anemometer degradation remains the wind-tunnel test described in Sect. 3.2.3. These findings are discussed further in Sect. 4.1.
3.4 Sensor Drift as a Function of Deployment Age
To understand long-term sensor drift from the meteorological and radiation-driven biases described in Sect. 3.3, we plotted monthly mean temperature and humidity biases – and 30 d binned daily precipitation percentage differences – against deployment age for each station (Fig. 7). This approach removes calendar-year effects and isolates aging-related trends from climate variability, following the methodology employed by Bell (2015) for humidity sensor drift assessment.
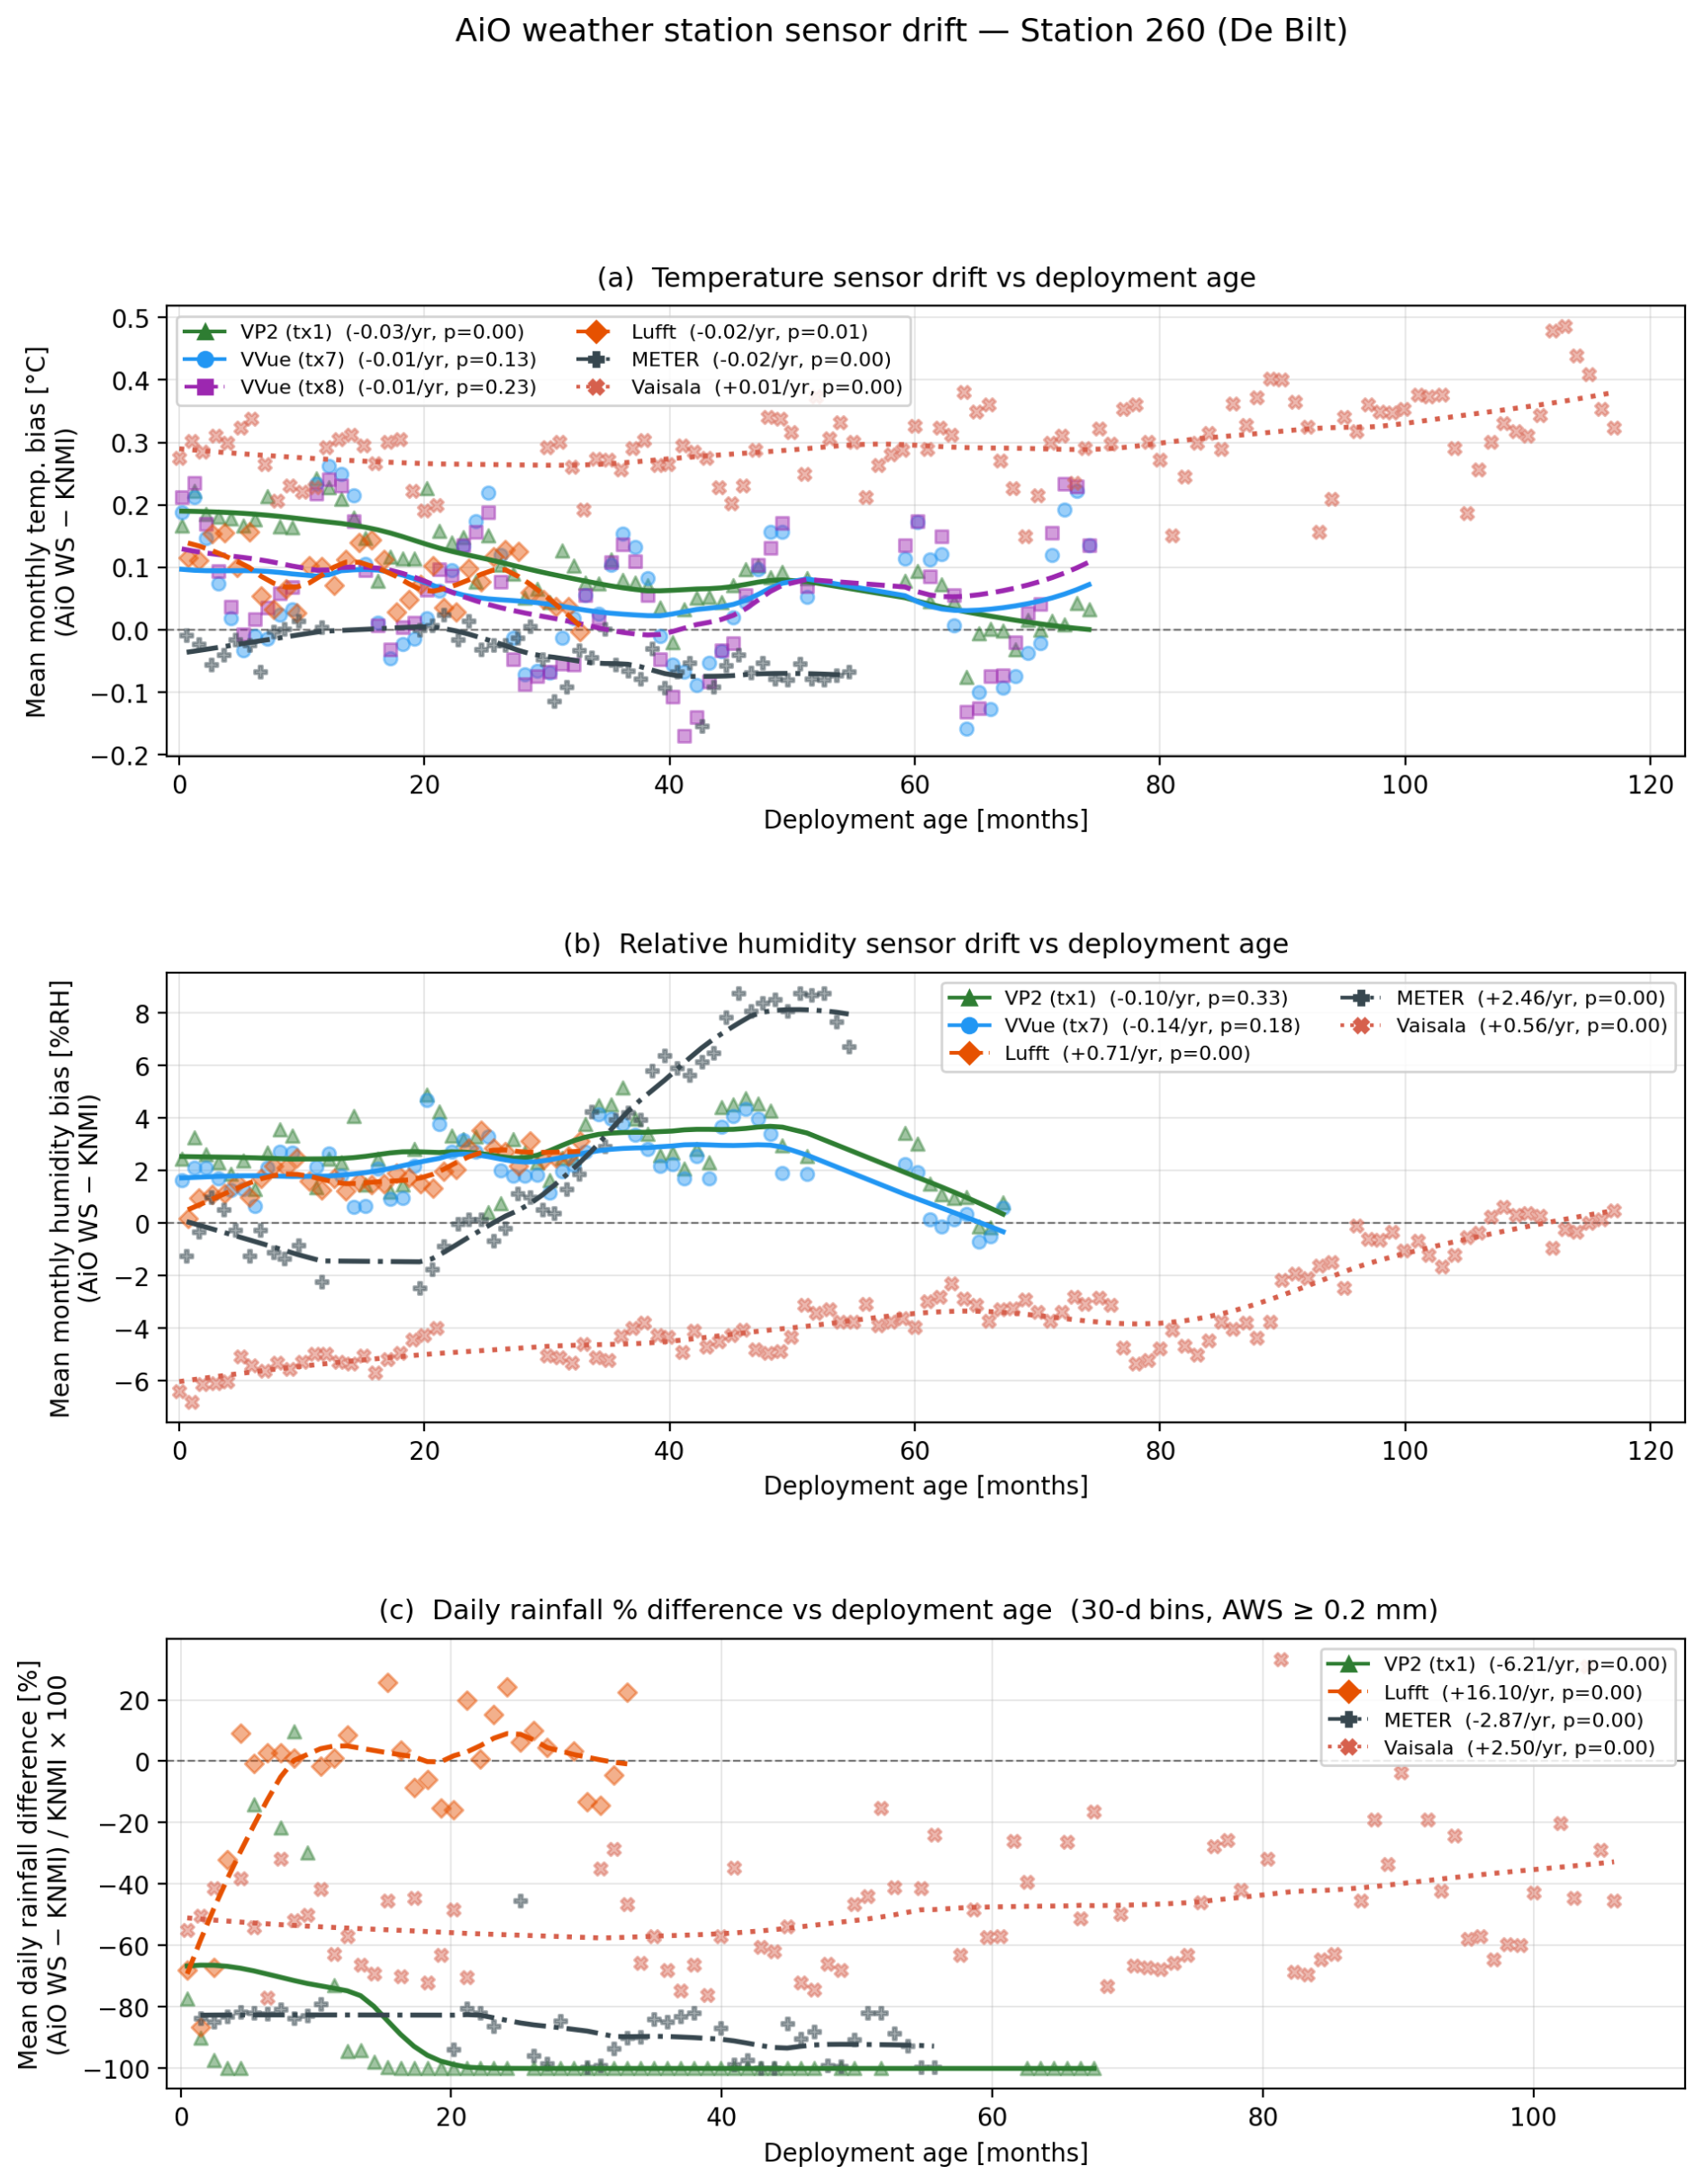
Figure 7Sensor bias as a function of deployment age (months since first valid data) for (a) monthly mean temperature bias (°C), (b) monthly mean relative humidity bias (% RH), and (c) 30 d binned daily rainfall percentage difference (%). Lines show LOWESS smoothed trends; legend shows linear drift rate per year and associated p value.
For air temperature (Fig. 7a), drift over deployment lifetime was modest for all instruments. Linear regression of monthly mean bias against deployment age gave drift rates of −0.03 °C yr−1 for the VP2 (TX1), −0.02 °C yr−1 for both Lufft and METER (both statistically significant, p<0.05), and +0.01 °C yr−1 for Vaisala (p<0.01). The Davis VVue units (TX7 and TX8) showed no significant linear drift (p>0.1), confirming that their seasonal bias pattern reflects radiation-shield effects rather than progressive thermistor degradation. The Vaisala's slowly increasing warm bias is consistent with mild thermal aging of its measurement element over its long deployment.
Humidity drift (Fig. 7b) showed far stronger and more variable time-dependent signals. The Vaisala WXT520 showed an interesting long-term drift recovery: the dry bias of approximately −6 % RH at deployment improved progressively towards zero over 9 years (+0.56 % RH yr−1, p<0.001). This behavior suggests both a poor initial calibration coupled with a gradual equilibration of the hygroscopic polymer film. In contrast, the METER showed large drift: a near-neutral bias at deployment increased rapidly to +8 % RH within 4 years (+2.46 % RH yr−1, p<0.001), perhaps consistent with progressive contamination of its capacitive sensing element as described by Ingleby et al. (2013). The Lufft showed a significant but more moderate positive drift (+0.71 % RH yr−1, p<0.001) over its 3-year deployment. Davis VP2 and VVue showed no statistically significant humidity drift (p>0.1), maintaining a relatively stable wet bias of approximately +2 %–3 % RH.
The daily precipitation percentage difference as a function of deployment age (Fig. 7c) showed large differences. The Davis VP2 (TX1) effectively reached −100 % almost from the very start of deployment (−6.2 % yr−1 linear trend driven entirely by reed-switch failure within the first months), confirming that its rain gauge failure was an early and complete breakdown rather than a gradual degradation. The METER showed a similar failure of the rain gauge, with observations falling to almost −100 % within the first 300 d, thus rendering precipitation data essentially useless. The Vaisala showed a slow but statistically significant positive trend (+2.5 % yr−1, p<0.001) across its deployment, improving from approximately −65 % to −35 % undercatch by the end of the record. The Lufft was notable for showing a strong non-linear improvement in observational quality: a large initial undercatch in the first 3–4 months was followed by near-zero bias for the remainder of its deployment. As the Lufft uses a tipping bucket mechanism, this pattern may reflect an initial settlement or bedding in of components that resulted in self-correction of rainfall measurements, and it underscores why the linear regression drift rate (+16.1 % yr−1) is misleading for this instrument compared to the LOWESS curve.
4.1 Sensor drift and degradation mechanisms due to environmental exposure
The long unattended deployment across multiple AiOWSs revealed sensor-specific degradation situations that explain the differences seen in Figs. 2 to 5. Degradation for all variables (aside from RH) is seemingly governed less by instrument age than by instrument design coupled with cumulative environmental stressors (such as solar loading, humidity cycling, particulates, biofouling and corrosion from wind-driven rain/condensation.) This is demonstrated by the early damage to the Davis VP2 rain gauge system resulting in no data being collected, whilst the Vaisala system worked for a decade under exactly the same environmental conditions. Relative humidity did however show a potential drift that worsened with age of the sensor.
The rapid degradation observed in precipitation and wind sensors is likely linked to the design and material choices in manufacturing of these instruments. In several units, we observed the use of standard steel (rather than stainless steel) within tipping bucket mechanisms, and unprotected shaft bearings in cup-and-vane anemometers, which allows moisture to access the bearing races and initiate corrosion. These findings suggest that outdoor weather stations would benefit from construction using corrosion-resistant or inert materials, and from ingress protection to at least IP66 equivalence, which would significantly reduce environmentally-driven component failures.
Temperature displayed the strongest long-term stability. Laboratory tests showed that aged units remained close to specifications in the 0–30 °C band, with a consistent underestimation of approximately 0.6 °C above 30 °C relative to the reference. In the field, monthly biases were typically within approx. ± 0.2–0.5 °C. The Vaisala trended from 0.3 °C toward 0.45 °C by 2024, while the two Davis VVue sensors exhibited seasonality – underestimation in winter and overestimation in summer (Fig. 4). The patterns are indicative of radiation-shield issues in AiOWS under high insolation conditions rather than thermistor drift (Bell, 2015). This is demonstrated by the high temperature bias (>30 °C) on the test field being in the opposite direction to the bias observed in the climate chamber. The Netherlands is too cold to have >30 °C air temperatures without solar radiation (i.e. at night time). However, the climate chamber heats through convective air circulation without radiation, and thus is representative of nighttime or overcast temperature conditions. Therefore, a laboratory calibration of the AiOWS temperature sensors under conditions of high temperature and zero radiation (and correction of the temperature measured) would actually result in a larger positive temperature bias being recorded by the instruments at peak summertime solar radiation for all instruments apart from the METER. The radiation-binned analysis (Fig. 7) quantifies this effect precisely: at irradiances exceeding 600 W m−2, VVue warm biases of +0.4–0.7 °C are fully consistent with radiation-shield overheating rather than thermistor drift, and the systematic amplification under low-wind conditions (Fig. 7b) confirms that aspiration and/or functioning radiation shielding is the primary mitigating factor. This conclusion is strengthened through the good performance of the actively ventilated Lufft AiOWS under high temperatures and high irradiances.
Data from the field tests confirmed the laboratory observations on relative humidity (Fig. 4). Here, all AiOWSs overreported RH at low RH conditions, and underreported RH at high RH conditions (>90 % RH). Vaisala's RH bias started near −6 %, trending towards zero over ∼10 years. METER's RH bias grew rapidly from −1 % to +8 % within 4–5 years. VVue sensors followed similar patterns: bias rose until 2020, then returned towards zero by 2021. Lufft's RH bias increased from ∼0 % to +3 % in the first 3 years. All except Lufft showed largest underestimation at 90 %–100 % RH and overestimation below 60 %. RH MAE trends mirrored the biases. METER's MAE rose steeply (5 %–7 %), Vaisala's declined towards ∼2 %, VVue and Lufft remained ∼3 %–4 %. These confirm long-term sensor calibration drift and bias trends observed in other work (e.g. Bell, 2015; Ingleby et al., 2013). As discussed in the literature, these behaviors match also failure mechanisms of polymer-film capacitive sensors such as moisture ingress, contamination, thermal aging, producing low-RH positive bias and high-RH saturation; as seen in both laboratory tests and field time series (Bell, 2015; Ingleby et al., 2013). The deployment-age analysis (Fig. 7b) adds further data to this: the Vaisala's initial dry bias of −6 % RH progressively recovered over 9 years, while the METER's bias accelerated rapidly in the positive direction (+2.46 % RH yr−1). These opposing trajectories highlight that the direction and rate of humidity drift are sensor-specific and cannot be assumed to be uniform across instrument types, making a generic bias correction untenable without instrument-specific calibration history.
Wind speed saw all anemometers under-reporting relative to the 10 m AWS (primarily due to the height of the AiOWS (1.5 m) being influenced by surface roughness of the ground.) For this reason, it is not logical to directly compare the wind data with the AWS data. The binned data in Fig. 5 shows this, with substantial under recording of wind speeds across all sensors. This highlights the necessity of using wind tunnel testing of the AiOWSs to understand degradation of wind speed observations, rather than imperfectly co-located observations.
Precipitation was the least reliable and durable variable, with the Lufft the only AiOWS able to produce usable data. Substantial detritus was found in all AiOWS after field deployments (Fig. 6), comprising insects, leaves and pine cones. Considering the open grassland location of the study, we would predict that AiOWSs situated closer to woodland or agricultural areas would suffer more from such fouling. Tipping buckets under-collected in the field and deteriorated mechanically.
4.2 Performance relative to WMO standards and international guidance
The WMO Guide (WMO-No. 8) provides accuracy classes that serve as practical benchmarks for research and operations. The combined laboratory and field results indicate initial compliance with Class B for temperature and portions of wind, but rapid degradation toward Class C/D for humidity and rainfall.
For temperature measurements, newly manufactured AiOWS units routinely achieved Class B (± 0.5–0.6 °C) and sometimes approached Class A (± 0.2 °C) in laboratory conditions. Field MAE typically remained approx. 0.2–0.5 °C (Fig. 3; Table 2). The systematic approx. 0.6 °C underestimation above 30 °C across multiple instruments suggests overheating caused by the non ventilated compact radiation shields found on the tested AiOWSs, mitigable by aspiration, improved siting, or post-hoc radiation corrections (Cornes et al., 2020; WMO-No. 8).
Relative humidity showed that initial performance was often within Class B (± 5 % RH) and occasionally near Class A (± 2 %) for sensors, but field drift drove many instruments into Class C/D within 3–5 years – consistent with polymer-film aging and contamination. This suggests that annual recalibration or sensor replacement is necessary for unattended deployments (Bell, 2015).
Wind speed showed that in laboratory conditions, anemometers typically met Class B thresholds (± 10 % or ± 2 m s−1), but aging of bearings reduced effective class to C for the Davis VP2 and VVUE AiOWSs especially at low winds where friction from aged bearing and run-up thresholds dominate.
Precipitation showed that none of the AiOWSs achieved reliable WMO Class B compliance. Wind-induced undercatch, intensity-dependent tipping bias, clogging, and component failure led to persistent negative biases. The stratified analysis in Fig. 5 confirms that only the Lufft WS601 approached Class B performance (−13 % to −14 % underread across most intensity bins), while the Vaisala's 42 %–53 % undercatch places it firmly in Class D. The Davis VP2 and METER reached near-total precipitation failure (−85 % to −97 %), and for these instruments precipitation data should be considered absent rather than merely degraded. Event-based metrics (PoD well below 1; low FAR except for spurious METER tips) further quantify reliability limits: even well-performing AiOWSs miss light and short events without careful calibration and regular servicing. As deployed, precipitation sensing in AiOWS should be treated as qualitative unless supported by frequent inspection, leveling, shielding, and calibration checks (Segovia-Cardozo et al., 2023).
Several studies have demonstrated the scientific utility of AiOWS precipitation data when properly quality-controlled (e.g., de Vos et al., 2017; Overeem et al., 2013; Rombeek et al., 2025). These studies typically draw on dense networks of many hundreds of stations, applying statistical quality control to filter out erroneous observations. Our findings do not contradict this: the Lufft (and to a lesser extent, Vaisala) AiOWSs study did detect the majority of precipitation events and produced broadly plausible monthly totals. However, individual station reliability – without the benefit of network-scale quality control – was poor, with significant missed events (low PoD), undercatch, and sensitivity to fouling and mechanical failure. This highlights an important distinction: AiOWS precipitation data can be scientifically useful at the network scale with appropriate quality control, but should not be treated as reliable at the individual station level without regular servicing and calibration.
While wind speed measurements from AiOWSs present challenges in standardised comparison with reference AWSs – particularly due to height differences and surface roughness effects – they may still provide value in heterogeneous terrain and urban environments. In such settings, WMO siting criteria for conventional wind measurements are inherently difficult to satisfy, meaning that AiOWS data, if correctly quality controlled, can offer unique insight into local wind patterns that would otherwise go unobserved (Droste et al., 2020). The key requirement is transparent documentation of instrument height and local surroundings in station metadata, allowing users to account for siting effects during data analysis.
4.3 Recommendations for AiOWS networks and users
Quality control and assurance should be designed around known degradation/sensor weaknesses rather than nominal specifications from the manufacturer. We recommend to implement quarterly visual inspections, funnel cleaning, and re-leveling for gauges. At semiannual checks; annual cup/vane bearing need inspection and replacement as needed, and given the drift rates quantified in Figs. 4 and 11b, the capacitive RH sensors need to be viewed as a consumable item, and renewed frequently – with the METER showing drift exceeding +2 % RH yr−1, suggesting sensor replacement on a 2–3 year cycle for this instrument type.
There is potentially a need to improve radiation shielding/aspiration design in AiOWSs, particularly those deployed in high-insolation sites. The failure of the METER and Vaisala sonic anemometers suggest that attempts by the manufacturer to strengthen these components against damage and environmental degradation would also be beneficial. For precipitation, maintaining level AiOWS mounting and the use of bird guards (where feasible) to reduce undercatch and ingestion of debris into the funnel would likely improve observational quality.
Maintaining metadata on installations, maintenance, component swaps, and calibration results is vital to improve confidence in AiOWS data. There is a need to train AiOWS operators in how to perform functional tests (manual bucket tips, anemometer spin tests) and complete basic quality control interpretation, particularly when the AiOWSs are operated by non-experts/citizen scientists.
For temperature and mid-range wind measurements, AiOWSs offer value, particularly for spatially dense nowcasting, urban climatology, and micro-meteorological applications where biases of a few tenths of a degree or approx. 5 %–10 % are acceptable or correctable. For humidity and precipitation, AiOWSs generally require more frequent servicing to remain useful in operational systems (such as required by a national meteorological service). Operational plans should budget for recurring sensor replacements (RH), routine gauge cleaning/calibration (rain gauge and cup and vane anemometers), and redundancy in the form of a higher quality raingauge system for rainfall where this parameter is of high importance.
4.4 Limitations and future work
The study mimicked worst-case user behavior (minimal maintenance) to test intrinsic durability limits. While this reveals fundamental constraints, networks with preventive maintenance and calibration schedules will likely outperform the results shown here. However, as this was an opportunistic study, the following improvements for future studies within this field are of interest. First and foremost, is to design a study which concurrently tests multiple AiOWSs of the same type, to observe issues and trends with greater confidence, rather than a single/two individual weather stations. Second, is to also quantify improvements from scheduled maintenance regimes. Other topics of interest include, an assessment of newer solid-state rain sensors and low-cost sonics under extended deployments, and to further investigate radiative heat related air temperature bias caused by high solar insolation heating the comparatively (versus an AWS) small radiation shields found on most AiOWSs.
Six AiOWSs were assessed through laboratory calibration and multiple years of unattended deployment at a meteorological testfield site with collocated AWS. The results show that, despite a prolonged period without maintenance, certain variables, particularly air temperature, remained within acceptable accuracy limits for scientific applications. Across both the laboratory and field settings below temperatures of 30 °C, all AiOWSs aligned with WMO Class B standards even after environmental exposure and zero maintenance.
In contrast, precipitation measurements proved to be generally unreliable. Tipping bucket mechanisms, particularly those in the Davis Vantage Vue and Lufft, performed best in both lab and field tests, but even these showed considerable degradation over time when compared with rain gauge data from an AWS. Haptic and drip-counting sensors (e.g., Vaisala WXT520 and METER Atmos41) were especially prone to underreporting, likely from sensor fouling and material degradation.
Relative humidity sensors showed the clearest evidence of long-term drift. The AiOWSs met Class B performance thresholds under high-humidity conditions in the lab; however, real-world data showed increasing bias over time. The Vaisala remained within Class B tolerances in the field, but most others, particularly the METER Atmos41, degraded into Class C or D performance bands.
The long-term field deployment revealed operational challenges as well. Data availability was severely impacted by yellowing of solar panel covers, clogging of rain gauges with detritus, and failure of instrument components, such as reed switches. Of the six stations, only the Vaisala WXT520 delivered a near-complete dataset. However, we conclude that with moderate effort in cleaning the AiOWSs, replacement of humidity sensors and wind tunnel calibration, the data collected from these devices will become increasingly valuable to end users.
The Python analysis scripts used to produce the figures in this paper are available from the corresponding author on reasonable request. No novel software package was developed for this study; analyses were conducted using standard open-source Python libraries (pandas, numpy, scipy, matplotlib, statsmodels).
The AWS reference data from KNMI station 06260 (De Bilt) are publicly available via the KNMI Data Platform (https://dataplatform.knmi.nl, last access: 23 April 2026). Personal weather station data are available via the KNMI WOW-NL portal (https://www.knmi.nl/kennis-en-datacentrum/uitleg/wow-nl, last access: 30 April 2026), which is also replicated at the UK Met Office WOW portal (https://wow.metoffice.gov.uk/, last access: 30 April 2026). The raw AiOWS observational data collected during this study are available from the corresponding author on reasonable request.
CB and MdH designed the experiment, with CB and MS completing the post deployment laboratory testing. CB prepared the manuscript, with Figs. 4, 5 and 6 produced by MS. Review and scientific improvements were suggested by TB and MdH, along with extensive rewording.
The contact author has declared that none of the authors has any competing interests.
Publisher's note: Copernicus Publications remains neutral with regard to jurisdictional claims made in the text, published maps, institutional affiliations, or any other geographical representation in this paper. The authors bear the ultimate responsibility for providing appropriate place names. Views expressed in the text are those of the authors and do not necessarily reflect the views of the publisher.
We would like to acknowledge the work of Jos Verbeek, of KNMIs' calibration laboratory, without whom, we would not have been able to assess the AiOWS performance pre and post deployment, and Sanne Vega who assisted with the initial calibration and field installation. We also thank Karin van der Wiel with assisting with improvements to the text and figures.
This work was entirely funded by KNMI directly.
Publisher's note: Copernicus Publications remains neutral with regard to jurisdictional claims made in the text, published maps, institutional affiliations, or any other geographical representation in this paper. The authors bear the ultimate responsibility for providing appropriate place names. Views expressed in the text are those of the authors and do not necessarily reflect the views of the publisher.
This paper was edited by Gianfranco Vulpiani and reviewed by two anonymous referees.
Bell, S. J.: Evaluating and Improving the Quality of Personal Weather Station Observations, PhD thesis, Aston University, Birmingham, UK, https://publications.aston.ac.uk/id/eprint/26693/1/Bell_Simon_J._2015.pdf (last access: 11 November 2025), 2015.
Brousse, O., Simpson, T., Poorthuis, A., Georganos, S., Makido, Y., Heaviside, C., and Wouters, H.: Using local climate zones to assess the spatial representativeness of urban meteorological stations, Environ. Res. Lett., 17, 044041, https://doi.org/10.1088/1748-9326/ac5c0f, 2022.
Chapman, L., Bell, C., and Bell, S.: Can the crowdsourcing data paradigm take atmospheric science to a new level? A case study of the urban heat island of London quantified using Netatmo weather stations, Int. J. Climatol., 37, 3597–3605, https://doi.org/10.1002/joc.4940, 2017.
Cornes, R. C., Dirksen, M., and Sluiter, R.: Correcting citizen-science air temperature measurements across the Netherlands for short wave radiation bias, Meteorol. Appl., 27, e1814, https://doi.org/10.1002/met.1814, 2020.
de Vos, L., Leijnse, H., Overeem, A., and Uijlenhoet, R.: The potential of urban rainfall monitoring with crowdsourced automatic weather stations in Amsterdam, Hydrol. Earth Syst. Sci., 21, 765–777, https://doi.org/10.5194/hess-21-765-2017, 2017.
de Vos, L. W., Leijnse, H., Overeem, A., and Uijlenhoet, R.: Quality control for crowdsourced personal weather stations to enable operational rainfall monitoring, Hydrol. Res., 68, 2020–2045, https://doi.org/10.2166/nh.2023.136, 2023.
Demortier, A., Mandement, M., Pourret, V., and Caumont, O.: Assimilation of surface pressure observations from personal weather stations in AROME-France, Nat. Hazards Earth Syst. Sci., 24, 907–927, https://doi.org/10.5194/nhess-24-907-2024, 2024.
Dombrowski, O., Klaus, J., Gisler, M., and Niessner, F.: Performance of the ATMOS41 all-in-one weather station for weather monitoring, Sensors, 21, 741, https://doi.org/10.3390/s21030741, 2021.
Droste, A. M., Heusinkveld, B. G., Fenner, D., and Steeneveld, G. J.: Assessing the potential and application of crowdsourced urban wind data, Q. J. R. Meteorol. Soc., 146, 2671–2688, https://doi.org/10.1002/qj.3829, 2020.
Fenner, D., Bechtel, B., Demuzere, M., Kittner, J., and Meier, F.: CrowdQC+ – A Quality-Control for Crowdsourced Air-Temperature Observations Enabling World-Wide Urban Climate Applications, Front. Environ. Sci., 9, 720747, https://doi.org/10.3389/fenvs.2021.720747, 2021.
Hahn, C., Garcia-Martí, I., Sugier, J., Emsley, F., Beaulant, A.-L., Oram, L., Strandberg, E., Lindgren, E., Sunter, M., and Ziska, F.: Observations from personal weather stations – EUMETNET interests and experience, Climate, 10, 192, https://doi.org/10.3390/cli10120192, 2022.
Huwald, H., Higgins, C. W., Boldi, M.-O., Bou-Zeid, E., Lehning, M., and Parlange, M. B.: Albedo effect on radiative errors in air temperature measurements, Water Resour. Res., 45, W08431, https://doi.org/10.1029/2008WR007600, 2009.
Ingleby, B., Moore, D., Sloan, C., and Dunn, R.: Evolution and accuracy of surface humidity reports, J. Atmos. Oceanic Technol., 30, 2025–2043, https://doi.org/10.1175/JTECH-D-12-00232.1, 2013.
Jenkins, T.: A comparison between two types of widely used weather stations, Weather, 69, 100–107, https://doi.org/10.1002/wea.2292, 2014.
Mandement, M. and Caumont, O.: Contribution of personal weather stations to the observation of deep-convection features near the ground, Nat. Hazards Earth Syst. Sci., 20, 299–322, https://doi.org/10.5194/nhess-20-299-2020, 2020.
Meier, F., Fenner, D., Grassmann, T., Otto, M., and Scherer, D.: Crowdsourcing air temperature from citizen weather stations for urban climate research, Urban Clim., 19, 170–191, https://doi.org/10.1016/j.uclim.2017.01.006, 2017.
Nakamura, R. and Mahrt, L.: Air temperature measurement errors in naturally ventilated radiation shields, J. Atmos. Ocean. Technol., 22, 1046–1058, https://doi.org/10.1175/JTECH1762.1, 2005.
Nipen, T. N., Seierstad, I. A., Lussana, C., Kristiansen, J., and Hov, Ø.: Adopting citizen observations in operational weather prediction, Bull. Am. Meteorol. Soc., 101, E43–E57, https://doi.org/10.1175/BAMS-D-18-0237.1, 2020.
Overeem, A., Robinson, J. C., Leijnse, H., Steeneveld, G. J., Horn, B. K. P., and Uijlenhoet, R.: Crowdsourcing urban air temperatures from smartphone battery temperatures, Geophys. Res. Lett., 40, 4081–4085, https://doi.org/10.1002/grl.50786, 2013.
Rombeek, N., Hrachowitz, M., Droste, A., and Uijlenhoet, R.: Evaluation of high-intensity rainfall observations from personal weather stations in the Netherlands, Hydrol. Earth Syst. Sci., 29, 4585–4606, https://doi.org/10.5194/hess-29-4585-2025, 2025.
Royal Netherlands Meteorological Institute (KNMI): TR296: Wind Tunnel and Field Test of Three 2D Sonic Anemometers, Royal Netherlands Meteorological Institute Technical Report, https://cdn.knmi.nl/knmi/pdf/bibliotheek/knmipubTR/TR296.pdf (last access: 11 November 2025), 2020.
Segovia-Cardozo, D. A., Bernal-Basurco, C., and Rodríguez-Sinobas, L.: Tipping bucket rain gauges in hydrological research: Summary on measurement uncertainties, calibration, and error reduction strategies, Sensors, 23, 5385, https://doi.org/10.3390/s23125385, 2023.
Stull, R. B.: An Introduction to Boundary Layer Meteorology, Kluwer Academic Publishers, Dordrecht, 666 pp., https://doi.org/10.1007/978-94-009-3027-8, 1988.
Vučković, M. and Schmidt, J.: On the importance of data quality assessment of crowdsourced meteorological data, Sustainability, 15, 6941, https://doi.org/10.3390/su15086941, 2023.
Wolters, D. and Brandsma, T.: Estimating the urban heat island in residential areas in the Netherlands using observations by weather amateurs, J. Appl. Meterol. Climatol., 51, 711–721, https://doi.org/10.1175/JAMC-D-11-0135.1, 2012.
World Meteorological Organization: Guide to Instruments and Methods of Observation (WMO-No. 8), 2018 Edn., WMO, Geneva, Switzerland, ISBN 978-92-63-10008-5, 2018.