the Creative Commons Attribution 4.0 License.
the Creative Commons Attribution 4.0 License.
 | 06 May 2026
Methane quantification of LNG gas-fired power plant in Seoul, South Korea
Jaewon Joo
Hyuckjae Lee
Yeonsoo Kim
Jaewon Shin
Donghee Kim
Dong Yeong Chang
Methane emissions from a liquefied natural gas (LNG) gas-fired power plant in Seoul, South Korea were measured using a mobile greenhouse gas measurement platform. Twenty-one mobile measurements were conducted between February and 12 July 2023. The Gaussian Plume Dispersion Model and the OTM-33A method were used to quantify fugitive methane emissions from mobile measurements in order to compare them with estimated fugitive methane emissions from the bottom-up approach. The measurements identified three key emission hotspots: S1 and S2 were attributed to continuous fugitive methane leaks from underground pipeline, whereas S3 was identified as a stochastic super-emitter likely caused by incomplete combustion or pressure relief venting from the facility's exhaust. The average methane emission rates were 90 ± 9, 18 ± 2, and 550 ± 58 kg h−1 at S1, S2, and S3, respectively. Notably, S3 had a significant methane emission rate of 2053 ± 283 kg h−1, approximately 6 times greater than our corresponding bottom-up estimate of fugitive methane emissions (350 kg h−1). This significant discrepancy arises because bottom-up inventories rely on aggregated monthly fuel consumption data and static emission factors. These inventories are unable to capture intermittent, high-emission events like S3. Our snapshot measurements highlight this temporal variability, demonstrating that mobile measurement is an effective approach for identifying specific sources of methane emissions in Seoul, especially for facilities with strict access restrictions. Furthermore, assuming the maximum rate as a continuous event, we estimated a potential upper-bound annual financial loss of approximately USD 15.77 million, highlighting the economic necessity of improved leak detection and repair (LDAR). These findings are essential for developing a more precise understanding of effective methods to reduce methane emissions from these facilities.
- Article
(10734 KB) - Full-text XML
- BibTeX
- EndNote


The global demand for liquefied natural gas (LNG) reached 401 million t in 2023, with market growth driven largely by Asia, which accounts for 64 % of global LNG imports (GIIGNL, 2024; IGU, 2024). South Korea remains among the world's top three importers, with imports of approximately 45 million t in 2023 (GIIGNL, 2024; IGU, 2024). Due to its relatively low carbon intensity compared to coal or oil, LNG is often recognized as a “transition fuel” for decarbonization efforts (Al-Kuwari, 2023; IGU, 2024). The concept of LNG as a transition fuel has been supported by previous studies, highlighting its potential to facilitate a shift from more carbon-intensive sources and to support the intermittency of renewable energy (Al-Kuwari, 2023). However, this perspective is challenged by research showing that methane emissions associated with LNG supply chains and gas-fired power generation can significantly undermine this environmental benefit (Howarth, 2024), as methane has a much higher global warming potential than carbon dioxide over a shorter time period (IPCC, 2023).
In South Korea, the energy sector, including LNG gas-fired power plants, accounts for approximately 23 % of total national methane emissions (MOE, 2022). The number of LNG gas-fired power plants in the country has expanded in recent years to meet rising electricity demands, with plans to increase LNG-based power capacity from 43.3 GW in 2020 to 69.5 GW by 2038 under the 11th National Basic Plan for Electricity Supply and Demand in South Korea. This transition offers a cleaner alternative to traditional coal-fired facilities in terms of carbon dioxide emissions. However, the accurate quantification of methane emissions from LNG power plants has proven challenging, and significant uncertainties remain regarding the magnitude of fugitive emissions (Lyon et al., 2015). Most methane estimates for these facilities rely on bottom-up inventories, which often have difficulty capturing fugitive emissions from operating conditions (Alvarez et al., 2018; Brandt et al., 2014). These inventories, which apply generic emission factors to activity data, can underestimate actual emissions owing to their limitations in reflecting real-world variability (Howarth, 2024). In particular, recent studies on industrial methane emissions have consistently revealed a substantial discrepancy between bottom-up inventories and ground-based top-down atmospheric measurements. Rutherford et al. (2021) showed that bottom-up inventories frequently underestimate emissions from global oil and gas infrastructure because they depend on fixed factors that do not account for stochastic “super-emitter” events. Such discrepancies are well-documented in upstream production fields (Alvarez et al., 2018), but downstream industrial facilities, such as LNG power plants and distribution networks, are also prone to substantial fugitive emissions due to equipment leaks and operational venting (Weller et al., 2020; Plant et al., 2022). Despite their critical role in urban environments, these downstream sites lack facility-level monitoring.
To address the limitations of traditional bottom-up inventories, which often struggle to capture fugitive emissions from complex industrial operations, ground-based top-down measurement approaches utilizing mobile platforms have gained significant traction in recent years for quantifying urban methane emissions (IPCC, 2023; Alvarez et al., 2018; Brandt et al., 2014). Mobile measurements from vehicle-mounted sensors have proven to be highly effective for mapping and identifying fugitive methane emissions from urban natural gas distribution networks (Vogel et al., 2024). This provides a more accurate understanding of urban methane budgets. Mobile measurements identify more fugitive methane sources that are difficult to detect in bottom-up inventories and provide data for improved estimations of total emissions (Joo et al., 2024; Maazallahi et al., 2022; Maazallahi et al., 2020; Vogel et al., 2024; Mitchell et al., 2015; Jia et al., 2025). Vogel et al. (2024) conducted a study in 12 European cities and demonstrated that mobile measurements could effectively identify and quantify methane emissions from natural gas systems in diverse urban infrastructures. These measurements successfully detected methane emissions that traditional approaches have often missed. In Hamburg, Germany, Maazallahi et al. (2022) quantified urban natural gas emissions using a vehicle-based methane monitoring system and found that fugitive emissions accounted for approximately 15 % of the total estimated emissions, with individual leakage rates varying from 0.1 to 5 kg h−1. Joo et al. (2024) discovered significant missing fugitive methane emissions (approximately 573 t yr−1) from urban sewer networks in the Gwanak district of Seoul, South Korea, highlighting the limitations of relying solely on bottom-up inventories. Beyond urban infrastructure, mobile platforms are crucial for assessing fugitive methane emissions from industrial facilities. Studies in Texas and California, US, have quantified fugitive emissions and identified major sources by comparing ground-based top-down methane measurements and bottom-up inventories around oil and gas production and processing sites (Alvarez et al., 2018; Brandt et al., 2014; Lyon et al., 2015). Alvarez et al. (2018) evaluated methane emissions across the US oil and gas supply chain, estimating total emissions at 13 million t yr−1, a figure 60 % higher than the U.S. Environmental Protection Agency (EPA) estimates at the time. Furthermore, Brandt et al. (2014) quantified methane leaks in a North American natural gas system and reported leak rates ranging from 0.05 % to 8 % of the natural gas production, with substantial variation across different supply chain segments. Jia et al. (2025) quantified fugitive methane emissions from natural gas stations in China using on-site component-level measurements and identified “super-emitters,” which accounted for nearly 80 % of the total fugitive emissions detected at the LNG facilities, with methane concentrations exceeding 10 000 ppm. These studies highlighted the importance of direct measurement techniques for quantifying fugitive methane emissions and identifying key mitigation opportunities in the natural gas industry.
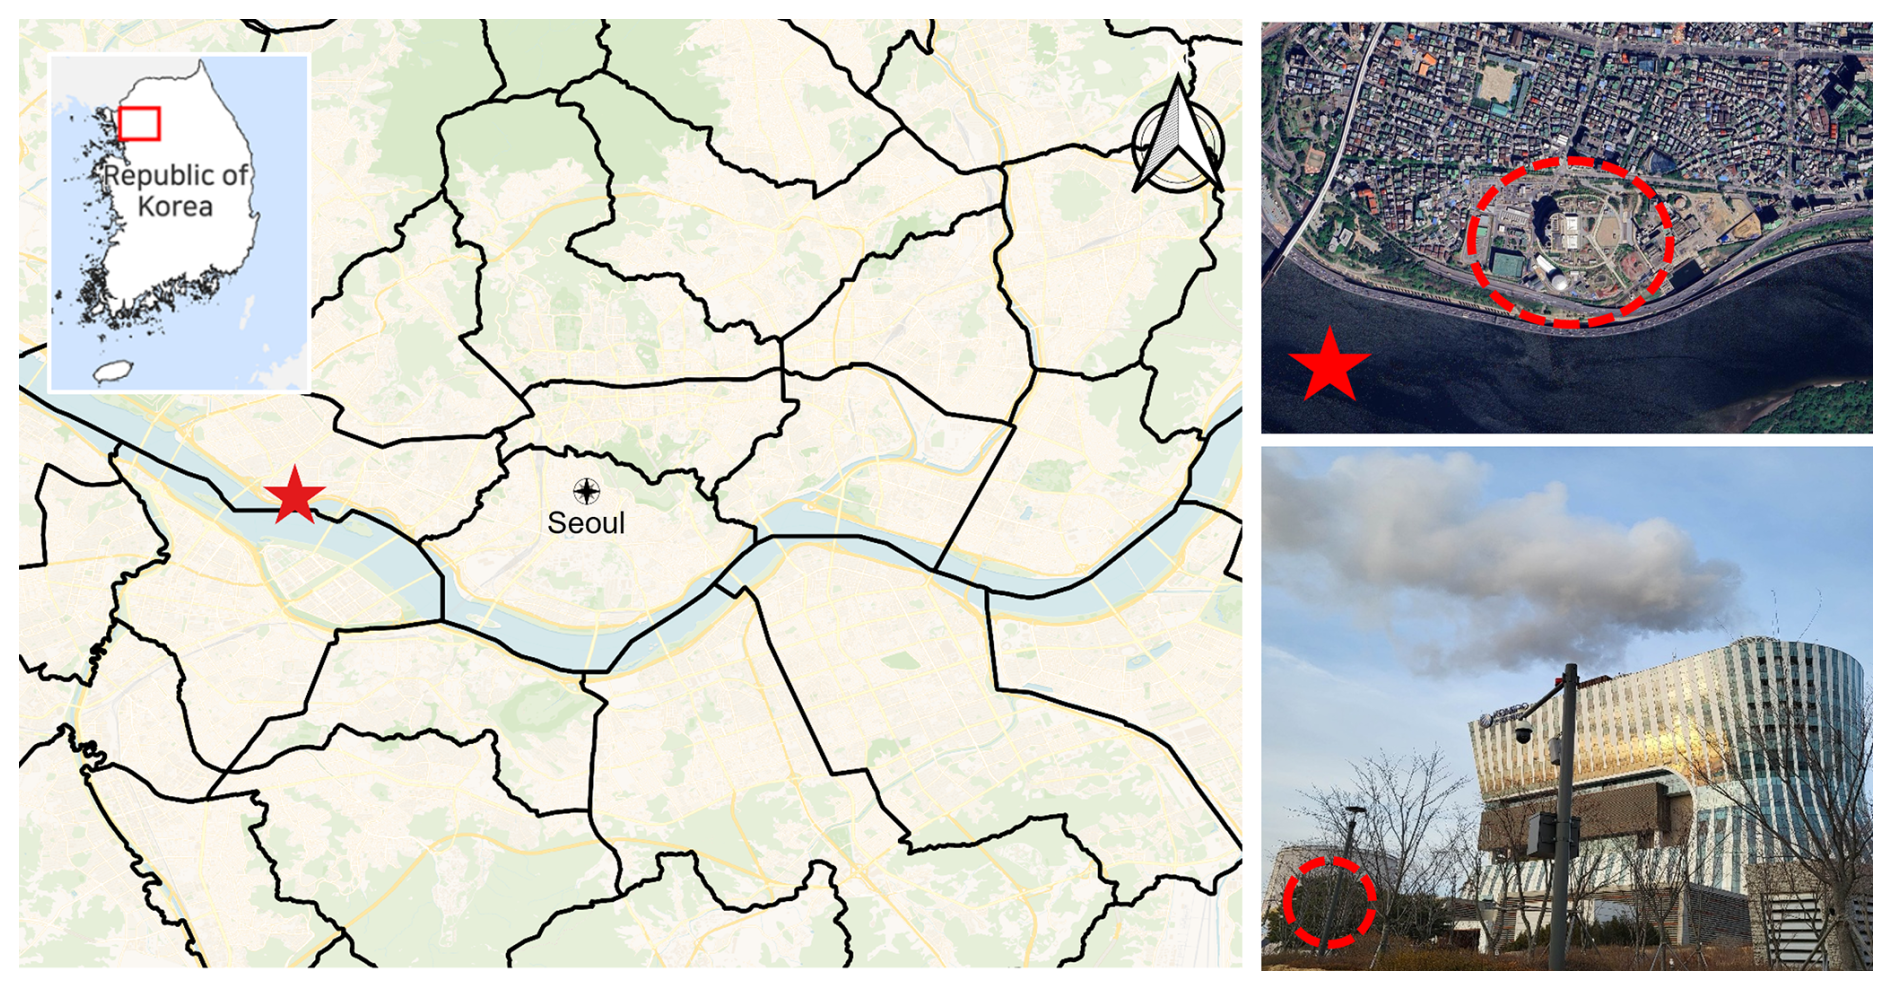
Figure 1Target area for methane measurements (© OpenStreetMap contributors 2024, distributed under the Open Database License (ODbL 1.0). Tiles by Carto, licensed under CC BY 3.0; Map data © Google Maps 2024).
This study addresses the need for a comprehensive assessment of methane emissions from LNG gas-fired power plants, particularly those located within major urban infrastructures. This is one of the first studies to measure methane production at a major LNG power plant in metropolitan Seoul. Using a mobile greenhouse gas (GHG) measurement platform, we identified and quantified the fugitive methane sources within a large LNG gas-fired power plant. This study also compared ground-based top-down measurements with bottom-up inventory estimates of fugitive methane emissions. Using a mobile GHG measurement platform, this study aimed to provide a more accurate assessment of fugitive methane emissions, overcoming the limitations associated with bottom-up methods in real environments. A comparison between ground-based top-down measurements and bottom-up inventories will contribute to a better understanding of the gap between current emissions reporting and real environmental methane emissions of LNG-based power generation in urban areas. In this study, the term “fugitive emissions” is used broadly to encompass all methane emissions detected by the mobile GHG measurement platform including unintentional equipment leaks, operational venting, and potential incomplete combustion products.
2.1 Study area and mobile GHG platform
The target LNG gas-fired power plant (Fig. 1) is one of the largest underground LNG power plants (800 MW) in the world, generating an amount of electricity equivalent to about half of the total electricity consumed by 3.7 million households in Seoul (Korea Midland Power Co., Ltd., 2026). The target LNG gas-fired power plant is an underground facility, and an urban renewal park was created for public use (Fig. 2). The plant operates as a combined cycle power plant (400 MW × 2 units), utilizing gas turbines and heat recovery steam generators (HRSGs). The plant is equipped with two main combustion exhaust stacks, each approximately 88 m in height, which release emissions from the underground generation units (Korea Midland Power Co., Ltd., 2026). LNG is supplied to the plant via pipelines from the Incheon LNG terminal, which is operated by the Korea Gas Corporation (KOGAS). Consequently, there are no on-site LNG storage tanks within the facility. The target LNG gas-fired power plant is situated in a complex urban environment surrounded by residential areas, the Han River waterfront park, and sewer networks. These factors act as potential sources of methane emission. To ensure accurate attribution, we conducted extensive preliminary surveys to characterize these sources before proceeding with the targeted quantification of the power plant's emissions.
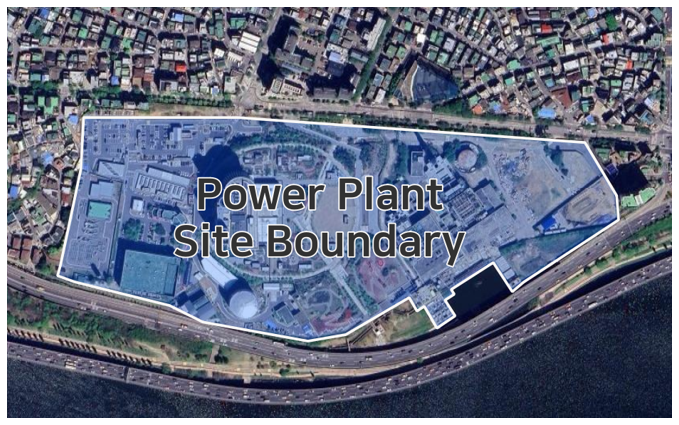
Figure 2Map of the target area showing the boundary of LNG gas-fired power plant in Seoul (Map data © Google Maps 2024).
2.2 Mobile GHG platform
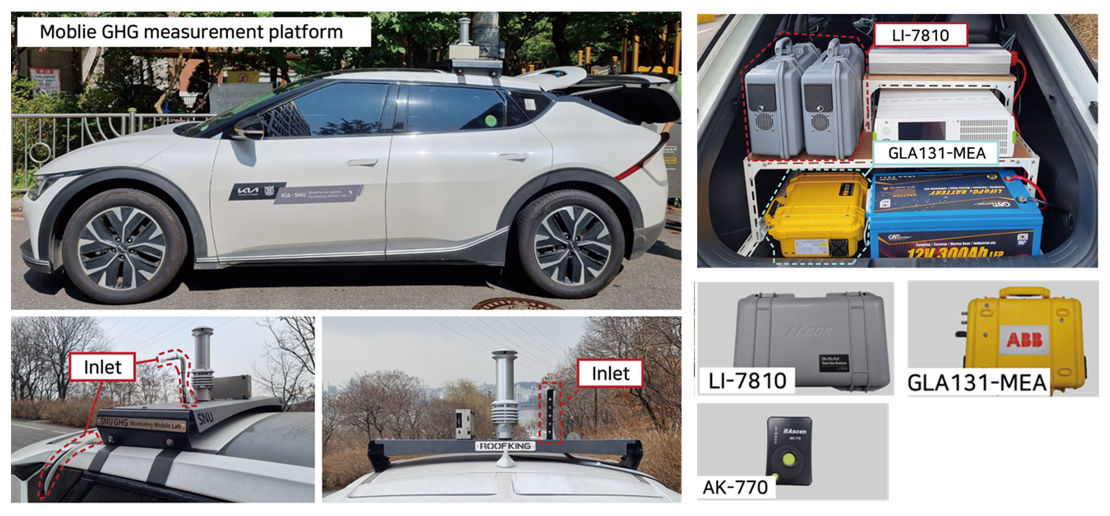
The mobile GHG platform used in this study comprises an electric vehicle equipped with a global positioning system (GPS) and GHG analyzers for measuring CO2, CH4, and C2H6 concentrations, as shown in Fig. 2 (Joo et al., 2024). The platform featured the LI-7810 analyzer, which employs optical feedback cavity-enhanced absorption spectroscopy to measure atmospheric CH4, CO2, and H2O concentrations at 1 s intervals with a precision of ± 0.6 ppb for CH4. Additionally, the GLA131-MEA analyzer used off-axis integrated cavity output spectroscopy to measure CH4 and C2H6 with a precision of ± 0.09 and ± 20 ppb, respectively. The GPS system employed an AK-770 device that integrates GPS and GLONASS to provide accurate location data, including longitude, latitude, speed, and elevation at 1 s intervals with position accuracy 3 m (50 % CEP, Circular Error Probability). An electric vehicle (KIA EV6) was selected to eliminate combustion-related emissions during the measurements, and the analyzer inlets were installed on the roof of the vehicle at a height of 2.1 m to conduct GHG sampling.
2.2.1 Instrument calibration
To ensure the accuracy of the measurements, a two-point calibration for LI-7810 and one-point calibration for GLA131-MEA were performed prior to each daily measurement. We conducted a two-point (zero and span) calibration for the CH4 channel using CH4-free zero air (0 µmol mol−1; 0 ppm) and a certified CH4 span standard of 2.03 µmol mol−1 (2.03 ppm). For the GLA131-MEA, we performed a zero and span calibration using certified reference gases through the instrument's built-in calibration routine (reference-gas calibration). All reference gases used for calibration were Korea Research Institute of Standard and Science (KRISS)-certified reference gas mixtures, providing metrological traceability and international recognition under the CIPM MRA and produced within KRISS's ISO/IEC 17025 and ISO 17034 quality system (KRISS, 2026).
2.2.2 Data preprocessing
To quantify the methane emissions from the LNG gas-fired power plant, the raw measurement data were first quality-controlled and time-synchronized. We corrected for the temporal lag between the GPS coordinates and the gas analyzer measurements, accounting for the residence time of air through the sampling inlet. The time-synchronized CH4 concentration time series was merged with collocated GPS and meteorological data (wind speed and wind direction) to produce a point-by-point dataset. The CH4 background concentration for each data point was defined as the median of measurements within a moving window of ± 2.5 min centered on that timestamp (Weller et al., 2020; Maazallahi et al., 2020). Methane enhancement was then calculated by subtracting the estimated background from the measured concentration.
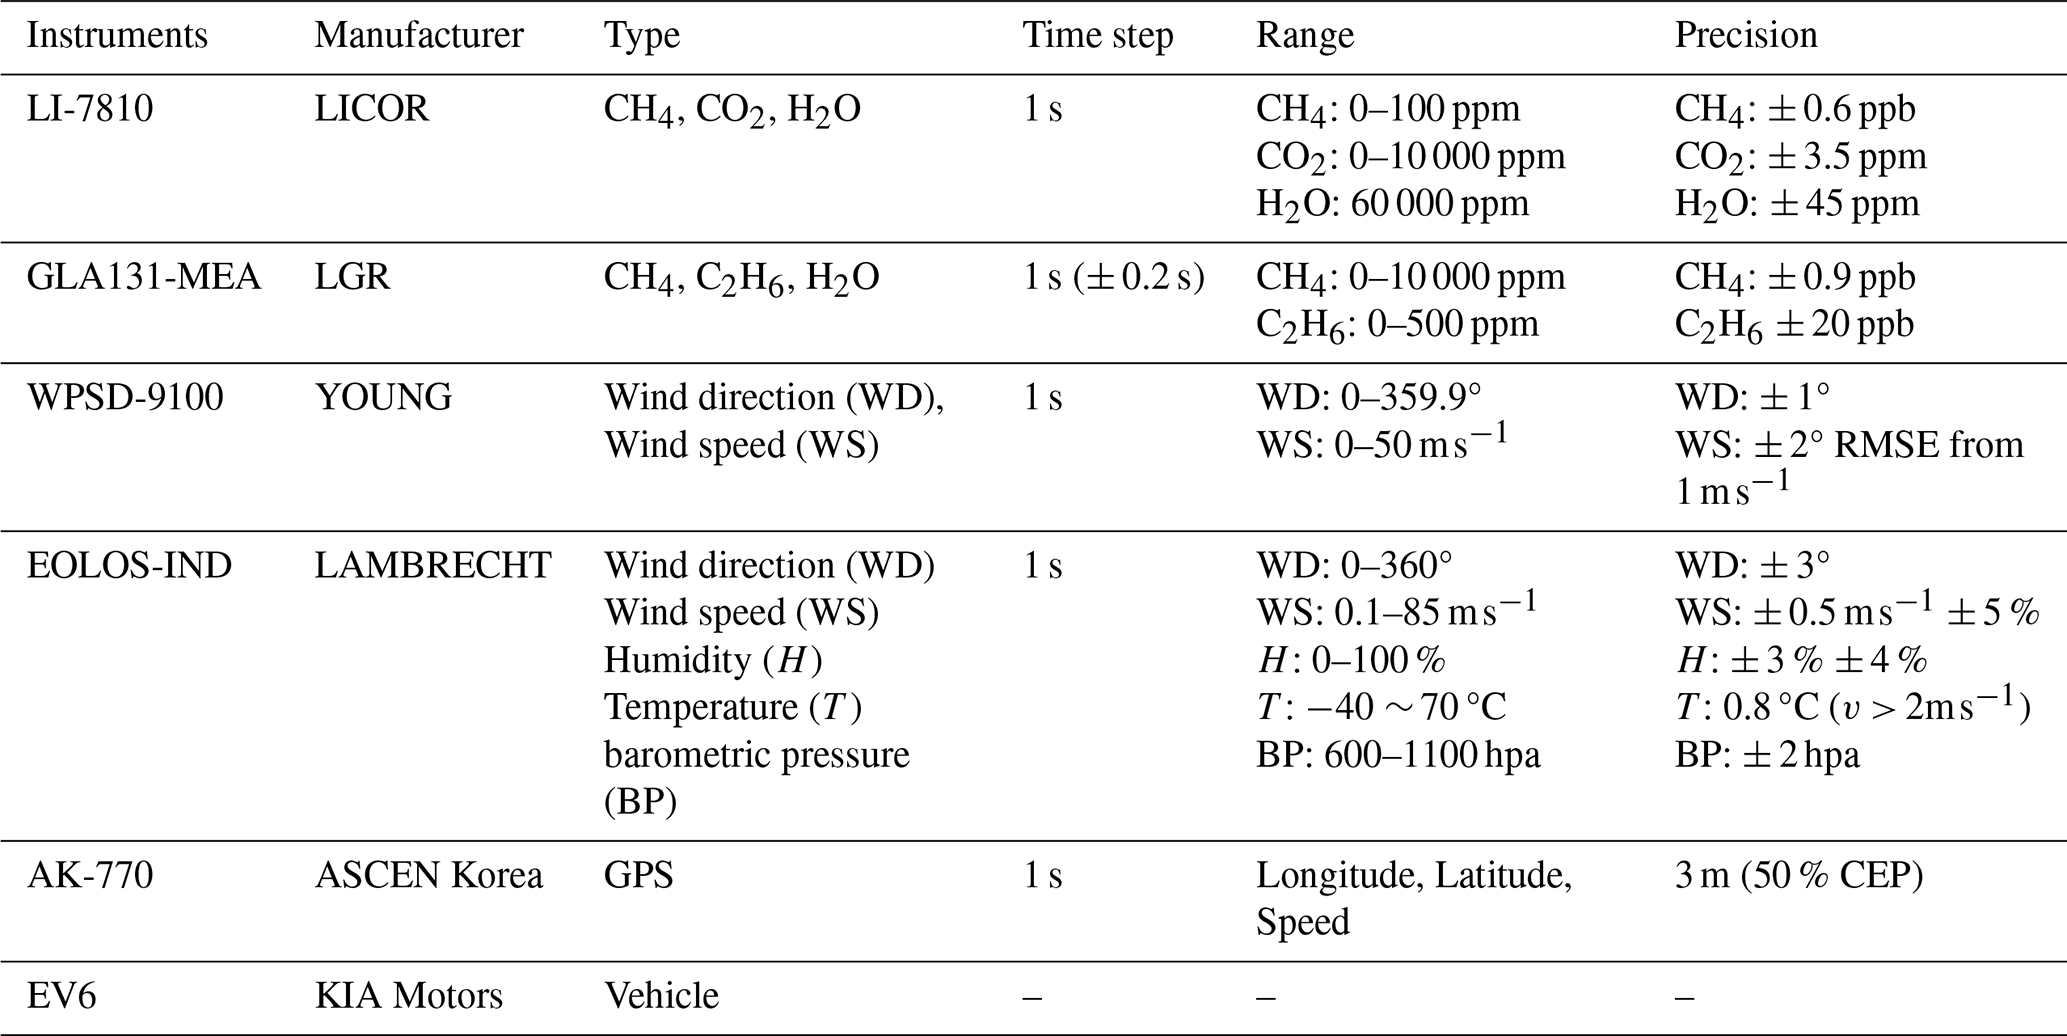
Table 2Pasquill–Gifford stability class (Thoma and Squier, 2014).
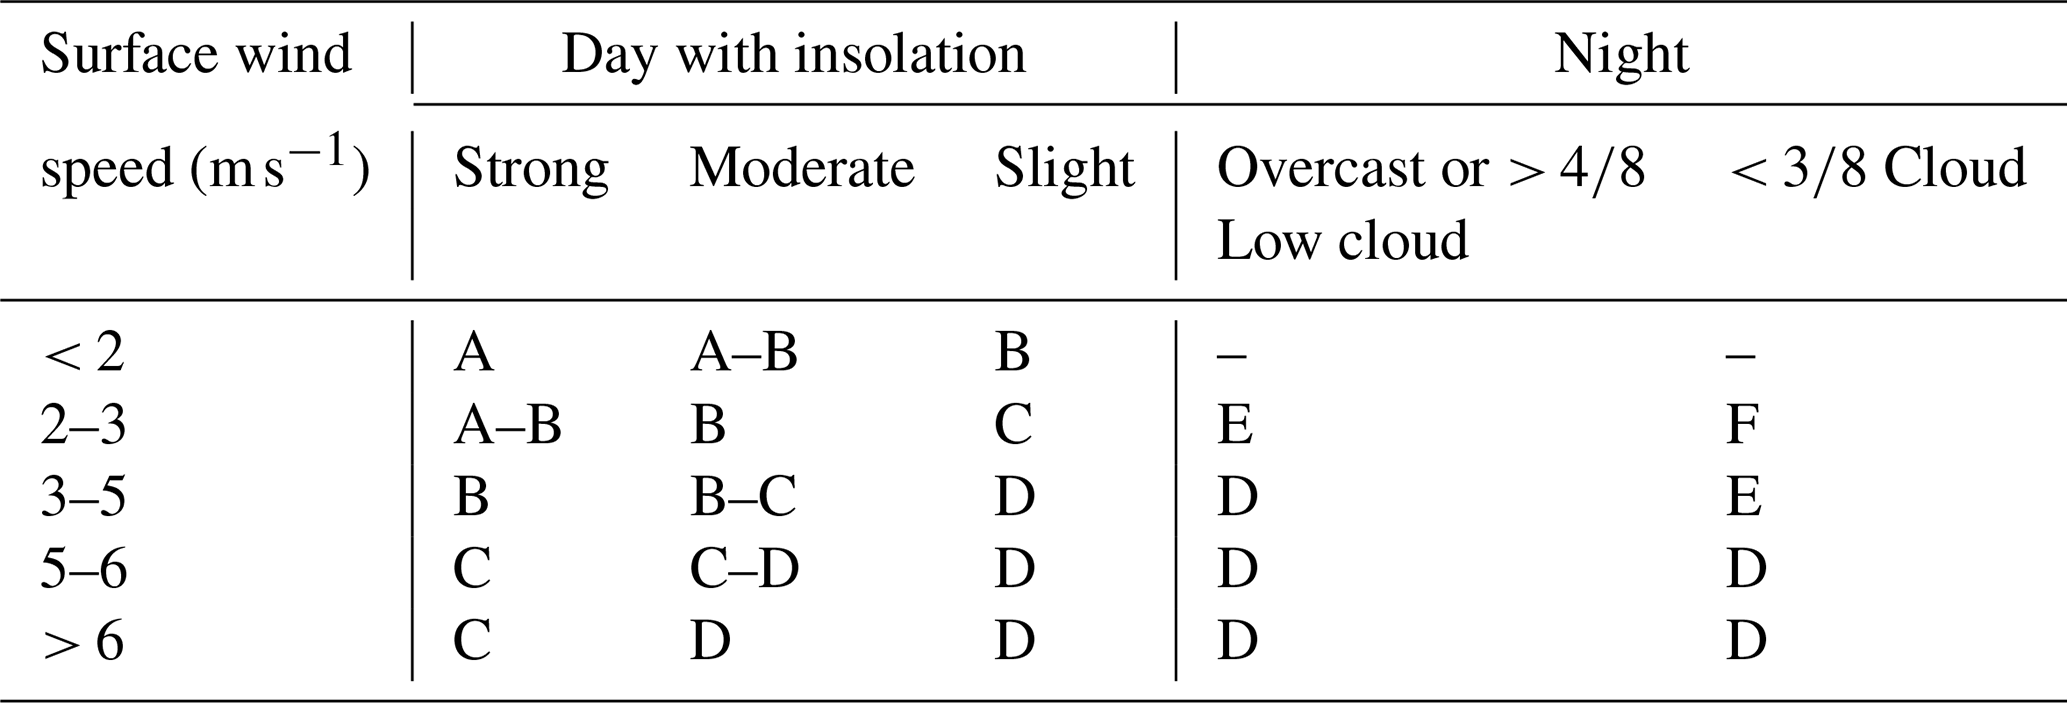
A: Extremely unstable, B: Moderate unstable, C: Slightly unstable, D: Neutral, E: Slightly stable, E: Moderately stable.
2.3 Quantification of methane emissions from ground-based top-down approaches
The methane concentration data from mobile measurements at the LNG gas-fired power plant were quantified using the standard point source Gaussian Plume Dispersion Model (GPDM) and Other Test Method 33A (OTM-33A) (see Eqs. 2 and 3). The GPDM is a widely used atmospheric dispersion model that assumes a Gaussian distribution of methane concentrations in the horizontal and vertical directions under steady-state conditions (Turner, 1970; Chen et al., 2020; Maazallahi et al., 2020). It considers factors such as the emission rate, wind speed, atmospheric stability, and distance from the source to estimate pollutant concentrations downwind. OTM-33A, developed by the U.S. EPA, is a near-source flux measurement method designed to locate and estimate methane emissions from oil and gas facilities without requiring site access (Thoma and Squier, 2014). It employs an inverse Gaussian approach, and is particularly useful for mobile measurements. Both methods offer advantages in capturing real-world emissions under operational conditions, and can help quantify specific emission sources within a facility.
where C is the CH4 enhancement converted to grams per cubic meter (g m−3) at Cartesian coordinates x, y, and z relative to the source ([xyz]source = 0 at ground-level source); x is the distance of the plume from the source aligned with the wind direction; y is the horizontal axis perpendicular to the wind direction; z is the vertical axis; Q is the emission rate in grams per second (g s−1); u (m s−1) is the wind speed along the x axis; and σy and σz are the horizontal and vertical plume dispersion parameters, respectively.
where Q (g s−1) is the source emission rate. σy and σz are the horizontal and vertical dispersion coefficients, respectively, from the Pasquill–Gifford stability class listed in Table 2. U is the average wind speed during the measurement (m s−1) (Thoma and Squier, 2014). The stability classes were determined based on hourly average wind speed and solar altitude angle data obtained from the Korea Astronomy and Space Science Institute (KASSI). Strict data quality indicators (DQIs) were applied to ensure the reliability of the OTM-33A estimates. While standard guidelines recommend a sampling duration of 15–20 min from the U.S. EPA, we extended the stationary measurement period to 30 min for sites characterized by complex terrain or dense vegetation. This extension was implemented to ensure sufficient plume event accumulation and to mitigate the impact of near-field obstructions on plume transport. Data were strictly screened based on the following criteria: (1) the plume center was captured within ± 30° of the mean wind direction, (2) the in-plume methane concentration exceeded 0.1 ppm, and (3) the Gaussian curve fit exhibited an R2 > 0.8.
We quantified the uncertainty of methane emission rates using a Monte Carlo simulation with 10 000 iterations. Given that the target LNG power plant is situated in a complex environment that deviates from the ideal conditions of flat terrain and homogeneous wind fields, we assigned robust uncertainty ranges to key input parameters. Specifically, uncertainties were set at ± 10 % for the source-receptor distance; ± 20 % for wind speed to account for surface roughness and turbulence; and ± 30 % for the source height, reflecting the uncertainty in estimating vents from underground facilities.
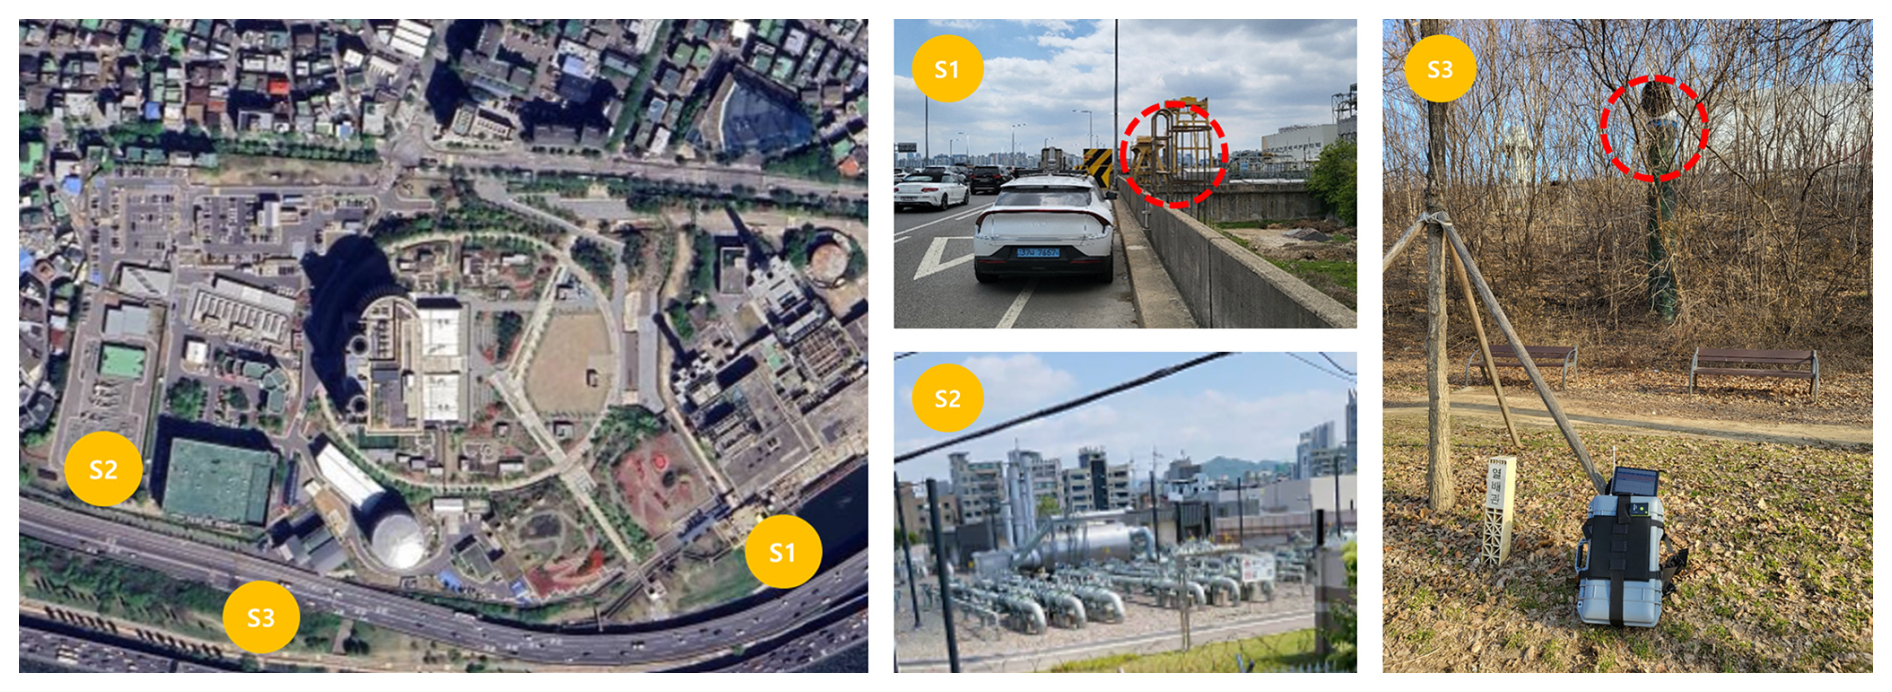
Figure 4Key hotspots of methane emissions in the target area from the mobile measurements (Map data © Google Maps 2024).
2.4 Quantification of fugitive methane emissions from bottom-up approaches
The hourly fugitive methane emission rates of the target LNG gas-fired power plant were estimated by multiplying the activity data with the emission factor.
The activity data used in this study were the monthly LNG consumption of the power plant reported by the KOREA MIDLAND POWER Co., Ltd. (KOMIPO). For the emission factor, South Korea's country-specific factor for fugitive emissions from post-meter leakage at industrial plants and power stations (87.5 t CH4 PJ−6) was applied. The resulting monthly emissions were then distributed on an hourly basis using 5 min operational status data from the Korea Power Exchange as a proxy (KPX, 2025), which records the near real-time power generation estimates of the target plant in megawatts (MW).
2.5 Measurement strategy
Due to strict security protocols restricting access to most LNG power plants in South Korea, indirect measurement strategies are often required. The target facility in this study is an underground power plant. Accordingly, we conducted measurements primarily at the surface level (ground level) where access was permitted. Our strategy involved repeated mobile transects combined with targeted walking surveys to ensure the reliability of source identification. We defined a location as a potential emission source only when elevated methane concentrations were consistently detected at the same spot on at least two or more separate occasions.
In this study, we employed GPDM and OTM-33A to quantify the methane emissions from an LNG gas-fired power plant. The measurement strategies for these two models were selected as mobile and stationary measurements. The mobile measurement strategy drives multiple trajectories along the boundaries of the target LNG power plant (Fig. 2). In this study, we drove 10 to 15 trajectories to quantify methane emissions using the GPDM. The stationary measurement strategy involved at least 30 min of measurement near the identified methane emissions. To identify methane leaks from the LNG power plant, we conducted driving and walking monitoring for methane leak surveys in the LNG power plant area.
Figure 4 illustrates three key methane emission hotspots (S1, S2, and S3) using a mobile GHG platform near an LNG gas-fired power plant. Methane enhancements from the mobile measurements indicate a maximum of 3795.7 ppb (S1) with an average of 1698.62 ppb, a maximum of 1188.94 ppb (S2) with an average of 466.22 ppb, and a significant maximum of 56 039.06 ppb (S3) with an average of 19 963.97 ppb, identifying them as specific emission sources associated with the LNG gas-fired power plant. S1 and S2 were located downwind of sections of the plant's natural gas pipelines and LNG power plant facilities, such as power generation units and smokestacks. S3 was located downwind of an exhaust pipe associated with internal processes and LNG power plant facilities. The mobile measurement strategy employed in this study was effective in monitoring the target area surrounding the access-restricted LNG power plant, enabling the identification and characterization of methane emission plumes from the facilities.
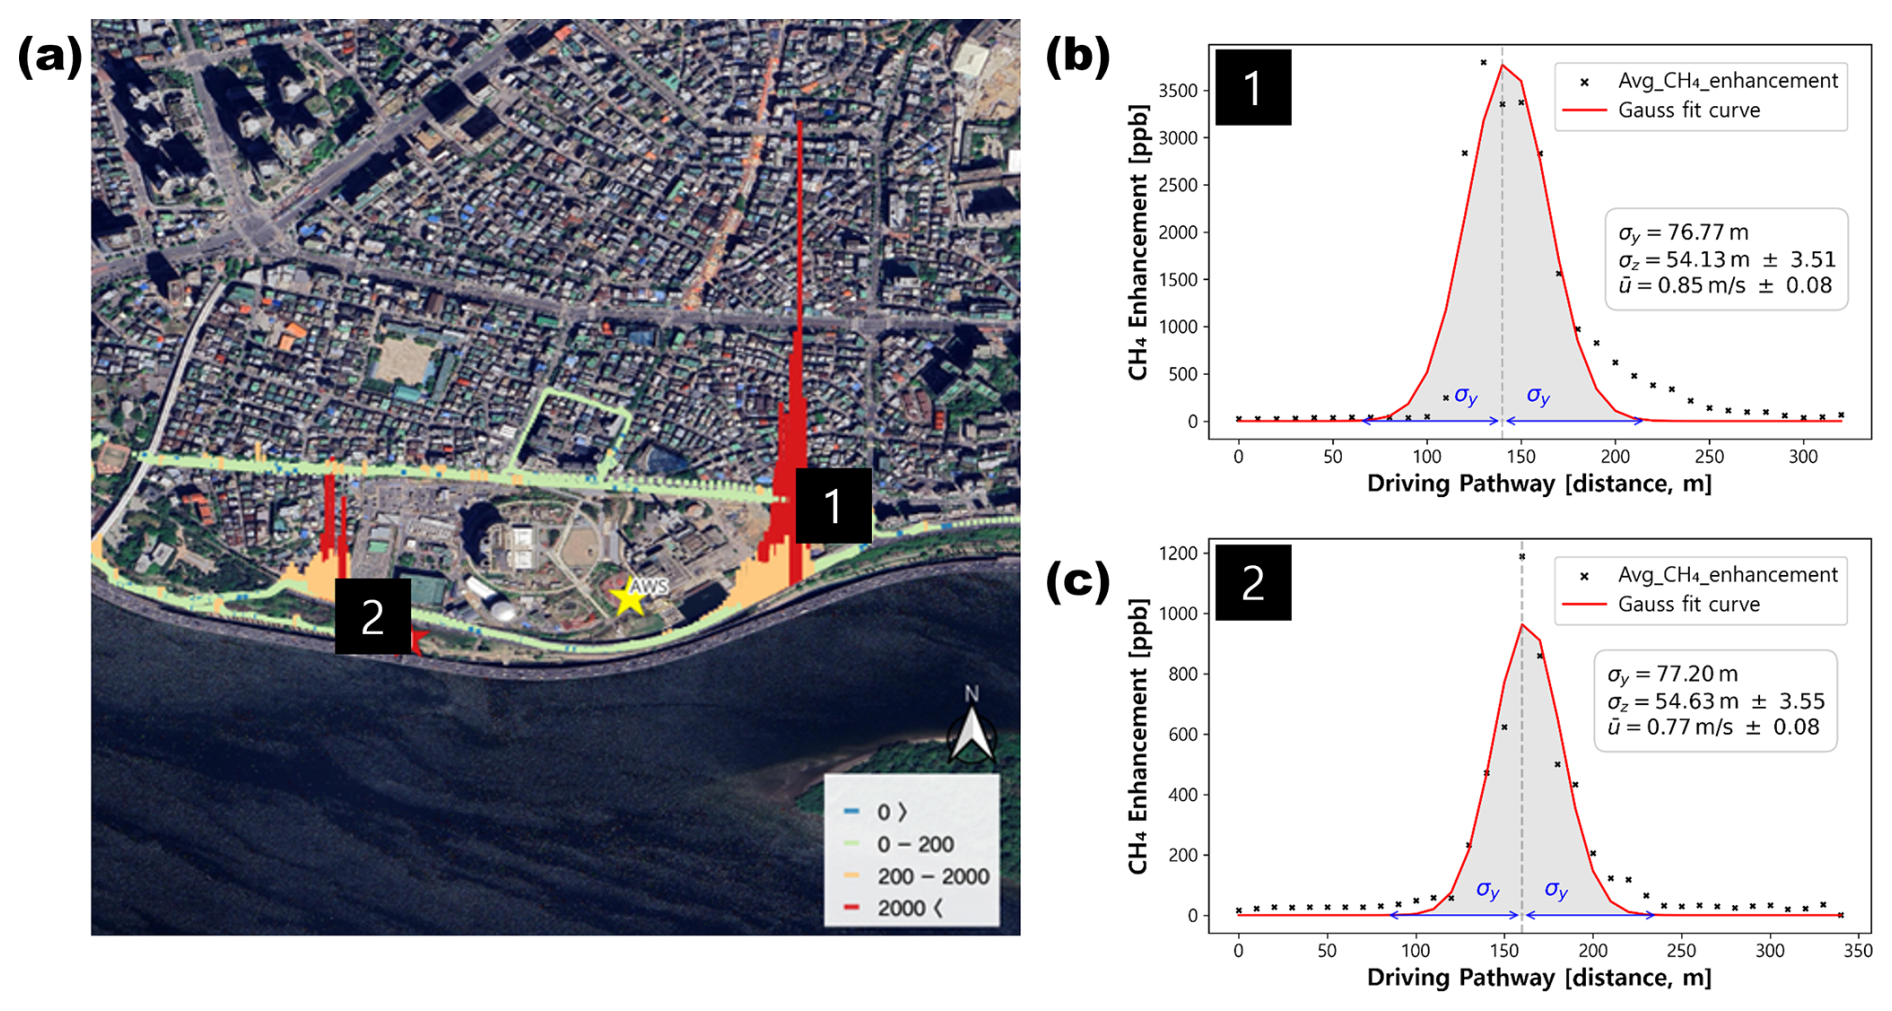
Figure 5Methane emissions from the mobile measurements at S1 and S2 for the GPDM on 23 June 2023. (a) Driving route with the two major methane sources from the LNG power plant (color scale); the yellow star mark shows the location of anemometer. (b) and (c) indicate CH4 enhancement variabilities (ppb) from two sources versus distance along the route. Black dotted points are bin-mean values from 15 trajectories; the red line represents a Gaussian fit to those points. Blue annotations indicate σ (lateral dispersion length scale, m) and the mean wind speed (, m s−1) (Map data © Google Maps 2024).
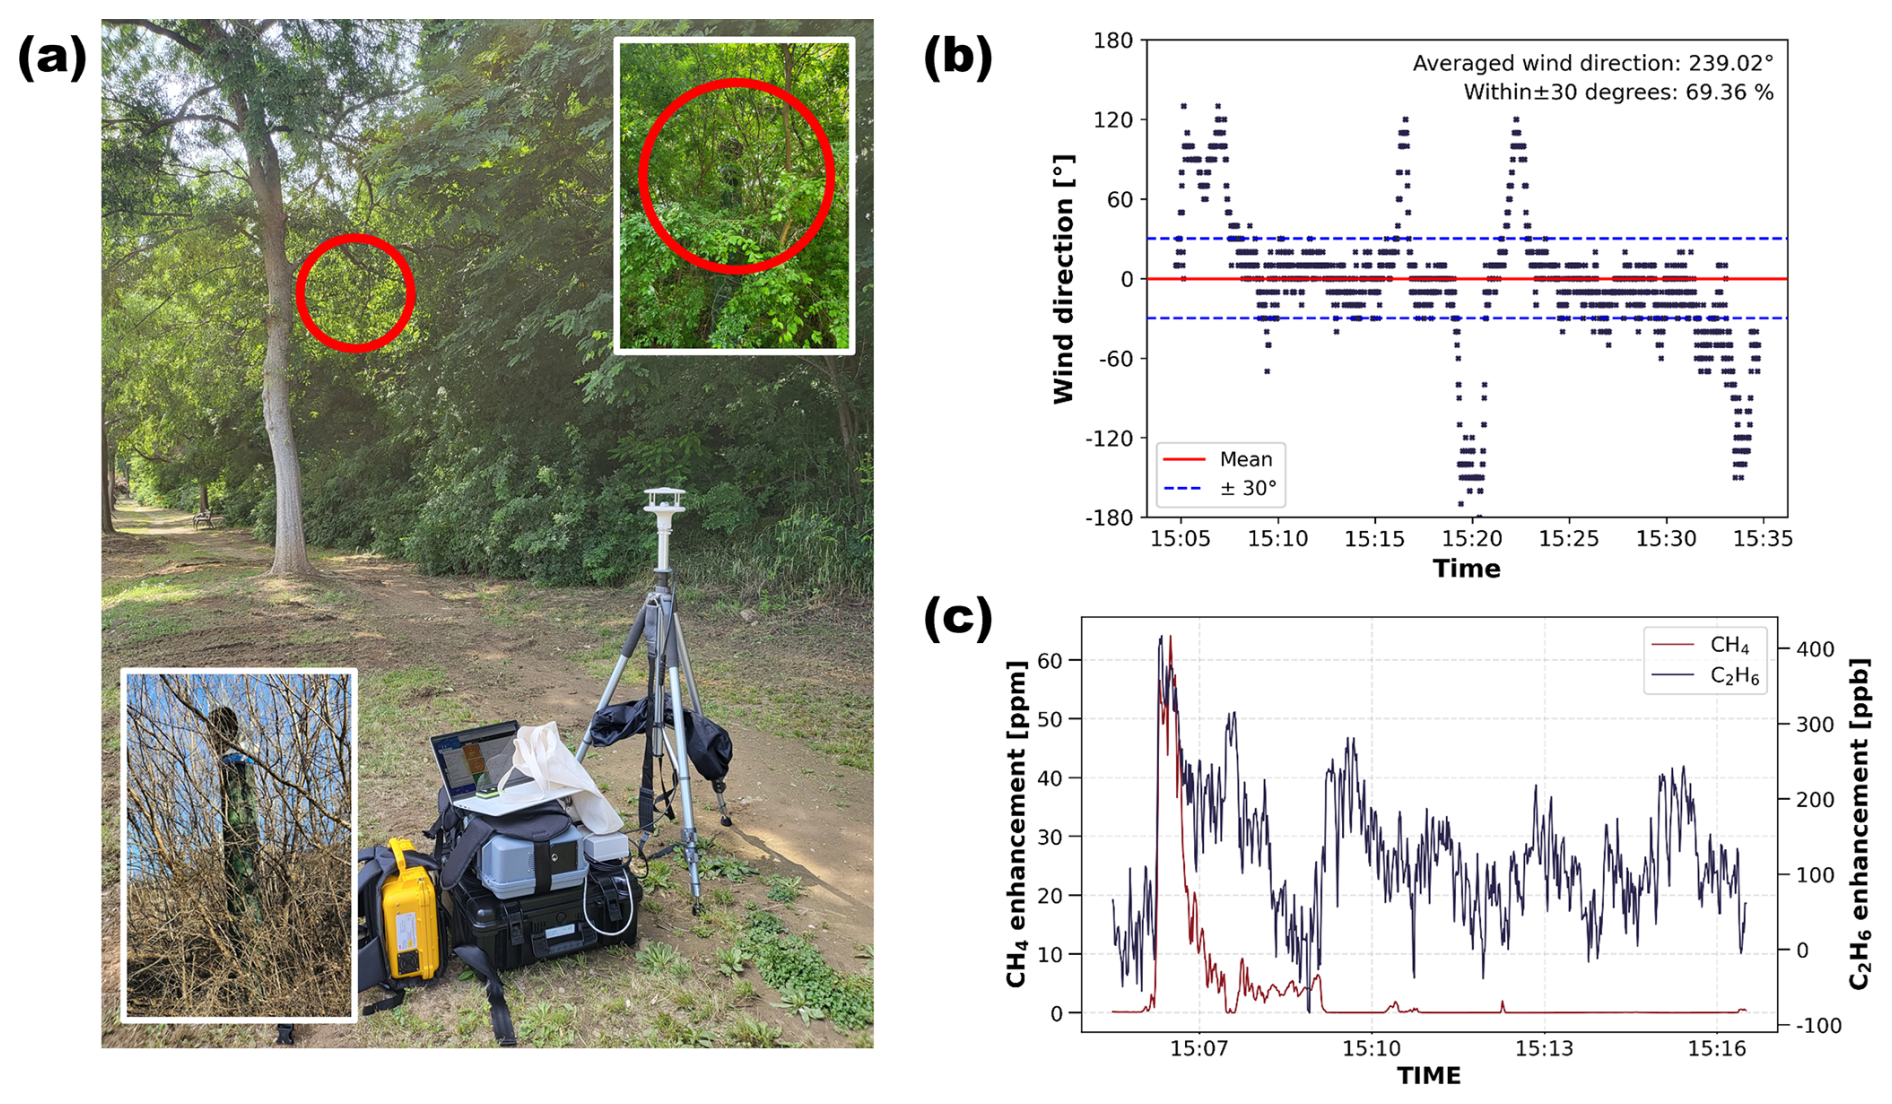
Figure 6Methane emissions from mobile measurements at S3 for OTM-33A on 23 June 2023. (a) indicates the photograph of the stationary measurement point; red circles (inset) show the major methane source of LNG power plant (S3). (b) represents the centered wind direction time series with reference lines at 0° (red) and ± 30° (blue); the header shows the mean centered wind direction and the fraction within ± 30°. (c) represents the CH4 and C2H6 enhancements (ppb).
The contrasting methane emission characteristics of S1, S2, and S3 are shown in Figs. 4 and 5. Figure 5 shows the relatively constant methane emissions during the 10–15 mobile measurement trajectories at S1 and S2. In contrast, Fig. 6 highlights the frequent and pronounced spikes in the methane and ethane concentrations measured downwind of the exhaust source (S3). Methane and ethane concentration data can be used to distinguish between fossil fuels and microbial sources (Joo et al., 2024). Ethane is co-emitted with methane from fossil fuel sources, such as natural gas leaks, whereas microbial processes typically produce methane with negligible amounts of ethane (Maazallahi et al., 2022; Joo et al., 2024). Figure 6 shows that the ethane concentrations increase and decrease in a pattern similar to the methane concentrations at S3, strongly suggesting that the methane emissions measured at S3 originate from the LNG power plant.
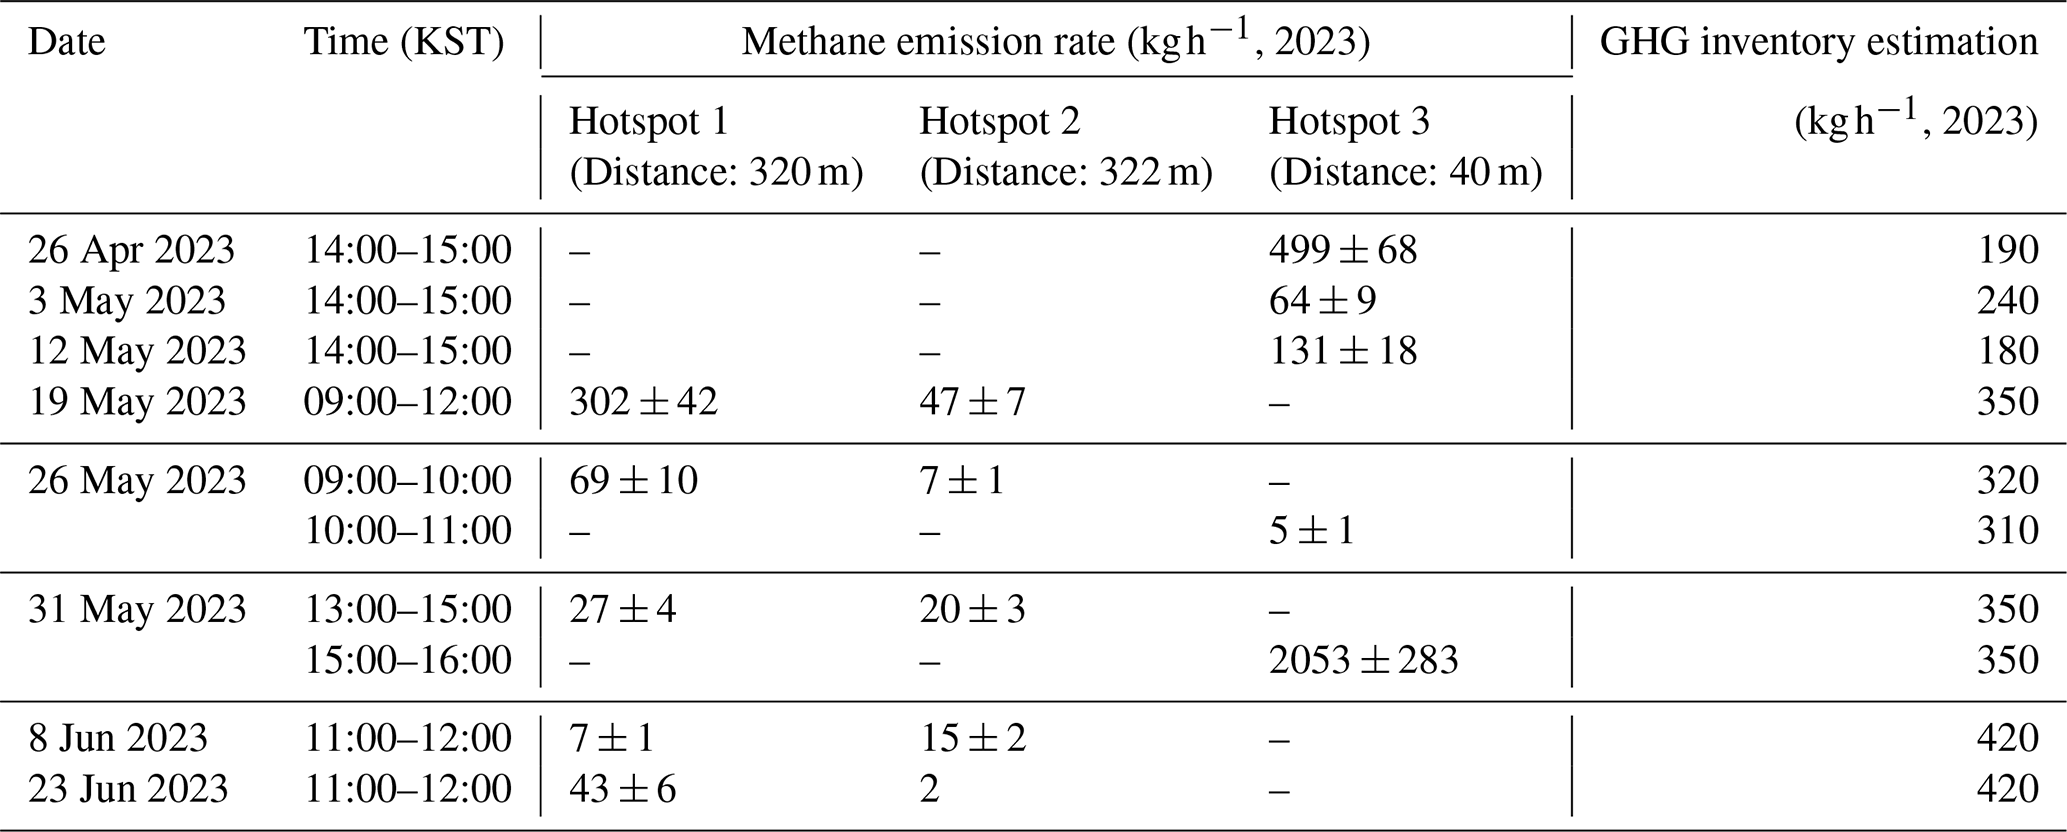
Methane emission rates at S1 and S2 were quantified using the GPDM from the mobile measurement data. The average emission rates of these hotspots were 90 ± 9 kg h−1 for S1 and 18 ± 2 kg h−1 for S2 (Table 3 and Fig. 5). The emission rate at hotspot S3 was quantified using OTM-33A, which is appropriate for the higher concentrations captured in this area, with an average emission rate of 550 ± 58 kg h−1 (Table 3, Fig. 6). Notably, the emissions at S3 exhibited substantial temporal fluctuation, ranging from 64 ± 9 kg h−1 to 2053 ± 283 kg h−1 (31 May; Table 3). Quantification of the methane emission rates at the three hotspots revealed distinct characteristics for the natural gas pipeline-associated locations versus the exhaust pipes of the LNG power plant-associated locations in Table 3 and Figs. 5 and 6. The two hotspots located downwind of the natural gas pipelines and LNG power plant facilities, S1 and S2, exhibited relatively lower and more consistent methane emission rates. In contrast, hotspot S3, which was located downwind of the exhaust pipe and LNG power plant facilities, displayed significantly higher average emissions and pronounced variability. This extreme variability at S3 strongly suggests the occurrence of intermittent, high-magnitude emission events potentially linked to specific operational phases (such as startups, shutdowns, or load changes) or process inefficiencies (such as incomplete combustion), aligning with the concept of “super-emitter” behavior noted in other industrial emission studies (Alvarez et al., 2018; Brandt et al., 2014).
Table 3 shows the significant discrepancies observed between our emission quantifications derived from mobile measurements and fugitive methane estimates based on standard national emission factors and activity data from the target LNG power plant. To enable a direct comparison, the bottom-up annual emission estimates were converted into hourly emission rates (kg h−1) based on the monthly fuel consumption and operating hours corresponding to the measurement period. Although bottom-up inventories generally underestimated emissions, particularly during the significant peak event at S3, there were other instances, particularly at S1 and S2, where the inventories overestimated the measured emissions. Specifically, bottom-up estimates of this study showed a relatively narrow range of 180 ± 499 kg h−1. In contrast, the measured emissions exhibited significant variability across sites, ranging from 7 to 302 kg h−1 at S1, 2 to 47 kg h−1 at S2, and 5 to 2053 kg h−1 at S3. The maximum methane emission rate at S3 on 31 May, 15:00–16:00, was 2053 ± 283 kg h−1, which was significantly higher than the bottom-up estimate of 350 kg h−1. However, Table 3 also indicates that in several instances at S1 and S2, the bottom-up estimates were higher than the measured methane emissions. This highlights the issue of temporal representativeness and emission variability. Although S1 and S2 are presumed to be continuous emission sources, their actual emission rates fluctuate depending on specific operational and meteorological conditions. Because our mobile measurements are snapshot-based (e.g., n=5 for each source), they directly capture the methane emission rates under those specific conditions. Conversely, bottom-up inventories annualize emissions using static factors, failing to account for such operational variability and intermittency. Therefore, the lower measured rates at S1 and S2 strongly suggest that the statistical inventory approach overestimates the emissions by smoothing out these dynamic conditions, rather than our observation-based estimates underestimating them. Discrepancies between fugitive methane estimates from bottom-up inventories and methane emissions from mobile measurements are influenced by several critical factors in LNG power plants. Operational variability, such as startups and shutdowns, can lead to short-term spikes in methane emissions that are difficult to capture using bottom-up methane estimates (Brandt et al., 2014). Furthermore, undetected or slowly developing fugitive emissions from the LNG facilities such as pipelines and fittings can be identified as intermittent “super-emitter” events by ground-based top-down measurements rather than bottom-up methane estimates (Howarth, 2019; Alvarez et al., 2018; Karion et al., 2013). Despite these variations, the discrepancy at source S3 is especially significant. While bottom-up estimates may slightly overestimate emissions at S1 and S2 during normal operations, they completely underestimate the magnitude of emissions at S3. Ground-based top-down measurements at S3 exceeded bottom-up estimates by a factor of 6. Due to the “heavy-tailed” nature of methane emissions, in which a few super-emitters often dominate total emissions (Brandt et al., 2014; Zavala-Araiza et al., 2015), the significant underestimation at S3 outweighs the minor overestimations at S1 and S2. However, characterizing the total methane emissions requires accounting for the full distribution of sources, not just the extreme outliers. Williams et al. (2025) recently demonstrated that dispersed sources emitting less than 100 kg h−1 can collectively account for a majority of total methane emissions in oil and gas basins. In our study, while the super-emitter S3 dominates the total methane emissions, the routine leaks detected at S1 and S2 fall into this category of smaller, dispersed sources, highlighting the need for a comprehensive monitoring strategy that captures both heavy-tailed events and widely distributed smaller leaks.
These findings are consistent with previous research, highlighting the difficulties faced by bottom-up methods in fully accounting for fugitive emissions from LNG power plants (Alvarez et al., 2018; Brandt et al., 2014; Howarth, 2019; Karion et al., 2013; Zavala-Araiza et al., 2015). Alvarez et al. (2018) reported that the actual methane emissions from the US oil and natural gas supply chain were approximately 60 % higher than the estimates provided by EPA inventories. Similarly, our ground-based top-down measurements at the S3 hotspot revealed peak emissions of 2053 ± 283 kg h−1, which are approximately 6 times greater than our corresponding bottom-up estimate of 350 kg h−1. The substantial discrepancy between the measured emission rate and the bottom-up inventory stems directly from the limitations of the input data described in the methodology. While we utilized 5 min operational proxies (MW), the underlying activity data relied on “monthly aggregated LNG consumption.” This temporal resolution inevitably smooths out instantaneous high-emission events. Furthermore, the applied emission factor (87.5 t CH4 PJ−6) accounts only for routine “post-meter leakage” under normal operating conditions and does not capture stochastic super-emitter events – such as incomplete combustion during start-ups or pressure relief venting – which likely caused the elevated plumes detected at the S3 hotspot. This level of discrepancy aligns with measurements of “super-emitter” phenomena in natural gas facilities. Mitchell et al. (2015) found that the top 30 % of natural gas gathering facilities contributed 80 % of the total emissions. One facility alone accounted for 10 % of all measured emissions from the gathering facilities. This indicates that a few sources can have a disproportionate impact on the overall emissions. Mitchell et al. (2015) reported a median throughput-normalized weighted average facility-level emissions rate of 0.079 % for processing plants. These plants differ from LNG power plants but have similar components. The magnitude of our peak S3 emission (2053 kg h−1) suggests a significant emission event that far exceeds typical operational estimates. This level of discrepancy aligns with “super-emitter” phenomena measurements in natural gas facilities. Jia et al. (2025) quantified fugitive methane emissions from typical natural gas infrastructure components (e.g., valves, flanges) using on-site measurement techniques. They reported that the total annual emissions from an entire LNG terminal were approximately 5202 kg yr−1 (averaging 0.6 kg h−1), with individual components emitting significantly less. In comparison, the methane emissions identified in our study at sources S1 (90 ± 9 kg h−1) and S2 (18 ± 2 kg h−1) are orders of magnitude higher than these typical component-level methane emissions. These results suggest that the emissions at S1 and S2 are caused by high-pressure fugitive leaks or compromised infrastructure, which is different from the minor component-level leaks that are typical of standard distribution stations. Furthermore, Zimmerle et al. (2015) reported comprehensive transmission and storage (T&S) sector measurements. Their study determined the mean methane emission rates to be approximately 670 Mg yr−1 (equivalent to ∼ 76.5 kg h−1) for transmission stations and 847 Mg yr−1 (equivalent to ∼ 96.7 kg h−1) for underground storage facilities. When placed in this context, the emission rate at S1 (90 ± 9 kg h−1) is comparable to the average emission load of an entire US transmission station, indicating a substantial facility-level emissions. In stark contrast, the maximum emission rate at S3 (2053 ± 283 kg h−1) is exceptionally high, exceeding the average emissions of these large-scale midstream facilities by a factor of over 20. While S1 and S2 represent significant localized leaks, S3 falls into the category of extreme super-emitters, exhibiting discharge rates far surpassing typical operational emissions found in standard natural gas infrastructure.
To further contextualize the magnitude of these emissions, we compared our findings with the official 2023 GHG inventory of Seoul (SCNSC, 2026). The reported annual methane emissions from the entire energy fugitive sector were approximately 4464 t, and the wastewater treatment sector accounted for approximately 1607 t. Although emissions at S3 hotspot are likely intermittent, extrapolating the average measured rate of 550 kg h−1 to an annual scale yields a potential magnitude of approximately 4818 t. Notably, this potential figure from a single hotspot exceeds the total reported fugitive emissions for the entire Seoul and is nearly three times higher than the emissions from the wastewater treatment sector alone. This comparison illustrates how current bottom-up inventories may significantly underestimate urban methane budgets by failing to account for the intensity of industrial super-emitters.
Table 3Quantification of methane emissions by mobile measurements and bottom-up GHG inventory estimates.
The fugitive methane emissions identified in this study also represent a significant economic loss. Based on the maximum emission rate at S3 (2053 ± 283 kg h−1), we estimated the potential annual financial loss. Using the lower heating value (LHV) of methane and the power generation charge rates from the Korea Gas Corporation (KOGAS, 2026), the estimated annual loss amounts to approximately USD 15.77 million. It is important to note the conceptual distinction between instantaneous emission rates and total annualized emissions. Meaningful extrapolation to total emissions is only robust when the temporal distribution, frequency, and duration of emission events are adequately characterized. Therefore, this calculation assumes that the maximum methane emission event occurs continuously, serving strictly as an upper-bound estimate of the potential revenue loss. This substantial economic cost underscores the necessity and cost-effectiveness of implementing stricter leak detection and repair (LDAR) protocols to minimize fugitive emissions. The annual financial loss was calculated using Eq. (3);
where, Q is the methane emission rate (t CH4 h−1), LHV is the lower heating value of methane (50.1 GJ t−1), the Charge is based on KOGAS power generation rates converted to USD (2023 average exchange rate, USD 1 = KRW 1 305 979), f is the continuous operation factor (set to f=1).
This study identified and quantified fugitive methane emissions from an urban LNG gas-fired power plant in Seoul using a mobile measurement platform. By integrating mobile measurements with GPDM and OTM-33A, we demonstrated that ground-based top-down approaches can effectively quantify emission sources even in complex urban environments where facility access is restricted. Our measurements revealed three distinct emission hotspots with varying characteristics. Sources S1 and S2 were identified as continuous fugitive leaks associated with underground pipeline infrastructure, exhibiting consistent emission rates of 90 ± 9 and 18 ± 2 kg h−1, respectively. In contrast, source S3 was characterized as a stochastic super-emitter, with a peak emission rate reaching 2053 ± 283 kg h−1. The magnitude and intermittency of S3 suggest it is driven by operational venting or incomplete combustion, events that are typically invisible to standard leak detection protocols. A critical finding of this research is the substantial discrepancy between our ground-based top-down measurements and bottom-up inventory estimates. The high temporal variability observed at S3 demonstrates that emission factors used in current inventories fail to capture transient, high-intensity events. This disparity underscores the inherent limitations of current greenhouse gas inventory calculation methods, which often fail to account for fugitive emissions arising from specific, variable operational conditions. Furthermore, the estimated potential financial loss of approximately USD 15.77 million yr−1 underscores the economic urgency of addressing these leaks.
In conclusion, relying solely on current inventories can lead to a significant underestimation of the methane emissions from urban energy infrastructure. We recommend implementing continuous methane monitoring systems and conducting regular mobile measurements to capture the full distribution of emissions, including those from heavy-tailed super-emitters. These transparent, measurement-based strategies are crucial for accurately assessing and effectively mitigating greenhouse gas emissions in the energy sector.
Data are available upon request to the corresponding author Sujong Jeong (sujong@snu.ac.kr).
JJ and SJ designed and wrote the manuscript of this research. JJ, HL, JS, and DK conducted mobile measurements. HL, YK and DC conducted data analysis for estimating methane emission rates.
The contact author has declared that none of the authors has any competing interests.
Publisher's note: Copernicus Publications remains neutral with regard to jurisdictional claims made in the text, published maps, institutional affiliations, or any other geographical representation in this paper. The authors bear the ultimate responsibility for providing appropriate place names. Views expressed in the text are those of the authors and do not necessarily reflect the views of the publisher.
Map data are the copyright of OpenStreetMap contributors and available from https://www.openstreetmap.org (last access: 18 October2025).
This work was supported by Korea Environment Industry & Technology Institute (KEITI) through Project for developing an observation-based GHG emissions geospatial information map, funded by Korea Ministry of Environment (MOE) (RS-2023-00232066) and the Carbon Neutrality Core Technology Development Program (RS-2023-00267529, 2410000450) funded by the Ministry of Trade, Industry & Energy (MOTIE, Korea) and Korea Planning & Evaluation Institute of Industrial Technology (KEIT, Korea).
This paper was edited by Zhao-Cheng Zeng and reviewed by two anonymous referees.
Al-Kuwari, O.: The future of liquified natural gas (LNG) in the energy transition: options and implications for the LNG industry in a decarbonising world, UCL (University College London), 2023.
Alvarez, R. A., Zavala-Araiza, D., Lyon, D. R., Allen, D. T., Barkley, Z. R., Brandt, A. R., Davis, K. J., Herndon, S. C., Jacob, D. J., and Karion, A.: Assessment of methane emissions from the US oil and gas supply chain, Science, 361, 186–188, https://doi.org/10.1126/science.aar7204, 2018.
Brandt, A. R., Heath, G., Kort, E., O'Sullivan, F., Pétron, G., Jordaan, S. M., Tans, P., Wilcox, J., Gopstein, A., and Arent, D.: Methane leaks from North American natural gas systems, Science, 343, 733–735, https://doi.org/10.1126/science.1247045, 2014.
Chen, J., Dietrich, F., Maazallahi, H., Forstmaier, A., Winkler, D., Hofmann, M. E. G., Denier van der Gon, H., and Röckmann, T.: Methane emissions from the Munich Oktoberfest, Atmos. Chem. Phys., 20, 3683–3696, https://doi.org/10.5194/acp-20-3683-2020, 2020.
GIIGNL: The LNG Industry – GIIGNL Annual Report 2024, GIIGNL, Paris, 2024, https://giignl.org (last access: 10 October 2025).
Howarth, R. W.: Ideas and perspectives: is shale gas a major driver of recent increase in global atmospheric methane?, Biogeosciences, 16, 3033–3046, https://doi.org/10.5194/bg-16-3033-2019, 2019.
Howarth, R. W.: The greenhouse gas footprint of liquefied natural gas (LNG) exported from the United States, Energy Sci. Eng., 12, 4843–4859, https://doi.org/10.1002/ese3.1934, 2024.
International Gas Union (IGU): World LNG Report 2024, IGU, https://www.igu.org (last access: 10 October 2025), 2024.
IPCC: Climate Change 2021 – The Physical Science Basis: Working Group I Contribution to the Sixth Assessment Report of the Intergovernmental Panel on Climate Change, Cambridge University Press, Cambridge, https://doi.org/10.1017/9781009157896, 2023.
Jia, W., Jia, P., Gu, L., Ren, L., Zhang, Y., Chen, H., Wu, X., Feng, W., and Cai, J.: Quantification of methane emissions from typical natural gas stations using on-site measurement technology, Journal of Pipeline Science and Engineering, 5, https://doi.org/10.1016/j.jpse.2024.100229, 2025.
Joo, J., Jeong, S., Shin, J., and Chang, D. Y.: Missing methane emissions from urban sewer networks, Environ. Pollut., 342, 123101, https://doi.org/10.1016/j.envpol.2023.123101, 2024.
Karion, A., Sweeney, C., Pétron, G., Frost, G., Michael Hardesty, R., Kofler, J., Miller, B. R., Newberger, T., Wolter, S., and Banta, R.: Methane emissions estimate from airborne measurements over a western United States natural gas field, Geophys. Res. Lett., 40, 4393–4397, https://doi.org/10.1002/grl.50811, 2013.
Korea Gas Corporation (KOGAS): Natural gas tariff for power generation, Korea Gas Corporation, https://www.kogas.or.kr/site/koGas/1040402000000, last access: 21 January 2026 (in Korean).
Korea Midland Power Co., Ltd. (KOMIPO): Seoul Power Generation Site Division, https://www.komipo.co.kr/eng/content/198/main.do?mnCd=EN010403, last access: 27 January 2026.
Korea Power Exchange (KPX): Real-time power generation data, Korea Power Exchange, https://new.kpx.or.kr/board.es?mid=a10109020400&bid=0068, last access: 10 October 2025 (in Korean).
Korea Research Institute of Standards and Science (KRISS): CIPM MRA, Korea Research Institute of Standards and Science, https://www.kriss.re.kr/menu.es?mid=80a20105020000, last access: 23 January 2026.
Lyon, D. R., Zavala-Araiza, D., Alvarez, R. A., Harriss, R., Palacios, V., Lan, X., Talbot, R., Lavoie, T., Shepson, P., and Yacovitch, T. I.: Constructing a spatially resolved methane emission inventory for the Barnett Shale region, Environ. Sci. Technol., 49, 8147–8157, https://doi.org/10.1021/es506359c, 2015.
Maazallahi, H., Fernandez, J. M., Menoud, M., Zavala-Araiza, D., Weller, Z. D., Schwietzke, S., von Fischer, J. C., Denier van der Gon, H., and Röckmann, T.: Methane mapping, emission quantification, and attribution in two European cities: Utrecht (NL) and Hamburg (DE), Atmos. Chem. Phys., 20, 14717–14740, https://doi.org/10.5194/acp-20-14717-2020, 2020.
Maazallahi, H., Delre, A., Scheutz, C., Fredenslund, A. M., Schwietzke, S., Denier van der Gon, H., and Röckmann, T.: Intercomparison of detection and quantification methods for methane emissions from the natural gas distribution network in Hamburg, Germany, Atmos. Meas. Tech., 16, 5051–5073, https://doi.org/10.5194/amt-16-5051-2023, 2023.
Mitchell, A. L., Tkacik, D. S., Roscioli, J. R., Herndon, S. C., Yacovitch, T. I., Martinez, D. M., Vaughn, T. L., Williams, L. L., Sullivan, M. R., and Floerchinger, C.: Measurements of methane emissions from natural gas gathering facilities and processing plants: Measurement results, Environ. Sci. Technol., 49, 3219–3227, https://doi.org/10.1021/es5052809, 2015.
Plant, G., Kort, E. A., Brandt, A. R., Chen, Y., Fordice, G., Gorchov Negron, A. M., and Zavala-Araiza, D.: Inefficient and unlit natural gas flares both emit large quantities of methane, Science, 377, 1566–1571, https://doi.org/10.1126/science.abq0385, 2022.
Rutherford, J. S., Sherwin, E. D., Ravikumar, A. P., Heath, G. A., Englander, J. G., Cooley, D., Lyon, D., Omara, M., Langfitt, Q., and Brandt, A. R.: Closing the methane gap in US oil and natural gas production emissions inventories, Nat. Commun., 12, 4715, https://doi.org/10.1038/s41467-021-25017-4, 2021.
Seoul Carbon Neutrality Support Center (SCNSC): 2023 Greenhouse Gas Inventory Report of Seoul, Seoul Carbon Neutrality Support Center, https://news.seoul.go.kr/env/climate-environment/climatechange-strategy/green-inventory-report#view/451138 last access: 29 January 2026 (in Korean).
Thoma, E. and Squier, B.: OTM 33 geospatial measurement of air pollution, remote emissions quantification (gmap-req) and OTM33A geospatial measurement of air pollution-remote emissions quantification-direct assessment (GMAP-REQ-DA), US Environmental Protection Agency, Cincinnati, OH, 2014.
Turner, D.: Workbook of atmospheric dispersion estimates, US Environmental Protection Agency, Environment Health Series Air Pollution, 84, 16, 1970.
Vogel, F., Ars, S., Wunch, D., Lavoie, J., Gillespie, L., Maazallahi, H., Röckmann, T., Nęcki, J., Bartyzel, J., and Jagoda, P.: Ground-based mobile measurements to track urban methane emissions from natural gas in 12 cities across eight countries, Environ. Sci. Technol., 58, 2271–2281, https://doi.org/10.1021/acs.est.3c03160, 2024.
Weller, Z. D., Hamburg, S. P., and von Fischer, J. C.: A national estimate of methane leakage from pipeline mains in natural gas local distribution systems, Environ. Sci. Technol., 54(14), 8958–8967, https://doi.org/10.1021/acs.est.0c00437, 2020.
Williams, J. P., Omara, M., Himmelberger, A., Zavala-Araiza, D., MacKay, K., Benmergui, J., Sargent, M., Wofsy, S. C., Hamburg, S. P., and Gautam, R.: Small emission sources in aggregate disproportionately account for a large majority of total methane emissions from the US oil and gas sector, Atmos. Chem. Phys., 25, 1513–1532, https://doi.org/10.5194/acp-25-1513-2025, 2025.
Zavala-Araiza, D., Lyon, D., Alvarez, R. A., Palacios, V., Harriss, R., Lan, X., Talbot, R., and Hamburg, S. P.: Toward a functional definition of methane super-emitters: Application to natural gas production sites, Environ. Sci. Technol., 49, 8167–8174, https://doi.org/10.1021/acs.est.5b00133, 2015.
Zimmerle, D. J., Williams, L. L., Vaughn, T. L., Quinn, C., Subramanian, R., Duggan, G. P., Willson, B., Opsomer, J. D., Marchese, A. J., Martinez, H. E., and Robinson, A. L.: Methane emissions from the natural gas transmission and storage system in the United States, Environ. Sci. Technol., 49, 9374–9383, https://doi.org/10.1021/acs.est.5b01669, 2015.