the Creative Commons Attribution 4.0 License.
the Creative Commons Attribution 4.0 License.
 | 19 May 2026
Reflectance-based cross-calibration of GOME and SCIAMACHY spectrometers enhanced by polarization monitoring devices data
Melanie Coldewey-Egbers
Sander Slijkhuis
Günter Lichtenberg
Bernd Aberle
Spectrometer instruments have significantly contributed to monitoring atmospheric composition and climate change for decades. Among them, the Global Ozone Monitoring Experiment (GOME, 1995–2011) and the Scanning Imaging Absorption Spectrometer for Atmospheric Chartography (SCIAMACHY, 2002–2012) were two well-known sensors whose missions overlapped by nearly a decade. Both instruments provided valuable data for atmospheric applications. However, to ensure data consistency and extend long-term time series, cross-calibration between the two instruments is important. The Fundamental Data Record for Atmospheric Composition (FDR4ATMOS) project, initiated by the European Space Agency (ESA), aims at harmonizing GOME and SCIAMACHY Level 1 data, i.e., irradiance and reflectance measurements.
This paper presents, for the first time, a cross-calibration methodology for the top-of-atmosphere (TOA) reflectance of the spectrometers developed within the FDR4ATMOS project. Sub-pixel variability analysis, based on Polarization Monitoring Devices (PMD) data, enabled the evaluation of the homogeneity and similarity of the scene as observed by GOME and SCIAMACHY, thereby reducing the uncertainty in the cross-calibration process. Key challenges, including differing spatial resolutions, the absence of exact spatiotemporal overlap, and the need to preserve spectral structure, were addressed through targeted strategies. These included the selection of scenes with minimal acquisition time differences over Pseudo-Invariant Calibration Sites (PICS) characterized by stable meteorological and atmospheric conditions. A critical step consisted of spatially weighted averaging of SCIAMACHY pixels within each GOME footprint, followed by the computation of spectral channel–wise ratios across Bands 2B, 3, and 4, covering the ultraviolet, visible, and near-infrared (UV/VIS/NIR) spectral regions where many dominant trace gases are present. Furthermore, PMD data from both GOME and SCIAMACHY were analyzed to assess the spatial homogeneity of the pixels used in the cross-calibration and to evaluate its impact on cross-calibration performance.
Observations under near-clear-sky conditions from 2003 were collocated over PICS and used to derive transfer functions (TFs). Polynomial TFs were fitted for Bands 2B and 3, while a constant TF was used for Band 4. The TFs showed dependence on viewing zenith angle (VZA), degradation, and wavelength. The uncertainty in the TFs increased with wavelength due to decreasing homogeneity of the cross-calibrated pixels, as indicated by the PMD data analysis, where pixel-to-pixel variability became larger. Using PMD measurements from cross-calibrated pixels as an indicator to filter out non-homogeneous pixels of the main spectral channels resulted in an uncertainty reduction of up to 70 % in the TFs.
Overall, the presented cross-calibration approach and PMD-based analysis provide a pathway toward generating consistent and long-term spectrometer records. This work highlights the potential for extending the cross-calibration beyond traditional PICS and ideally suited scenes, increasing robustness across varied surfaces and atmospheric conditions.
- Article
(7319 KB) - Full-text XML
- Companion paper
- BibTeX
- EndNote


1.1 Motivation
Satellite remote sensing data has been increasingly used in various operational applications, such as atmospheric applications (Zhang et al., 2020). The increased number of satellite missions has led to the rapid growth of remote sensing archives from diverse satellite missions. These archives help to track and monitor atmospheric conditions and phenomena. In addition to high spatial and radiometric resolution, they offer global coverage. One of these applications, which received considerable attention in the last decades, is the retrieval of trace gases (Abad et al., 2019; He et al., 2024). Accurate emission monitoring over timelines spanning decades is essential for assessing measures to improve, for example, air quality and for understanding atmospheric processes.
Major trend analyses regarding the atmospheric environment require long-term datasets to provide a continuous and comprehensive view of gases. The time series analysis should have more than a decade of data, which could be greater than the individual satellite lifetime (Cabor et al., 1998). To avoid discontinuity in time series data, it is necessary to fully use the ever-increasing number of satellite systems from the historical and current missions. To generate consistent time series data from multi-mission sensors, several factors should be considered, including the differences in the sensors' characteristics, such as overpassing time, data quantity, viewing geometry, solar geometry, instrument-related effects, and atmospheric conditions (Barnes et al., 2021).
1.2 Cross-calibration based on Pseudo-Invariant Calibration Sites
Cross-calibration is a method of ensuring the consistency, accuracy, and comparability of measurements from different instruments, platforms, and missions. Cross-calibration consists of comparing the monitored measurements to reference instruments (Chander et al., 2013b). For trace gas applications, monitored parameters include reflectance or radiance and solar irradiance. The optimal situation to perform the cross-calibration is to acquire the measurements from both sensors simultaneously in the same geometrical and solar conditions. However, the spatiotemporal coincidence measurements are usually not very frequent, which complicates the cross-calibration.
Vicarious calibration is a well-known method of absolute calibration based on precise measurements of spectral reflectance from ground instruments over a target (Patel et al., 2016; Wang et al., 2025), or measurements acquired over sites with invariant surface properties such as deserts or oceans (Ma et al., 2015). Man-made features, such as concrete structures, preserve the ground reflectance values and do not change significantly over time. These features, known as pseudo-invariant targets, can also serve as reference measurements for calibration (Hadjimitsis et al., 2009). This type of cross-calibration is independent of the satellites’ onboard calibration systems.
Pseudo-Invariant Calibration Sites (PICS) are one of the most widely used sites in the vicarious calibration methods (Wu et al., 2020; Barsi et al., 2016; Cabor et al., 1998; Helder et al., 2013; Chander et al., 2013a). Cosnefroy et al. (1996) proposed desert sites in Africa and the Arabian Peninsula with 100×100 km2. Cosnefroy et al. (1996) demonstrated the methods and criteria used for identifying PICS based on observations taken from Meteosat-4 from July 1989 to January 1990. The selection criteria ranged from spatial and temporal variability of the surface reflectance, cloud cover, precipitation, geomorphology, and bidirectional effects. It has been assumed that these sites had spatial uniformity better than 3 % in a multi-temporal series of cloud-free images (Cosnefroy et al., 1996). The primary characteristics of these sites are limited precipitation, a lack of vegetation cover, and minimal human-induced changes. Many studies assumed that the PICS remain temporally invariant (Khadka et al., 2021), and the radiance upwelling from the Earth can be assumed to be constant (Helder et al., 2013). Therefore, the main part of the changes observed in the temporal stability of sites will be directly related to the changes that occurred to the sensors.
1.3 GOME and SCIAMACHY spectrometers cross-calibration
The Global Ozone Monitoring Experiment (GOME) and Scanning Imaging Absorption Spectrometer for Atmospheric Chartography (SCIAMACHY) were used primarily for the retrieval of trace gases. Owda and Lichtenberg (2026) compared the life mission top-of-atmosphere (TOA) reflectance – hereafter referred to as reflectance, unless stated otherwise – data of GOME and SCIAMACHY over the PICS under near-clear-sky conditions. They found that the reflectance time series of SCIAMACHY observations were more uniform and stationary compared with the GOME reflectance time series. The same study showed that GOME reflectance suffered from severe degradation in 2001 and toward the end of its life mission, in agreement with Coldewey-Egbers et al. (2018). Therefore, it was recommended to use SCIAMACHY as the reference sensor in the cross-calibration. The SCIAMACHY data from 2003 were selected as a reference to perform the harmonization between GOME and SCIAMACHY. This choice was due to (i) SCIAMACHY being at the beginning of the mission and exhibiting no or negligible instrument degradation. The reference point for the SCIAMACHY degradation was taken as 27 February 2003. Choosing the same year minimized degradation-related uncertainties. (ii) SCIAMACHY has better capabilities for in-flight calibration, and Level 1b data have better degradation correction (Hilbig et al., 2019; Lichtenberg et al., 2006).
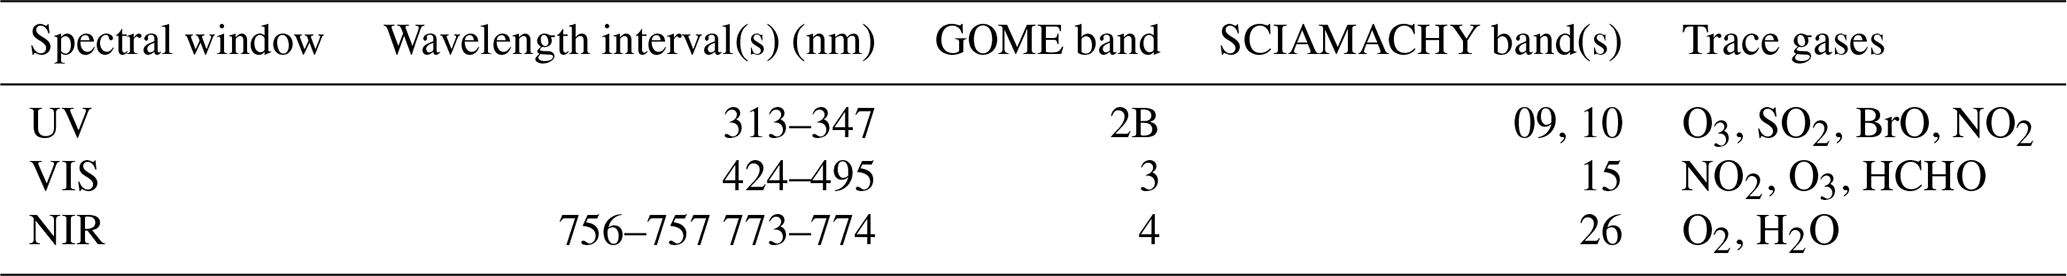
The reflectance and solar irradiance from Level 1 of GOME and SCIAMACHY have been cross-calibrated in the Fundamental Data Records in the Domain of Satellite Atmospheric Composition (FDR4ATMOS) project (ESA, 2024a). The FDR4ATMOS focused on three spectral windows in the ultraviolet, visible, and near-infrared (UV/VIS/NIR), as these regions contain well-characterized absorption features of many key atmospheric trace gases (see Table 4).
This cross-calibration between the satellite spectrometers GOME and SCIAMACHY implies several unique challenges. Despite the significant temporal overlap of the two missions, there were no simultaneous observations at the same locations. Additionally, a difference in spatial resolution further complicates the cross-calibration process. These challenges highlight fundamental differences between spectrometer cross-calibration and that of imaging satellite instruments, which typically do not face such constraints. Cross-calibration of imaging sensors does not require the stringent point-to-point accuracy needed for spectroscopic trace-gas retrievals, as imaging applications are less sensitive to small radiometric inconsistencies than Differential Optical Absorption Spectroscopy (DOAS)-based retrievals, which typically demand relative accuracy on the order of 10−4. In contrast, trace gas retrievals using data from GOME require specialized approaches that maintain the integrity of spectral data throughout the calibration process.
This paper focuses on addressing these issues, proposing a methodology tailored specifically for cross-calibrating satellite spectrometers, rather than conventional imaging instruments. The paper is structured as follows: Sections 2 and 3 describe the sensors and study areas. The cross-calibration method is presented in Sect. 4. Sections 5 and 6 present the results and the discussions, respectively. Finally, the conclusion and final remarks are given in Sect. 7.
2.1 GOME
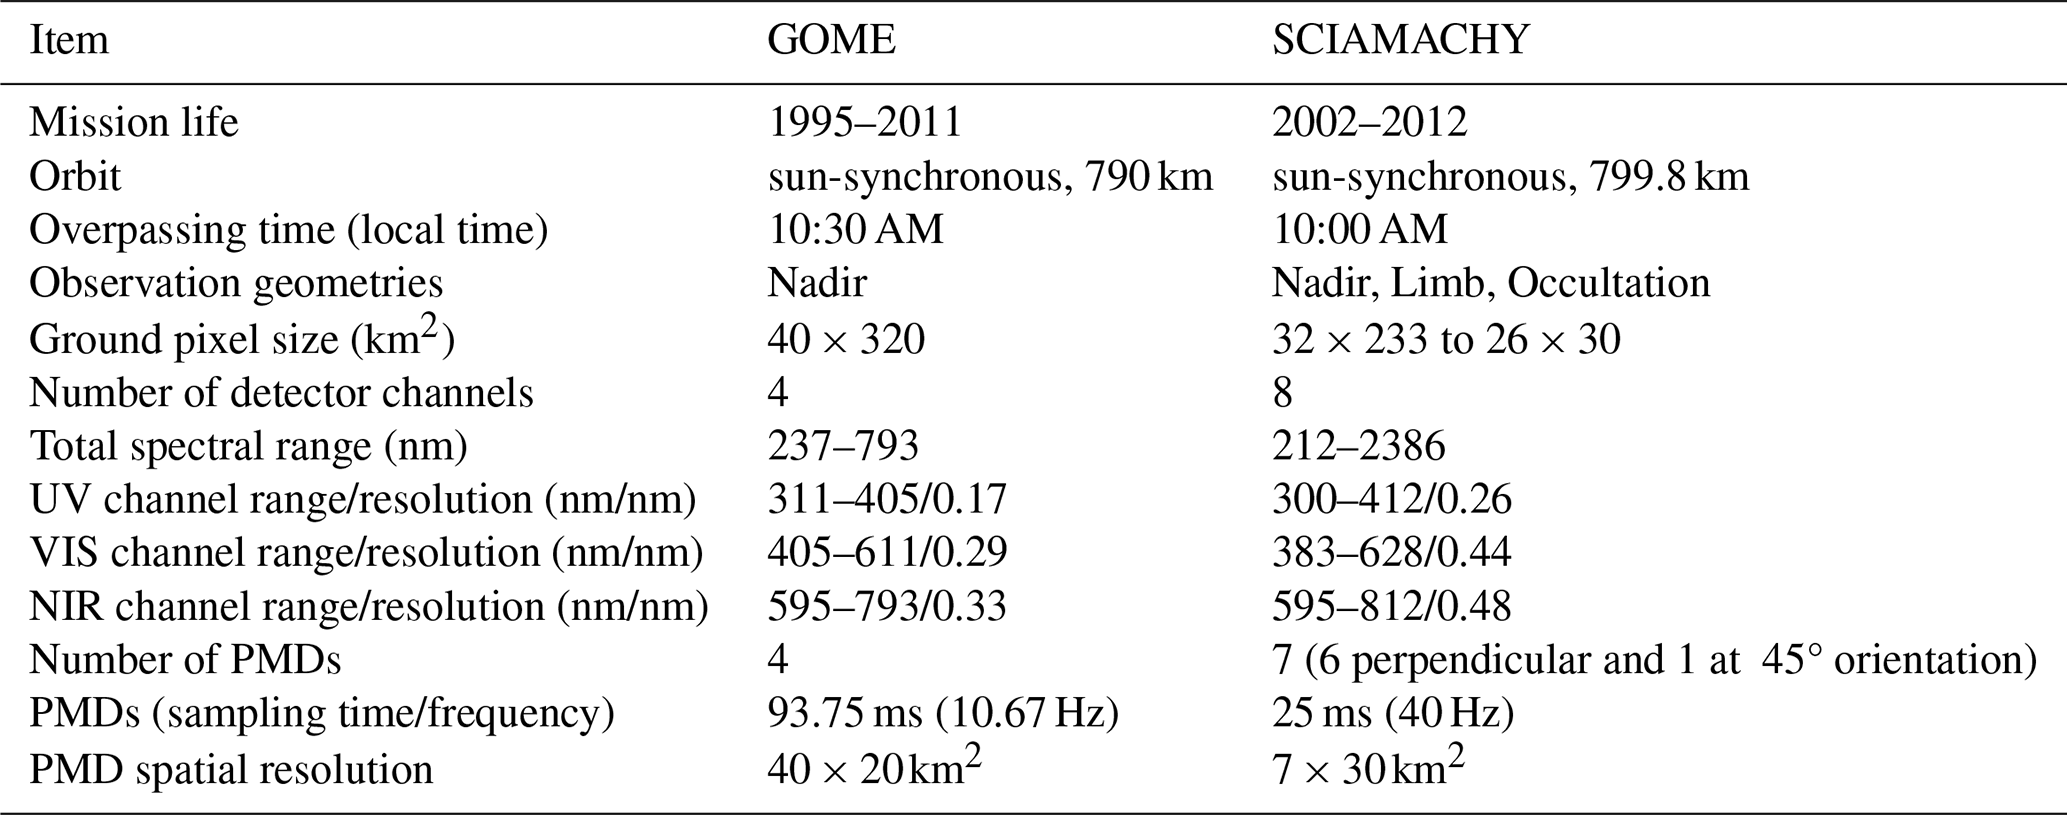
GOME (1995–2011) was a passive nadir-viewing, grating spectrometer, covering the UV, VIS, and NIR spectral ranges. It was mounted on the second European Remote Sensing (ERS-2) satellite (ESA, 2025b). GOME could provide global coverage every 3 d. The primary objective of the mission was to collect observations to measure the total column of ozone, nitrogen dioxide, clouds, aerosols, pollutants, and other atmospheric compositions (Burrows et al., 1999). The mission measured the upwelling solar radiation reflected or scattered by the Earth's atmosphere and surface in the wavelength range of 240–790 nm.
GOME operated using both forward and backward scanning modes, producing four ground pixels per scan cycle (3 forward and 1 backward), each with an integration time of 1.5 s. In the forward scan, three pixels were recorded in the east, nadir, and west directions, each covering a minimum spatial resolution of 40×320 km2. The backward scan produced one pixel with a coarser spatial resolution of 40×960 km2. The instrument was equipped with three Polarization Monitoring Devices (PMDs) and four detector channels. The spectral resolution was approximately 0.2 nm in the UV range and 0.4 nm in the VIS and NIR. The PMDs are broadband detectors specifically designed to capture polarization information with high spatial resolution.
2.2 SCIAMACHY
SCIAMACHY (2002–2012) was a passive imaging spectrometer aboard the ENVISAT satellite (ESA, 2025d). It operated across the UV, VIS, NIR, and shortwave infrared (SWIR) spectral regions, covering wavelengths from 240 to 2400 nm. The instrument featured three distinct observation modes: nadir, limb, and solar/lunar occultation.
The primary mission objective was to monitor various processes that affect the chemical composition of the troposphere and stratosphere (Bovensmann et al., 1999). In nadir mode, SCIAMACHY provided measurements at a spatial resolution between 26×30 and 32×233 km2, depending on the wavelength and orbit phase. The swath width was 960 km. The instrument was equipped with eight detector channels and seven PMDs. Various atmospheric gases, aerosol characteristics, radiation budgets, and cloud properties were retrieved.
The differences between GOME and SCIAMACHY are illustrated in Table 1.
Table 1Comparison of GOME and SCIAMACHY satellite instruments.
2.3 GOME and SCIAMACHY data
The fully calibrated Level 1 products from GOME (Level 1b) and SCIAMACHY (Level 1c) were used as input for the cross-calibration method. Both products contained solar irradiance and radiance measurements used to compute reflectance, as explained later in Sect. 4.1.1. For SCIAMACHY, cloud information from Level 2 was added to the standard Level 1c products, whereas GOME Level 1b products already contained cloud information. The PMD measurements in both GOME and SCIAMACHY products were sun-normalized.
The following are the main parameters from both sensors used in this research study:
-
Reflectances: This denotes the proportion of incident solar radiation that is reflected toward the sensor. It includes contributions from both the Earth's surface and the atmosphere through scattering. Reflectance is used because instrumental effects common to both Earth and Sun observation light paths, such as etalon interference, are largely canceled through the ratioing process. Furthermore, the retrieval of most atmospheric parameters is based on the reflectance. Reflectance served as a key parameter for the derivation of the transfer functions (TFs), which were used to update the GOME observations based on SCIAMACHY observations, as defined in Sect. 4.1.4. The reflectance measurements were denoted as Rg and Rs, for GOME and SCIAMACHY, respectively.
-
Cloud fraction (CF): represents by a range from 0 to 1, where 0 indicates clear sky (no clouds) and 1 indicates full cloud cover. The cloud fraction was used to assess the cloud conditions of overlapping pixels from both sensors. To minimize the influence of CF on the cross-calibration process, only pixels with a CF below 0.25 were selected.
-
Viewing zenith angle (VZA): The VZA is the angle between the incoming radiation directed toward the sensor and the vertical line (nadir) directly below the sensor. GOME and SCIAMACHY measured the incoming radiation based on a scanning mirror that sweeps the Earth's surface in the east-west direction. The influence of the line-of-sight on the TFs was investigated using the VZA.
-
Information from PMDs: PMDs offer a higher spatial resolution compared to the measurements from the main detector channels. The higher spatial resolution of PMDs compared with the main detector channels' resolution (see Table 1) allowed multiple PMD measurements to be captured within a single GOME or SCIAMACHY ground pixel. This enabled the investigation of variation at the sub-pixel scale. For GOME, the PMDs were read out sequentially every 93.75 ms, which means for a nominal East-West scan (4.5 s), 48 PMD measurements were collocated. For a possible scan width of 960 km, each PMD could cover an area of 40×20 km2 (Table 1). As a result, PMDs were utilized to assess the homogeneity of the overlapping pixels from GOME and SCIAMACHY. The PMD measurements used in this study were normalized with the PMD measurements of the sun. The wavelength ranges covered by the PMDs were chosen to overlap with the corresponding spectral channels. For instance, the wavelength ranges of the PMD-1 for both GOME and SCIAMACHY (Table 2) aligned with the wavelength range in the UV band used for the cross-calibration in the FDR4ATMOS (Table 3). The wavelength ranges of the PMDs in GOME were broader than those of the corresponding PMDs in SCIAMACHY; hence, different PMD measurement values were expected for SCIAMACHY and GOME.
Table 2The PMDs were used in the analysis to assess scene homogeneity. The wavelength ranges of the PMDs for both GOME and SCIAMACHY are shown.
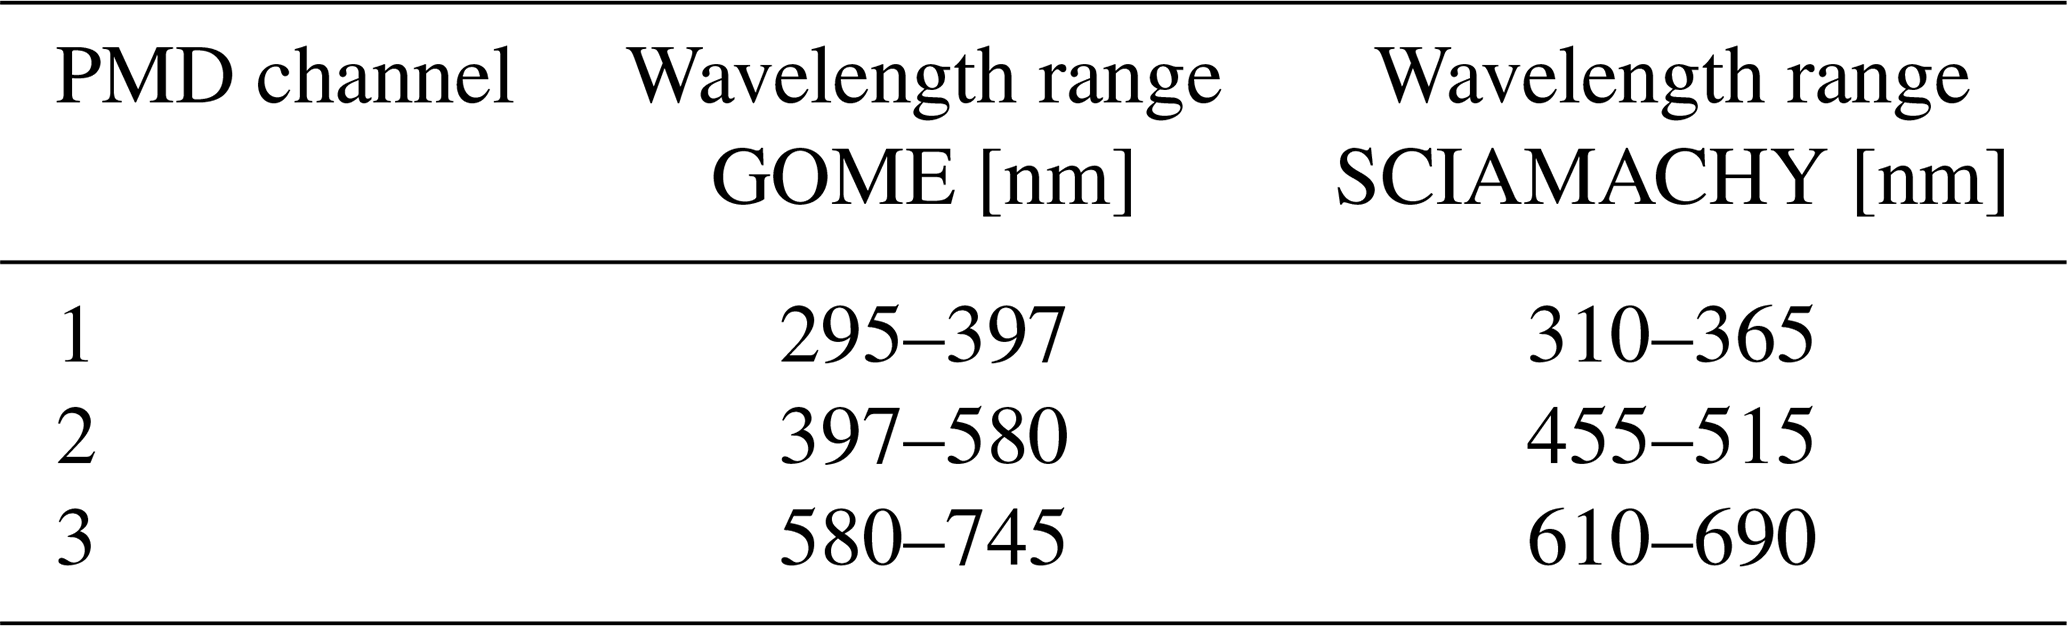
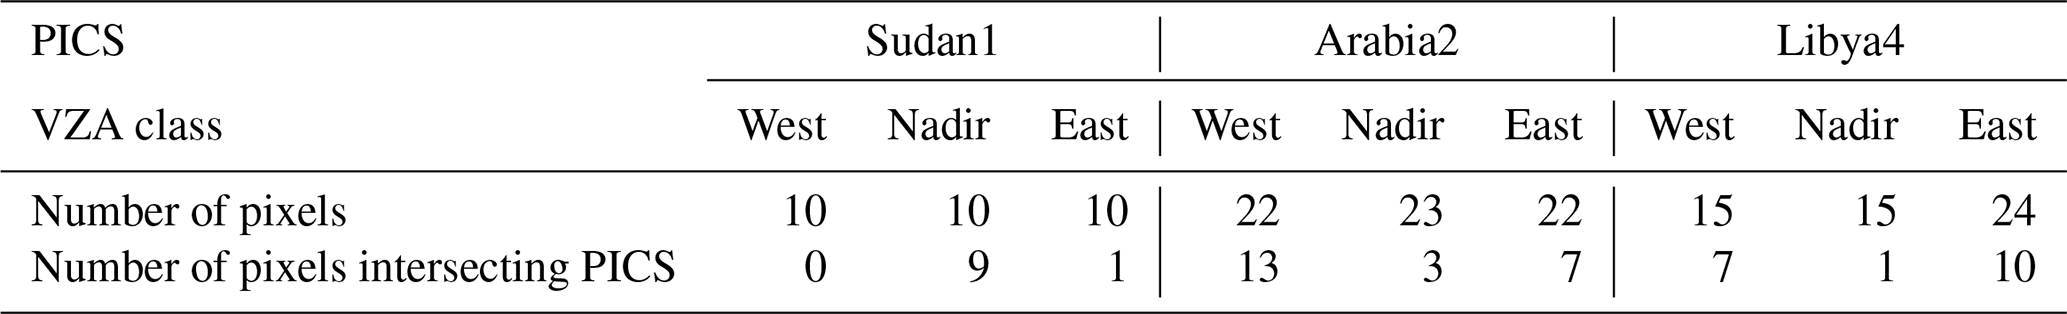
Table 3Statistics of GOME pixels used in the derivation of TFs based on VZA for each PICS, and the number of GOME pixels that intersected with PICS.
Before cross-calibration, the temporal stability of PICS and the surrounding areas was investigated to identify the most suitable sites. Large areas beyond the PICS themselves were considered in the investigation, due to the large spatial extent of GOME and SCIAMACHY pixels. A decade of SCIAMACHY observations over the 20 PICS was analyzed as part of a companion study (Owda and Lichtenberg, 2026). This analysis indicated that Sudan1, Arabia2, and Libya4 were among the most stable PICS. These sites are shown in Fig. 1, and their 2003 reflectance data were used in the cross-calibration.
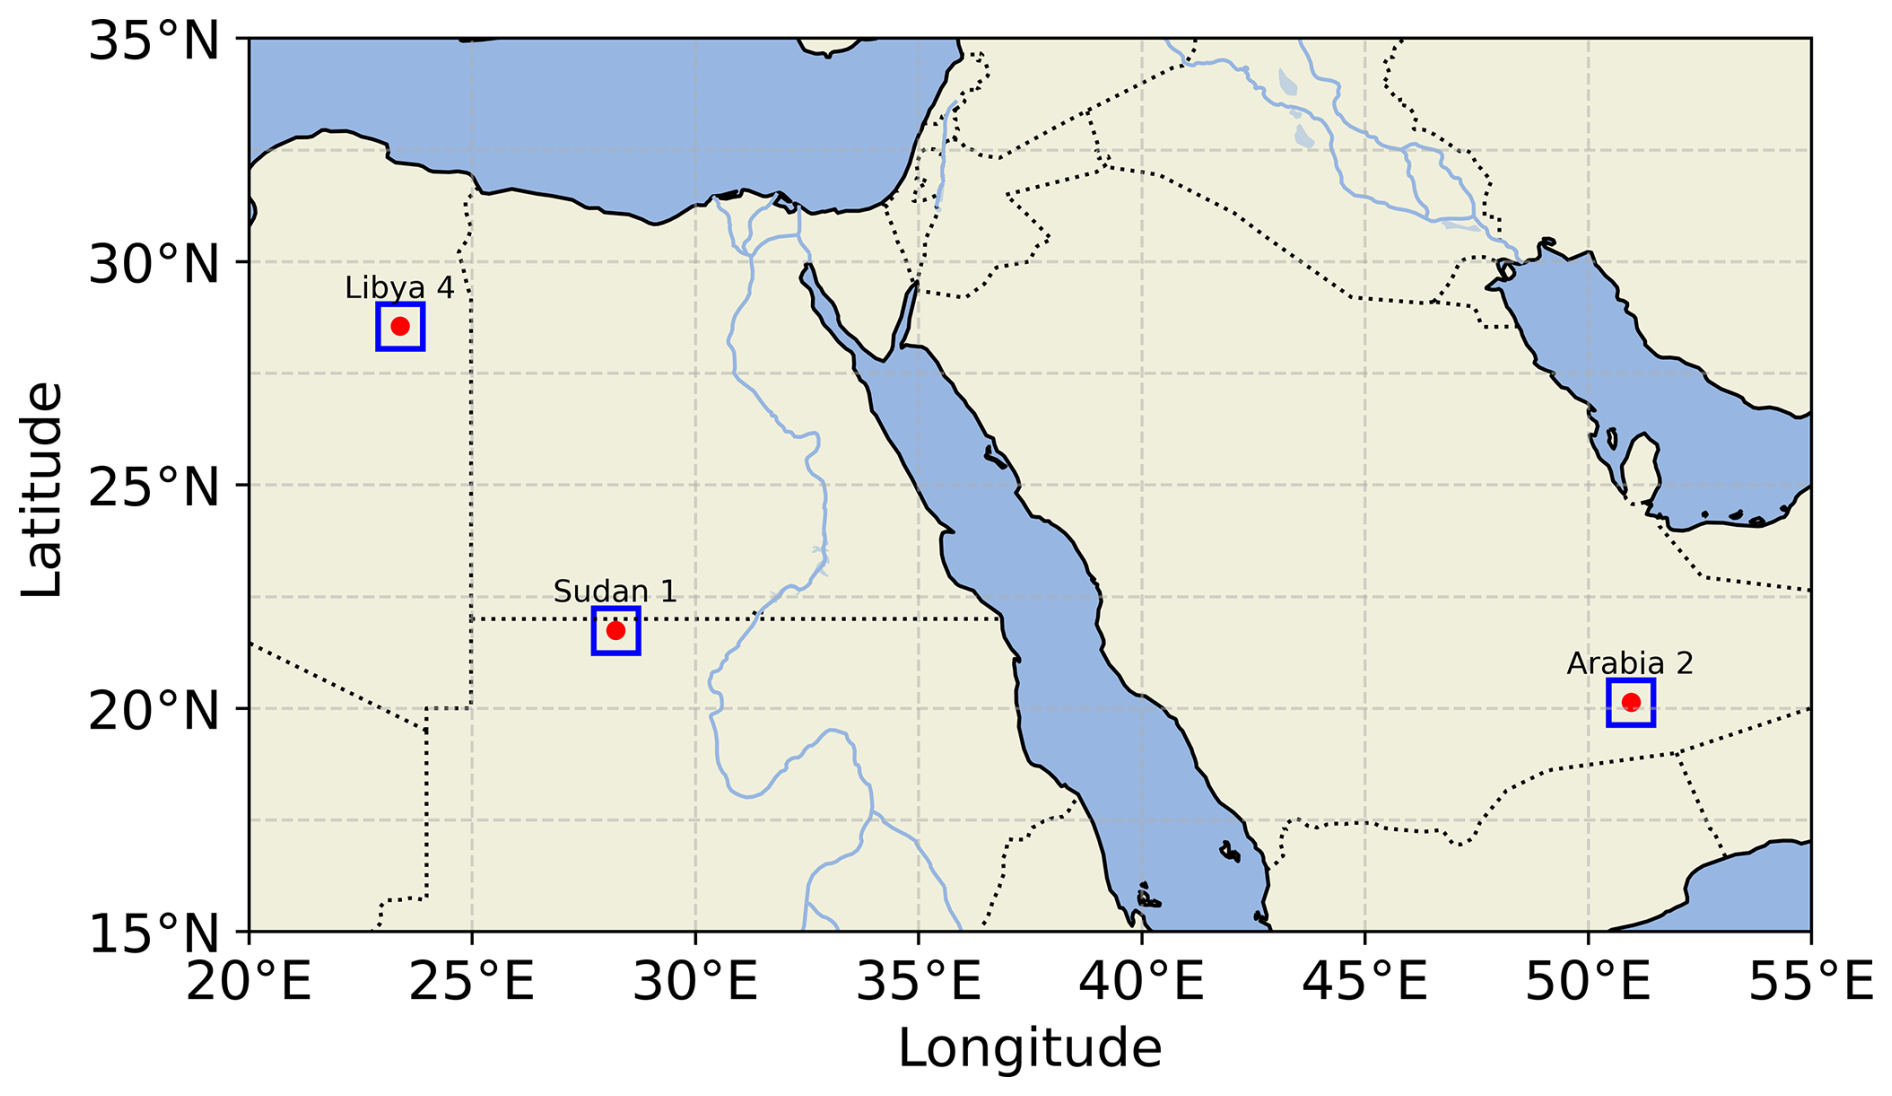
Figure 1Selected PICS for cross-calibration include Sudan1 (28.22° E, 21.74° N), Arabia2 (50.96° E, 20.13° N), and Libya4 (23.39° E, 28.55° N), which were identified as the most stable sites among those proposed by Cosnefroy et al. (1996), according to Owda and Lichtenberg (2026).
This section outlines the methods used for deriving TFs to cross-calibrate instruments (Sect. 4.1) and the PMD-based analysis of pixel homogeneity and cross-calibration uncertanity (Sect. 4.2).
4.1 Transfer functions derivation
The FDR4ATMOS cross-calibration workflow is illustrated in Fig. 2. The diagram illustrates the steps used to perform the cross-calibration between Rs and Rg: (i) spatial collocation of SCIAMACHY and GOME scenes over the selected sites, (ii) averaging the spatially higher resolved SCIAMACHY over the GOME ground pixel for the overlapped scenes, yielding Rscia2gome, (iii) re-gridding the data and computing the ratio of for the investigated spectral ranges and the selected sites, (iv) removing outliers and applying PMDs-based filters, and (v) fitting the filtered ratio.
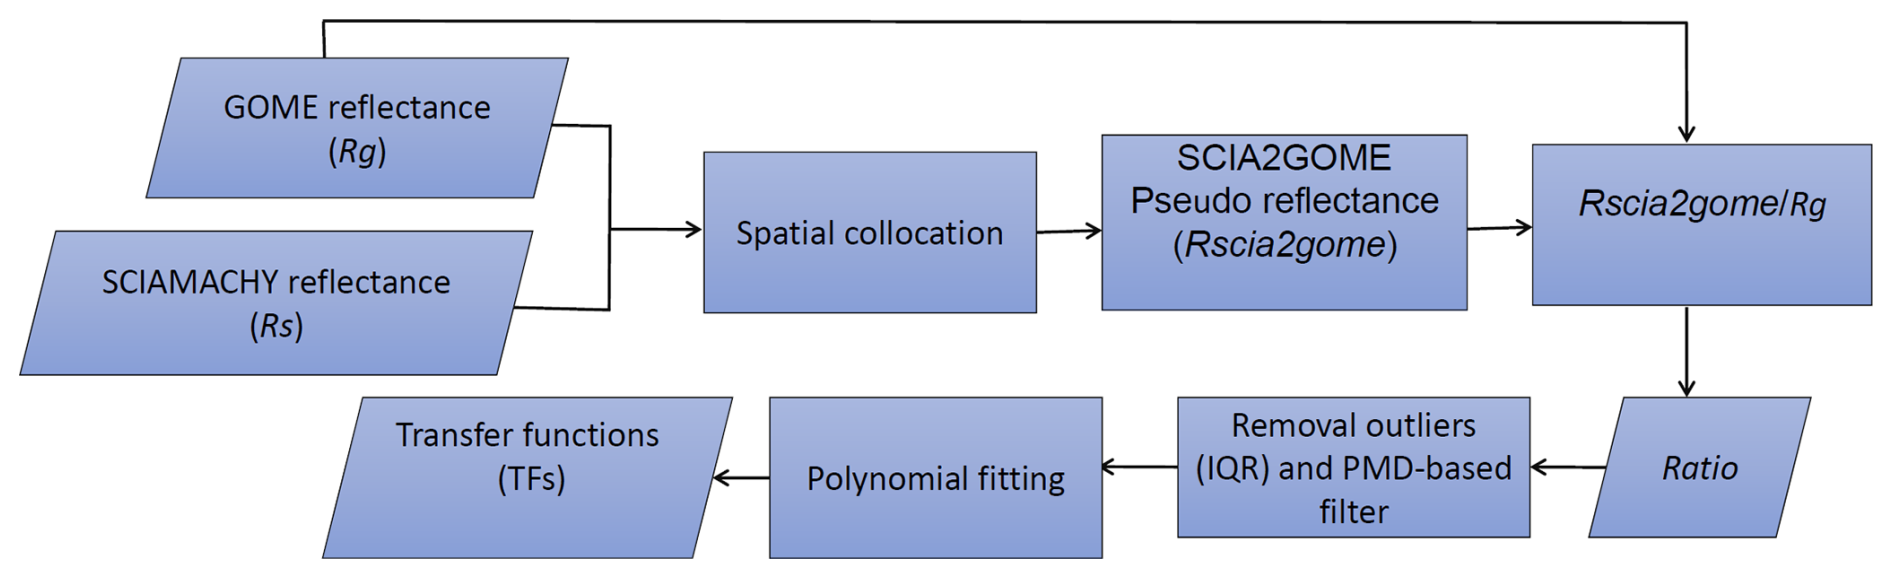
Figure 2The FDR4ATMOS workflow of the reflectance cross-calibration of GOME and SCIAMACHY. The transfer functions are calculated for UV, VIS and NIR, excluding the O2 A-band (FDR4ATMOS manual, 2024).
4.1.1 GOME and SCIAMACHY reflectance
GOME measured radiance, but it was affected by a randomly varying residual etalon, which is effectively removed when converting to reflectances. Therefore, using reflectances as the basis for the harmonization is advantageous. The reflectance for a particular observation is defined as
where R(λ) is the reflectance, Iearth(λ) is the calibrated radiance, ϕo is the solar zenith angle, and Esun(λ) is the solar irradiance as measured by the instrument.
4.1.2 Spatial GOME and SCIAMACHY scene collocations
The complete GOME and SCIAMACHY archives for 2003, with CF below 0.25, were spatially collocated. The collocation was taken as the complete scanline within the PICS center (see Fig. 4). The collocation was performed using the forward-scanning modes of both sensors. GOME pixels were larger than SCIAMACHY pixels and the dimension of PICS. A GOME pixel could contain 1–2 SCIAMACHY scanlines. Larger areas than those of the PICS had to be considered due to the large footprint of GOME pixels. The time difference between GOME and SCIAMACHY was about 30 min. Figure 3 shows the GOME and SCIAMACHY footprints.
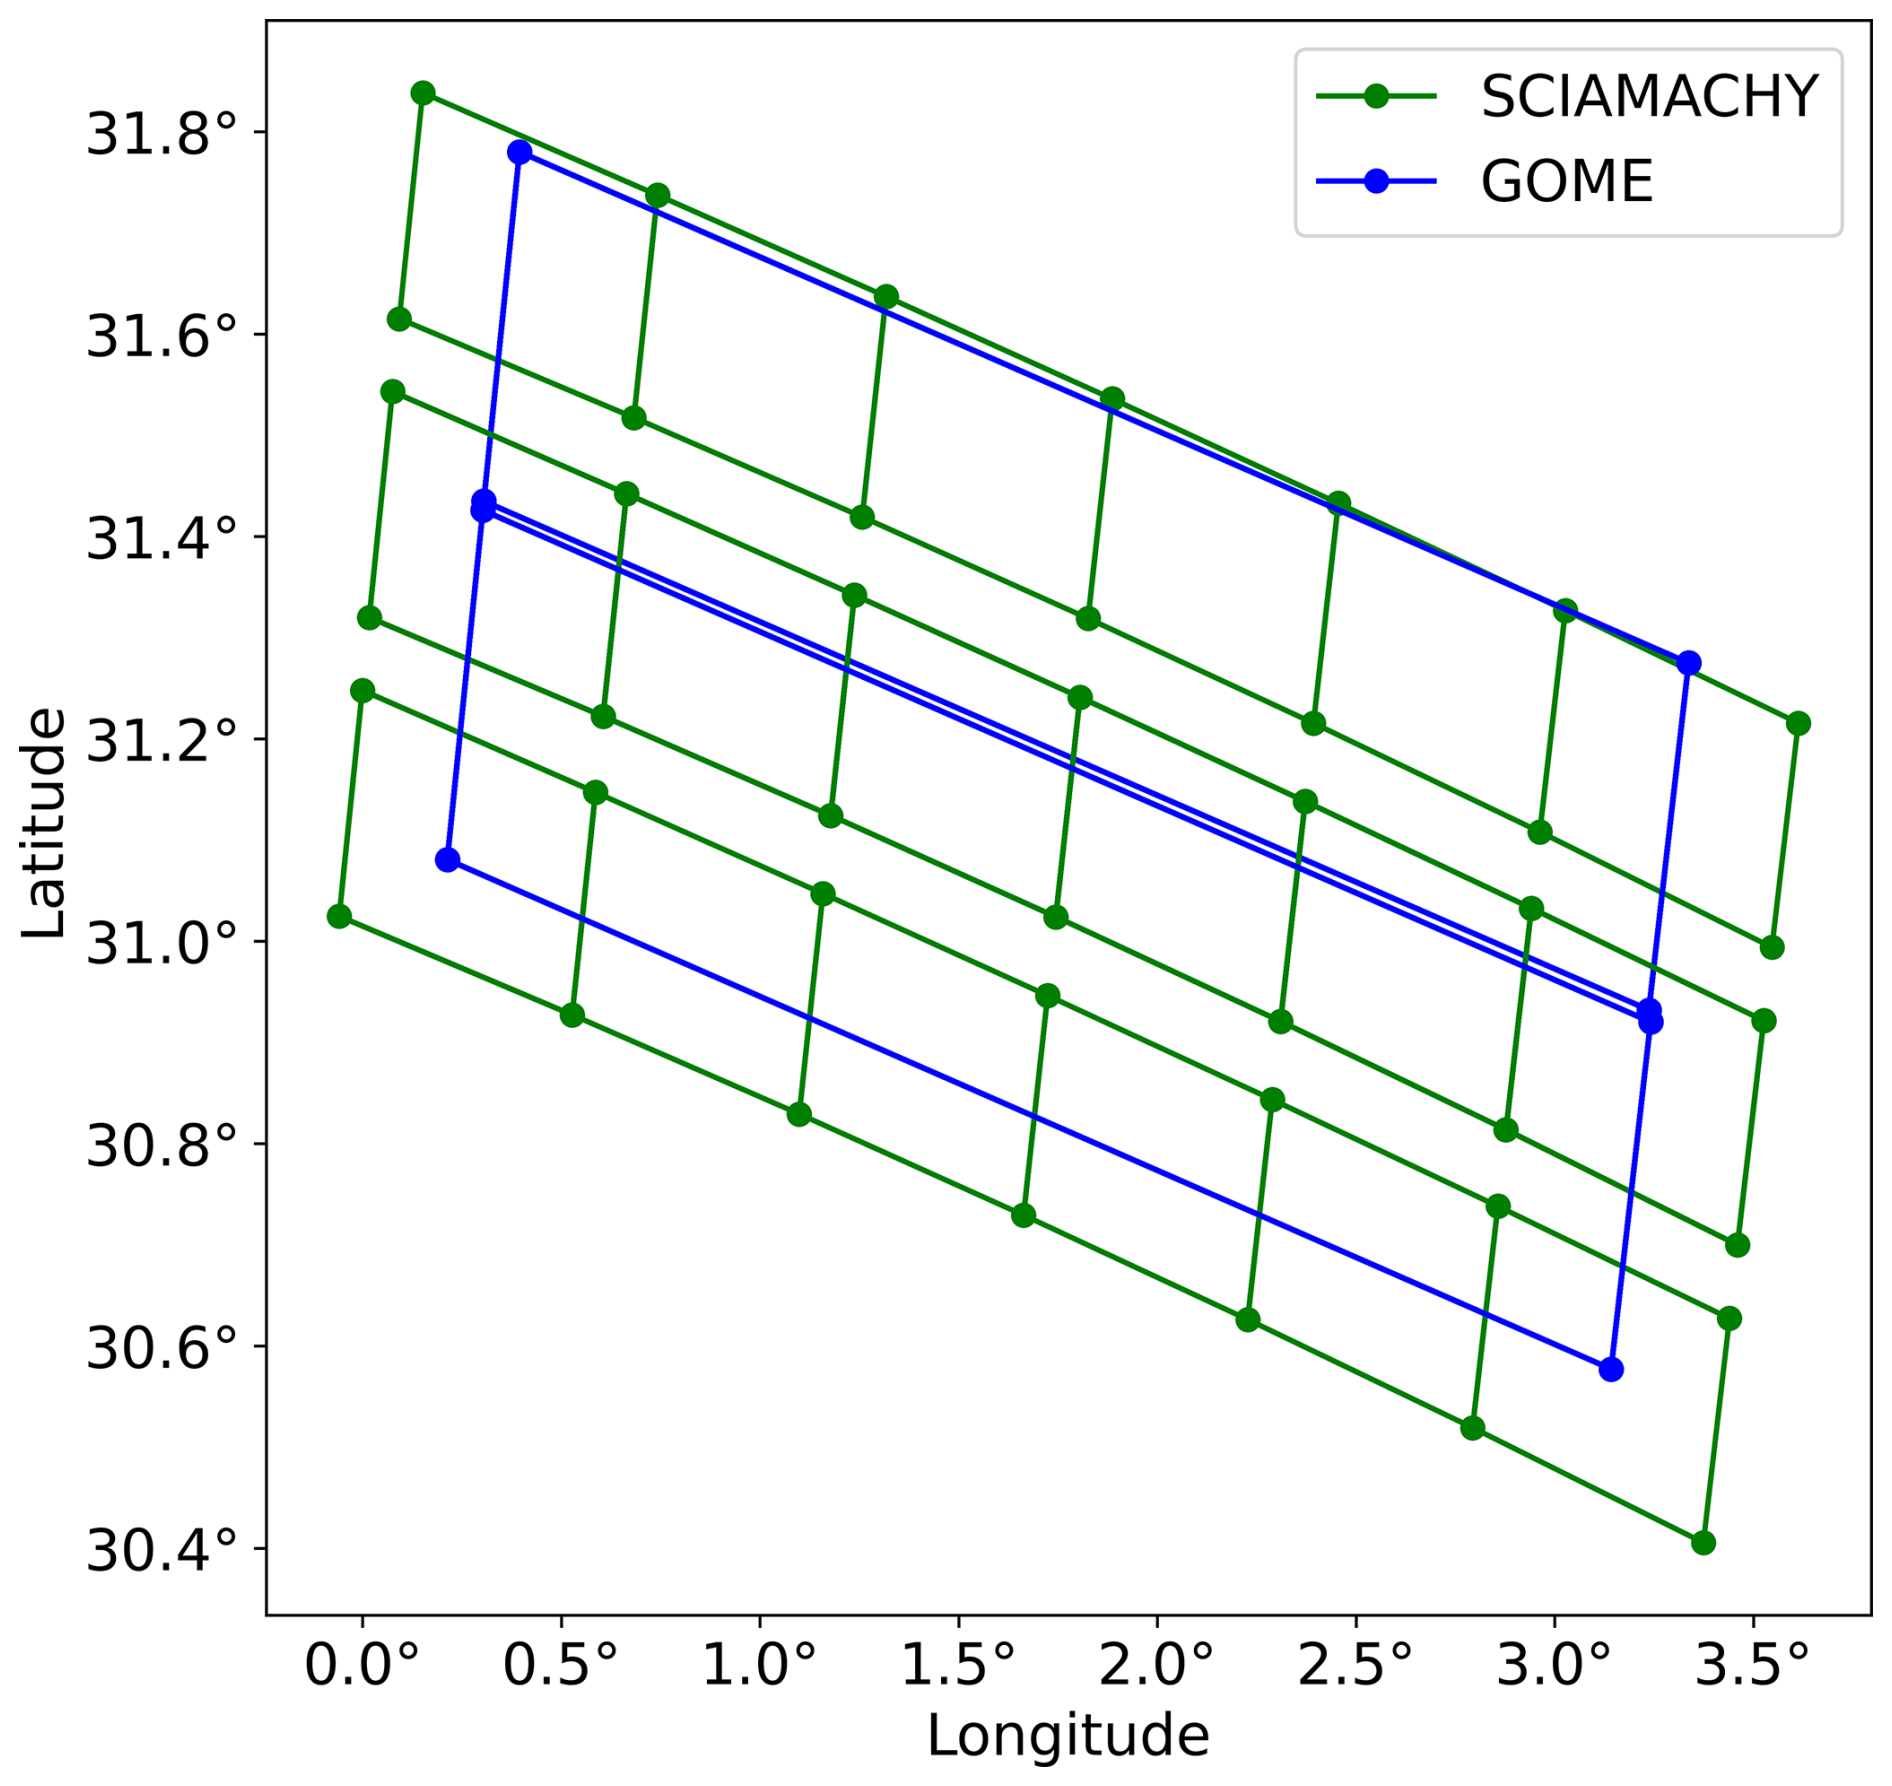
Figure 3Footprints of GOME (blue) and SCIAMACHY (green) pixels are shown. For example, for two GOME pixels, 24 intersecting SCIAMACHY pixels were identified. Only pixels acquired in the forward-scanning mode were considered in the cross-calibration. The gaps between SCIAMACHY pixels corresponded to the exclusion of backward-scanning mode pixels.
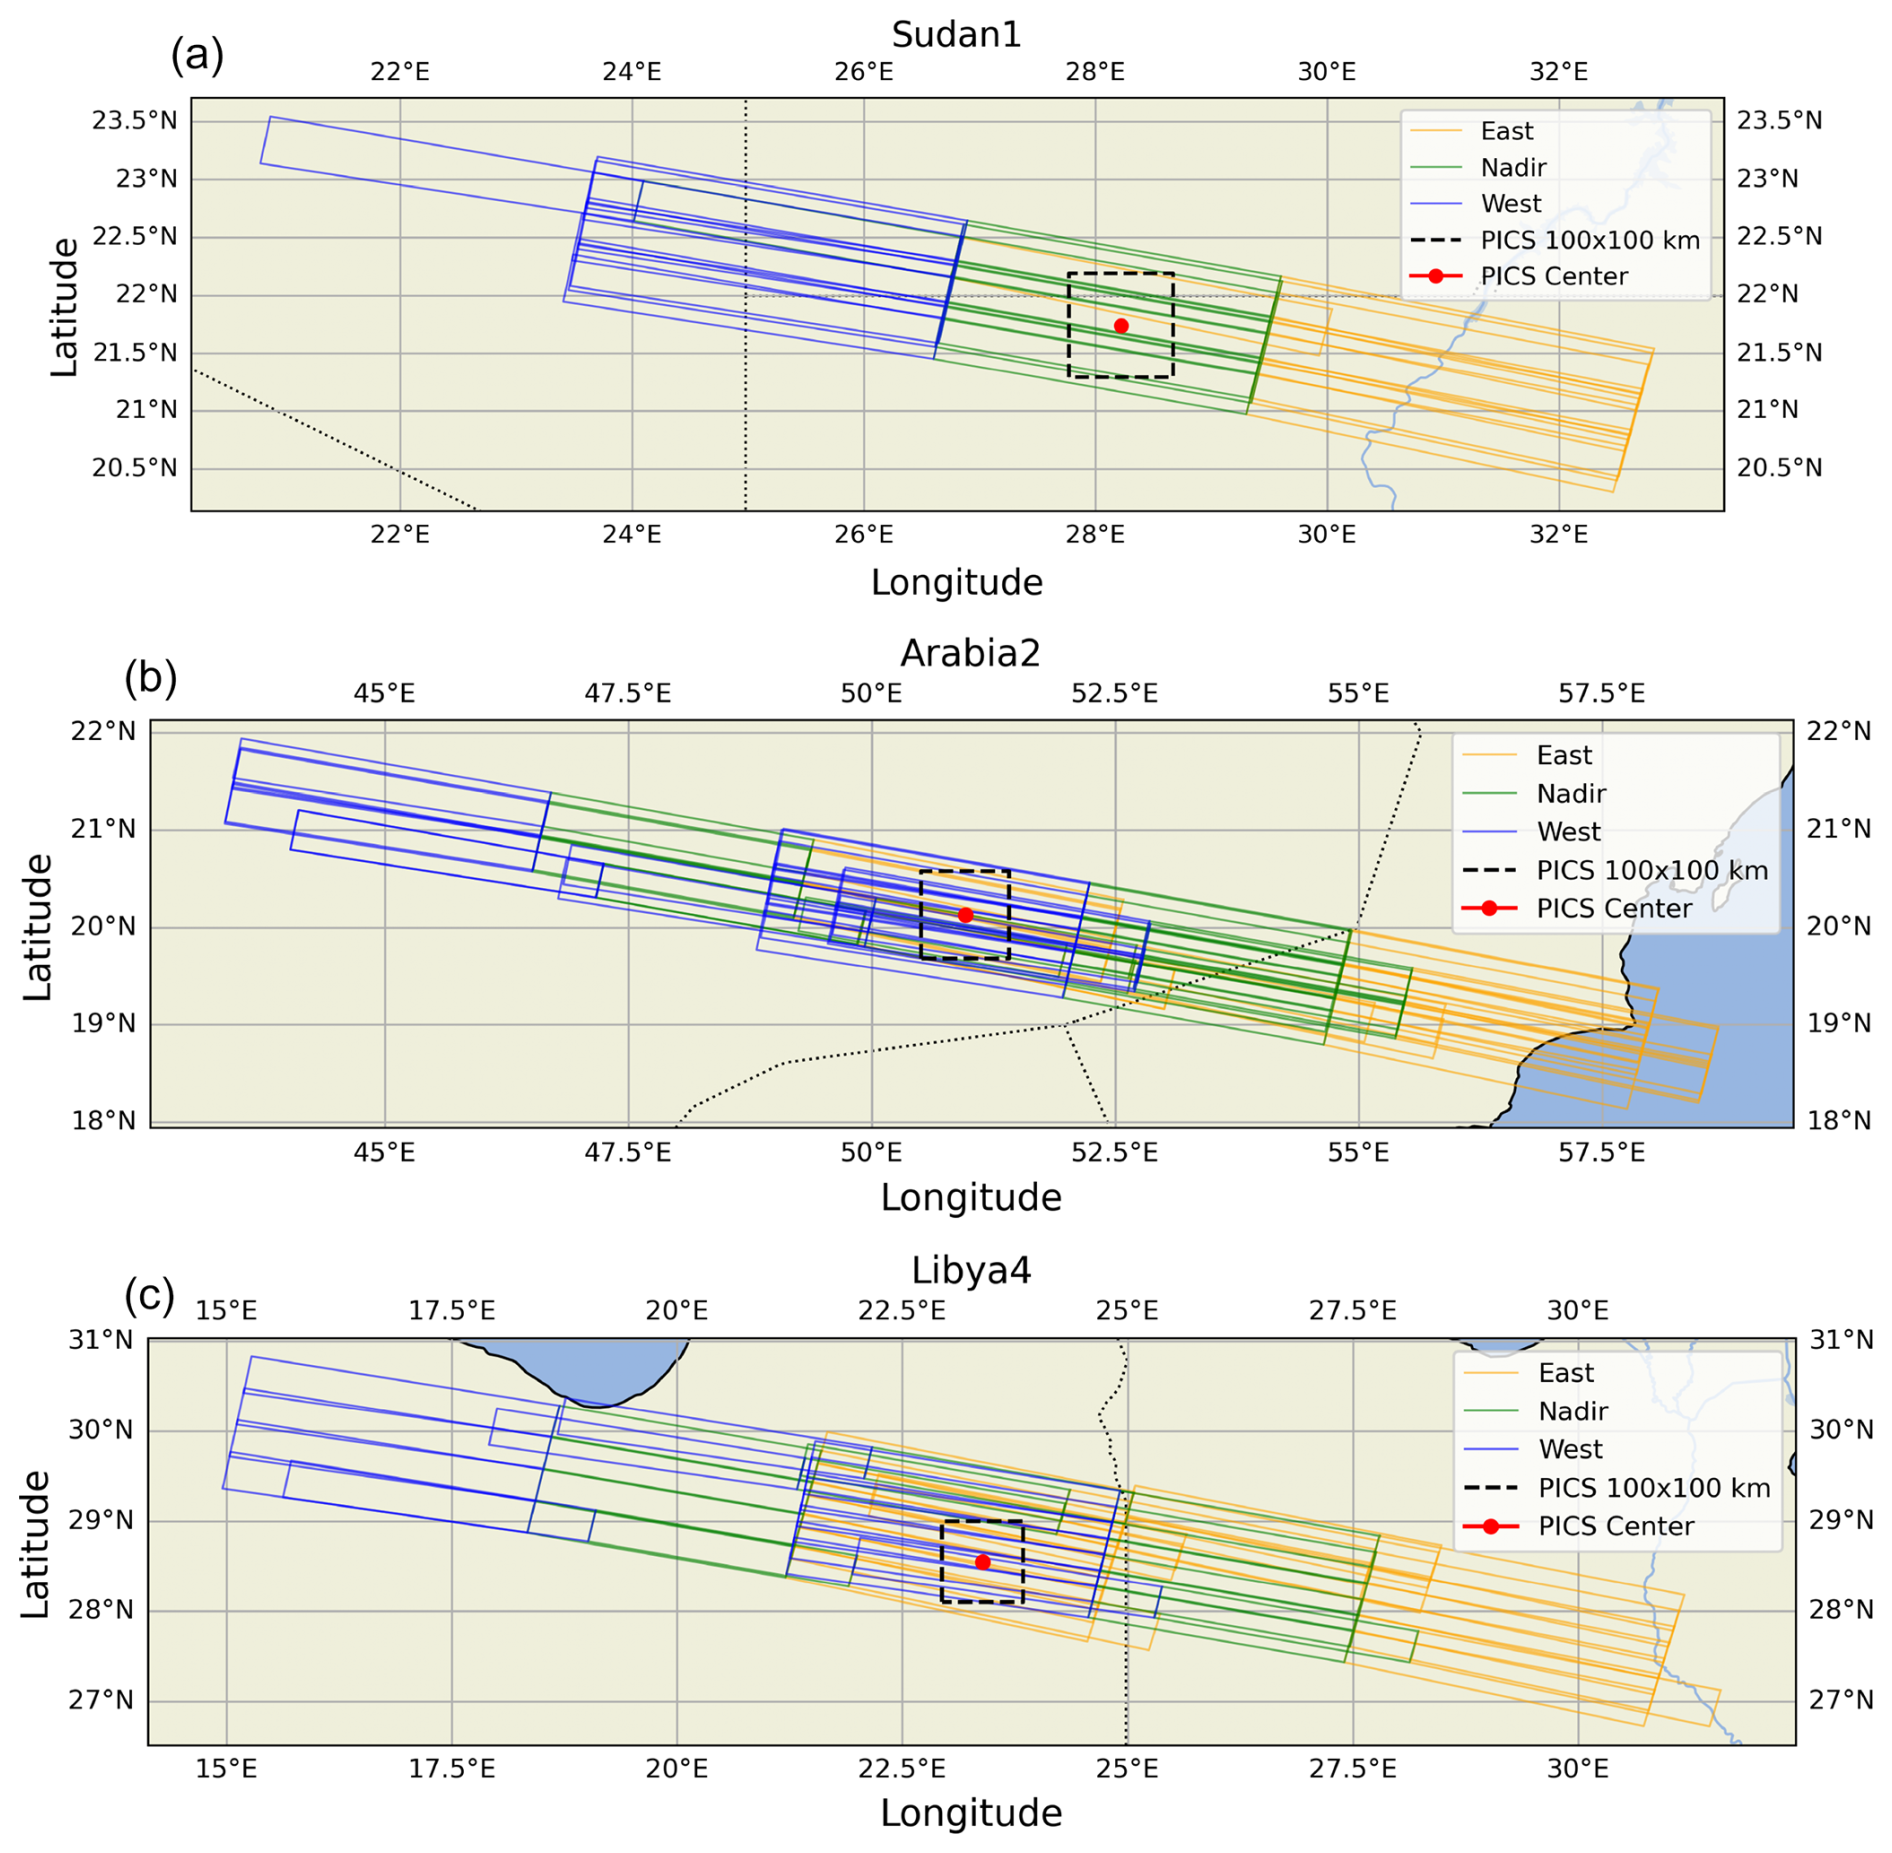
Figure 4GOME pixels distribution over PICS and surrounding regions. (a) Sudan1, (b) Arabia2, and (c) Libya4. The GOME pixels are plotted according to VZA, whereas east, nadir, and west VZAs are represented by orange, green, and blue, respectively. PICS with dimensions of 100×100 km2 are shown as a black dashed square.
The overlapped fractions of the intersected GOME and SCIAMACHY were calculated. Based on the overlapped fractions, the weighted mean reflectances of all SCIAMACHY ground pixels inside the GOME pixel were computed based on Eq. (2)
where Rscia2gome is the pseudo signal SCIAMACHY reflectance averaged over GOME ground pixel, ∑gpscia is the summation of all SCIAMACHY ground pixels that have overlapped with the GOME ground pixel, Rscia,i is the original SCIAMACHY reflectance of pixel i, and wi is the fraction of SCIAMACHY ground pixel i that lies within the GOME ground pixel.
4.1.3 Statistics and geographic distribution of GOME pixels used in derivation of TFs
A total of 151 GOME pixels with CF less than 0.25 were found to overlap with SCIAMACHY pixels in scanlines that include the PICS and their surrounding area for one year of data (see Fig. 4). Each GOME scanline consists of three ground pixels (east, nadir, and west, according to VZA). In each scanline, only one ground pixel can intersect the PICS. Therefore, approximately 34 % of these GOME pixels intersect the PICS. Considering all pixels of one scanline increases the number of available measurements for deriving TFs, since some ground pixels are close to the PICS but do not overlap with it.
Table 3 summarizes the distribution of used GOME pixels based on VZA, along with the number of pixels intersecting the PICS. According to these statistics, GOME pixels with west VZA were found to have the highest intersection rate, and it was lower for east and nadir. The geographic distribution of the GOME pixels used in this study is illustrated in Fig. 4, showing that most of them are located over desert surfaces, except some east-VZA pixels in Arabia2 and Sudan1 that crossed water surfaces, either from the ocean or the river.
Both datasets were used to derive TFs to assess whether the differences in TF values were statistically significant. If no significant differences were found, the dataset containing all pixels in the scanline was considered suitable for TF derivation. Section 5.1 presents the results of this analysis and the resulting decision regarding the dataset selected for cross-calibration.
4.1.4 Reflectance harmonization
The differences between Rs and Rg might be due to: (i) the differences inherent in the observation geometry of the instrument, (ii) imperfect calibration, (iii) degradation of sensors, (iv) scene dependencies.
The generic formula of the harmonization can be written as follows (FDR4ATMOS manual, 2024):
where Rinst1 and Rinst2 are the reflectance signals of instruments 1 and 2, respectively. Cδ is the correction factor for multiplicative differences between instruments. and C2,scene are the correction factors for scene-dependent effects and offsets, respectively.
The Rg in Eq. (4) is the GOME reflectance re-gridded to the SCIAMACHY wavelength grid (λs) from the corresponding Rscia2gome measurements using the Akima interpolation scheme, which is a method for smoothly interpolating data points using piecewise cubic polynomials (Akima, 1970). The ratio of Rscia2gome to the Rg is calculated based on Eq. (4):
The Ratio was computed for each GOME pixel overlapped with SCIAMACHY pixels as a function of wavelength for each site and the three spectral windows selected by FDR4ATMOS. The spectral windows are shown in Table 4.
Table 4Spectral windows used in the FDR4ATMOS, showing the wavelength intervals used for TFs derivation, the associated GOME and SCIAMACHY bands, and the main atmospheric trace gases. The O2 A-band in the NIR band (757–773 nm) is excluded from the derivation of TFs (FDR4ATMOS manual, 2024).
4.1.5 Removal of outliers
The interquartile range (IQR) is a robust measure of the statistical dispersion of the samples. IQR includes the data between Q1 (25 % of data) and Q3 (75 % of data). IQR was applied to reflectance ratios from Eq. (4) to remove the outliers and focus on the central portion of the data.
The ratios from Eq. (4) falling below or above were considered potential outliers. The factor 1.5 was chosen based on the assumption that the ratios had a normal distribution.
4.1.6 Transfer functions
The TFs represent the ratios of Eq. (4) as a function of wavelength. Among the tested polynomial degrees, a third-degree function was selected, as it adequately represented the spectral behavior while preventing overfitting and suppressing artificial artifacts and anomalous high-frequency details. Although small systematic deviations from a purely polynomial behavior may exist, these remain within the measurement uncertainties. The use of a polynomial is justified because broadband spectral structures are removed in the Differential Optical Absorption Spectroscopy (DOAS) retrieval by polynomial fitting. Consequently, this approach ensures that DOAS analyses performed on the FDR4ATMOS data remain fully consistent with previously retrieved and validated trace-gas products.
For the UV and VIS spectral windows, the TFs were modeled based on a weighted least squares fit of a third-degree polynomial function after removing outliers based on IQR. For the derivation of the TF of the NIR spectral window, the O2 A-band was excluded due to its high atmospheric sensitivity and the resulting strong variability in the observed reflectance. Instead, the two wavelength intervals of 1 nm width located immediately to the left and right of the O2 A-band were used to compute the TFs. The ratio measurements obtained in these adjacent intervals were averaged to derive a single wavelength-independent TF, which was then applied to the entire spectral window, including the O2 A-band.
4.2 PMD analysis and filter for improvement of the cross-calibration uncertainties
4.2.1 PMD-based analysis on pixel homogeneity
GOME and SCIAMACHY spectrometers are sensitive to polarization. Atmospheric polarization can be retrieved from PMD measurements. For this study, we leveraged the fact that the PMD detectors operate at a significantly higher spatial resolution than the main spectral channels. For GOME, the readout rate was 16 times faster than the main channels, whereas the smallest SCIAMACHY pixels had 6 PMD readouts. The structure and sensitivity of the PMD detectors make their data particularly valuable for assessing pixel homogeneity in the cross-calibration study. In this work, PMD channels spanning the UV (PMD-1), VIS (PMD-2), and NIR (PMD-3) ranges from both GOME and SCIAMACHY were analyzed for collocated observations.
The comparison was performed by calculating the statistical indicators that described the correlation and the variation among PMDs of overlapping pixels. The statistical indicators included the average (μ), the standard deviation (σ), the Pearson correlation coefficient (R2), and the coefficient of variation (CV).
High standard deviation in PMD values within GOME pixels, as well as within SCIAMACHY pixels that intersect the same GOME pixel, indicates a low level of spatial homogeneity in the scan direction. Additionally, a large difference between σ and CV of PMDs from GOME and the corresponding intersecting SCIAMACHY pixels suggests the presence of non-homogeneous conditions in the cross-scan direction or of temporal variability.
The following steps were considered to perform the PMD analysis:
-
The coordinates of the overlapping GOME and SCIAMACHY pixels of the three PICS were retrieved. As an example, Fig. 3 illustrates the intersections for two GOME pixels with 24 SCIAMACHY pixels. A polygon was created for each intersection.
-
The created polygons were used to filter the spatial coordinates (longitude and latitude) of the PMD measurements from the corresponding GOME and SCIAMACHY PMD channels, ensuring that only PMD measurements intersecting the overlapped GOME and SCIAMACHY pixels were included.
-
For each GOME pixel used in the cross-calibration, μ, σ, and CV of the PMD measurements from both GOME and the overlapped SCIAMACHY pixels were computed.
where sensor refers to either GOME or SCIAMACHY, n is the number of measurements from PMDs, is the average of PMD measurements for an overlap, j is the PMD channel, and k is the index over PMD measurements in the exact overlap (not in the whole pixel). The CV (%) is computed based on the ratio of σ and μ
4.2.2 PMD filter
The spatial variability for each collocated GOME pixel with SCIAMACHY pixels was quantified by estimating the . The PMD-based filter was designed using the differences in of the overlapped GOME and SCIAMACHY pixels, as shown in Eq. (9). We selected as the descriptive parameter due to the fact that the absolute PMD measurements from GOME and SCIAMACHY were expected to differ as a result of their different broadband spectral ranges (see Table 4); therefore, was used to characterize the relative variability within pixels rather than their absolute magnitude.
A percentile-based threshold was then defined to identify GOME pixels with low variability, using the 25th percentile of the absolute differences. This 25th percentile threshold represented the minimum detectable variability in the PMD measurements.
where D is the absolute difference, and j refers to the channel index.
where Nselected is the number of selected observations that meet the threshold criterion. T is the threshold percentile, which here is 25 %. This means that the threshold corresponds to the value below which 25 % of the absolute differences lie and D is the absolute difference.
This filtering was applied to ensure that only homogeneous pixels–those with minimal variability–contributed to the derivation of another version of the TFs, referred to as TFs with PMD. These were then compared to the originally derived functions, referred to as TFs without PMD, to assess the impact of filtering on the TFs.
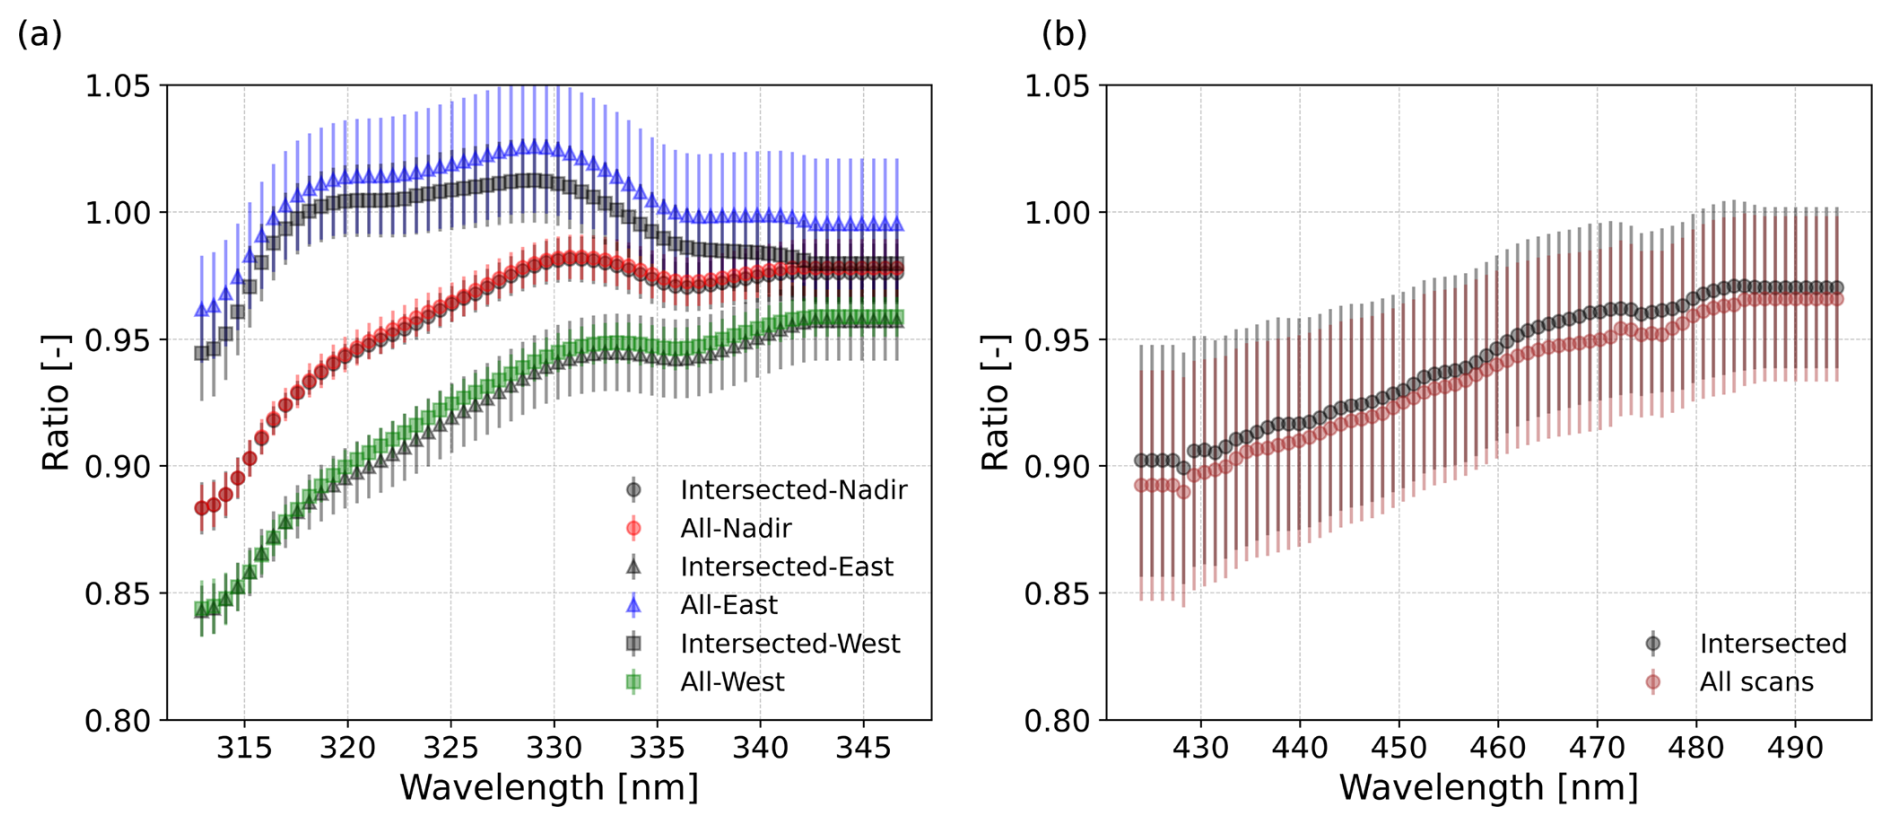
Figure 5Median and the standard deviation values of ratios of Eq. (4) for the only ground pixels that include the exact PICS area (black color and labelled “Intersected”) and all collocated pixels “all scanlines” over the PICS and surrounding areas (colors and labelled “All”) for (a) Band 2B west, nadir, and east VZA (b) Band 3.
5.1 Transfer functions
The ratios from Eq. (4) were computed for overlapping GOME and SCIAMACHY pixels using two datasets in Table 3: (i) considering only pixels that directly intersect the PICS, and (ii) including all ground pixels in a scan that had an overlap with the PICS. The comparison revealed minimal differences in the ratios used to derive TFs, regardless of which dataset was employed. Figure 5 presents the median values and corresponding standard deviations for Bands 2B (Fig. 5a) and 3 (Fig. 5b). The largest discrepancy was observed for Band 2B in the east viewing geometry, with a maximum difference of approximately 1.5 %. Overall, the magnitude of uncertainties was found to be consistent across the different bands.
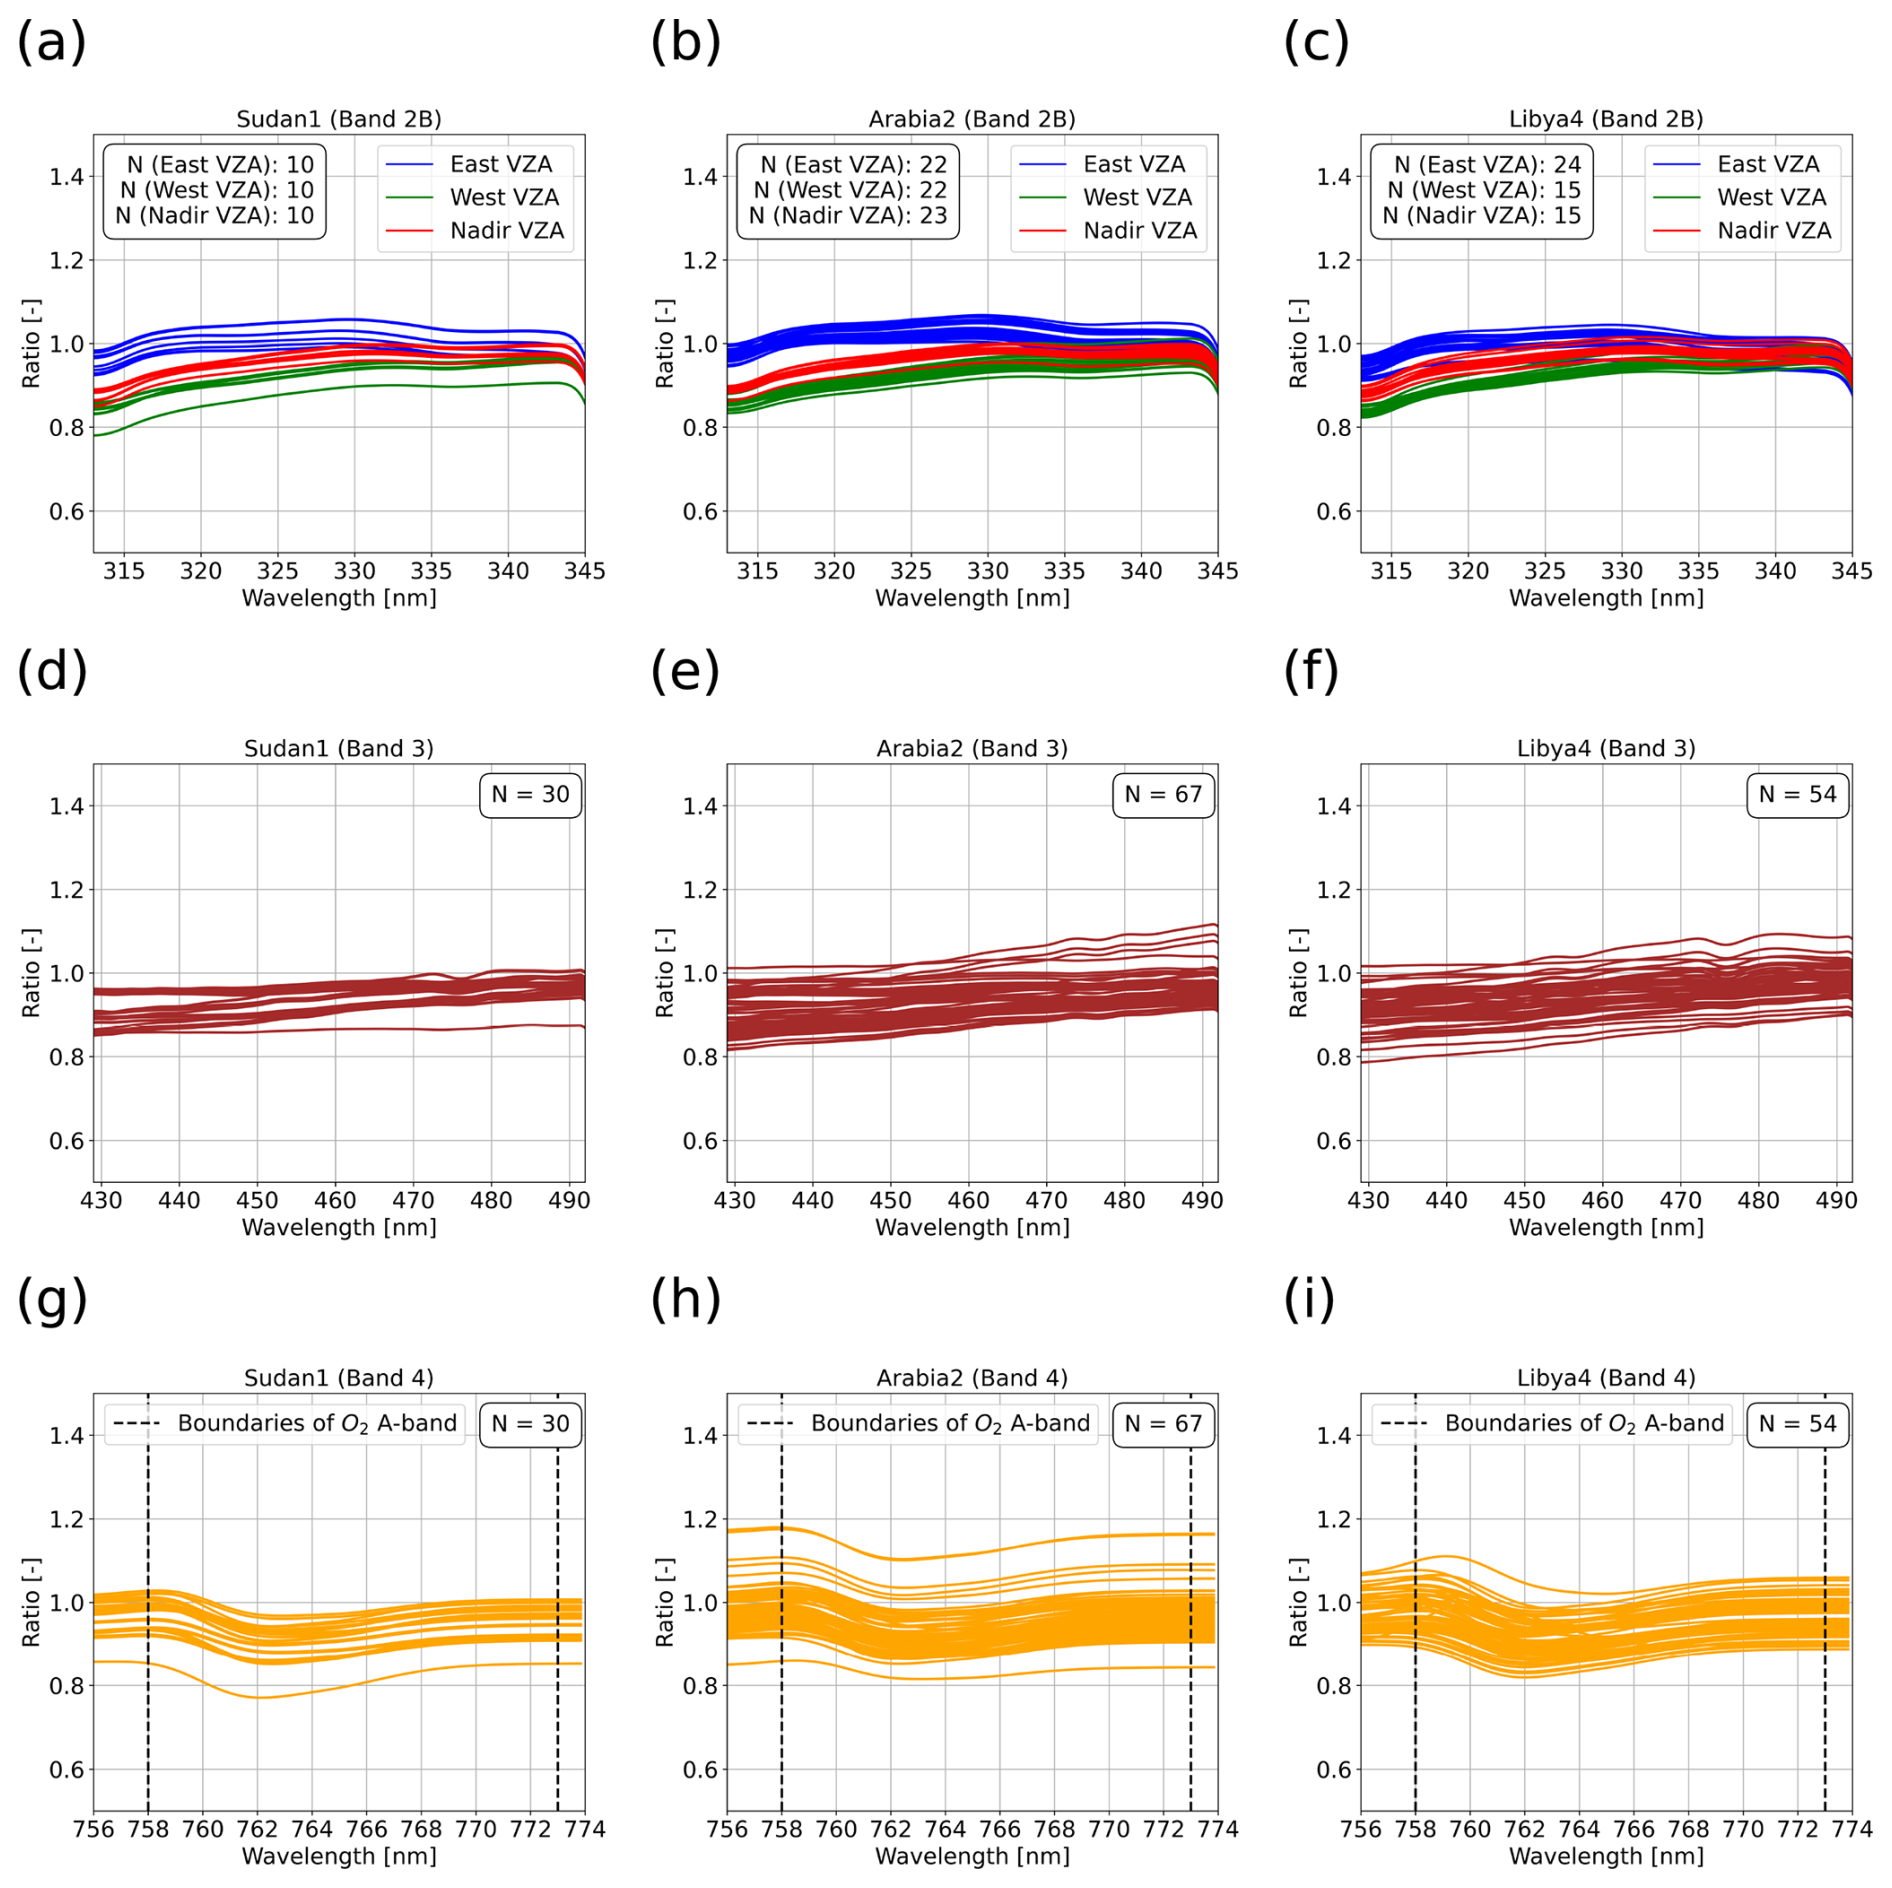
Figure 6Ratios () of each band (rows) and selected PICS (columns). For band 2B (a–c), the ratios were classified based on VZA to the west (green), east (blue), and nadir (red). (d)–(f) and (g)–(i) refer to ratios for band 3 and band 4, respectively. Each line curve represents the ratios of one GOME pixel overlapped with several SCIAMACHY pixels. These ratios were accompanied by cloud fractions less than 0.25. Note: In Band 4, the derivation of the TF for GOME relied solely on observations outside the O2 A-band.
We chose to use ratios from all collocated pixels to increase the statistics. The resulting ratios are illustrated in Fig. 6. In general, although the ratio patterns varied across the bands, each band exhibited a consistent pattern across the PICS. For Band 2B (Fig. 6a–c), the ratios–particularly at the shorter wavelengths–were dependent on the VZA. For Band 3 (Fig. 6d–f), the ratios increased with wavelength across the PICS. In contrast, for Band 4 (Fig. 6g–i), the ratios on the left and right sides of the O2 A-band remained constant and are independent of wavelength.
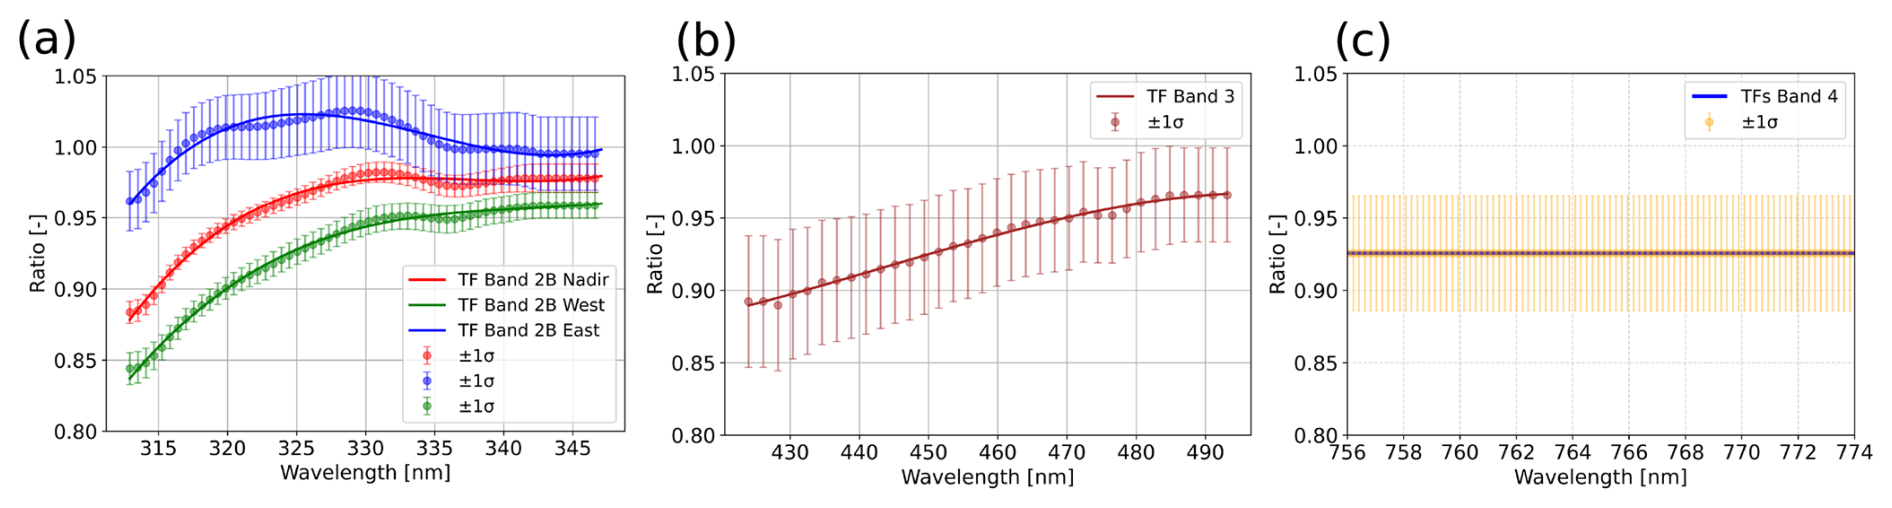
Figure 7The transfer functions were derived by fitting the median values of the spectral channels' ratios from Fig. 6, appearing as dots, using a third-degree polynomial function for (a) Band 2B and (b) Band 3. (c) A constant TF of 0.93 was used for Band 4. The error bars indicate one standard deviation and are shown every 5 steps for Bands 2B and 3 and 1 step for Band 4.
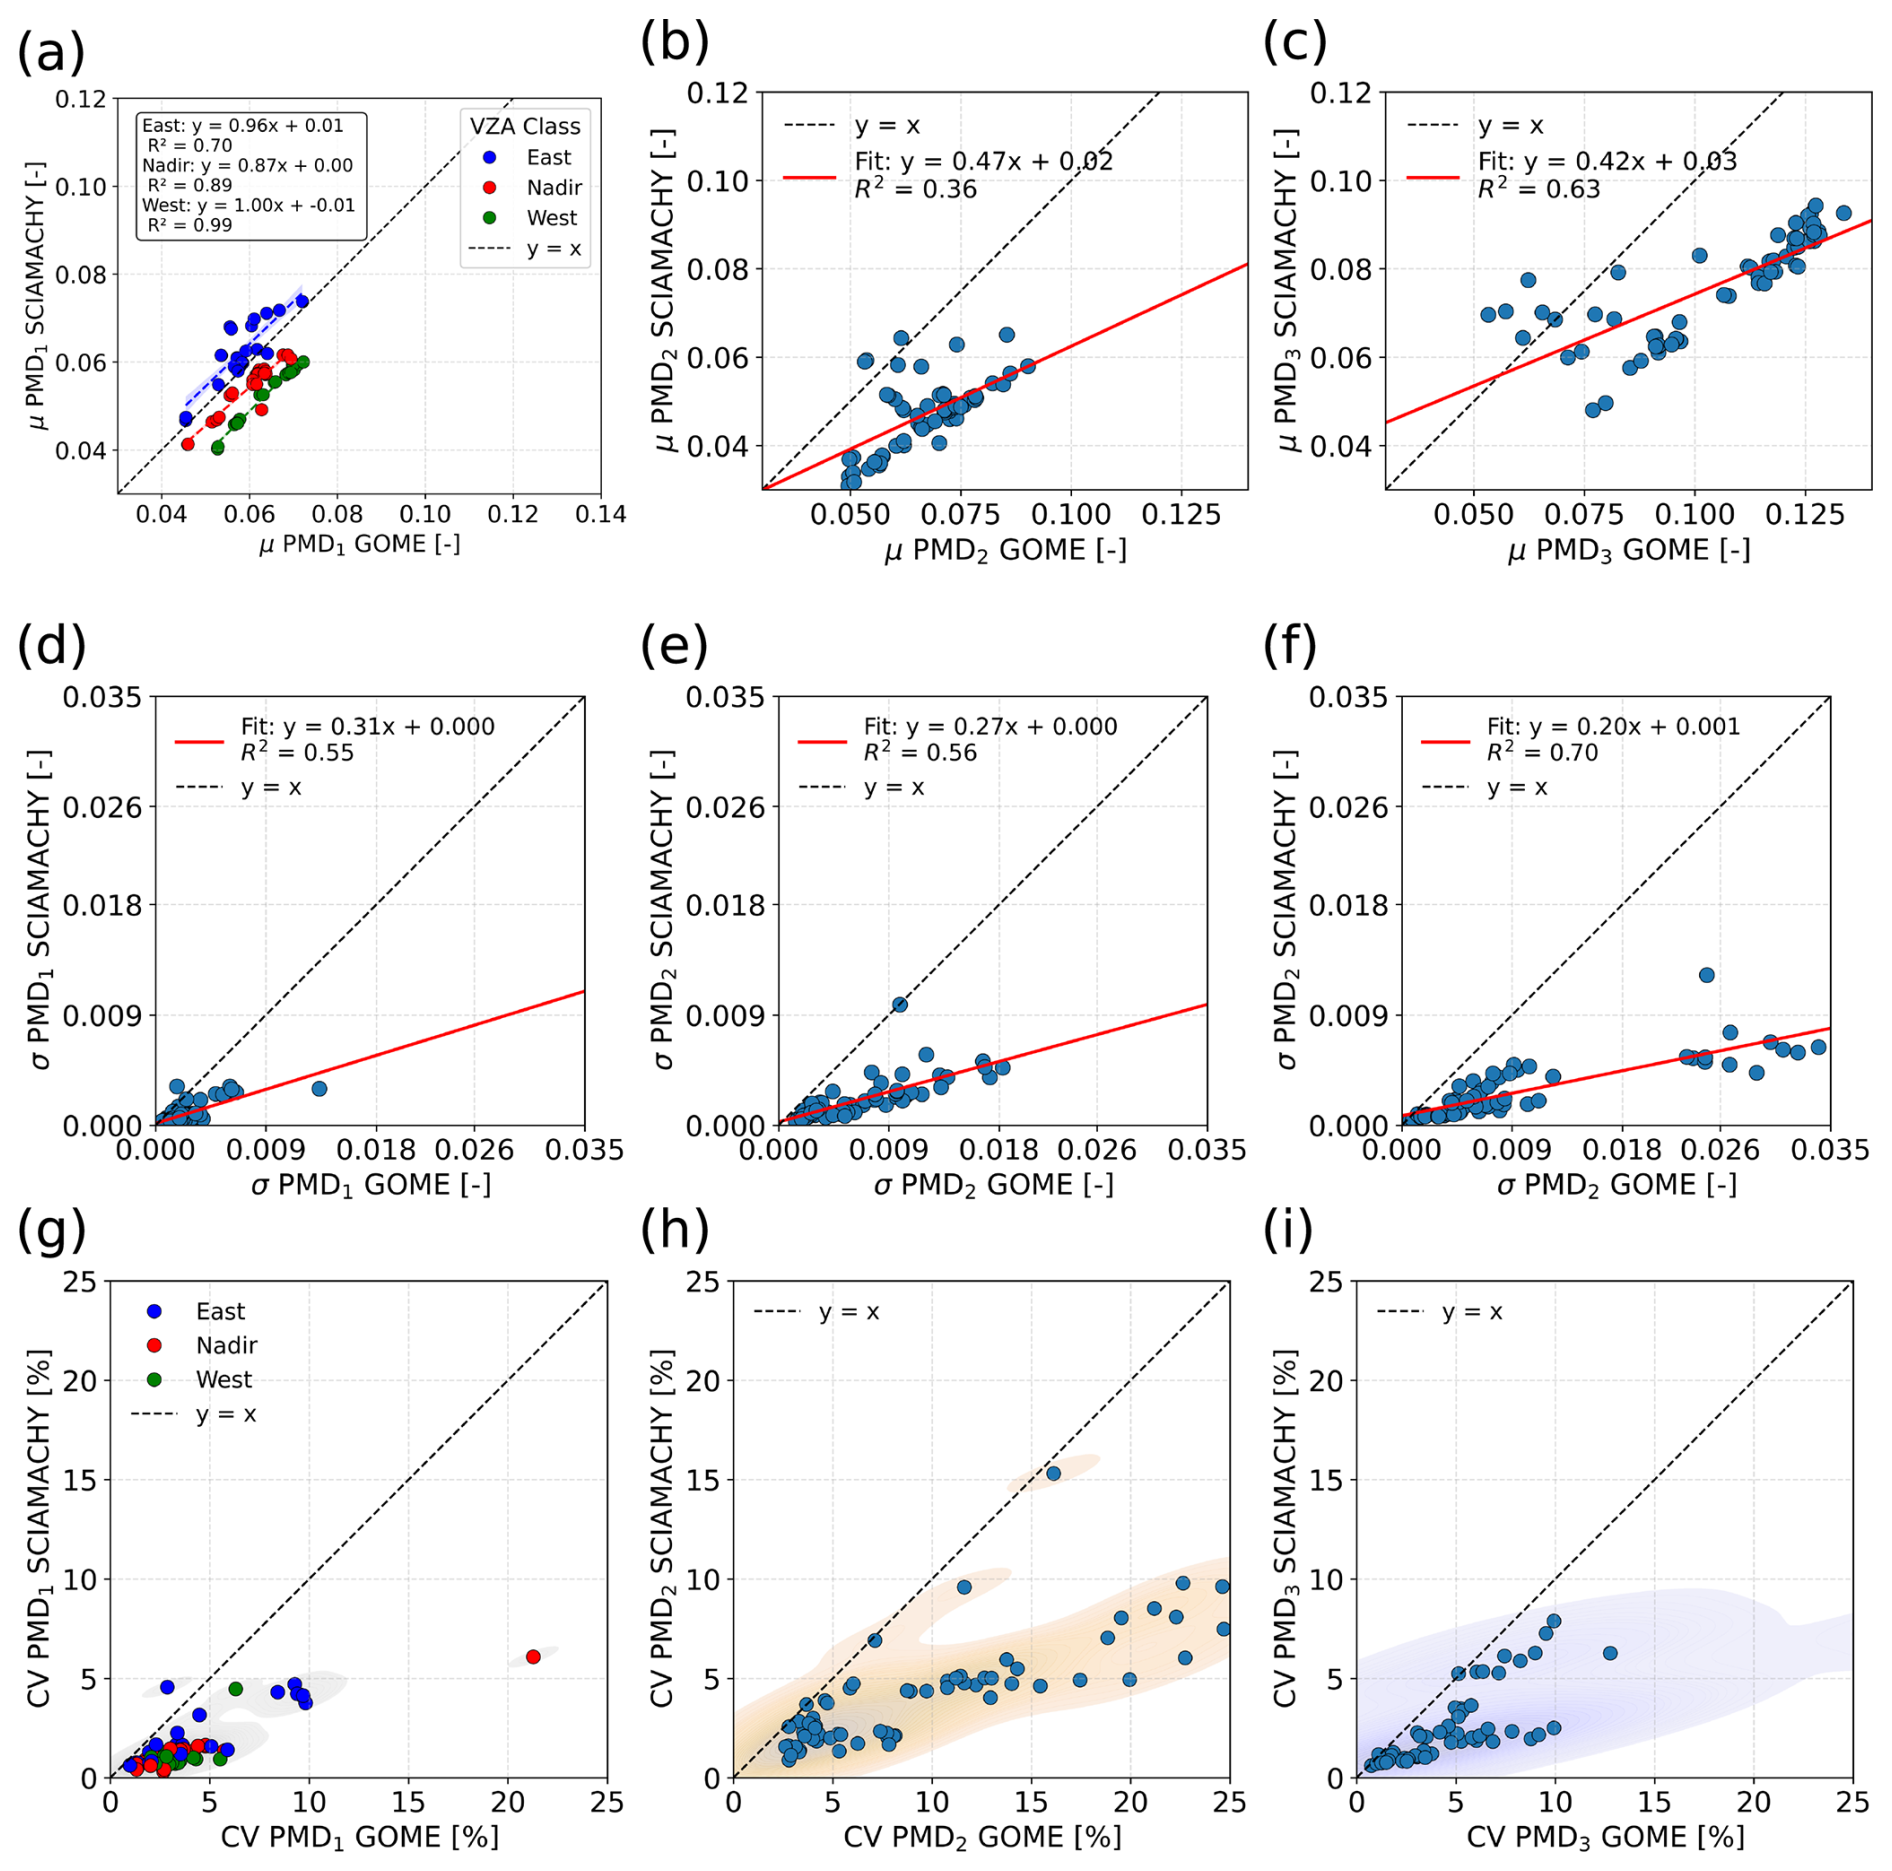
Figure 8PMD-based analysis of GOME and SCIAMACHY pixels used in the derivation of TFs. Subplots (a)–(c) show the mean (μ) PMD values for channels 1, 2, and 3, corresponding to Bands 2B, 3, and 4, respectively. Subplots (d)–(f) and (g)–(i) present σ and CV for the same channels, respectively, providing additional insights into the variability and homogeneity of the observed pixels.
The derived TFs for each spectral band, along with their median and standard deviation values, are shown in Fig. 7. For Bands 2B and 3, the TFs were modeled using third-degree polynomial fits. The TF of eastward VZA was closer to 1 than those for nadir and westward VZA (Fig. 5b), indicating that the reflectance values for East VZA were, on average, similar between the two sensors. However, the standard deviation for East VZA was relatively higher than for Nadir and West VZA, indicating a wider spread of reflectance values in the East direction compared with the other viewing angles.
For Band 4, the TF was obtained by averaging the ratios on the left and right sides of the O2 A-band, yielding a constant value of 0.93, which represented the TF for Band 4, including the O2 A-band (blue dashed line in Fig. 7c). The uncertainty in the TFs was indicated by error bars corresponding to 1 sigma.
Among the VZA classes in Band 2B, the nadir view exhibited the lowest uncertainty. In contrast, the uncertainties for the west and east VZA classes were, on average, approximately 3 and 2 times higher than that of the nadir VZA, respectively. For Bands 3 and 4, larger uncertainties were observed. On average, the uncertainties in Bands 3 and 4 were about 4 times greater than the uncertainties in the Band 2B nadir TFs.
5.2 PMD data analysis of both sensor pixels used in the cross-calibration
The PMD analysis of the GOME and SCIAMACHY pixels used in the derivation of TFs, based on PMD channels 1, 2, and 3 – representing Bands 2B, 3, and 4, respectively – is shown in Fig. 8. The analysis included the statistical indicators μ, σ, and CV.
For Band 2B (Fig. 8a), based on μ measurements from PMD channel 1, the PMD values from GOME and SCIAMACHY showed different correlations, with R2 values of 0.99, 0.89, and 0.70 for west, nadir, and east VZA pixels, respectively. The PMD measurements exhibited a clear dependence on the VZA. SCIAMACHY tended to underestimate the PMD values compared to GOME for the nadir and east VZA pixels, while a slight overestimation was observed for the west VZA pixels.
For Bands 3 and 4 (Fig. 8b and c), the correlation of PMD measurements between GOME and SCIAMACHY was lower, with R2 values of 0.36 and 0.63, respectively, indicating weaker agreement compared to Band 2B. In both cases, SCIAMACHY generally underestimated the PMD values relative to GOME.
The σ values of PMD measurements for Band 2B from both GOME and SCIAMACHY (Fig. 8d) were relatively low, indicating more spatially uniform and homogeneous pixels with R2 values of 0.55. In contrast, for Bands 3 (Fig. 8e) and 4 (Fig. 8f), the σ values of GOME PMDs were higher than those of SCIAMACHY, suggesting that less homogeneous pixels were involved in the cross-calibration for these bands. A similar trend was observed in CV: lower variability was seen in Band 2B (Fig. 8g) compared to Bands 3 (Fig. 8h) and 4 (Fig. 8i). By looking at the shaded areas in Fig. 8g–i, the PMD measurements of GOME pixels exhibited higher variability than those of SCIAMACHY.
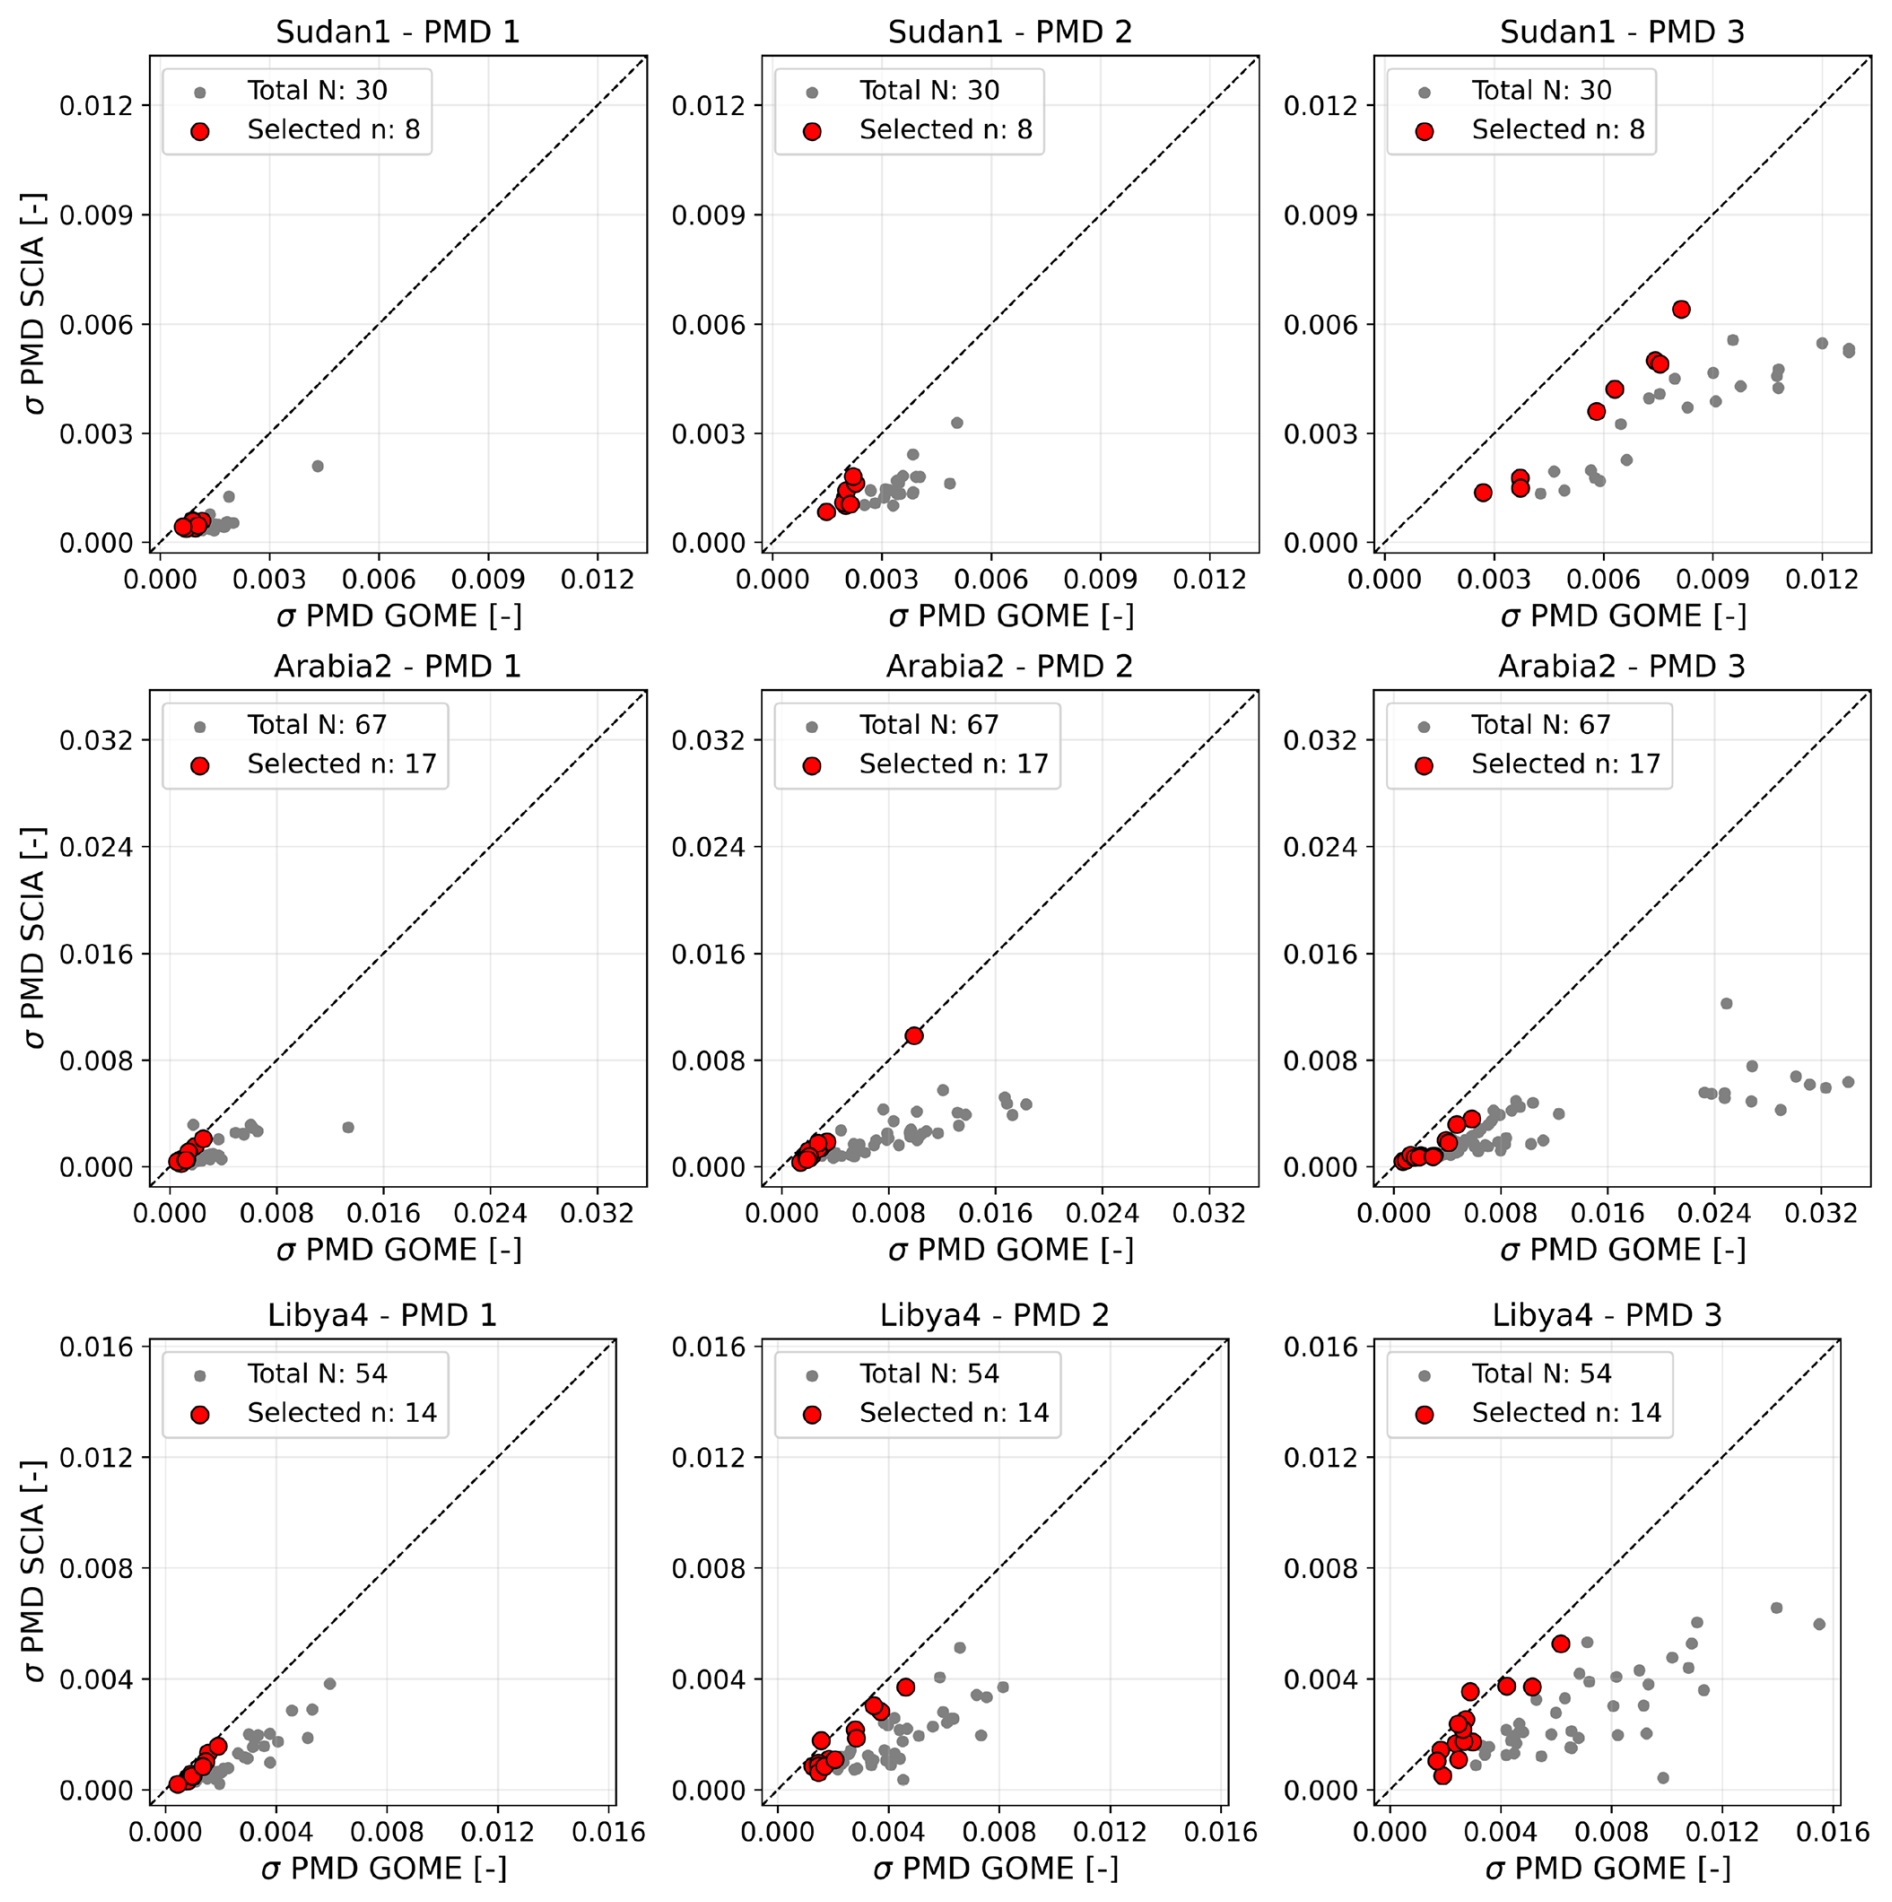
Figure 9σ PMD GOME vs. σ PMD SCIA of the PICS (Sudan1, Arabia2, and Libya4). Each site includes three subplots: (left) PMD1, (middle) PMD2, and (right) PMD3. The red scatter points represent the GOME pixels that were used in the derivation of TFs with PMD after fulfilling the criteria in Eq. (10).
5.3 PMD-based filter
The PMD-based filter was applied to the GOME pixels used in the derivation of the TFs of Fig. 7. This filter was applied separately for each site and each PMD channel, as illustrated in Fig. 9. The red scatter points represent the GOME pixels for which the absolute value of relative difference in the PMD standard deviation compared with SCIAMACHY pixels was less than 25 %. The filter resulted in a significant reduction in the sample size. After applying this filter, 39 out of 151 GOME pixels were retained for the next iteration of cross-calibration, yielding the TFs denoted as TFs with PMD.
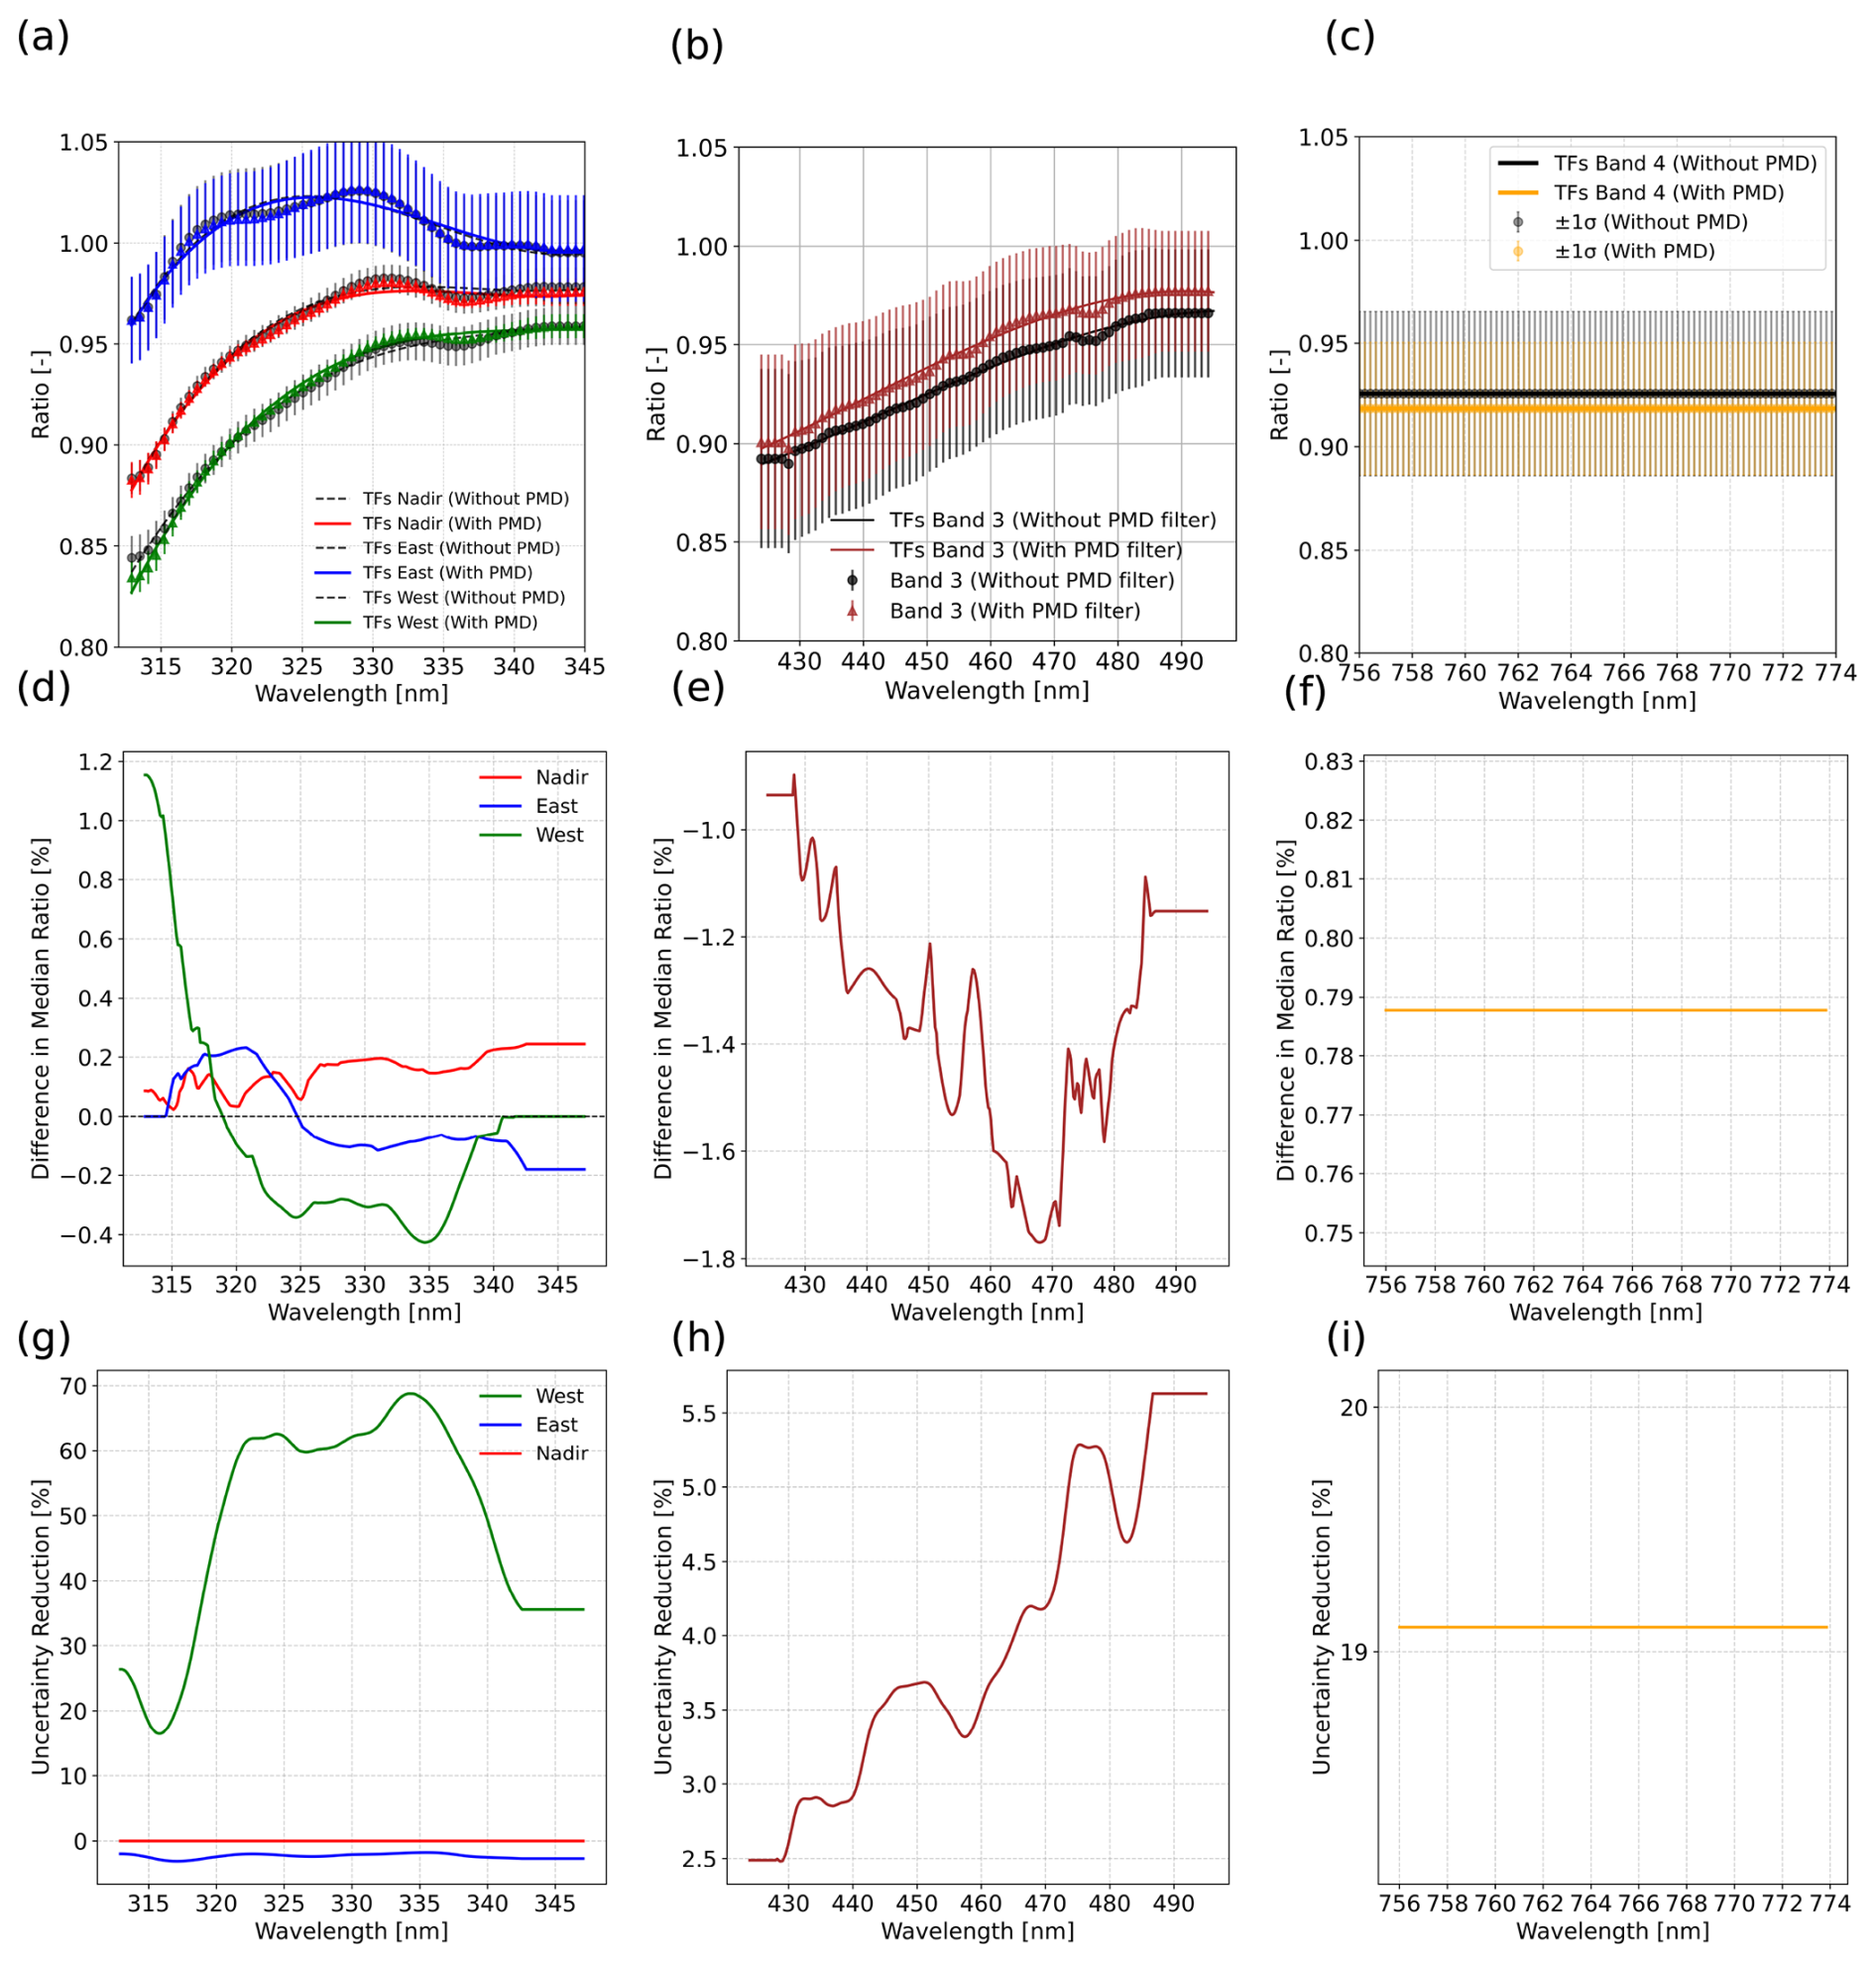
Figure 10The comparison of TFs with PMD filter (solid lines) and without PMD filter (dashed lines). TFs with and without PMDs filter for (a) Band 2B west, nadir, and east VZA, (b) Band 3, (c) Band 4. The differences in the derived TFs (with PMD – without PMD) for (d) Band 2B west, nadir, and east VZA, (e) Band 3, (f) and Band 4. The reduction in the 1 σ of error bar (with PMD – without PMD) for (g) Band 2B west, nadir, and east VZA; (h) Band 3, and (i) Band 4.
5.4 Transfer functions with PMD filter
The fitted TFs for the bands without applying the PMD filter (black dashed curves) were consistent with the TFs derived when the PMD-based filter was used (colored curves), as shown in Fig. 10a–c. The differences in the median values of both TFs are highlighted in Fig. 10d–f. The maximum absolute difference was 1.75 % for Band 2B west VZA (Fig. 10d). Overall, the TF values (with and without the PMD-based filter) changed only slightly and not significantly. However, the uncertainties of the TFs were markedly reduced when the PMD-based filter was applied (Fig. 10g–i). For Band 2B west, the uncertainty was decreased by up to 70 % (Fig. 10g). In contrast, there was no uncertainty reduction for Band 2B nadir and east VZA. For Bands 3 and 4, the uncertainty reduction reached up to 5.5 % (Fig. 10h) and 19 % (Fig. 10i), respectively.
6.1 Challenges on spectrometer cross-calibration and mitigation strategies
The main challenges mentioned in the introduction about the GOME and SCIAMACHY cross-calibration were tackled in the methods by applying the following strategies:
-
The cross-calibration was performed using observations acquired over PICS, which are community-accepted calibration sites. For these sites, the probability of rapid changes in atmospheric and meteorological conditions within the 30 min acquisition time difference between the sensors is relatively low.
-
The ratios used to derive the TFs were filtered based on a low CF threshold, ensuring that only data collected under nearly clear-sky conditions were used. In addition to using median values, an IQR filter was applied to minimize the impact of outliers on the derived TFs.
-
Differences in spatial resolution between the sensors were addressed by synthesizing SCIAMACHY pixels that overlap with a GOME pixel. The weighted average reflectance of the SCIAMACHY pixels within the overlapping GOME pixel was then calculated.
-
Differences in spectral sampling were handled by regridding the GOME band wavelengths to match those of the SCIAMACHY bands.
-
A PMD-based analysis approach was employed as an indicator of pixel homogeneity in the cross-calibration process. This approach enabled the exclusion of non-homogeneous pixels and ensured more uniform pixel textures, thereby reducing the uncertainty of the TFs. This is facilitated by the higher sampling frequency of PMD measurements compared to the main detector channels.
6.2 Transfer functions from PICS
Including all measurements from the complete scanline, rather than limiting the analysis to only those directly intersecting with the PICS, did not significantly impact the cross-calibration results. This was likely due to the similar scene characteristics and surface reflectance signals typical of desert environments. The advantage of PICS was not significantly lost for the spectrometer ground pixel that extends beyond the defined boundary of PICS. Additionally, the small time difference in the collocation assisted in mitigating significant differences in the content of the cross-calibrated pixels.
The ratios of reflectance values of both sensors were in the range between 0.8 and 1.1 for the GOME bands before applying the PMD-based filter. GOME radiance and irradiance data were corrected for degradation, but the correction was solely based on irradiance measurements. A possible differential degradation that affected the reflectance was not corrected. It is found that the TFs for the East VZA exhibit larger uncertainties compared with those for the West and Nadir VZA. The PMD measurements of GOME and SCIAMACHY in Band 2B show a dependence on the VZA, which was consistent with the derived TFs for the same band (see Fig. 8a). As shown in the figure, the PMDs for the East VZA were less correlated than those for the West and Nadir VZAs, indicating less homogeneous pixels in the East viewing direction. Consequently, the uncertainties associated with the East VZA were higher than those for the Nadir and West VZAs.
The derived TFs of Band 2B exhibited a stronger dependence on VZA compared to those for Bands 3 and 4. This behavior was attributed to the significant UV degradation of the GOME instrument since 2001, which was scan mirror-dependent and varied with the viewing angles (Tilstra and Stammes, 2006), particularly at shorter wavelengths. In contrast, the degradation was less pronounced at longer wavelengths, resulting in reduced VZA dependency for Bands 3 and 4. Consequently, the impact of degradation on TFs was expected to be more substantial over time.
A notable observation was that the uncertainty appeared to be wavelength-dependent. In the UV, the measured signal was dominated by atmospheric scattering, whereas the contribution from surface reflection increased with wavelength. Consequently, scene inhomogeneity due to surface variability became more pronounced at longer wavelengths. Since GOME and SCIAMACHY did not sample identical ground pixels, surface inhomogeneity could lead to differences in the derived TFs for individual overpasses, resulting in increased scatter around the true TFs.
6.3 PMD measurements on describing the homogeneity of scenes
GOME and SCIAMACHY were both equipped with PMDs, which provided sub-pixel-scale measurements. The PMD measurements from GOME pixels involved in the cross-calibration were consistently higher than those from the corresponding SCIAMACHY pixels due to: (i) GOME PMDs had roughly double the spectral bandwidth compared to SCIAMACHY (see Table 2), and the optics were different, (ii) the GOME measurements were at the equatorial crossing time of 10:30 against SCIAMACHY at 10:00, hence, the GOME PMDs would receive larger signals, (iii) PMD data on Level 1b were not corrected with the cos (phi) factor (as the reflectance was), (iv) the larger values in PMDs GOME could explain that we have more sampling and less averaging than for a SCIAMACHY pixel. Nevertheless, different levels of correlation were observed between the two instruments, with the strongest correlation for Band 2B.
The PMD analysis revealed that the degree of spatial uniformity was wavelength-dependent. A broader range of σ and CV values was found for Bands 3 and 4 compared to Band 2B (see Fig. 8g–i), suggesting reduced pixel homogeneity at longer wavelengths. This reduction in homogeneity contributed to higher uncertainties in the TFs derived for Bands 3 and 4.
6.4 PMD-based filter on the improvement of the cross-calibration
The PMD analysis highlighted the crucial role of PMD measurements in assessing pixel homogeneity for cross-calibration. It provided a basis for developing robust filtering criteria using PMD-derived indicators, which enabled the exclusion of spatially non-uniform pixels. Overall, most cross-calibrated pixels from both sensors were spatially homogeneous, with absolute differences in below 0.01. Applying the PMD-based filter lead to the exclusion of a considerable number of GOME pixels from the TF derivation. Nevertheless, the absolute TF values with and without the filter showed no significant differences, while the uncertainties of many TFs were substantially reduced. This selective adjustment demonstrated that the PMD-based filter effectively improved TF estimates in the presence of non-homogeneous pixels. Ultimately, this approach broadens the applicability of TF derivation by enabling the inclusion of a more diverse range of surface types and reflectance conditions, rather than relying solely on desert scenes.
6.5 Limitation of the derived TFs
The derived TFs still exhibit some limitations and constraints that should be addressed to improve their accuracy and representativeness further:
- i.
Temporal dependency: The derived TFs depended on data from the year 2003. It was reported by Owda and Lichtenberg (2026) that degradation became severe toward the end of the GOME mission lifetime. Since the TFs are expected to be influenced by degradation, particularly in the UV, it is recommended to apply reflectance degradation corrections to the GOME data prior to TF derivation in order to ensure long-term consistency. This is envisaged for the next version of the TFs within the FDR4ATMOS project.
- ii.
Scene dependency: The TFs were derived using scenes with similar surface characteristics, primarily desert regions. As a result, the derived TFs were primarily tailored to a specific type of reflectance signal and may not generalize well to other surface types. To enhance their representativeness, it may be advisable to include additional reflectance signals from more diverse surfaces, such as those in oceanic and polar regions, provided that the selected scenes meet established homogeneity criteria. That work is envisaged for a follow-up paper.
The primary objective of the cross-calibration and harmonization of GOME and SCIAMACHY reflectances within the FDR4ATMOS project is the generation of a consistent cross-instrument Level 1b dataset spanning a longer temporal coverage than that of individual sensors. GOME and SCIAMACHY provided measurements with an overlap of approximately 10 years. To fully leverage data from both heritage missions, it is important to harmonize their measurements based on reference observations. Several studies reported on the stability of SCIAMACHY during its life mission and the better degradation model compared with GOME. That makes the SCIAMACHY a reliable reference for the cross-calibration. The resulting dataset provides harmonized reflectance suitable for long-term, instrument-independent trend analyses. Harmonization at the reflectance level is advantageous, as it remains independent of the specific assumptions and implementation of Level 2 retrieval algorithms. Consequently, the harmonized reflectances enable the development of new retrieval algorithms and products based on a consistent radiometric foundation.
The cross-calibration of spectrometers like GOME and SCIAMACHY is more complicated than the cross-calibration of imagers. The cross-calibration of GOME and SCIAMACHY presented unique challenges. There was no spatial collocation, and the sensors had different spatial and spectral resolutions. Furthermore, spectral structures had to be kept for the retrieval of trace gases. Strategies were introduced to address these challenges before the derivation of the TFs. These strategies shared the common goal of standardizing the conditions of overlapping pixels by reducing the influence of atmospheric and meteorological effects. Therefore, only measurements with a CF of less than 0.25 were used in the analysis. Furthermore, the O2 A-band with strong absorption features was excluded from the derivation of TFs.
The ratio of reflectance values for the overlapping pixels was consistent across spectral channels and PICS. The TFs for GOME Bands 2B and 3 were third-degree polynomial functions, and for Band 4, a constant value near 0.93. The derived TFs for the short wavelengths of GOME Band 2B were more dependent on VZA compared with longer wavelengths. It found that the uncertainty in TFs for the Band 2B nadir was the lowest among the other TFs.
The paper presented an approach for assessing scene homogeneity using PMD measurements. These measurements were characterized by higher spatial resolution, down to the sub-pixel level, and high sensitivity, and were effective in capturing the spatial variations within the observed scenes. The PMD analysis demonstrated a correlation between measurements of PMDs of GOME and SCIAMACHY. The homogeneity of pixels was wavelength-dependent. The spatial uniformity of overlapped pixels of Band 2B was higher than Bands 3 and 4, which impacted the uncertainty of TFs among the bands.
The PMD-based analysis enabled the identification of non-homogeneous overlapping pixels, allowing them to be excluded before the derivation of TFs. Subsequently, the ranges of ratios used to derive TFs were significantly reduced, leading to a higher level of convergence for fitting the polynomial functions. This improved the overall reliability of the cross-calibration process. This approach highlights the potential for expanding the dataset to include a larger number of observations from non-PICS sites by enabling the identification of pixels that meet homogeneity criteria. The proposed method can be applied in principle whenever higher spatial resolution data are available, with the aim of producing a long and continuous observational record spanning multiple decades.
Previous studies have shown that GOME reflectances are affected by differential degradation in irradiance and radiance measurements, which can impact retrieval results (e.g., Lerot et al., 2014). A corresponding soft-correction scheme for GOME reflectances, together with its expected impact on retrieval performance, will be presented in a follow-up study. For existing Level 2 products based on the DOAS retrieval approach, the impact of this degradation is expected to be negligible, as polynomial functions are employed as transfer functions (see Product README: ESA, 2025a). In contrast, retrieval approaches based on direct spectral fitting are expected to benefit directly from the harmonized reflectances.
A forthcoming study will explore the potential of utilizing scenes characterized by a range of surface textures and reflected signal properties by extending the analysis beyond stable pseudo-invariant calibration sites (PICS) to include more diverse land cover types and reflectance characteristics. The results are expected to provide valuable insights into optimizing pixel selection criteria and enhancing the robustness of satellite cross-calibration under more complex and variable conditions.
AO: Conceptualization, Methodology, Programming, Investigation, Writing – original draft. MCE: Programming, Writing – review and editing. SS: Conceptualization, Methodology, Writing – review and editing. GL: Conceptualization, Methodology, Writing – review and editing. BA: Programming.
The contact author has declared that none of the authors has any competing interests.
Publisher's note: Copernicus Publications remains neutral with regard to jurisdictional claims made in the text, published maps, institutional affiliations, or any other geographical representation in this paper. The authors bear the ultimate responsibility for providing appropriate place names. Views expressed in the text are those of the authors and do not necessarily reflect the views of the publisher.
The FDR4ATMOS project, initiated by ESA, provides long-term records of Earth observation Level 1 parameters (radiance, irradiance, reflectance) to improve the performance of mission datasets (https://atmos.eoc.dlr.de/FDR4ATMOS/, last access: 1 July 2025).
This research has been supported by the European Space Agency (grant no. 4000128410/19/I-NS). The article processing charges for this open-access publication were covered by the German Aerospace Center (DLR).
This paper was edited by Mark Weber and reviewed by three anonymous referees.
Abad, G. G., Souri, A. H., Bak, J., Chance, K., Flynn, L. E., Krotkov, N. A., Lamsal, L., Li, C., Liu, X., Miller, C. C., Nowlan, C. R., Suleiman, R., and Wang, H.: Five decades observing Earth’s atmospheric trace gases using ultraviolet and visible backscatter solar radiation from space, J. Quant. Spectrosc. Ra., 238, 106478, https://doi.org/10.1016/j.jqsrt.2019.04.030, 2019. a
Akima, H.: A new method of interpolation and smooth curve fitting based on local procedures, J. ACM, 17, 589–602, https://doi.org/10.1145/321607.321609, 1970. a
Barnes, B. B., Hu, C., Bailey, S. W., Pahlevan, N., and Franz, B. A.: Cross-calibration of MODIS and VIIRS long near infrared bands for ocean color science and applications, Remote Sens. Environ., 260, 112439, https://doi.org/10.1016/j.rse.2021.112439, 2021. a
Barsi, J. A., Markham, B. L., Czapla-Myers, J. S., Helder, D. L., Hook, S. J., Schott, J. R., and Haque, M. O.: Landsat-7 ETM+ radiometric calibration status, in: Earth Observing Systems XXI, SPIE, 9972, 96–107, https://doi.org/10.1117/12.2238625, 2016. a
Bovensmann, H., Burrows, J., Buchwitz, M., Frerick, J., Noël, S., Rozanov, V., Chance, K., and Goede, A.: SCIAMACHY: Mission objectives and measurement modes, J. Atmos. Sci., 56, 127–150, https://doi.org/10.1175/1520-0469(1999)056<0127:SMOAMM>2.0.CO;2, 1999. a
Burrows, J. P., Weber, M., Buchwitz, M., Rozanov, V., Ladstätter-Weißenmayer, A., Richter, A., DeBeek, R., Hoogen, R., Bramstedt,K., Eichmann, K.-U., Eisinger, M., and Perner, D.: The global ozone monitoring experiment (GOME): Mission concept and first scientific results, J. Atmos. Sci., 56, 151–175, https://doi.org/10.1175/1520-0469(1999)056<0151:TGOMEG>2.0.CO;2, 1999. a
Cabor, F., Hagolle, O., Cosnefroy, H., and Briottet, X.: Inter-calibration using desertic sites as a reference target, in: IGARSS'98. Sensing and Managing the Environment. 1998 IEEE International Geoscience and Remote Sensing. Symposium Proceedings, IEEE, 98CH36174, 5, 2713–2715, https://doi.org/10.1109/IGARSS.1998.702327, 1998. a, b
Chander, G., Angal, A., Choi, T., and Xiong, X.: Radiometric cross-calibration of EO-1 ALI with L7 ETM+ and Terra MODIS sensors using near-simultaneous desert observations, IEEE J. Sel. Top. Appl., 6, 386–399, https://doi.org/10.1109/JSTARS.2013.2251999, 2013a. a
Chander, G., Hewison, T. J., Fox, N., Wu, X., Xiong, X., and Blackwell, W. J.: Overview of intercalibration of satellite instruments, IEEE T. Geosci. Remote, 51, 1056–1080, https://doi.org/10.1109/TGRS.2012.2228654, 2013b. a
Coldewey-Egbers, M., Slijkhuis, S., Aberle, B., Loyola, D., and Dehn, A.: The Global Ozone Monitoring Experiment: review of in-flight performance and new reprocessed 1995–2011 level 1 product, Atmos. Meas. Tech., 11, 5237–5259, https://doi.org/10.5194/amt-11-5237-2018, 2018. a
Cosnefroy, H., Leroy, M., and Briottet, X.: Selection and characterization of Saharan and Arabian desert sites for the calibration of optical satellite sensors, Remote Sens. Environ., 58, 101–114, https://doi.org/10.1016/0034-4257(95)00211-1, 1996. a, b, c
ESA: FDR4ATMOS products, ESA [data set], https://doi.org/10.5270/ESA-852456e, 2024a. a, b
ESA: SCIAMACHY Level-1b data, ESA [data set], https://doi.org/10.5270/EN1-5eab12a, 2024b. a
ESA: FDR4ATMOS readme, https://earth.esa.int/eogateway/documents/d/earth-online/fdr4atmos_fdr_readme (last access: 13 April 2026), 2025a. a
ESA: Global Ozone Monitoring Experiment (GOME), https://earth.esa.int/eogateway/instruments/gome (last access: 13 April 2026), 2025b. a
ESA: GOME Level-1b data, ESA [data set], https://earth.esa.int/eogateway/instruments/gome/products-information (last access: 13 April 2026), 2025c. a
ESA: SCIAMACHY Instrument Overview, https://earth.esa.int/eogateway/instruments/sciamachy (last access: 13 April 2026), 2025d. a
FDR4ATMOS manual: FDR Product User Guide Level 1a/b, https://earth.esa.int/documents/d/earth-online/fdrproductuserguide-fdr4atb-pug-dlr-0018_issue1 (last access: 2 July 2025), 2024. a, b, c
Hadjimitsis, D. G., Clayton, C. R., and Retalis, A.: The use of selected pseudo-invariant targets for the application of atmospheric correction in multi-temporal studies using satellite remotely sensed imagery, Int. J. Appl. Earth. Obs., 11, 192–200, https://doi.org/10.1016/j.jag.2009.01.005, 2009. a
He, Z., Fan, G., Li, X., Gong, F.-Y., Liang, M., Gao, L., and Zhou, M.: Spatio-temporal modeling of satellite-observed CO2 columns in China using deep learning, Int. J. Appl. Earth. Obs., 129, 103859, https://doi.org/10.1016/j.jag.2024.103859, 2024. a
Helder, D., Thome, K. J., Mishra, N., Chander, G., Xiong, X., Angal, A., and Choi, T.: Absolute radiometric calibration of Landsat using a pseudo invariant calibration site, IEEE T. Geosci. Remote, 51, 1360–1369, https://doi.org/10.1109/TGRS.2013.2243738, 2013. a, b
Hilbig, T., Bramstedt, K., Weber, M., Burrows, J. P., and Krijger, M.: Optimised degradation correction for SCIAMACHY satellite solar measurements from 330 to 1600 nm by using the internal white light source, Atmos. Meas. Tech., 13, 3893–3907, https://doi.org/10.5194/amt-13-3893-2020, 2020. a
Khadka, N., Teixeira Pinto, C., and Leigh, L.: Detection of change points in pseudo-invariant calibration sites time series using multi-sensor satellite imagery, Remote Sens.-Basel, 13, 2079, https://doi.org/10.3390/rs13112079, 2021. a
Lerot, C., Van Roozendael, M., Spurr, R., Loyola, D., Coldewey-Egbers, M., Kochenova, S., van Gent, J., Koukouli, M., Balis, D.,Lambert, J.-C., Granville, J., and Zehner, C.: Homogenized total ozone data records from the European sensors GOME/ERS-2, SCIAMACHY/Envisat, and GOME-2/MetOp-A, J. Geophys. Res.-Atmos., 119, 1639–1662, https://doi.org/10.1002/2013JD020831, 2014. a
Lichtenberg, G., Kleipool, Q., Krijger, J. M., van Soest, G., van Hees, R., Tilstra, L. G., Acarreta, J. R., Aben, I., Ahlers, B., Bovensmann, H., Chance, K., Gloudemans, A. M. S., Hoogeveen, R. W. M., Jongma, R. T. N., Noël, S., Piters, A., Schrijver, H., Schrijvers, C., Sioris, C. E., Skupin, J., Slijkhuis, S., Stammes, P., and Wuttke, M.: SCIAMACHY Level 1 data: calibration concept and in-flight calibration, Atmos. Chem. Phys., 6, 5347–5367, https://doi.org/10.5194/acp-6-5347-2006, 2006. a
Ma, S., Yan, W., Huang, Y.-X., Ai, W.-H., and Zhao, X.: Vicarious calibration of S-NPP/VIIRS day–night band using deep convective clouds, Remote Sens. Environ., 158, 42–55, https://doi.org/10.1016/j.rse.2014.11.006, 2015. a
Owda, A. and Lichtenberg, G.: Comparative analysis of GOME and SCIAMACHY reflectance over Pseudo-Invariant Calibration Sites: implications for spectrometers cross-calibration, Atmos. Meas. Tech., 19, 3193–3211, https://doi.org/10.5194/amt-19-3193-2026, 2026. a, b, c, d
Patel, P. N., Bhatt, H., Mathur, A., Prajapati, R., and Tyagi, G.: Reflectance-based vicarious calibration of INSAT-3D using high-reflectance ground target, Remote Sensing Applications: Society and Environment, 3, 20–35, https://doi.org/10.1016/j.rsase.2015.12.001, 2016. a
Tilstra, L. G. and Stammes, P.: Intercomparison of reflectances observed by GOME and SCIAMACHY in the visible wavelength range, Appl. Optics, 45, 4129–4135, https://doi.org/10.1364/AO.45.004129, 2006. a
Wang, J., Chen, S., Hu, S., Deng, L., Ma, C., Peng, H., and Song, Q.: System vicarious calibration and ocean color retrieval from the HY-1C UVI, Int. J. Appl. Earth. Obs., 136, 104417, https://doi.org/10.1016/j.jag.2025.104417, 2025. a
Wu, A., Mu, Q., Angal, A., and Xiong, X.: Assessment of MODIS and VIIRS calibration consistency for reflective solar bands calibration using vicarious approaches, in: Sensors, Systems, and Next-Generation Satellites XXIV, SPIE, 11530, 235–246, https://doi.org/10.1117/12.2573022, 2020. a
Zhang, X., Wang, F., Wang, W., Huang, F., Chen, B., Gao,L., Wang, S., Yan, H., Ye, H., Si, F., Hong, J., Li, X., Cao, Q., Che, H., and Li, Z.: The development and application of satellite remote sensing for atmospheric compositions in China, Atmos. Res., 245, 105056, https://doi.org/10.1016/j.atmosres.2020.105056, 2020. a