the Creative Commons Attribution 4.0 License.
the Creative Commons Attribution 4.0 License.
 | 26 May 2026
Vertical structure and driving mechanism of PM2.5 and PM10 aerosols in Hefei based on LiDAR observations (2021–2023)
Yan Yan
Xueliang Deng
Rui Dai
Qianqian Xu
Qinqin Huang
Yang Liu
Chunxuan Wei
Jinhua Xie
Yanfeng Li
Yan Sun
Aerosol pollution remains a significant environmental concern in China. However, the vertical structure and evolution of particulate matter are poorly understood due to the lack of long-term, high-resolution observations. In Hefei, the aerosols during the study period were dominated by a mixture of fine particulate matter (PM2.5) and coarse particulate matter (PM10), mainly originating from urban traffic emissions, industrial activities, and regional transport, with significant contributions from secondary inorganic aerosols and occasional dust events. To address the knowledge gap in aerosol vertical distribution during different pollution episodes, this study employed an aerosol LiDAR system with 532 nm band to investigate the vertical profile characteristics of aerosols, with a focus on comparing the stratification differences of optical properties between PM2.5 and PM10 pollution events over Hefei. The seasonal and diurnal variations of aerosol profiles were investigated on polluted and clean days. The relationship between near-surface particulate matter concentrations and aerosol vertical properties was analyzed at different heights, alongside the dynamic evolution of aerosol layers during typical pollution events. Our results demonstrated that the extinction coefficient (532 nm) of PM2.5-polluted days below 0.6 km was approximately 3 times that of PM10-polluted days. In contrast, the depolarization ratio of PM10-polluted episodes remains consistently higher than that of PM2.5-polluted cases throughout the entire observed altitude range. The differences in extinction between polluted and clean days for PM2.5 were most pronounced below 0.9 km and subsequently decreased as altitude increased, whereas the differences in PM10 remained significant below 1.2 km. For PM2.5, the strongest enhancement appeared between 07:00 and 14:00 Beijing time (BJT). A subtle lifting with height was observed around midday. PM10-polluted days were characterized by a greater vertical extension of high aerosol extinction (up to ∼ 1.2–1.4 km) but a shorter duration of strong extinction. In contrast, PM2.5-polluted days exhibited a persistent but vertically confined aerosol layer. The vertical wind shear (VWS) was weaker on PM2.5-polluted days compared to clean days. On PM10-polluted days, the VWS in the near-surface layer (1000–900 hPa) was significantly stronger than that on clean days, especially during the early morning and evening periods. The PM2.5 pollution in Hefei was mostly contributed by temperature inversion and high relative humidity, while PM10 pollution was driven by long-range transport of aerosol particles under the cold front system and dry conditions. These findings reveal complex interactions between aerosol optical properties, boundary-layer dynamics, and synoptic conditions, providing new insights into the vertical air quality processes in eastern China.
- Article
(23336 KB) - Full-text XML
-
Supplement
(2647 KB) - BibTeX
- EndNote


Air pollution remains one of the most pressing environmental challenges globally, with fine particulate matter and inhalable coarse particles posing serious risks to public health and atmospheric visibility (Chen et al., 2023; Deng et al., 2023). Air quality is closely related to the concentration of pollutants suspended in the atmosphere (Wang et al., 2024). Solid and liquid phase pollutants, known as aerosols, not only impact air quality and visibility through multiple mechanisms but also affect the climate by altering Earth's radiation budget and water cycle processes (Chen et al., 2016; Miao et al., 2018). In China, substantial improvements in air quality have been achieved in recent years through stringent emission control policies. However, severe particle pollution events still occur frequently, especially in winter haze episodes and spring dust storms across the Yangtze River Delta (YRD) region (Han and Cao 2022; Wang and Wang 2021). To date, most studies have focused on surface-level air quality, with particular attention to individual PM2.5 and PM10 event in eastern China and urban agglomerations from ground monitoring networks (He et al., 2021). These data provide critical insights into near-surface concentrations. However, they lack information on the vertical distribution and formation mechanisms of pollutants, which is essential for understanding aerosol processes in the troposphere (Mehta et al., 2021; Mishra and Shibata 2012; Wang et al., 2018).
While extensive ground-based monitoring has provided insights into surface-level pollution, the understanding of the vertical distribution and evolution of aerosols remains limited due to a lack of long-term and high-resolution vertical observations (He et al., 2022; Ou et al., 2021; Shen et al., 2022). The atmospheric boundary layer (ABL) plays a crucial role in regulating aerosol dynamics through physical mechanisms such as turbulence, convection, and mixing (Gao et al., 2011; Garratt 1994; Tombrou et al., 2007). As the interface between the surface and the free troposphere, the ABL governs the vertical exchange of energy, moisture, and pollutants. Numerous studies have demonstrated that lower ABL heights could trap pollutants near the surface, leading to elevated PM2.5 levels. These lower heights are often associated with thermal inversions and stagnant synoptic conditions (Liu et al., 2020; Sun et al., 2024). Under such conditions, limited mixing suppresses the vertical dispersion of aerosols, allowing surface emissions to accumulate rapidly, particularly in urban areas with high anthropogenic activity. In contrast, strong vertical mixing and higher ABL heights enhance dispersion and dilution of pollutants, which frequently results in improved surface air quality (Jin et al., 2021). Moreover, interactions between the lower ABL and the overlying free troposphere, including vertical wind shear, subsidence, and entrainment processes, also significantly influence aerosol layering and transboundary transport (Deng et al., 2023; Li et al., 2022). These interactions are significant during transition periods such as the morning boundary layer growth phase or evening collapse, which strongly affect aerosol vertical distribution (Li et al., 2018). Despite these known mechanisms, detailed observations of the vertical structure of aerosols and their relation to meteorological dynamics remain limited under varying pollution conditions and across different seasons (Yang et al., 2025). Comprehensive long-term observations are still needed to characterize how meteorology influences aerosol stratification and transformation over time.
Active remote sensing techniques, such as aerosol Light Detection and Ranging (LiDAR), have emerged as powerful tools to fill this observational gap (Ansmann et al., 2013; Chen et al., 2024a). Unlike passive satellite-based instruments, LiDAR systems provide high-resolution vertical profiles of aerosol optical properties at fine temporal scales and under both day and night conditions, capable of capturing sub-kilometer vertical gradients and diurnal variability that are critical for understanding boundary-layer dynamics (Wang et al., 2024; Zhang et al., 2020b). It enables continuous monitoring of aerosol structure, boundary layer formation, and pollutant layering in response to atmospheric dynamics (Fan et al., 2024; Fang et al., 2024; Li et al., 2024). Specifically, polarization-sensitive aerosol LiDAR can simultaneously retrieve extinction coefficients and depolarization ratios, which serve as indications of aerosol concentration and morphology (Cairo et al., 2024; Chen et al., 2024a; Kumar et al., 2024). The extinction coefficient quantifies the total attenuation of light caused by scattering and absorption by particles, and it is directly related to aerosol optical depth and visibility (Chen et al., 2024b; Qian et al., 2024b). The depolarization ratio distinguishes the spherical and non-spherical particles, providing insights into aerosol types such as secondary inorganic aerosols, biomass burning smoke, and desert dust. These parameters are crucial for understanding not only the optical but also the physical properties of aerosols (Chen et al., 2024b; Gebauer et al., 2024). However, most previous studies using such measurements have been limited to short-term campaigns or case studies of individual pollution episodes (Chen et al., 2022; Zhong et al., 2018). These attempts often lack the long-term temporal continuity and seasonal representativeness necessary for climatological or process-level understanding, particularly in regions subject to strong seasonal and meteorological variability.
Long-term monitoring of air pollutants is essential for the comprehensive understanding of their temporal characteristics (Fan et al., 2021; Xiang et al., 2021). Unlike ground-based air quality monitoring networks, vertically resolved data are required to evaluate the entire process of pollution events, vertical mixing, and potential long-range transport (Wang et al., 2024). Passive satellite remote sensing techniques have proven useful in bridging spatial gaps in air quality data, but are limited in their ability to resolve vertical structures with high temporal accuracy due to their coarse resolution and fixed overpass times (Chen et al., 2023). Chemical transport models (CTMs) have been widely used to simulate the spatiotemporal behavior of aerosols and their interactions with meteorology (Wang et al., 2025; Xiong et al., 2023). However, their accuracy is constrained by uncertainties in emissions inventories, boundary conditions, meteorological input fields, and the representation of aerosol microphysics. In addition, model performance varies significantly by region and pollution type (Zhan et al., 2024). LiDAR technology provides high temporal resolution and fine vertical resolution measurements of aerosol and meteorological variables, including aerosol extinction, backscattering, and wind profiles (Chen et al., 2023; Chouza et al., 2015; Zhang et al., 2020b). This capability makes LiDAR particularly suitable for investigating aerosol evolution and transport within the ABL and lower troposphere. Nonetheless, long-term time series analyses based on continuous LiDAR measurements remain limited in the literature.
To address these limitations, we conducted multi-year observations using an aerosol LiDAR system in Hefei. The deployed LiDAR system provides real-time vertical profiles of aerosol extinction and depolarization ratios, allowing for a detailed assessment of aerosol structure under different pollution levels. This study fills the observational gap in the long-term vertical characteristics of both fine and coarse particulate pollution over this region. We characterized the vertical and temporal evolution of aerosol properties and linked them with pollution episodes and boundary-layer processes by integrating LiDAR data with surface PM2.5 and PM10 concentrations, meteorological observations, and reanalysis products. Therefore, the objectives of this study were (1) to analyze the seasonal and diurnal variations of vertical profiles with aerosol extinction and depolarization data; (2) to compare the vertical structures on polluted and clean days to clarify the differences in aerosol optical properties between these two conditions; (3) to assess the relationship between aerosol layering and near-surface pollutant concentrations at different heights; and (4) to investigate the spatiotemporal evolution of aerosols during specific pollution episodes and explore the mechanisms of their vertical structure, meteorological conditions, and accumulation process. The findings are expected to enhance our understanding of aerosol vertical structure in eastern China and provide scientific support for air quality management and modeling efforts.
2.1 Study region
Hefei occupies a strategic location, bridging the Beijing–Tianjin–Hebei metropolitan cluster and the Yangtze River Delta economic hub. The study area lies in a transitional climatic zone, where temperature inversions occur frequently in winter. Such conditions often result in stagnant air that limits pollutant dispersion. In addition, the geography of Hefei plays a critical role in exacerbating air quality challenges. Hefei is surrounded by the Dabie Mountains in the west and the Huangshan ranges in the south. The open plains dominate its northern and eastern frontiers (Fig. 1b). These natural barriers hinder the southward dispersion of airborne pollutants while trapping those transported from industrialized northern regions within the basin. The unique combination of geographic constraints and atmospheric conditions has made Hefei a focal point for studying complex pollution mechanisms. Researchers here focus particularly on the synergistic effects of regional transportation, local emissions, and meteorological drivers on particulate matter formation (Fang et al., 2024; Huang et al., 2016; Liu et al., 2024).
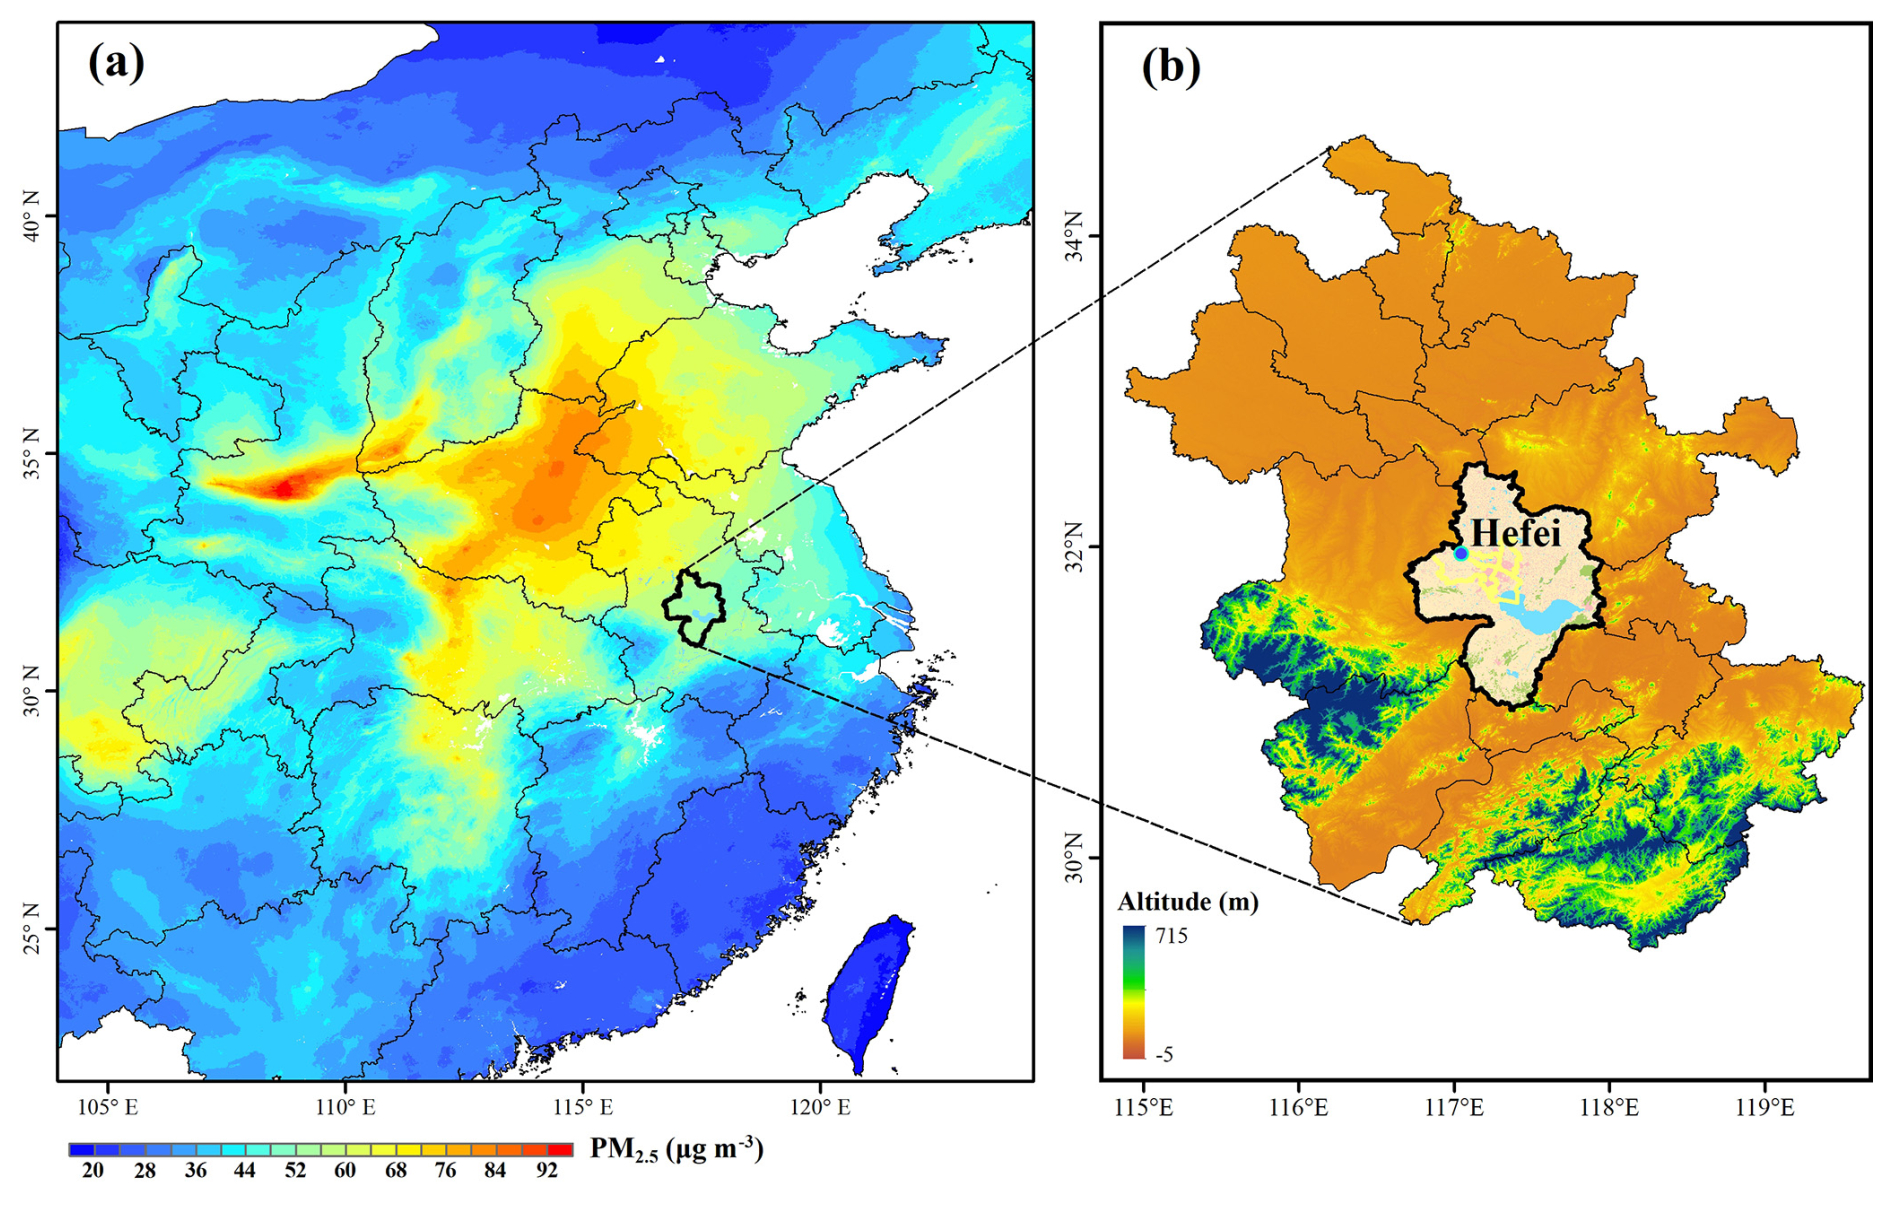
Figure 1The spatial distribution of (a) the averaged PM2.5 concentration during winter from 2021 to 2023(Ministry of Environmental Protection in China, https://air.cnemc.cn:18007/, last access: 5 January 2025) and (b) the location of the study area (Hefei, China). The digital elevation model (DEM) data are derived from the NASA Shuttle Radar Topography Mission (SRTM) 30 m product (https://glovis.usgs.gov/, last access: 15 January 2025), and the land use map of the study area is obtained from the 30 m resolution annual China Land Cover Dataset (CLCD) dataset. The monitoring station is marked by the blue dot.
2.2 Aerosol LiDAR data
The LGJ-05 aerosol LiDAR combines traditional radar technology and modern laser technology, with 355, 532, and 1064 nm as detection light sources. Measurements at 532 nm were utilized exclusively for this study. The LiDAR emits a laser pulse into the atmosphere to capture backscattered signals, thereby obtaining key aerosol optical characteristics. As a polarization-sensitive system, it can retrieve extinction coefficients and depolarization ratios to characterize aerosols in the atmosphere. During the transmission process, the laser pulse is scattered and extinguished by atmospheric aerosol particles. The intensity of backscattered light at different altitudes correlates with the scattering and extinction properties of aerosol and cloud particles at those altitudes. The backscattered light from spherical particles can maintain its polarization characteristics of the emitted pulse since the emitted laser pulse is linearly polarized. In contrast, non-spherical particles (such as dust particles and ice crystals in cirrus clouds) depolarize the backscattered light due to their irregular shapes and asymmetric interaction with linearly polarized laser pulses. The LiDAR could detect the echo signals of the parallel and vertical components in the backscattered light, enabling acquisition of the vertical profile of the depolarization ratio of atmospheric aerosol particles. It could enable three-dimensional monitoring of the atmosphere in real time through active remote sensing, with the capacity to invert spatiotemporal distribution information such as aerosol extinction, depolarization, and water vapor mixing ratio in the atmosphere. The aerosol extinction coefficient reflects the attenuation capacity of aerosol particles to incident light, while the depolarization ratio indicates the non-spherical nature of aerosol and cloud particles. A higher extinction coefficient typically indicates a larger concentration of aerosol particles or stronger light-scattering/absorbing properties. However, greater depolarization values denote a higher abundance of non-spherical aerosol particles (e.g., dust, rugged industrial aerosols) or mixed-phase cloud constituents. By contrast, lower depolarization ratios indicate a dominance of spherical particles or simpler particle structures.
Since the instrument is capable of receiving data below 30 km, the effective detection range of the aerosol LiDAR can cover 0.2–6 and 0.2–15 km for daytime and nighttime, respectively. It offers a vertical spatial resolution of 7.5 m and a temporal resolution of 10 min. The observations were conducted at the National Meteorological Observation Station in the northwest of Hefei (31.96° N, 117.06° E) from March 2021 to May 2023.
2.3 Ground-based observational data
Hourly concentrations of PM2.5 and PM10 were obtained from ground-based monitoring stations in Hefei, which are operated and maintained by the China National Environmental Monitoring Centre (CNEMC) (Liu et al., 2017). These pollutant data were obtained from professional monitoring instruments, with the LGH-01E aerosol mass concentration monitor used for PM10 and the LGH-01B for PM2.5, both of which apply the beta attenuation method. All instruments are calibrated regularly according to national standards, and the data undergo strict quality control procedures, including hourly, daily, and annual audits, as described in the China Environmental Monitoring Quality Assurance and Quality Control Manual. It should be noted that we focused on PM2.5 and PM10 concentrations during winter and spring, respectively. All comparisons between PM2.5 and PM10 pollution episodes were conducted across both seasons. The hourly resolution of the dataset allows for capturing diurnal variations in pollutant levels, while the multi-pollutant data facilitates analysis of the differences in meteorological responses of pollutants in Hefei.
The observed meteorological variables were obtained from the China Meteorological Administration (CMA) (http://data.cma.cn/en, last access: 16 March 2025), measured by the Vaisala PTB210 Digital Barometer for atmospheric pressure, the Vaisala HMP155A Temperature and Relative Humidity Probe for air temperature (T) and relative humidity (RH), the EL15-2C Wind Direction Sensor for wind direction (WD), and the EL15-1C Wind Speed Sensor for wind speed (WS). All meteorological instruments are routinely maintained and calibrated to ensure the accuracy and reliability of observational data.
2.4 ECMWF reanalysis data
This study aims to investigate the impact of the synoptic system on PM2.5 and PM10 pollution. The ERA5 reanalysis dataset, freely accessible via the Copernicus Climate Change Services platform (https://cds.climate.copernicus.eu/datasets, last access: 23 March 2025), serves as the data source. Vertical atmospheric data within the ERA5 dataset are interpolated to 37 pressure levels. This interpolation yields comprehensive data ranging from the Earth's surface to the upper atmosphere. Given its high spatial and temporal resolution, the ERA5 dataset has been widely employed in extreme weather events, climate prediction, and air pollution studies (Fan et al., 2021; Zhang et al., 2020b).
This study collected hourly geopotential height, vertical wind velocity, temperature, and humidity data. The data correspond to multi-pressure levels (500, 700, 725, 750, 775, 800, 825, 850, 875, 900, 925, 950, 975, and 1000 hPa). The spatial resolution of our dataset was 0.25° × 0.25° (zonal and meridional) and supports a detailed and accurate exploration of the synoptic-particulate matter relationship. The data were extracted for winter and spring during 2021–2023, consistent with the periods of the surface pollutant and aerosol LiDAR observations.
2.5 Quality control
To explore the potential of aerosol LiDAR observations and improve data reliability, this study extracted the extinction coefficient and depolarization ratio data at 532 nm from the LiDAR system for the period from March 2021 to May 2023. In the quality control process, specific criteria were established to ensure the reliability of the retrieved parameters. Specifically, it covers three steps for outlier detection, removal of spurious points, and temporal consistency analysis. Outlier detection was conducted to eliminate all records outside the normal value range according to the parameter intervals provided by the instrument, with specific thresholds applied based on the signal-to-noise ratios (SNR) of the parallel (P) and perpendicular (S) channels. The extinction coefficient at 532 nm was calculated using data from the P channel, which was considered reliable only when the corresponding SNR exceeded three. The depolarization ratio was derived from the P and S channels, and data were accepted only when both channels had SNRs greater than three. The P channel detects linearly polarized light in the parallel direction, while the S channel detects linearly polarized light in the perpendicular direction. Based on the time series of SNR records, the individual extinction and depolarization data were cross-referenced. Temporal consistency analysis was conducted by identifying records that deviated by more than three standard deviations from the mean as outliers. The original LiDAR data have a 10 min temporal resolution. After quality control, these data were averaged to hourly resolution to be consistent with the hourly ground-based pollutant observations. To further improve data reliability, this study calculated the credibility ratio of the extinction coefficient and depolarization ratio at different altitudes. Based on the criterion of a 60 % valid data availability rate, the effective detection ranges for the 532 nm of the extinction coefficient and depolarization ratio were 0.2–1.8 km.
2.6 Methodology
2.6.1 Definition of polluted and clean
In this study, the data from 2021–2023 are gathered and categorized into four seasons: spring (March–May), summer (June–August), autumn (September–November), and winter (December–February). Given that PM2.5 pollution is most severe in winter and sand-dust events are frequent in spring, the definitions of polluted and clean days in this study primarily focus on these two seasons. Days in winter when the daily average concentration of PM2.5 exceeds 75 µg m−3 are defined as PM2.5-polluted days. Conversely, days in winter with a daily average PM2.5 concentration below 50 µg m−3 are classified as PM2.5-clean days. For PM10, spring days with daily average concentrations above 150 µg m−3 are defined as polluted days, while those below 100 µg m−3 are considered clean days (Ministry of Environmental Protection of the People's Republic of China, Technical Regulation on Ambient Air Quality Index, 2012). To eliminate the wet deposition effect of precipitation, all observations in this study excluded precipitation daily data.
2.6.2 Calculation of Vertical Wind Shear
The vertical wind shear (VWS) is a crucial factor in characterizing the change in wind velocity with height. It is defined as the variation of wind vector across atmospheric layers, quantified by the magnitude of the difference between upper and lower levels. The VWS can be calculated using the following formula:
where VWS is measured in units of . ut and ul denote the zonal wind components at the upper zt and lower zl levels, respectively, while vt and vl represent the corresponding meridional wind components. This calculation aids in quantifying the vertical dynamic forces that may impact the dispersion and transportation of pollutants.
3.1 Variations of inter-annual PM2.5 and PM10
Figure 2 shows the variations in the concentrations of PM2.5 and PM10 pollutants from 2021 to 2023. Both PM2.5 and PM10 pollutants exhibited a clear seasonal pattern, with concentrations higher in winter and lower in summer (Liu et al., 2021; Wang et al., 2024). In addition, PM10 concentrations were relatively high during the spring months of 2022 and 2023, likely driven by increased dust events such as sand-dust storms that commonly occurred during this season. High PM2.5 PM10 ratios (≥ 0.5) during winter suggest a dominant contribution from fine particulate matter, whereas lower ratios (≤ 0.5) in spring indicate an increased presence of coarse particles (Liu et al., 2015). The episodic PM10 peaks observed in spring 2022–2023 coincided with a pronounced decrease in the PM2.5 PM10 ratio in Hefei. This phenomenon reflected intensified pollution of coarse-mode aerosols. Although winter months also suffered elevated PM10 pollution, the concurrent high PM2.5 concentrations complicated the separation of dust-related contributions. In contrast, the lower PM2.5 PM10 ratios in spring facilitated the distinct observation of dust events due to the reduced interference from fine particulate matter.
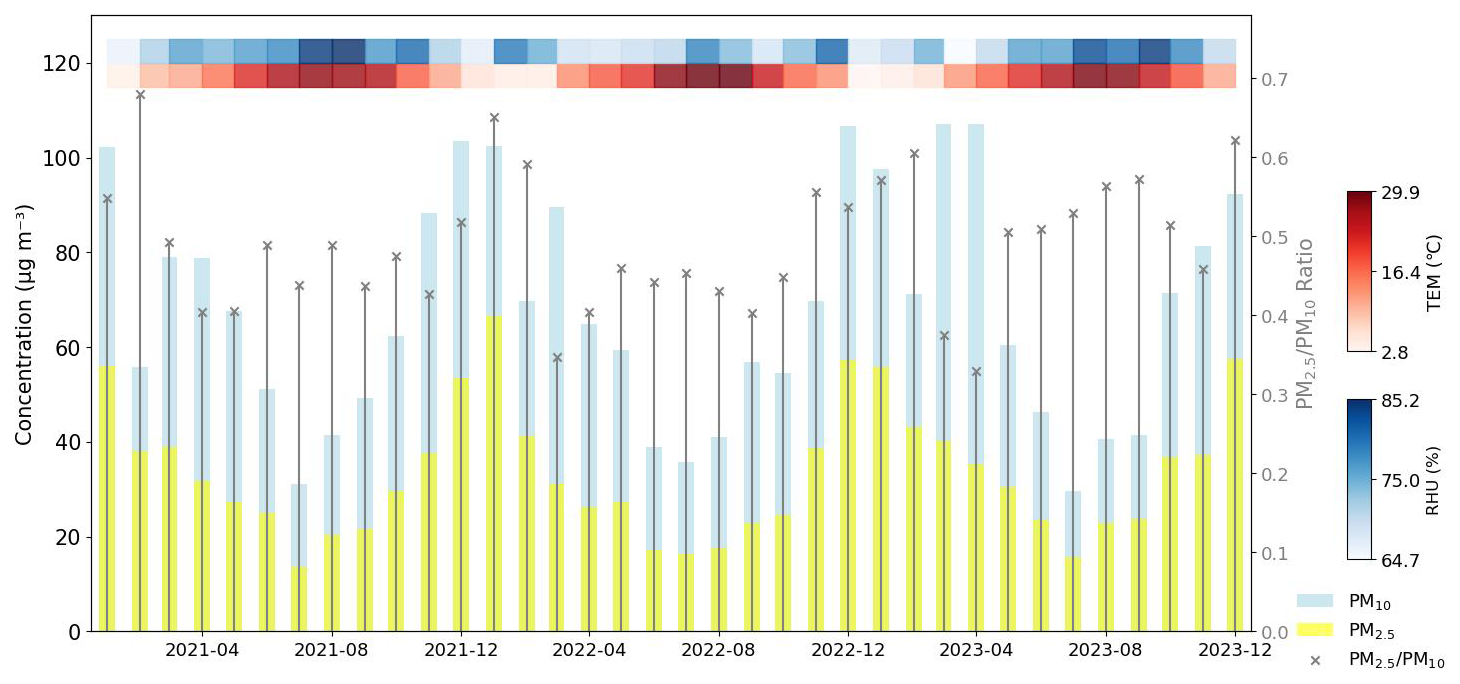
Figure 2Monthly variation of PM2.5 (marked as the yellow bars) and PM10 (marked as the blue bars) concentrations, PM2.5 PM10 ratio (the grey lines with markers on top), temperature (TEM), and relative humidity (RH) during 2021–2023 in Hefei (Beijing time, BJT = UTC + 8 h).
The hourly PM2.5 and PM10 concentrations exhibited clear diurnal variation on both polluted and clean days (Fig. 3). Polluted days showed significantly higher PM2.5 levels, with hourly averages ranging from 100 to 125 µg m−3, compared to the stable 35–55 µg m−3 range observed on clean days. The PM2.5 concentrations on polluted days displayed a bimodal pattern. The concentrations remained consistently high throughout the morning period from 04:00 to 11:00 (Beijing time, BJT), with the peak at 10:00–11:00 (BJT) (Dai et al., 2020). Valleys in PM2.5 concentrations occurred at 16:00 (BJT), possibly associated with enhanced atmospheric dispersion from midday heating that facilitates the dilution of particulate matter. Concentrations initiated an upward trend from 17:00 (BJT), with a gradual increase culminating in a peak between 21:00 and 22:00 (BJT). In contrast, clean days exhibited a subtle morning and overnight peaks. For PM10, polluted days presented pronounced peaks at 10:00–12:00 and 21:00–22:00 (BJT), coinciding with increased dust resuspension or construction activities (Yu et al., 2020). However, valleys occurred at 07:00 and 19:00 (BJT). These may be due to reduced surface disturbances during dawn and enhanced vertical mixing in the afternoon. Clean days maintained relatively low hourly mean PM10 concentrations (50–70 µg m−3) with minor fluctuations. The time series curves of pollutants had different peak times and amplitudes, indicating distinct origins. PM2.5 was more influenced by continuous anthropogenic emissions, while PM10 was sensitive to episodic coarse-particle events (Deng et al., 2023; Wang et al., 2024). These hourly dynamics highlighted the role of diurnal meteorological cycles in modulating particulate matter distribution, with polluted days amplifying both primary emissions and secondary aerosol formation (Liu et al., 2021).
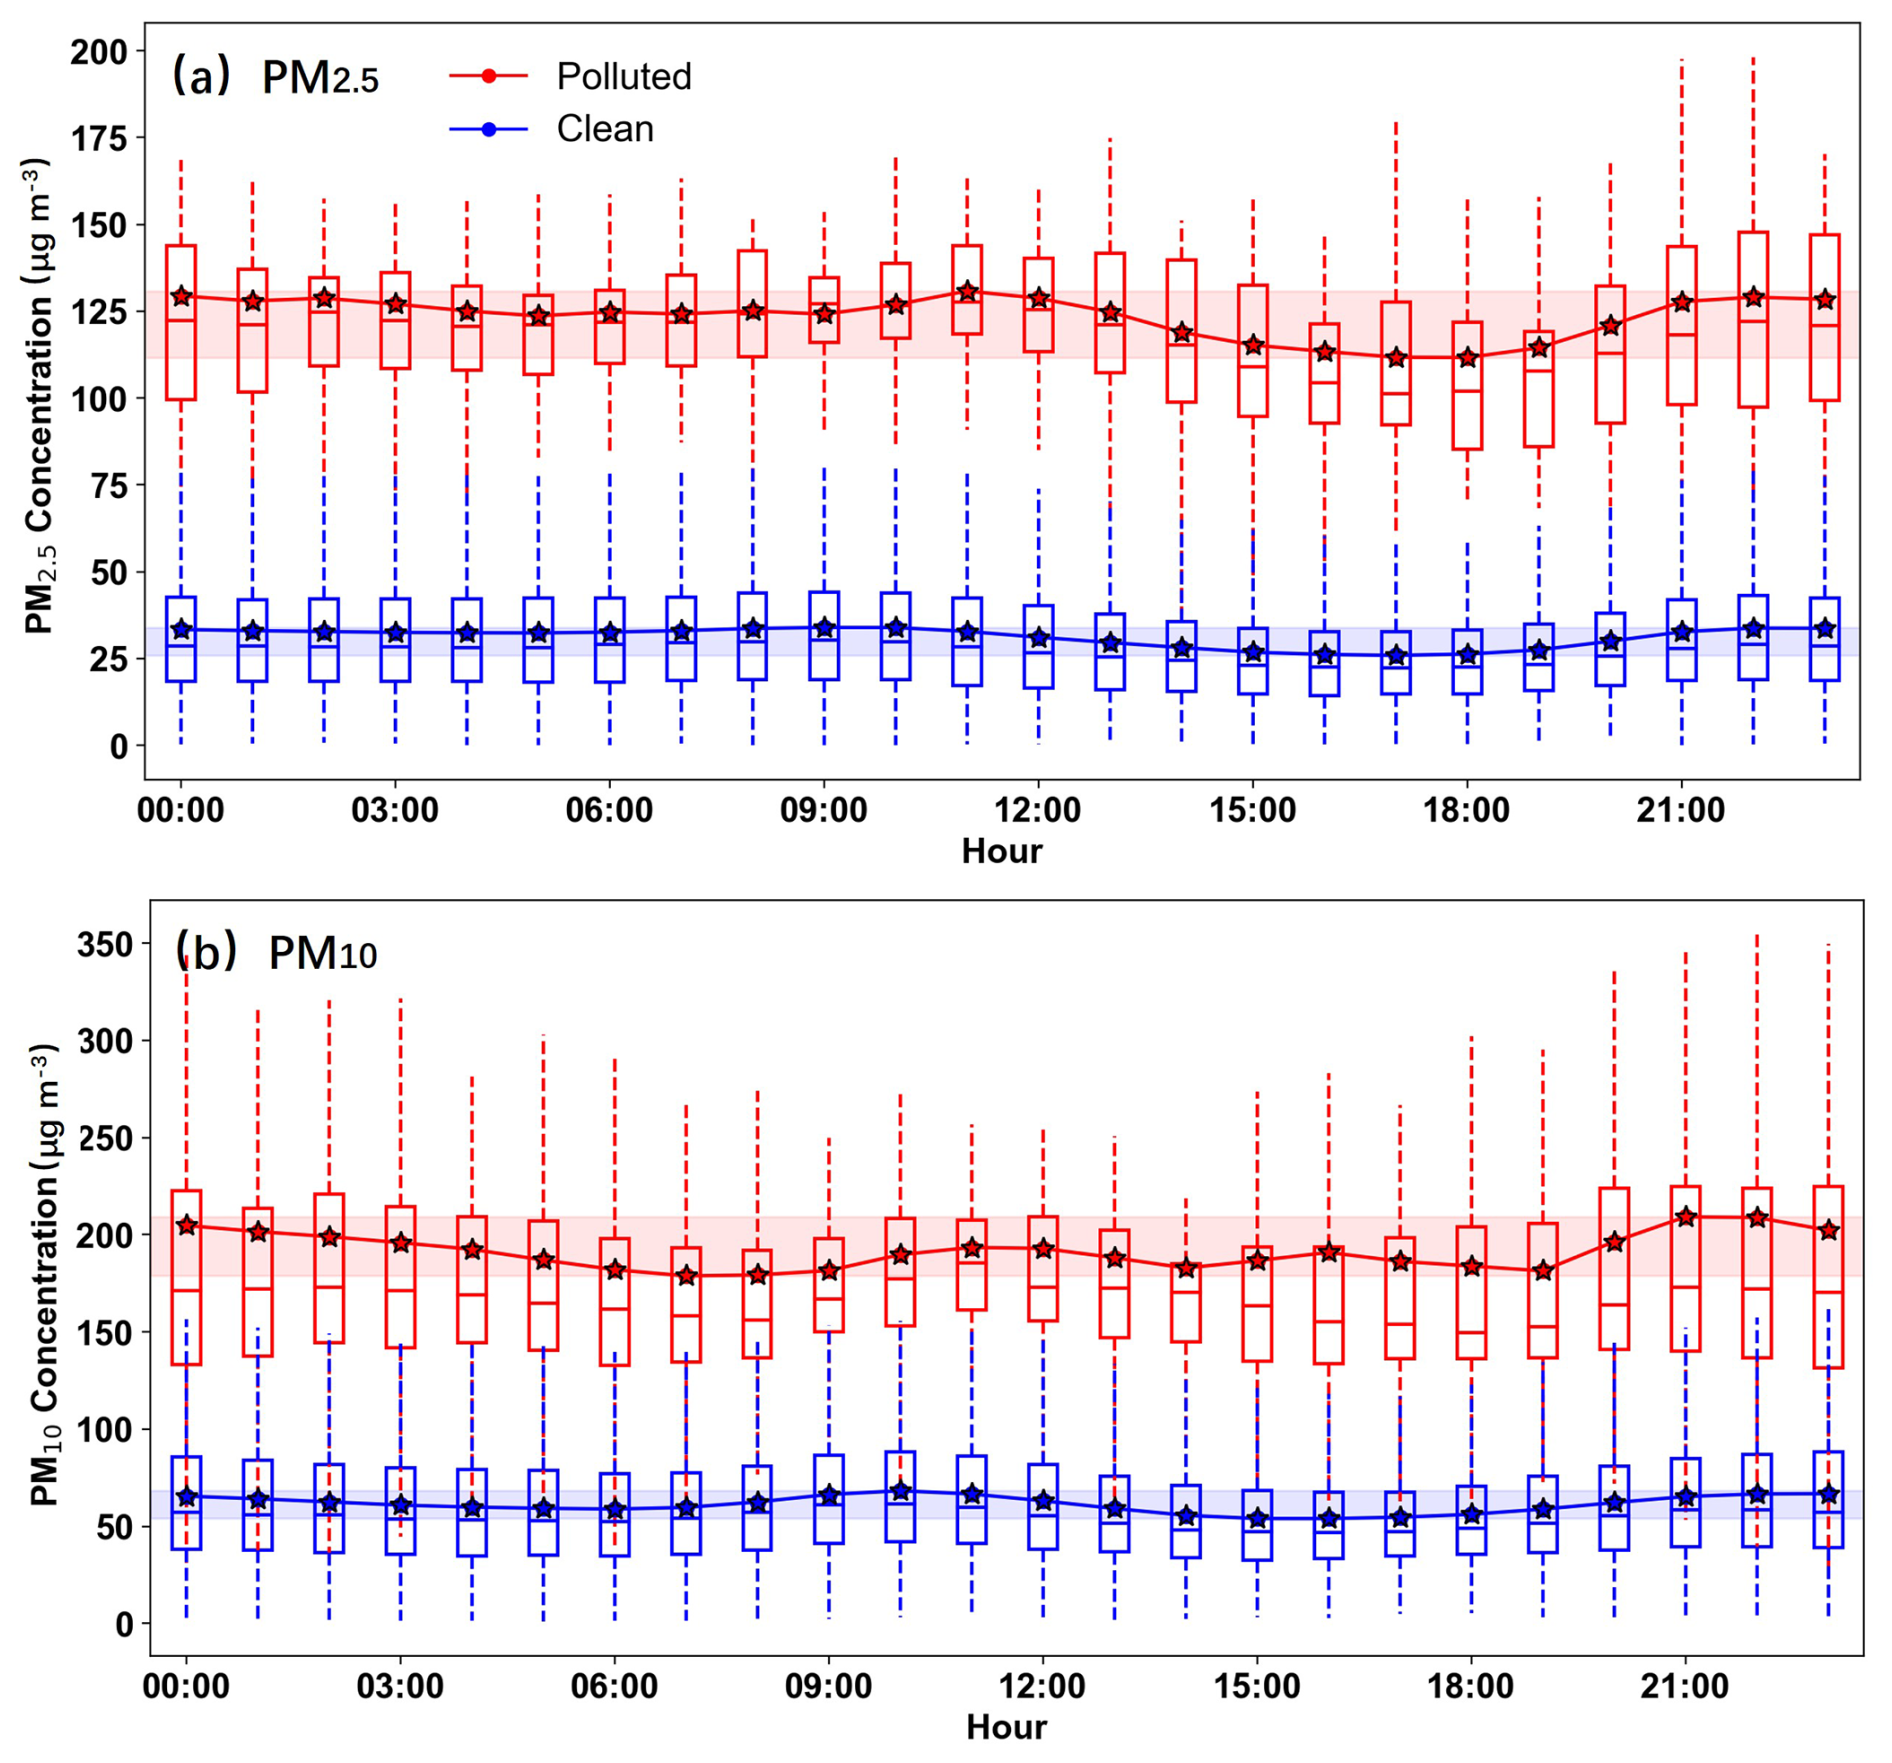
Figure 3Hourly mean (a) PM2.5 and (b) PM10 concentrations on polluted and clean days (Beijing time, BJT = UTC + 8 h). The blue and red shaded areas represent the ranges of mean concentration values for polluted and clean days, respectively. The whiskers and boxes represent the 95th, 75th, 50th, 25th, and 5th percentiles, respectively. The stars represent the mean values of the pollutant concentrations. The solid lines connect the hourly mean values to show the diurnal variation trends.
3.2 Temporal variation of vertical distribution structure
In addition to the impacts exerted by surface-level pollution, the investigation of vertical distribution is also of paramount significance for a comprehensive understanding of air quality dynamics. The extinction coefficient at 532 nm shows seasonal and vertical variation. Vertically, extinction coefficients were highest near the surface and gradually decreased with altitude in all seasons. This vertical decline arises from rapid reductions in aerosol loading due to vertical mixing, gravitational sedimentation, and dilution with increasing height, as well as the dominance of weaker molecular scattering above the planetary boundary layer (Wang et al., 2021). Winter presented the highest extinction values among the four seasons (Fig. 4a) (Chen et al., 2023; Wang et al., 2024). This was likely related to enhanced emissions from domestic heating and stagnant meteorological conditions that restrict vertical mixing (Zhong et al., 2018). In contrast, summer exhibited the lowest extinction coefficients at 532 nm across the profile, suggesting the effective dispersion of aerosols due to strong convection and a high planetary boundary layer (Li et al., 2015). Spring and autumn showed intermediate levels. The most significant differences between seasons appeared below 1 km, especially in the 0.2–0.6 km range (Zhong et al., 2018). Above 1.0 km, the extinction values in all seasons converged toward high altitude, indicating a reduced aerosol presence in the upper layer (Liu et al., 2024).
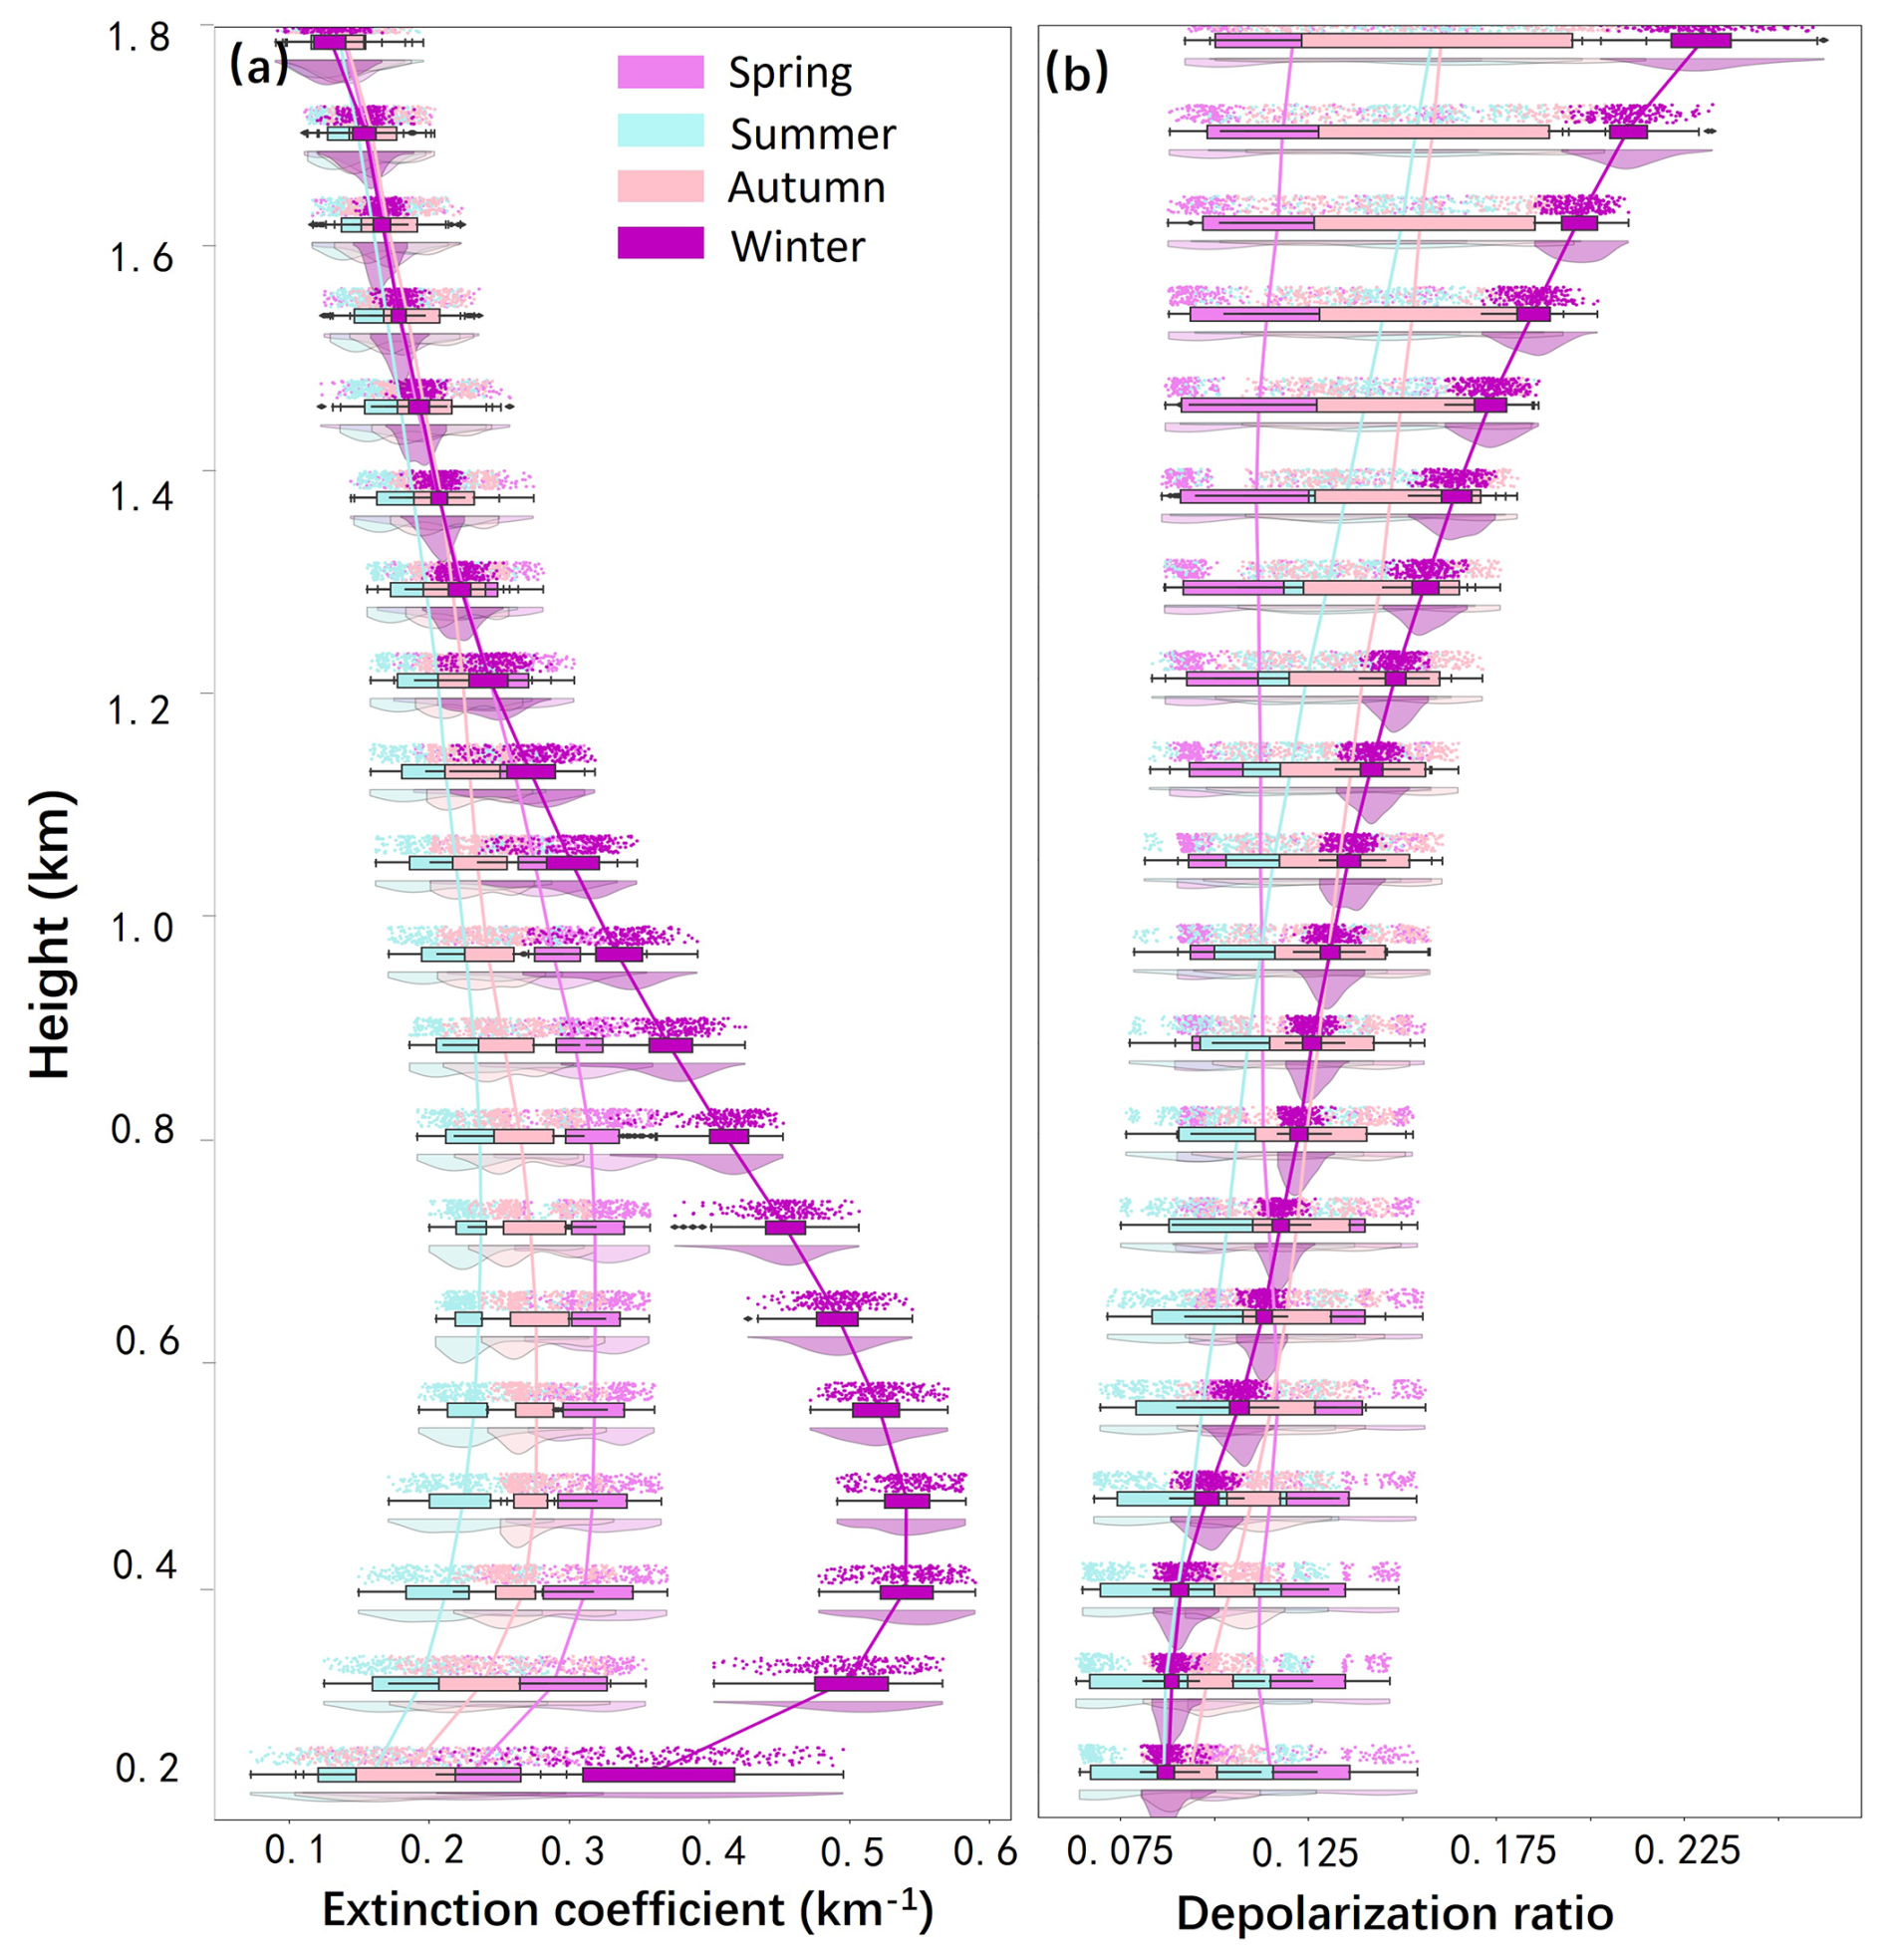
Figure 4Seasonal variation of vertical aerosol (a) extinction coefficient and (b) depolarization profiles at 532 nm from LiDAR measurements. The whiskers represent the 90th and 10th percentiles, respectively. The shaded areas represent the 25th–75th percentiles. The connected lines depict the trend of mean values across different heights.
The depolarization ratio also exhibited seasonal differences (Fig. 4b). With increasing altitude, the contribution of non-spherical particles increases, leading to a steady rise in depolarization ratio. This is attributed to the fact that non-spherical particles exhibit stronger anisotropic light scattering than nearly spherical fine-mode aerosols that dominate near the surface (Wang et al., 2020b). In the lower layer below 0.6 km, spring showed the highest depolarization ratios, which were attributed to a greater proportion of non-spherical particles such as mineral dust or internally mixed soot (Biuki et al., 2022). This may result from springtime dust resuspension and aged industrial emissions. In contrast, summer had the lowest depolarization ratios, implying that aerosols were dominated by more spherical particles, such as those formed through secondary processes (e.g., sulfate or organic aerosols) (Sun et al., 2013). In autumn and winter, values were moderate and stayed between the two extremes. However, the seasonal pattern changed above 0.6 km. Winter showed the highest depolarization ratio, while spring became the lowest. The vertical profile revealed that the change in particle shape with height strongly depends on seasons (Wang et al., 2004). In winter, the low ambient temperatures in the upper atmosphere promote the formation of non-spherical particles (e.g., ice crystals and irregular aerosols), which substantially enhance the depolarization ratio due to their anisotropic light-scattering properties (Haarig et al., 2017; Wang et al., 2021; Yu et al., 2021). In addition, elevated aerosol layers were dominated by long-range transported dust with pronounced nonspherical properties. However, aerosols in the upper layer were more spherical and less influenced by dust in spring (Wang et al., 2020b).
The extinction coefficient is significantly higher on PM2.5-polluted days than on PM10 polluted days. This is attributed to the optimal size match between fine-mode particles (≤ 2.5 µm) and visible light (0.4–0.7 µm), as well as their chemical components, which are more efficient at scattering and absorbing light (Wang et al., 2021; Chen et al., 2023). The extinction coefficients at 532 nm exhibited clear differences between polluted and clean days for both PM2.5 and PM10, with strong vertical and diurnal variation (Fig. 5). For PM2.5, polluted days were characterized by significantly higher extinction values below 0.9 km, especially during the nighttime and the period from early morning to near noon (Wang et al., 2024). This enhancement was mainly attributed to the stable boundary layer and limited vertical mixing during the night, which favored the accumulation of aerosols near the surface. Strong solar radiation enhances photochemical reactions, leading to substantial secondary aerosol formation at noon and a lift in altitude (Fig. 5a). However, extinction values near the surface (below 0.4 km) were relatively low during 12:00–15:00 (BJT), with high values concentrated mainly around 0.6 km. This midday vertical uplift of the aerosol layer corresponds to the decrease in near-surface PM2.5 shown in Fig. 3, as enhanced convective mixing lifts fine particles upward and weakens near-surface extinction. Hence, strong daytime turbulence promotes the vertical transport of aerosols, resulting in an elevated and vertically expanded aerosol layer (Fig. 5a) (Wang et al., 2024). During this period (12:00–15:00 BJT), the enhanced extinction was concentrated around 0.6 km, extending vertically from the surface to this altitude, rather than peaking near the ground. The upward expansion of aerosols was driven by boundary layer development and persistent emission sources (Dai et al., 2020). In contrast, clean days showed low extinction values throughout the day, with little vertical variation and no significant peak. For PM10, extinction coefficients at 532 nm were also increased on polluted days (Fig. 5b). However, the enhancement of extinction values extended to a higher altitude compared to that of PM2.5, reaching up to 1.2 km. The primary increase occurred during the night and early morning, with a minor secondary rise observed around midday (Li et al., 2020). Clean-day extinction remained uniformly low with minimal temporal variation (Fig. 5d).
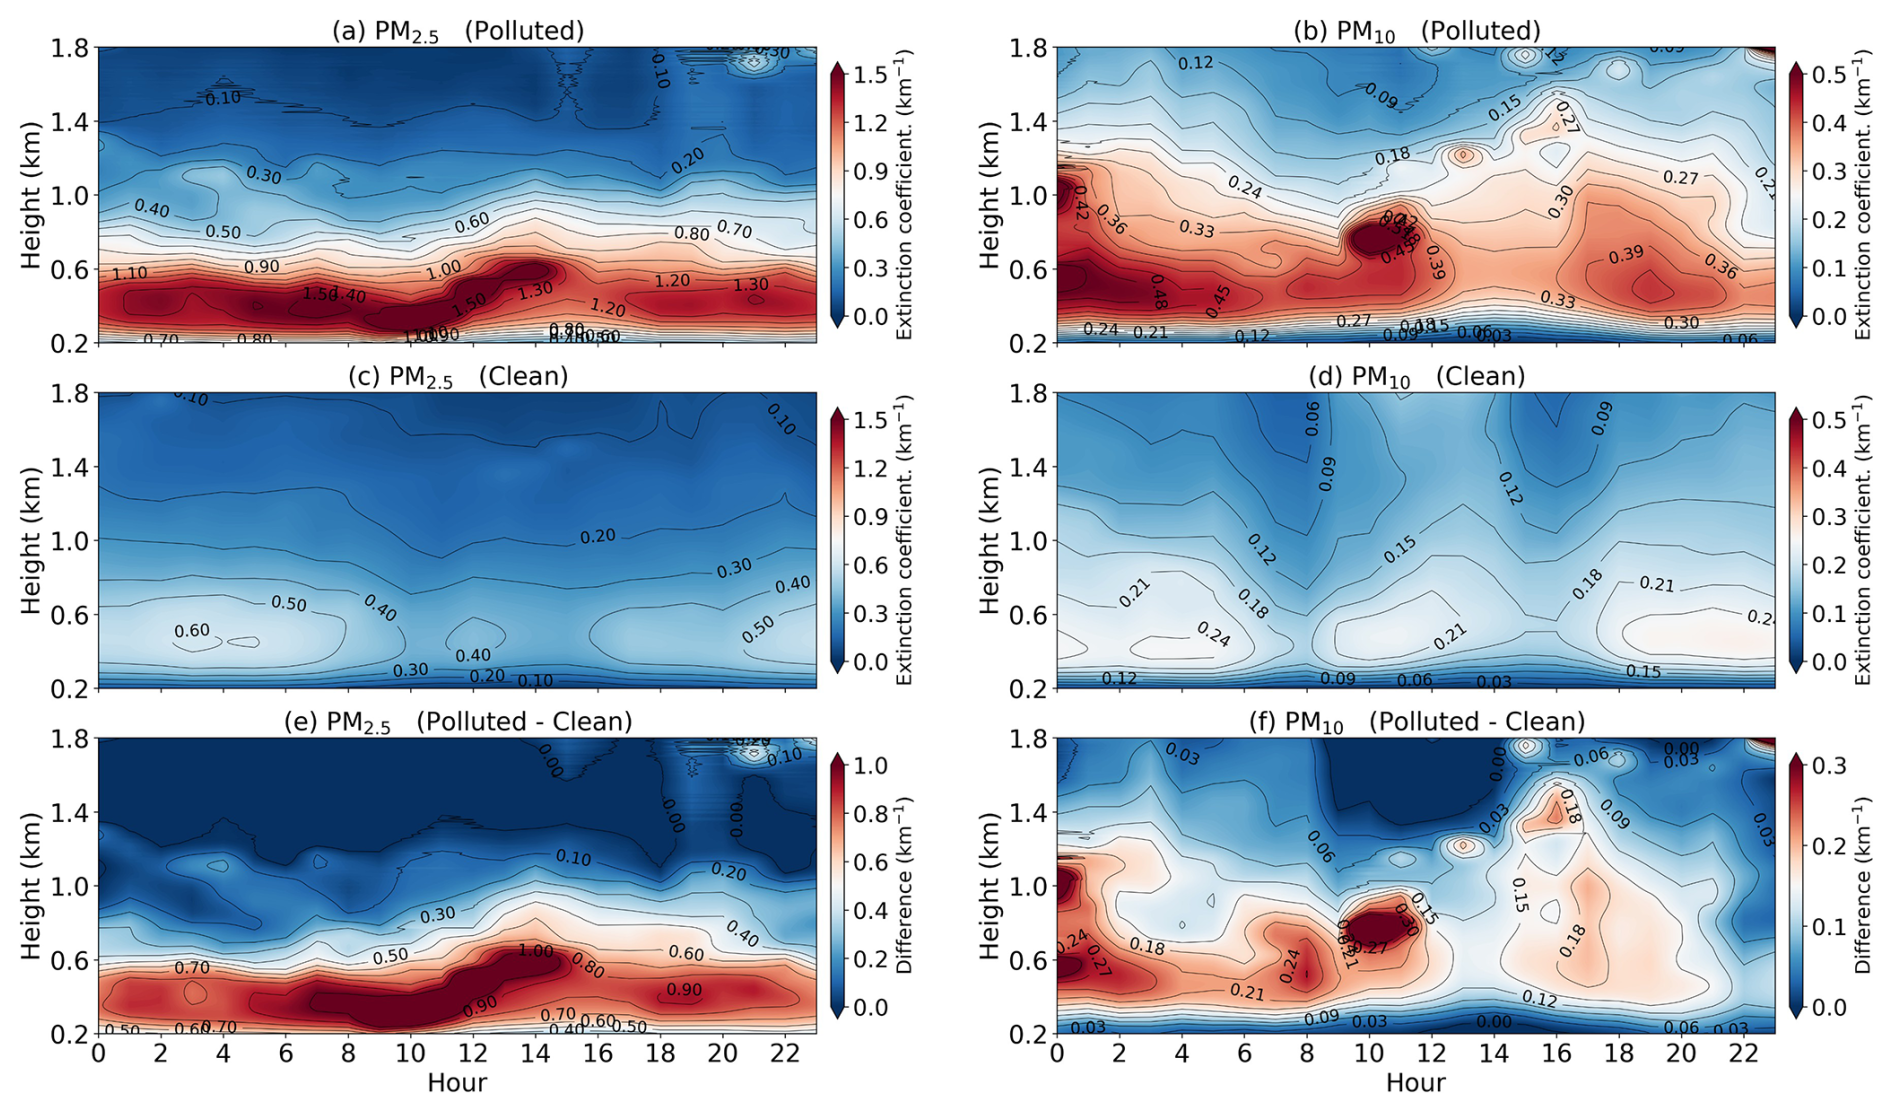
Figure 5Diurnal variation in the vertical distribution of aerosol extinction coefficient (Winter days for PM2.5: First column; Spring days for PM10: Second column) under days with (a, b) polluted, (c, d) clean, and (e, f) the difference between the two. All data are presented in Beijing time (BJT = UTC + 8 h) for the 532 nm channel.
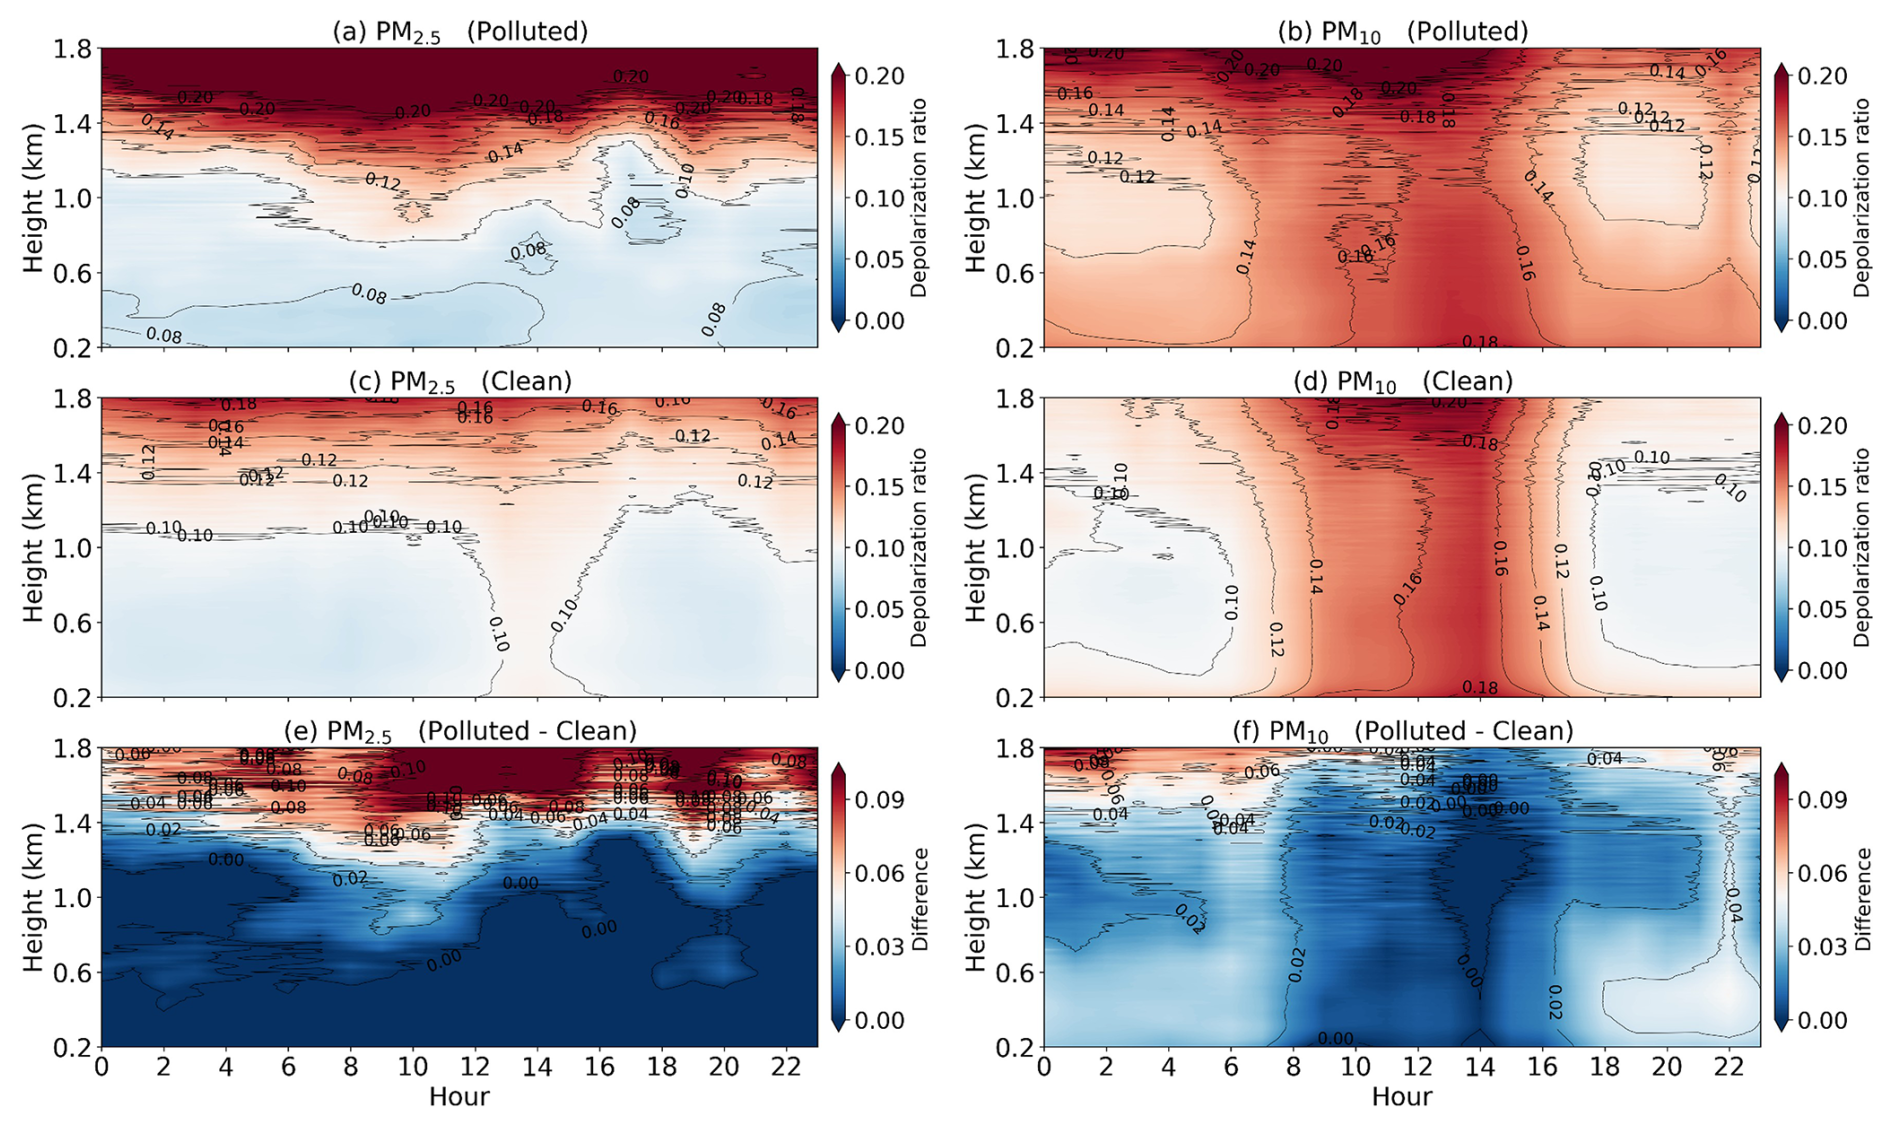
For the depolarization ratio, distinct patterns also emerged between polluted and clean days for both PM2.5 and PM10 (Fig. 6). For PM2.5, depolarization ratios near the surface (below ∼ 0.6 km) were relatively low on polluted days, particularly during nighttime and early morning (Fig. 6a). This can be attributed to the accumulation of fine, spherical particles in the stable boundary layer, which tend to have lower depolarization ratios. As altitude increased, depolarization ratios rose. This indicates the presence of more irregularly shaped or coarser particles aloft, possibly from transported dust or aged aerosols. In contrast, clean days showed uniformly low depolarization ratios across most heights, consistent with the dominance of fine, spherical aerosols under favorable dispersion conditions (Fig. 6c). For PM10, depolarization ratios at 532 nm on polluted days exhibited a different behavior (Fig. 6b). Starting around 08:00 (BJT), elevated depolarization values were observed across a broad vertical layer, extending up to ∼ 1.2 km throughout the day. This suggests that coarser particles, which typically have higher depolarization ratios, were more effectively mixed vertically and persisted at higher altitudes compared to PM2.5. The broader vertical distribution of PM10 depolarization signals reflects the larger size and potentially different sources (e.g., resuspended dust, industrial emissions) of these particles, which are less confined by boundary layer dynamics than finer PM2.5. The increased depolarization ratio at noon during PM10-polluted days is attributed to midday boundary layer growth and frontal dust transport, elevating non-spherical coarse particle concentrations.
The difference between polluted and clean days highlighted a strong increase in near-surface extinction during early morning on polluted days, indicating suppressed vertical mixing and increased emission accumulation (Fig. 5e and f). For PM2.5, the differences were concentrated near the ground, especially below 0.9 km. The strongest enhancement appeared between 07:00 and 14:00 (BJT). A subtle lifting with height was observed around midday. Noon solar radiation maximizes surface heating, which causes severe thermal convection. The lower atmosphere becomes unstable as a result of the hot Earth transferring energy upward. It could break the stable stratification and drive upward air motion. Pollutants trapped near the surface are lifted, reducing extinction in the lower layer (< 0.4 km) while increasing it aloft as vertical mixing intensifies (Wang et al., 2024). For PM10, the enhancement tended to be localized and less vertically extended. The coarse particles may be lifted in upstream source regions, but their vertical transport weakens significantly along the trajectory. As a result, the transport altitude of PM10 reaching Hefei was largely confined below 1.2 km (Shim et al., 2022). Compared to PM2.5, the high-value region for PM10 on polluted days has a higher vertical extension, and the period of strong extinction is shorter. The particles of PM10 are relatively large and heavy, which leads to rapid sedimentation and thus a short duration of heavy pollution. Pollutants tend to accumulate in the middle and low altitudes (0.4–1.2 km) on polluted days.
To further analyze the vertical aerosol properties under different pollution levels, the mean extinction coefficient and depolarization ratio at 532 nm were calculated across three representative conditions (Fig. 7). Unlike the temporal variation that emphasized vertical profile distributions (Figs. 5 and 6), these curves highlight altitude-related trends (e.g., gradual changes, peak positions, and inflection points) for the comparison between polluted, clean, and difference conditions. For PM2.5, the extinction coefficient decreased exponentially with height and intensified sharply below 0.4 km on polluted days (Fig. 7a) (Wang et al., 2020a). The near-surface value reached up to 1.4 km−1 at 0.4 km, which was nearly 3 times higher than that on clean days. The difference was most significant within the boundary layer, especially between 0.3–0.6 km. For PM10 (Fig. 7b), although the overall extinction values were lower than those of PM2.5, the difference between polluted and clean days remained obvious. The polluted-clean difference for PM10 was more confined below 1.2 km. This discrepancy may be attributed to that the coarse-mode particles tend to concentrate closer to the surface due to their limited vertical transport.
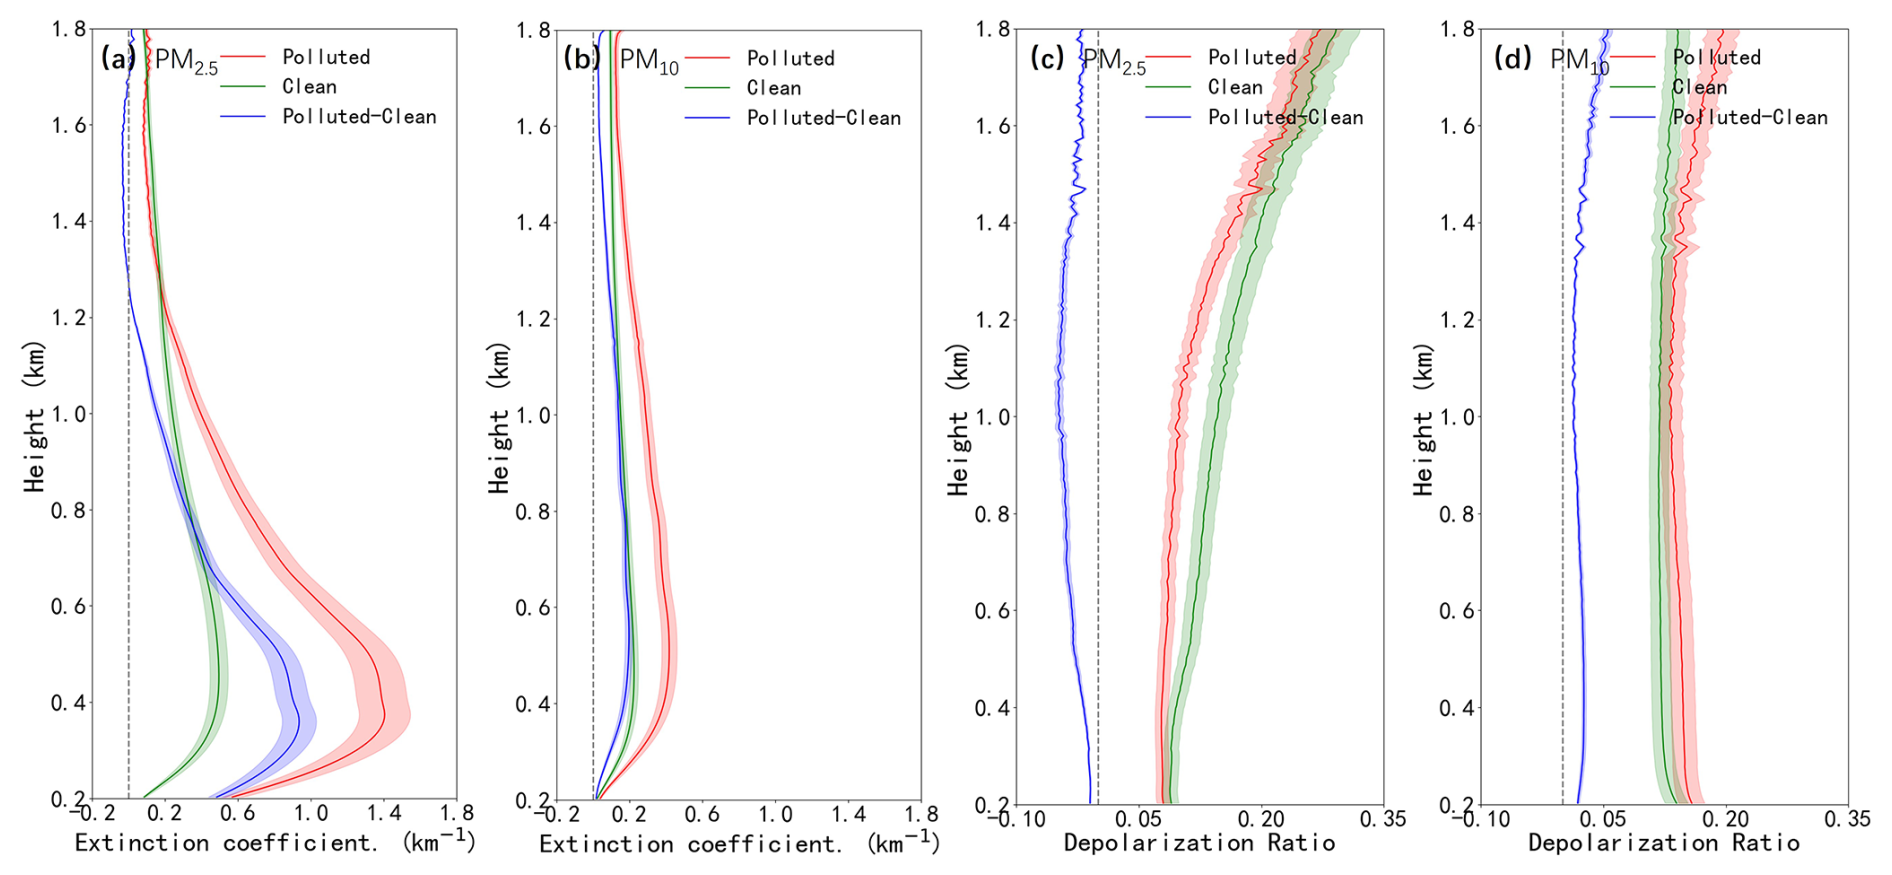
Figure 7Vertical profiles of aerosol (a, b) extinction coefficient and (c, d) depolarization ratio at 532 nm for (a, c) PM2.5 in winter and (b, d) PM10 in spring on polluted, clean days, and the difference between the two. The gray dashed line represents the zero line. Note: The extinction coefficient and depolarization ratio of individual polluted and clean days are positive physical quantities. Negative values in the “Polluted-Clean” panels indicate that the aerosol optical parameters (extinction coefficient or depolarization ratio) are higher on clean days than on polluted days. All data are presented in Beijing time (BJT = UTC + 8 h) for the 532 nm channel.
The vertical distributions of the depolarization ratio under different pollution levels are presented in Fig. 7c and d for PM2.5 and PM10, respectively. For PM2.5, the depolarization ratio on clean days was higher than that on polluted days across the entire vertical column up to 1.8 km (Fig. 7c). The depolarization ratio of PM2.5 increases with height. The most significant difference in depolarization ratios between polluted and clean days was observed around 1 km. Above this height, the difference narrowed but clean days still showed slightly higher values. Unlike near-surface PM2.5, which is dominated by local pollution sources, PM2.5 at higher altitudes is mainly associated with long-range transport in the free troposphere, leading to higher depolarization ratios. Higher altitudes have more PM2.5 particles from long-range transport in the free troposphere, which possess higher depolarization ratios (Vakkari et al., 2021; Wang et al., 2021). Even at higher altitudes, the residual influence of cleaner, non-spherical particle sources in the background air kept the clean-day depolarization ratio higher (Li et al., 2020). For PM10, the depolarization ratio of polluted days was higher than that of clean days across the entire vertical range (Fig. 7d), reflecting a greater abundance of coarse-mode and irregularly shaped particles on polluted days. Below 1.2 km, the depolarization ratio of PM10 was distinctly higher than that of PM2.5 on polluted days. This difference emphasized the dominant influence of coarse, non-spherical particles (e.g., dust and mechanically suspended material) in the PM10 fraction, particularly near the surface (Shim et al., 2022). On PM10-polluted days in autumn, the depolarization ratio increased with height, which is mainly also affected by the long-distance transport of dust in the free troposphere.
Figure 8 presents the 3-hourly variation of extinction coefficient and depolarization ratio at 532 nm on polluted and clean days across three altitude layers (0–0.5, 0.5–1, and 1–1.8 km). Below 0.5 km, the extinction coefficients were markedly higher on polluted days for PM2.5 than that on clean days, with peak values occurring at 03:00–12:00 (BJT) (Fig. 8a), which was consistent with the variation in surface pollutant concentrations (Fig. 3). The depolarization ratio for PM2.5 was lower on polluted days in contrast with clean days. This is due to the dominance of spherical fine particles (e.g., sulfates, organic aerosols) from anthropogenic and secondary sources (Fig. 8a and c). These particles scatter light less directionally compared to the irregular coarse particles (e.g., dust) prevalent on clean days. In contrast, both the extinction coefficient and depolarization ratio for PM10 were high on polluted days (Zhang et al., 2020a). At the layer between 0.5 and 1 km, the extinction coefficient for PM2.5 showed a significant peak around 12:00 to 15:00 (BJT) on polluted days, which was consistent with the upward transport of pollutants to around 0.6 km during the same period as shown in the diurnal vertical structure (Fig. 5). The extinction values decreased significantly and remained at low levels above 1 km (Fig. 8e). However, the depolarization ratio remained relatively high during polluted periods. The depolarization ratio in winter was higher than that of spring, mainly because PM2.5 pollution contains a higher proportion of irregular particles from coal-fired fly ash and industrial emissions (Fig. 8f). The low temperatures inhibit the diffusion and settlement of coarse particles. In contrast, days in spring for PM10 pollution were more affected by coarse particles such as windblown dust. Although these particles are irregular in shape, their large particle size makes them prone to settling. Moreover, the strong atmospheric fluidity in spring led to a slightly lower depolarization ratio compared to winter. Overall, the greatest contrast between polluted and clean days was observed in the lowest layer, where both particle concentration and shape varied most distinctly with pollution level and time of day (Zhong et al., 2018).
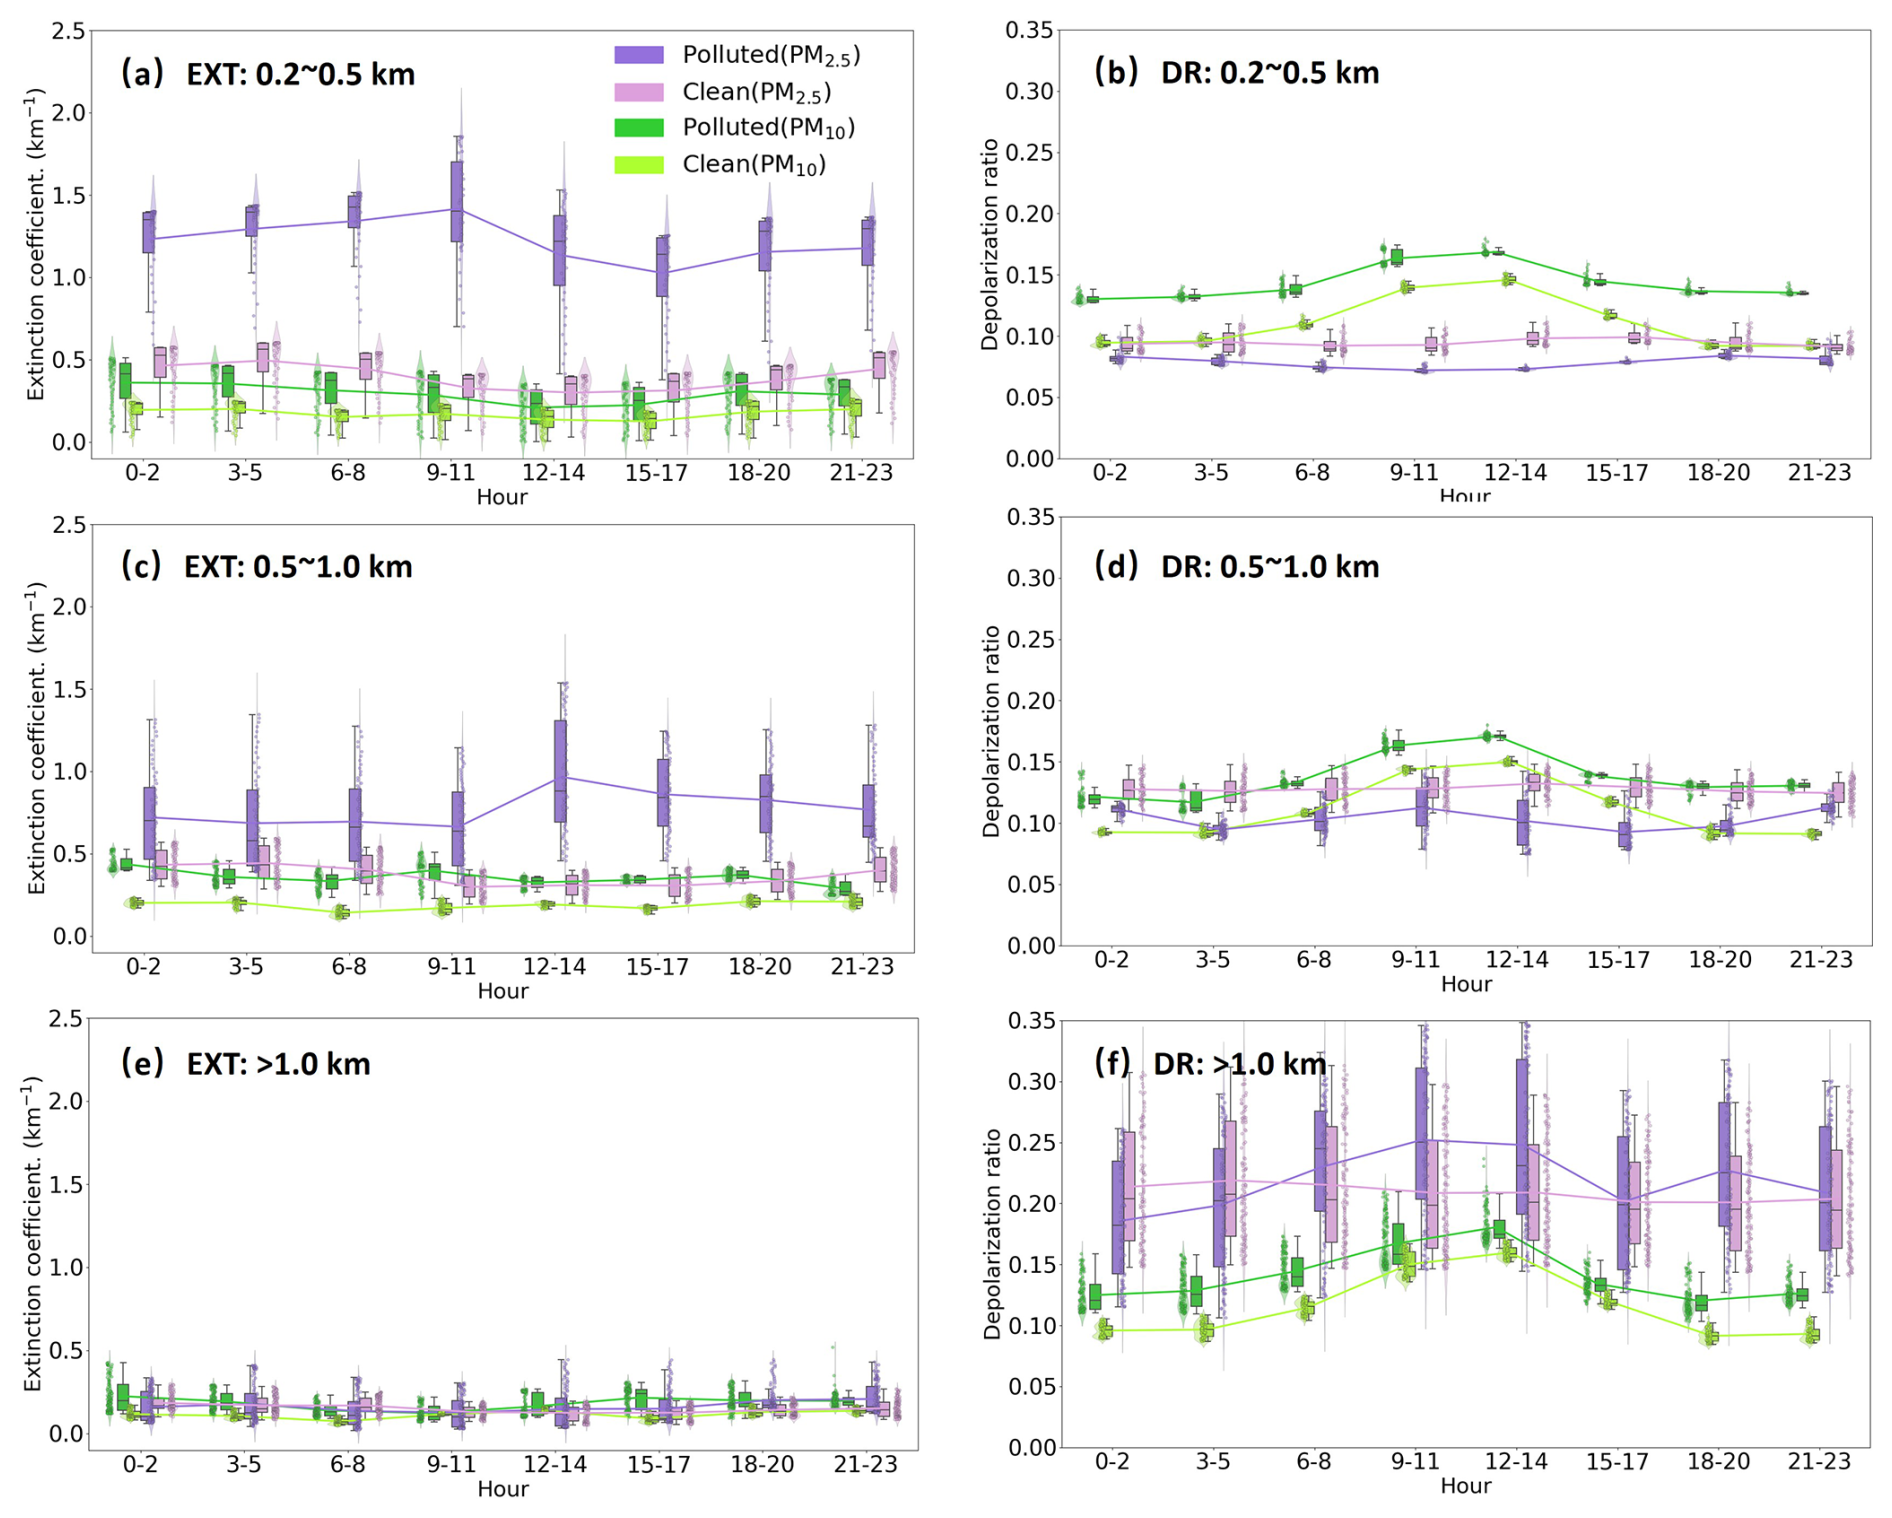
Figure 8Diurnal variations of (EXT: a, c, and e) extinction coefficient and (DR: b, d, and f) depolarization ratio at 532 nm on polluted and clean days for PM2.5 and PM10 at (a, b) 0.2–0.5 km, (c, d) 0.5–1.0 km, and (e, f) above 1.0 km, respectively. The whiskers represent the 90th and 10th percentiles, respectively. The shaded areas represent the 25th–75th percentiles. The connected lines depict the trend of mean values across different heights. All data are presented in Beijing time (BJT = UTC + 8 h) for the 532 nm channel.
3.3 Role of aerosol extinction coefficient and depolarization ratio at different altitudes on ground-based PM2.5 and PM10 concentrations
Figure 9 shows the vertical profiles of the relationships between surface pollutant concentrations and aerosol optical properties (extinction coefficient and depolarization ratio at 532 nm) on polluted and clean days. For PM2.5, the extinction coefficients showed a clear positive correlation with surface PM2.5 concentration throughout the profile below 0.9 km on polluted days, marking a key boundary for vertical variation in particle composition (Fig. 9a). The values on polluted days increase sharply near the surface, suggesting a local accumulation. A negative correlation was observed between the depolarization ratio and PM2.5 concentration below 0.9 km on polluted days, as elevated PM2.5 levels corresponded to a higher fraction of fine, spherical particles with low depolarization (Zhang et al., 2020a). In contrast, clean days showed a consistently positive correlation between depolarization ratio and surface pollutants throughout the vertical profile.
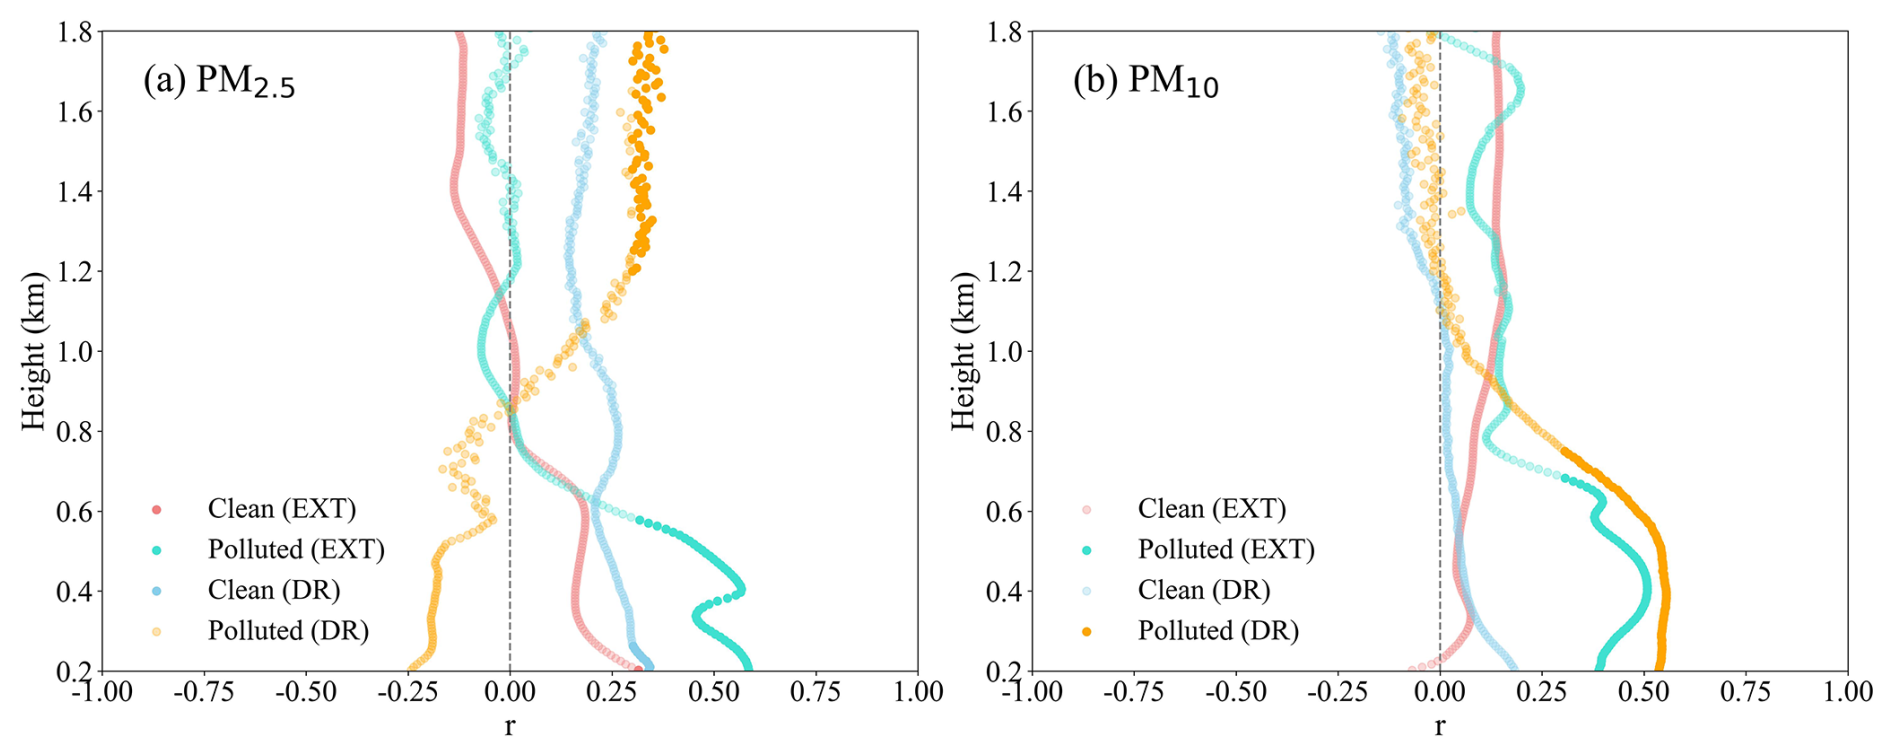
Figure 9Vertical distributions of correlation (r) between aerosol optical properties (532 nm) and ground-based pollutants (a: PM2.5 in winter, b: PM10 in spring) on clean and polluted days. EXT = extinction coefficient; DR = depolarization ratio. The gray dashed line represents the zero line.
The increased depolarization levels are linked to greater proportions of non-spherical particles, such as dust or mechanically suspended matter (Vakkari et al., 2021). The depolarization ratio showed consistently positive correlations with surface PM10 concentration on polluted days, especially below 1.2 km (Fig. 9b). On clean days, the correlation between the depolarization ratio and PM10 concentration remained near zero, reinforcing that the depolarization ratio is a distinguishing feature of coarse-mode aerosols. These results revealed the contrasting aerosol properties between PM2.5 and PM10 pollution. PM2.5 events were dominated by fine, spherical particles that reduce depolarization, while PM10 events were closely associated with the presence of coarse, non-spherical particles that enhanced depolarization signals (Biuki et al., 2022).
3.4 Analysis of LiDAR observations during heavy pollution episodes
Temporal variations of the extinction coefficient and depolarization ratio at 532 nm exhibited a clear association with PM2.5 and PM10 concentrations, effectively highlighting severe pollution periods (Fig. 10). Severe PM2.5 pollution was evident at 10:00 on 2 January 2023 (BJT), with the maximum hourly concentration reaching 159.6 µg m−3. The peak of the extinction coefficient matched the actual maximum concentration of PM2.5, with fine particulate matter exhibiting strong light-scattering properties at this time (Fig. 10a). However, the depolarization ratio of PM2.5-polluted days was markedly decreased during this peak period (Fig. 10c). Physically, the extinction coefficient scales with aerosol concentration and size, while the depolarization ratio is governed by particle morphology. Spherical fine particles such as hygroscopic sulfates and nitrates dominating this PM2.5 event, leading to increased extinction and decreased depolarization. A dramatic peak in PM10 concentration was observed, with the highest hourly value of 1440 µg m−3 recorded at 22:00 p.m. (BJT) on 11 April 2023. The severe PM10 event was reflected by a pronounced increase in the extinction coefficient (Fig. 10b) (Sun et al., 2013). In addition, the depolarization ratio exhibited high values during this period, which aligned with the elevated extinction coefficient and was consistent with the irregular morphology of coarse particles that contributed to both stronger light scattering and greater depolarization (Fig. 10d). Overall, the profiles of the extinction coefficient and depolarization ratio correspond directly to the temporal patterns of PM2.5 (1–8 January 2023) and PM10 (11–13 April 2023) concentrations (Fig. 10). Peaks in pollutant concentrations were reflected in enhanced extinction coefficients and characteristic depolarization ratio patterns (Zhong et al., 2018). This confirms that these optical metrics effectively identify severe pollution episodes.
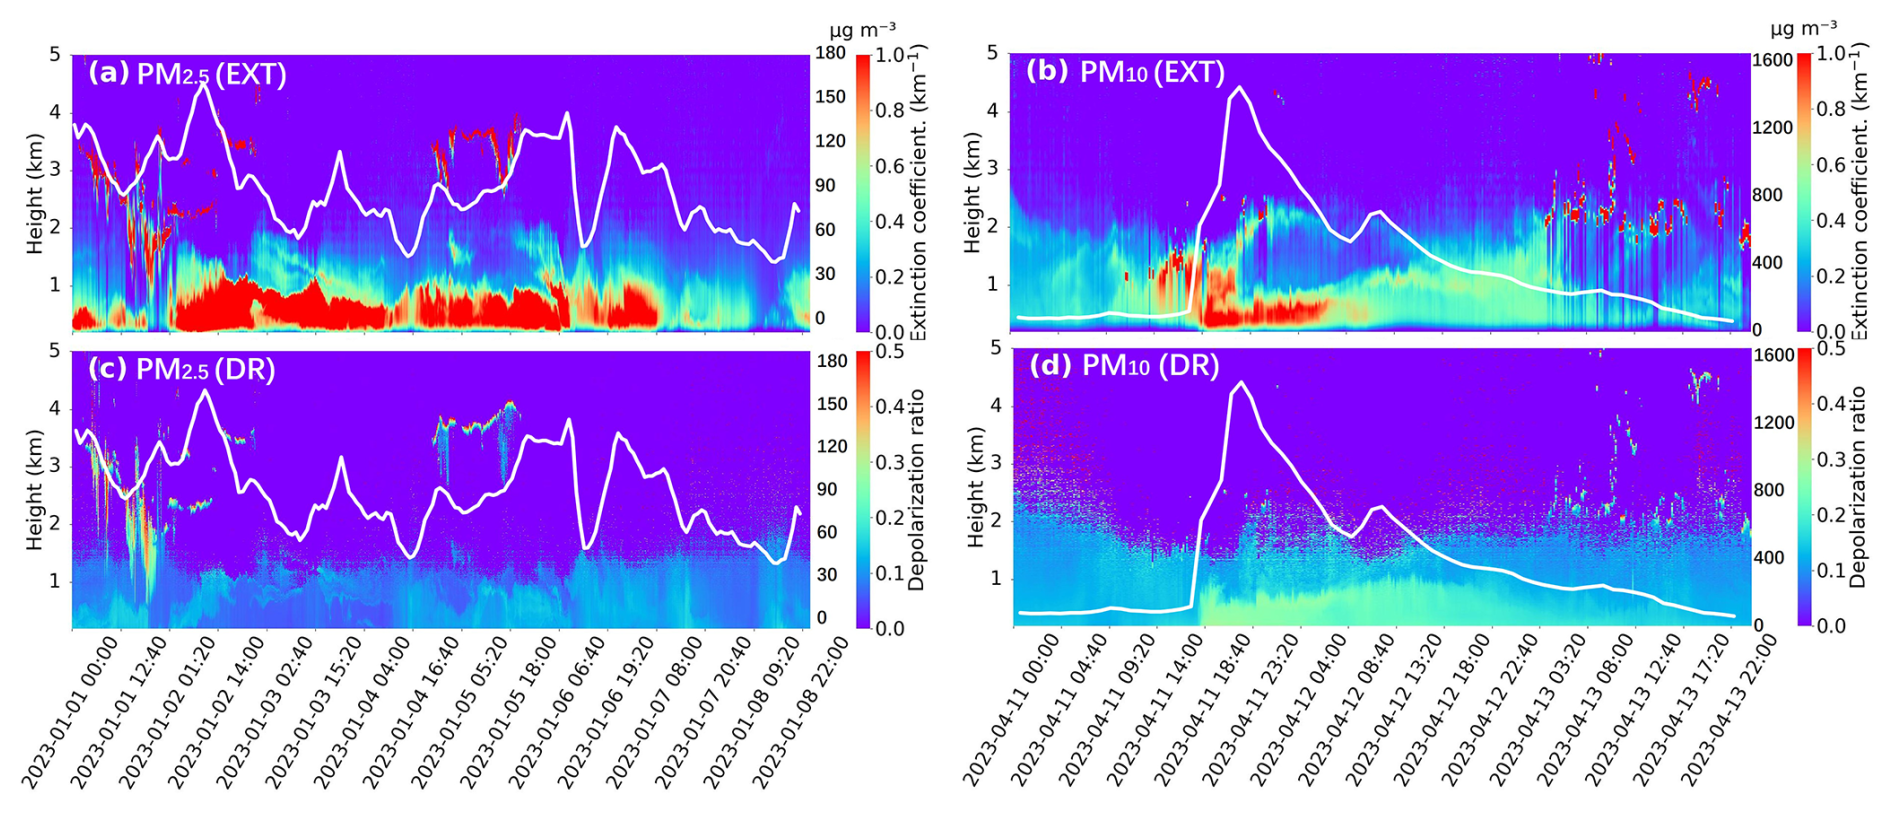
Figure 10Pollution Episodes: Temporal dynamics of (a, b) extinction and (c, d) depolarization parameters for the 532 nm channel during severe (a, c) PM2.5 (1–8 January 2023) and (b, d) PM10 (11–13 April 2023) periods in Hefei. The white lines represent the hourly (a) PM2.5 and (b) PM10 concentrations, with their scale on the secondary y-axis. All data are presented in Beijing time (BJT = UTC + 8 h). EXT = extinction coefficient; DR = depolarization ratio.
3.5 Analysis of meteorological conditions and their driving role in air pollution
Figure S1 in the Supplement shows boxplots of the concentrations of PM2.5 and PM10 in temperature (T), relative humidity (RH), surface pressure (PRS), and wind speed (WS) bins, respectively. Overall, the relationships of temperature with PM2.5, PM10 were not significant (Fig. S1a and e). The RH exerted distinct influences on PM10 and PM2.5 concentrations (Fig. S1b and f). Higher PM2.5 concentrations were associated with increased RH, primarily due to elevated humidity promoting the condensation of gaseous precursors (e.g., sulfur dioxide, nitrogen oxides) onto pre-existing PM2.5 particles (Fig. S1b) (Wang et al., 2004). Additionally, it accelerated secondary aerosol formation via aqueous-phase chemical reactions in the atmosphere, thereby elevating PM2.5 levels (Yang et al., 2022). In contrast to PM2.5, the relationship between PM10 concentrations and RH was inverse (Fig. S1f). Higher RH promotes moisture uptake and growth of coarse PM10 particles , accelerating their sedimentation and wet deposition, thereby reducing ambient concentrations (Gao et al., 2020; Ma et al., 2023). PRS tended to increase with rising concentrations of PM2.5 and PM10 (Fig. S1c and g). The average pressure values were lower on clean days (PM2.5 ≤ 75 µg m−3, PM10 ≤ 150 µg m−3) and became higher on polluted days. The high-pressure systems promote atmospheric stability and suppress vertical mixing, thereby facilitating the accumulation of particulate matter near the surface (Li et al., 2015). Wind speed exhibited a decreasing trend with increasing PM2.5 concentrations (Fig. S1d and h). Lower wind speeds during heavy pollution periods indicate weak horizontal dispersion, which contributes to the persistence and accumulation of fine particles in the boundary layer. In addition, the polar plot of PM2.5 concentrations shows a directional pattern, with the highest values predominantly associated with winds from the northwest (Fig. S2a). The cities of northern Anhui Province, Henan Province, and even further north were characterized by dense industrial activities and frequent wintertime heating emissions, which contribute to elevated PM2.5 levels (Qian et al., 2024a; Shi et al., 2018). For PM10, the concentration distribution was more spatially confined but still shows a dominant contribution from the northwest area (Huang et al., 2016). The most intense PM10 concentrations were clustered in the northwest, appearing localized and patchy (Fig. S2b).
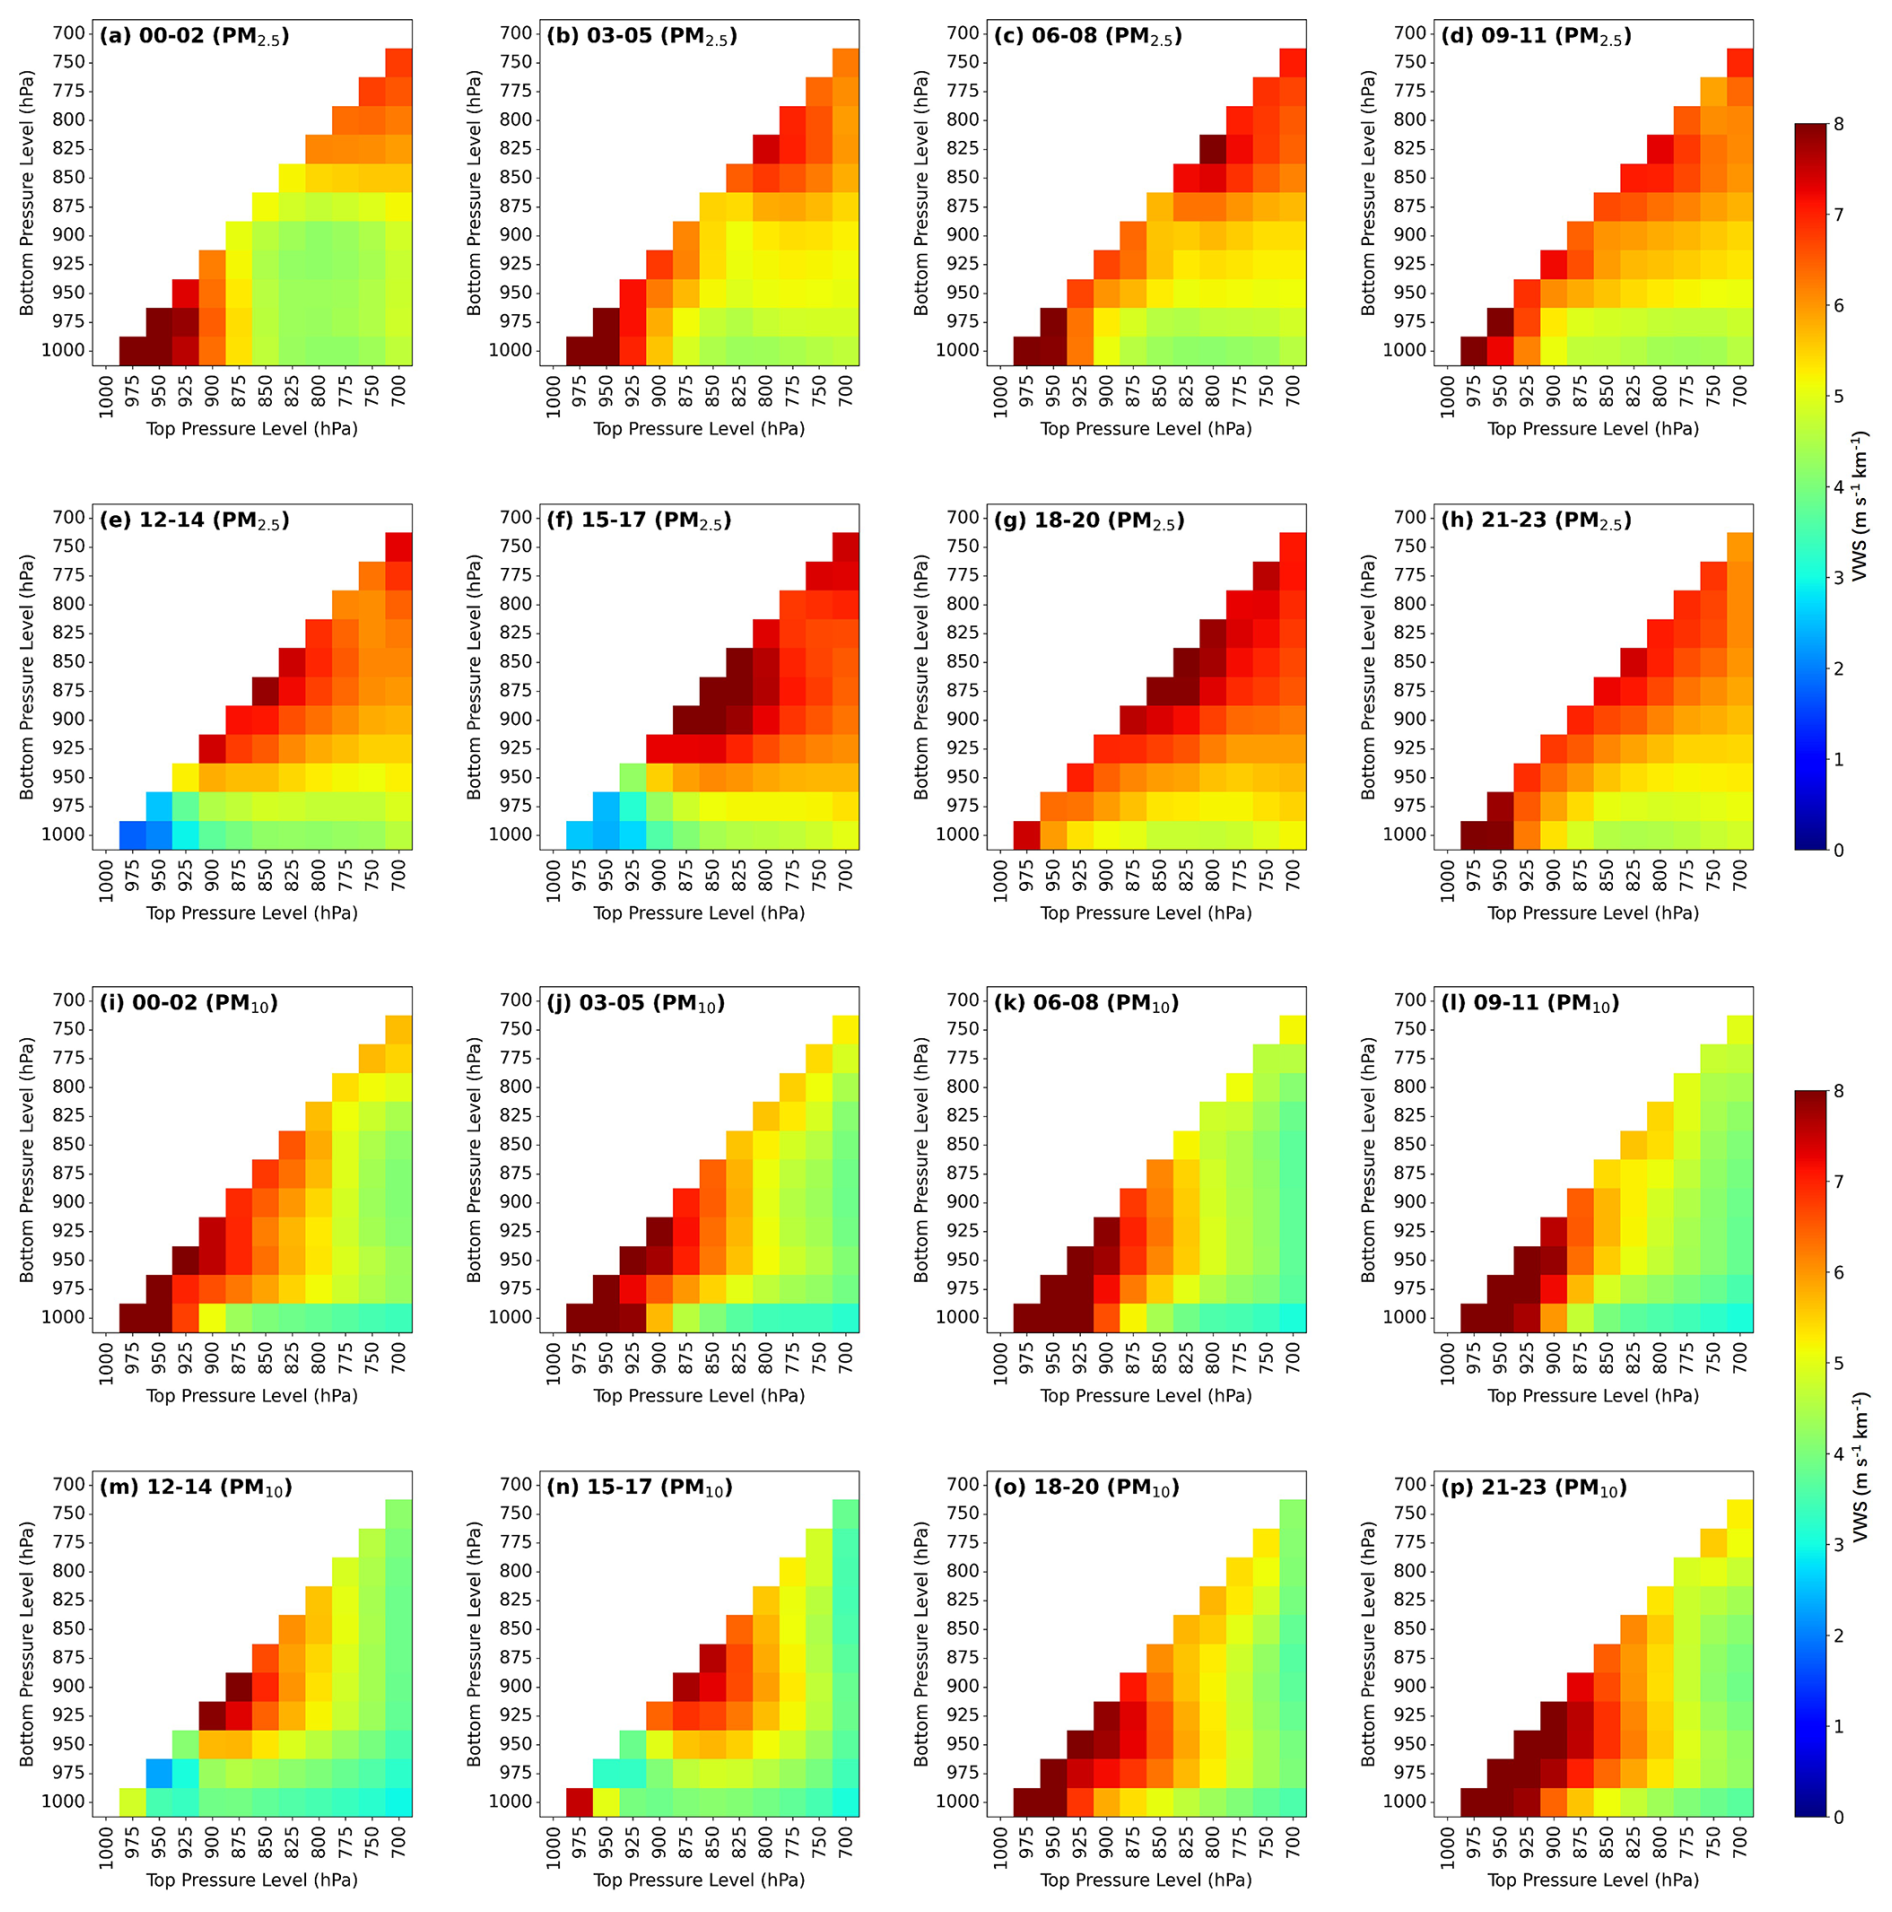
The vertical wind shear (VWS) is a key dynamic factor affecting pollutant dispersion, as it influences mechanical turbulence and vertical mixing within the boundary layer (Deng et al., 2023). Figures 11 and 12 illustrate the diurnal variation of VWS on polluted and clean days, respectively. For PM2.5, weak shear persisted throughout the boundary layer on polluted days when temperature inversions and stable stratification typically dominate the lower atmosphere (Fig. 11a–h). Clean days showed stronger shear during most periods, enhancing upward transport and dilution of fine particles (Fig. 12). Notably, the difference in VWS between polluted and clean days was more pronounced in the lower boundary layer (1000–900 hPa) than in the upper boundary layer (875–700 hPa) (Zhang et al., 2020b). Hence, suppressed vertical mixing near the surface contributed significantly to the accumulation of PM2.5. Surface air quality tends to deteriorate significantly due to pollutant accumulation near the ground, especially in cases where shear is insufficient in the lower layer (Wang et al., 2024), which was consistent with the trend that the extinction coefficient at 532 nm near the surface is higher than that in the upper layer (Figs. 7 and 8).
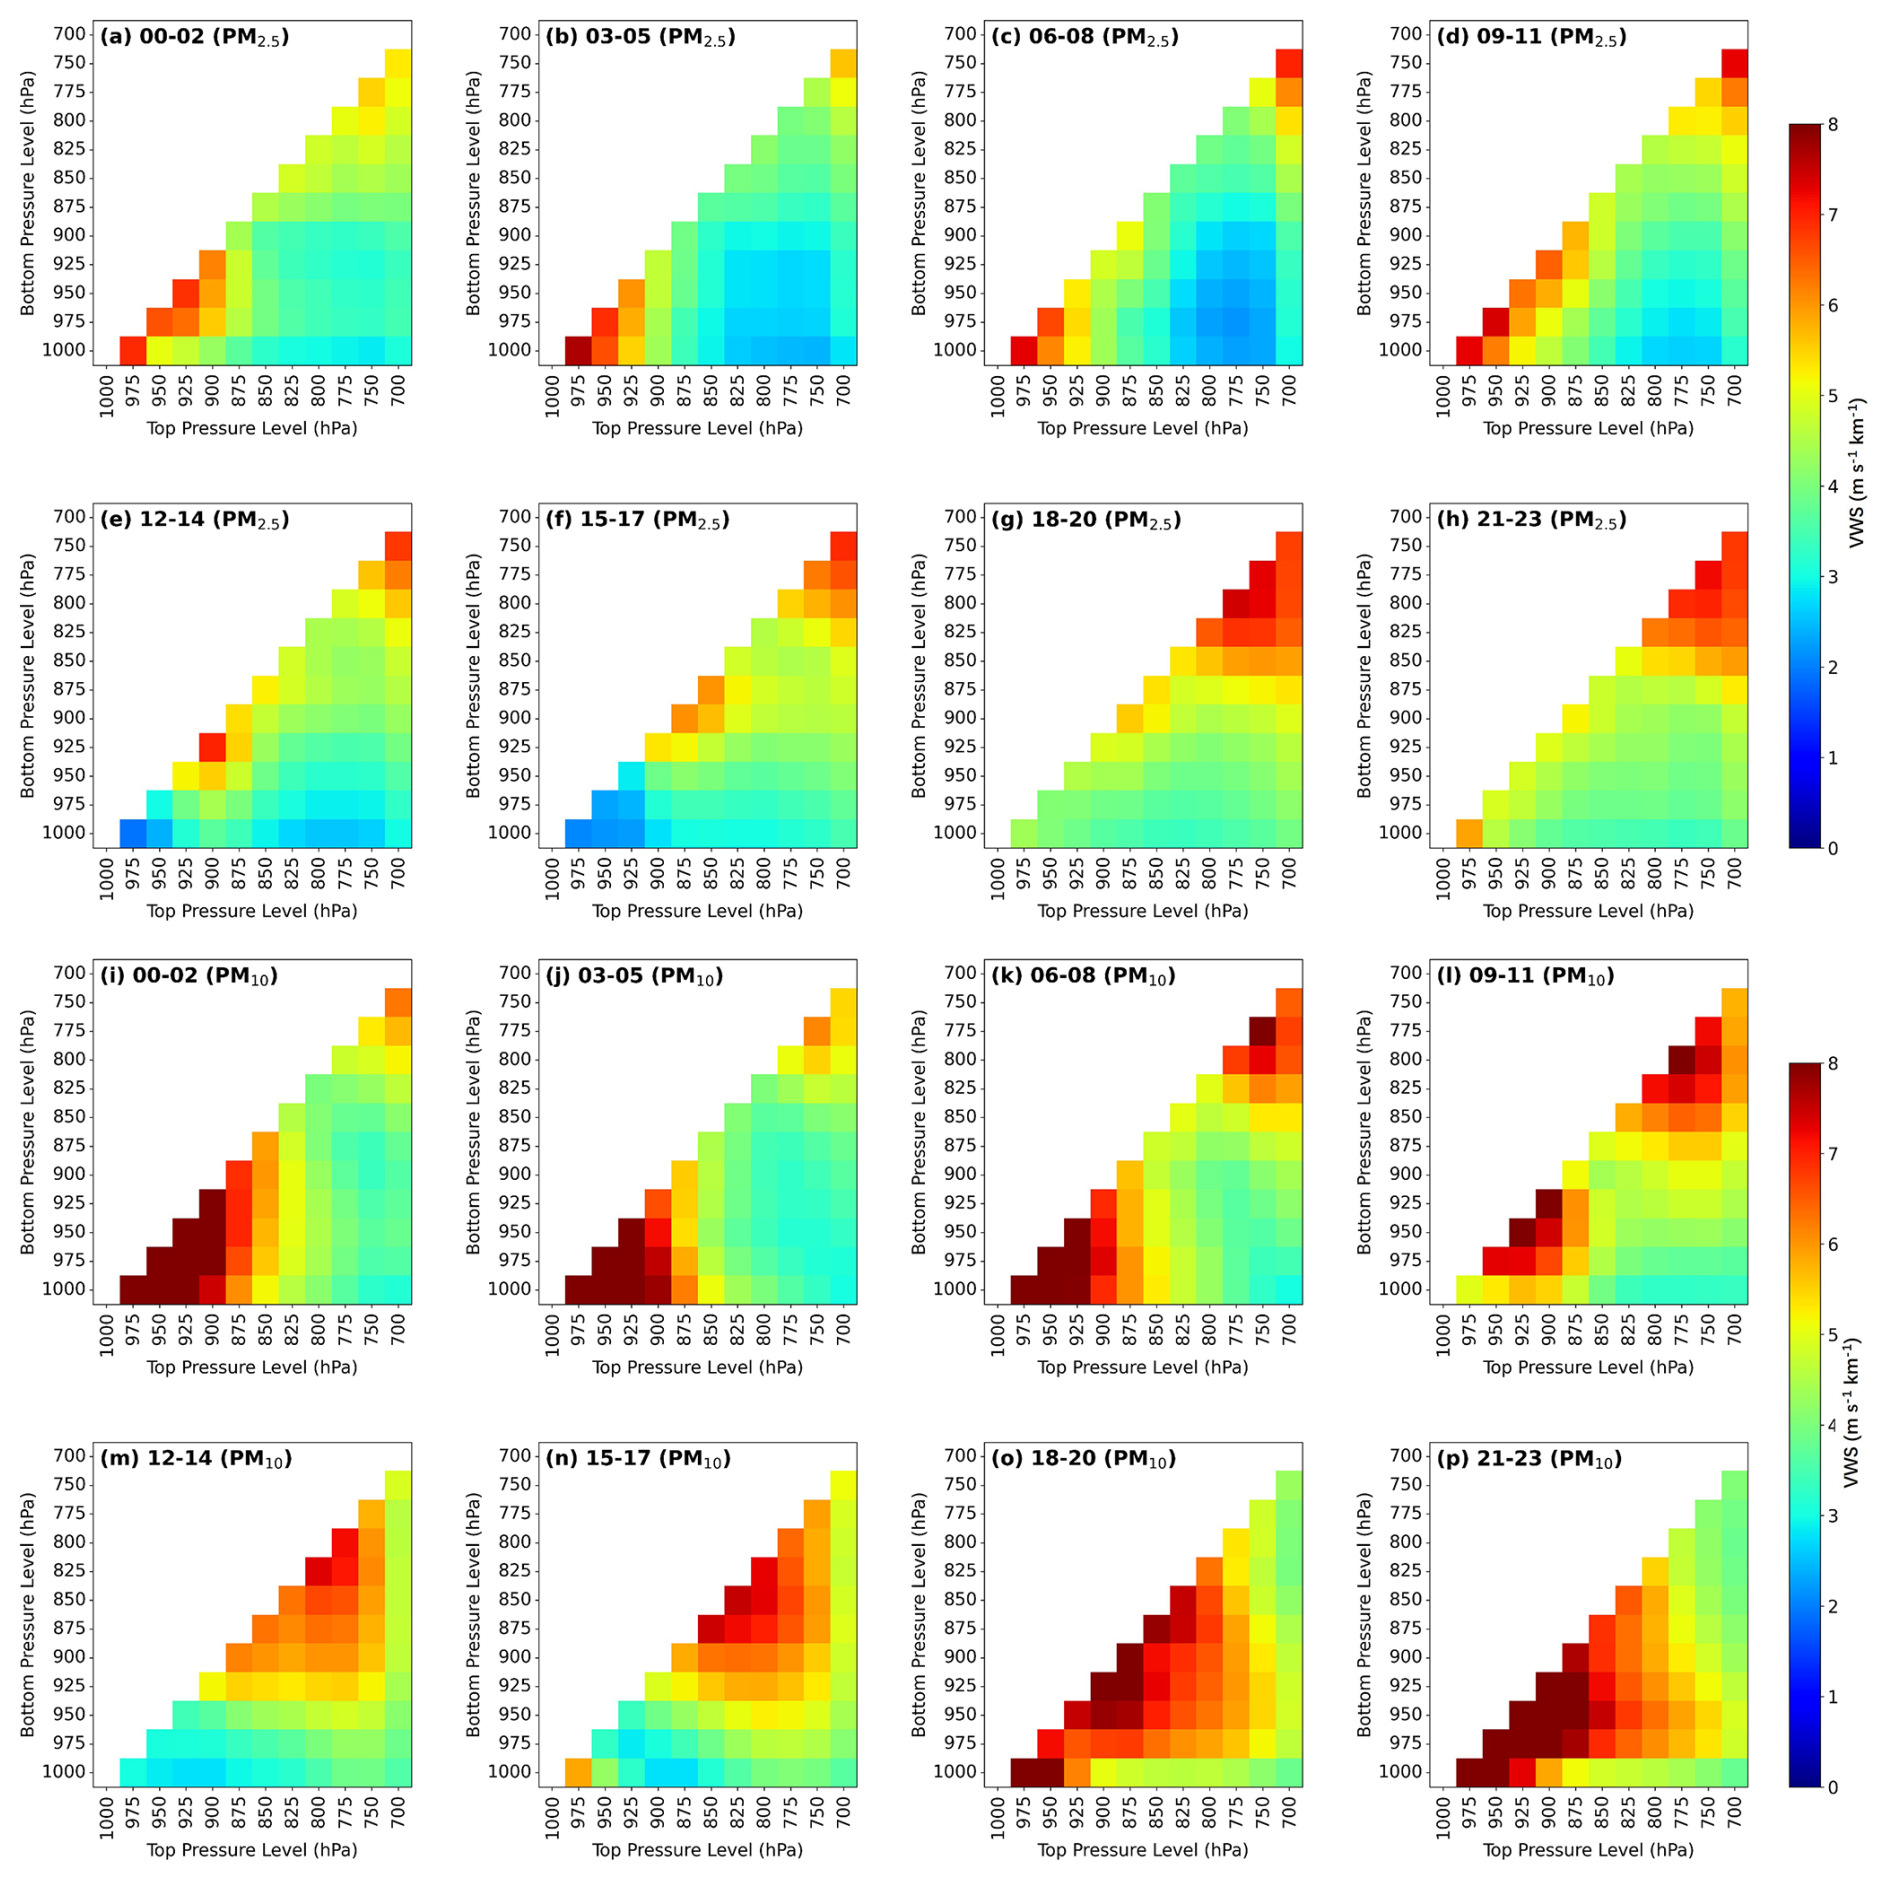
Figure 11Three-hourly variation of vertical wind shear for (a–h) PM2.5 and (i–p) PM10 on polluted days in Hefei at (a, i) 00:00–02:00 BJT, (b, j) 03:00–05:00 BJT, (c, k) 06:00–08:00 BJT, (d, l) 09:00–11:00 BJT, (e, m) 12:00–14:00 BJT, (f, n) 15:00–17:00 BJT, (g, o) 18:00–20:00 BJT, and (h, p) 21:00–23:00 BJT. Beijing Time (BJT) is UTC + 8, the local standard time used in this study. The axes indicate the vertical bounds (upper and lower pressure levels) used to compute VWS, where the main diagonal (from top-right to bottom-left) corresponds to self-referential values for single-layer calculations. The color gradient represents the magnitude of VWS between adjacent atmospheric layers.
Contrary to the expectation that polluted days generally exhibited weak VWS, the VWS associated with PM10 on polluted days was not consistently lower than that on clean days (Figs. 11i–p and 12i–p). In particular, dust storms with high PM10 levels are typically accompanied by intensified VWS, which is conducive to dust uplift and transport under dynamic atmospheric conditions (Yang et al., 2019). The large VWS associated with PM10 would clear the air in the upper air at the beginning but later contributed to raising surface PM10 levels through regional transport at the near-surface and through downward transport of aerosol particles from the upper air. During the onset phase of dust intrusion, intensified shear facilitates both horizontal and vertical transport of dust particles (Biuki et al., 2022). From 00:00 to 11:00 (BJT), the VWS in the upper layer (850–700 hPa) gradually increases on PM2.5-polluted days. At night, the near-surface air cools, forming a stable temperature inversion layer that inhibits vertical mixing. Hence, the stable structure would lead to weak VWS in the upper layer. As the sun rises in the mornings, the inversion layer gradually dissipates, and vertical mixing shifts from being suppressed to active (Fig. 11i–l). The VWS in the upper layer gradually increases due to the mixing effect. In addition, PM10 pollution often occurs during cold front passage. The vertical gradient of wind direction and speed changes suddenly near the frontal surface when cold and warm air masses converge. Once the front is located in a certain pressure range, the wind shear may be significantly higher than that in the surrounding layers. The weaker VWS between adjacent pressure layers (e.g., near 825–850 hPa) may correspond to the fault distribution (Fig. 11i–l). The sinking of cold air also leads to an increase in VWS at the lower level.
To clarify the synoptic influences on PM2.5 and PM10 pollution, we analyzed the distributions of air temperature across different pressure levels from March 2021 to May 2023. During PM2.5 pollution days, temperatures at all levels were consistently higher than those on clean days. The warming showed a notable pattern, with the most pronounced trend initially observed at 875 hPa, (Fig. 13b). The enhanced upper-level warming relative to the lower-level led to a thermally stable stratification, which inhibited vertical mixing and promoted the accumulation of PM2.5 near the surface. In contrast, PM10-polluted days exhibited negative temperature differences below 875 hPa (Fig. 13d), indicating the intrusion of cold air masses. These cold air masses, often accompanied by long-range dust transport, not only bring in PM10 particles from upwind regions but also suppress vertical mixing in the lower atmosphere due to their higher density. Notably, the altitude of the cooling (875 hPa) coincided with the effective aerosol layer height identified in our LiDAR-based analyses (Figs. 8, 11, and 12), which supported the conclusion that dust particles were primarily transported within this level.
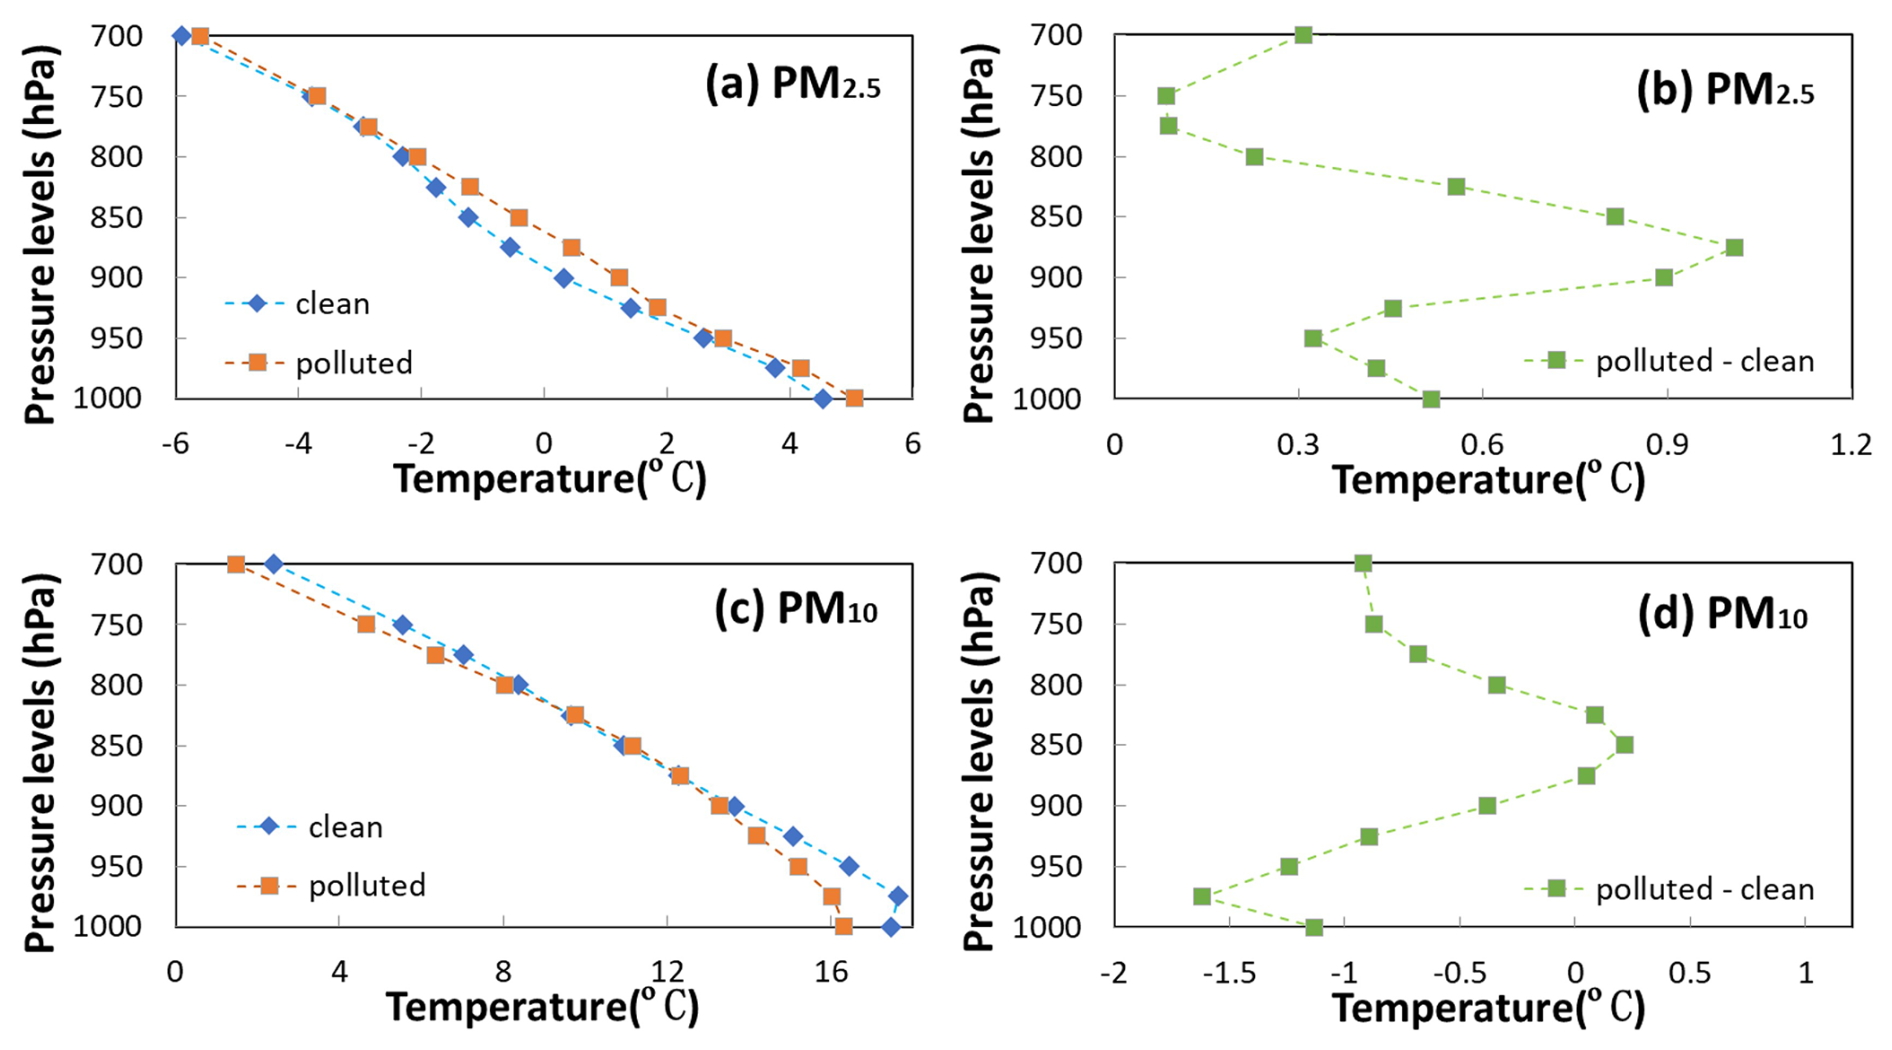
Figure 13Vertical distributions of temperature for polluted, clean, and their difference in (a, b) PM2.5 and (c, d) PM10.
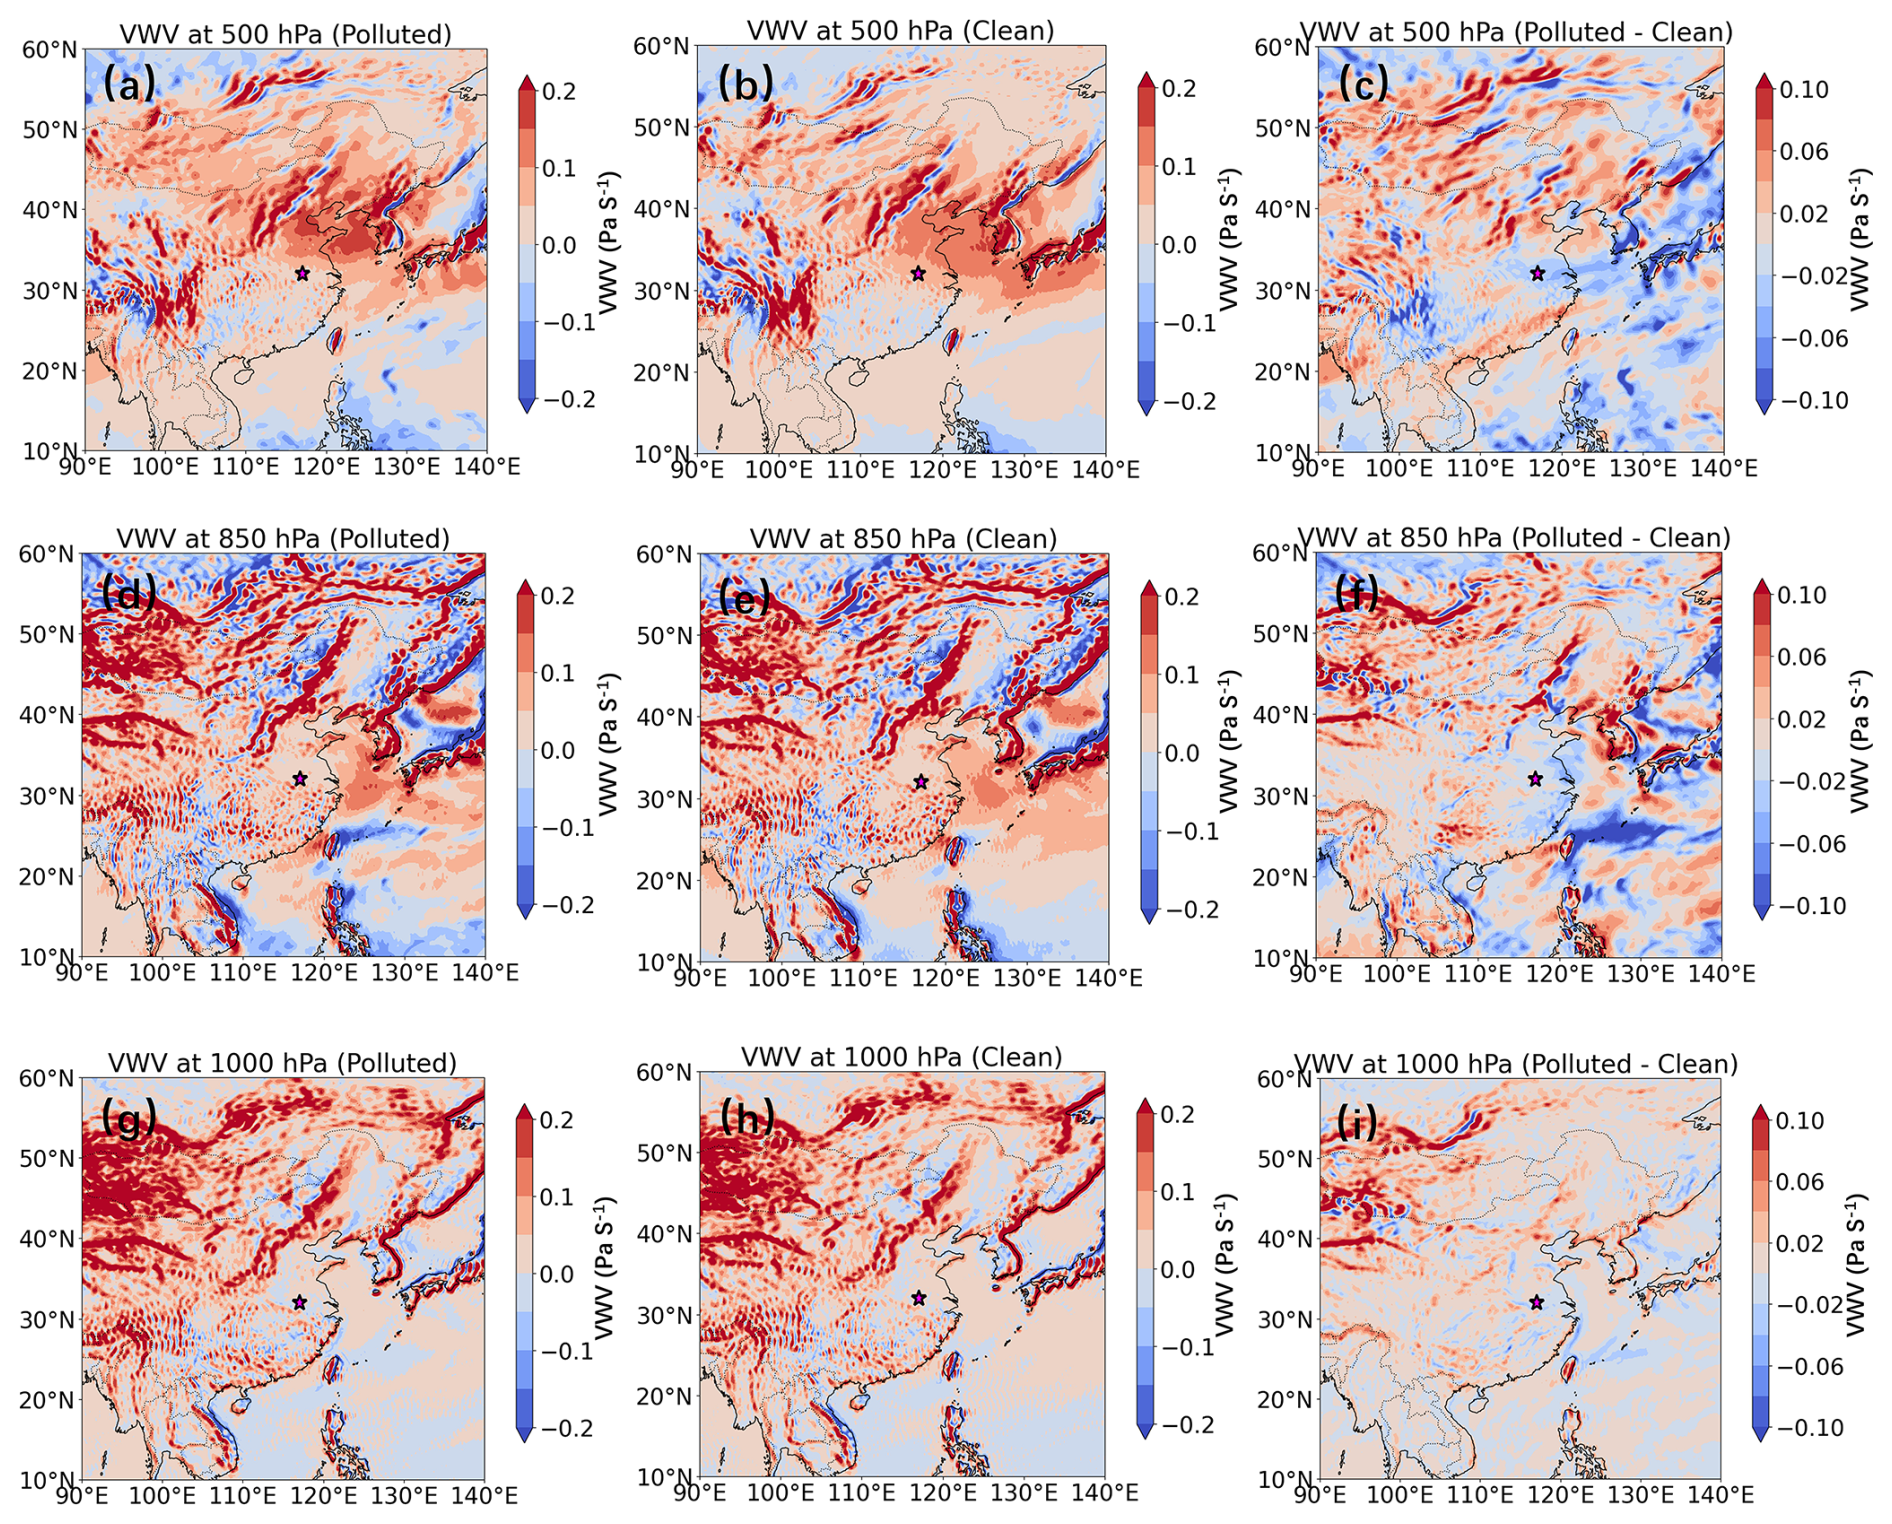
Figure 14Spatial distribution of the vertical wind velocity (VWV) at three pressure levels (500 hPa: a–c; 850 hPa: d–f; 1000 hPa: g–i) on PM2.5-polluted (left column), clean (middle column) days and the difference between them (right column), respectively. The areas highlighted with a red star represents the location of Hefei.
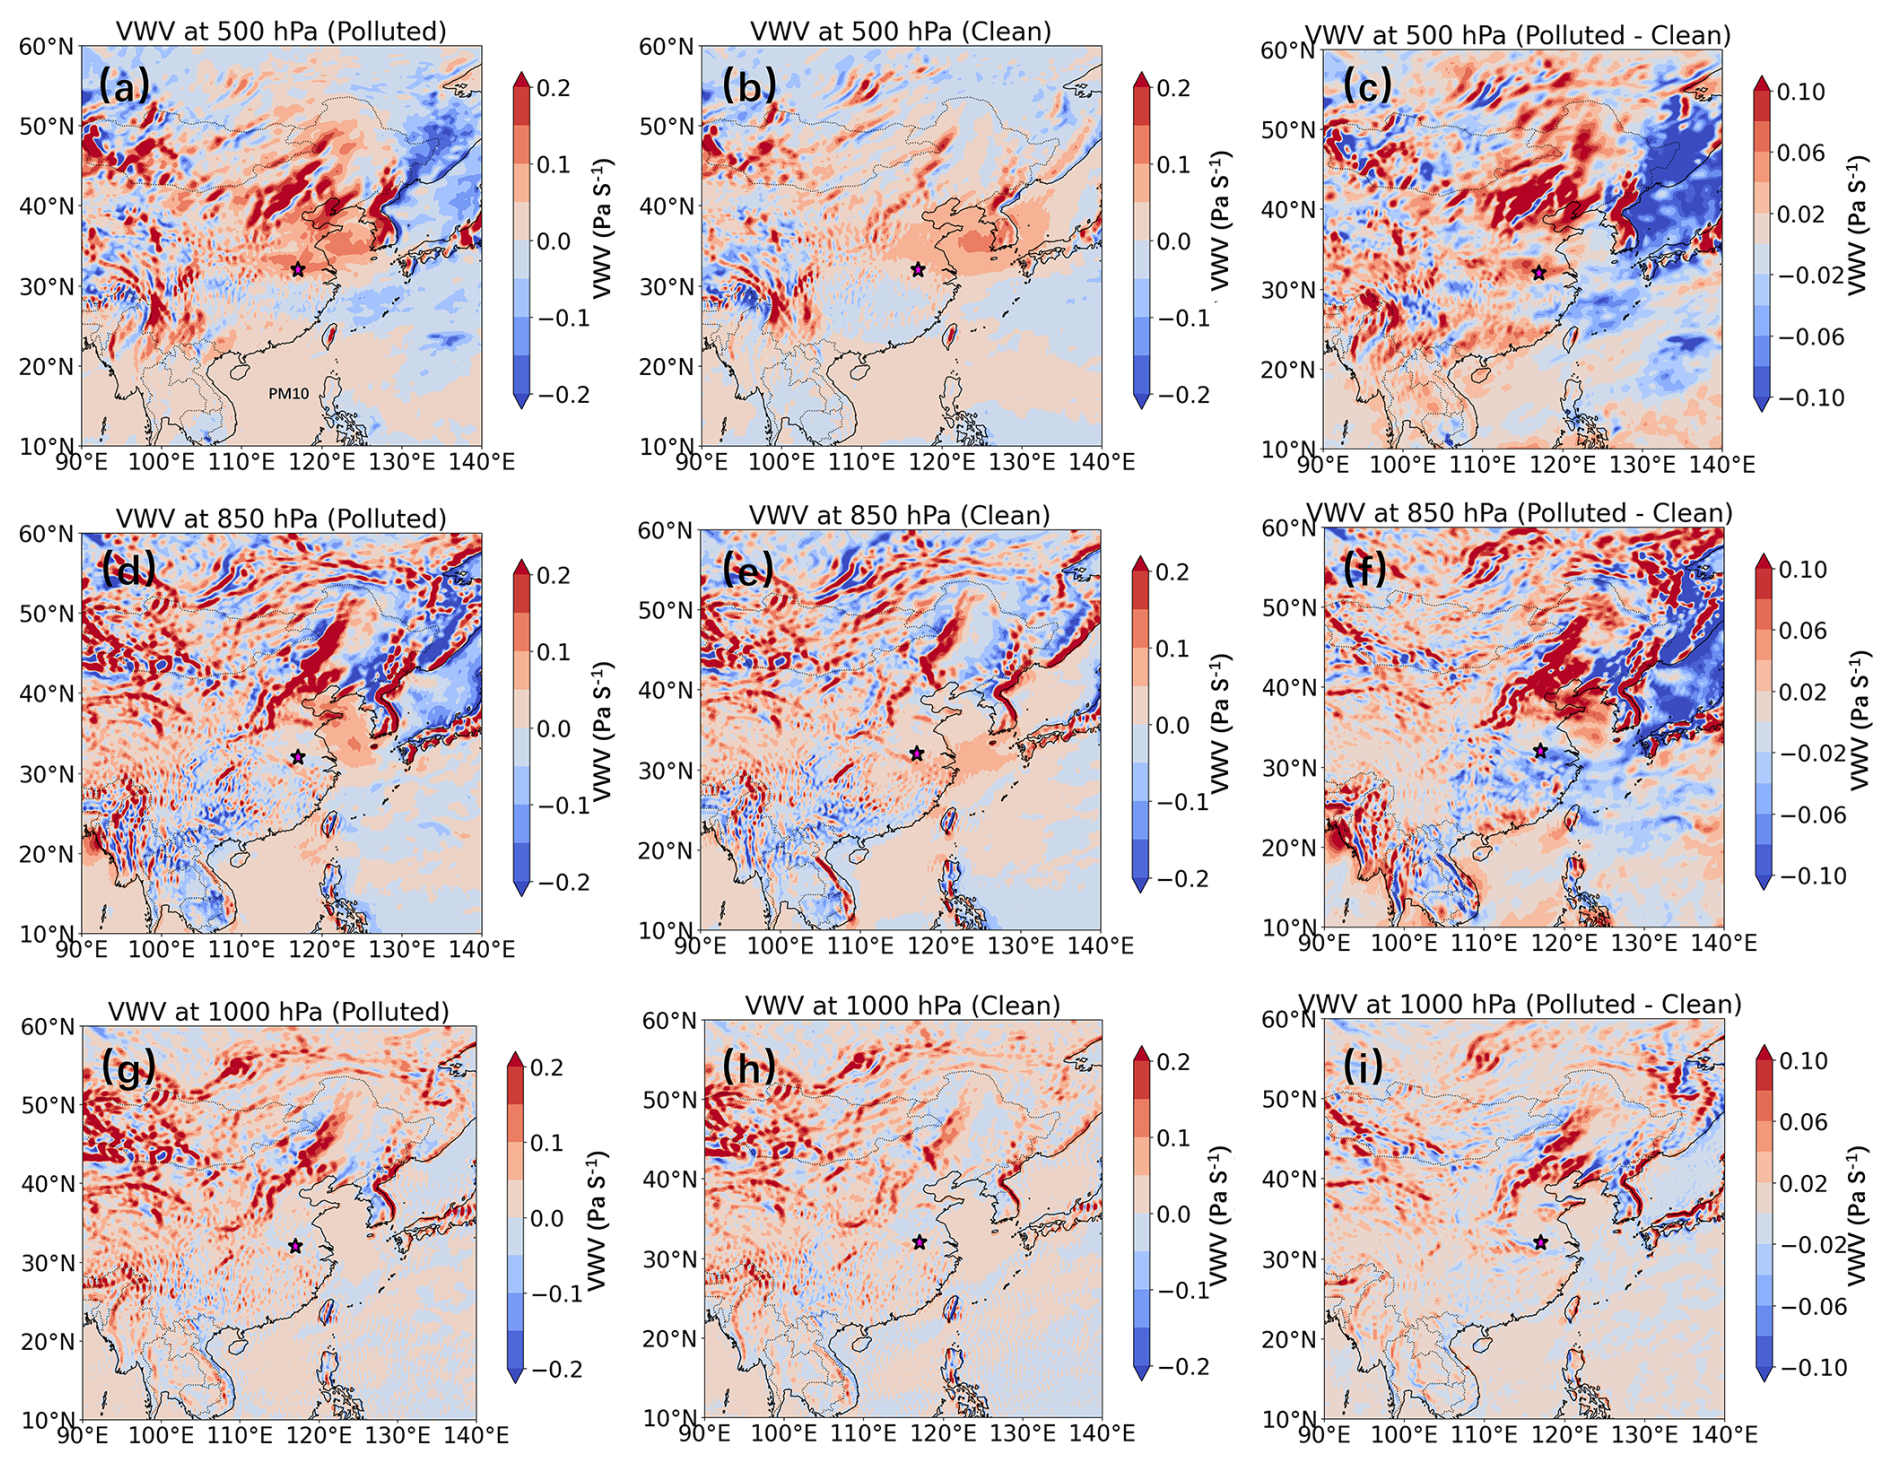
Figure 15Same as Fig. 14, but on PM10-polluted (left column), clean (middle column) days and the difference between them (right column), respectively.
To further investigate the vertical thermal and humidity differences between clean and polluted days, we focus on three key pressure levels (1000, 850, and 500 hPa). During PM2.5-polluted periods, the warming at 850 hPa was greater than that near the surface at 1000 hPa in Hefei (Fig. S3f and i). This vertical temperature structure created a pronounced inversion, which inhibited the vertical mixing and enhanced the atmospheric stability. The lower troposphere also exhibited elevated relative humidity, particularly in Hefei and nearby regions. Elevated relative humidity suppresses turbulent exchange and reduces dilution capacity, and hence forms a shallow, moist, and stable boundary layer that favors pollutant persistence and contributes to poor air quality. In contrast, the clean days showed a lower humidity in the boundary layer and a weaker vertical temperature gradient, allowing enhanced upward motion and effective removal of surface aerosols (Deng et al., 2023). PM10 pollution episodes occurred under a markedly different meteorological background (Fig. S4). Specifically, the relative humidity at both 1000 and 850 hPa was significantly lower on PM10-polluted days than on clean days (Fig. S4f and i). Aloft cold air intrusions occurred on PM10 pollution days, creating favorable conditions for the large-scale transport of dust into Hefei. Under such dry and calm conditions, the accumulation of PM10 is likely driven by mechanical resuspension or regional dust transport rather than secondary aerosol formation processes enhanced by moisture (Li et al., 2020). Overall, these findings reveal that PM2.5 episodes over Hefei are typically governed by moist and thermodynamically stable boundary layers under subsiding air masses, while PM10 events are more influenced by dust-laden airflow and dry boundary-layer dynamics. The distinct thermal and humidity structures observed across the vertical profile emphasize the importance of differentiating pollution types when diagnosing meteorological drivers.
The vertical wind velocity was investigated at three pressure levels to reveal the dynamic mechanisms on PM2.5 and PM10 pollution days (Figs. 14 and 15). To better elucidate the meteorological characteristics between polluted and clean conditions, we calculated the differences in vertical velocity between these two scenarios, as their broadly similar large-scale background circulation patterns obscure the subtle but critical dynamic anomalies that drive pollution formation. On PM2.5-polluted days, the atmosphere around Hefei exhibits a clear subsidence trend at 850 and 1000 hPa (Fig. 14). The subsidence reflects the existence of high-pressure systems and stagnant synoptic conditions, which contribute to the accumulation of fine particles. This inhibition of the upward motion of vertical wind corresponds with a stable thermal structure, which can effectively restrict vertical exchange and compress the boundary layer. During PM10 pollution events, subsidence at 500 hPa is significantly stronger than that on clean days (Fig. 15). However, Hefei is located in a unique region defined by upward motion at 850 hPa, with a comparable weak upward movement also observed at 1000 hPa. The subsidence at 500 hPa stabilizes the atmosphere and suppresses the upward dispersion of particles. Meanwhile, upward motion at 850 hPa and near the surface (1000 hPa) may be caused by local convergence or orographic lifting, allowing the uplift and recirculation of dust within the lower troposphere. This dynamic difference could reflect more complex interactions between local surface sources and large-scale synoptic. Upward motion at 850 hPa supports the interpretation that PM10 events are influenced by weak convective movements or vertical recycling of particles within a confined layer rather than stagnation alone. These findings reveal that PM2.5 and PM10 pollution in Hefei are governed by contrasting vertical dynamic regimes. PM2.5 events are closely tied to a uniformly subsiding atmosphere, which favors the trapping and accumulation of fine particles. In contrast, PM10 events are characterized by a layered structure, where upper-level subsidence and lower-level ascent work in tandem to recirculate coarse particles, rather than simply trapping them. This distinction underscores the need for targeted, pollutant-specific strategies in air quality forecasting and management.
This study comprehensively assesses the vertical structures of aerosols in Hefei by comparing fine (PM2.5) and coarse (PM10) particulate matter on clean and polluted days. We utilized long-term aerosol LiDAR measurements and reanalysis meteorological data to compare the vertical distribution characteristics of different particulate pollution types as well as the underlying thermodynamic and dynamic mechanisms that drive their vertical development. Aerosol extinction coefficients at 532 nm for PM2.5 and PM10 were consistently higher on polluted days than on clean days. Since fine-mode particles predominate the aerosol population on PM2.5 pollution days, the depolarization ratios fell within a range lower than those observed on clean days. In contrast, PM10-polluted days had larger depolarization ratios than clean days, indicating significant contributions from non-spherical coarse particles.
Our findings reveal that the accumulation of PM2.5 is closely linked to stable boundary layer structures characterized by high humidity, weak vertical shear, and a mid-level inversion temperature. These conditions collectively inhibit vertical exchange and confine fine particles near the surface. The vertical extinction and depolarization profiles support the dominance of aerosols during PM2.5 pollution, particularly in the lower 0.9 km. In contrast, PM10 pollution is typically associated with low humidity and mechanically driven transport of dust from upwind sources. The vertical profiles show enhanced depolarization ratios, indicating the presence of non-spherical, coarse particles such as dust or resuspended material. Distinct vertical motion patterns identify the two types of pollution. PM2.5 episodes showed upward mobility in the mid-troposphere and near-surface subsidence, which reinforced stratification and pollution trapping. However, PM10 events were distinguished by upper-level subsidence coupled with low-level ascent, which might facilitate vertical transport of coarse particles during regional dust episodes. These dynamic differences highlight that PM2.5 and PM10 are generated by fundamentally separate atmospheric processes, and a unified treatment of particulate pollution risks oversimplifies their behavior.
Expanding such analyses across multiple sites would also aid in identifying geographical heterogeneity and testing the generalizability of the discovered trends. Future research may be directed toward integrating long-term, high-resolution vertical observations with advanced modeling approaches to better understand the multiscale dynamics behind various forms of particle pollution and create tailored mitigation solutions.
Hourly concentrations of major air pollutants were obtained from the China National Environmental Monitoring Centre (CNEMC) (https://www.cnemc.cn/, last access: 5 November 2024). Surface meteorological variables were obtained from the China Meteorological Administration (CMA) (http://data.cma.cn/en, last access: 16 March 2025). The ERA5 reanalysis dataset, used to investigate the impact of synoptic systems on PM2.5 and PM10 pollution, was freely accessible via the Copernicus Climate Change Services platform (https://cds.climate.copernicus.eu/datasets, last access: 23 March 2025).
The supplement related to this article is available online at https://doi.org/10.5194/amt-19-3459-2026-supplement.
YY acquired and analyzed the data and drafted the manuscript; XD conceived the study; RD and QX performed data processing and investigation; QH, YL and CW provided theoretical support; JX and YS discussed the results and revised the manuscript; YL acquired funding; all co-authors reviewed and approved the final version of the manuscript.
The contact author has declared that none of the authors has any competing interests.
Publisher's note: Copernicus Publications remains neutral with regard to jurisdictional claims made in the text, published maps, institutional affiliations, or any other geographical representation in this paper. The authors bear the ultimate responsibility for providing appropriate place names. Views expressed in the text are those of the authors and do not necessarily reflect the views of the publisher.
The authors thank the editor and reviewers for their constructive comments and valuable suggestions, which have greatly improved the quality of this manuscript. We also acknowledge the China National Environmental Monitoring Centre (CNEMC), the China Meteorological Administration (CMA), and the Copernicus Climate Change Service for providing observation and reanalysis datasets used in this study.
This work was supported by the Innovation and Development Special Project of Anhui Meteorological Bureau (CXB202404), the 2025 Independent Innovation Scientific Research Project of Anhui Public Meteorological Service Center (GFCX202504), the Open Fund Project for Heavy Rain (BYKJ2025D03), the Science and Technology Projects of Xizang Autonomous Region, China (XZ202502JD0041), and the Special Project for Forecasters of Anhui Meteorological Bureau (KY202003).
This paper was edited by Piet Stammes and reviewed by two anonymous referees.
Ansmann, A., Muellera, D., Wandinger, U., and Mamouri, R. E.: Lidar profiling of aerosol optical and microphysical properties from space: overview, review, and outlook, in: 1st International Conference on Remote Sensing and Geoinformation of the Environment (RSCy), Paphos, CYPRUS, 8–10 April 2013, Proc. SPIE 8795, https://doi.org/10.1117/12.2028112, 2013.
Biuki, Z. A., Parvin, P., and Aghaei, M.: Satellite remote sensing of particulate matter in the atmosphere of megacities: A case study of Tehran, Iran, Atmos. Pollut. Res., 13, https://doi.org/10.1016/j.apr.2022.101545, 2022.
Cairo, F., Di Liberto, L., Dionisi, D., and Snels, M.: Understanding aerosol-cloud interactions through lidar techniques: A review, Remote Sens., 16, https://doi.org/10.3390/rs16152788, 2024.
Chen, C., Song, X., Wang, Z., Chen, Y., Wang, X., Bu, Z., Zhang, X., Zhuang, Q., Pan, X., Li, H., Zhang, F., Wang, X., Li, X., and Zheng, R.: Calibration methods of atmospheric aerosol lidar and a case study of haze process, Front. Phys., 10, https://doi.org/10.3389/fphy.2022.942926, 2022.
Chen, W., Tang, H., Zhao, H., and Yan, L.: Analysis of aerosol properties in Beijing based on ground-based sun photometer and air quality monitoring observations from 2005 to 2014, Remote Sens., 8, https://doi.org/10.3390/rs8020110, 2016.
Chen, X., Yang, T., Wang, H. B., Wang, F. T., and Wang, Z. F.: Variations and drivers of aerosol vertical characterization after clean air policy in China based on 7-years consecutive observations, J. Environ. Sci., 125, 499–512, https://doi.org/10.1016/j.jes.2022.02.036, 2023.
Chen, Y., Bu, Z., Wang, X., Dai, Y., Li, Z., Lu, T., Liu, Y., and Wang, X.: Development and calibration of 532 nm standard aerosol lidar with low blind area, Remote Sens., 16, https://doi.org/10.3390/rs16030570, 2024a.
Chen, Z., Ji, C., Mao, J., Wang, Z., Jiao, Z., Gao, L., Xiang, Y., and Zhang, T.: Downdraft influences on the differences of PM2.5 concentration: insights from a mega haze evolution in the winter of northern China, Environ. Res. Lett., 19, https://doi.org/10.1088/1748-9326/ad1229, 2024b.
Chouza, F., Reitebuch, O., Groß, S., Rahm, S., Freudenthaler, V., Toledano, C., and Weinzierl, B.: Retrieval of aerosol backscatter and extinction from airborne coherent Doppler wind lidar measurements, Atmos. Meas. Tech., 8, 2909–2926, https://doi.org/10.5194/amt-8-2909-2015, 2015.
Dai, F., Chen, M., and Yang, B.: Spatiotemporal variations of PM2.5 concentration at the neighborhood level in five Chinese megacities, Atmos. Pollut. Res., 11, 190–202, https://doi.org/10.1016/j.apr.2020.03.010, 2020.
Deng, X., Chen, J., Dai, R., Zhai, Z., He, D., Zhao, L., Jin, X., and Zhang, J.: The effects of planetary boundary layer features on air pollution based on ERA5 data in east China, Atmosphere, 14, https://doi.org/10.3390/atmos14081273, 2023.
Fan, G., Zhang, B., Zhang, T., Fu, Y., Pei, C., Lou, S., Li, X., Chen, Z., and Liu, W.: Accuracy evaluation of differential absorption lidar for ozone detection and intercomparisons with other instruments, Remote Sens., 16, https://doi.org/10.3390/rs16132369, 2024.
Fan, S., Gao, C. Y., Wang, L., Yang, Y., Liu, Z., Hu, B., Wang, Y., Wang, J., and Gao, Z.: Elucidating roles of near-surface vertical layer structure in different stages of PM2.5 pollution episodes over urban Beijing during 2004–2016, Atmos. Environ., 246, https://doi.org/10.1016/j.atmosenv.2020.118157, 2021.
Fang, Z., Yang, H., Li, C., Kuang, Z., Xu, X., and Jin, H.: Reveal persistent haze pollution episodes in Hefei: A perspective from ground-based and satellite observation, Air Qual. Atmos. Health, 17, 2555–2568, https://doi.org/10.1007/s11869-024-01587-2, 2024.
Gao, F., Bergant, K., Filipcic, A., Forte, B., Hua, D. X., Song, X. Q., Stanic, S., Veberic, D., and Zavrtanik, M.: Observations of the atmospheric boundary layer across the land-sea transition zone using a scanning Mie lidar, J. Quant. Spectrosc. Ra., 112, 182–188, https://doi.org/10.1016/j.jqsrt.2010.04.001, 2011.
Gao, Y., Chen, Y., Liu, G., and Zhang, J.: Investigating the influence of meteorological factors on particulate matters: A case study based on path analysis, Energy Environ., 31, 479–491, https://doi.org/10.1177/0958305x19876696, 2020.
Garratt, J. R.: Review: The atmospheric boundary layer, Earth Sci. Rev., 37, 89–134, https://doi.org/10.1016/0012-8252(94)90026-4, 1994.
Gebauer, H., Floutsi, A. A., Haarig, M., Radenz, M., Engelmann, R., Althausen, D., Skupin, A., Ansmann, A., Zenk, C., and Baars, H.: Tropospheric sulfate from Cumbre Vieja (La Palma) observed over Cabo Verde contrasted with background conditions: a lidar case study of aerosol extinction, backscatter, depolarization and lidar ratio profiles at 355, 532 and 1064 nm, Atmos. Chem. Phys., 24, 5047–5067, https://doi.org/10.5194/acp-24-5047-2024, 2024.
Haarig, M., Ansmann, A., Gasteiger, J., Kandler, K., Althausen, D., Baars, H., Radenz, M., and Farrell, D. A.: Dry versus wet marine particle optical properties: RH dependence of depolarization ratio, backscatter, and extinction from multiwavelength lidar measurements during SALTRACE, Atmos. Chem. Phys., 17, 14199–14217, https://doi.org/10.5194/acp-17-14199-2017, 2017.
Han, X. and Cao, T.: Urbanization level, industrial structure adjustment and spatial effect of urban haze pollution: Evidence from China's Yangtze River Delta urban agglomeration, Atmos. Pollut. Res., 13, https://doi.org/10.1016/j.apr.2022.101427, 2022.
He, G., Deng, T., Wu, D., Wu, C., Huang, X., Li, Z., Yin, C., Zou, Y., Song, L., Ouyang, S., Tao, L., and Zhang, X.: Characteristics of boundary layer ozone and its effect on surface ozone concentration in Shenzhen, China: A case study, Sci. Total Environ., 791, https://doi.org/10.1016/j.scitotenv.2021.148044, 2021.
He, Y., Li, L., Wang, H., Xu, X., Li, Y., and Fan, S.: A cold front induced co-occurrence of O3 and PM2.5 pollution in a Pearl River Delta city: Temporal variation, vertical structure, and mechanism, Environ. Pollut., 306, https://doi.org/10.1016/j.envpol.2022.119464, 2022.
Huang, L., Chen, M. D., and Hu, J. L.: Twelve-year trends of PM10 and visibility in the Hefei metropolitan area of China, Adv. Meteorol., 2016, https://doi.org/10.1155/2016/4810796, 2016.
Jin, X., Cai, X., Yu, M., Wang, X., Song, Y., Kang, L., Zhang, H., and Zhu, T.: Mesoscale structure of the atmospheric boundary layer and its impact on regional air pollution: A case study, Atmos. Environ., 258, https://doi.org/10.1016/j.atmosenv.2021.118511, 2021.
Kumar, V. R., Collins, R. L., and Yellapragada, B. K.: Polarization lidar observations of diurnal and seasonal variations in the atmospheric mixing layer above a tropical rural place gadanki, India, J. Atmos. Sol.-Terr. Phy., 263, https://doi.org/10.1016/j.jastp.2024.106335, 2024.
Li, H., Sodoudi, S., Liu, J. F., and Tao, W.: Temporal variation of urban aerosol pollution island and its relationship with urban heat island, Atmos. Res., 241, https://doi.org/10.1016/j.atmosres.2020.104957, 2020.
Li, Q., Zhang, H., Jin, X., Cai, X., and Song, Y.: Mechanism of haze pollution in summer and its difference with winter in the North China Plain, Sci. Total Environ., 806, https://doi.org/10.1016/j.scitotenv.2021.150625, 2022.
Li, X., Wang, Y., Shen, L., Zhang, H., Zhao, H., Zhang, Y., and Ma, Y.: Characteristics of boundary layer structure during a persistent haze event in the central Liaoning city Cluster, Northeast China, J. Meteorol. Res.-PRC, 32, 302–312, https://doi.org/10.1007/s13351-018-7053-6, 2018.
Li, Y., Chen, Q. L., Zhao, H. J., Wang, L., and Tao, R.: Variations in PM10, PM2.5 and PM1.0 in an urban area of the Sichuan basin and their relation to meteorological factors, Atmosphere, 6, 150–163, https://doi.org/10.3390/atmos6010150, 2015.
Li, Y., Huang, T., Lee, H. F., Heo, Y., Ho, K. F., and Yim, S. H. L.: Integrating Doppler LiDAR and machine learning into land-use regression model for assessing contribution of vertical atmospheric processes to urban PM2.5 pollution, Sci. Total Environ., 952, https://doi.org/10.1016/j.scitotenv.2024.175632, 2024.
Liu, C., Huang, J., Wang, Y., Tao, X., Hu, C., Deng, L., Xu, J., Xiao, H.-W., Luo, L., Xiao, H.-Y., and Xiao, W.: Vertical distribution of PM2.5 and interactions with the atmospheric boundary layer during the development stage of a heavy haze pollution event, Sci. Total Environ., 704, https://doi.org/10.1016/j.scitotenv.2019.135329, 2020.
Liu, J., Cai, P., Dong, J., Wang, J., Li, R., and Song, X.: Assessment of the dynamic exposure to PM2.5 based on hourly cell phone location and land use regression model in Beijing, Int. J. Env. Res. Pub. He., 18, https://doi.org/10.3390/ijerph18115884, 2021.
Liu, T., Gong, S., He, J., Yu, M., Wang, Q., Li, H., Liu, W., Zhang, J., Li, L., Wang, X., Li, S., Lu, Y., Du, H., Wang, Y., Zhou, C., Liu, H., and Zhao, Q.: Attributions of meteorological and emission factors to the 2015 winter severe haze pollution episodes in China's Jing-Jin-Ji area, Atmos. Chem. Phys., 17, 2971–2980, https://doi.org/10.5194/acp-17-2971-2017, 2017.
Liu, Z., Hu, B., Wang, L., Wu, F., Gao, W., and Wang, Y.: Seasonal and diurnal variation in particulate matter (PM10 and PM2.5) at an urban site of Beijing: analyses from a 9-year study, Environ. Sci. Pollut. R., 22, 627–642, https://doi.org/10.1007/s11356-014-3347-0, 2015.
Liu, Z., Xiang, Y., Pan, Y., Zhang, T., Xu, W., and Li, L.: Unveiling 3-D evolution and mechanisms of ozone pollution in Changzhou, China: Insights from lidar observations and modelling, Environ. Pollut., 359, 124556, https://doi.org/10.1016/j.envpol.2024.124556, 2024.
Ma, P., Zhang, Z., Zhang, Y., Lamu, Y., and Za, D.: Effect of meteorological conditions on PM10 concentrations in the middle reaches of the Yarlung Zangbo River, Tibet Plateau, Theor. Appl. Climatol., 151, 725–737, https://doi.org/10.1007/s00704-022-04330-y, 2023.
Mehta, M., Khushboo, R., Raj, R., and Singh, N.: Spaceborne observations of aerosol vertical distribution over Indian mainland (2009-2018), Atmos. Environ., 244, https://doi.org/10.1016/j.atmosenv.2020.117902, 2021.
Miao, Y., Guo, J., Liu, S., Zhao, C., Li, X., Zhang, G., Wei, W., and Ma, Y.: Impacts of synoptic condition and planetary boundary layer structure on the trans-boundary aerosol transport from Beijing-Tianjin-Hebei region to northeast China, Atmos. Environ., 181, 1–11, https://doi.org/10.1016/j.atmosenv.2018.03.005, 2018.
Mishra, A. K. and Shibata, T.: Climatological aspects of seasonal variation of aerosol vertical distribution over central Indo-Gangetic belt (IGB) inferred by the space-borne lidar CALIOP, Atmos. Environ., 46, 365–375, https://doi.org/10.1016/j.atmosenv.2011.09.052, 2012.
Ou, J., Hu, Q., Liu, H., Hong, Q., Xing, C., Tan, W., Lin, H., Wang, X., Xu, H., Zhu, P., and Liu, W.: Vertical characterization and potential sources of aerosols in different seasons over the Yangtze River Delta using ground-based MAX-DOAS, Environ. Pollut., 279, https://doi.org/10.1016/j.envpol.2021.116898, 2021.
Qian, Z., Li, L., Lin, X., Sun, R., and Chen, Y.: Spatial and temporal variation of PM2.5 and the influence of vegetation in the Yangtze River Delta region, Atmos. Pollut. Res., 15, https://doi.org/10.1016/j.apr.2024.102266, 2024a.
Qian, Z., Li, L., Lin, X. X., Sun, R. J., and Chen, Y. Z.: Spatial and temporal variation of PM2.5 and the influence of vegetation in the Yangtze River Delta region, Atmos. Pollut. Res., 15, https://doi.org/10.1016/j.apr.2024.102266, 2024b.
Shen, L., Cheng, Y., Bai, X., Dai, H., Wei, X., Sun, L., Yang, Y., Zhang, J., Feng, Y., Li, Y. J., Chen, D.-R., Liu, J., and Gui, H.: Vertical profile of aerosol number size distribution during a haze pollution episode in Hefei, China, Sci. Total Environ., 814, https://doi.org/10.1016/j.scitotenv.2021.152693, 2022.
Shi, C., Yuan, R., Wu, B., Meng, Y., Zhang, H., Zhang, H., and Gong, Z.: Meteorological conditions conducive to PM2.5 pollution in winter 2016/2017 in the Western Yangtze River Delta, China, Sci. Total Environ., 642, 1221–1232, https://doi.org/10.1016/j.scitotenv.2018.06.137, 2018.
Shim, K., Kim, M.-H., Lee, H.-J., Nishizawa, T., Shimizu, A., Kobayashi, H., Kim, C.-H., and Kim, S.-W.: Exacerbation of PM2.5 concentration due to unpredictable weak Asian dust storm: A case study of an extraordinarily long-lasting spring haze episode in Seoul, Korea, Atmos. Environ., 287, https://doi.org/10.1016/j.atmosenv.2022.119261, 2022.
Sun, W., Liu, Z., Videen, G., Fu, Q., Muinonen, K., Winker, D. M., Lukashin, C., Jin, Z., Lin, B., and Huang, J.: For the depolarization of linearly polarized light by smoke particles, J. Quant. Spectrosc. Ra., 122, 233–237, https://doi.org/10.1016/j.jqsrt.2012.03.031, 2013.
Sun, X., Zhao, T., Hu, J., Bai, Y., Meng, L., Yang, Q., Zhou, Y., and Fu, W.: Inverse effects of aerosol radiative forcing on heavy PM2.5 pollution of local accumulation and regional transport over central China, Sci. Total Environ., 917, https://doi.org/10.1016/j.scitotenv.2024.170319, 2024.
Tombrou, M., Dandou, A., Helmis, C., Akylas, E., Angelopoulos, G., Flocas, H., Assimakopoulos, V., and Soulakellis, N.: Model evaluation of the atmospheric boundary layer and mixed-layer evolution, Bound.-Lay. Meteorol., 124, 61–79, https://doi.org/10.1007/s10546-006-9146-5, 2007.
Vakkari, V., Baars, H., Bohlmann, S., Bühl, J., Komppula, M., Mamouri, R.-E., and O'Connor, E. J.: Aerosol particle depolarization ratio at 1565 nm measured with a Halo Doppler lidar, Atmos. Chem. Phys., 21, 5807–5820, https://doi.org/10.5194/acp-21-5807-2021, 2021.
Wang, H., Sun, Z., Li, H., Gao, Y., Wu, J., and Cheng, T.: Vertical-distribution characteristics of atmospheric aerosols under different thermodynamic conditions in Beijing, Aerosol Air Qual. Res., 18, 2775–2787, https://doi.org/10.4209/aaqr.2018.03.0078, 2018.
Wang, J., Zhang, Y., Shao, M., Liu, X., Zeng, L., Cheng, C., and Xu, X.: Chemical composition and quantitative relationship, between meteorological condition and fine particles in Beijing, J. Environ. Sci., 16, 860–864, 2004.
Wang, J., Wang, H., Zhang, C., Wang, Y., Zhang, Y., Zhou, J., Xu, W., Whalley, L. K., Dyson, J. E., Slater, E. J., Xing, C., Chi, S., Wang, Y., Wang, L., Yu, X., Zeng, L., Lin, W., Zhao, W., Heard, D. E., Song, S., and Ye, C.: Ozone production underestimation over the Tibetan Plateau: The role of NOx and OVOCs modeling uncertainties, J. Geophys. Res.-Atmos., 130, https://doi.org/10.1029/2025jd043321, 2025.
Wang, L. Y., Lyu, B. L., and Bai, Y. Q.: Aerosol vertical profile variations with seasons, air mass movements and local PM2.5 levels in three large China cities, Atmos. Environ., 224, https://doi.org/10.1016/j.atmosenv.2020.117329, 2020a.
Wang, M. and Wang, H.: Spatial distribution patterns and influencing factors of PM2.5 pollution in the Yangtze River Delta: Empirical analysis based on a GWR model, Asia-Pac. J. Atmos. Sci., 57, 63–75, https://doi.org/10.1007/s13143-019-00153-6, 2021.
Wang, M., Wei, T., Lolli, S., Wu, K., Wang, Y., Hu, H., Yuan, J., Tang, D., and Xia, H.: A long-term Doppler wind lidar study of heavy pollution episodes in western Yangtze River Delta region, China, Atmos. Res., 310, https://doi.org/10.1016/j.atmosres.2024.107616, 2024.
Wang, Z., Liu, C., Xie, Z., Hu, Q., Andreae, M. O., Dong, Y., Zhao, C., Liu, T., Zhu, Y., Liu, H., Xing, C., Tan, W., Ji, X., Lin, J., and Liu, J.: Elevated dust layers inhibit dissipation of heavy anthropogenic surface air pollution, Atmos. Chem. Phys., 20, 14917–14932, https://doi.org/10.5194/acp-20-14917-2020, 2020b.
Wang, Z., Liu, C., Hu, Q. H., Dong, Y. S., Liu, H. R., Xing, C. Z., and Tan, W.: Quantify the contribution of dust and anthropogenic sources to aerosols in north China by lidar and validated with CALIPSO, Remote Sens., 13, https://doi.org/10.3390/rs13091811, 2021.
Xiang, Y., Zhang, T., Liu, J., Wan, X., Loewen, M., Chen, X., Kang, S., Fu, Y., Lv, L., Liu, W., and Cong, Z.: Vertical profile of aerosols in the Himalayas revealed by lidar: New insights into their seasonal/diurnal patterns, sources, and transport, Environ. Pollut., 285, https://doi.org/10.1016/j.envpol.2021.117686, 2021.
Xiong, K., Xie, X., Mao, J., Wang, K., Huang, L., Li, J., and Hu, J.: Improving the accuracy of O3 prediction from a chemical transport model with a random forest model in the River Delta China, Environ. Pollut., 319, https://doi.org/10.1016/j.envpol.2022.120926, 2023.
Yang, S., Ma, Y., Zhang, W., Lin, Z., Lu, Z., Zhou, X., Ren, Y., Ren, X., Peng, K., Tan, Y., Wei, Y., Ahmad, M., Zhao, D., Kong, L., Ma, Y., Tian, Y., and Xin, J.: The interaction of atmospheric boundary layer and PM pollution in Mongolian Plateau: Implication for the threshold control strategy, Atmos. Res., 316, https://doi.org/10.1016/j.atmosres.2025.107937, 2025.
Yang, Y., Yim, S. H. L., Haywood, J., Osborne, M., Chan, J. C. S., Zeng, Z., and Cheng, J. C. H.: Characteristics of heavy particulate matter pollution events over Hong Kong and their relationships with vertical wind profiles using high-time-resolution Doppler Lidar measurements, J. Geophys. Res.-Atmos., 124, 9609–9623, https://doi.org/10.1029/2019jd031140, 2019.
Yang, Z., Wang, Y., Xu, X.-H., Yang, J., and Ou, C.-Q.: Quantifying and characterizing the impacts of PM2.5 and humidity on atmospheric visibility in 182 Chinese cities: A nationwide time-series study, J. Cleaner Prod., 368, https://doi.org/10.1016/j.jclepro.2022.133182, 2022.
Yu, H., Wang, Y., Peng, Q., Shao, Y., Duan, C., Zhu, Y., Dong, S., Li, C., Shi, Y., Zhang, N., Zheng, Y., Chen, Y., Jiang, Q., Zhong, P., and Zhou, Y.: Influence of coarse particulate matter on chickenpox in Jiading District, Shanghai, 2009–2018: A distributed lag non-linear time series analysis, Environ. Res., 190, https://doi.org/10.1016/j.envres.2020.110039, 2020.
Yu, S., Liu, D., Xu, J., Wang, Z., Wu, D., Shan, Y., Shao, J., Mao, M., Qian, L., Wang, B., Xie, C., and Wang, Y.: Optical properties and seasonal distribution of aerosol layers observed by lidar over Jinhua, southeast China, Atmos. Environ., 257, https://doi.org/10.1016/j.atmosenv.2021.118456, 2021.
Zhan, Y., Xie, M., Zhuang, B., Gao, D., Zhu, K., Lu, H., Wang, T., Li, S., Li, M., Luo, Y., and Zhao, R.: Particle-ozone complex pollution under diverse synoptic weather patterns in the Yangtze River Delta region: Synergistic relationships and the effects of meteorology and chemical compositions, Sci. Total Environ., 946, 174365, https://doi.org/10.1016/j.scitotenv.2024.174365, 2024.
Zhang, T., Che, H. Z., Gong, Z. Q., Wang, Y. Q., Wang, J. Z., Yang, Y. Q., Gui, K., and Guo, B.: The two-way feedback effect between aerosol pollution and planetary boundary layer structure on the explosive rise of PM2.5 after the “Ten Statements of Atmosphere” in Beijing, Sci. Total Environ., 709, https://doi.org/10.1016/j.scitotenv.2019.136259, 2020a.
Zhang, Y., Guo, J., Yang, Y., Wang, Y., and Yim, S. H. L.: Vertica wind shear modulates particulate matter pollutions: A perspective from radar wind profiler observations in Beijing, China, Remote Sens., 12, https://doi.org/10.3390/rs12030546, 2020b.
Zhong, J., Zhang, X., Dong, Y., Wang, Y., Liu, C., Wang, J., Zhang, Y., and Che, H.: Feedback effects of boundary-layer meteorological factors on cumulative explosive growth of PM2.5 during winter heavy pollution episodes in Beijing from 2013 to 2016, Atmos. Chem. Phys., 18, 247–258, https://doi.org/10.5194/acp-18-247-2018, 2018.