the Creative Commons Attribution 4.0 License.
the Creative Commons Attribution 4.0 License.
 | 22 Jun 2026
Sodium thiosulfate-coated ceramic denuders for ozone removal in ultrafine particle sampling
Elisabeth Eckenberger
Andreas Mittereder
Nadine Gawlitta
Martin Sklorz
Dieter Brüggemann
Ralf Zimmermann
Anke Christine Nölscher
Ozone (O3) remaining in sampling air can artefactually alter the chemical composition of collected ultrafine particles (UFPs), biasing quantitative analysis of the chemical composition. In this study, we developed and evaluated a sodium-thiosulfate O3 denuder (TSOD) specifically tailored for UFP sampling and assessed its O3 scrubbing efficiency, particle losses, and chemical selectivity. In laboratory tests under controlled relative humidity and inlet O3 levels up to 200 ppbV, the outlet concentration remained consistently below the limit of detection, demonstrating the O3 removal efficiency of the TSOD. During an urban field deployment over 5 d O3 downstream of the TSOD consistently remained below the detection limit while ambient O3 varied between 0 and 65 ppbV. Moreover, for particles with mobility diameters ranging from 10 to 1000 nm, we did not observe any significant losses in particle number concentrations. Using a parallel two-channel UFP sampler (with vs. without upstream TSOD), we quantified O3-driven sampling artefacts in UFP mass focussing on three types of organic markers. (1) Firstly, we targeted polycyclic aromatic hydrocarbons (PAHs), particularly chrysene (Chry), benz[a]anthracene (BaA), benzo[a]pyrene (BaP), indeno[1,2,3-cd]pyrene (IcdP), benzo[k]fluoranthene (BkF), and benzo[b]fluoranthene (BbF). Without upstream O3 removal, the individual concentrations of the PAHs were 15 ± 3 %–46 ± 6 % lower. (2) Secondly, for the tire and road wear marker, the antioxidant N-(1,3-dimethylbutyl)-N′-phenyl-p-phenylenediamine (6PPD) and its oxidation product 6PPD-quinone (6PPDq), we observed in-situ ozonation of 6PPD to 6PPDq with transformation yields of about 13 ± 4 % to 20 ± 8 %. (3) In contrast, biogenic organic acids (bOAs) did not show differences when sampled with or without O3, as their O3 reactivity is much lower than the one of the PAHs. Moreover, this test indicated that the TSOD did not perturb the gas–particle partitioning of these semi-volatile species. Our results demonstrate that the TSOD (i) efficiently scrubs atmospheric O3 at relevant mixing ratios, (ii) does not introduce measurable particle losses across 10–1000 nm, and (iii) preserves semi-volatile partitioning.
- Article
(1355 KB) - Full-text XML
-
Supplement
(623 KB) - BibTeX
- EndNote


Tropospheric ozone (O3) is ubiquitous and highly reactive. Close to the Earth's surface, O3 typically exhibits mixing ratios of up to 80 ppbV, occasionally exceeding 90 ppbV during strong photochemical episodes (Gaudel et al., 2018; Monks et al., 2015). Its tropospheric lifetime is on the order of days to weeks, typically 6–27 d depending on altitude and chemical environment (Prather and Zhu, 2024; Young et al., 2013). O3 can damage leaf tissues, irritate eyes, and harm the respiratory system, making it an air pollutant with short and long-term effects on ecosystems and human health (Emberson, 2020; Zhang et al., 2019). In the atmosphere, O3 reacts with a wide range of atmospheric organic compounds. While being an important oxidant and initiating the oxidative removal of unsaturated organic gaseous molecules, O3 poses a challenge in sampling when these O3-reactive molecules are targeted in the chemical analysis (Ernle et al., 2023; Monks et al., 2015). If O3 remains in the sampling air, it can continue to react with other atmospheric compounds bearing O3-reactive unsaturated functional groups during the collection, thus leading to sampling artefacts. Such O3-induced artefacts have been long recognized in atmospheric science and especially aerosol sampling (Balducci et al., 2018; Grosjean, 1992; Van Vaeck and Van Cauwenberghe, 1984). In filter-based aerosol samplers, particles often reside on filters from several hours up to several days, providing enough time to react with O3 of the sampling air streaming through filters and already collected particles (World Meteorological Organization (WMO), 2023). Consequently, collected particles may undergo oxidative reactions with O3, resulting in distortion of their chemical composition.
To mitigate O3-induced sampling artefacts, upstream O3 denuders or scrubbers are recommended for the sampling of particulate matter (e.g. PM2.5 and PM10) by regulatory standards such as CEN EN 15549:2008. Particularly for O3-reactive species like PAH (European Committee for Standardization (CEN), 2008), those denuders are used to remove O3 from the sampling air stream and thereby prevent O3 induced reactions on the filters before analysis.
There are different materials which have been deployed in O3 denuders, which offer various mechanisms to scrub O3 (Fick et al., 2001). Common approaches include potassium iodide (KI) coatings, manganese dioxide (MnO2) catalysts, activated carbon (charcoal) adsorbents, silver-coated surfaces, and sodium thiosulfate (Na2S2O3) impregnation (Ernle et al., 2023; Fick et al., 2001; Liu et al., 2014; Williams and Grosjean, 1990).
KI based denuders remove O3 via stoichiometric redox reactions, thereby iodide oxidation products are generated. But the release of those reactive by-products such as I2 and OH−, could interact with the atmospheric samples. For example, iodinated compounds and hydroxide from KI based O3 scrubbers have been shown to degrade derivatization agents that might be used during the extraction procedure, and introduce secondary artefacts in sampling of carbonylic compounds (Ho et al., 2013). MnO2-coated denuders function via catalytic O3 removal and have proven to prevent O3 induced reactions of organic marker compounds in particulate matter. Yet, studies showed that the strong oxidizing surface of the MnO2 coated denuders itself can react with components of the sampling air. In particular, while the use of a MnO2 denuder prevented the loss of particle-bound PAH during sampling, it also led to degradation of some PAH and concurrent formation of oxygenated PAH on the denuder surface (Liu et al., 2006). Activated carbon and silver traps offer broad O3 removal through adsorption or catalysis, but these materials are relatively non-selective and thus may adsorb other gas-phase species or alter trace constituents in the sampling air (Fick et al., 2001; Helmig and Greenberg, 1995; Liffick, 1970). In contrast, Na2S2O3 offers a well-characterized stoichiometric reaction with O3 yielding in unreactive inorganic products.
Thiosulfate reacts with O3 via stepwise oxidation, yielding tetrathionate and, under excess O3, sulfate as stable products. The reaction effectively removes O3 without generating gaseous radical by-products (Reaction R1, Takizawa et al., 1973):
Na2S2O3 coated denuders (TSOD) have been successfully employed in gas-phase sampling to protect analytes (e.g. volatile organic compounds, VOC, such as terpenoids and carbonyls) from O3 reactions. In one comparative study, both KI and Na2S2O3 O3 filters achieved > 90 % removal efficiency for about 50 ppbV O3, although KI showed slightly higher performance and less humidity sensitivity. For Na2S2O3, O3 removal increases with relative humidity (RH) and declines in very dry air, while robust elimination is obtained at ∼ 50 %–80 % RH (Rynek et al., 2025). Crucially, unlike KI, the thiosulfate method does not introduce organic reactive by-products, offering a potential advantage for preserving the organic composition of particle samples (Fick et al., 2001). Despite that, sodium thiosulfate O3 denuders have seen little application in particulate-matter sampling compared with established O3-denuders to date, and their performance in that context remains largely unexplored.
This knowledge gap is particularly relevant for ultrafine particles (UFPs, diameter < 100 nm), which are of special interest due to their many, diverse sources and health implications (Balmes and Hansel, 2024; Haddad et al., 2024; Li et al., 2023; Marval and Tronville, 2022). Among others, UFPs distinguish from coarser particles because of their small mass, high number concentration and high surface-area-to-mass ratio and high diffusional mobility. Thus, UFPs can readily adsorb gases, like O3 and other oxidants, and undergo rapid surface chemistry. These properties not only facilitate heterogeneous reactions, altering particle composition, but also influences toxicological behaviour (Kwon et al., 2020; Oberdörster et al., 1992).
A particularly relevant example is the enrichment of polycyclic aromatic hydrocarbons (PAH) in UFPs. PAH are ubiquitous environmental pollutants originating from anthropogenic activities such as biomass burning and fossil fuel combustion (Abdel-Shafy and Mansour, 2016). They are of concern due to their persistence, potential for long-range transport, and the formation of toxic transformation products in the atmosphere (Ravindra et al., 2008). Their atmospheric lifetime and toxicity profiles are governed by multiphase oxidation pathways involving gas-phase radicals and O3. Among others, the higher-molecular-weight PAH (≥ 5 rings; benzo[a]pyrene (BaP), benzo[b]fluoranthene (BbF), benzo[k]fluoranthene (BkF), indeno[1,2,3-cd]pyrene (IcdP), together with four-ring PAHs such as chrysene (Chry) and benz[a]anthracene (BaA), are known to undergo heterogeneous ozonolysis on particle surfaces, especially under conditions of elevated O3 exposure (Ji et al., 2024).
Another prominent example is N-(1,3-dimethylbutyl)-N′-phenyl-p-phenylenediamine (6PPD), a widely used tire antiozonant that protects rubber surfaces through reactive scavenging of O3. During tire wear, 6PPD is released into the environment and oxidized via O3 to 6PPD-quinone (6PPDq). This transformation product has recently shown to exhibit acute aquatic toxicity, particularly toward coho salmon (Hu et al., 2022; Zhao et al., 2023).
A further compound class of interest are biogenic organic acids (bOAs), secondary oxidation products of monoterpenes that serve as markers for biogenic secondary organic aerosol (SOA) formation and ageing (Christoffersen et al., 1998; Denjean et al., 2015; Mutzel et al., 2016). This includes pinic acid (PA), pinonic acid (POA), terpenylic acid (TPA), and terebic acid (TA), which span a broad range of volatility: while PA is mainly particle-bound, POA, TPA, and TA remain partly in the gas phase (Kristensen et al., 2016a; Yu et al., 1999). Because of their semi-volatile nature, non-specific adsorption of gas-phase bOAs or disturbance of the gas–particle equilibrium are known artefact pathways in denuder-based sampling, which can alter the measured particle-phase concentrations (Subramanian et al., 2004; Yatavelli et al., 2014, 2012). This issue is particularly relevant for UFP sampling, where the high surface-area-to-mass ratio enhances adsorption and desorption processes and thus amplifies potential denuder artefacts (Kristensen et al., 2016b; Kuwabara et al., 2016; Shiraiwa et al., 2011).
Given the emerging significance of UFPs as important contributors to air pollution in atmospheric chemistry and human health, being linked to oxidative stress, respiratory and cardiovascular diseases (Das et al., 2024; Pantzke et al., 2023), such artefacts can bias the interpretation of UFP chemical composition and reactivity, underscoring the need for artefact-free sampling when assessing their environmental and health relevance (Schraufnagel, 2020).
To address this, we designed a study combining laboratory and field experiments to assess the performance of TSOD for UFP composition analysis under controlled and ambient conditions. Specifically, we focused on three representative classes of marker compounds: (1) PAHs to quantify O3-induced losses; (2) tire-derived N-(1,3-dimethylbutyl)-N′-phenyl-p-phenylenediamine (6PPD) and its quinone (6PPDq) as a parent–product pair indicative of in-sampler ozonation; and (3) biogenic organic acids (bOAs) to test the selectivity and potential disturbance of gas–particle equilibrium.
2.1 O3 denuder preparation
As O3 denuder body, we used ceramic bodies (Ø 25.4 × 50 mm; squared channels with 400 cells per square inch, Rauschert, Germany) that were impregnated with Na2S2O3 (Merck, 99 %). Before coating the ceramic bodies, they were heated to 500 °C for 5 h, then cleaned in water (H2O, obtained from Seralpur PRO 90 CN system with Supor DCF filter, Electronics Grade, 0.2 µm), subjecting them to ultrasonication for two cycles, each for 10 min. Subsequently, the bodies were manually dried with vigorous shaking to remove bulk water from the honeycomb channels. Next, the bodies were placed in a 5.6 mol L−1 solution of Na2S2O3 and H2O, and ultrasonicated for an additional 10 min. After ultrasonic impregnation, excess solution was removed by vigorous shaking while holding the monolith vertically to allow drainage of bulk liquid from the honeycomb channels. Afterwards, bulk solution within the channels, which was not removed by shaking, was blow-dried with nitrogen (N2, 99.99 %). This was a critical step to prevent the growth of crystals within the ceramic matrix and the subsequent occlusion of the channels. The drying process was finished by baking the TSODs at a temperature of 120 °C for a duration of 60 min. For equilibration, the TSODs were placed in a sealed container with a separate water reservoir at the base to maintain a high humidity environment. This setup was left to rest overnight, for 12 h, to achieve an even coating of Na2S2O3 on the ceramic body. Afterwards the TSODs were stored under N2 atmosphere in a closed glass vessel.
2.2 Laboratory test-bed for determining the denuder efficiency for O3 removal under controlled conditions
To assess the O3 removal efficiency of the TSODs, we set up an experimental test-bed in the laboratory. O3 was produced in variable levels with a generator (Teledyne, T750U), diluted with zero air at a flow rate of 4 L min−1 , and passed through the TSOD. Upstream of the TSOD, humidified air was added to the sample flow by bubbling 4 L min−1 of zero air through a suction flask filled with H2O, yielding a total flow of 8 L min−1 through the TSOD (Fig. 1a). We measured the RH upstream of the TSOD, which remained constant at about 50 %. Downstream of the TSODs, the O3 mixing ratio was measured using an O3-analyzer (Thermo Scientific, MLU, Model 49i). We tested the TSOD over an O3 mixing ratio range of 5 to 200 ppbV. To assess the practical zero-level response of the instrument, separate zero-air measurements were performed, yielding an analyzer signal of 4.6 ± 0.5 ppbV under O3-free conditions. The variability of this baseline signal resulted in a limit of detection (LOD) of 1.5 ppb, calculated as three times the standard deviation of the zero-air measurements (k = 3).
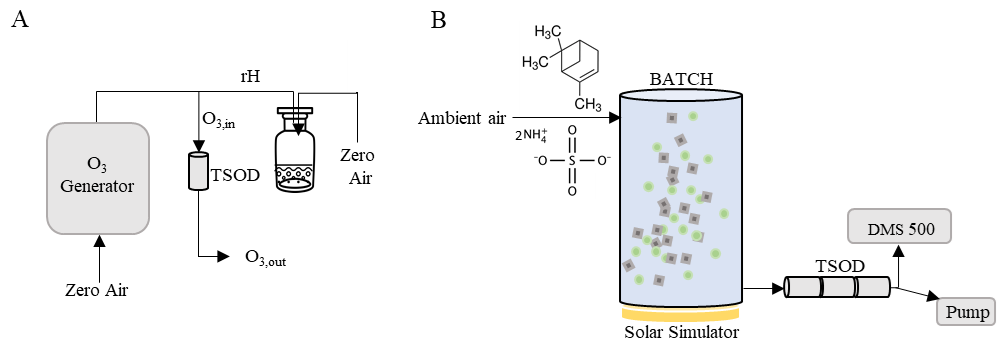
Figure 1Schematic of the laboratory test-bed for assessing the O3 removal efficiency (A) and potential particle losses of TSODs (B). (A) O3 was generated, diluted with zero air, humidified to ∼ 50 % relative humidity, and passed through the TSOD. Downstream O3 mixing ratios were measured using an O3 analyzer. (B) For particle loss tests, the setup was connected to the BATCH, where SimOA was generated from α-pinene oxidation with ammonium sulfate seed particles and ambient air. The aerosol flow was directed through three TSODs, and particle size distributions were measured downstream using a DMS500.
2.3 Assessment of particle losses within the O3 denuder
To examine potential particle losses due to the TSOD, we conducted loss tests with simulated atmospheric organic aerosol (SimOA) using the Bayreuth Atmospheric simulation Chambers (BATCH). To maintain a stable aerosol mixture for several hours, we flushed the 700 L cylindrical glass chamber with ambient air for several hours. Subsequently, 0.05 mL of alpha-pinene (≥ 98,0 %, Carl Roth) was injected into the airflow, while a nebulizer delivered seed particles (from spraying saturated ammonium sulfate solution and drying) into the chamber at a flow rate of 3 L min−1 for 3 min. After an additional 5 min, the pump supplying ambient air was switched off, and the solar simulator (UV Osram HMI, 4000 W, filtered with a water-cooled glass plate) (Ofner et al., 2011; Zhao et al., 2008), was ignited for 15 min to produce first O3 and subsequently SimOA. We connected three TSOD bodies in line to the chamber. Downstream the TSOD, a Y-connector was attached splitting the flow into two channels. One channel end led to a pump which allowed to adjust to variable flows through the denuder (4–30 L min−1). The other channel end led to a particle size spectrometer to record the particle size distribution after the TSOD (Cambustion, DMS500). As a control, the setup was also operated without the TSOD installed in the stainless-steel cylinders.
2.4 Field deployment and UFP sampling for offline chemical characterization
To evaluate the performance of the TSOD under real environmental conditions, a novel setup was installed in a measurement container at an urban field site of the University of Applied Sciences in Augsburg, Germany (48.358° N, 10.907° E) in September 2023. The site is dominated by domestic heating and traffic which are likely sources for PAH and 6PPD/6PPDq. Streetside and campus vegetation emitted monoterpenes, providing biogenic precursors for SOA. Air was drawn through a PM10 sample inlet from the roof of the air-conditioned container at a height of 4.2 m. A stainless-steel sampling tube (2.1 m × 28 mm) led into the container, where it was connected to a modified 120 R Microorifice Uniform Deposit Impactor (MOUDI, TSI). The 120R-MOUDI was reduced to sample with cut-off sizes of 2.5, 1.0, and 0.1 µm. The impactor plates were coated with high-vacuum grease to minimize bounce effects. Behind the reduced MOUDI unit, the After Filter Stage, intended to collect particles smaller than 0.1 µm, was omitted, and instead, a Y-connector (30 cm × 28 mm) was installed, leading to an automated filter changer (HYDRA Dual Sampler, FAI instruments), thereby introducing a two-channel filter collector. Here, UFP samples were collected from both channels in parallel on pre-baked quartz fiber filters (47 mm Whatman, QM-A) and, following a weekly change, stored at −20 °C in Analyslides (Cytiva) until analysis. In one of these channels (Channel A), the TSOD was installed, while the other channel (Channel B) was operated with an uncoated ceramic body as reference (Figs. S1 and S2 in the Supplement). For control measurements, both channels were operated with a ceramic body without coating. The total flow through the impactor was set to 30 L min−1 according to the manufacturer's specifications, with a corresponding collection of 15 L min−1 per channel. Ambient O3 mixing ratios were measured after channel A (41M, UV Photometric O3 analyzer, ansyco, Environnement S.A.) and cross-checked against values reported by the local governmental monitoring station (Landesamt für Umwelt, LfU). This field setup was intended to serve (i) as assessment of the O3 removal efficiency under real-world conditions over a longer time period, and (ii) the effect of O3 removal during collection of UFP samples for subsequent offline chemical analysis.
2.5 Chemical marker compounds
UFP samples obtained during the field campaign were analyzed offline to investigate the effect of upstream O3 removal via TSOD on the concentrations of selected organic marker compounds. The following target compounds were analyzed: (i) PAHs: BaP, BbF, BkF, IcdP, Chry, and BaA; (ii) parent–product (ozonolysis) pair: 6PPD and 6PPDq; and (iii) bOAs: PA, POA, TPA, and TA. Internal standards were 3-methylcholanthrene (3-MC, Merck, 98.0 %, 0.4 µM) and nicotinic acid (NA, Merck, 99.5 %, 10 µM). Reagents, solvents, and standards were sourced from LGC Standards, Merck, Carl Roth, ASCA-Berlin, and Fisher Chemical (purities > 95 %–99.99 %). HPLC-grade acetonitrile (ACN, 99.95 %), methanol (MeOH, 99.99 %), water (H2O; Seralpur PRO 90 CN, electronics grade, 0.2 µm), and formic acid (HCOOH, ≥ 98 %) were used as mobile-phase components; dichloromethane (DCM, 99.8 %) and high-purity nitrogen (N2, 99.999 %) were used for extraction/solvent handling and evaporation.
2.6 Extraction
We extracted the selected marker components from the filters via a soft, solvent-based and optimized protocol: (1) the filter loaded with particles was divided into two equal parts. One part was extracted, the other one used as backup. (2) The filter-half for extraction, was spiked with 50 µL of each internal standard, namely 3-methylcholanthrene (3-MC, 0.4 µM) and Nicotinic acid (NA, 10 µM) and cut into small fragments. (3) These filter fragments were then transferred into a glass container with a screw cap, and 2 mL of extraction solvent (e.g. analytical-grade dichloromethane (DCM, Fisher Chemical, 99.8 %) and methanol (MeOH, Carl Roth, ≥ 99.9 %)) were introduced. (4) The samples underwent extraction through agitation within a closed flask for a duration of 15 min using a vortex shaker (2000 rpm). (5) Filter residues were kept in the glass container. Extracts were filtered using custom-designed glass frits with a diameter of 1 cm and a pore size of 20 µm to filter any potential filter residue.
Steps (3) to (5) were repeated three times, each time employing a different extraction solvent. The sequential solvents used were, in order, pure MeOH, 50 : 50 MeOH : DCM, and pure DCM. Subsequently, the solvent from the combined extracts was evaporated under a gentle flow of nitrogen while cooled with ice to avoid loss of semi-volatile compounds. A droplet was kept as residue which was dissolved in 1 mL of a 60 : 40 solution of acetonitrile (ACN, Carl Roth, 99.95 %) and Millipore water (H2O obtained from Seralpur PRO 90 CN system with Supor DCF filter, Electronics Grade, 0.2 µm). This was transferred into two separate vials for subsequent analysis. Throughout this entire sample preparation process, the samples were consistently stored in an ice cooled environment to avoid losses.
2.7 HPLC methods
The extracts of the collected UFPs were analyzed using two complementary high-performance liquid chromatography (HPLC) systems, adapted to the specific analytical requirements of the target compounds. PAHs were quantified using an Agilent 1260 Infinity system equipped with a fluorescence detector (Agilent 1100 Series FLD). bOAs and tire-derived antioxidants, including 6PPD and its transformation product 6PPDq, were analyzed on an Agilent 1100 Series HPLC coupled to an electrospray ionization mass spectrometer (ESI-MS; Agilent 6130 Single Quadrupole).
All analyses were conducted using HPLC-grade solvents: acetonitrile, ultrapure water, and formic acid (≥ 98 %, Carl Roth). Chromatographic separation and detection settings were optimized for each compound class. A detailed summary of the applied methods is provided in our previous publication and in the Supplement (Eckenberger et al., 2025; Table S1).
To assess the overall analytical recovery, spiking experiments were performed in triplicate. One half of a pre-baked quartz fiber filter (47 mm, Whatman QM-H) was spiked with 10 µL of a 10 µM standard solution containing all target compounds and subsequently extracted following the same procedure used for ambient samples. Recoveries were calculated using external calibration and expressed as the ratio of measured to expected concentrations:
Average recoveries ranged from 70 % to 101 % and were consistent across compound classes. Specifically, recoveries for PAHs were 78 ± 5 % for BaP, 74 ± 4 % for BbF, 89 ± 6 % for BkF, 70 ± 4 % for IcdP, and 97 ± 5 % for ∑(Chry + BaA). 6PPD and its transformation product 6PPDq yielded recoveries of 75 ± 7 % and 81 ± 7 %, respectively. Among the bOAs, PA was recovered at 84 ± 6 %, while POA, TA, and TPA showed recoveries of 101 ± 6 %, 85 ± 6 %, and 96 ± 6 %, respectively. Uncertainties represent 1σ standard deviations (SD) obtained from triplicate spiking experiments.
To account for analyte-specific losses, all sample concentrations were corrected for recovery using the following equation:
Validation of the analytical procedure was performed using the NIST Standard Reference Material SRM 2786 (Fine Atmospheric Particulate matter with mean diameter < 4 µm), which was applied to a quartz filter and processed identically to the environmental samples. Specifically, 107 ± 4 % of the certified BaP concentration was recovered. BbF, BkF, ∑(Chry + BaA), and IcdP showed recoveries of 96 ± 5 %, 94 ± 7 %, 89 ± 5 %, and 99 ± 7 %, respectively. The results agreed with the certified concentrations within their stated uncertainty, confirming the reliability of the method even in the presence of a complex particulate matrix. Limits of detection (LOD) were determined for each compound from four replicate injections of a diluted calibration standard, targeting a signal-to-noise ratio of 3. The LOD was calculated as:
where σ is the standard deviation of replicate peak areas and RF denotes the compound-specific response factor derived from external calibration. For comparison with ambient concentrations, airborne detection limits LODAir were calculated by normalizing the LOD to the sampling volume (Table S2).
Instrument and field blanks were routinely collected and processed alongside samples using the identical preparation. Instrument blanks consisted of pure-solvent injections between runs. Field filter blanks were prepared by placing clean quartz filters in the sampler holders but without drawing air. Blank signals were subtracted on a per-compound basis when reproducible across replicate blanks and clearly below sample signals. If blank values varied strongly within a batch or exceeded expected background levels, affected samples were excluded from further analysis.
Last step to calculate mass concentrations of the marker compounds in UFPs was to convert the blank-corrected extract concentrations to air concentrations by multiplying the corrected concentration by the final extract volume (1 mL), correcting for recovery and the analyzed filter fraction (only half filter was analyzed), and normalizing to the sampled air volume (21.6 m3).
3.1 Laboratory evaluation of denuder performance
To evaluate the O3 removal efficiency of the TSOD under controlled conditions, we first conducted a laboratory test. Previous studies have shown that RH plays a critical role in the reactivity of sodium thiosulfate toward O3 (Ernle et al., 2023). Specifically, at 80 % RH, the lifetime of the sodium thiosulfate scrubber increases dramatically, enabling complete O3 removal from the sample air, in contrast to its performance under dry conditions. As a reference for typical ambient conditions at our field site in Augsburg, daily data from the nearest German Weather Service (Deutscher Wetterdienst, DWD) climate station for the meteorological summer 2023 yield an average RH of 69 % ± 11 % (Data source: DWD). We therefore intentionally conducted our laboratory experiments under distinctly drier conditions (reported as RH = 52.4 %–53.3 %), in order to test TSOD performance near the lower end of the humidity range expected during field operation. Previous studies indicate that thiosulfate-based ozone removal decreases under drier conditions, consistent with reduced water availability at the denuder surface (Ernle et al., 2023; Rynek et al., 2025).
In urban and suburban environments, O3 levels frequently peak between 70 and 100 ppbV and can surpass 120 ppbV during intense pollution events (Bell et al., 2007; Cooper et al., 2014; World Health Organization, 2021). Thus, the inlet O3 mixing ratio was incrementally increased to up to 200 ppbV in a sequence of discrete measurement intervals. As depicted in Fig. 2, the outlet O3 mixing ratios (4.4–5.0 ppbV) were indistinguishable from this zero-air baseline, indicating that ozone downstream of the denuder was below the LOD of the measurement setup.
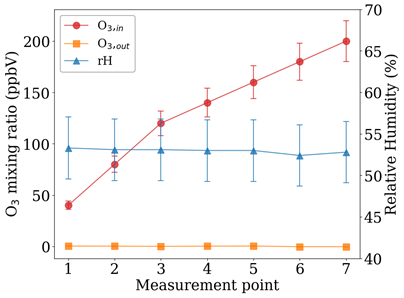
Figure 2Average O3 mixing ratios upstream (“O3, in”, red) and downstream (“O3, out”, orange) of the TSOD during consecutive laboratory measurement intervals with stepwise increasing inlet O3 mixing ratios (40–200 ppbV). RH was simultaneously monitored and remained constant. Lines are included to guide the eye.
This indicates that, even at comparably high mixing ratios, O3 was removed from the air in this experimental setup. However, it is important to note that this experiment was conducted under controlled laboratory conditions with constant temperatures, RH, and zero air. Furthermore, the duration of the experiment does not match the typical collection duration required for UFPs, which, due to their low mass, must be collected over several hours or days for mass-based chemical analysis. To complement the controlled laboratory evaluation, a field deployment was conducted to assess the TSOD's applicability under real-world sampling conditions. The results of this field implementation, including performance under ambient O3 exposure and implications for UFP sampling, are discussed in detail in Sect. 3.2.
To assess if the sampling flow channelled through the TSOD is associated with particle losses, we compared particle number concentrations (PNC) measured with (wTSOD) and without (woTSOD) TSOD installed, where the woTSOD setup served as the reference using an empty TSOD housing. The analysis was performed for two particle size ranges: 10–100 and 10–1000 nm. All measurements were repeated at three flow rates (4, 11, and 30 L min−1), and an instrument uncertainty of 10 % was assumed. In the 10–100 nm range, relative differences between the wTSOD and woTSOD configurations ranged from 2 % to 7 % depending on the flow rate. At 4 L min−1, the difference corresponded to a 2 % loss, increasing to 7 %, and 6 % at 11 and 30 L min−1, respectively. Comparable results were obtained for the full-size spectrum (10–1000 nm). Measured losses amounted to 7 % (4 L min−1), 3 % (11 L min−1), and 6 % (30 L min−1) (Fig. 3).
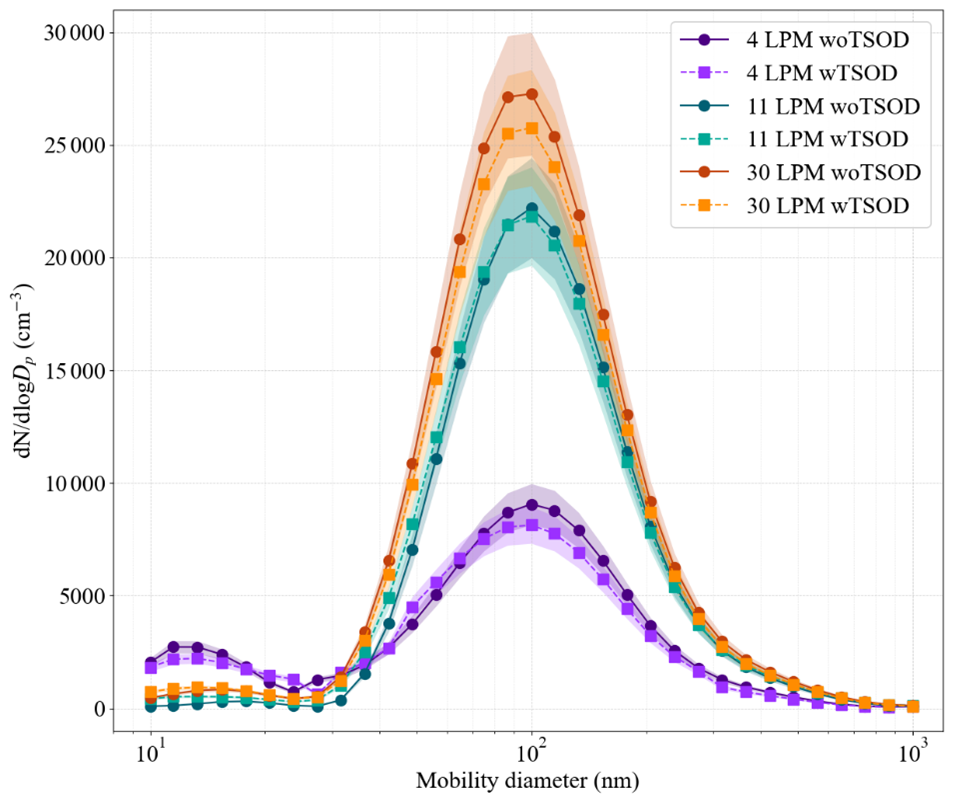
Figure 3Particle size distributions recorded downstream of the TSOD and for reference without a TSOD at three different flow rates (4, 11, and 30 L min−1). Purple tones refer to 4 L min−1 (light purple: wTSOD, dark purple: woTSOD), green tones to 11 L min−1 (medium green: wTSOD, dark green: woTSOD), and orange tones to 30 L min−1 (orange: wTSOD, dark orange: woTSOD). Shaded areas represent ±10 % uncertainty.
The average observed deviation between the wTSOD and woTSOD measurements was 5 % and falls within the measurement uncertainty of the particle size spectrometer utilized. Hence, we found no significant losses in particle number concentrations and the TSOD setup can be considered suitable for ambient UFP sampling. Since the measurements at 30, 11, and 4 L min−1 were conducted sequentially, the absolute particle number concentrations between the different flow-rate experiments vary and are not directly comparable.
3.2 Field performance of the denuder and chemical composition of UFPs
The O3 removal performance of the TSOD was further evaluated under ambient conditions during a five-day deployment at an urban field site. Due to the lack of a second O3 analyzer, the experiments were conducted using only one device. Initially, measurements were taken with the O3 analyzer without the installed coated ceramic body. Subsequently, these measurement results were compared with publicly available data on O3 mixing ratios from a nearby site monitored by the Bavarian Environment Agency (Bayerisches Landesamt für Umwelt (LfU), 2025).
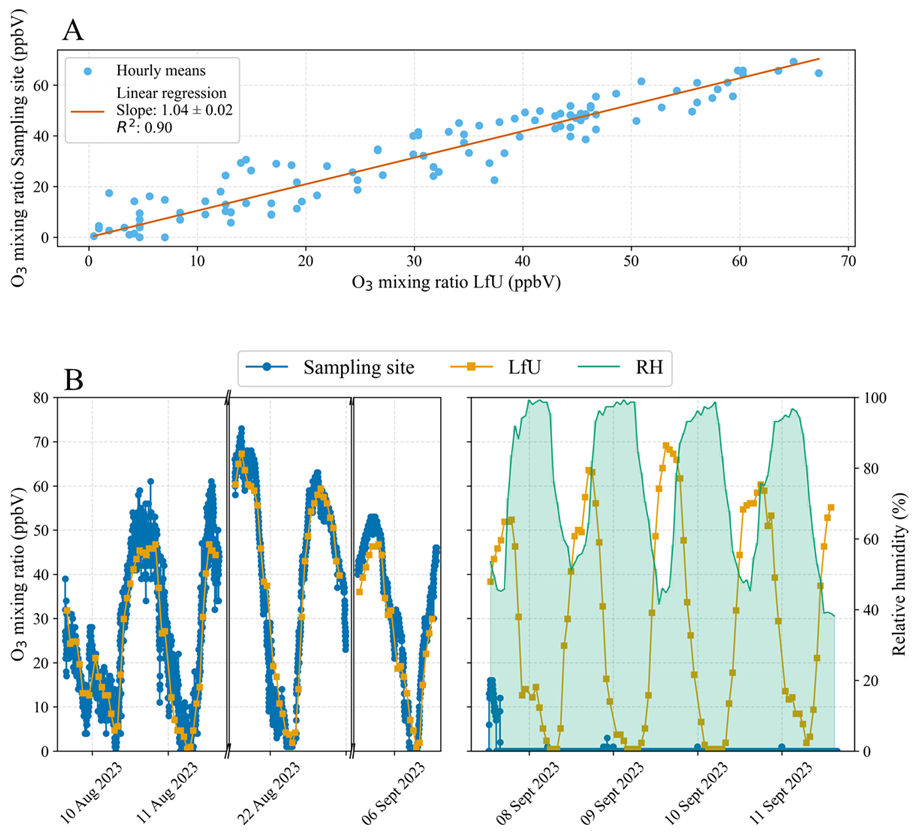
Figure 4(A) Correlation between hourly averaged O3 mixing ratios from the sampling site and the LfU monitoring station. A linear regression through the origin (red line) yields a slope of 1.04 and R2 = 0.90. (B) Time line of ambient O3 mixing ratios before and during the field campaign in Augsburg. Measurements before the campaign were taken from a setup without a TSOD, allowing comparison with reference data from the LfU monitoring station. After the start of UFP sampling, measurements were taken downstream of the TSOD (blue, “Sampling site”) and compared to the LfU reference data (orange, “LfU”).
The hourly averaged data are compared in Fig. 4a. A linear regression yielded a slope of 1.04 and a coefficient of determination (R2) of 0.90, confirming the comparability of both datasets within the uncertainty of the measurement. The near-unity slope indicates that the inlet, impactor, hose system, and uncoated denuder did not cause substantial systematic O3 losses under the field conditions. Therefore, no correction was applied to either dataset before subsequent analysis. During the period when a TSOD, in channel A of the measurement setup, was installed, the O3 mixing ratio behind the TSOD was consistently measured. In comparison to the measurements from the Bavarian Environment Agency, it was observed that the O3 mixing ratio behind the TSOD remained below the LOD, while the outdoor O3 mixing ratios fluctuated between 0 and 65 ppbV (Fig. 4b). Over the period of 5 d, the TSOD removed O3 reliably from the sampled air. These results indicate the O3 removal efficiency of the TSOD under environmental conditions and over an extended time period.
Chemical organic tracer analysis of UFPs
To assess the efficiency and selectivity of the TSOD under ambient conditions, we evaluated changes in particle-phase concentrations of selected organic tracer compounds. We analyzed representative compounds from three organic marker groups: PAHs, 6PPD and 6PPDq, and bOAs. All compounds are potentially susceptible to TSOD-induced sampling improvements or artefacts. This could be either by prevented degradation through O3 oxidation or by shifts in gas-particle partitioning through removal of gaseous components. In the following, we present compound-specific mass concentrations measured in Channel A (with O3 removal via TSOD) and Channel B (without O3 removal comparing to an uncoated ceramic body). We assess the TSOD performance for each class of marker compounds.
First, to verify the performance and internal consistency of the dual-channel sampling setup, all targeted marker substances were analyzed under reference conditions in which neither sampling line contained an upstream-coated ceramic body. The measured mass concentrations of all compounds in UFPs sampled through Channel A and Channel B agreed within the uncertainties. Regression slopes were close to unity for PAHs (BaP: 0.97, BkF: 0.83, BbF: 1.18, IcdP: 1.05, ∑(Chry + BaA): 0.92), demonstrating the absence of systematic differences between the two channels. Similarly, mass concentrations of 6PPD (slope = 1.01) and 6PPDq (slope = 1.04) and the bOAs, including PA (slope = 1.00), POA (slope = 0.94), TA (slope = 1.003), and TPA (slope = 1.010) were comparable for both channels (Table 1). Detailed regression plots are provided in the Supplement (Fig. S2).
Table 1Linear regression slopes of marker compound concentrations between the two sampling channels during operation with ozone removal (TSOD installed in Channel A). For comparison, slopes obtained during reference operation, when both channels were equipped with uncoated ceramic bodies, are also shown (Reference, Fig. S3). Slopes were derived from linear regressions constrained through the origin. Values greater or smaller than unity indicate enhancement or loss of the respective compound in the presence of O3 removal.
Deploying the TSOD in Channel A and regressing concentrations in Channel B (no O3 removal) against Channel A provides a direct quantitative analysis of O3 induced sampling artefacts. For PAHs, slopes of 0.54–0.85 (BaP: 0.60, BkF: 0.85, BbF: 0.66, ∑(Chry + BaA): 0.54, IcdP: 0.62; Table 1) indicate about 15 % to 46 % in-sampler losses when O3 is present (Fig. 5a). For context, ambient BaP was on the order of about 9 pg m−3 with the deployment of a TSOD, without O3 removal this would be 40 % lower. In contrast, 6PPD and its oxidation product 6PPDq show opposite behaviour (Fig. 5b, Table 1): 6PPD exhibits a slope of 0.52, indicating underestimation without O3 removal, whereas 6PPDq shows a slope of 1.40, reflecting overestimation due to in-sampler ozonolysis. These findings are consistent with the oxidative conversion of 6PPD to 6PPDq, which is suppressed in-situ when O3 is scrubbed from the sampling air. Mechanistic and computational studies have shown that O3 attacks the aromatic amine moiety of 6PPD, forming hydroxylated intermediates that subsequently oxidize to 6PPDq as the major transformation product (Cataldo, 2019; Rossomme et al., 2023; Zhao et al., 2023). In our dual-channel approach, we find that about 13 % to 20 % of the initial 6PPD was converted to 6PPDq. These transformation yields align with those reported by Zhao et al. (2023), who reported that 1 %–19 % of 6PPD was converted to 6PPDq during controlled ozonation of 6PPD.
Figure 5Comparison of analyte concentrations measured in sampling channel A (with TSOD, O3 removed) and channel B (without TSOD, O3 present). The sample in channel B was exposed to ambient O3 mixing ratios during the 24 h sampling interval. Each data point represents the mass concentration of an analyte measured in parallel filters. Dashed lines show linear regressions constrained through the origin, while grey dashed lines represent the 1 : 1 relationship. (a) PAHs: BaP, BbF, BkF, IcdP, and . (b) Tire wear antioxidants and their transformation product: 6PPD and 6PPDq. (c) bOA: PA, POA, TPA, and TA. The standard deviation used for the error bars is derived from three replicate measurements of three extracted filter samples.
Conversely, bOAs exhibited negligible inter-channel differences (slopes about 0.95 to 1.09, Fig. 5c, Table 1), indicating that the TSOD effectively removes O3 without perturbing gas–particle partitioning. Given their semi-volatile nature, any non-selective uptake or release by the TSOD would shift this equilibrium and drive evaporation or condensation, which is not observed (Kristensen et al., 2016a; Yu et al., 1999). This indicates that the sodium thiosulfate coating does not disturb gas-particle equilibrium.
Among the PAHs, the most pronounced O3 related losses were observed for the (46 %) and for BaP (40 %), followed by IcdP (38 %), BkF (34 %), and BbF (15 %). These losses observed in the UFP fraction are consistent with sampling artefact studies focusing on O3 related degradation in larger particle fractions.
For PM10, Balducci et al. (2018) reported summer field BaP concentrations of about 0.022 to 0.028 ng m−3 and, in laboratory tests at 400 ppbV O3 for 1–3 h, observed BaP losses of ∼ 24 %–55 % (with smaller losses for BbF and BkF). Similarly, Liu et al. (2006) reported daily O3 concentrations of 50–95 µg m−3 (≈ 25–48 ppbV at 290 K) and deployed a MnO2 denuder into PM7 sampling. The observed concentrations for particulate PAH rose from 0.16 to 0.20 ng m−3 (+25 %) for BaP and shifts for BaA (−7 %), chrysene (−14 %), and IcdP (+6 %), while BbF remained unchanged upon the removal of O3. Consistently, the study of Liu et al. (2014) in Beijing summer showed averaged O3 concentrations of 74.6 µg m−3 (∼ 37 ppbV). They sampled PM2.5 with a denuder-equipped method, which yielded higher particulate PAH concentrations than the conventional setup (Σ9PAH = 42.3 ± 10.5 vs. 27.1 ± 13.8 ng m−3), and for BaP a corresponding underestimation from 49 % to 83 % without O3 removal. While inter-channel artifacts such as gas-particle partitioning (“blow-on” or “blow-off”) might occur, our control measurements showed no inter-channel bias in the absence of the TSOD. Therefore, we conclude that the observed differences are primarily driven by O3-induced chemical transformation of particle-bound PAHs in the channel without the denuder.
To contextualize the relative O3-induced artefacts, we compared them with the heterogeneous pseudo–first-order rate constants (k′) for O3 loss of particle-bound PAHs reported by Bedjanian and Nguyen, (2010). In this study, soot from a premixed kerosene–air flame was exposed to an initial O3 of 1.3 × 10¹² molec. cm−3 (≈ 51.4 ppbV at 290 K) under dry, dark flow conditions. Figure 6 shows that our observed UFP degradation pattern generally follows the compound-specific reactivities described by Bedjanian and Nguyen (2010). Consistently with those compound-specific reactivities, our degradation pattern largely follows ∑(Chry + BaA) > BaP > BkF. Quantitatively, ∑(Chry + BaA) shows the highest k′ (7.3 × 10⁻³ s−1), followed by BaP (6.8 × 10⁻³ s−1) and BkF (6.0 × 10⁻³ s−1). BbF has a comparable k′ (5.5 × 10⁻³ s−1), about 80 % of BaP, yet its O3-related loss in our data is only ∼ 40 % of BaP. This discrepancy likely reflects particle-phase microphysics, specifically the partial embedding or molecular shielding within condensed organic matrices. These structural factors inherently reduce the effective surface accessibility of certain PAHs (Kwamena et al., 2007; Shiraiwa et al., 2011; Zhou et al., 2019). Furthermore, the elevated RH during sampling (74 %–84 %) may have further enhanced this effect, by increasing particle viscosity or forming hydrated amorphous surface layers which can act as transient diffusion barriers (Pöschl et al., 2001). Consequently, while the relative ranking of O3 susceptibility among PAHs in UFPs is preserved, the overall magnitude of degradation is likely strongly influenced by particle-phase microphysics. This distinction underscores the critical importance of integrating such particle-phase effects when extrapolating laboratory kinetic data to realistic atmospheric conditions.
Figure 6Compound-specific comparison of O3 induced losses of particle-bound PAH. Blue bars (left axis) show the O3-attributable loss fraction from this study (1 – slope of the O3-contrast regression). Red symbols (right axis) show first-order consumption rate constants k′ (× 10−3 s−1) from Bedjanian and Nguyen (2010) for soot exposed to [O3]0 = 1.3 × 10¹² molec. cm−3 at 290 K; red vertical whiskers indicate their reported variability. The red dashed lines simply connect compounds to guide the eye. “n.d.” = no k′ reported (IcdP).
This study demonstrates the development and evaluation of a TSOD adapted for UFP sampling. Under controlled laboratory conditions, the TSOD removed O3 effectively for O3 mixing ratios of up to 200 ppbV and constant RH of 53 %. The same was observed during a 5 d field campaign, with varying ambient O3 mixing ratios (0–65 ppbV) and RH (38 %–99 %). No significant particle losses were observed in the 10–100 and 10–1000 nm range across various flow rates, with relative average deviation of 5 %, remaining within instrumental uncertainty.
Utilizing a dual-channel approach, we compared the impact of upstream O3 removal prior to filter based analysis of mass concentrations of selected UFP-bound marker compounds of diverse chemical properties and of well-known interest in atmospheric studies. O3-sensitive markers such as PAHs and 6PPD showed marked inter-channel differences: relative O3-induced losses reached 15 %–46 % for higher molecular weight PAHs and up to 48 % for 6PPD. In contrast, 6PPDq concentrations increased in the O3-exposed channel, consistent with in-situ formation from 6PPD. Quantitative comparison of absolute concentrations suggests a 6PPD to 6PPDq transformation of about 13 % to 20 %, in agreement with previously reported laboratory yields. BOAs showed no inter-channel effect, implying that the TSOD did not induce a measurable change in particle reactivity or phase distribution of these semi-volatile species. Such change would need to be large enough to overcome analytical variability, which we do not observe.
Without an upstream O3 denuder, systematic sampling artefacts occur: PAHs and 6PPD are systematically and significantly underestimated, while oxidation products such as 6PPDq are overestimated due to in-situ ozonolysis. Thus, O3 removal is a methodological requirement for quantitative chemical UFP analysis. The TSOD meets the requirements by (i) efficiently scrubbing O3 at atmospherically relevant mixing ratios, (ii) introducing no measurable particle loss across sizes from 10 to 1000 nm, and (iii) not perturbing the gas–particle partitioning of semi-volatile bOAs.
The data presented here are available at https://doi.org/10.5281/zenodo.20325619 (Eckenberger et al., 2026).
The supplement related to this article is available online at https://doi.org/10.5194/amt-19-4035-2026-supplement.
EE: denuder design and preparation, laboratory and field deployment, measurements, chemical analysis, data processing and interpretation, and writing (original draft, review, and editing). AM, DB: DMS500 measurements, data analysis. NG: Filter collection and writing (review and editing). MS, RZ, ACN: funding acquisition, conceptualization, supervision, and writing (review and editing).
The contact author has declared that none of the authors has any competing interests.
Publisher's note: Copernicus Publications remains neutral with regard to jurisdictional claims made in the text, published maps, institutional affiliations, or any other geographical representation in this paper. The authors bear the ultimate responsibility for providing appropriate place names. Views expressed in the text are those of the authors and do not necessarily reflect the views of the publisher.
We thank the Bavarian Environment Agency (LfU) and the German Weather Service (DWD) for providing ozone and meteorological data.
This project is financed by the Bavarian State Ministry of the Environment and Consumer Protection.
The article processing charges for this open-access publication were covered by the Forschungszentrum Jülich.
This paper was edited by Hans Osthoff and reviewed by two anonymous referees.
Abdel-Shafy, H. I. and Mansour, M. S. M.: A review on polycyclic aromatic hydrocarbons: Source, environmental impact, effect on human health and remediation, Egyptian Journal of Petroleum, 25, 107–123, https://doi.org/10.1016/j.ejpe.2015.03.011, 2016.
Balducci, C., Cecinato, A., Paolini, V., Guerriero, E., Perilli, M., Romagnoli, P., Tortorella, C., Iacobellis, S., Giove, A., and Febo, A.: Volatilization and oxidative artifacts of PM bound PAHs collected at low volume sampling (1): Laboratory and field evaluation, Chemosphere, 200, 106–115, https://doi.org/10.1016/j.chemosphere.2018.02.090, 2018.
Balmes, J. R. and Hansel, N. N.: Tiny Particles, Big Health Impacts, Am. J. Respir. Crit. Care Med., 210, 1291–1292, https://doi.org/10.1164/rccm.202407-1476ED, 2024.
Bayerisches Landesamt für Umwelt (LfU): LÜB – Messwertarchiv: O3, hourly data, station Augsburg/LfU, 8 August until 13 September 2023, https://www.lfu.bayern.de/luft/immissionsmessungen/messwertarchiv/index.htm, last access: 8 June 2025.
Bedjanian, Y. and Nguyen, M. L.: Kinetics of the reactions of soot surface-bound polycyclic aromatic hydrocarbons with O3, Chemosphere, 79, 387–393, https://doi.org/10.1016/j.chemosphere.2010.02.009, 2010.
Bell, M. L., Goldberg, R., Hogrefe, C., Kinney, P. L., Knowlton, K., Lynn, B., Rosenthal, J., Rosenzweig, C., and Patz, J. A.: Climate change, ambient ozone, and health in 50 US cities, Clim. Change, 82, 61–76, https://doi.org/10.1007/s10584-006-9166-7, 2007.
Cataldo, F.: Protection Mechanism of Rubbers from Ozone Attack, Ozone Sci. Eng., 41, 358–368, https://doi.org/10.1080/01919512.2018.1542518, 2019.
Christoffersen, T. S., Hjorth, J., Horie, O., Jensen, N. R., Kotzias, D., Molander, L. L., Neeb, P., Ruppert, L., Winterhalter, R., Virkkula, A., Wirtz, K., and Larsen, B. R.: cis-pinic acid, a possible precursor for organic aerosol formation from ozonolysis of α-pinene, Atmos. Environ., 32, 1657–1661, https://doi.org/10.1016/S1352-2310(97)00448-2, 1998.
Cooper, O. R., Parrish, D. D., Ziemke, J., Balashov, N. V., Cupeiro, M., Galbally, I. E., Gilge, S., Horowitz, L., Jensen, N. R., Lamarque, J.-F., Naik, V., Oltmans, S. J., Schwab, J., Shindell, D. T., Thompson, A. M., Thouret, V., Wang, Y., and Zbinden, R. M.: Global distribution and trends of tropospheric ozone: An observation-based review, Elem. Sci. Anth., 2, https://doi.org/10.12952/journal.elementa.000029, 2014.
Das, A., Pantzke, J., Jeong, S., Hartner, E., Zimmermann, E. J., Gawlitta, N., Offer, S., Shukla, D., Huber, A., Rastak, N., Meščeriakovas, A., Ivleva, N. P., Kuhn, E., Binder, S., Gröger, T., Oeder, S., Delaval, M., Czech, H., Sippula, O., Schnelle-Kreis, J., Di Bucchianico, S., Sklorz, M., and Zimmermann, R.: Generation, characterization, and toxicological assessment of reference ultrafine soot particles with different organic content for inhalation toxicological studies, Sci. Total Environ., 951, 175727, https://doi.org/10.1016/j.scitotenv.2024.175727, 2024.
Denjean, C., Formenti, P., Picquet-Varrault, B., Camredon, M., Pangui, E., Zapf, P., Katrib, Y., Giorio, C., Tapparo, A., Temime-Roussel, B., Monod, A., Aumont, B., and Doussin, J. F.: Aging of secondary organic aerosol generated from the ozonolysis of α-pinene: effects of ozone, light and temperature, Atmos. Chem. Phys., 15, 883–897, https://doi.org/10.5194/acp-15-883-2015, 2015.
Eckenberger, E., Mittereder, A., Gawlitta, N., Schnelle-Kreis, J., Sklorz, M., Brüggemann, D., Zimmermann, R., and Nölscher, A. C.: Performance evaluation of four cascade impactors for airborne ultrafine-particle (UFP) collection: the influence of particle type, concentration, mass, and chemical nature, Aerosol Research, 3, 45–64, https://doi.org/10.5194/ar-3-45-2025, 2025.
Eckenberger, E., Mittereder, A., Gawlitta, N., Sklorz, M., Brüggemann, D., Zimmermann, R., and Nölscher, A. C.: Data files for Sodium Thiosulfate-Coated Ceramic Denuders for Ozone Removal in Ultrafine Particle Sampling, Zenodo [data set], https://doi.org/10.5281/zenodo.20325619, 2026.
Emberson, L.: Effects of ozone on agriculture, forests and grasslands, Philos. T. Roy. Soc. A, 378, 20190327, https://doi.org/10.1098/rsta.2019.0327, 2020.
Ernle, L., Ringsdorf, M. A., and Williams, J.: Influence of ozone and humidity on PTR-MS and GC-MS VOC measurements with and without a Na2S2O3 ozone scrubber, Atmos. Meas. Tech., 16, 1179–1194, https://doi.org/10.5194/amt-16-1179-2023, 2023.
European Committee for Standardization (CEN): EN 15549:2008 – Air quality — Standard method for the measurement of the concentration of benzo[a]pyrene and other polycyclic aromatic hydrocarbons in ambient air, Brussels, 1–22 pp., 2008.
Fick, J., Pommer, L., Andersson, B., and Nilsson, C.: Ozone Removal in the Sampling of Parts per Billion Levels of Terpenoid Compounds: An Evaluation of Different Scrubber Materials, Environ. Sci. Technol., 35, 1458–1462, https://doi.org/10.1021/es0001456, 2001.
Gaudel, A., Cooper, O. R., Ancellet, G., Barret, B., Boynard, A., Burrows, J. P., Clerbaux, C., Coheur, P.-F., Cuesta, J., Cuevas, E., Doniki, S., Dufour, G., Ebojie, F., Foret, G., Garcia, O., Granados-Muñoz, M. J., Hannigan, J. W., Hase, F., Hassler, B., Huang, G., Hurtmans, D., Jaffe, D., Jones, N., Kalabokas, P., Kerridge, B., Kulawik, S., Latter, B., Leblanc, T., Le Flochmoën, E., Lin, W., Liu, J., Liu, X., Mahieu, E., McClure-Begley, A., Neu, J. L., Osman, M., Palm, M., Petetin, H., Petropavlovskikh, I., Querel, R., Rahpoe, N., Rozanov, A., Schultz, M. G., Schwab, J., Siddans, R., Smale, D., Steinbacher, M., Tanimoto, H., Tarasick, D. W., Thouret, V., Thompson, A. M., Trickl, T., Weatherhead, E., Wespes, C., Worden, H. M., Vigouroux, C., Xu, X., Zeng, G., and Ziemke, J.: Tropospheric Ozone Assessment Report: Present-day distribution and trends of tropospheric ozone relevant to climate and global atmospheric chemistry model evaluation, Elem. Sci. Anth., 6, https://doi.org/10.1525/elementa.291, 2018.
Grosjean, D.: In situ organic aerosol formation during a smog episode: Estimated production and chemical functionality, Atmos. Environ. A-Gen., 26, 953–963, https://doi.org/10.1016/0960-1686(92)90027-I, 1992.
Haddad, P., Jeong, H., Kappeler, R., Altug, H., Andersen, Z. J., Bergmann, M., Boogaard, H., Kutlar, M. J., Lim, Y. H., Loft, S., Pohl, T., and Hoffmann, B.: Systematic review on health effects of long-term exposure to UFP, ISEE Conference Abstracts, 2024, https://doi.org/10.1289/isee.2024.0574, 2024.
Helmig, D. and Greenberg, J.: Artifact formation from the use of potassium-iodide-based ozone traps during atmospheric sampling of trace organic gases, J. High Res. Chromatog., 18, 15–18, https://doi.org/10.1002/jhrc.1240180105, 1995.
Ho, S. S. H., Ip, H. S. S., Ho, K. F., Dai, W.-T., Cao, J., and Ng, L. P. T.: Technical Note: Concerns on the Use of Ozone Scrubbers for Gaseous Carbonyl Measurement by DNPH-Coated Silica Gel Cartridge, Aerosol Air Qual. Res., 13, 1151–1160, https://doi.org/10.4209/aaqr.2012.11.0313, 2013.
Hu, X., Zhao, H. N., Tian, Z., Peter, K. T., Dodd, M. C., and Kolodziej, E. P.: Transformation Product Formation upon Heterogeneous Ozonation of the Tire Rubber Antioxidant 6PPD (N-(1,3-dimethylbutyl)-N′-phenyl-p-phenylenediamine), Environ. Sci. Technol. Lett., 9, 413–419, https://doi.org/10.1021/acs.estlett.2c00187, 2022.
Ji, Z., Zhang, N., Huang, C., Duan, X., Ren, D., and Huo, Z.: The Degradation of Polycyclic Aromatic Hydrocarbons (PAHs) by Ozone-Based Advanced Oxidation Processes: A Review, Ozone Sci. Eng., 46, 26–42, https://doi.org/10.1080/01919512.2023.2192751, 2024.
Kristensen, K., Bilde, M., Aalto, P. P., Petäjä, T., and Glasius, M.: Denuder/filter sampling of organic acids and organosulfates at urban and boreal forest sites: Gas/particle distribution and possible sampling artifacts, Atmos. Environ., 130, 36–53, https://doi.org/10.1016/j.atmosenv.2015.10.046, 2016a.
Kristensen, K., Watne, Å. K., Hammes, J., Lutz, A., Petäjä, T., Hallquist, M., Bilde, M., and Glasius, M.: High-Molecular Weight Dimer Esters Are Major Products in Aerosols from α-Pinene Ozonolysis and the Boreal Forest, Environ. Sci. Technol. Lett., 3, 280–285, https://doi.org/10.1021/acs.estlett.6b00152, 2016b.
Kuwabara, H., Sekiguchi, K., Sankoda, K., Sakurai, K., Yamaguchi, R., Furuuchi, M., and Hata, M.: Evaluation of Artifacts Generated during Collection of Ultrafine Particles Using an Inertial Filter Sampler, Aerosol Air Qual. Res., 16, 3063–3074, https://doi.org/10.4209/aaqr.2015.12.0679, 2016.
Kwamena, N.-O. A., Clarke, J. P., Kahan, T. F., Diamond, M. L., and Donaldson, D. J.: Assessing the importance of heterogeneous reactions of polycyclic aromatic hydrocarbons in the urban atmosphere using the Multimedia Urban Model, Atmos. Environ., 41, 37–50, https://doi.org/10.1016/j.atmosenv.2006.08.016, 2007.
Kwon, H.-S., Ryu, M. H., and Carlsten, C.: Ultrafine particles: unique physicochemical properties relevant to health and disease, Exp. Mol. Med., 52, 318–328, https://doi.org/10.1038/s12276-020-0405-1, 2020.
Li, Q.-Q., Guo, Y.-T., Yang, J.-Y., and Liang, C.-S.: Review on main sources and impacts of urban ultrafine particles: Traffic emissions, nucleation, and climate modulation, Atmos. Environ. X, 19, 100221, https://doi.org/10.1016/j.aeaoa.2023.100221, 2023.
Liffick, G. L.: An Investigation of the Removal of Ozone by Activated Charcoal, master's thesis, Oregon State University, Oregon, 1–73 pp., Open Library: OL17639717M, 1970.
Liu, K., Duan, F., He, K., Ma, Y., and Cheng, Y.: Investigation on sampling artifacts of particle associated PAHs using ozone denuder systems, Front. Environ. Sci. Eng., 8, 284–292, https://doi.org/10.1007/s11783-013-0555-7, 2014.
Liu, Y., Sklorz, M., Schnelle-Kreis, J., Orasche, J., Ferge, T., Kettrup, A., and Zimmermann, R.: Oxidant denuder sampling for analysis of polycyclic aromatic hydrocarbons and their oxygenated derivates in ambient aerosol: Evaluation of sampling artefact, Chemosphere, 62, 1889–1898, https://doi.org/10.1016/j.chemosphere.2005.07.049, 2006.
Marval, J. and Tronville, P.: Ultrafine particles: A review about their health effects, presence, generation, and measurement in indoor environments, Build. Environ., 216, 108992, https://doi.org/10.1016/j.buildenv.2022.108992, 2022.
Monks, P. S., Archibald, A. T., Colette, A., Cooper, O., Coyle, M., Derwent, R., Fowler, D., Granier, C., Law, K. S., Mills, G. E., Stevenson, D. S., Tarasova, O., Thouret, V., von Schneidemesser, E., Sommariva, R., Wild, O., and Williams, M. L.: Tropospheric ozone and its precursors from the urban to the global scale from air quality to short-lived climate forcer, Atmos. Chem. Phys., 15, 8889–8973, https://doi.org/10.5194/acp-15-8889-2015, 2015.
Mutzel, A., Rodigast, M., Iinuma, Y., Böge, O., and Herrmann, H.: Monoterpene SOA – Contribution of first-generation oxidation products to formation and chemical composition, Atmos. Environ., 130, 136–144, https://doi.org/10.1016/j.atmosenv.2015.10.080, 2016.
Oberdörster, G., Ferin, J., Gelein, R., Soderholm, S. C., and Finkelstein, J.: Role of the alveolar macrophage in lung injury: studies with ultrafine particles., Environ. Health Perspect., 97, 193–199, https://doi.org/10.1289/ehp.97-1519541, 1992.
Ofner, J., Krüger, H.-U., Grothe, H., Schmitt-Kopplin, P., Whitmore, K., and Zetzsch, C.: Physico-chemical characterization of SOA derived from catechol and guaiacol – a model substance for the aromatic fraction of atmospheric HULIS, Atmos. Chem. Phys., 11, 1–15, https://doi.org/10.5194/acp-11-1-2011, 2011.
Pantzke, J., Das, A., Zimmermann, E. J., Offer, S., Jeong, S., Delaval, M. N., Schnelle-Kreis, J., Sklorz, M., Di Bucchianico, S., and Zimmermann, R.: 68 On the Role of Chemical Identity over the size of Model Ultrafine Particles Driven (geno)-Toxicity, Ann. Work Expo. Health, 67, i93–i93, https://doi.org/10.1093/annweh/wxac087.227, 2023.
Pöschl, U., Letzel, T., Schauer, C., and Niessner, R.: Interaction of Ozone and Water Vapor with Spark Discharge Soot Aerosol Particles Coated with Benzo[a]pyrene: O 3 and H 2 O Adsorption, Benzo[a]pyrene Degradation, and Atmospheric Implications, J. Phys. Chem. A, 105, 4029–4041, https://doi.org/10.1021/jp004137n, 2001.
Prather, M. J. and Zhu, X.: Lifetimes and timescales of tropospheric ozone, Elem. Sci. Anth., 12, https://doi.org/10.1525/elementa.2023.00112, 2024.
Ravindra, K., Sokhi, R., and Vangrieken, R.: Atmospheric polycyclic aromatic hydrocarbons: Source attribution, emission factors and regulation, Atmos. Environ., 42, 2895–2921, https://doi.org/10.1016/j.atmosenv.2007.12.010, 2008.
Rossomme, E., Hart-Cooper, W. M., Orts, W. J., McMahan, C. M., and Head-Gordon, M.: Computational Studies of Rubber Ozonation Explain the Effectiveness of 6PPD as an Antidegradant and the Mechanism of Its Quinone Formation, Environ. Sci. Technol., 57, 5216–5230, https://doi.org/10.1021/acs.est.2c08717, 2023.
Rynek, R., Mayer, T., and Borsdorf, H.: Enhancing forest air sampling using a novel reusable ozone filter design, Atmos. Meas. Tech., 18, 4103–4117, https://doi.org/10.5194/amt-18-4103-2025, 2025.
Schraufnagel, D. E.: The health effects of ultrafine particles, Exp. Mol. Med., 52, 311–317, https://doi.org/10.1038/s12276-020-0403-3, 2020.
Shiraiwa, M., Ammann, M., Koop, T., and Pöschl, U.: Gas uptake and chemical aging of semisolid organic aerosol particles, P. Natl. Acad. Sci. USA, 108, 11003–11008, https://doi.org/10.1073/pnas.1103045108, 2011.
Subramanian, R., Khlystov, A. Y., Cabada, J. C., and Robinson, A. L.: Positive and Negative Artifacts in Particulate Organic Carbon Measurements with Denuded and Undenuded Sampler Configurations, Special Issue of Aerosol Science and Technology on Findings from the Fine Particulate Matter Supersites Program, Aerosol Sci. Tech., 38, 27–48, https://doi.org/10.1080/02786820390229354, 2004.
Takizawa, M., Okuwaki, A., and Okabe, T.: The Chemical Behavior of Low Valence Sulfur Compounds. VIII. The Oxidation of Sodium Thiosulfate with Ozone, Bull. Chem. Soc. Jpn., 46, 3785–3789, https://doi.org/10.1246/bcsj.46.3785, 1973.
Van Vaeck, L. and Van Cauwenberghe, K.: Conversion of polycyclic aromatic hydrocarbons on diesel particulate matter upon exposure to ppm levels of ozone, Atmos. Environ., 18, 323–328, https://doi.org/10.1016/0004-6981(84)90106-9, 1984.
Williams, E. L. and Grosjean, D.: Removal of atmospheric oxidants with annular denuders, Environ. Sci. Technol., 24, 811–814, https://doi.org/10.1021/es00076a002, 1990.
World Health Organization: WHO global air quality guidelines: particulate matter (PM2.5 and PM10), ozone, nitrogen dioxide, sulfur dioxide and carbon monoxide, Geneva, ISBN 9789240034228, 2021.
World Meteorological Organization (WMO): GAW Report No. 281: Guidelines for Measurements of Non-Methane Hydrocarbons in the Troposphere, Geneva, 2023.
Yatavelli, R. L. N., Lopez-Hilfiker, F., Wargo, J. D., Kimmel, J. R., Cubison, M. J., Bertram, T. H., Jimenez, J. L., Gonin, M., Worsnop, D. R., and Thornton, J. A.: A Chemical Ionization High-Resolution Time-of-Flight Mass Spectrometer Coupled to a Micro Orifice Volatilization Impactor (MOVI-HRToF-CIMS) for Analysis of Gas and Particle-Phase Organic Species, Aerosol Sci. Tech., 46, 1313–1327, https://doi.org/10.1080/02786826.2012.712236, 2012.
Yatavelli, R. L. N., Stark, H., Thompson, S. L., Kimmel, J. R., Cubison, M. J., Day, D. A., Campuzano-Jost, P., Palm, B. B., Hodzic, A., Thornton, J. A., Jayne, J. T., Worsnop, D. R., and Jimenez, J. L.: Semicontinuous measurements of gas–particle partitioning of organic acids in a ponderosa pine forest using a MOVI-HRToF-CIMS, Atmos. Chem. Phys., 14, 1527–1546, https://doi.org/10.5194/acp-14-1527-2014, 2014.
Young, P. J., Archibald, A. T., Bowman, K. W., Lamarque, J.-F., Naik, V., Stevenson, D. S., Tilmes, S., Voulgarakis, A., Wild, O., Bergmann, D., Cameron-Smith, P., Cionni, I., Collins, W. J., Dalsøren, S. B., Doherty, R. M., Eyring, V., Faluvegi, G., Horowitz, L. W., Josse, B., Lee, Y. H., MacKenzie, I. A., Nagashima, T., Plummer, D. A., Righi, M., Rumbold, S. T., Skeie, R. B., Shindell, D. T., Strode, S. A., Sudo, K., Szopa, S., and Zeng, G.: Pre-industrial to end 21st century projections of tropospheric ozone from the Atmospheric Chemistry and Climate Model Intercomparison Project (ACCMIP), Atmos. Chem. Phys., 13, 2063–2090, https://doi.org/10.5194/acp-13-2063-2013, 2013.
Yu, J., Griffin, R. J., Cocker, D. R., Flagan, R. C., Seinfeld, J. H., and Blanchard, P.: Observation of gaseous and particulate products of monoterpene oxidation in forest atmospheres, Geophys. Res. Lett., 26, 1145–1148, https://doi.org/10.1029/1999GL900169, 1999.
Zhang, J., Wei, Y., and Fang, Z.: Ozone Pollution: A Major Health Hazard Worldwide, Front. Immunol., 10, https://doi.org/10.3389/fimmu.2019.02518, 2019.
Zhao, H. N., Hu, X., Tian, Z., Gonzalez, M., Rideout, C. A., Peter, K. T., Dodd, M. C., and Kolodziej, E. P.: Transformation Products of Tire Rubber Antioxidant 6PPD in Heterogeneous Gas-Phase Ozonation: Identification and Environmental Occurrence, Environ. Sci. Technol., 57, 5621–5632, https://doi.org/10.1021/acs.est.2c08690, 2023.
Zhao, Z., Hao, J., Li, J., and Wu, S.: Second organic aerosol formation from the ozonolysis of α-pinene in the presence of dry submicron ammonium sulfate aerosol, J. Environ. Sci., 20, 1183–1188, https://doi.org/10.1016/S1001-0742(08)62207-X, 2008.
Zhou, S., Hwang, B. C. H., Lakey, P. S. J., Zuend, A., Abbatt, J. P. D., and Shiraiwa, M.: Multiphase reactivity of polycyclic aromatic hydrocarbons is driven by phase separation and diffusion limitations, P. Natl. Acad. Sci. USA, 116, 11658–11663, https://doi.org/10.1073/pnas.1902517116, 2019.