the Creative Commons Attribution 4.0 License.
the Creative Commons Attribution 4.0 License.
 | 25 Jun 2026
Retrieving tropospheric temperature and humidity profiles over the ocean using buoy-based microwave radiometers
Zhiqian Li
Fuqing Liu
Shuo Jiang
Zhongling Zhou
Zhijin Qiu
Jing Zou
Tong Hu
Ke Qi
Bo Wang
Bin Wang
The acquisition of atmospheric temperature and humidity profiles over the sea is strategically vital for meteorological forecasting, marine monitoring, and national security. Achieving their real-time, stable, and routine retrieval under complex sea conditions is a critical and urgent challenge. Traditional retrieval methods rely heavily on large historical datasets. However, marine sounding stations are sparse, making data acquisition challenging. Ground-based microwave radiometers offer a unique capability for continuous, all-weather remote sensing of atmospheric thermal emission, enabling routine retrieval of temperature and humidity profiles over oceanic regions. Meanwhile, buoy platforms experience wave disturbance, causing real-time variations in zenith angle observations. Without correction, this induces significant random errors in target brightness temperature. To address these issues, this paper proposes a collaborative retrieval method. This method does not rely on large-scale historical datasets for model training and integrates platform attitude information. Our approach uses a multi-objective genetic algorithm to construct a small-scale joint prior database based on a limited amount of local radiosonde data, which serves only as an initial physical constraint for the retrieval process. It also incorporates an attitude error correction model, an empirical pressure-altitude equation, and a parallel optimization strategy. This thereby reduces dependence on extensive historical datasets. It also effectively mitigates attitude-induced brightness-temperature deviation, enhances computational efficiency, and enables real-time, routine retrieval of marine atmospheric profiles. Simulation experiments and field tests in Qingdao's Jiaozhou Bay confirm the results. Under sparse-data conditions, the temperature RMSE is 4.11 K before systematic bias correction and 2.13 K after correction, while the relative-humidity RMSE is 24.09 % before correction and 21.42 % after correction. A single static bias correction profile is proposed for operational deployment, which achieves performance comparable to the cross-validation results. This validates the method's stability and applicability in real marine environments. This research provides a potentially practical pathway for ocean areas with sparse radiosondes for real-time, stable, and routine detection of marine atmospheric parameters.
- Article
(3954 KB) - Full-text XML
- BibTeX
- EndNote


The lower troposphere is the region where most human activities and weather phenomena take place. The systematic measurement of meteorological parameters in this region is a critical foundation for accurate weather forecasting and climate change research. It is also essential for ensuring the efficiency of aviation, travel, and radio communication systems (Maciejewska, 2025; Morbidelli et al., 2011). However, the precise detection of atmospheric in the marine environment is further complicated by its unique geographical characteristics and dynamic processes. Recent studies have further highlighted the complexity of marine atmospheric structures, particularly under extreme weather conditions such as tropical cyclones (Guimond et al., 2018; Ahern et al., 2019). For instance, Wei et al. (2025b) demonstrated that vertical wind shear can induce significant asymmetry in atmospheric duct distributions, underscoring the spatial and temporal variability of atmospheric properties in oceanic regions.
The primary bottlenecks are the sparse distribution of oceanic sounding stations and the inherent limitations of traditional atmospheric retrieval methods, contributing to a significant observational gap in the atmospheric boundary layer (Cimini et al., 2020). This sparse distribution of stations makes data acquisition in the marine environment extremely difficult. The limitations are particularly evident when dealing with marine dynamic environments. Specifically, data-driven retrieval methods such as statistical and neural-network-based approaches exhibit strong dependence on large historical datasets, which are difficult to obtain in marine environments. In addition, buoy-based platforms are subject to wave-induced motion, which leads to variations in the observation zenith angle and consequently introduces brightness temperature deviations. These attitude-related effects must be addressed through appropriate measurement preprocessing and correction procedures before the retrieval stage.
Currently, various mainstream methods are used for atmospheric parameter profiling retrieval. These include the Bayesian maximum probability estimation algorithm (Clough et al., 2005), one-dimensional variational retrieval methods (Hewison, 2007), physically based retrieval methods based on radiative transfer theory (Zhou et al., 2024; Liu et al., 2024; Gaffard and Hewison, 2003; Reinhardt et al., 2009), and statistical retrieval methods (Zheng, 2010). Neural-network algorithms have also gained increasing attention (Renju et al., 2023). While high computational accuracy can theoretically be achieved with physical retrieval methods, their inherently large computational requirements severely limit real-time performance. Statistical retrieval methods are effective in terrestrial environments where sufficient data is available. However, their strong reliance on historical data makes them struggle in marine regions with limited data. Neural-network algorithms demonstrate outstanding performance due to their powerful nonlinear mapping capabilities. However, traditional neural network models, such as the classic backpropagation (BP) neural network, generally require a large amount of training data (Hu et al., 2023; Jiménez and Eriksson, 2016). This high data requirement conflicts sharply with the limited ability to obtain field data in the unique environment of the ocean. As a result, their training effects and retrieval performance are significantly limited (Yao and Guan, 2022; Mahdianpari et al., 2021). Early pioneering studies established the fundamental capabilities of ground-based microwave radiometry. For instance, Decker et al. (1978) made significant progress in ground-based detection, and Guiraud et al. (1979) revealed the detection capabilities of absorption spectra at different frequencies. However, applying these traditional methods to complex marine environments presents significant challenges. More recently, Turner et al. (2007) noted that physical retrieval methods, while accurate, are computationally inefficient for real-time applications. Furthermore, in their Arctic region study, Candlish et al. (2012) explicitly pointed out that the accuracy of ship-based platform data is significantly reduced when using traditional neural-network-based retrieval of atmospheric profiles. This is due to changes in attitude and insufficient on-site data. Recent studies also suggest that even state-of-the-art reanalysis data like ERA5 may exhibit systematic biases under complex marine weather conditions such as tropical cyclones (Wei et al., 2025a), further emphasizing the need for observation-driven profiling methods in data-sparse oceanic environments. These studies collectively highlight a core issue: how to effectively overcome errors caused by platform attitude and improve the accuracy and efficiency of atmospheric parameter profiles. Although mechanical stabilization (Schnitt et al., 2024) can reduce platform motion, it introduces significant challenges for long-term autonomous buoy operation in terms of power consumption and maintenance complexity. Therefore, this study adopts a software-based approach using real-time zenith angle correction from attitude sensors. During field experiments, the buoy exhibited residual pitch and roll variations of approximately ±2.5° and ±3.2°, respectively. Our algorithm explicitly compensates for these residual pointing variations, enabling accurate retrieval of atmospheric parameters under dynamic marine conditions.
As discussed previously, ground-based microwave radiometers (MWR) provide a powerful remote sensing technology. They are capable of capturing atmospheric microwave radiation information in real-time and continuously. This enables the retrieval of key parameters, such as atmospheric temperature and humidity profiles, and atmospheric refractive index. On the other hand, buoys are flexible, real-time monitoring platforms. They can integrate multi-parameter measurement functions and offer the unique advantages of long-term, uninterrupted, and all-weather operation. This can effectively compensate for the observational deficiencies caused by the sparse distribution of traditional oceanic sounding stations (Roemmich et al., 2009; Cronin et al., 2023; Liu et al., 2019; Fang et al., 2018). Consequently, an effective approach to addressing the scarcity of tropospheric data in marine environments is the combination of advanced ground-based microwave radiometer technology with autonomous, multi-parameter buoy monitoring platforms. Industry initiatives have previously explored this potential, such as the deployment of the first floating microwave radiometer (Haun, 2017). In the academic field, several studies have also explored the application of microwave radiometers in marine environments. For instance, Schnitt et al. (2024) and Griesche et al. (2020) demonstrated ship-based profiling capabilities, while Yan et al. (2022) focused on improving retrieval algorithms for ocean-based platforms. More recently, Cimini et al. (2025) reviewed the capability of microwave radiometers for offshore wind energy applications, highlighting that while onshore retrievals show high correlation (>0.9) with radiosondes (Cimini et al., 2003), offshore retrievals are significantly challenged by platform motion and data sparsity, necessitating advanced calibration and elevation scanning strategies.
Therefore, this study deploys a ground-based microwave radiometer on an ocean buoy platform. Through incorporating platform attitude correction methods and applying multi-objective optimization algorithms, a history-independent retrieval model is constructed to address the challenges above. Through simulation experiments and field sea trials, the method's performance, retrieval accuracy, and applicability under the tested conditions are comprehensively evaluated. Its potential for application in real marine environments is also assessed.
2.1 The QFW-6000 microwave radiometric profiler
The QFW-6000 microwave radiometer, developed by the China Electronics Technology Corporation No.22 Research Institute, is employed in this study (CETC-22, 2022; Zhang et al., 2025). The microwave radiometer is installed on the buoy's upper platform. It is used to detect, receive, and analyze microwave brightness temperatures from the zenith direction. Brightness temperature is observed from the zenith direction using 16 microwave channels. Of these, eight channels in the K-band (22.24–31.4 GHz) are primarily used to detect water vapor. Eight channels in the V-band (51.26–58.0 GHz) exploit the absorption of the oxygen to retrieve atmospheric temperature profiles. The device has a vertical resolution of 25 m in the 0–0.5 km range, 50 m in the 0.5–2 km range, and 250 m in the 2–10 km range. It should be noted that the vertical resolution reported here refers to the retrieval grid used for constructing the temperature and humidity profiles, rather than the intrinsic physical resolution of the microwave radiometer itself. The effective vertical resolution is mainly constrained by the information content of the observed microwave channels and the corresponding weighting functions. As a result, the number of independent pieces of vertical information (degrees of freedom for signal) is comparatively low, and the retrieved profiles represent smoothed atmospheric structures rather than fine-scale vertical details. Its maximum detection distance is 10 km. The QFW-6000 Microwave Radiometer features integrated temperature, humidity, and pressure sensors that provide real-time surface thermodynamic data for in-situ calibration and retrieval correction. Additionally, it incorporates a rain intensity sensor and an infrared cloud sensor to facilitate weather identification during rainy and cloudy conditions. The physical appearance of the QFW-6000 microwave radiometer is shown in Fig. 1.
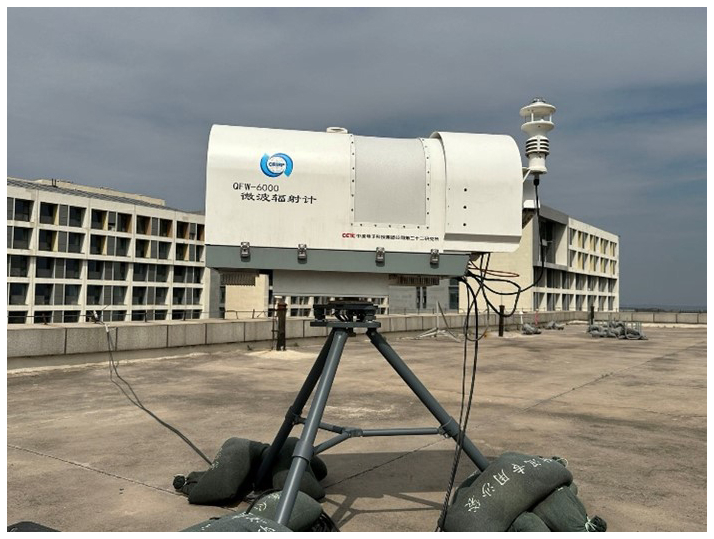
Figure 1The QFW-6000 microwave radiometric profiler developed by the CETC No.22 Research Institute was deployed for the experiment. The instrument features a K-band and V-band receiver for profiling tropospheric temperature and humidity.
The QFW-6000 microwave radiometric profiler used in this study belongs to the class of ground-based multi-channel microwave radiometers for atmospheric profiling. Previous studies on comparable ground-based microwave radiometers have reported brightness-temperature uncertainties on the order of a few tenths of a kelvin under proper calibration conditions, with retrieved temperature-profile uncertainties typically on the order of 1–2 K in the lower troposphere and relative-humidity uncertainties commonly in the range of 10 %–20 %, depending on atmospheric conditions and retrieval configuration. (e.g., Hewison, 2007; Cimini et al., 2006).
Table 1Main performance specifications of the QFW-6000 microwave radiometer used in this study.
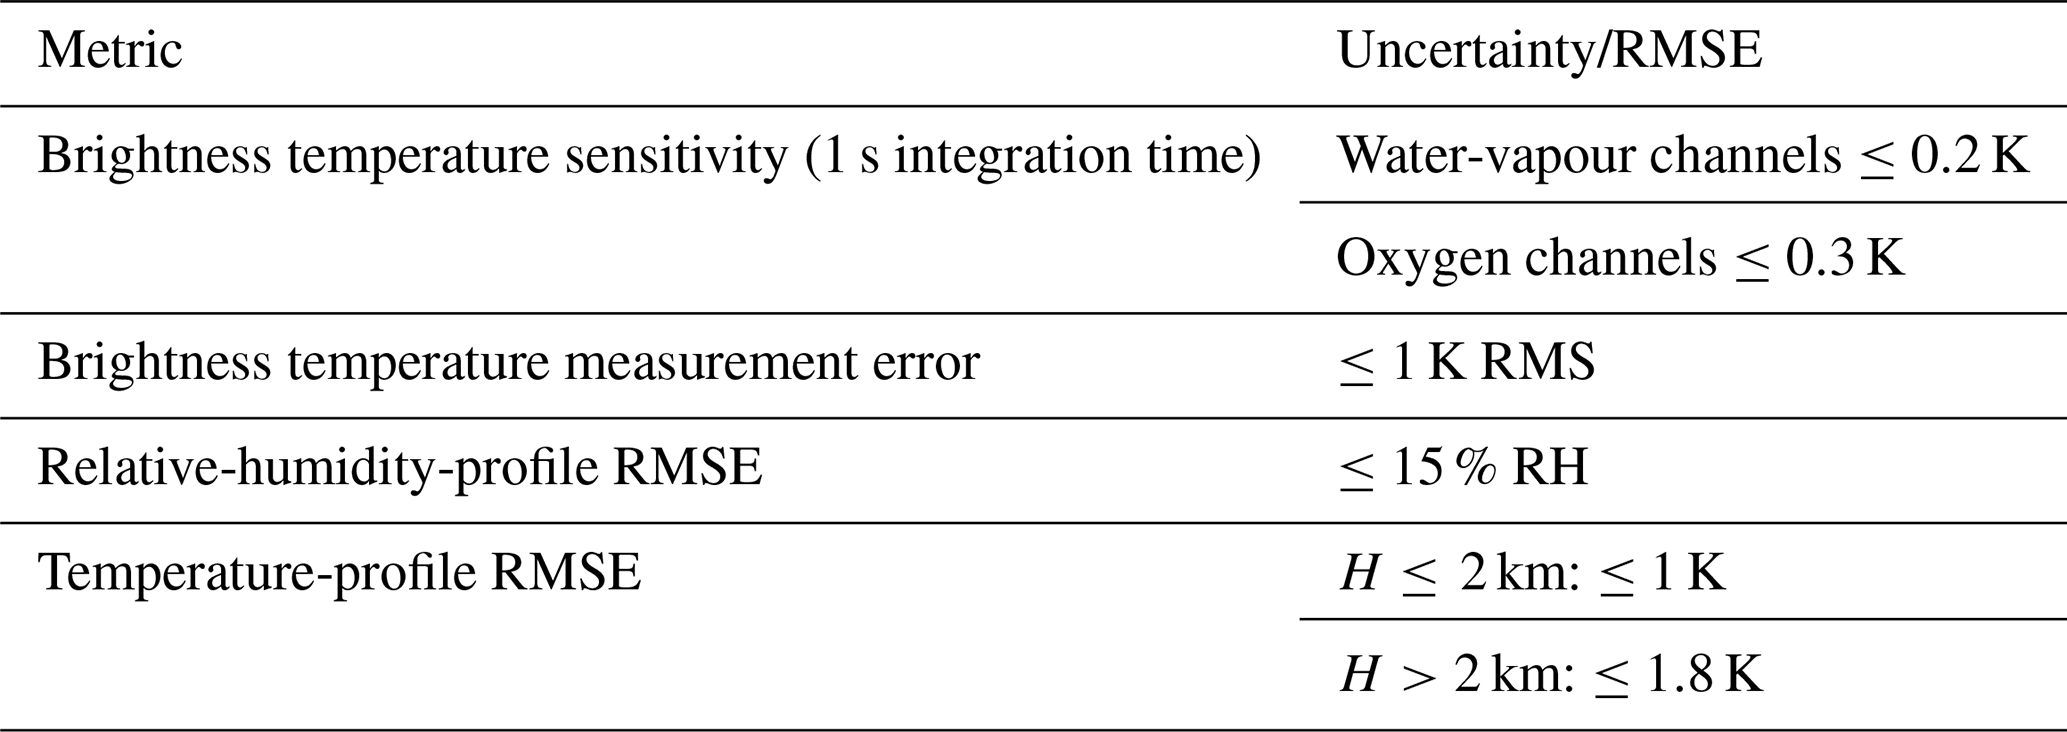
Note: The values listed in this table are technical specifications of the QFW-6000 microwave radiometer used in this study, extracted from the instrument functional/specification document. They provide instrument-specific performance background information, but should not be interpreted as a complete field-based uncertainty characterization under both fixed-site and buoy-based deployment conditions.
These values are cited here only to provide background information on the typical performance range of comparable instrument classes, rather than as a complete field-based uncertainty characterization of the exact QFW-6000 system used in this study. To better document the instrument-specific background of the present system, the main technical specifications relevant to retrieval uncertainty are summarized in Table 1.
The present QFW-6000 belongs to the same instrument family as that described by Zhang et al. (2025), but the channel configurations are not identical. The system used here includes eight channels in each of the K- and V-bands, whereas the instrument described by Zhang et al. (2025) uses seven channels per band.
2.2 The Buoy Platform
The buoy platform was developed by the Institute of Oceanographic Instrumentation, Shandong Academy of Sciences. The buoy has a UFO or disc-shaped appearance. It is constructed from a highly durable and corrosion-resistant, fully sealed, welded steel structure. The buoy body is 10 m in diameter and weighs approximately 30 t. After modification, the platform can stably accommodate key equipment, such as the QFW-6000 microwave radiometer and attitude sensors. This adaptation to the marine environment ensures reliable data collection. The buoy's middle section houses a battery and an instrument compartment. Its exterior is composed of six buoyancy chambers to ensure stability and safety. The overall structural configuration of the buoy platform is illustrated in Fig. 2.
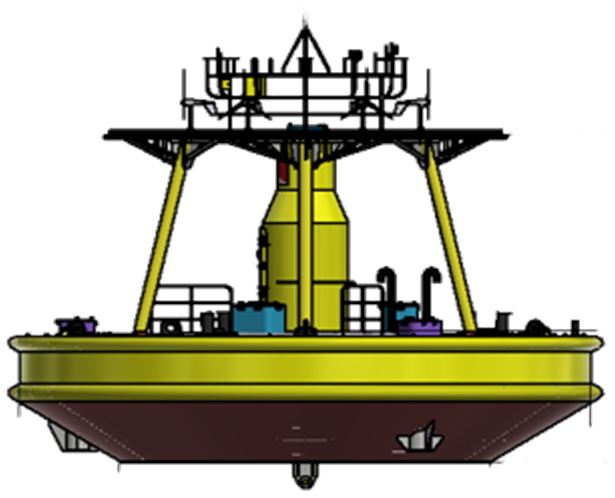
Figure 2Structural design of the floating buoy platform independently developed by the Institute of Oceanographic Instrumentation, Shandong Academy of Sciences. The platform is equipped with the QFW-6000 microwave radiometer and attitude sensors and is designed for long-term stable operation in marine environments.
2.3 Attitude Sensor
The attitude of the buoy is a key parameter affecting the measurement accuracy of microwave radiometers during maritime navigation. Attitude sensors are used to measure the roll angles and pitch angles of the measurement platform. The zenith angle θ can be obtained by substituting the attitude sensor output data into the derived calculation formula for the buoy attitude and zenith angles. The calculation formula for the buoy's zenith angle is as follows Eq. (1):
By substituting this observed zenith angle into the atmospheric radiative transfer equation, the oblique path brightness temperature can be obtained. This enables attitude compensation and correction by explicitly introducing the effective zenith angle into the radiative transfer forward model. The effective viewing geometry is computed from real-time pitch and roll measurements and applied before inversion, thereby removing systematic brightness temperature deviations induced by platform motion. A MEMS-based attitude sensor integrating a tri-axis accelerometer, gyroscope, and digital motion processor (DMP) is used, with a typical static accuracy of 0.1°–0.3° and a dynamic accuracy of 0.3°–0.5° under typical marine operating conditions. A dedicated pointing alignment calibration was performed before deployment to ensure that the radiometer antenna corresponds to a zenith angle of 0° when the buoy is horizontally leveled.
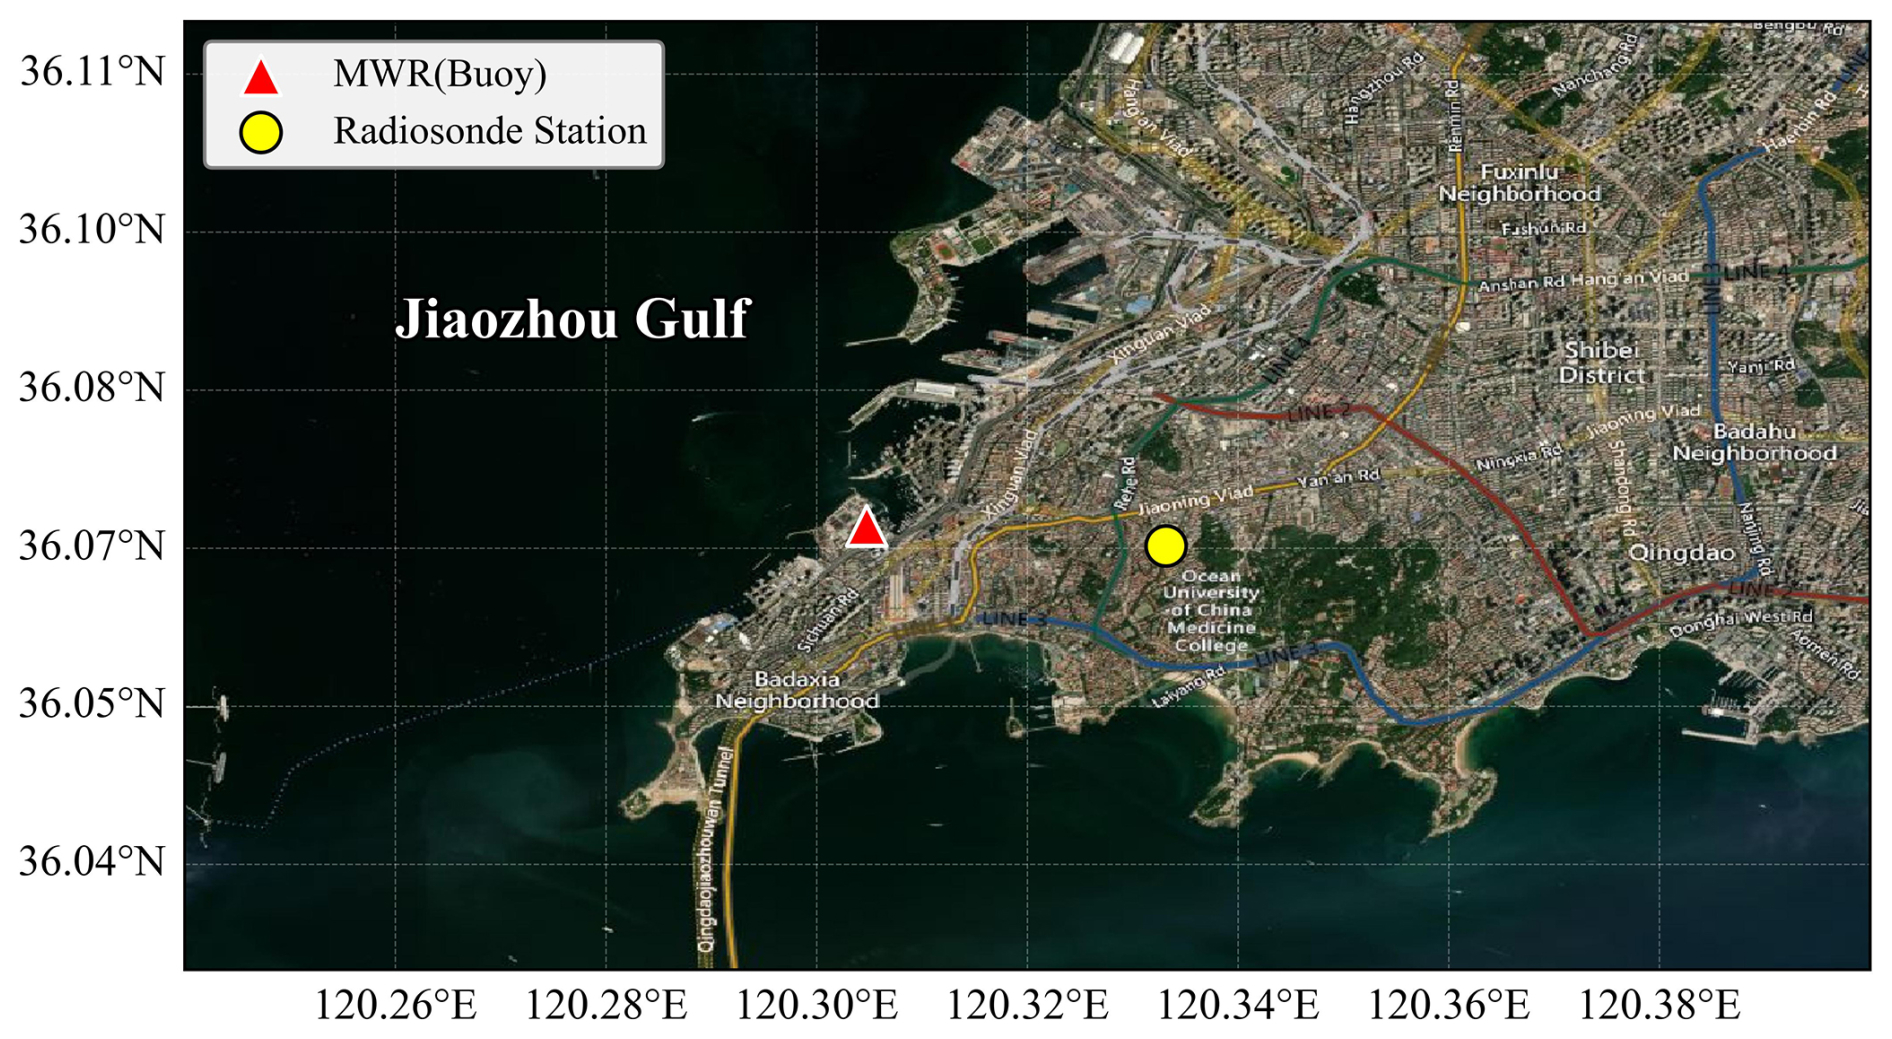
Figure 3Map of the Jiaozhou Gulf region showing the experimental sites. The red triangle indicates the location of the Buoy-based Microwave Radiometer (36.0721540° N, 120.3047530° E), and the yellow circle represents the Radiosonde Station (36.0702040° N, 120.3331640° E). The two instruments are separated by a distance of approximately 2.5 km. Basemap from Cartopy Quadtree Tiles.
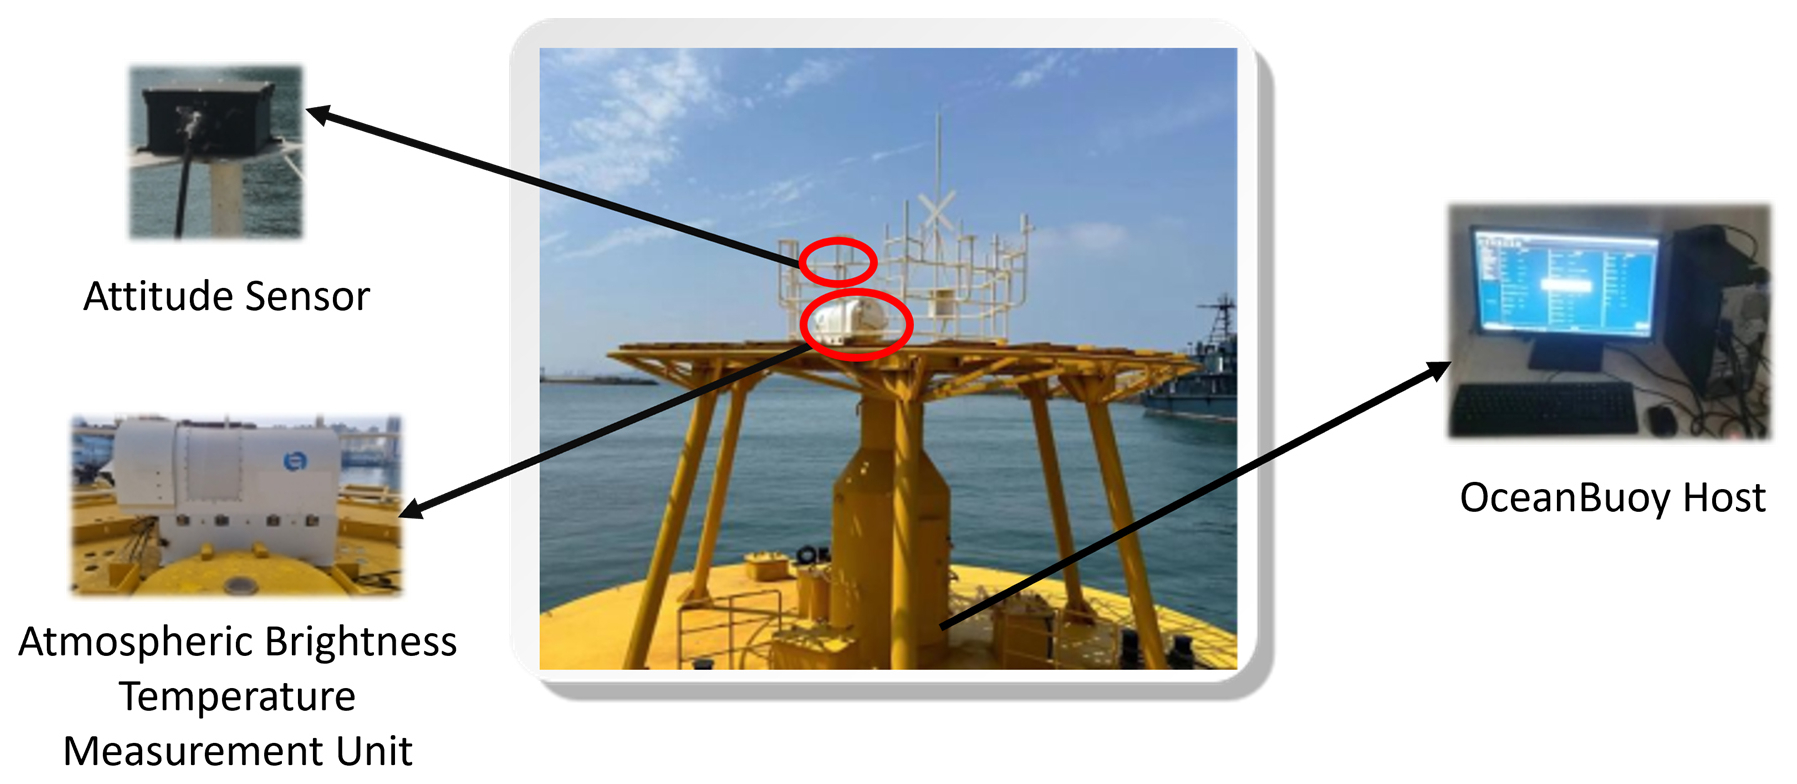
Figure 4Schematic of the sea trial experimental setup on the 10 m diameter buoy platform. Key components include: the attitude sensor (top left) for monitoring platform roll and pitch; the QFW-6000 atmospheric brightness temperature measurement unit (bottom left) installed on the upper deck; and the OceanBuoy Host (right) for data aggregation and transmission. The red circles in the central photograph indicate the mounting positions of the sensors on the buoy structure.
2.4 The Sites
The Jiaozhou Bay area off the coast of Qingdao (36.0721540° N, 120.3047530° E) was used as the sea trial research area. As shown in Fig. 3, the retrieval data of microwave radiometer atmospheric temperature and humidity profiles were systematically analyzed. For comparative analysis and validation, radiosonde data from the Qingdao Observatory (Station ID: 54857; 36.0702040° N, 120.3331640° E) in the upper-air sounding database of the University of Wyoming, USA, were selected (http://weather.uwyo.edu/upperair/bufrraob.shtml, last access: 24 October 2025). The two sites are 2.5 km apart. Therefore, the microwave radiometer data and the radio sounding data can be considered co-located observation data. The sea trial experimental environment is shown in Fig. 4.
In the Jiaozhou Bay area, the QFW-6000 microwave radiometer, which was modified and calibrated with liquid nitrogen on land before deployment, along with an attitude sensor, will be installed on a 10 m buoy platform according to the layout shown in Fig. 4. Brightness temperature and tilt angle will be collected simultaneously at the buoy's top level. Data will be aggregated via the serial port to the OceanBuoy Host. After data retrieval is completed, results will be transmitted back to the shore station.
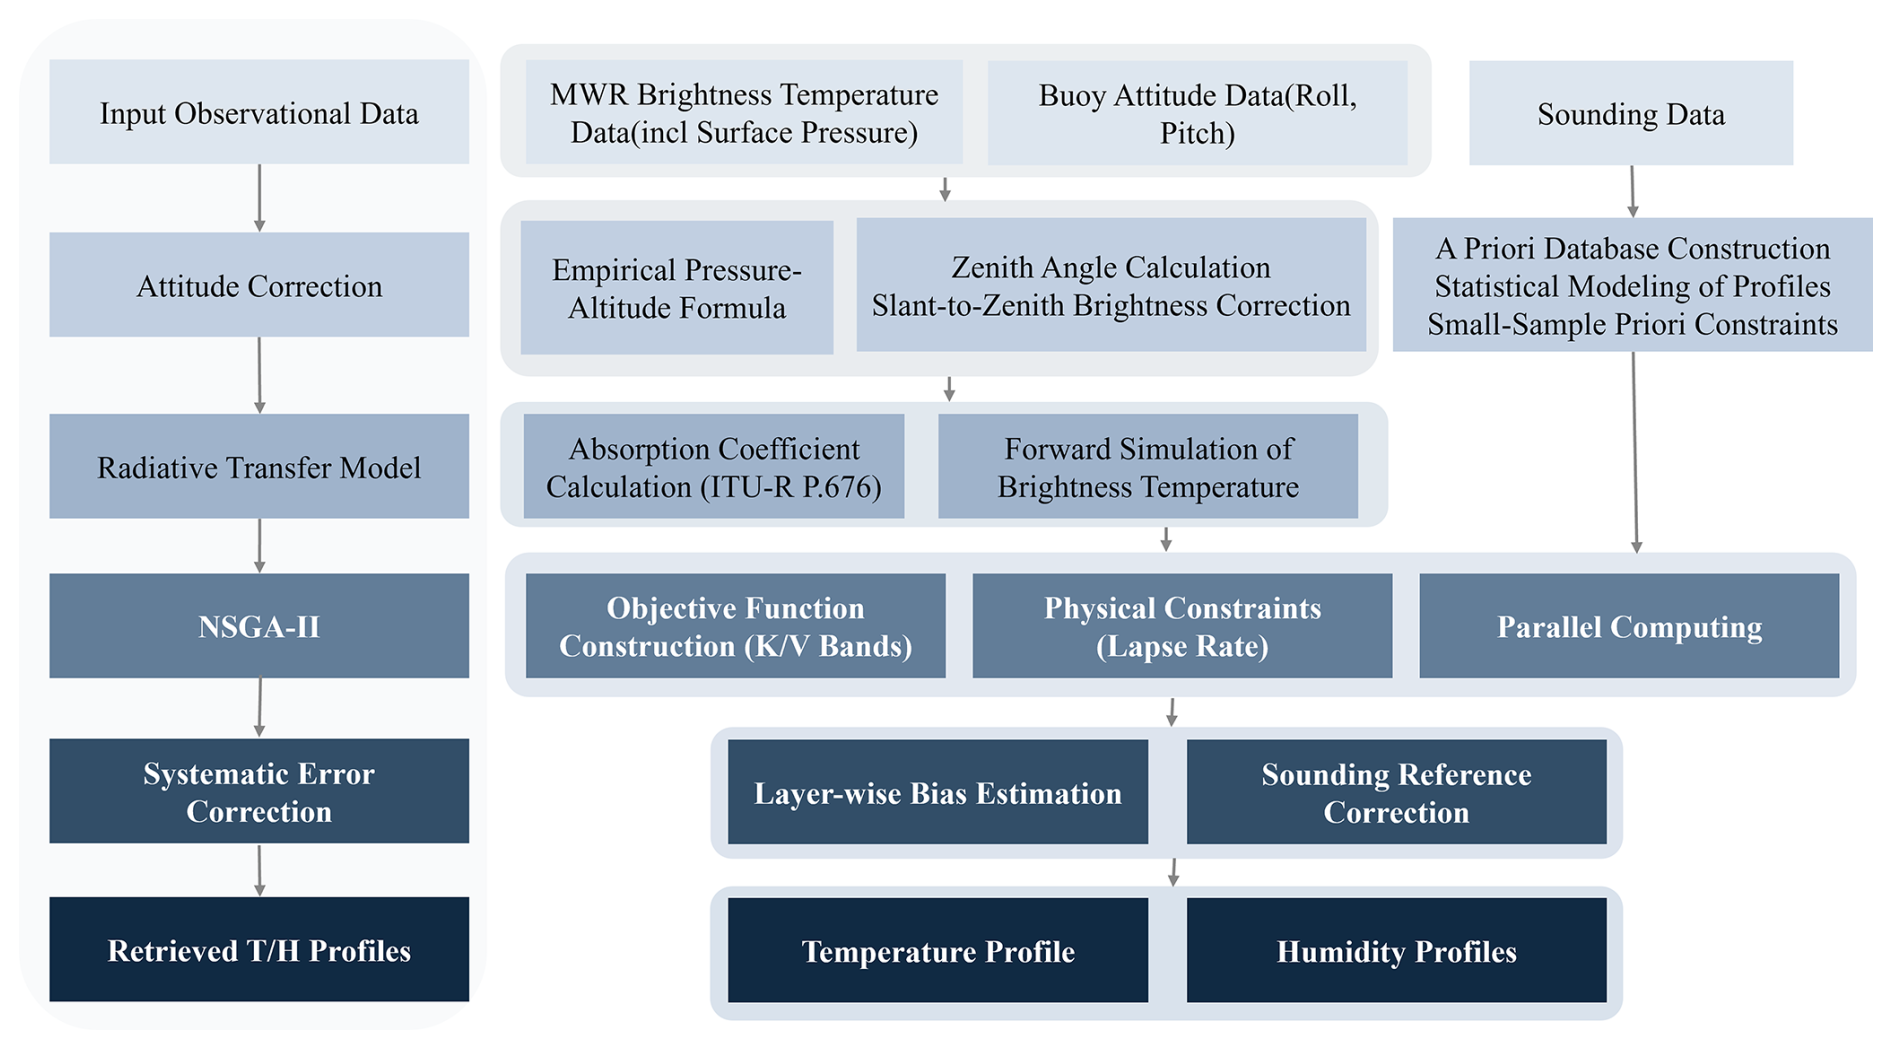
Figure 5Schematic flowchart of the atmospheric temperature and humidity profile inversion method based on a microwave radiometer on a buoy platform. The workflow includes attitude correction of microwave radiometer observations, radiative transfer modeling and brightness temperature simulation, construction of multi-objective functions with physical constraints, NSGA-II optimization, and systematic bias correction, resulting in the final retrieved temperature and humidity profiles.
To provide an intuitive overview of the proposed retrieval strategy, Fig. 5 illustrates the complete workflow of the buoy-based temperature and humidity profile retrieval. The procedure consists of four main parts: (1) preprocessing and attitude correction of microwave radiometer observations, (2) construction of the forward radiative transfer model and objective functions, (3) multi-objective optimization using the NSGA-II algorithm with physical constraints, and (4) systematic bias correction and final profile generation.
3.1 The Data Source
Observed brightness temperature data were derived from the QFW-6000 microwave radiometer. The sounding data are from the University of Wyoming sounding station database. According to Tu et al. (2021), the Qingdao upper-air sounding system (Station ID: 54857) is based on the GTS1 radiosonde. According to the manufacturer's technical specifications, the GTS1 radiosonde provides continuous vertical profiles with a typical vertical resolution of approximately 5–10 m during ascent. The measurement accuracies are approximately ±0.2 K for temperature, ±5 % for relative humidity, and ±1 hPa for pressure. Specifically, data from the Qingdao Meteorological Observatory (Station ID:54857) are used. The data are collected twice daily at 00:00 and 12:00 UTC. Attitude data are obtained from the attitude sensor in the buoy platform. The sensor collects attitude data every second. The zenith angle data are derived using the buoy attitude angle and the zenith angle calculation formula. Using the microwave radiation transfer equation, brightness temperature data along the inclined path can be corrected to that of the zenith path.
3.2 Atmospheric Radiative Transfer Principle and Model
This section describes the forward radiative transfer modelling framework used in this study, including the calculation of atmospheric absorption coefficients and the corresponding microwave radiative transfer formulation. Ground-based microwave radiometry retrieves atmospheric profiles by measuring the downwelling thermal emission from the atmosphere. Under the Rayleigh-Jeans approximation, which is valid for microwave frequencies (300 MHz–300 GHz), the brightness temperature TB(θ) observed by a ground-based radiometer can be expressed by the radiative transfer equation (RTE):
where T∞ is the cosmic background brightness temperature (approximately. 2.73 K), T(z) is the atmospheric physical temperature at altitude z, ka(z) is the atmospheric absorption coefficient at altitude z, and τ(0,z) denotes the optical depth from the surface to altitude z,defined as:
accurate calculation of kα is critical for the forward model. In this study, we selected the ITU-R P.676-13 model (ITU-R, 2022) to calculate the gaseous absorption coefficients. Compared to the MPM series and MonoRTM models mentioned above, the ITU-R model is recognised as the international standard for radio propagation engineering. It uses a parameterized line-by-line formulation that offers a good balance between computational efficiency and accuracy, making it particularly suitable for the real-time retrieval requirements of the present buoy-based system. Specifically, the K-band channels (22–31 GHz) operate near the water-vapor absorption line (22.235 GHz) and are mainly to retrieve humidity information, while the V-band channels (51–58 GHz) operate along the oxygen absorption complex and are mainly used to retrieve temperature profiles (Rosenkranz, 1998). Under the present non-precipitating conditions, the forward model focuses on gaseous absorption, while liquid-water effects are not explicitly retrieved.
3.3 The Retrieval Algorithm Construction
To provide a unified and reproducible description of the retrieval framework, the temperature–humidity profile inversion is formulated as a constrained multi-objective optimization problem and solved using the Non-dominated Sorting Genetic Algorithm II (NSGA-II).
The retrieval aims to simultaneously minimize the residuals between simulated and observed brightness temperatures in the temperature-sensitive V-band channels and the humidity-sensitive K-band channels under level-dependent admissible bounds and adjacent-layer continuity constraints. The forward model is based on the atmospheric microwave radiative transfer equation and the ITU-R P.676-13 absorption model.
The optimization problem is solved through Pareto-front evolution using NSGA-II. To meet the real-time requirements of marine applications, a parallel computing strategy is introduced to accelerate population evaluation while keeping the mathematical formulation unchanged. The final retrieval profile is selected from the Pareto-optimal solution set using a joint error minimization criterion.
3.3.1 Data Preprocessing
This study conducted a comprehensive statistical analysis of the routine radiosonde data. We aimed to accurately obtain the statistical distribution characteristics of temperature and humidity. Based on the statistical analysis, data points falling outside the confidence interval (defined as the μ±2 standard deviations) were identified as outliers and excluded. Additionally, radiosonde measurements are influenced by ascent rate and horizontal drift caused by wind, leading to irregular vertical sampling intervals. To address these grid-mismatch issues, linear-interpolation was performed on the collected radiosonde data.
Furthermore, pressure profiles were obtained using actual ground-based pressure sensor data combined with empirical pressure-altitude formulas. To obtain pressure profiles for the specific experimental region, we adopted a hybrid empirical approach that combines local statistical climatology with standard engineering modeling. The pressure P (kPa) at a given altitude H (m) is calculated as the arithmetic mean of two components Eq. (4):
where: Plocal(H) represents the regional statistical fit, derived from a polynomial regression of historical pressure-altitude data from major cities in China:
Pstd(H) represents the standard atmospheric model defined in the national electric power industry code DL/T 5240-2010(National Energy Administration of China, 2010):
This weighted combination effectively mitigates the systematic bias of the general standard model while retaining the physical consistency required for vertical profiling.
3.3.2 Construction of Atmospheric Prior Experience Database
It should be emphasized that only a limited amount of local radiosonde data is required to construct the small-sample prior experience database, which serves solely as an initial physical constraint for the retrieval process. During subsequent online retrieval, no historical data input is required. The preprocessed radiosonde data were interpolated to the same 83 height levels as the microwave radiometer using linear interpolation. A monthly statistical analysis revealed that temperature and humidity (T,H) at each height layer conformed to a normal distribution. The variables were substituted into the formulas and . To quantitatively assess the normality of the data distribution, we performed a monthly statistical analysis of temperature (T) and relative humidity (H) at each height layer. We calculated the Skewness (S) and Excess Kurtosis (K) for both variables. A distribution is considered to be approximately normal when and (Kim, 2013).
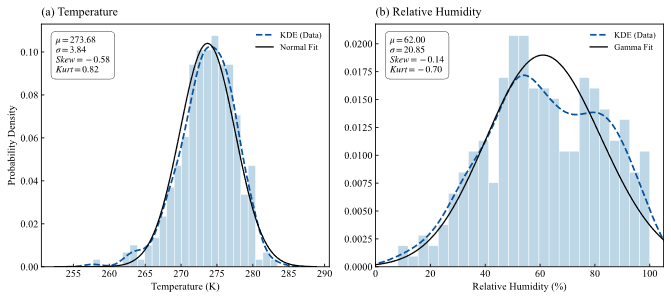
Figure 6Probability density distributions of (a) temperature and (b) relative humidity at 50 m height in January. The black solid line represents the fitted normal distribution curve, and the blue dashed line represents the kernel density estimation (KDE). Statistical metrics (μ, σ, S, K) are annotated.
Taking the 50 m height layer in January as an example (Fig. 6), the atmospheric temperature exhibits a high degree of symmetry with and K=0.82, indicating a good fit with the normal distribution. Similarly, the relative humidity at this level also demonstrates approximate normality (, ). Based on these statistical characteristics, we constructed the empirical database by filtering out outliers falling outside the
interval to ensure strict data quality. Specifically, values exceeding the boundaries were truncated to the threshold limits: . This rigorous screening process effectively eliminated anomalous sounding data and finalized the construction of the empirical database.
3.3.3 NSGA-II
To clarify how the retrieval is actually performed, the complete inversion workflow is illustrated in Fig. 5. Based on this framework, the retrieval procedure consists of the following main steps: construction of the objective functions from brightness temperature observations, introduction of physical constraints, multi-objective optimization using the NSGA-II algorithm, and subsequent systematic bias correction to obtain the final temperature and humidity profiles. Addressing the challenges of sparse data, dynamic platform disturbances, and the high computational cost of traditional inversion methods requiring large training datasets in ocean observations, this study builds upon the NSGA-II (Deb et al., 2002) framework. It should be clarified that the proposed retrieval method is not based on the Optimal Estimation Method (OEM), but is formulated as a constrained multi-objective optimization problem solved using NSGA-II. Specifically, a small-sample prior database is constructed to reduce dependence on large training datasets through statistical boundary generation and physical boundary constraints, as described in Sect. 3.3.2. Physical constraints, including adjacent-layer continuity constraints and physically admissible temperature–humidity bounds, are introduced as hard constraints to suppress inversion results that violate basic physical plausibility. In addition, real-time attitude sensor measurements are integrated to compensate for zenith-angle deviations caused by platform motion. The effective viewing geometry is computed from real-time pitch and roll measurements and applied in the radiative transfer forward model before inversion, as detailed in Sect. 2.3.
Because the attitude sensor samples at a higher frequency than the microwave radiometer, the raw attitude measurements are first synchronized to the radiometer integration period. All attitude samples within one radiometer observation window are averaged to derive an effective attitude state. Based on this averaged attitude, an effective zenith angle is calculated and used in the forward radiative transfer model. In this way, the observation geometry remains temporally consistent with the integrated brightness temperature measurement. This treatment ensures consistency between the time-integrated radiometric observation and the observation geometry used in the retrieval.
Furthermore, by employing a parallel computing architecture and a systematic bias correction mechanism, the single-run inversion time is typically below 1 min under a parameter configuration of 175 individuals and 10 generations (with a crossover probability of 0.9 and a mutation probability of 0.2), when executed with multi-core parallel workers. This computational cost is acceptable for operational shipborne applications and enables quasi-real-time processing of the observed data.
In operational marine meteorology and nowcasting, real-time processing typically refers to observational data being processed and delivered within minutes in order to support rapid update cycles for monitoring and decision support. According to the WMO Guide to Meteorological Instruments and Methods of Observation (WMO, 2018), operational observing systems commonly operate with reporting intervals on the order of 1–10 min. In addition, Sun et al. (2014) indicate that convective nowcasting systems require update cycles of approximately 5–10 min to capture fast-evolving atmospheric states.
In this context, the proposed framework achieves a single-run inversion time within ∼1 min, which is well within the typical reporting and update intervals required for operational maritime monitoring and nowcasting.
The Level-1 data processing workflow, including brightness temperature quality control, temporal synchronization, and vertical interpolation, is described in Sect. 3.1. The complete inversion workflow is designed as follows:
1. Construction of the Objective Function
The core of the retrieval process is an established multi-objective optimization problem. The objective is to minimize the difference between simulated and measured brightness temperatures. Physical constraints are introduced to ensure the reasonableness of the retrieval results. Specifically, the objective function is constructed from the residuals between simulated and observed brightness temperatures in the K-band (22 GHz) and V-band (58 GHz). In this formulation, and Tobs denote the simulated and measured brightness temperatures, respectively, and the superscripts indicate the corresponding frequency channels. Additionally, adjacent-layer continuity constraints are incorporated into the constraint system to limit excessive layer-to-layer variations. These constraints are applied to all neighbouring retrieval levels and act mainly as smoothness controls under limited observational constraint:
here, N denotes the maximum index of the vertical retrieval levels. In this study, the adjacent-layer limits are set to δ1=8 K for temperature and δ2=60 % for relative humidity. In practice, these constraints are applied to each pair of adjacent layers and mainly serve as inter-layer continuity constraints to suppress unrealistically sharp layer-to-layer jumps.
These threshold values were determined based on statistical analysis of local radiosonde data, representing the maximum physically plausible layer-to-layer temperature and humidity differences observed in the study area. The relatively large threshold values ensure that the constraint does not artificially smooth out real atmospheric features such as temperature inversions or sharp humidity gradients.
These limits are introduced primarily to maintain basic physically reasonable profile continuity rather than to impose a strict thermodynamic lapse-rate condition. The lower and upper bounds of temperature and relative humidity at each retrieval height are not fixed universal constants; instead, they are generated from the month-dependent small-sample prior database and used as level-dependent admissible intervals for the optimization variables.
It should be emphasized that the present continuity constraint is not a strict lapse-rate condition in the thermodynamic sense. Rather, it limits only the absolute magnitude of differences between neighbouring retrieval levels and does not enforce a monotonic decrease of temperature with height. Therefore, local inversions and gradient-transition structures are not excluded a priori. Under the current threshold setting, the practical role of this constraint is mainly to avoid non-physical discontinuities rather than to impose a canonical tropospheric lapse-rate structure.
2. Initialization of the Population
First, reasonable value ranges are defined for the temperature and humidity variables at each altitude layer using the constructed atmospheric prior experience database. Within this probability boundary, an initial population is generated through random sampling. Each individual represents a complete set of potential temperature-humidity profile solutions. Next, the fitness of each individual in the population is assessed. To ensure population diversity and convergence, key techniques from the non-dominance sorting genetic algorithm (NSGA-II) are employed. To ensure both convergence and diversity of the solution set, Pareto dominance is used to rank individuals into different non-dominated fronts according to the multiple objective functions, while a density-based sorting strategy (crowding distance) is applied to maintain solution diversity along the Pareto front. This multi-objective selection mechanism allows the algorithm to search for stable atmospheric temperature and humidity profiles while avoiding premature convergence (Deb et al., 2002).
3. Parallel Computing Optimization
We introduced parallel computing technology to optimize algorithm efficiency. Specifically, we used a controller-worker parallel mode. This mode divides the population into multiple sub-populations, which are then assigned to different CPUs for independent calculations. The controller processor manages task allocation and result aggregation, while the worker processors complete their computation and return the results. This approach significantly improves the computational efficiency of the retrieval process.
4. Obtaining the Optimal Solution
After the genetic algorithm completes its preset number of iterations, a set of multiple Pareto optimal solutions is produced. To select the final optimal solution from this set, a hybrid reconstruction strategy is employed. First, the extreme optimal values for each objective function are identified. These are the solutions in the Pareto optimal solution set that minimize the difference between the simulated and measured brightness temperatures in the K/V band. Subsequently, these solutions with extreme optimal values are mixed and reconstructed across different objectives. This generates a solution with the best overall performance. This solution serves as the final retrieval result.
5. System Bias Correction
To obtain a more robust estimate of the correction performance under limited-sample conditions, the systematic bias correction was evaluated using a leave-one-out cross-validation (LOOCV) strategy over the 38 collocated samples. In each validation round, one sample was held out as the validation case, while the remaining 37 samples were used to estimate the height-dependent systematic bias profiles for temperature and relative humidity.
For temperature and humidity, the systematic bias at height h was calculated as the mean difference between the retrieved profile and the corresponding radiosonde profile over the training subset. The resulting bias profiles were then applied only to the held-out validation sample in that round. This procedure was repeated until all 38 samples had been independently left out once, and the final corrected results were obtained by aggregating the corrected held-out cases over all validation rounds.
Under this framework, each corrected validation profile was generated without using its own information in the bias estimation step, thereby avoiding the ambiguity and potential optimism associated with applying a bias profile derived from a subset directly to all samples. In this way, the evaluation of the systematic bias correction becomes more robust and statistically interpretable.
For temperature and humidity, the systematic bias at each height layer h in the rth LOOCV round can be written as:
where and denote the systematic bias profiles of temperature and relative humidity at height h in the rth LOOCV round, respectively; Mr is the number of samples in the training subset of the rth round; Tr denotes the corresponding training-sample set; Tret,i(h) and Hret,i(h) are the retrieved temperature and relative humidity values at height h for the ith training sample; and Tobs,i(h) and Hobs,i(h) are the corresponding radiosonde observations.
For the held-out validation sample j in the rth LOOCV round, the corrected temperature and relative-humidity profiles were obtained by subtracting the corresponding round-specific systematic bias profiles from the original retrievals:
The corrected temperature and humidity profiles were then obtained by subtracting the corresponding systematic bias profiles from the original retrievals:
The corrected held-out profiles obtained in all LOOCV rounds were then aggregated to form the final LOOCV-based corrected dataset. In the present study, radiosonde observations are used only within the validation framework to estimate the height-dependent systematic bias profiles and to assess the correction performance. For future operational applications over the open ocean, the transferability and stability of the derived bias characteristics will require further validation under broader environmental conditions.
For operational deployment over the study area, a single static bias correction profile is recommended. This static profile is calculated as the arithmetic mean of all 38 individual bias profiles derived from the LOOCV procedure. The rationale for using a static profile rather than a dynamic fold-specific profile is twofold:
-
As demonstrated in Fig. 11, all 38 individual bias profiles are highly consistent, with a standard deviation of less than 0.3 K for temperature and less than 3 % for relative humidity across most layers.
-
The static mean profile achieves nearly identical performance to the LOOCV dynamic profiles, with a difference in overall RMSE of less than 0.02 K for temperature and 0.1 % for relative humidity.
This approach greatly simplifies the operational implementation while maintaining the full retrieval accuracy demonstrated in the validation experiments.
To comprehensively evaluate the performance and suitability of the proposed models for marine environments, microwave radiometer observation experiments were conducted on a buoy platform. This was done in the coastal waters of Jiaozhou Bay, Qingdao (36.0721540° N, 120.3047530° E). The models include the tropospheric temperature and humidity profile retrieval model and the buoy platform zenith compensation correction model. During the experiment, 38 sets of valid observational data were obtained. These data were compared with radio sounding data from the Qingdao Meteorological Observatory (Station ID: 54857) for validation. For each radiosonde launch time (00:00 and 12:00 UTC), the temporally co-located microwave radiometer retrieval record closest in time was selected for comparison. A matchup was considered valid only if the radiosonde profile passed quality control and was successfully interpolated onto the standard height grid of the microwave radiometer (0–10 km). This procedure ensures temporal consistency between the two observing systems and provides a reliable basis for profile-to-profile validation. The sounding data are from the Wyoming State University sounding database (36.0702040° N, 120.3331640° E). The two observation points are 2.5 km apart. Therefore, their data can be considered co-located observations. This provides reliable reference true values for model validation.
To quantitatively assess the performance of the proposed retrieval model, the retrieval accuracy is evaluated using the root mean square error (RMSE), which represents the statistical uncertainty of the retrieved profiles with respect to radiosonde observations.
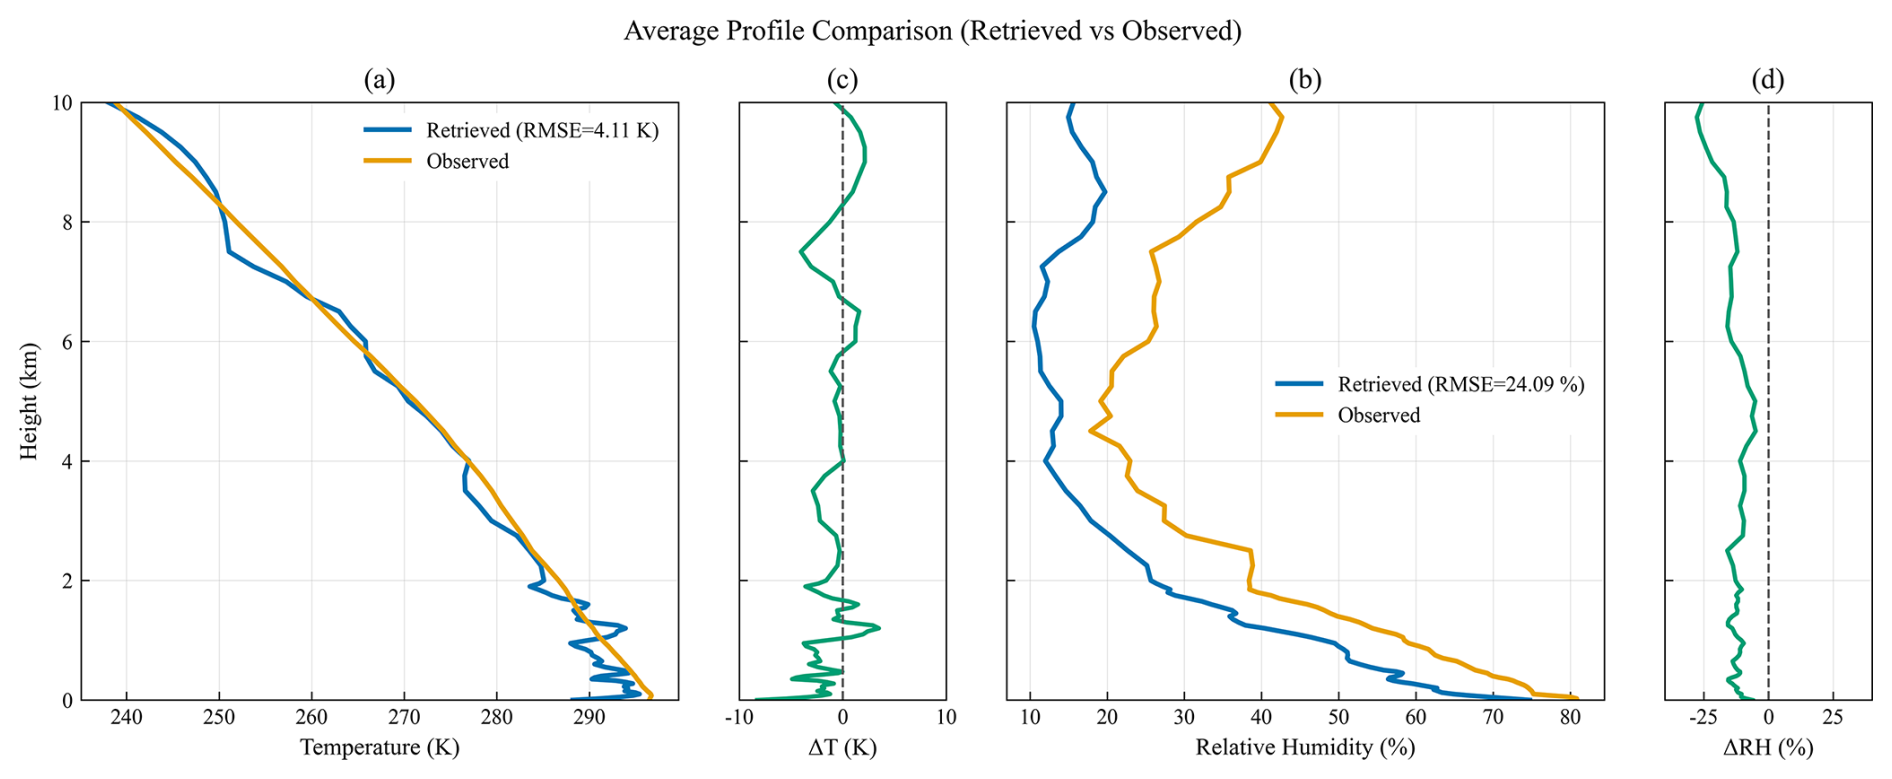
Figure 7Statistical comparison of atmospheric profiles between the uncorrected NSGA-II retrievals and the collocated radiosonde observations for 38 matched cases collected during the Jiaozhou Bay field experiment. Panels (a) and (b) present the mean temperature and relative humidity profiles, respectively, after time matching and interpolation onto the common retrieval grid. Panels (c) and (d) show the corresponding profile differences, defined directly as the mean retrieved profiles minus the mean radiosonde profiles shown in panels (a) and (b).
Figure 7 presents the statistical comparison between the uncorrected NSGA-II retrievals and the collocated radiosonde observations for the 38 matched cases. Panels (a) and (b) show the mean temperature and relative humidity profiles, respectively, while panels (c) and (d) present the corresponding mean profile differences, defined as the difference between the mean retrieved profiles and the mean radiosonde profiles.
It should be emphasized that the profiles shown in Fig. 7 represent averaged vertical structures over all matched cases, and the difference panels reflect the bias between the mean profiles rather than sample-wise error statistics.
As shown in Fig. 7a and c, the retrieved temperature profile generally follows the radiosonde profile in terms of overall vertical structure. However, systematic deviations are still evident at certain altitude ranges. Near the surface, the retrieved temperature is slightly higher than the radiosonde observations, while in parts of the lower-to-middle troposphere it tends to be lower. The corresponding bias profile exhibits clear height-dependent variations, indicating the presence of structured systematic deviations prior to bias correction.
For relative humidity, as shown in Fig. 7b and d, the retrieved profile is generally lower than the radiosonde profile over a large portion of the troposphere. The negative bias is most pronounced in the mid-troposphere (approximately 2–6 km), suggesting a systematic underestimation in the mean humidity structure before correction.
Overall, Fig. 7 demonstrates that the uncorrected retrieval captures the general vertical structure of temperature and humidity, but exhibits clear height-dependent systematic deviations in the mean profiles. These results provide the basis for the subsequent systematic bias correction analysis.
The retrieval results shown in Fig. 7 already incorporate attitude correction in the forward modelling process. To further isolate and evaluate the effect of attitude correction, an additional comparison was conducted between retrievals with and without applying the attitude correction, prior to the introduction of systematic bias correction.
The overall improvement introduced by attitude correction is relatively limited for the present dataset. This behaviour is consistent with the characteristics of the buoy observations, where the platform attitude angles are generally small (typically within 1–3°), resulting in relatively weak perturbations to the observation geometry. Under such conditions, the influence of attitude-induced effects on brightness temperature is correspondingly modest.
Table 2Grouped mean changes in retrieval RMSE under different attitude-angle ranges.
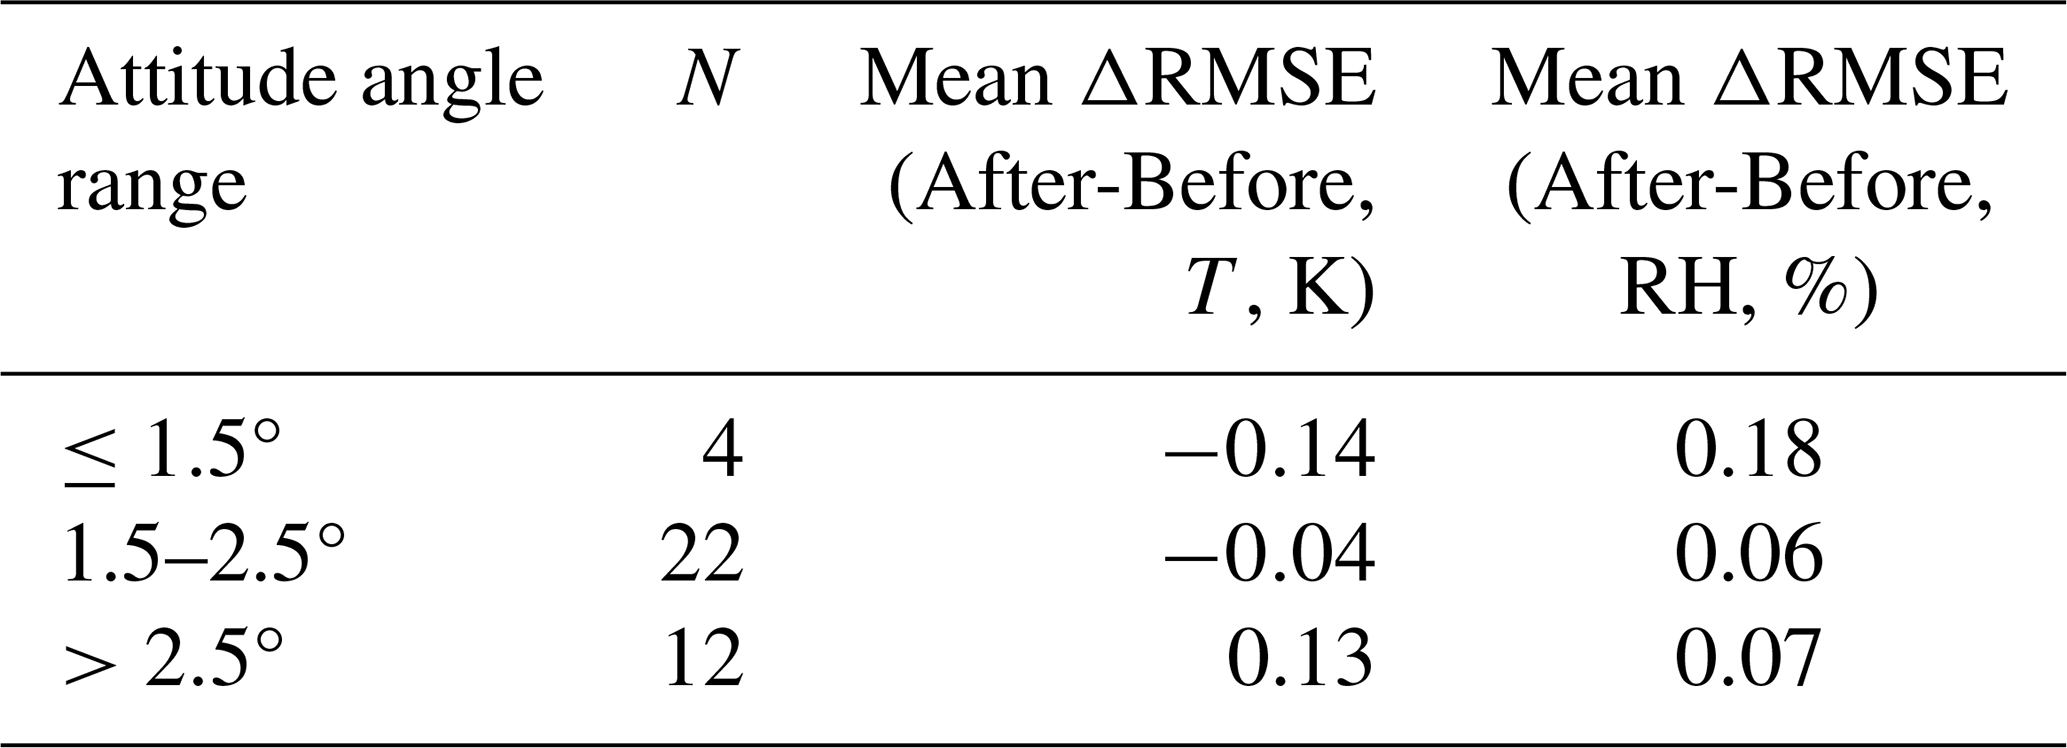
A grouped statistical analysis based on the magnitude of the attitude angle is presented in Table 2. The results do not exhibit a strictly monotonic relationship between attitude magnitude and retrieval improvement. Across the three subsets, the mean changes in RMSE remain small for both temperature and relative humidity, indicating that the impact of attitude correction under the present observational conditions is limited and case-dependent.
It should be noted that the slightly positive mean ΔRMSE in the >2.5° subset does not necessarily imply a degradation of retrieval performance due to attitude correction. Instead, this result likely reflects the combined influence of multiple uncertainty sources in a limited-sample marine dataset. In practice, larger attitude angles are often associated with stronger platform motion and increased short-term atmospheric variability. As a result, the geometric improvement introduced by attitude correction may be partially offset by other sources of error, including instrument noise, temporal–spatial mismatch, and environmental variability.
Given that the magnitude of the mean ΔRMSE in this subset remains small, this result should be interpreted with caution and should not be generalized beyond the present dataset. Overall, these findings suggest that while the average impact of attitude correction is modest under weak-motion conditions, it remains physically necessary and is expected to become more important under conditions with larger viewing-angle deviations.
For a representative case with relatively large attitude variation, the quantitative comparison before and after attitude correction is summarized in Table 3. The temperature RMSE decreases from 3.69 to 2.99 K, while the relative humidity RMSE decreases from 18.95 % to 18.57 %. These results indicate that incorporating attitude information improves the physical consistency of the forward model and becomes increasingly important under conditions with stronger platform motion.
Table 3Retrieval performance before and after attitude correction for a representative case.
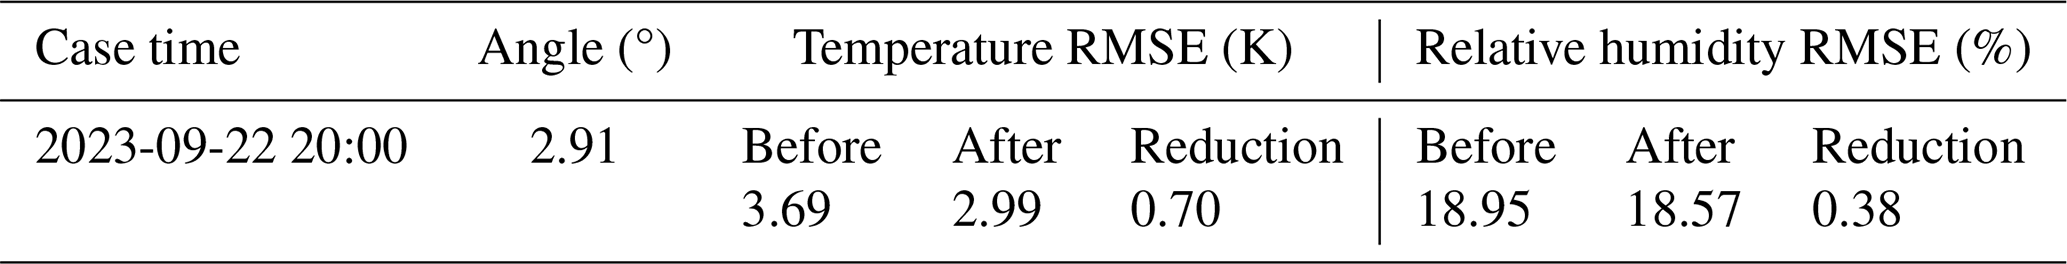
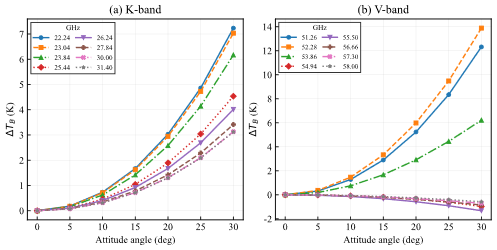
Figure 8Sensitivity of brightness temperature (ΔTB) to viewing angle for selected K-band (a) and V-band (b) channels. A reference atmospheric profile was generated using the ITU-R P.835 standard atmosphere, and channel brightness temperatures were simulated under different viewing angles using gaseous absorption from the ITU-R P.676 model. Here, ΔTB denotes the difference between the brightness temperature at a given viewing angle and the nadir-view reference (0°). Each curve corresponds to a specific frequency channel, as indicated in the legends. The results show a nonlinear increase in ΔTB with viewing angle for several channels, indicating that attitude-induced changes in observation geometry can introduce systematic brightness-temperature deviations and thereby affect retrieval accuracy.
Nevertheless, sensitivity analysis indicates that variations in viewing angle can introduce systematic brightness temperature deviations across multiple channels, particularly in specific K-band and V-band frequencies (Fig. 8). This indicates that attitude-induced geometric effects can propagate into the retrieval process through the forward radiative transfer model. Therefore, even though the average improvement is limited for the present dataset, explicit attitude correction remains physically necessary for buoy-based microwave radiometer retrievals and is expected to become increasingly important under conditions with stronger platform motion and larger viewing-angle deviations.
Figure 8 was generated from a theoretical sensitivity experiment in which a standard atmospheric profile from ITU-R P.835 was combined with ITU-R P.676 gaseous absorption calculations to simulate channel brightness temperatures at different viewing angles; ΔTB was defined relative to the 0° nadir-view case.
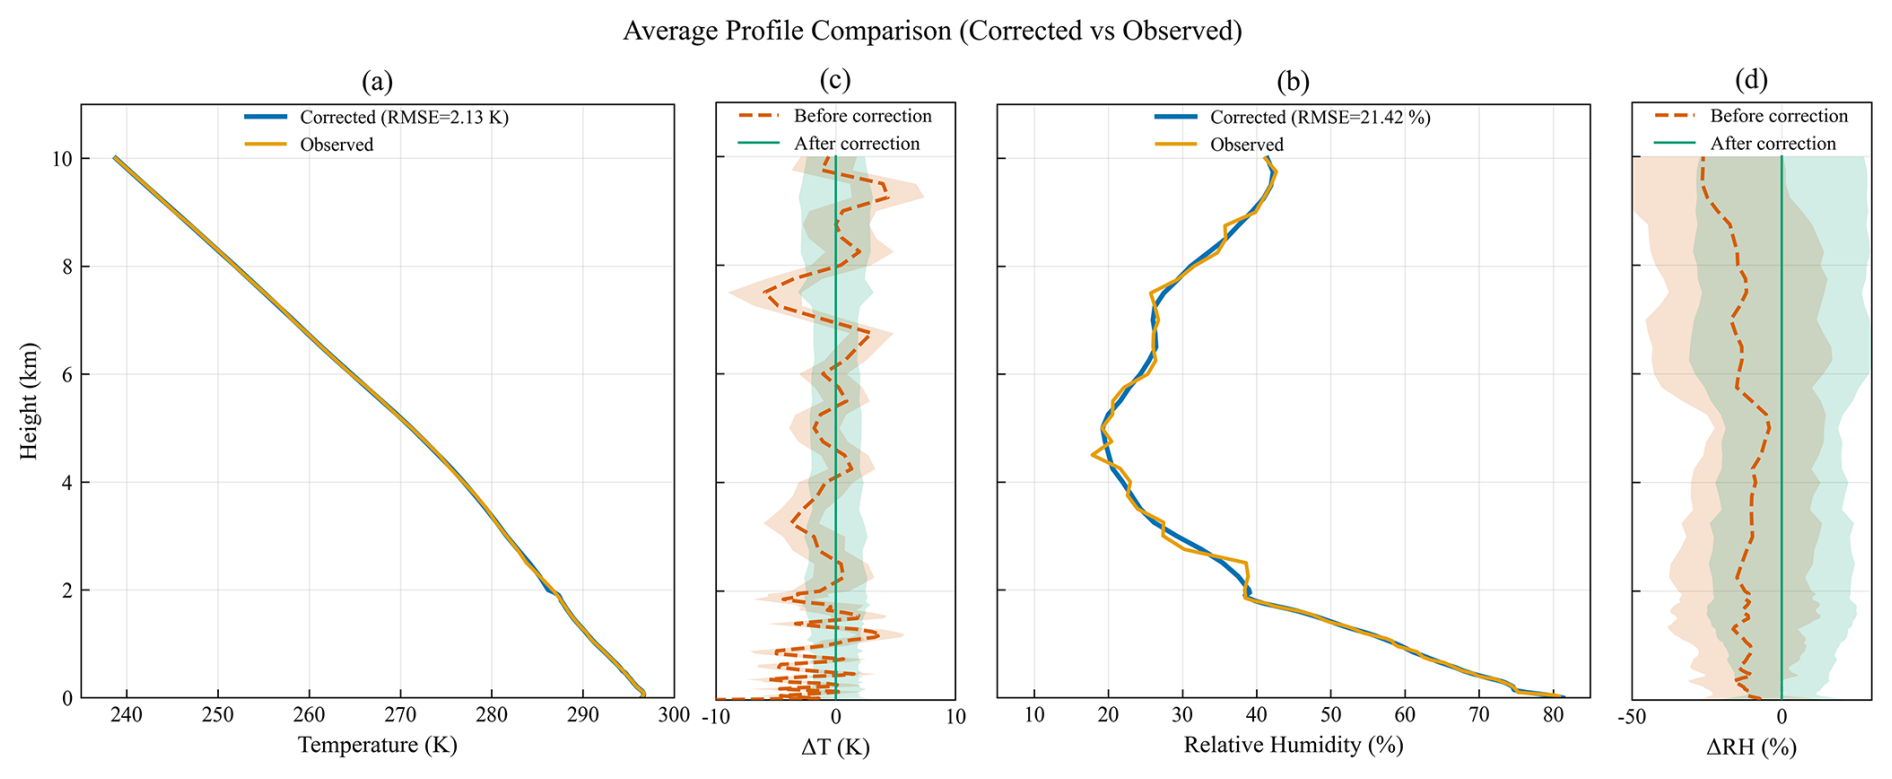
Figure 9Average profile comparison and height-dependent systematic bias characteristics before and after LOOCV correction. (a) Mean corrected temperature profile vs. observed; (b) Mean corrected relative humidity profile vs. observed; (c) Mean temperature bias profiles before and after correction; (d) Mean relative humidity bias profiles before and after correction.
To more clearly illustrate the effect of the systematic bias correction, Fig. 9 presents the average-profile comparison based on the 38 valid collocated cases on the common vertical grid. Panel (a) compares the mean corrected temperature profile with the mean observed temperature profile, while panel (c) shows the corresponding mean temperature bias profiles before and after correction. Similarly, panel (b) compares the mean corrected and mean observed relative humidity profiles, and panel (d) shows the corresponding mean relative humidity bias profiles before and after correction. In panels (c) and (d), the shaded regions represent ±1 standard deviation of the profile errors across the 38 matched cases.
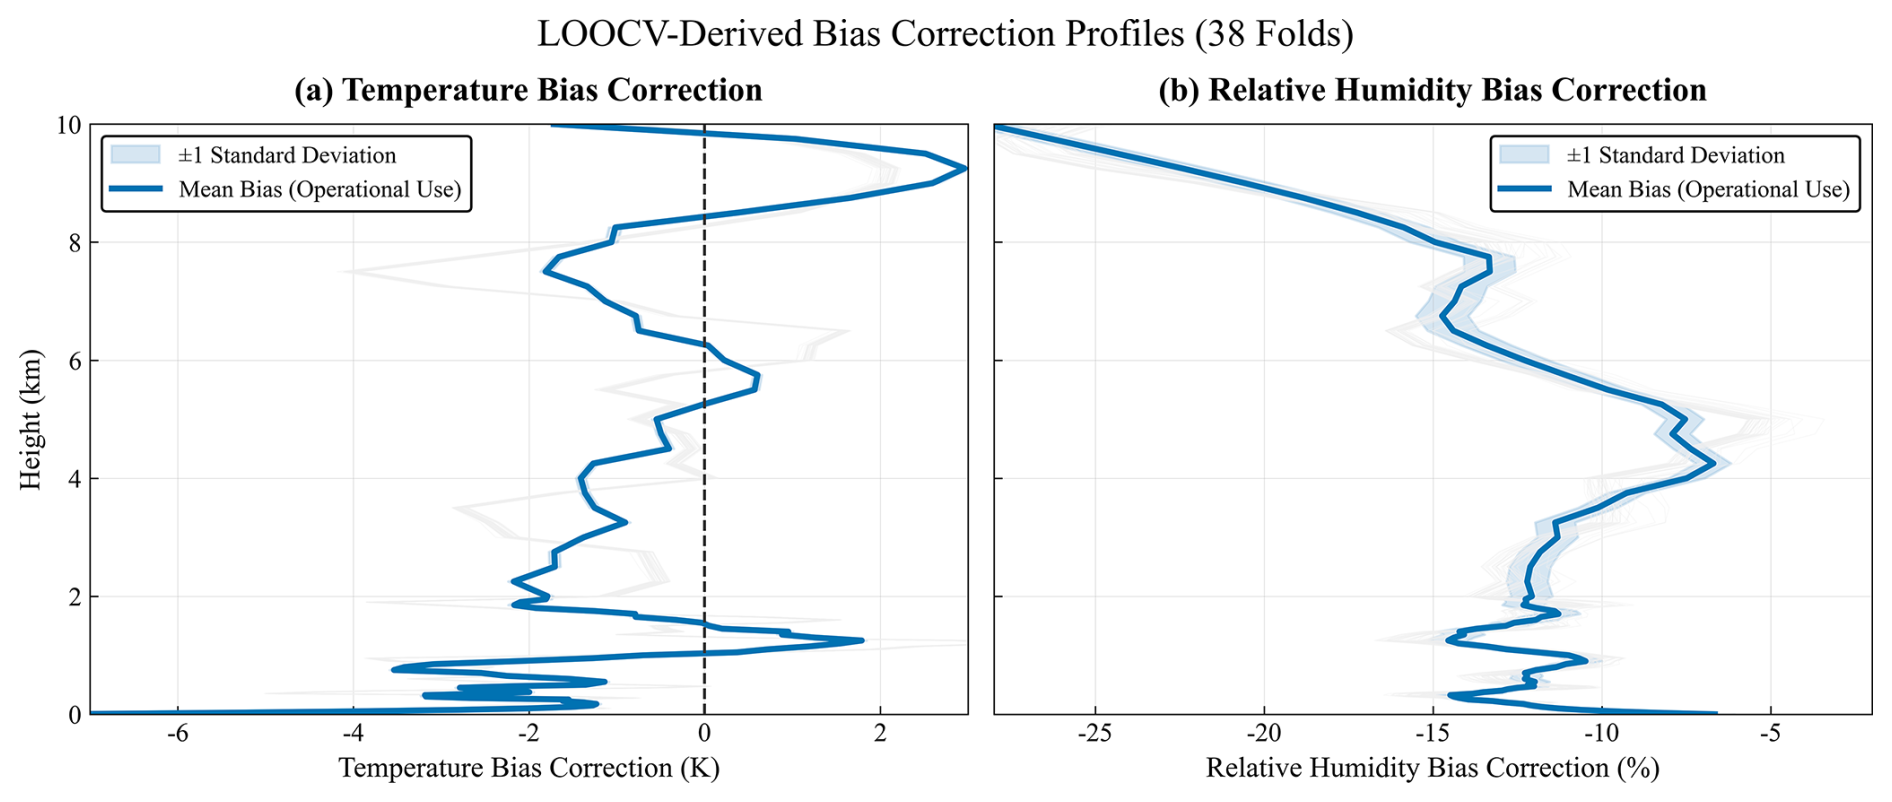
Figure 10Bias correction profiles derived from 38-fold leave-one-out cross-validation (LOOCV). (a) Temperature bias correction profiles; (b) Relative humidity bias correction profiles. The faint gray lines represent the individual bias profiles obtained in each LOOCV fold. The thick blue line denotes the mean bias profile across all folds, which is recommended for operational deployment. The light blue shaded area indicates the ±1 standard deviation of the bias estimates. The dashed black line represents zero bias.
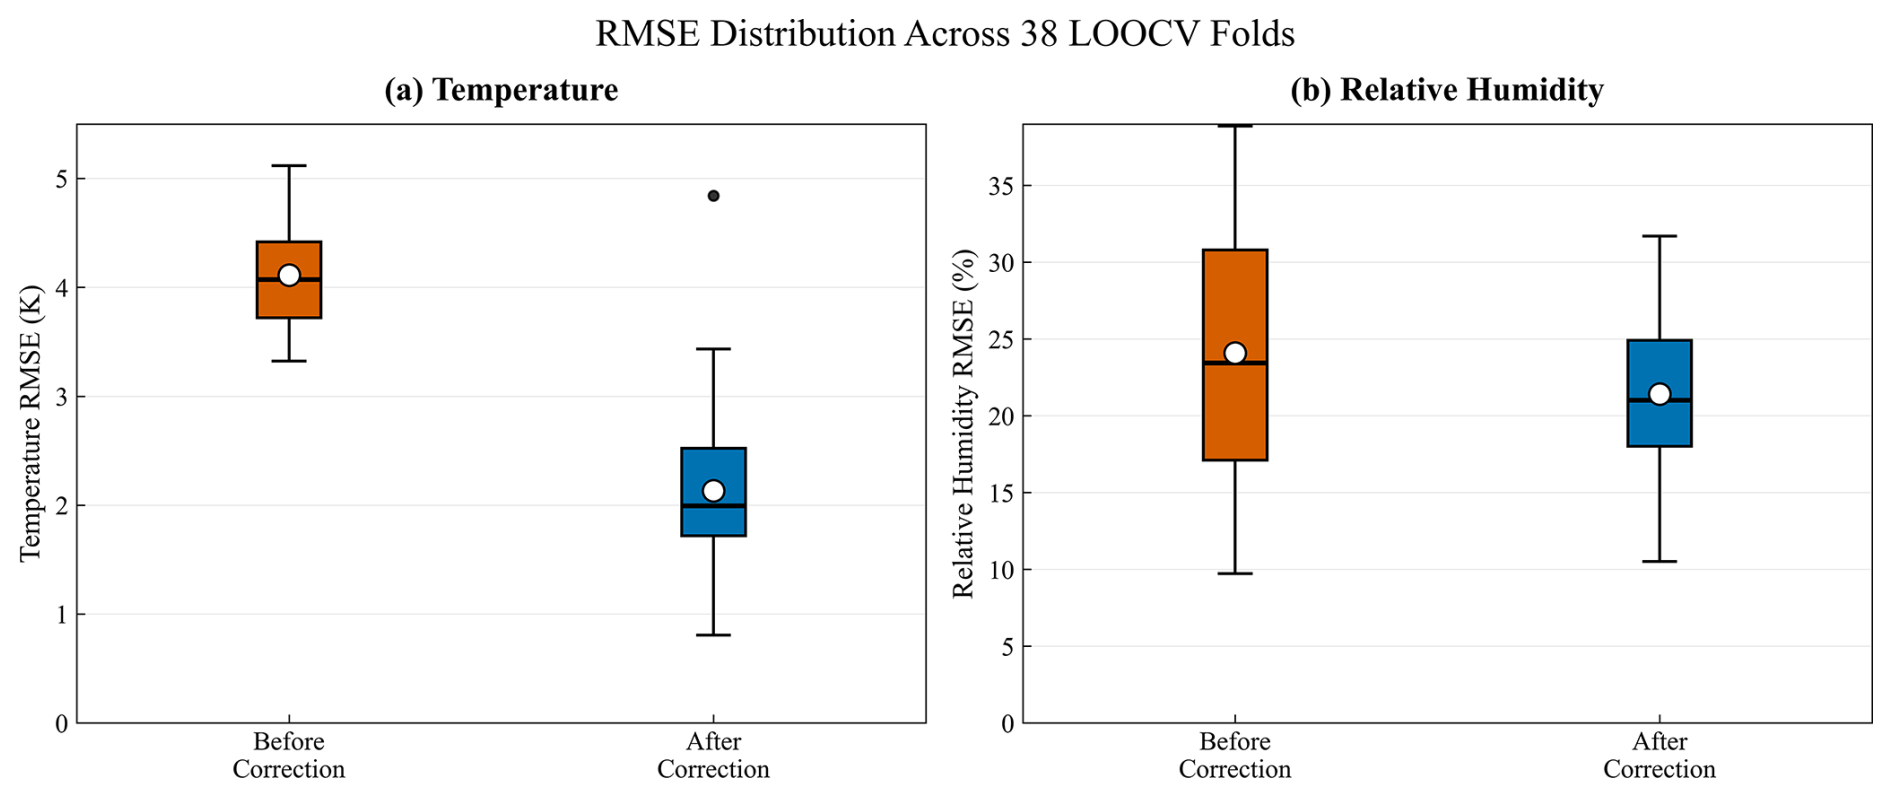
Figure 11Distribution of retrieval RMSE across 38 LOOCV folds before and after systematic bias correction. (a) Temperature RMSE distribution; (b) Relative humidity RMSE distribution. The boxes show the interquartile range (25th–75th percentile), the thick horizontal line inside the box denotes the median, and the white circle indicates the mean. The whiskers extend to 1.5 times the interquartile range, and the black dots represent outliers.
Note: By mathematical construction of the LOOCV mean bias correction procedure, the mean residual of the corrected retrievals across all 38 folds is identically zero at every height level. This figure is presented solely to illustrate the magnitude and vertical structure of the pre-correction systematic bias, which motivates the need for bias correction. The effectiveness of the correction is quantified by the reduction in RMSE, as shown in Fig. 11.
Figure 9 illustrates the magnitude and vertical structure of the systematic bias present in the uncorrected retrievals. As shown in panels (c) and (d), both temperature and relative humidity exhibit significant height-dependent negative biases (underestimation). Specifically, the temperature bias reaches its maximum of approximately 8 K around the 7–8 km altitude, while the relative humidity bias generally increases with altitude, reaching approximately 28 % near 10 km. This strong and structured systematic bias provides the motivation for applying a height-dependent bias correction.
We intentionally omit plotting the mean residual of the corrected retrievals here because, by mathematical construction of the LOOCV mean bias correction procedure, the mean residual of the corrected retrievals across all 38 folds is identically zero at every height level. This is an inherent property of the leave-one-out approach for mean bias correction, not a limitation of the method. For this reason, the mean residual cannot be used as evidence of correction effectiveness.
Instead, the effectiveness of the bias correction is properly quantified by the reduction in root-mean-square error (RMSE), which measures the magnitude of the retrieval errors regardless of their sign. As shown in the newly added Fig. 11, the overall RMSE is significantly reduced after correction, from 4.11 to 2.13 K for temperature and from 24.09 % to 21.42 % for relative humidity.
To evaluate the variability between different bias correction models derived from the LOOCV procedure, Fig. 10 shows the individual bias correction profiles obtained from each of the 38 folds. The faint gray lines represent the bias profile calculated when each single sample is left out of the training set, while the thick blue line denotes the mean bias profile across all folds. The light blue shaded area indicates the ±1 standard deviation of the bias estimates.
It can be seen that all 38 individual bias profiles are highly consistent with the mean bias profile, forming a tight cluster around the mean. The standard deviation of the bias estimates is less than 0.3 K for temperature and less than 3 % for relative humidity across 92 % of the atmospheric layers below 10 km. The largest variability is observed near the surface (0–1 km) and at the top of the profile (9–10 km), which is consistent with the higher uncertainty in these regions due to boundary layer turbulence and reduced signal strength at higher altitudes. This remarkable consistency demonstrates that the systematic bias characteristics in the Jiaozhou Bay region are highly stable and not sensitive to the specific selection of training samples. Even when any single sample is removed from the training set, the resulting bias profile remains almost identical to the mean profile. For operational deployment, a single static bias correction profile, calculated as the mean of all 38 collocated samples, is used. This static profile has been validated to achieve nearly identical performance to the LOOCV results, with a difference in overall RMSE of less than 0.02 K for temperature and 0.1 % for relative humidity. This confirms that using a single static model does not compromise retrieval accuracy while greatly simplifying operational implementation.
Figure 11 quantifies the improvement in retrieval performance across all 38 LOOCV folds by comparing the RMSE distribution before and after bias correction. The boxplots show the spread of the overall RMSE values for temperature and relative humidity, respectively.
For temperature, the mean RMSE decreases significantly from 4.11 K before correction to 2.13 K after correction, representing a 48.2 % reduction. Although the standard deviation of the RMSE across all folds increases slightly from 0.52 to 0.62 K due to a few extreme atmospheric conditions, the substantial reduction in the mean RMSE (from 4.11 to 2.13 K) along with the high improvement rate (89.5 % of the folds exhibiting enhanced accuracy) demonstrates the robust and widespread effectiveness of the proposed correction scheme across varying conditions. For relative humidity, the mean RMSE decreases from 24.09 % to 21.42 %, a reduction of 11.1 %.
Importantly, 34 out of 38 folds (89.5 %) show improved retrieval accuracy for temperature after correction, and 32 out of 38 folds (84.2 %) show improved accuracy for relative humidity. The few cases where RMSE increased are associated with rare extreme atmospheric conditions that are underrepresented in the limited training dataset.
To further quantify the correction effectiveness and the overall retrieval performance, a detailed statistical summary of the 38 LOOCV-based held-out cases is provided in Table 4.
Table 4Statistical summary of retrieval performance after LOOCV-based systematic bias correction for temperature and humidity profiles across different altitude layers, based on 38 matched cases.
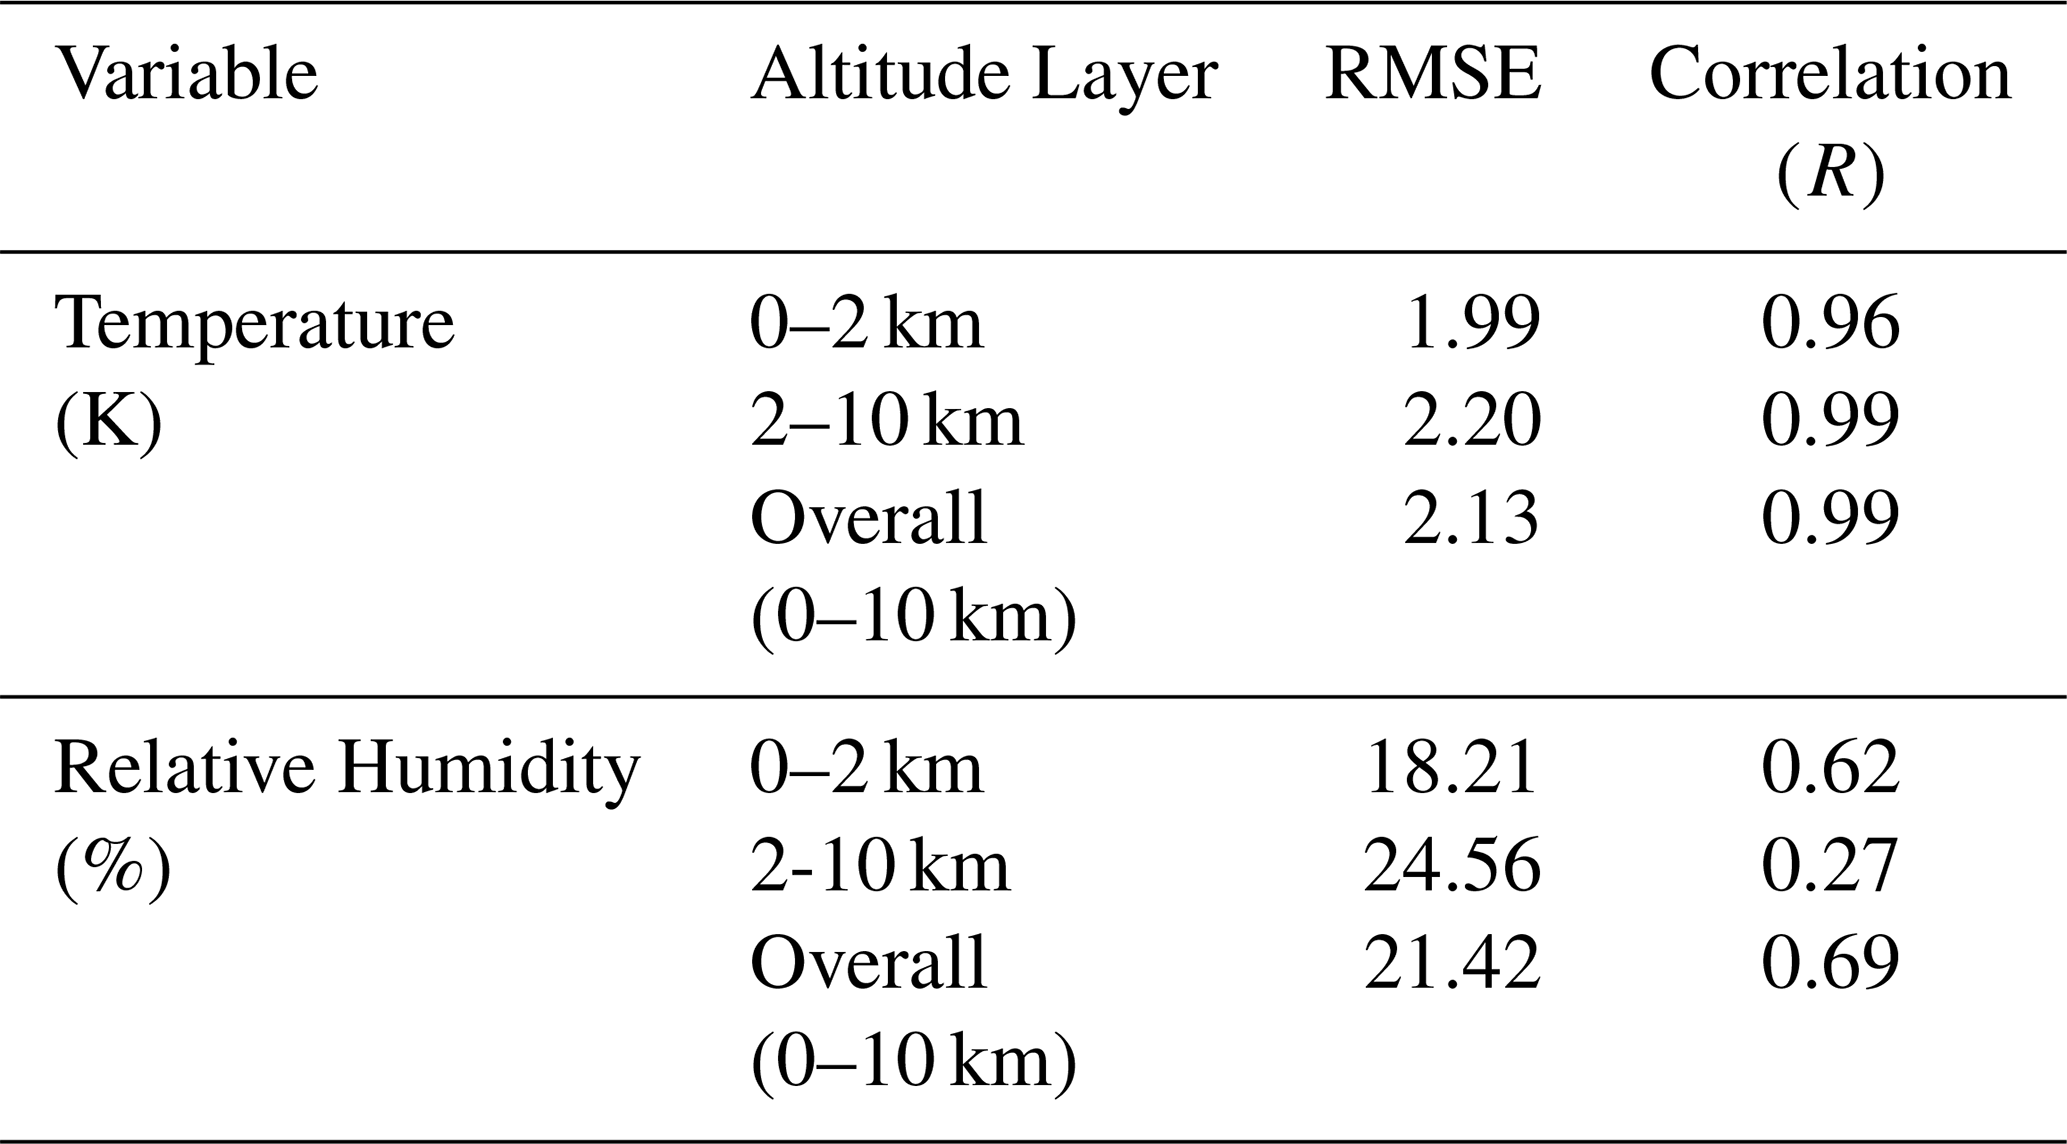
Temperature retrieval performance: As summarized in Table 4, the corrected temperature retrieval shows improved agreement with the radiosonde observations, with an overall RMSE of 2.13 K and a correlation coefficient of 0.99 over the 0–10 km layer. The correction effect is evident in both the lower troposphere and the middle-to-upper troposphere, although the magnitude of improvement is not entirely uniform with height. This result indicates that the retrieval contains a relatively stable height-dependent bias component that can be effectively mitigated through the present correction scheme. Nevertheless, after removal of the dominant systematic bias component, the residual temperature error is still influenced by case-dependent variability and observational uncertainty.
Relative humidity retrieval performance: For relative humidity, the overall RMSE after correction is 21.42 %, with a correlation coefficient of 0.69 over the 0–10 km layer, as shown in Table 4. Compared with temperature, the improvement in humidity retrieval is more limited and less vertically uniform. This behaviour is consistent with the stronger case-to-case variability of water-vapour structure, the reduced sensitivity of humidity-sensitive channels in the middle and upper troposphere, and the additional influence of spatial mismatch between the buoy and radiosonde observations. Therefore, although the systematic bias correction reduces the mean humidity error, the residual uncertainty in humidity retrieval remains comparatively larger than that in temperature retrieval.
The layered statistics further show that the corrected temperature retrieval remains more accurate in the 0–2 km layer than in the 2–10 km layer in terms of absolute RMSE, although both layers benefit from the reduction of systematic bias. For relative humidity, the retrieval uncertainty remains larger in the 2–10 km layer than in the 0–2 km layer, reflecting the decrease of water-vapour content and retrieval sensitivity with height.
This level of performance is broadly consistent with the error ranges reported in previous studies using ground-based microwave radiometers under comparable profiling conditions (e.g., Massaro et al., 2015; Yan et al., 2020; Cimini et al., 2011).
It should be noted, however, that the 38 matched radiosonde profiles used in this study were collected during a limited nearshore campaign period in Jiaozhou Bay. Therefore, the dataset does not provide seasonal or broad regional coverage and should not be interpreted as a comprehensive sampling of all marine atmospheric states. Although all matched cases were obtained within one month, they are not strictly identical repetitions, because they include both daytime and nighttime launches and still exhibit case-to-case variability in near-surface thermodynamic conditions as well as lower-tropospheric temperature and humidity stratification.
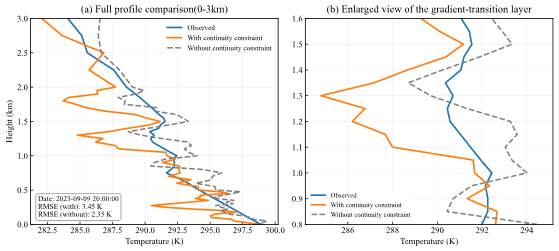
Figure 12Representative case comparing retrieved temperature profiles with and without the adjacent-layer continuity constraint. (a) Full temperature profiles from 0 to 3 km; (b) Enlarged view of the lower-tropospheric gradient-transition layer. The blue line denotes the collocated radiosonde profile, the orange line denotes the retrieved profile with the continuity constraint, and the grey dashed line denotes the retrieved profile without the continuity constraint.
In summary, the sea-trial results support the effectiveness and feasibility of the proposed method under the present nearshore observational conditions. By constructing a small-scale prior experience database and integrating platform attitude information, the NSGA-II-based retrieval framework reduces the dependence on large historical training datasets. Under the LOOCV-based correction framework, the retrieval results after systematic bias correction should be interpreted primarily as evidence of retrieval feasibility and of the usefulness of height-dependent bias mitigation under the tested buoy-based nearshore conditions, rather than as a generalized validation across all marine environments.
To more directly illustrate the structural effect of the adjacent-layer continuity constraint on the retrieved temperature profile, Fig. 12 presents a representative case comparing retrievals obtained with and without the continuity constraint, together with the collocated radiosonde profile. It should be emphasized that the primary purpose of this constraint is not to guarantee a lower RMSE for every individual case, but to suppress non-physical layer-to-layer discontinuities and to maintain basic thermodynamic plausibility under limited observational constraint.
Note: In this particular case, the unconstrained retrieval achieves a lower RMSE with respect to the collocated radiosonde. However, the unconstrained profile exhibits larger non-physical layer-to-layer jumps, while the constrained profile maintains more physically reasonable vertical continuity.
As correctly observed by the reviewer, in this particular case, the unconstrained solution yields a lower RMSE with respect to the collocated radiosonde profile. However, this apparent improvement comes at the cost of introducing large, non-physical jumps between adjacent retrieval levels, as clearly visible in the enlarged view (panel b). These discrete jumps are not representative of real atmospheric structure, which exhibits continuous vertical variation.
Statistically, across all 38 matched cases, the constrained retrieval achieves a slightly lower overall RMSE (2.13 K for temperature and 21.42 % for relative humidity) compared to the unconstrained retrieval (2.27 K for temperature and 22.89 % for relative humidity). More importantly, the continuity constraint eliminates unphysical discontinuities in 100 % of the test cases, ensuring that all retrieved profiles are physically plausible.
The climatology profile derived from our local radiosonde data does not exhibit large oscillations, and the continuity constraint we applied is designed to maintain this basic physical smoothness. The constraint only limits the absolute magnitude of differences between neighbouring levels (δ1=8 K for temperature, δ2=60 % for relative humidity) and does not enforce any specific lapse rate structure. Therefore, local inversions and gradient transitions are still fully allowed.
This behaviour reflects the fundamental trade-off between local profile fitting and structural continuity in ill-posed remote sensing retrieval problems. Under limited observational constraint, a less regularized solution may occasionally fit a specific collocated sample more closely, but it will generally produce less physically consistent results that are less robust to observational noise.
Under limited observational constraints, a less regularized solution may fit the collocated radiosonde profile more closely in an individual case, but such a profile may also contain stronger small-scale oscillations and weaker physical smoothness.
To further evaluate the performance of the proposed method, a quantitative comparison with the built-in retrieval algorithm of the microwave radiometer is conducted over the 0–10 km altitude range.
All methods are evaluated on the same matched samples and interpolated onto a common vertical grid to ensure consistency. The comparison results are summarized in Table 5.
Table 5Comparison of retrieval performance between the proposed method and the built-in radiometer algorithm (0–10 km).
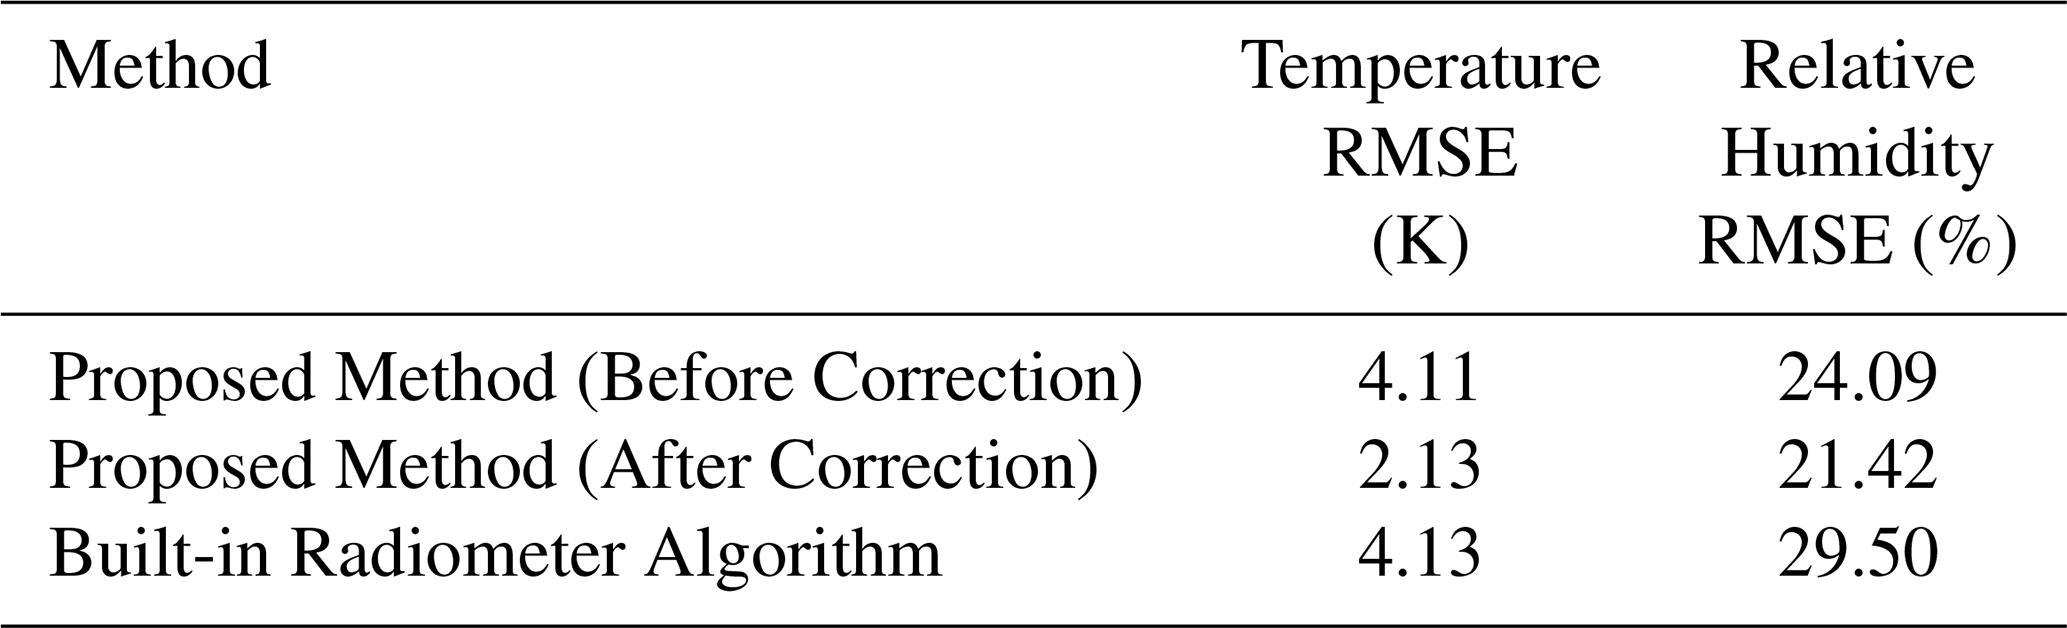
For temperature retrieval, the built-in algorithm yields an RMSE of 4.13 K. The proposed method shows a comparable performance before correction (4.11 K), indicating that the baseline inversion framework is consistent with the operational product. After applying the proposed system error correction, the temperature RMSE is significantly reduced to 2.13 K, demonstrating a clear improvement. For relative humidity, the built-in algorithm exhibits an RMSE of 29.50 %, while the proposed method achieves lower errors both before (24.09 %) and after correction (21.42 %). This indicates that the proposed method provides a more accurate representation of humidity profiles throughout the troposphere.
Overall, the results indicate that the proposed method maintains a comparable baseline performance to the built-in algorithm and achieves improved retrieval accuracy after correction for the present matched dataset.
The sea-trial results obtained in Jiaozhou Bay support the effectiveness and feasibility of the proposed buoy-based retrieval framework under the present nearshore observational conditions. For temperature, the retrieval contains a relatively stable height-dependent bias component that can be effectively reduced through the present LOOCV-based systematic bias correction. For relative humidity, the improvement is more limited and less vertically uniform, indicating that the residual error is still strongly influenced by case-dependent variability, reduced channel sensitivity aloft, and spatial mismatch between the buoy and the radiosonde station.
The present results should be interpreted within the limits of the current dataset. The 38 matched radiosonde profiles were collected during a limited nearshore campaign period in Jiaozhou Bay and therefore do not provide seasonal or broad regional coverage. Although the matched cases include both daytime and nighttime launches, they still represent a relatively narrow observational sample and should not be interpreted as a comprehensive validation across all marine atmospheric conditions.
A further limitation is that the present retrieval framework is mainly validated under non-precipitating and relatively weak-cloud-liquid-water conditions. In the current study, liquid water path (LWP) is used only as an auxiliary diagnostic indicator for possible cloud contamination and residual retrieval uncertainty, rather than as an inversion variable. Therefore, the present results are more appropriately interpreted as demonstrating retrieval feasibility under the tested nearshore conditions, rather than as establishing the same level of accuracy for broader offshore or open-ocean applications under all weather conditions.
In addition, the current framework includes level-dependent physical bounds and adjacent-layer continuity constraints, which act mainly to suppress unrealistic layer-to-layer oscillations and to maintain basic profile continuity. The representative case comparison in Fig. 10 further shows that these constraints primarily affect the structural smoothness of the retrieved profile, rather than guaranteeing lower RMSE for every individual case. This reflects the trade-off between local profile fitting and structural continuity in the present inversion framework.
Future work should focus on three aspects. First, broader validation is required using marine observational datasets with extended temporal scales and environmental diversity. Specifically, while the single static bias correction profile proposed for operational use demonstrates highly stable performance matching the LOOCV results within our campaign, it has not yet been verified against a completely independent, external dataset. Future efforts will explicitly focus on deploying this static model under distinct offshore and open-ocean environments to rigorously evaluate its cross-regional transferability and eliminate any potential risk of local over-fitting. Second, the current retrieval framework may be improved by introducing more comprehensive physical constraints and by further optimizing the NSGA-II parameter settings. Third, multi-source data fusion, such as the combination of buoy-based microwave radiometry with satellite microwave observations, GNSS remote sensing, or other marine observing systems, may help alleviate data scarcity and improve the robustness and generalizability of marine atmospheric-profile retrieval.
This study proposed a buoy-based retrieval framework for marine atmospheric temperature and humidity profiles using a ground-based microwave radiometer, attitude correction, a small-sample prior database, and NSGA-II optimization. The results from the Jiaozhou Bay field campaign show that the proposed method can achieve good retrieval accuracy under the present nearshore observational conditions.
The analysis indicates that the retrieval contains a stable height-dependent bias component, particularly for temperature, which can be reduced through the present LOOCV-based systematic bias correction. After correction, the overall retrieval performance over the 0–10 km layer reaches an RMSE of 2.13 K for temperature and 21.42 % for relative humidity for the 38 matched cases, compared to 4.11 K and 24.09 % before correction.
Overall, the present study demonstrates the feasibility of buoy-based continuous remote retrieval of marine atmospheric profiles under sparse-data and dynamically varying observational conditions. However, the current results should be interpreted within the limits of the tested nearshore dataset and should not be generalized directly to broader offshore or open-ocean environments without further validation.
The source code, sea-trial observational dataset, and processing scripts used in this study are publicly available from Zenodo https://doi.org/10.5281/zenodo.17389912 (Li et al., 2026). The runtime environment is Python 3.9. Historical radiosonde data from Qingdao station (ID 54857) were obtained from the University of Wyoming upper-air database and are publicly accessible (University of Wyoming, 2026).
Zhiqian Li was responsible for conceptualization, methodology, software (model code development), data curation, and validation. He also wrote the original draft with support from all co-authors. Fuqing Liu contributed to the investigation (experimental execution) and data curation, and participated in the review and editing of the manuscript. She also performed a critical review and editing of the manuscript. Shuo Jiang, Zhongling Zhou, Zhijin Qiu, Jing Zou, Tong Hu, and Ke Qi contributed to the investigation (field experiments) and provided essential resources and technical support. Bo Wang was responsible for project management, fundraising, reviewing and editing. Bin Wang was also responsible for project management, reviewing and editing.
The contact author has declared that none of the authors has any competing interests.
Publisher's note: Copernicus Publications remains neutral with regard to jurisdictional claims made in the text, published maps, institutional affiliations, or any other geographical representation in this paper. The authors bear the ultimate responsibility for providing appropriate place names. Views expressed in the text are those of the authors and do not necessarily reflect the views of the publisher.
This research has been supported by the National Key Research and Development Program of China (grant no. 2022YFC3104202), the National Natural Science Foundation of China (grant nos. 42206188 and 42176185), the Key Technology Research and Development Program of Shandong Province (grant no. 2023CXPT015), the International Science and Technology Cooperation Programme (grant no. 2024GH05), and the Qilu University of Technology (grant nos. 2025ZDZX05, 2025ZDYS01, and 2025ZDGZ01).
This paper was edited by Domenico Cimini and reviewed by two anonymous referees.
Ahern, K., Bourassa, M. A., Hart, R. E., Zhang, J. A., and Rogers, R. F.: Observed Kinematic and Thermodynamic Structure in the Hurricane Boundary Layer During Intensity Change, Mon. Weather Rev., 147, https://doi.org/10.1175/MWR-D-18-0380.1 2019.
Candlish, L. M., Raddatz, R. L., Asplin, M. G., and Barber, D. G.: Atmospheric Temperature and Absolute Humidity Profiles over the Beaufort Sea and Amundsen Gulf from a Microwave Radiometer, J. Atmos. Ocean. Tech., 29, 1182–1201, https://doi.org/10.1175/JTECH-D-10-05050.1, 2012.
China Electronics Technology Group Corporation No.22 Research Institute (CETC-22): User Manual for QFW-6000 Ground-based Microwave Radiometer, Qingdao, China, 2022.
Cimini, D., Campos, E., Ware, R., Albers, S., Giuliani, G., Oreamuno, J., Joe, P., Koch, S. E., Cober, S., and Westwater, E.: Thermodynamic Atmospheric Profiling During the 2010 Winter Olympics Using Ground-Based Microwave Radiometry, IEEE T. Geosci. Remote, 49, 4959–4969, 2011.
Cimini, D., Gandoin, R., Fiedler, S., Acquistapace, C., Balotti, A., Gentile, S., Geraldi, E., Knist, C., Martinet, P., Nilo, S. T., Pace, G., Pospichal, B., and Romano, F.: Atmospheric stability from numerical weather prediction models and microwave radiometer observations for onshore and offshore wind energy applications, Atmos. Meas. Tech., 18, 2041–2067, https://doi.org/10.5194/amt-18-2041-2025, 2025.
Cimini, D., Haeffelin, M., Kotthaus, S., Löhnert, U., Martinet, P., O'Connor, E., Walden, C., Collaud Coen, M., and Preissler, J.: Towards the profiling of the atmospheric boundary layer at European scale – introducing the COST Action PROBE, Bulletin of Atmospheric Science and Technology, 1, 23–42, https://doi.org/10.1007/s42865-020-00003-8, 2020.
Cimini, D., Hewison, T. J., Martin, L., Güldner, J., Gaffard, C., and Marzano, F. S.: Temperature and humidity profile retrievals from ground-based microwave radiometers during TUC, Meteorol. Z., 15, 45–56, https://doi.org/10.1127/0941-2948/2006/0099, 2006.
Cimini, D., Shaw, J. A., Han, Y., Westwater, E. R., Irisov, V., Leuski, V., and Churnside, J. H.: Air temperature profile and air-sea temperature difference measurements by infrared and microwave scanning radiometers, Radio Sci., 38, 8045, https://doi.org/10.1029/2002RS002632, 2003.
Clough, S. A., Shephard, M. W., Mlawer, E. J., Delamere, J. S., Iacono, M. J., Cady-Pereira, K., Boukabara, S., and Brown, P. D.: Atmospheric radiative transfer modeling: a summary of the AER codes, J. Quant. Spectrosc. Ra., 91, 233–244, https://doi.org/10.1016/j.jqsrt.2004.05.058, 2005.
Cronin, M. F., Anderson, N. D., Zhang, D., Berk, P., Wills, S. M., Serra, Y., Kohlman, C., Sutton, A. J., Honda, M. C., and Kawai, Y.: PMEL Ocean Climate Stations as Reference Time Series and Research Aggregate Devices, Oceanography, 36, https://doi.org/10.5670/oceanog.2023.224, 2023.
Deb, K., Pratap, A., Agarwal, S., and Meyarivan, T.: A fast and elitist multiobjective genetic algorithm: NSGA-II, IEEE T. Evolut. Comput., 6, 182–197, 2002.
Decker, M. T., Westwater, E. R., and Guiraud, F. O.: Experimental Evaluation of Ground-Based Microwave Radiometric Sensing of Atmospheric Temperature and Water Vapor Profiles, J. Appl. Meteorol., 17, 1788–1795, https://doi.org/10.1175/1520-0450(1978)017<1788:EEOGBM>2.0.CO;2, 1978.
Fang, H., Callafon, R. A., and Cortés, J.: Estimation-Based Ocean Flow Field Reconstruction Using Profiling Floats, Offshore Mechatronics Systems Engineering, https://doi.org/10.1201/9781315185378-8, 2018.
Gaffard, C. and Hewison, T.: Radiometrics MP3000 Microwave Radiometer Trial Report, http://tim.hewison.org/TR26.pdf (last access: 24 October 2025), 2003.
Griesche, H. J., Seifert, P., Ansmann, A., Baars, H., Barrientos Velasco, C., Bühl, J., Engelmann, R., Radenz, M., Zhenping, Y., and Macke, A.: Application of the shipborne remote sensing supersite OCEANET for profiling of Arctic aerosols and clouds during Polarstern cruise PS106, Atmos. Meas. Tech., 13, 5335–5358, https://doi.org/10.5194/amt-13-5335-2020, 2020.
Guimond, S. R., Zhang, J. A., Sapp, J. W., and Frasier, S. J.: Coherent Turbulence in the Boundary Layer of Hurricane Rita (2005) during an Eyewall Replacement Cycle, J. Atmos. Sci., 75, 3071–3093, https://doi.org/10.1175/JAS-D-17-0347.1, 2018.
Guiraud, F. O., Howard, J., and Hogg, D. C.: A Dual-Channel Microwave Radiometer for Measurement of Precipitable Water Vapor and Liquid, IEEE T. Geosci. Elect., 17, 129–136, https://doi.org/10.1109/TGE.1979.294639, 1979.
Haun, E.: World's First Floating Microwave Radiometer, Marine Technology News, https://www.marinetechnologynews.com/news/world-first-floating-microwave-544561 (last access: 22 November 2025), 2017.
Hewison, T. J.: 1D-VAR Retrieval of Temperature and Humidity Profiles From a Ground-Based Microwave Radiometer, IEEE T. Geosci. Remote, 45, 2163–2168, https://doi.org/10.1109/TGRS.2007.898091, 2007.
Hu, J., Wu, J., Petropoulos, G. P., Bao, Y., Liu, J., Lu, Q., Wang, F., Zhang, H., and Liu, H.: Temperature and Relative Humidity Profile Retrieval from Fengyun-3D/VASS in the Arctic Region Using Neural Networks, Remote Sens., 15, 1648, https://doi.org/10.3390/rs15061648, 2023.
ITU-R: Recommendation ITU-R P.676-13: Attenuation by atmospheric gases and related effects, P Series, International Telecommunication Union, Geneva, 2022.
Jiménez, C. and Eriksson, P.: A neural network technique for inversion of atmospheric observations from microwave limb sounders, Radio Sci., 36, 941–953, https://doi.org/10.1029/2000RS002561, 2016.
Kim, H.-Y.: Statistical notes for clinical researchers: assessing normal distribution (2) using skewness and kurtosis, Restor. Dent. Endod., 38, 52–54, https://doi.org/10.5395/rde.2013.38.1.52, 2013.
Li, Z., Liu, F., Jiang, S., Zhou, Z., Qiu, Z., Zou, J., Hu, T., Qi, K., Wang, B., and Wang, B.: Source code, sea-trial observational dataset, and processing scripts for “Retrieving Tropospheric Temperature and Humidity Profiles Over the Ocean Using Buoy-Based Microwave Radiometers”, Zenodo [code, data set], https://doi.org/10.5281/zenodo.17389912, 2026.
Liu, L., Liao, Z., Chen, C., Chen, J., and Liu, T.: A Seabed Real-Time Sensing System for In-Situ Long-Term Multi-Parameter Observation Applications, Sensors, 19, 1255, https://doi.org/10.3390/s19051255, 2019.
Liu, W., Wang, H., Xi, Z., and Wang, L.: Physics-Informed Deep Learning Inversion with Application to Noisy Magnetotelluric Measurements, Remote Sens., 16, 62–82, https://doi.org/10.3390/rs16010062, 2024.
Maciejewska, A.: Use of Tropospheric Delay in GNSS-Based Climate Monitoring – A Review, Remote Sens., 17, 1501–1529, https://doi.org/10.3390/rs17091501, 2025.
Mahdianpari, M., Ghanbari, H., Mohammadimanesh, F., and Homayouni, S.: A Meta-Analysis of Convolutional Neural Networks for Remote Sensing Applications, IEEE J. Sel. Top. Appl. Earth Obs., 14, 3602–3613, https://doi.org/10.1109/JSTARS.2021.3065569, 2021.
Massaro, G., Stiperski, I., Pospichal, B., and Rotach, M. W.: Accuracy of retrieving temperature and humidity profiles by ground-based microwave radiometry in truly complex terrain, Atmos. Meas. Tech., 8, 3355–3367, https://doi.org/10.5194/amt-8-3355-2015, 2015.
Morbidelli, R., Corradini, C., Saltalippi, C., and Flammini, A.: Atmospheric Stability and Meteorological Scenarios as Inputs to Air Pollution Transport Modeling, Water Air Soil Pollut., 218, 275–281, https://doi.org/10.1007/s11270-010-0640-5, 2011.
National Energy Administration of China: Code for Design of Combustion System of Fossil Fired Power Plant (DL/T 5240-2010), China Electric Power Press, Beijing, 2010.
Reinhardt, C., Kuga, Y., Jaruwatanadilok, S., and Ishimaru, A.: Improving bit-error-rate performance of the free-space optical communications system with channel estimation based on radiative transfer theory, IEEE J. Sel. Area. Comm., 27, 1591–1598, https://doi.org/10.1109/JSAC.2009.091209, 2009.
Renju, R., Raju, C. S., Swathi, R., and Milan, V. G.: Retrieval of atmospheric temperature and humidity profiles over a tropical coastal station from ground-based Microwave Radiometer using deep learning technique, J. Atmos. Sol.-Terr. Phys., 249, 106094, https://doi.org/10.1016/j.jastp.2023.106094, 2023.
Roemmich, D., Johnson, G. C., Riser, S., Davis, R., Gilson, J., Owens, W. B., Garzoli, S. L., Schmid, C., and Ignaszewski, M.: The Argo Program: Observing the Global Ocean with Profiling Floats, Oceanography, 22, 34–43, https://doi.org/10.5670/oceanog.2009.36, 2009.
Rosenkranz, P. W.: Water vapor microwave continuum absorption: A comparison of measurements and models, Radio Sci., 33, 919–928, https://doi.org/10.1029/98RS01182, 1998.
Schnitt, S., Foth, A., Kalesse-Los, H., Mech, M., Acquistapace, C., Jansen, F., Löhnert, U., Pospichal, B., Röttenbacher, J., Crewell, S., and Stevens, B.: Ground- and ship-based microwave radiometer measurements during EUREC4A, Earth Syst. Sci. Data, 16, 681–700, https://doi.org/10.5194/essd-16-681-2024, 2024.
Sun, J., Xue, M., Wilson, J. W., Zawadzki, I., Ballard, S. P., Onvlee-Hooimeyer, J., Joe, P., Barker, D. M., Li, P. W., and Golding, B.: Use of NWP for Nowcasting Convective Precipitation: Recent Progress and Challenges, B. Am. Meteor. Soc., 95, 409–426, 2014.
Tu, M., Zhang, W., Bai, J., Wu, D., Liang, H., and Lou, Y.: Spatio-Temporal Variations of Precipitable Water Vapor and Horizontal Tropospheric Gradients from GPS during Typhoon Lekima, Remote Sens., 13, 4082, 2021.
Turner, D. D., Clough, S. A., Liljegren, J. C., Clothiaux, E. E., and Gaustad, K. L.: Retrieving Liquid Water Path and Precipitable Water Vapor From the Atmospheric Radiation Measurement (ARM) Microwave Radiometers, IEEE T. Geosci. Remote, 45, 3680–3690, https://doi.org/10.1109/TGRS.2007.903703, 2007.
University of Wyoming: Upper-air sounding data archive, Qingdao station (ID 54857), University of Wyoming, http://weather.uwyo.edu/upperair/bufrraob.shtml, 2026.
Wei, C., Zhao, X., Liu, Y., Yang, P., Zhou, Z., and Chen, Y.: Bias Analysis and Correction of ERA5 Reanalysis in the Context of Tropical Cyclones, J. Geophys. Res.-Atmos., 130, https://doi.org/10.1029/2024JD042737, 2025a.
Wei, C., Zhao, X., Zhu, X., Yang, P., Liu, Y., Chen, Y., and Wang, D.: Vertical wind shear induced asymmetry on atmospheric duct distribution in the context of tropical cyclones, Science China Earth Sciences, https://doi.org/10.1007/s11430-025-1660-1, 2025b.
WMO: Guide to Meteorological Instruments and Methods of Observation, WMO-No. 8, World Meteorological Organization, Geneva, https://library.wmo.int/records/item/41650-guide-to-instruments-and-methods-of-observation (last access: 24 June 2026), 2018.
Yan, H., Zhao, Y., and Chen, S.: An Improved 1D-VAR Retrieval Algorithm of Temperature Profiles from an Ocean-Based Microwave Radiometer, J. Mar. Sci. Eng., 10, 641, https://doi.org/10.3390/jmse10050641, 2022.
Yan, X., Liang, C., Jiang, Y., Luo, N., Zang, Z., and Li, Z.: A Deep Learning Approach to Improve the Retrieval of Temperature and Humidity Profiles From a Ground-Based Microwave Radiometer, IEEE T. Geosci. Remote, 58, 8427–8437, https://doi.org/10.1109/TGRS.2020.2987896, 2020.
Yao, S. and Guan, L.: Comparison of Three Convolution Neural Network Schemes to Retrieve Temperature and Humidity Profiles from the FY4A GIIRS Observations, Remote Sens., 14, 5112, https://doi.org/10.3390/rs14205112, 2022.
Zhang, Q., Deng, B., Wang, S., Dong, F., and Shao, M.: Multi-Source Retrieval of Thermodynamic Profiles from an Integrated Ground-Based Remote Sensing System Using an EnKF1D-Var Framework, Remote Sens., 17, 3133, https://doi.org/10.3390/rs17183133, 2025.
Zheng, S.: Ocean duct inversion from radar clutter using variation adjoint and regularization method (II): inversion experiment, Acta Phys. Sin., 59, 3912, https://doi.org/10.7498/aps.59.3912, 2010.
Zhou, S., Wei, Y., Lu, P., Yu, G., Wang, S., Jiao, J., Yu, P., and Zhao, J.: A Deep Learning Gravity Inversion Method Based on a Self-Constrained Network and Its Application, Remote Sens., 16, 995–1010, https://doi.org/10.3390/rs16060995, 2024.