
the Creative Commons Attribution 4.0 License.
the Creative Commons Attribution 4.0 License.
 | 08 Jul 2026
Investigation of supercooled water droplet sticking efficiency during power transmission line icing using digital holography
Pu Zhang
Dengxin Hua
Jiang Cheng
Jingjing Liu
Xiang Xu
Yitong Miao
Jun Wang
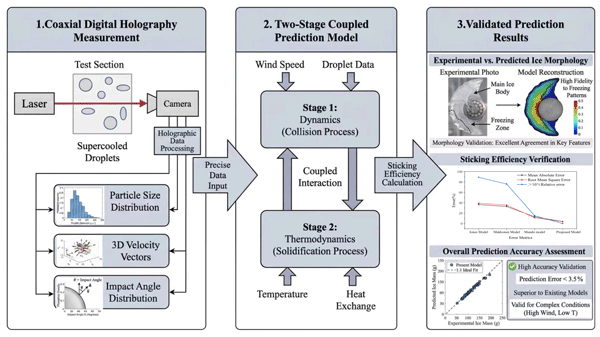
Transmission line icing severely threatens the safety of the power grid. Accurate prediction of the sticking efficiency (the proportion of supercooled droplets that remain on the conductor after impact, excluding bouncing and splashing) is critical for preventing and mitigating icing disasters. Traditional prediction models for sticking efficiency typically exhibit significant errors under complex conditions (e.g., varying wind speeds and precipitation intensities), thereby limiting their practical applications. To overcome this limitation, a two-stage coupled model based on coaxial digital holography was proposed. In this model, the diameters, velocities, and collision angles of supercooled droplets were accurately measured and incorporated into a two-stage framework that couples droplet impact dynamics with thermodynamic processes to calculate sticking efficiency. For the laboratory and field-validation cases examined in this study, the prediction errors of the proposed model remained below 3.5 % under various conditions, representing a significant improvement over traditional models and underscoring its enormous potential in engineering applications.
- Article
(5474 KB) - Full-text XML
- BibTeX
- EndNote


Accidents (such as tower collapses, wire breakages, and flashover trips) caused by transmission line icing seriously threaten the safety of power grids. Therefore, accurately predicting transmission line icing conditions is crucial for preventing and mitigating ice-related disasters (Wang et al., 2024). Among various prediction methods, physical icing models are considered the most precise paradigm for predicting transmission line icing, and the accurate calculation of their relevant parameters has long been a focus of researchers (Hou et al., 2024). In physical icing models, the ice accretion rate on transmission lines is typically determined by the collision efficiency, sticking efficiency, and freezing efficiency of supercooled raindrops. In the present study, sticking efficiency is defined as the fraction of incident supercooled droplets that remain adhered to the conductor surface after impact, excluding losses caused by rebound, splashing, and aerodynamic stripping. Among these, sticking efficiency has long been regarded as a challenging and overlooked aspect of research. In recent years, although some progress has been made in calculating sticking efficiency through numerical simulations and artificial intelligence applications, there are still significant deficiencies in experimental observations and theoretical modeling of the sticking efficiency mechanism. Makkonen and Stallabrass (2019) have utilized high-speed photography to observe droplet impact dynamics, which improves the accuracy of droplet velocity measurements but fails to accurately determine the collision angle of droplets impacting the transmission line surface. Jiang et al. (2021) have employed Laser diffraction-based characterization to measure the particle size distribution of raindrops in freezing rain; however, it's unable to measure the three-dimensional (3D) motion vector of single droplets (Jiang et al., 2021). Kringlebotn Nygaard et al. (2013) have modified the Makkonen model for wet snow accretion by introducing an adhesion parameterization scheme based on liquid water content, but it still could not describe the complex impact process of supercooled water droplets (Kringlebotn Nygaard et al., 2013). Liu et al. (2024) have introduced physics-informed neural networks (PINNs) to solve the icing flow field. Although the accuracy is high within the interpolation range, the model's extrapolation ability under high turbulence conditions is poor due to the lack of physical constraints for extreme splashing scenarios (Liu et al., 2024). Snaiki et al. (2024) have developed a neural network based on meta-heuristic optimization, which improves data fitting but relies on macroscopic observational data from meteorological stations and lacks an explanation of the micro-physical mechanisms of icing (Snaiki et al., 2024). The computational fluid dynamics-discrete element method (CFD-DEM) coupled model established by Gao et al. (2024) considers the two-way coupling of micron-sized droplets and conductor vibration but neglects the shear effect of oblique droplet impact (Gao et al., 2024). In summary, current research on the sticking efficiency of transmission line icing faces problems of missing measurements for wind speed, temperature, particle size, and collision angle, failing to comprehensively account for the combined effects of dynamic and thermodynamic factors during the icing process. Limited by these issues, existing icing collection rate models often exhibit errors exceeding 30 % under complex operating conditions, making it difficult to meet the needs of practical prediction.
Digital holography technology records and reconstructs the interference patterns of light waves, and when combined with image processing technology, it can acquire information about particle number, size, shape, and spatial distribution (Gao, 2024; Javidi et al., 2021; Khodadad, 2024). In the present context, this means that the reconstruction does not rely on an a priori assumption of spherical particles and can therefore be applied to droplets or fragments with non-spherical or dynamically evolving shapes. With the rapid development of computers and high-resolution CCD or CMOS sensors, it has been widely used in fields such as medical imaging (Huang and Cao, 2024; Mihaylova, 2024), holographic projection (Blinder et al., 2022), cloud microphysics (Chambers et al., 2024; Fuchs et al., 2025), non-destructive testing (Osten and Pedrini, 2022), and particle field measurement (Kumar and Hong, 2025; Yang et al., 2024). Building on this, this study employs a coaxial digital holographic 3D measurement system to achieve synchronous and precise measurement of the particle size distribution, spatial motion trajectory, and collision angle of supercooled raindrops. Based on these measurements, this study develops a two-stage coupled model for icing sticking efficiency that integrates the dynamic collision process with thermodynamic solidification. The proposed model overcomes the limitations of traditional isolated models, which are typically applicable only to specific scenarios. For the validation cases considered in this study, the prediction error of sticking efficiency is reduced to below 3.5 % relative to the corresponding laboratory or field reference values, providing technical support for early warning and protection against transmission line icing.
Transmission line icing is fundamentally a dynamic process, in which supercooled raindrops collide with the conductor, then adhere, and finally freeze and accumulate. The outcome of a supercooled droplet's impact is jointly determined by both the dynamic attachment process and the thermal freezing process (Fu et al., 2006).
The dynamic attachment of a supercooled droplet to the conductor depends on the competition between inertia and surface tension (Zhang et al., 2020). When a droplet strikes the conductor at a given speed, inertia drives it to diffuse along the surface of the conductor into a thin film, while the surface tension of the droplet resists diffusion and tends to pull the droplet back into a spherical shape. The relative strength of these two effects can be characterized by the dimensionless Weber number (We), defined as the ratio of the droplet's kinetic energy upon impact to the surface tension's restorative energy. In other words, the Weber number represents the magnitude of inertial force relative to the capillary force. The Weber number can be expressed as:
where ρ is the droplet density, vd is the incoming velocity of the droplet, d is the droplet diameter, θ is the angle between the droplet's velocity vector and the wire's surface normal, and σ is the surface tension. The Weber number quantifies the degree to which the droplet's kinetic energy drives diffusion deformation upon impact: when We>1, inertia dominates and the droplet will completely diffuse and may even splash and break up; when We≤1, the surface tension prevails and the droplet tends to remain intact and adhere. Under the competition between inertia and capillarity, a critical Weber number Wecr serves as the criterion for whether the droplet will adhere. If We<Wecr, the droplet can fully adhere to the surface; if We>Wecr, the droplet will fragment and splash, failing to adhere.
The core of the thermal freezing process lies in the heat transfer and equilibrium when a supercooled droplet undergoes liquid-solid phase change upon contacting the surface of the subfreezing conductor. Once a droplet attaches to a conductor surface below 0 °C, the supercooling ΔT drives heat transfer from the droplet to the conductor at the solid-liquid interface, eliminating the latent heat released by the droplet during freezing. For a droplet to freeze completely, the rate of heat conduction must balance the rate of the latent heat release, so as to remove all the latent heat prior to droplet detaches. The different dimensions of the heat conduction rate and the total latent heat, make it hard to compare them directly. Therefore, the effective contact time tc (the time the droplet remains attached to the conductor) and the minimum freezing time tf (the minimum time required for the droplet to solidify) are introduced. The freezing time of a droplet is directly proportional to the square of its characteristic size and inversely proportional to its degree of supercooling. Accordingly, a dimensional analysis gives the approximate relation:
where L is the latent heat of fusion of water per unit mass, and k is the thermal conductivity. Equation (2) indicates that the freezing time can be prolonged by larger droplets while shortened by a greater ambient supercooling. Therefore, the success criterion for the thermal phase lies in that the droplet must be completely frozen before separate, namely, the effective contact time of the droplet must be greater than or equal to its minimum freezing time.
In summary, only by precisely obtaining key physical parameters of the supercooled droplets – such as their size, impact velocity, and collision angle – can the sticking efficiency be calculated accurately. For this purpose, a coaxial digital holographic 3D measurement system is used to measure these parameters.
Coaxial digital holography offers a simple optical setup, high information density, and minimal dual image interference in the far field, enabling its extensive application in recording and reconstructing three dimensional dynamic fields (Chen et al., 2021; Liu et al., 2021; Zhou, 2024). When a planar laser wave illuminates the particle field, the light diffracted by a particle (object beam) will interfere with the undisturbed reference beam. The interference pattern is recorded as a digital hologram. Afterwards, using the Fresnel-Kirchhoff diffraction formula, the object wave can be numerically reconstructed. According to scalar diffraction theory, if the measurement volume contains n particles, the reconstructed wave field UR(u,v) (Goodman, 1968; Gao et al., 2021) at the reconstruction plane coordinates (u,v) is given by the follows:
where λ is the laser wavelength; R(x,y) is the reference wave; IH(x,y) is the intensity of the interference fringes of the hologram; k is the wavenumber; x and y are the horizontal and vertical coordinates in the particle focal plane, respectively; u and v are the horizontal and vertical coordinates in the hologram reconstruction plane, respectively; and zr=zi (i=1, 2, 3 …) are reconstruction distances. Equation (3) represents the reconstructed wave field generated by the superposition of the contributions from the n particles contained within the sampled measurement volume. A particle located at a reconstruction distance zr will be focused on the reconstruction plane. By reconstructing the hologram at a series of different distances zr, information about all particles within the sampled volume can be obtained. By applying an image fusion technique – specifically, a grayscale gradient variance method combined with a third-order Laplacian pyramid fusion algorithm – to the reconstructed digital images, the droplet particle sizes and three-dimensional positions can be measured with high accuracy. The application of a particle image recognition algorithm to the particles in the sampled volume yields the particle count.
By recording the time series of holograms through multiple exposures, the motion trajectories of the droplets can be obtained. In the reconstructed sequential particle images, each particle is tagged frame by frame and its 3D coordinates are extracted. The displacement of a particle between two successive frames is:
from which the instantaneous droplet impact velocity can be determined using particle tracking velocimetry as:
where Δt is the exposure time interval between adjacent frames. Using the above method, the droplet's diameter, collision angle, and impact velocity can be accurately measured. These high-precision measurements provide reliable input parameters for the subsequent development of the sticking efficiency model.
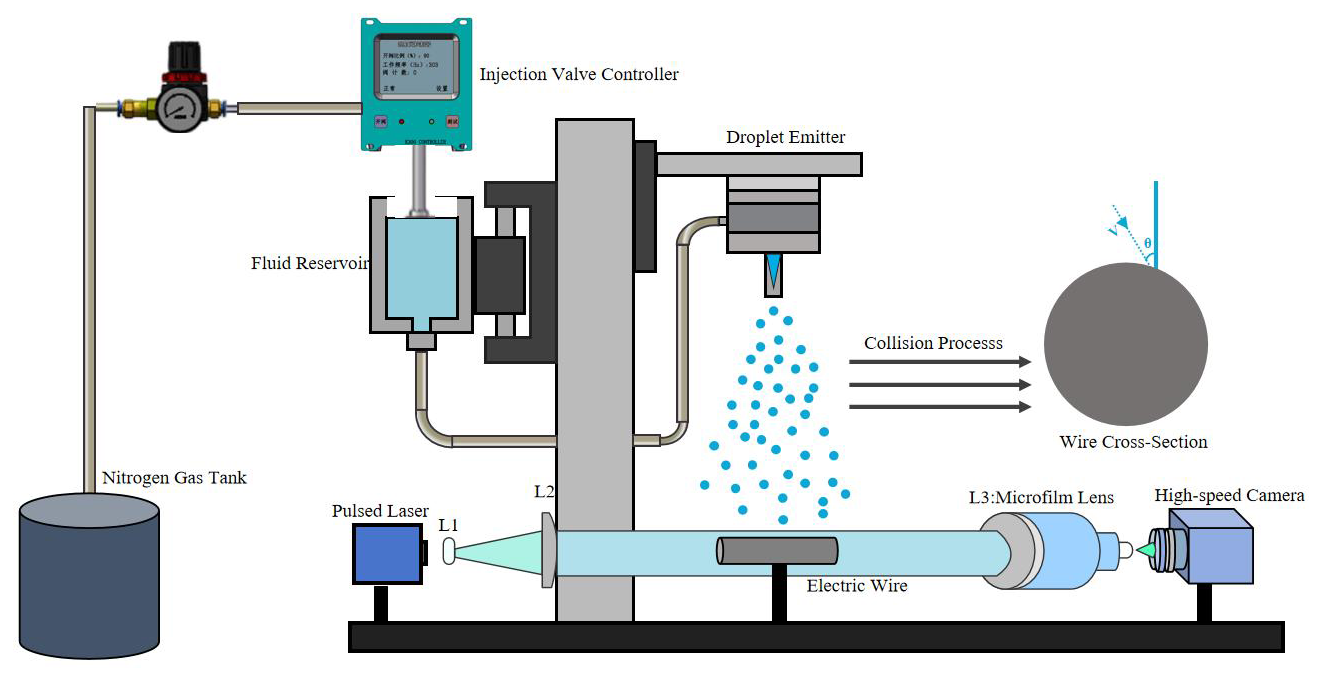
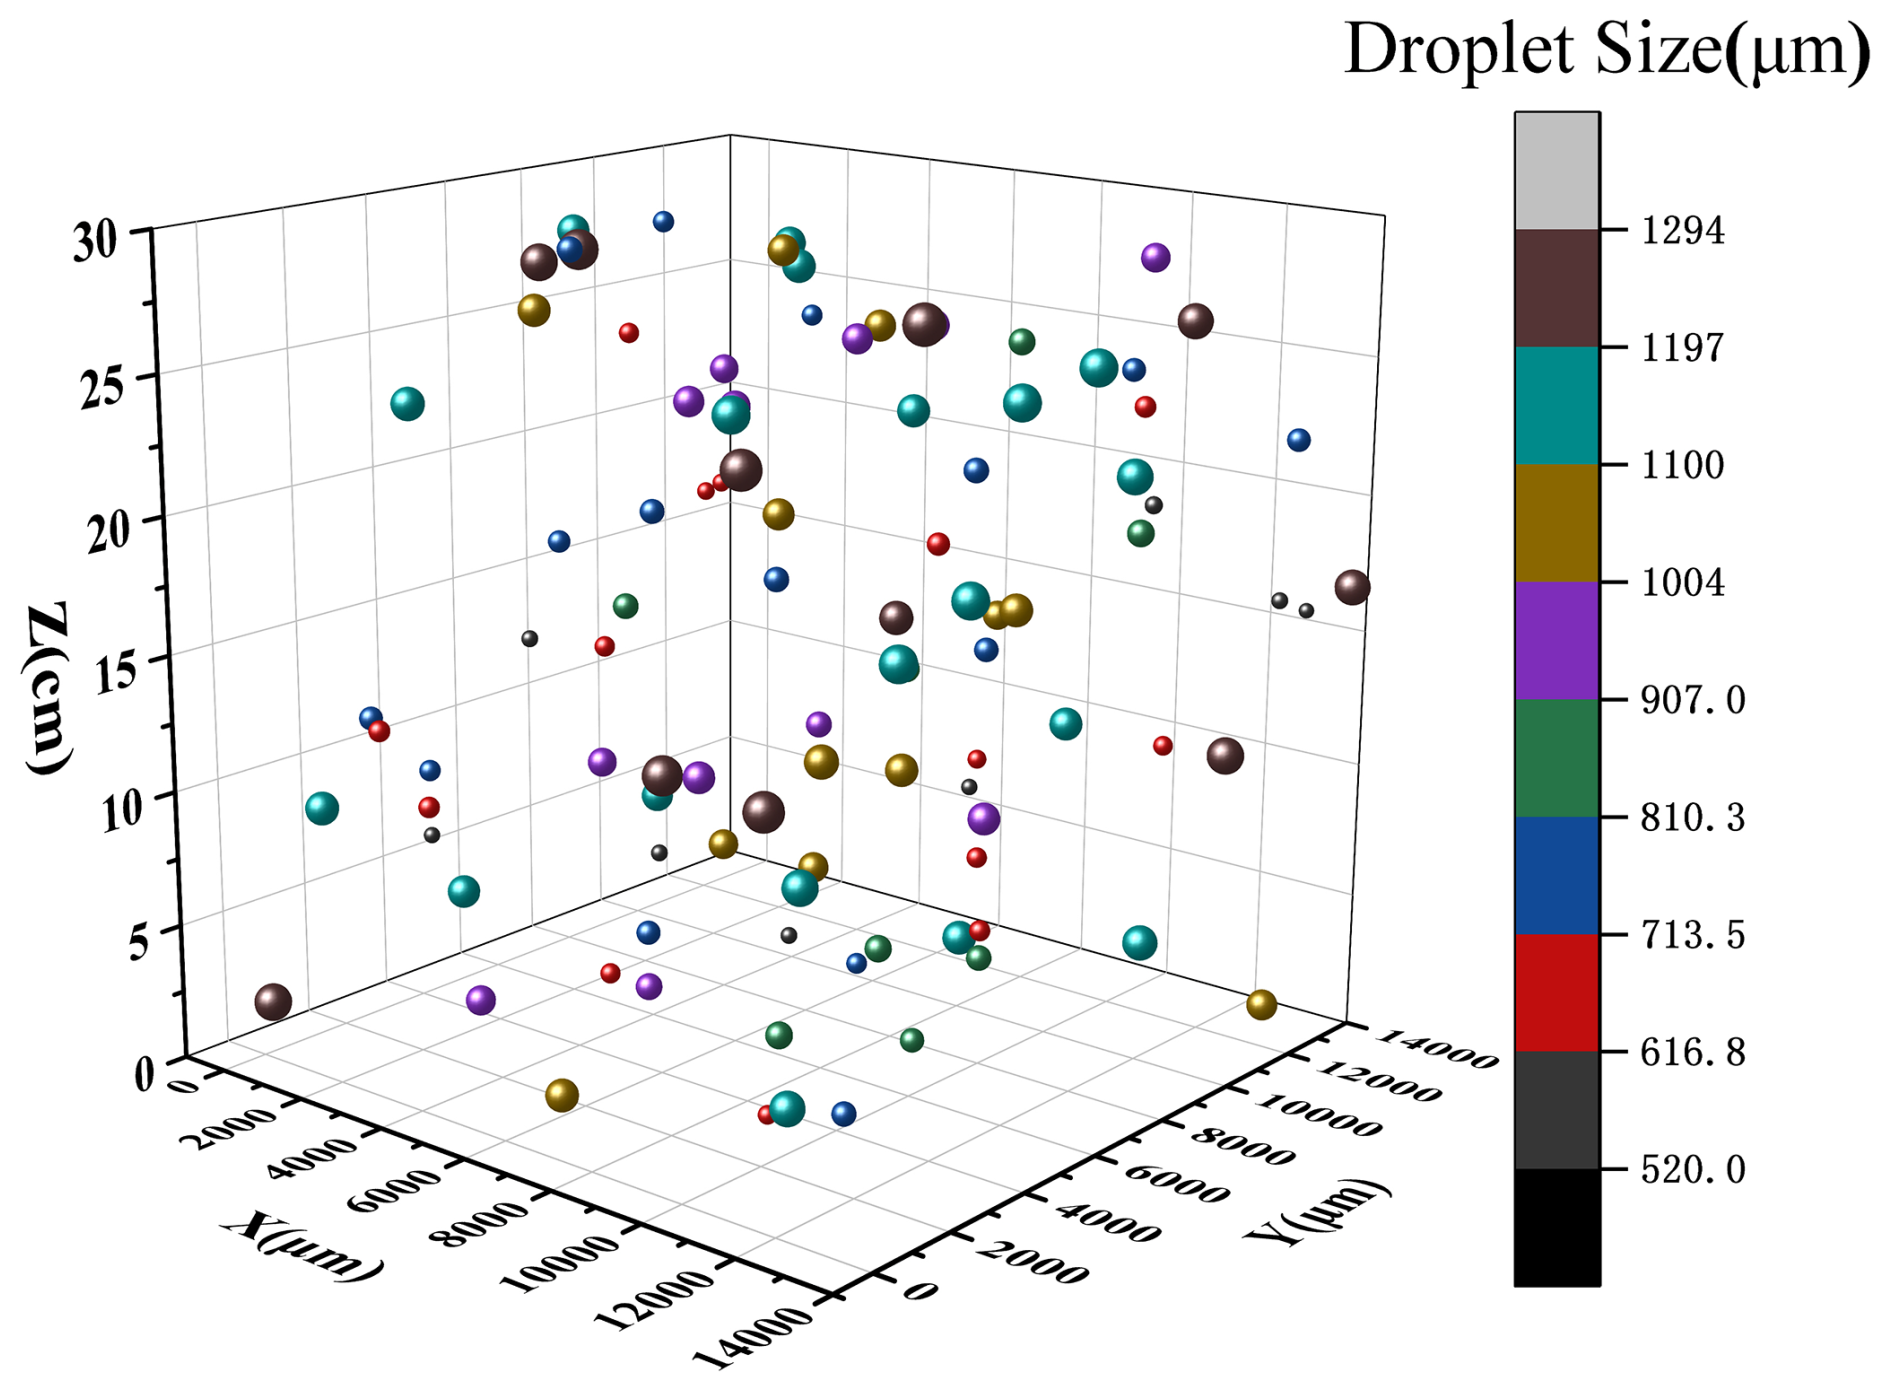
As shown in Fig. 1, a laboratory system is constructed to study the impact of micron-scale droplets on a conductor. The system is divided into two main parts: the first part is a coaxial digital holography measurement system consisting of a laser, a high-speed camera, and lenses. In the experimental optical measurement setup, a pulsed laser beam is first expanded by lens L1 and subsequently collimated into a parallel beam by lens L2, thereby illuminating the region containing simulated raindrops. The diffracted light produced by the particles interferes with the unblocked reference light, forming a coaxial digital hologram of the spray particle field. After propagating a certain distance, the hologram is imaged by a telecentric lens, recorded by the high-speed camera, and then stored on a computer. As shown in Fig. 2, after numerical reconstruction processing, the morphology and three-dimensional positions of the particles in the hologram can be recovered. The second part of the system is a simulated rainfall experimental setup, encompassing a droplet generator, a driving mechanism, and a support structure. Ultrapure water is pre-cooled to a supercooled state and placed in a pressurized chamber. A solenoid injection valve controls the pressure of a nitrogen tank, forcing supercooled water out of a nozzle to produce droplets with a certain velocity (1–8 m s−1). By using nozzles of different diameters, supercooled droplets with diameters within the range 500–3000 µm can be generated. The spray generator did not produce perfectly monodisperse droplets. Instead, different nozzles were used to target specific droplet-size ranges, whereas the actual diameter of each impacting droplet was determined through holographic reconstruction and subsequently grouped for analysis. The laboratory temperature-control system maintained the ambient temperature between −20 and 0 °C (with ±1 °C accuracy). In the experiments, droplet diameter, impact velocity, collision angle, supercooling degree, and crosswind speed were treated as control variables. Each nominal condition was repeated at least 5 times to ensure data reliability. Repeated runs were used to confirm the reproducibility of the observed trends, whereas representative valid data were selected only for concise visualization.
The processing workflow for digital holograms and velocity extraction is shown in Fig. 3, including hologram numerical reconstruction, depth-of-field extension, image fusion, particle identification, particle labeling, and velocity calculation steps. Using the above techniques, the splashing process of a group of micron-scale droplets impacting the conductor was measured and reconstructed, as illustrated in Fig. 4. Image recognition determines that the droplet diameter in this case reaches approximately 1100 µm. The analysis of the reconstructed trajectory has yielded a collision angle of about 70°, with an impact velocity of 2.5 m s−1.
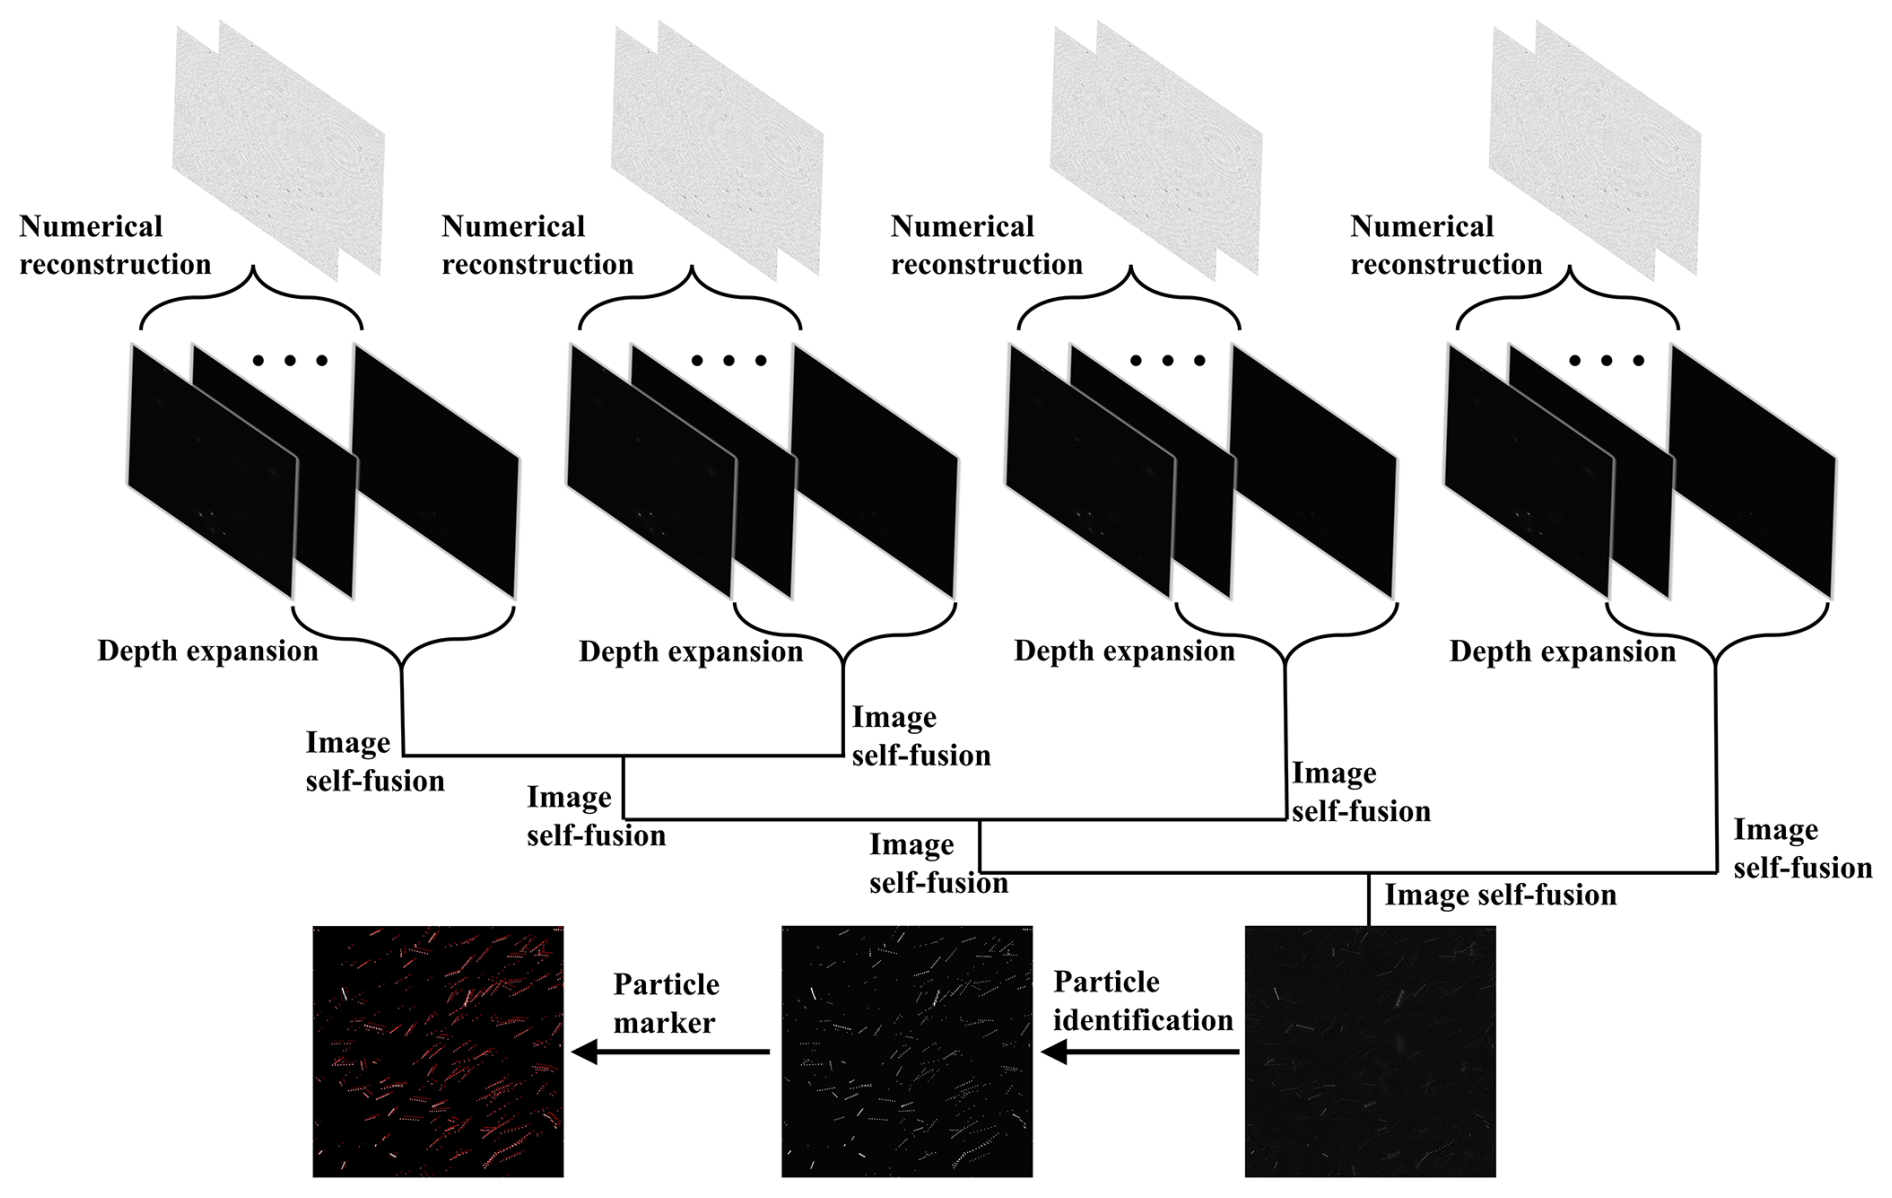
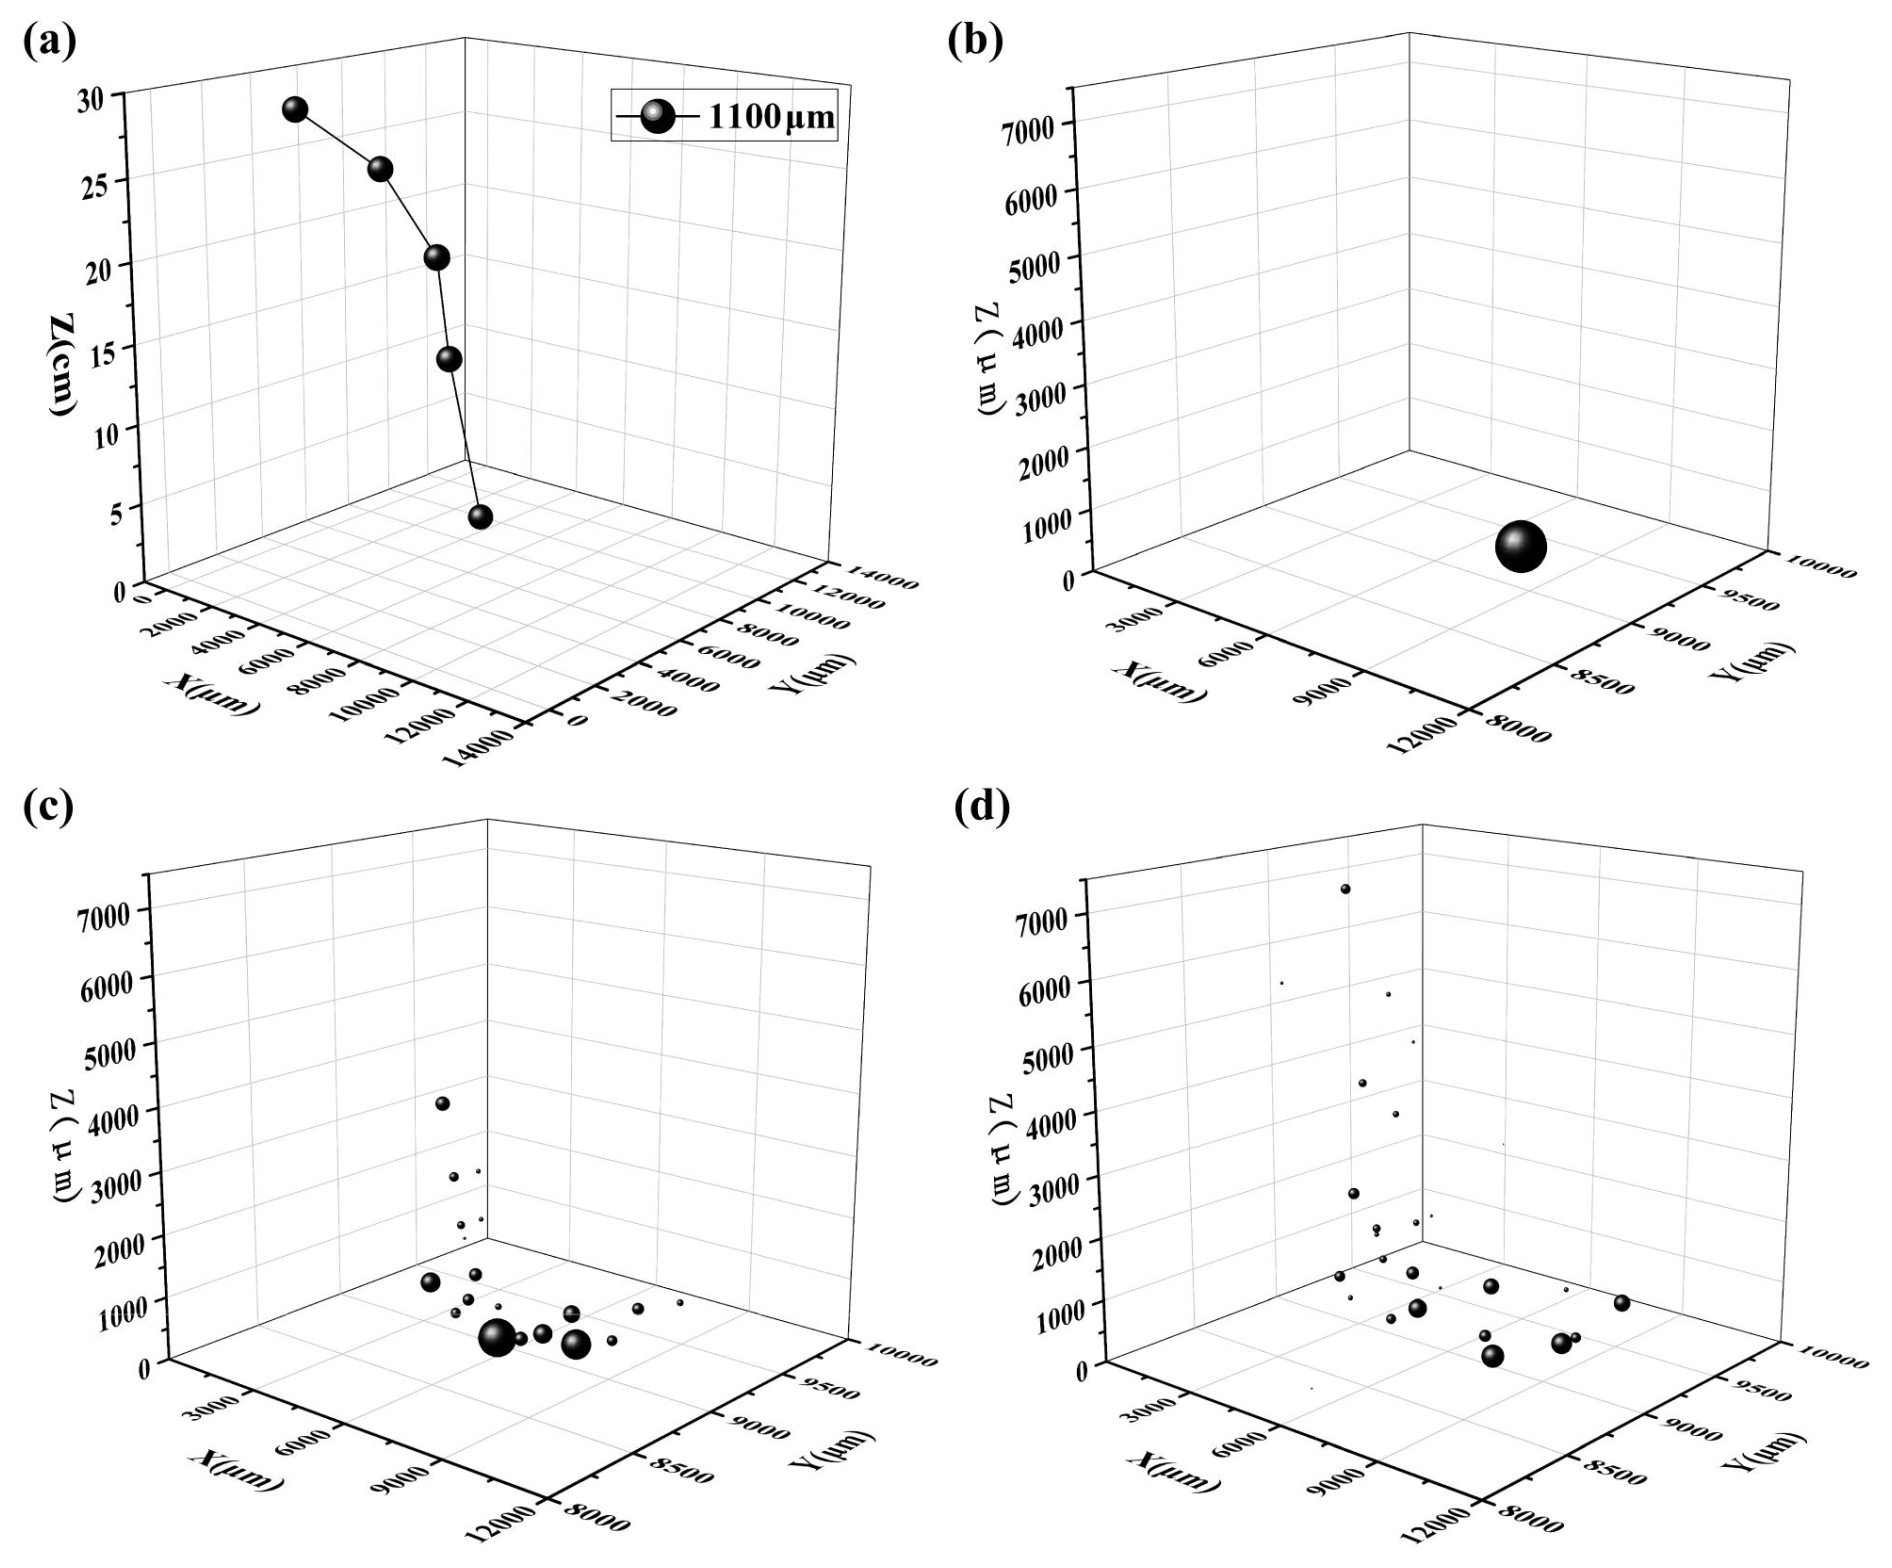
Figure 4Droplet trajectory and splashing process upon impacting the transmission line. (a) Droplet falling trajectory. (b) Time-sequential diagram of particle breakage process: t = 0. (c) Time-sequential diagram of particle breakage process: t = 0.5 ms. (d) Time-sequential diagram of particle breakage process: t = 1 ms.
4.1 Model development
4.1.1 Dynamic phase
For cases with an incoming wind, droplets strike the conductor at some relative collision angle θ instead of a perpendicular approach. When a droplet impacts the surface of a cylindrical conductor at a velocity vd and collision angle θ, the tangential component of its velocity will induce the droplet to slide and be stripped along the conductor surface, whereas the normal component of velocity is the key driving force targeting the deformation and breakup of droplets. Therefore, during the development progress of the dynamic model, the influence of the normal velocity component on the droplet's attachment behavior should be focused on. The normal impact velocity is defined as:
The traditional Weber number formulation is applicable only to the perpendicular impact of droplets and therefore cannot adequately quantify the shear effect during the oblique impact of supercooled droplets under high wind speeds. As the collision angle θ decreases from near-normal impact toward the highly oblique limit over the tested 90–0° range (Fig. 5), the tangential velocity component becomes increasingly important, leading to stronger asymmetric spreading and liquid shedding. Correspondingly, the experimentally measured post-impact sticking efficiency decreases as the collision angle decreases. This trend indicates that smaller collision angles enhance tangential shear and reduce the fraction of incident liquid retained on the conductor after impact.
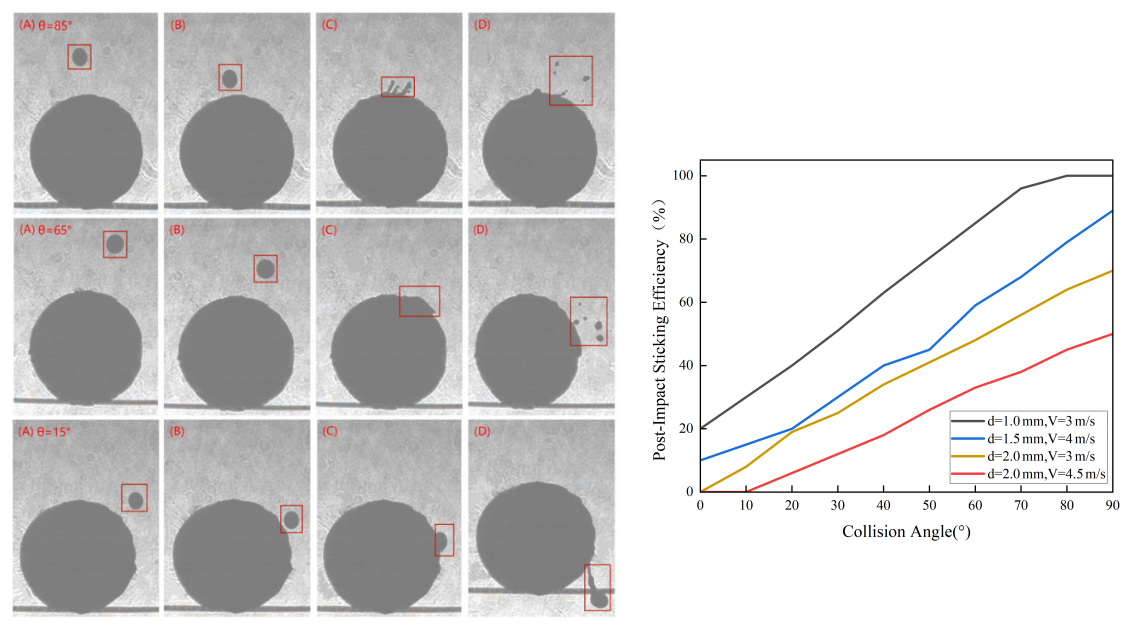
Figure 5Effect of collision angle on experimentally measured post-impact sticking efficiency. Representative impact images and the retained-fraction curve are shown.
To quantitatively describe the effect of collision angle on the droplet's dynamic behavior, an effective Weber number Weeff is introduced to modify the original Weber number. The shear-enhanced effective Weber number model is proposed as follows:
where ρ is the droplet density, vn is the normal impact velocity, d is the droplet diameter, and σ is the surface tension of water. The coefficient λ is an empirical oblique-impact correction term introduced to account for the additional shear effect under non-normal impact conditions. In the present dataset, λ ≈ 0.1 was obtained by fitting the experimentally observed shift in the transition between retention and splashing under oblique impact relative to the near-normal case.
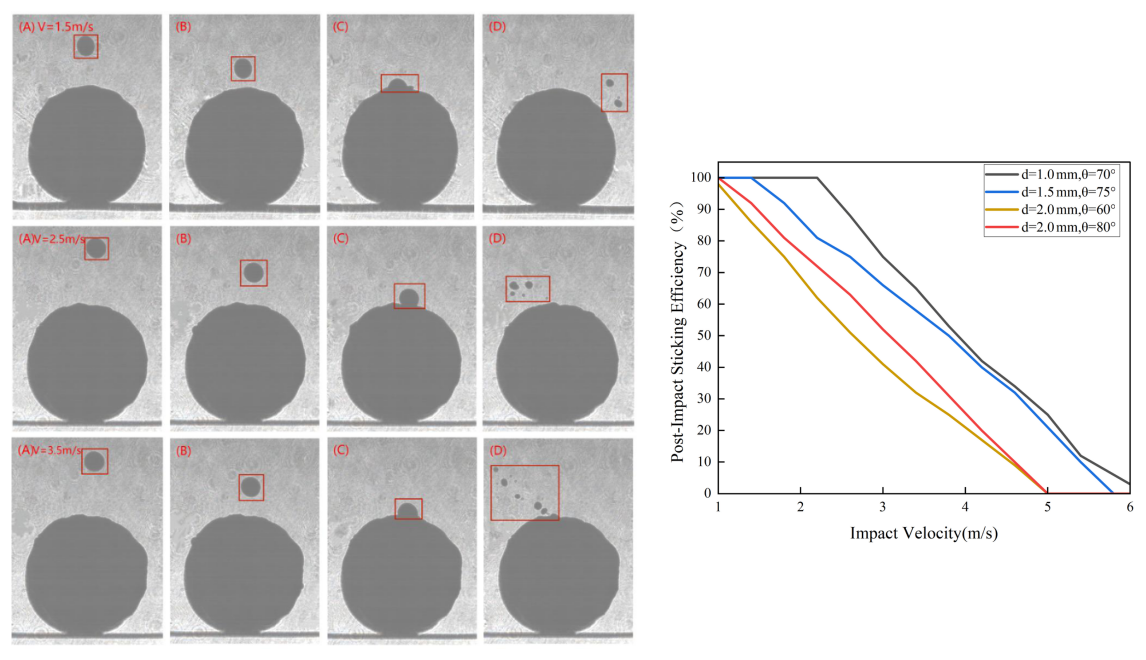
Figure 6Effect of impact velocity on experimentally measured post-impact sticking efficiency. Representative impact images and the retained-fraction curve are shown.
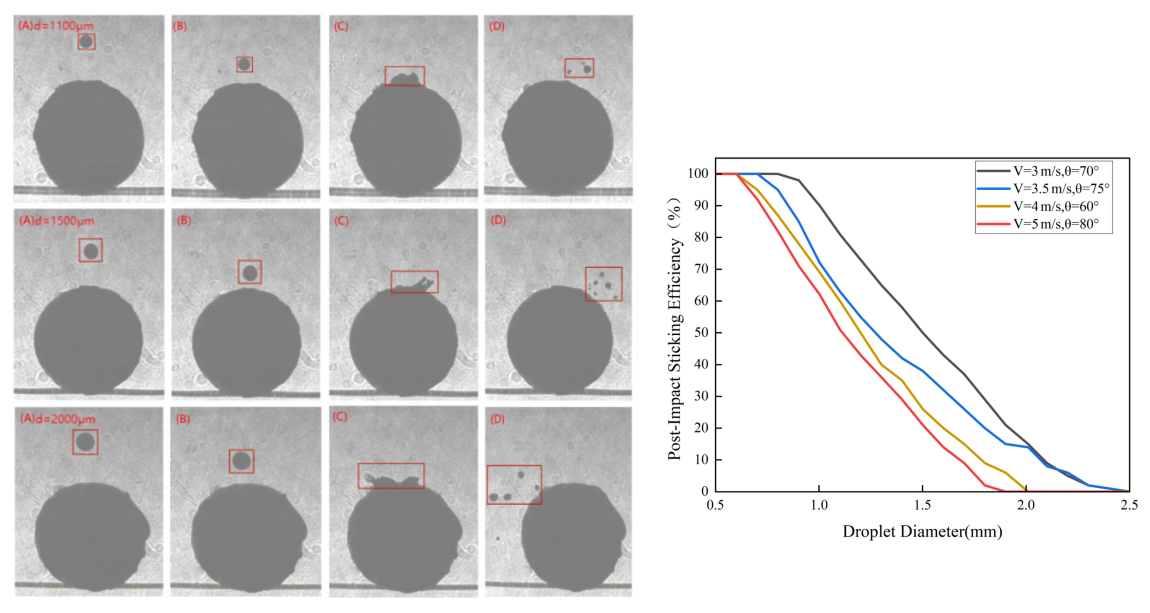
Figure 7Effect of droplet diameter on experimentally measured post-impact sticking efficiency. Representative impact images and the retained-fraction curve are shown.
As shown in Figs. 6 and 7, higher impact velocities intensify inertial deformation and liquid shedding, resulting in lower post-impact sticking efficiency. Under comparable wind-speed and collision-angle conditions, smaller droplets retain more liquid after impact because their lower inertia suppresses spreading and breakup. These trends indicate that the retention-splash transition depends jointly on collision angle θ, droplet diameter d, and impact velocity vd.
Accordingly, by performing a ternary nonlinear fitting on the experimental data, the modified critical Weber number model is introduced as follows:
where C is the baseline scale of the critical Weber-number threshold, A and B are empirical scaling coefficients, and δ is the velocity influence exponent. Experimental calibration for the present dataset yielded C=745, A=0.02, B=0.012, and δ=1.8.
Based on the criterion of inertia vs. surface tension competition, the ratio of the effective Weber number to the critical Weber number determines the outcome of droplet attachment. The dynamic attachment probability Ps is defined as a piecewise function of this ratio:
4.1.2 Thermal phase
High-speed imaging measurements show that the effective contact time tc increases with the increase of droplet diameter, and decreases with the increase of impact velocity. Therefore, the calculation of the effective contact time can be simplified as approximately:
Traditional models of liquid-solid phase change time typically assume ideal heat conduction, considering only the supercooling ΔT as a variable. In reality, however, there is a micrometer-scale oxide layer and an air boundary layer on the conductor surface, significantly inhibiting heat flow. In this study, the kinetic energy of the impacting droplet can disrupt the air film on the conductor surface and increase the actual contact area between the droplet and the conductor; Such effect grows quadratically with vn. Therefore, the expression for the liquid-to-solid phase change time is reconstructed to account for kinetic-energy-enhanced heat transfer:
where ρ is the liquid density, L is the latent heat of fusion per unit mass of the liquid, and hi is the average convective heat-transfer coefficient between the droplet and the conductor, reflecting the heat-transfer capability at the solid-liquid interface. The term is an empirical contact-area correction factor introduced to approximate the increase in effective spreading/contact area with collision angle; the coefficient 0.8 was obtained by fitting the angle-dependent spreading behavior observed in the impact images. The parameter β is an empirical enhancement factor introduced to represent the increase in effective interfacial heat transfer caused by impact-induced thinning of the air layer and enhanced liquid-solid contact. For the present dataset, β≈0.05 s2 m−2 was obtained by fitting the freezing-time correction term.
Based on the relationship between tc and tf, the freezing probability Pf can be expressed as follows:
If tc≥tf, sufficient time is available for heat transfer, and the supercooled droplet freezes completely (Pf=1).
If tc<tf, the unfrozen portion of the droplet is removed by the airflow. In this case, the freezing probability is expressed in exponential form as:
4.1.3 Overall sticking efficiency calculation
The overall sticking efficiency η is essentially the coupled probability of the dynamic collision stage and the thermal freezing stage occurring sequentially. Equation (13) is employed here as a first-order conditional-product approximation rather than as an assumption of strict physical independence. The dynamic stage determines whether sufficient liquid remains on the surface after impact, whereas the thermal stage evaluates whether the retained liquid can freeze within the effective contact time. Part of this coupling is already reflected in the thermodynamic stage through the kinematically dependent contact time tc in Eq. (10), as well as through the angle- and impact-dependent correction terms Ac and in Eq. (11). Thus, the total sticking efficiency can be expressed as the product of the probabilities of the two stages:
4.2 Model validation
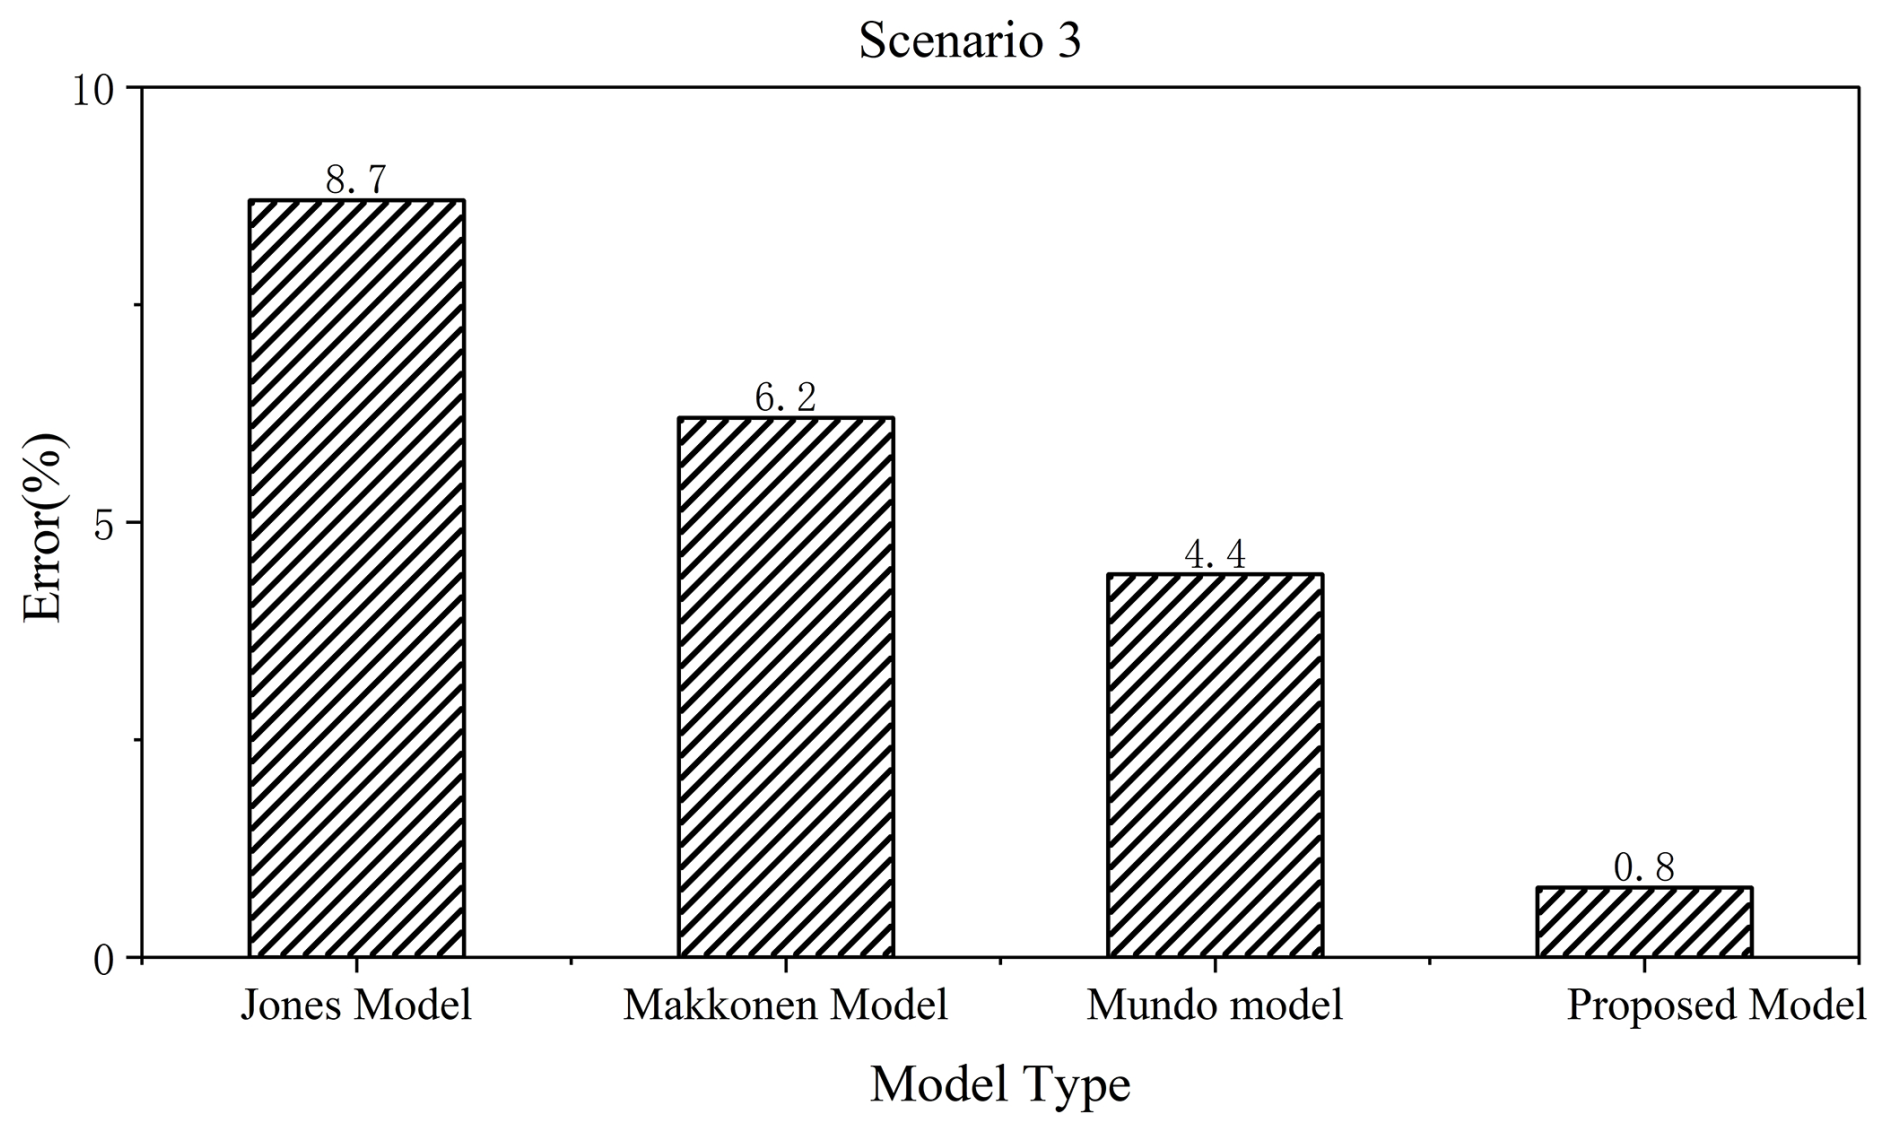
To rigorously evaluate the accuracy and applicability of the proposed model, three representative sticking efficiency models were selected for comparative analysis: the Jones model (Jones, 1996), the Makkonen model (Makkonen, 2000), and the Mundo-Sommerfeld-Tropea splashing model (Mundo et al., 1995). Using both controlled laboratory experiments and inverse analysis of actual transmission line icing accident data, the prediction accuracy of the sticking efficiency model proposed in this work was evaluated. Because the empirical coefficients in Eq. (8) were calibrated using the laboratory impact dataset, the laboratory comparison presented below should be interpreted as a comparison of the datasets against these formulations under identical laboratory conditions. For all four models, the same measured droplet and environmental input conditions were adopted to the extent permitted by each formulation.
4.2.1 Experimental design
-
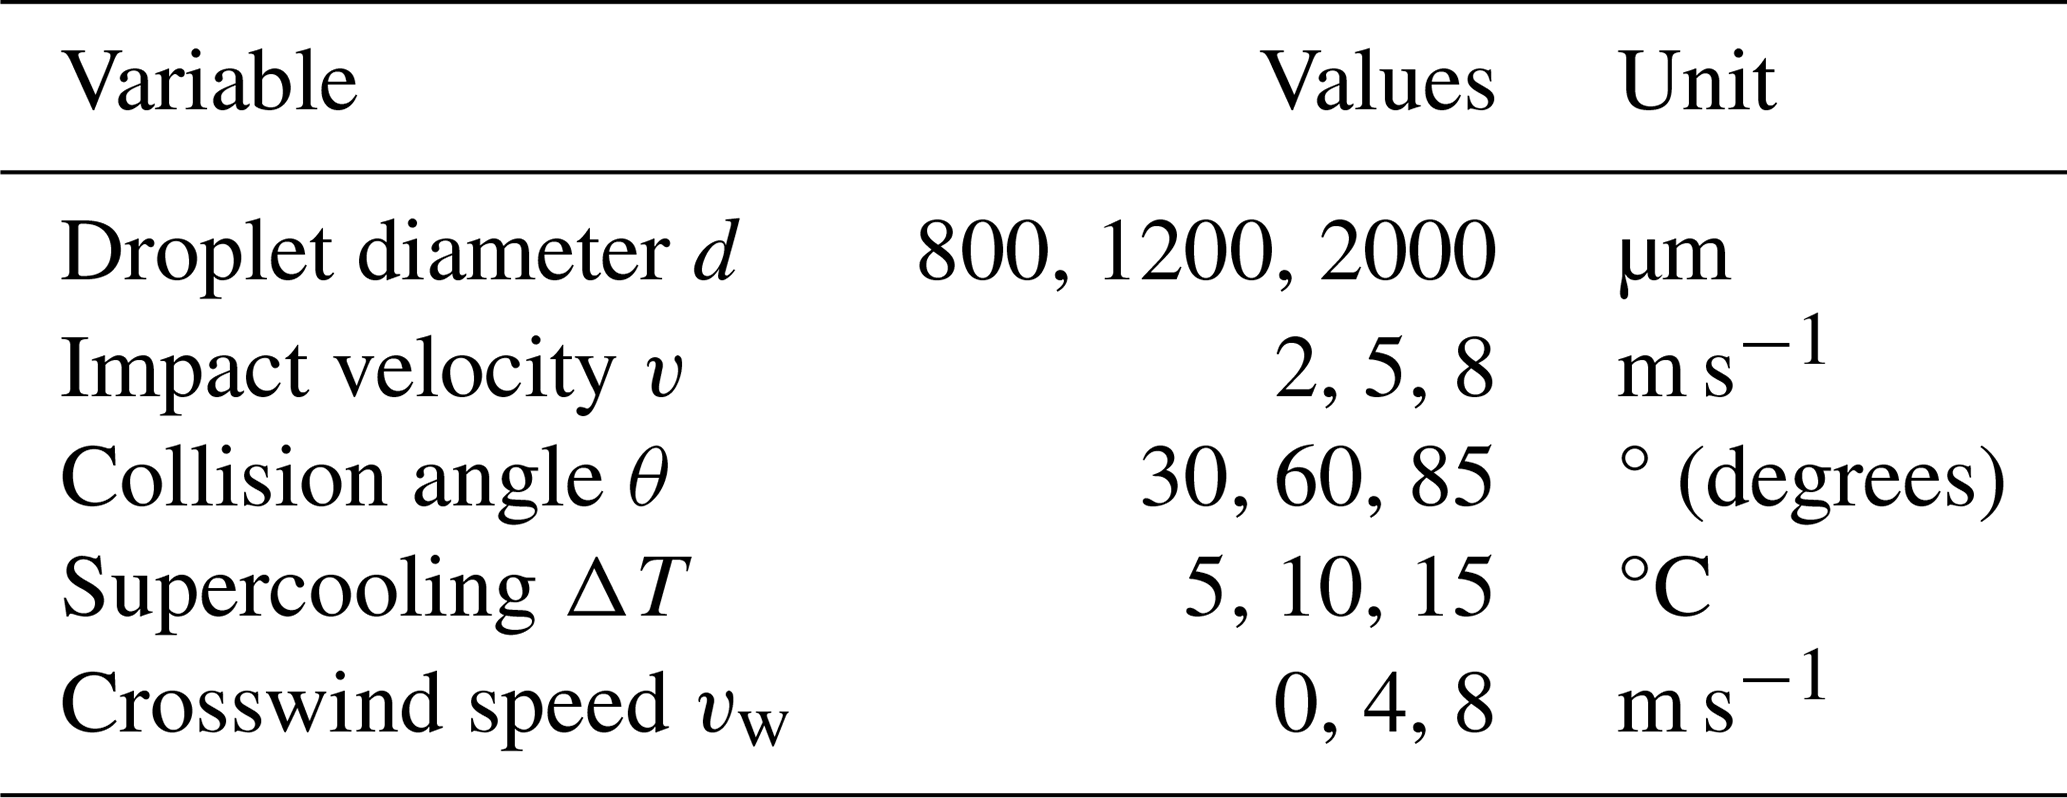
Laboratory parameters: The laboratory experiments were designed with five factors (droplet diameter, impact velocity, collision angle, supercooling, and crosswind speed), each at three levels, as summarized in Table 1. This yields 35=243 unique test conditions; Each condition was repeated 3 times, for a total of 729 experiments.
-
Actual transmission-line icing cases: The proposed model was further evaluated using three real-world transmission-line icing events. In each case, the reference sticking efficiency ηtrue was not obtained through direct droplet-by-droplet counting. Instead, it was inferred through inverse analysis based on the observed ice-accretion response of the transmission line together with the estimated incident supercooled water flux under the recorded meteorological conditions. Thus, ηtrue denotes a field-reference value inferred from icing observations rather than a directly measured microscopic sticking fraction.
-
Case 1: Parameters: collision angle θ=55°, droplet diameter d=1120 µm, droplet velocity v=6.5 m s−1, supercooling ΔT=7 °C, crosswind speed vw=3 m s−1.
-
Case 2: Parameters: θ=38°, d=1850 µm, v=11.2 m s−1, ΔT=6.5 °C, vw=14 m s−1.
-
Case 3: Parameters: θ=75°, d=800 µm, v=4 m s−1, ΔT=12 °C, vw=1 m s−1.
-
4.2.2 Results analysis
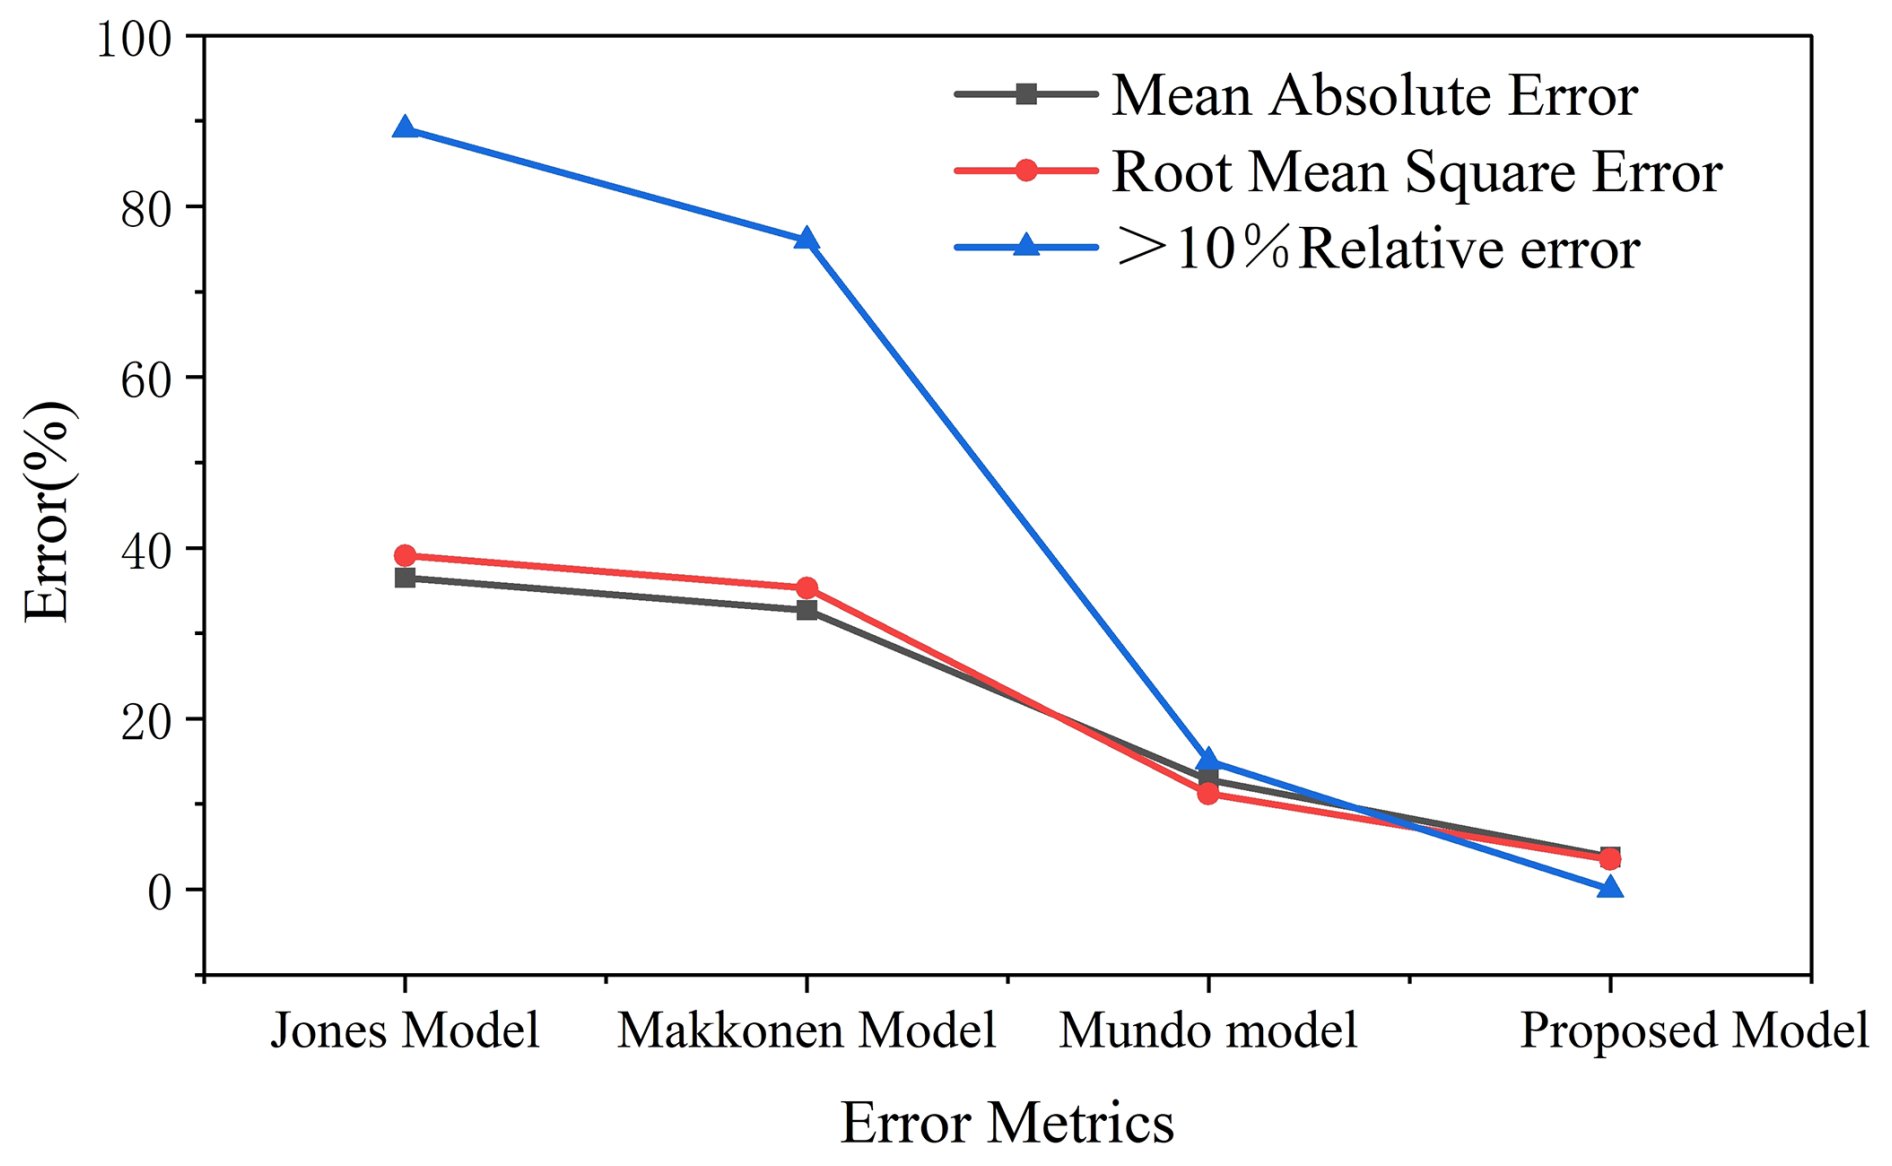
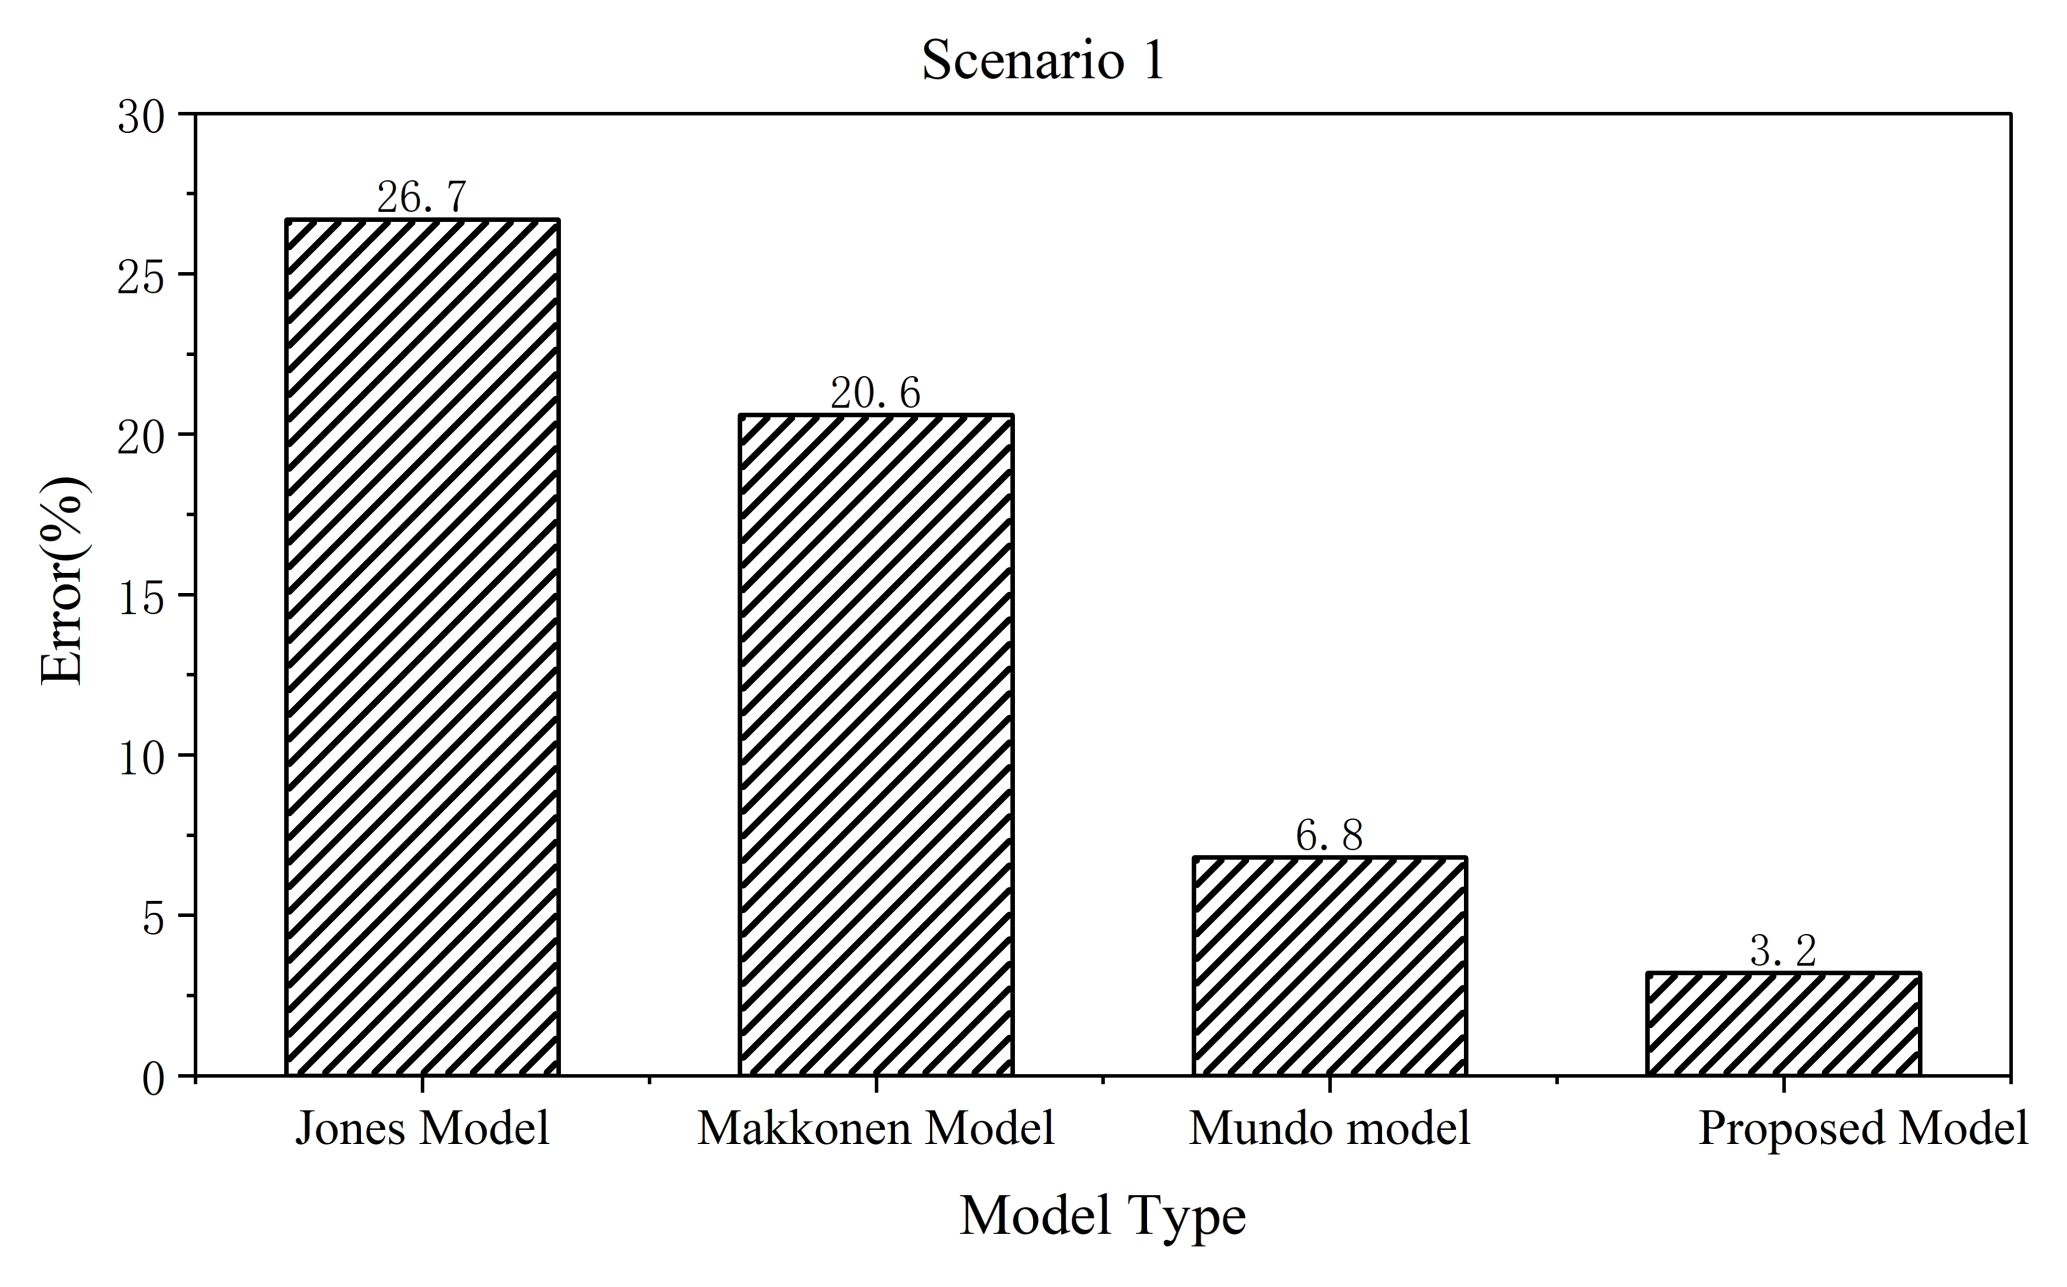
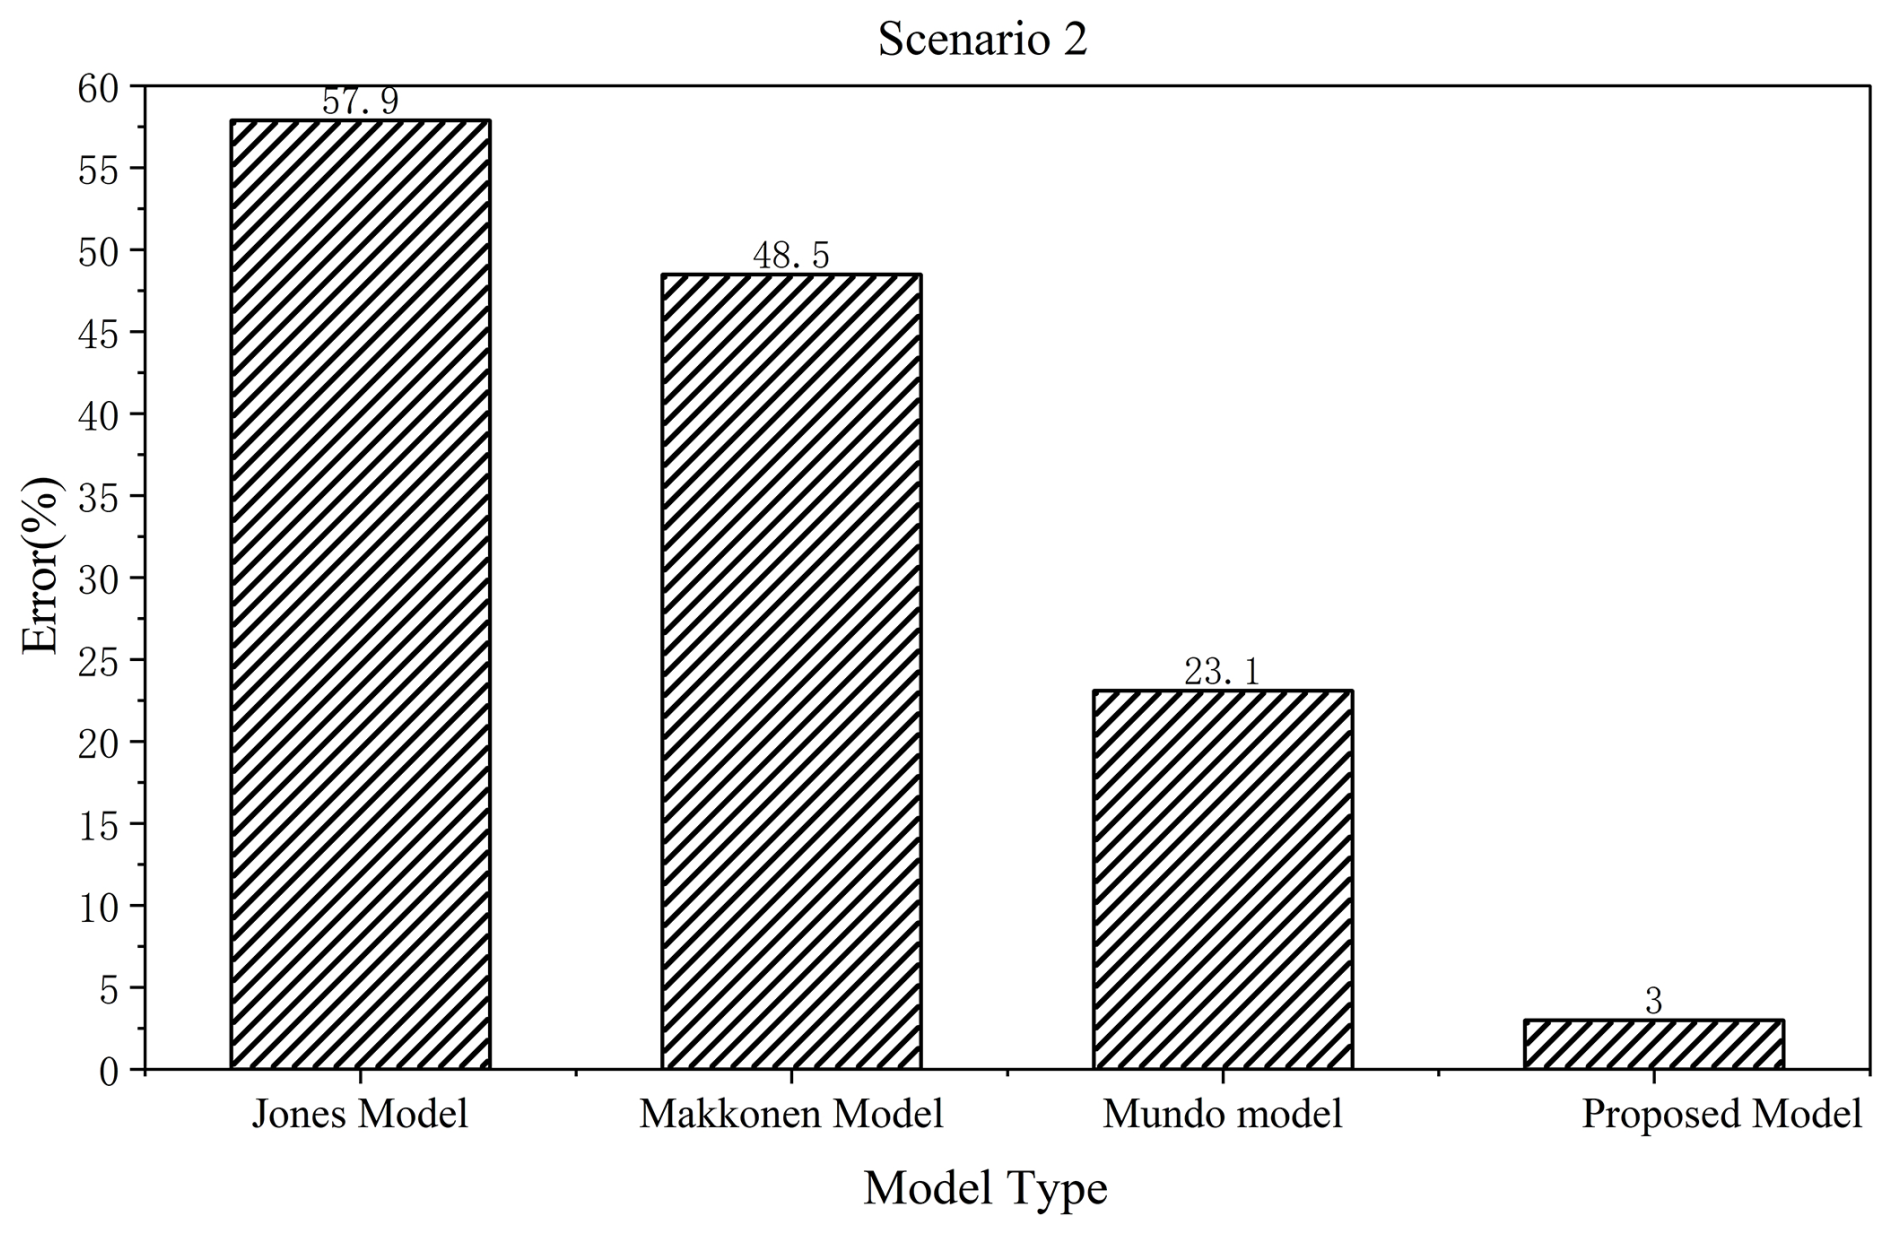
Using the above experimental data, the comparison was conducted on the sticking efficiency results calculated by each model (see Fig. 8), and the prediction errors of each model under the actual icing scenarios (see Figs. 9–11). The proposed model produced lower errors for the validation cases considered in this study, mainly because the holographically measured droplet diameter, impact velocity, and collision angle were incorporated into the coupled dynamic-thermal calculation. Thus, the model responds to changes in temperature, wind speed, droplet size, and collision angle more directly than the comparison formulations. Even under complex conditions, such as heavy precipitation accompanied by strong winds and low temperatures, the proposed model maintained prediction errors below 3.5 % for the validation cases considered in this study, indicating its potential for icing-risk assessment.
4.2.3 Sensitivity analysis
The sensitivity analysis was conducted to identify which measured dynamic input most strongly influences the dynamic-stage attachment probability Ps. The analysis was limited to droplet diameter d, impact velocity vd, and collision angle θ, because these three quantities enter the dynamic formulation through the effective Weber number and the retention–splash criterion.
A partial rank correlation coefficient (PRCC) method was used. PRCC is suitable in this context because it is simple, dimensionless, and capable of quantifying the independent influence of each input after removing the effects of the other two variables. In addition, the rank transformation makes the analysis robust for the monotonic but nonlinear response of Ps near the retention–splash transition.
For each case j in the validation matrix, the dynamic-stage attachment probability was first calculated from Eqs. (7)–(9):
where P(s,j) is the model-calculated dynamic attachment probability for the jth case, dj is the measured droplet diameter, v(d,j) is the measured impact velocity, θj is the measured collision angle, f(⋅) denotes the dynamic model defined by Eqs. (7)–(9), and N is the total number of cases used in the sensitivity analysis. In practice, dj, v(d,j), and θj were substituted into the dynamic model to obtain P(s,j) for each row of the validation matrix.
The PRCC for each input variable was then calculated as:
where pi is the PRCC of the ith input variable, xi denotes the tested input variable, and x−i represents the remaining two input variables used as control variables. Here, R(⋅) denotes the rank transformation of a variable, with tied values assigned average ranks; res(y|z) denotes the residual obtained by linearly regressing y against Z, and denotes the Pearson correlation coefficient between the two residual vectors.
The calculation procedure is summarized as follows. First, Ps, d, vd, and θare converted into ranks. Second, when evaluating a given variable such as vd, both R(Ps) and R(vd) are separately regressed against the ranks of the other two variables, R(d) and R(θ). Third, the residuals from these two regressions are correlated to obtain pv. The same procedure is repeated for d and θ. Consequently, each PRCC represents the independent monotonic influence of one input on Ps after the effects of the other two inputs have been removed.
Table 2PRCC sensitivity analysis of the dynamic-stage attachment probability Ps.
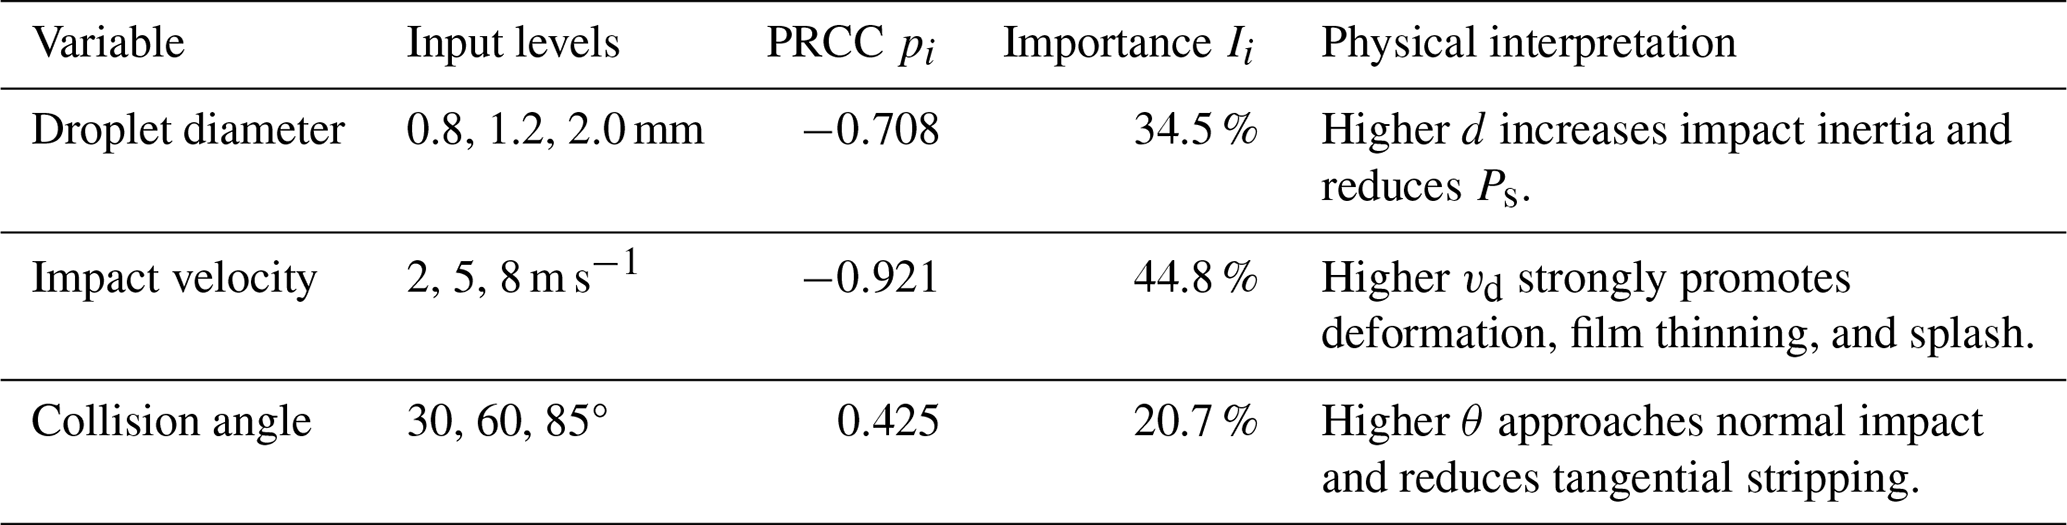
The relative importance of each input variable was calculated from the absolute PRCC value as:
where Ii is the relative importance of the ith input variable, is the absolute PRCC magnitude of that input, and , , and are the absolute PRCC values corresponding to droplet diameter, impact velocity, and collision angle, respectively. The absolute values are used because the sign of pi indicates the direction of influence, whereas its magnitude reflects the strength of influence. The results are summarized in Table 2.
The results show that the sensitivity ranking is vd > d > θ. Impact velocity exhibits the largest absolute PRCC and contributes 44.8 % of the total ranked sensitivity, indicating that the dynamic attachment probability is primarily governed by impact inertia. Droplet diameter is the second most influential variable, because larger droplets possess greater inertia and are therefore more likely to spread, thin, and splash. The collision angle has a smaller but still positive effect; increasing θ toward normal impact reduces tangential stripping along the conductor and consequently increases Ps.
In this study, a coaxial digital holographic three-dimensional measurement system was employed to achieve synchronized and high-precision measurements of supercooled droplet size distributions, spatial motion trajectories, and impact angles. Such measurement has lifted the limitations of traditional two dimensional projection measurements, addressed the problems of missing motion vector information and missing detections of tiny droplets, and provided accurate physical parameter inputs for the sticking efficiency model. On this basis, a droplet icing sticking efficiency prediction model was developed, which couples the dynamic collision process and the thermal freezing process in multiple stages. Through the comprehensive consideration on factors including wind speed, temperature, droplet size, and collision angle, the model was capable of eliminating the limitation of only handling a single scenario in traditional models. For the laboratory and field-validation cases considered in this study, the proposed model achieved prediction errors below 3.5 %, demonstrating superior predictive accuracy compared with existing models. Laboratory simulation tests and validations against typical icing accident cases demonstrate that even under extreme conditions (e.g. mixed wind and rain, high turbulence), the model maintains excellent predictive accuracy and stability. This study lays a theoretical and technical foundation for online monitoring and early warning of transmission line icing, which is of great significance for ensuring the safe operation of the power grid. In practical applications, the framework can provide droplet-scale inputs for icing-risk assessment and early-warning systems, especially under wind-driven oblique-impact conditions.
The data that support the findings of this study are available from the corresponding author upon reasonable request.
PZ and DH designed the experiments, and JC carried them out. PZ and JW developed the model code and performed the simulations. JL and XX calibrated and preprocessed the raw data. YM performed data curation. PZ prepared the manuscript with contributions from all co-authors.
The contact author has declared that none of the authors has any competing interests.
Publisher's note: Copernicus Publications remains neutral with regard to jurisdictional claims made in the text, published maps, institutional affiliations, or any other geographical representation in this paper. The authors bear the ultimate responsibility for providing appropriate place names. Views expressed in the text are those of the authors and do not necessarily reflect the views of the publisher.
The authors would like to thank Xi'an University of Technology for the support and assistance provided during the research. The research infrastructure relied on in this study is the Beijing Comprehensive Test Base Laboratory of Weather Modification, and the authors express their gratitude for the platform and technical support offered by the laboratory.
During the preparation of this work, the authors used Gemini exclusively to check and standardize the technical formatting of the references section, such as unifying journal abbreviations, citation styles, and punctuation. The AI tool was not employed to search for literature, analyze data, or generate any scientific text for the manuscript. All cited references were manually selected and thoroughly verified for their academic accuracy and contextual relevance by the human authors, who take full responsibility for the content of this publication.
This research has been supported by the National Natural Science Foundation of China (grant nos. 42375126 and 42375137).
This paper was edited by Zamin A. Kanji and reviewed by two anonymous referees.
Blinder, D., Birnbaum, T., Ito, T., and Shimobaba, T.: The state-of-the-art in computer generated holography for 3D display, Light Adv. Manuf., 3, 35, https://doi.org/10.37188/lam.2022.035, 2022.
Chambers, T. E., Reid, I. M., and Hamilton, M.: A lightweight holographic imager for cloud microphysical studies from an untethered balloon, Atmos. Meas. Tech., 17, 3237–3253, https://doi.org/10.5194/amt-17-3237-2024, 2024.
Chen, N., Wang, C., and Heidrich, W.: Snapshot space-time holographic 3D particle tracking velocimetry, Laser Photonics Rev., 15, 2100008, https://doi.org/10.1002/lpor.202100008, 2021.
Fu, P., Farzaneh, M., and Bouchard, G.: Two-dimensional modelling of the ice accretion process on transmission line wires and conductors, Cold Reg. Sci. Technol., 46, 132–146, https://doi.org/10.1016/j.coldregions.2006.06.004, 2006.
Fuchs, C., Ramelli, F., Schweizer, D., Lohmann, U., and Henneberger, J.: Putting the spotlight on small cloud droplets with SmHOLIMO – a new holographic imager for in situ measurements of clouds, Atmos. Meas. Tech., 18, 2969–2986, https://doi.org/10.5194/amt-18-2969-2025, 2025.
Gao, P.: Observation method of three-dimensional particle velocity based on digital holography, MD thesis, Xi'an University of Technology, Xi'an, China, 2024.
Gao, P., Wang, J., Zhao, C. C., Tang, J. B., Liu, J. J., Yan, Q., and Hua, D. X.: Simultaneous measurement method of cloud microphysical parameters based on digital holographic interferometry, Acta Phys. Sin., 70, 099201, https://doi.org/10.7498/aps.70.20201779, 2021.
Gao, W., Sato, Y., and Zhou, K.: CFD-DEM modeling of bidirectional coupling between micron droplets and conductor vibration, Powder Technol., 425, 118572, https://doi.org/10.1016/j.powtec.2023.118572, 2024.
Goodman, J. W.: Introduction to Fourier optics, McGraw-Hill, New York, USA, ISBN 9780070237766, 1968.
Hou, H., Wang, Y., Bai, X., Lv, J., Cui, R., Zhang, L., and Li, S.: Modelling icing growth on overhead transmission lines: Current advances and future directions, Energy Convers. Econ., 5, 062001, https://doi.org/10.1049/enc2.12131, 2024.
Huang, Z. and Cao, L.: Quantitative phase imaging based on holography: trends and new perspectives, Light Sci. Appl., 13, 145, https://doi.org/10.1038/s41377-024-01453-x, 2024.
Javidi, B., Carnicer, A., Anand, A., Barbastathis, G., Chen, W., Ferraro, P., Goodman, J., Horisaki, R., Khare, K., Kujawinska, M., and Leitgeb, R. A.: Roadmap on digital holography, Opt. Express, 29, 35078–35118, https://doi.org/10.1364/OE.435915, 2021.
Jiang, X., Wang, Z., and Liu, Y.: Laser diffraction-based characterization of raindrop size distribution in freezing precipitation, Atmos. Res., 259, 105682, https://doi.org/10.1016/j.atmosres.2021.105682, 2021.
Jones, K. F.: A simple model for freezing rain ice loads, Atmos. Res., 46, 87–97, https://doi.org/10.1016/S0169-8095(97)00053-7, 1996.
Khodadad, D.: Digital holography and its application, Appl. Sci., 14, 11254, https://doi.org/10.3390/app142311254, 2024.
Kringlebotn Nygaard, B. E., Ágústsson, H., and Somfalvi-Tóth, K.: Modeling wet snow accretion on power lines: Improvements to previous methods using 50 years of observations, J. Appl. Meteorol. Climatol., 52, 2189–2203, https://doi.org/10.1175/JAMC-D-12-0332.1, 2013.
Kumar, M. S. and Hong, J.: A review of 3D particle tracking and flow diagnostics using digital holography, Meas. Sci. Technol., 36, 032005, https://doi.org/10.1088/1361-6501/adabff, 2025.
Liu, F., Chen, T., and Wu, J.: Physics-informed neural networks for predicting ice accretion on power lines, Appl. Energy, 350, 121890, https://doi.org/10.1016/j.apenergy.2023.121890, 2024.
Liu, Z., Takahashi, T., Lindsay, D., Thevar, T., Sangekar, M., Watanabe, H. K., Burns, N., Watson, J., and Thornton, B.: Digital in-line holography for large-volume analysis of vertical motion of microscale marine plankton and other particles, IEEE J. Oceanic Eng., 47, 789–801, https://doi.org/10.1109/JOE.2021.3066788, 2021.
Makkonen, L.: A model for the growth of rime, glaze and wet snow on structures, Phil. Trans. R. Soc. A, 358, 2913–2939, https://doi.org/10.1098/rsta.2000.0690, 2000.
Makkonen, L. and Stallabrass, J. R.: Two-dimensional high-speed imaging of droplet impact dynamics, J. Atmos. Ocean. Technol., 36, 1523–1534, 2019.
Mihaylova, E. M.: Imaging of live cells by digital holographic microscopy, Photonics, 11, 980, https://doi.org/10.3390/photonics11100980, 2024.
Mundo, C., Sommerfeld, M., and Tropea, C.: Droplet-wall collisions: experimental studies of the deformation and breakup processes, Int. J. Multiphase Flow, 21, 151–173, https://doi.org/10.1016/0301-9322(94)00069-V, 1995.
Osten, W. and Pedrini, G.: 55 Years of holographic non-destructive testing and experimental stress analysis: Is there still progress to be expected?, Light Adv. Manuf., 3, 121–136, https://doi.org/10.37188/lam.2022.008, 2022.
Snaiki, R., Jamali, A., Rahem, A., Shabani, M., and Barjenbruch, B. L.: A metaheuristic-optimization-based neural network for icing prediction on transmission lines, Cold Reg. Sci. Technol., 224, 104249, https://doi.org/10.1016/j.coldregions.2024.104249, 2024.
Wang, G., Shen, J., Jin, M., Huang, S., Li, Z., and Guo, X.: Prediction model for transmission line icing based on data assimilation and model integration, Front. Environ. Sci., 12, 1403426, https://doi.org/10.3389/fenvs.2024.1403426, 2024.
Yang, C. Y., Wang, J., Zhang, C., Zhou, H., Yang, J. S., Yue, Z. G., Liang, G., Liu, J. J., and Hua, D. X.: Observation method of cloud ice crystal microphysical parameters based on digital holography, Acta Optica Sin., 44, 0601017, https://doi.org/10.3788/AOS231067, 2024.
Zhang, X., Liu, X., Wu, X., and Min, J.: Impacting-freezing dynamics of a supercooled water droplet on a cold surface: Rebound and adhesion, Int. J. Heat Mass Tran., 158, 119997, https://doi.org/10.1016/j.ijheatmasstransfer.2020.119997, 2020.
Zhou, H.: Hail recognition method and experimental research based on digital holography, MD thesis, Xi'an University of Technology, Xi'an, China, 2024.