
the Creative Commons Attribution 4.0 License.
the Creative Commons Attribution 4.0 License.
 | 10 Jul 2026
Remote sensing of local-dust across the Canadian Arctic
Seyed Ali Sayedain
Norman T. O'Neill
Keyvan Ranjbar
Phillipe Gauvin-Bourdon
Rachel Chang
Patrick L. Hayes
James King
We investigated the optical and microphysical characterization of High- and sub-Arctic dust events across the Canadian Arctic Archipelago (CAA). Events from local sources (local dust) were first identified and characterized using a combination of ground-based lidar, two AERONET instruments, and passive (MODIS, Sentinel-2, MISR) imagery in the neighbourhood of the High-Arctic Polar Environment Atmospheric Research Laboratory (PEARL) at Eureka, Nunavut (on Ellesmere Island in the northernmost part of the CAA).
The PEARL findings informed the identification and characterization of local dust events over other parts of the CAA using a suite of satellite instruments whose remote sensing (RS) capabilities were complementary to or an extension of the ground- and satellite-based techniques employed at Eureka. The events included plumes emanating from Axel Heiberg Island, just west of Ellesmere Island, Banks Island in the southwest corner of the CAA, Ellef Ringnes Island in the eastern part of the central CAA and Prince of Wales Island/Victoria Island in the central southern CAA. Plume identification, plume source and CM (coarse mode) aerosol optical depth (AOD) retrievals were investigated using a combination of low to high spatial resolution (MODIS to Sentinel-2) color imagery and the MODIS dark target AOD product over water. Plume thickness, height and speed for most of the events were obtained (depending on orbit availability and lack of cloud contamination) from MISR (Multi-angle Imaging Spectro Radiometer) stereoscopic products.
These RS results support an argument for the ubiquitous presence of pan-Arctic, low altitude dust that is typically (away from any strong sources such as mountainous drainage basins) at the lower levels of detectability offered by ground- and satellite-based RS techniques. The ability to RS airborne, near-source, local dust events and characterize dust properties and dynamics of important regions such as the CAA is critical to understanding local dust impacts such as early snow/ice melt and the nucleation role of local dust in the formation of low-altitude clouds.
- Article
(13609 KB) - Full-text XML
- BibTeX
- EndNote


Local, drainage-flow dust events are recognized as an important source of dust at high latitudes (Bullard et al., 2016) and are a significant contributor to Arctic and sub-Arctic aerosols in terms of total atmospheric (columnar) dust loads and notably, to near-surface concentration and attendant surface deposition (Groot Zwaaftink et al., 2016). Meinander et al. (2022) employed dust-transport simulations supported by recent verification data (including the identification of sources using satellite-based imagery) to confirm the predominance of high-latitude dust (HLD) sources in terms of snow and ice deposition. O'Neill et al. (2025) summarized satellite-derived findings of what was likely local dust deposition (with attendant decreases in visually observed surface reflectance) for a sampling of drainage basin regions in the CAA. Local dust, whose source plumes can produce quite strong coarse mode1 (CM) AODs (aerosol optical depths) eventually spread out and/or are deposited to yield weak, monthly-binned CM AODs (O'Neill et al., 2025 who employ the term DOD [dust optical depths] for the CM AODs known to be dominated by dust).
Dust from Asian deserts can be transported around the world and contributes to the dust load over the Arctic (see for example Uno et al., 2009). AboEl-Fetouh et al. (2020) argued that there was a small but distinct springtime, pan-Arctic (CM) AOD2 contribution of what was likely Asian dust over six AERONET stations spread across the Canadian and northern European Arctic. They also noted that the particle-volume size distribution (PVSD) associated with those CM AODs showed a peak radius ∼ 1.3 µm. This feature tends to dominate monthly-binned CM AOD averages in the spring (ibid) while DODs associated with local sources are likely more prevalent in the summer and fall according to the monthly-binned simulations (Fig. 7) of Groot Zwaaftink et al. (2016)3. Aside from its rather unique temporal signature, Asian dust tends to be concentrated in weak to moderately strong DOD plumes located in the mid- to upper-troposphere with some evidence of dust deposition during the period of relatively strong Asian dust events (see, for example, the Fig. 3 Barrow event of Zhao et al., 2022).
Local dust particles in the Arctic are known to be strong ice nucleating particles (INPs) that can significantly influence the dynamics of mixed-phase clouds (ice crystals and water droplets) and their optical and radiative impacts (Xi et al., 2022; Kawai et al., 2023). The dust plumes lofted into the atmosphere from the Copper River Delta in southern Alaska during late summer or autumn were, for example, shown to be a major INP source (Barr et al., 2023). Those authors also pointed out that the dust events can last for many days and extend hundreds of kilometers into the Gulf of Alaska. Tobo et al. (2019) noted that the high ice nucleating ability of local dust in the Svalbard region of the European Arctic was likely improved by the presence of organic matter.
HLD events in the Canadian Arctic and specifically the CAA are rarely monitored and so their properties are, accordingly, not well characterized: low population density and limited numbers of meteorological stations have resulted in a scarcity of observations. Persistent cloudy periods and the attendant underuse of RS data have represented significant challenges to the exploitation of satellite RS data (Bullard et al., 2016). Alternatively, optically thinner clouds and/or surface reflectance perturbations (such as white froth from waves) could act to contaminate AOD retrievals over water.
Satellite imagery at different spatial and temporal resolutions in the polar regions can provide color images of dust events as well as plume characterization products (including AOD, plume height and thickness, coarse indicators of particle size, etc.) that help to better characterize local dust. Satellite-based, high spatial-resolution RS data can, for example, enable the separation of local dust-plume patterns from suspended sediments and phytoplankton blooms in the water.
The identification of dust plumes over the Icelandic region using MODIS true color imagery has been reported for events dating back to 2002 (Arnalds, 2010). Satellite- and airborne-RS of local dust over the Arctic (as summarized by Sayedain et al., 2023; SDN) include airborne RS of dust over the riverbed, fjord, and coastal regions of Svalbard, sub-Arctic dust plumes flowing over the Gulf of Alaska (where they are much more readily identified and characterized), and MODIS- and CALIOP-based identification of dust plumes from Iceland. A local, high-Arctic CM dust plume, induced by the drainage basin dynamics of Lake Hazen (∼ 300 km northeast of Eureka on Ellesmere Island), was identified and characterized by Ranjbar et al. (2021) using various types of passive and active, satellite-based RS tools adapted to the special case of dust optics and microphysics. Baddock et al. (2024) provided a detailed analysis of a dust event over Pearly Land, Northern Greenland employing Sentinel-2 true-color images supported by reanalyzed near-surface wind and temperature data.
In terms of ground-based RS, Yang et al. (2020) used Doppler lidar (backscatter and depolarization ratio channels) and ceilometer profiles, along with CIMEL photometry (the instrument employed by AERONET) to characterize the optical properties of Icelandic, sub-Arctic dust plumes. Bachelder et al. (2020) reported peak CM radii of ∼ 1.63 µm for their measured near-source particle-mass size distributions (PMSDs) of local dust in the sub-Arctic Ä'äy Chù (Slims River) basin in the Canadian Yukon. SDN characterized the optical and microphysical properties of Lhù'ààn Mân'4 dust plumes using CIMEL and Doppler lidar instrumentation supported by microphysical surface measurements. Their CIMEL- and lidar-derived dust AODs (which we will refer to as DODs in cases where dust is likely the predominant aerosol) were CM dominated (weaker fine mode DODs that correlated with the CM DODs were also observed).
Kawai et al. (2023) simulated the columnar mass concentrations of local dust in the Arctic in order to lay the groundwork for their investigations into the strong role of local dust as INP. They employed CALIOP profiles and the CALIOP aerosol subtype classification product to produce a local-dust Arctic DOD climatology in order to verify the quality of their dust simulations. Their map of simulated columnar mass abundance of pan-Arctic dust helped contextualize (roughly guide or even semi-quantitatively validate) our search for dust events in the CAA that would be detectable using satellite-based RS. In general, we expect DODs associated with local dust to be dominated by CM particles (see, for example, the overview given in O'Neill et al., 2025).
The instruments and measurements that we employed in the investigations reported in this paper, reflect a general strategy of using ground-based microphysical as well as ground-based passive and active RS measurements acquired at the High-Arctic PEARL observatory as a means of demonstrating the presence of local dust in the PEARL region and then linking, by direct or indirect means, this information with imagery available from the very frequent overpasses of satellite-based instruments over a site that is near the tangent circle of all polar-orbiting satellites (and thus the beneficiary of a high density of RS data). With this type of analysis in hand we sought to support/inform (without the ground-based RS and microphysical sampling capabilities of the PEARL complex), the purely satellite-based RS and characterization of local dust events in other parts of the CAA. The motivation for this work was to analyze and help verify/evaluate elements of the large potential trove of satellite-based dust RS data over the CAA.
2.1 The Canadian Arctic Archipelago
The CAA extends from the northern (low Arctic) shores of the Canadian mainland to the high Arctic (Fig. 1a). It consists of a group of approximately 36 000 islands, many of which are covered by ice for much of the year (Adams et al., 2015). Different local CAA dust events at Eureka on Ellesmere Island, Axel Heiberg Island, Prince of Wales Island, Banks Island, and Ellef Ringnes Island were investigated as part of this local dust analysis.
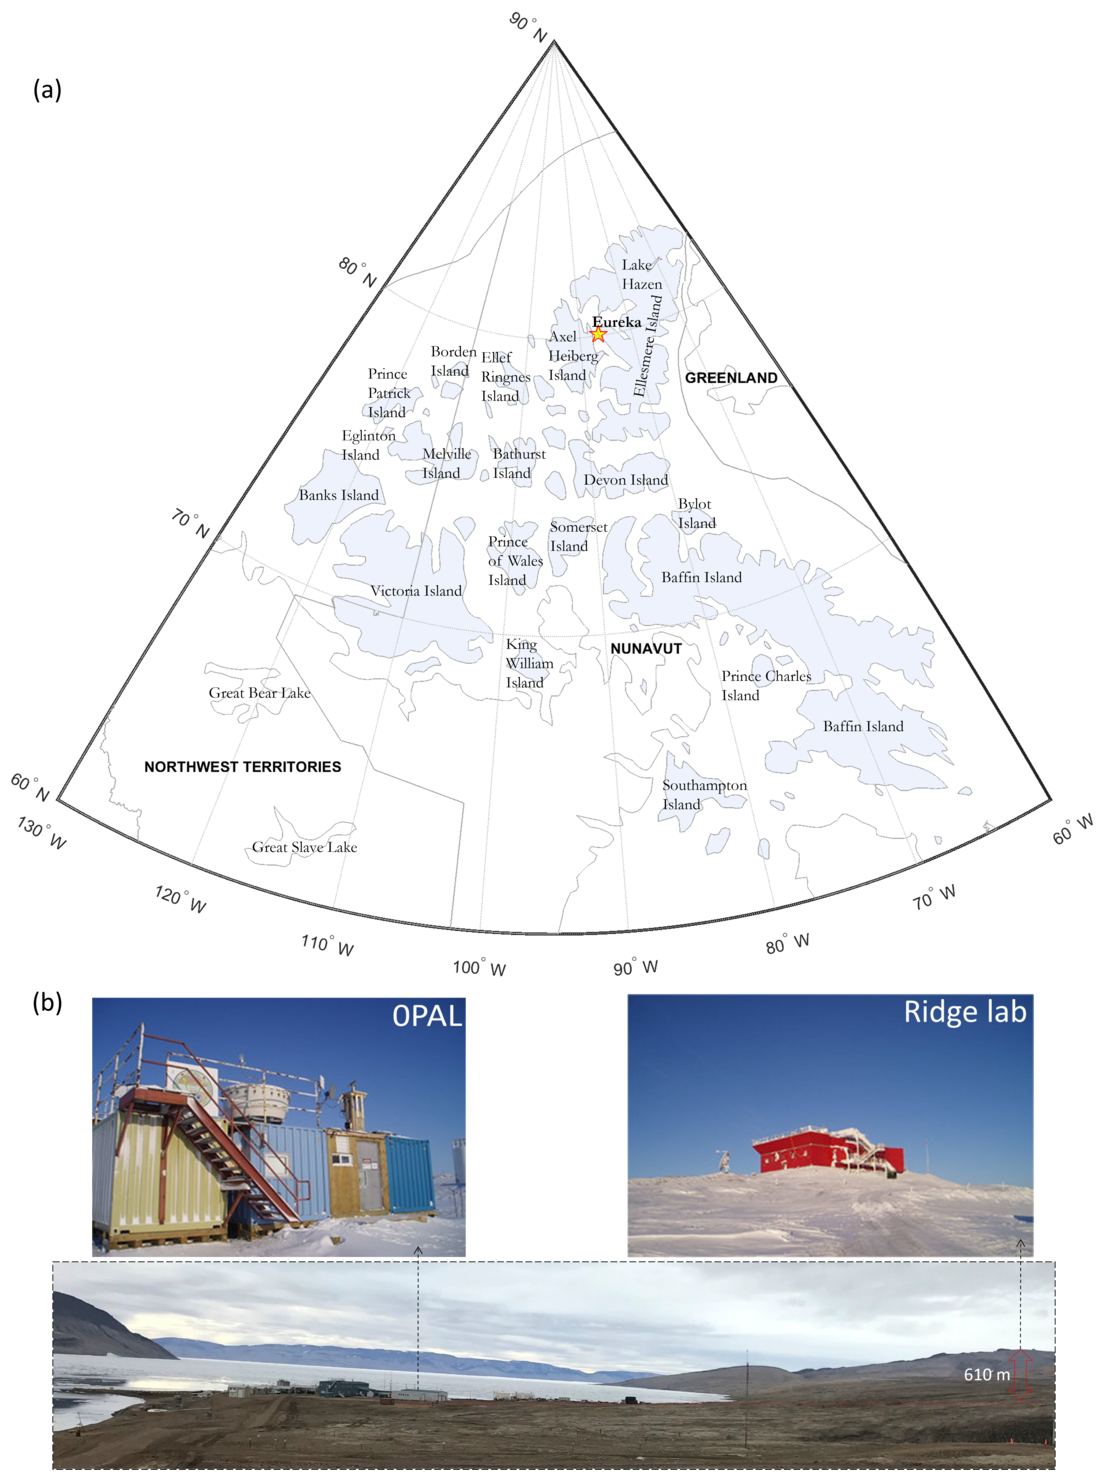
Figure 1(a) The geographical extent of the CAA as indicated by light-blue shading. The PEARL observatory at Eureka, Nunavut is indicated by a yellow star, (b) the PEARL complex showing both the 0PAL (left) and Ridge lab (right) sites (a wide-angle photo of the PEARL complex is below those photos). The nominal (AERONET) coordinates of the 0PAL and Ridge lab sites are, respectively; 79.990° N, 85.939° W at 5 m elevation and 80.054° N, 86.417° W at 615 m elevation.
The PEARL research complex
The Polar Environment Atmospheric Research Laboratory (PEARL) at Eureka is an important High-Arctic location where optical and microphysical measurements of gases, aerosols and clouds are conducted on a quasi-continuous basis. The PEARL complex (indicated by a star on the map of Fig. 1a) includes two atmospheric measurement sites (Fig. 1b): the 0PAL (Zero Altitude PEARL Auxiliary Laboratory) at 5 m a.s.l., and the Ridge lab at 615 m a.s.l. The 0PAL site and the Ridge lab are separated by a 15 km-long gravel road.
In this section, we present a brief overview of the instruments and measurements employed in our local dust investigations at the PEARL complex and a summary of the satellite imagery products that we employed over targeted CAA sites in our search for detectable dust events.
3.1 Sun photometer/sky radiometer
Spectral AOD and almucantar sky radiance measurements were acquired by two automated AERONET CIMEL sun photometer/sky radiometers (see Giles et al., 2019, for recent details on the CIMEL instrument and the AERONET network). The Canadian sub-network of AERONET (AEROCAN) is run by Environment and Climate Change Canada (ECCC) in collaboration with AERONET (Ihab Abboud is the AEROCAN coordinator). The Ridge lab and the 0PAL CIMEL have been in operation from 2007 to 2019 and from 2007 to the present, respectively5. The Ridge lab CIMEL is labeled ”PEARL” in the AERONET database.
The CIMEL instruments acquire solar-disk irradiances across eight spectral channels from the ultraviolet (UV) to the short-wave infrared (SWIR) at central wavelengths (λ) of 340, 380, 440, 500, 675, 870, 1020, and 1640 nm in a sequence of three 10 s (triplet) observation at a nominal temporal resolution of 3 min between triplets (15 min for older CIMEL versions). Version 3, Level 1.0 AERONET AODs were employed in the analysis (unless otherwise stated). These AOD spectra yield fine mode (FM) and coarse mode (CM) AODs (the AERONET SDA product at 500 nm wavelength) with pre-cloud-screened filtering being driven by a ceiling on the variation of the triplets (see Giles et al., 2019, for AERONET processing details and products).
The CIMELs also acquire (low frequency) AOD spectra and almucantar radiances across four spectral bands (380, 440, 675, 870 nm) at a nominal temporal resolution of 1 h6. Version 3, Level 1.5 (cloud-screened) AOD measurements and associated almucantar radiances are inverted to yield (what amount to) columnar averages of refractive index and PVSDs.
3.2 Aerodynamic Particle Sizer Spectrometer
The Aerodynamic Particle Sizer (APS) spectrometer measures both aerodynamic diameter and light-scattering intensity (TSI Incorporated, 2022). Their basic size distribution product is a largely CM product (52 optical channels with an aerodynamic particle diameter range between 0.5 and 20 µm). The chosen temporal bin-sampling frequency was 1 min. Particle-number size distributions () are calculated by dividing the measured number concentration of each bin by its logarithmic bin size (dlog D). PVSD concentrations () are then expressed in terms of equivalent spherical particles (). CM particle-volume concentrations (vc) are obtained by adding the dv = PVSDs × dlog D across a range of CM channels7 (vc = ).
3.3 Arctic High Spectral Resolution Lidar
The Arctic High Spectral Resolution Lidar (AHSRL) was deployed at 0PAL between August 2005 and June 2010. The AHSRL employs Doppler-type lidar technology to separate (slow-moving aerosol and fast-moving molecular), velocity-induced differences in Doppler frequencies. This separation enables the retrieval of particle (aerosol and/or cloud) to molecular backscatter coefficient ratios that, in turn, allow for the extraction of particle backscatter profiles by the simple expediency of multiplying by the relatively well-known molecular backscattering profile (see Eloranta's HSRL chapter in Weitkamp, 2005). The AHSRL provides backscatter coefficient8 (β with units of sr−1 km−1) and volume depolarization ratio (VDR9) profiles of 7.5 m vertical resolution up to 30 km of altitude and inter-sample resolution of 1 min (Eloranta et al., 2004). The VDR is a well-known source of information related to the optical separation of FM and CM contributions to the backscatter signal. We employ that type of information below to make links with CM AODs (DODs) derived from the CIMEL instruments.
The β altitude profiles can be integrated to yield what we refer to as the particulate backscatter optical depth (τβ) whose FM and CM AOD components are τβ,f and τβ,c. If the FM and CM profiles are largely dominated by homogeneous particle types (like, respectively, FM sulphatic-based pollution particles and CM dust) then their corresponding optical depths are given by = Sfτβ,f and = Scτβ,c (where Sf and Sc are the lidar ratios [sr] of the FM and CM particle types).
3.4 Satellite imagery
MODIS satellite images along with their derived AOD products as well as MISR multi-view images and their AOD, plume height and plume speed products were employed to investigate a variety of dust events using the contextualizing diversity of information layers available from the NASA Worldview10 application. High spatial resolution Sentinel-2 color images from the Copernicus Browser11 were also employed on an as-needed basis: they often yielded physical and/or spatio-temporal insights into local dust behavior that was not obvious in the (comparatively) low-resolution MODIS imagery and products.
3.4.1 MODIS
MODIS multispectral imagers operate on both the descending-orbit (Terra) and ascending orbit (Aqua) satellites at an altitude of 705 km12. MODIS employs 36 spectral bands between 400 nm (UV) and 14.4 µm (thermal-IR) at three different nadir spatial resolutions of 250 m (bands 1–2), 500 m (bands 3–7), and 1 km (bands 8–36). The sensor has a swath width of 2330 km (cross-track) by 10 km (along track at nadir) and views the entire Earth every 1 to 2 d, depending on the latitude of the orbit line (Justice et al., 2002). The MODIS “true color” RGB images provided by the NASA Worldview application have a spatial resolution of 250 m (R = Band 1 at 620–670 nm, G = Band 4 at 545–565 nm, B = Band 3 at 459–479 nm).
The highest-resolution, 3 km land and ocean (550 nm) AOD products (Terra, MOD04_3K, and Aqua, MYD04_3K) are computed using the Dark Target (DT) algorithms over dark land and ocean targets during daytime overpasses (Levy et al., 2015a, b). We employed the 3 km data while monitoring the predictions of the 10 km Deep Blue (DB) AOD product over Arctic land surfaces (Levy et al., 2015c, d) where the DT AOD product was typically sparse or non-existent. The DT algorithm's dependence on the presence of dense dark vegetation to achieve its dark pixel threshold over land is rarely achieved over the Arctic: the DB algorithm was designed to retrieve AOD over surfaces such as deserts or arid lands that are bright in the visible wavelength spectrum (Sayer et al., 2014). It is tempting to employ this product given that vegetation-sparse Arctic tundra often satisfies the conditions for the generation of DB AODs. However, it is a largely untested product over high-Arctic sites (Andrew Sayer, personal communication, 2025) and our investigations showed the presence of frequent AOD plumes (patches) that were often inordinately coincident with persistently dark reflectance patterns in the imagery. In the end we relied almost exclusively on the DT retrieval over water surfaces.
We employed the MODIS FMF (Fine Mode Fraction) product (Song et al., 2021) as a means of separating out the CM AOD from the AOD (CM AOD = (1 − FMF) × AOD). As indicated above, the DOD is generally expected to be dominated by CM particles. Sea-spray particles are also CM in nature: however, the unique spatial nature of dust plumes and their land-based origin largely occluded any possible mixup with sea-salt particles.
3.4.2 MISR
The Multi-angle Imaging SpectroRadiometer (MISR), aboard the Terra satellite, acquires images of the same scene at nine different viewing angles. The imagery ranges from aft- or backward-looking (−70°) to fore- or forward-looking (+70°) views in four spectral bands (blue at 447 nm, green at 558 nm, red at 672 nm, and near-infrared at 867 nm). The “Global Mode” nadir spatial resolution is 275 m which degrades to 1.1 km for all off-nadir bands except the red band (MISR Handbook, 2000). The latitude-dependent revisit time is every 2 to 9 d across a 380 km swath (Garay et al., 2020). The stereoscopic nature of the 9 MISR images enables the extraction of plume height and plume velocity. Both parameters are critical for dust plume investigations. This was notably, demonstrated by Ranjbar et al. (2021), for the case of a strong local-dust plume over Lake Hazen (about 330 km northeast of PEARL) that was characterized using MISR, MODIS, CALIOP and CloudSat data. More detailed information on MISR stereoscopic height and wind speed retrievals and the algorithm used to generate these products (the MISR INteractive eXplorer or MINX algorithm) can be found in Nelson et al. (2013), who also provide case studies of plume height and wind speed retrievals for smoke, dust, and cloud.
It was known, from its earliest conception, that the multi-angle feature of MISR would facilitate the extraction of aerosol parameters given their spatial invariance relative to the typically high frequency spatial variance and differing spectra of surface reflectance (see, for example, the definitive overview of Martonchik et al., 1998). The specific stereoscopic capabilities of MISR enable, in turn, the detection of aerosol or cloud plumes and the computation of their optical depth (see, for example, Kahn et al., 2007, for the case of dust, smoke and volcanic plumes at the 17.6 km atmospheric processing resolution). More recent versions of the MISR processing chain included a 4.4 km resolution, near real time, V23, Level 2 AOD product (Witek et al., 2021) whose AODs are reported at the standard reference wavelength of 550 nm (ibid). We employed both the MISR plume height and AOD products in our investigations of local-dust events across the CAA.
Our results are reported in two subsections: 4.1 – “Analysis of dust events at Eureka” and 4.2 – “Satellite-based RS of local dust events across the CAA”. Our goal is to demonstrate how an experienced-based local dust narrative can be built using the ground-based optical and microphysical measurements of dust plumes in the Eureka region while underscoring what can be achieved using satellite-based RS data that is informed, as much as possible, by the ground-based and satellite-based results at Eureka.
4.1 Analysis of dust events at Eureka
We carried out a purely optical analysis comparing CIMEL and AHSRL data13 in order to investigate certain optical dynamics that were consistent with the apparent presence of dust particles at low elevations between 0PAL and the Ridge lab. In a different sequence of aerosol events, the 0PAL CIMEL AOD measurements and in situ APS PVSDs shared a common measurement period from 9 July to 20 September 2018. These two periods were an important focus of our ground-based analysis at the PEARL sites. The correlation between different independent datasets was a key aspect of a multi-pronged strategy to provide evidence of Arctic dust events whose RS detectability can be generally characterized as weak to marginal (O'Neill et al., 2025).
4.1.1 Passive vs. active (ground-based) optical analysis at Eureka
Potential dust events over the August 2005 to June 2010 period (the duration of AHSRL measurements at 0PAL) were investigated by looking for low-altitude, large-amplitude VDR events whose derived CM AODs were correlated with the 0PAL CM AOD () and not correlated with the PEARL CM AOD () (if the plumes were found to be largely below the PEARL_CIMEL elevation of 615 m). The AHSRL CM AODs () were obtained by integrating CM lidar backscatter coefficient (βc) profiles associated with VDR values greater than a particular threshold (δthr) (from the 0PAL to Ridge lab elevations) and employing prescribed FM and CM lidar ratios. The reader is directed to Appendix A1 for a discussion of the FM/CM attributions between the 0PAL and PEARL CIMELs and for temporal resampling details (the resampling of and measurements to times). The theoretical VDR-driven FM/CM attributions for the lidar are defined in Appendix A2.
We analyzed the AHSRL profile statistics of 7 events that we claimed to be dust events in Sect. A3.2. The impact of varying the FM/CM attribution threshold of the VDRs (the value of δthr) is detailed in Appendix A3.314. We eventually determined that a 5 % VDR threshold for separating CM and FM optical depths was a reasonable compromise. The AHSRL profile details as well as the corresponding derived values of , , , and the 0PAL minus PEARL difference (Δτc) are shown in Figs. S1a to S7a15 while the summary (profile- and event-integrated) VDR statistics for those lidar profiles are given in Figs. S1b to S7b of the same file (with the overarching VDR statistics being given in the table of Fig. S8). A brief overview of those overarching statistics is given in Sect. A3.2.
Figure 2 shows the calculated cloud-screened CM AODs during the apparent dust event of 23 July 2007 (what we call Event 5). We chose it to illustrate the key elements in support of our dust plume detection claims. The and values show the high frequency variations that we argue are due to near surface dust. The (high frequency) similarities between the and “spikes” (coupled with the low frequency unresponsiveness of to those spikes) are coherent with an argument for the presence of a weak, low-altitude dust event. The standard deviation (SD) of is generally significantly larger than the SD of (this disparity amounts to a quantitative verification of the relative unresponsiveness of ).
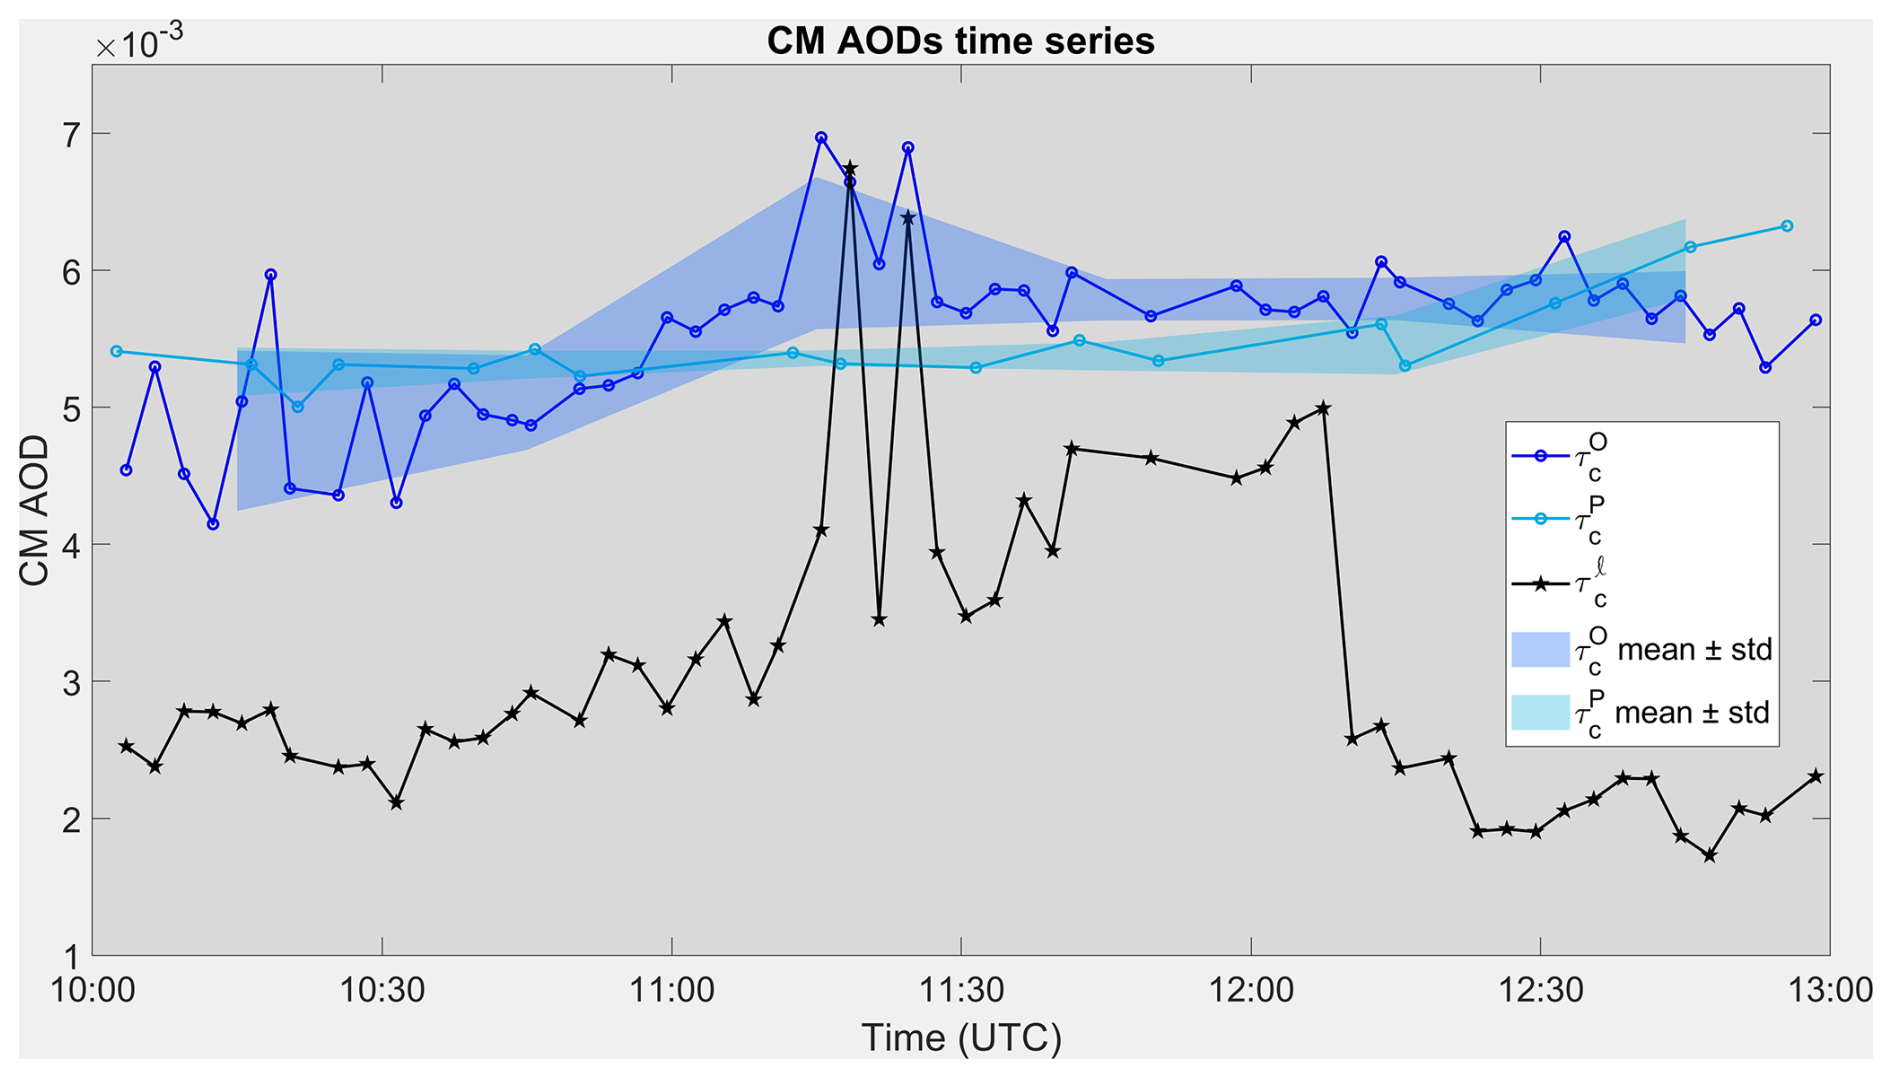
Figure 2Level 1.5 (cloud-screened) CM AOD time series of the 23 July 2007 dust event (Event 5 of our 7 dust events) for the CIMELs at 0PAL () and PEARL () as well as the 0PAL AHSRL () (altitude range of 5 to 615 m). The δthr value for separating CM and FM AODs was 5 %. should, normally, be greater than but the nominal CIMEL accuracy of ∼ 0.01/airmass (for both the 0PAL and PEARL CIMELs) is a key factor in the absolute comparison of these very small CM AOD values. The solid, blue-toned bands show the running standard deviation (SD) about the running mean over 30 min intervals with the first-interval mid-point starting at 10:15 UTC (we produced these bands to focus on the high frequency differences between and (to avoid the standard deviation contributions of more low frequency variations)).
The vs. intra-event statistics show marginal to moderately large correlation coefficients (R values from 0.41 to 0.64) for each of the seven events while the inter-event correlation coefficient for the ensemble of seven events was significant (R = 0.78). The complete ensemble of individual CM AOD measurements in August and July 2007 show diurnal examples of what we determined to be largely dust-free conditions in the 0PAL to PEARL layer. A particular example on 19 July 2007, occurred in the presence of very clear background columnar conditions above the 0PAL and PEARL CIMELs16: it was thus an explicit example of clean background conditions that could be used as reference for declarations of time-varying dust events in the layer between the two events.
4.1.2 Optical vs microphysical (ground-based) analysis at Eureka
Figure 3 encapsulates the analysis that we carried out in the comparison of the CIMEL CM AODs and APS vc values associated with an event that we argue was a significant dust event at Eureka. The simultaneous rise of the APS vc values and the time series after 20:30 UTC in Fig. 3c and d are likely the start of a CM-aerosol event which this and other evidence (see Sect. 4.1.3) suggests was a dust event. The zoomed Fig. 3d shows a rather remarkable vs. vc correlation with departures from that correlation in the neighbourhood of and vc peaks at, respectively, ∼ 21:30 and 00:30 UTC (the former could be ascribed to very thin cirrus clouds that we failed to detect in any satellite data while the latter could be the result of a very spatially-variable dust plume). During this particular event, two large temporal spikes were eliminated from the Level 1.0 retrievals by the AERONET temporally-driven (Level 1.5) cloud-screening algorithm (the Level 1.0 AERONET product of “Coarse AOD” can include CM cloud particles as well as CM aerosols). During this particular event, two large temporal spikes were eliminated from the Level 1.0 retrievals by the AERONET temporally-driven (Level 1.5) cloud-screening algorithm. Supporting data for this elimination17 is presented in Figs. S9 to S11 where we demonstrate that the Level 1.0 CM AOD spikes represent cirrus clouds that temporarily fouled the CIMEL sun-pointing FOV as determined using the MISR sensor.18
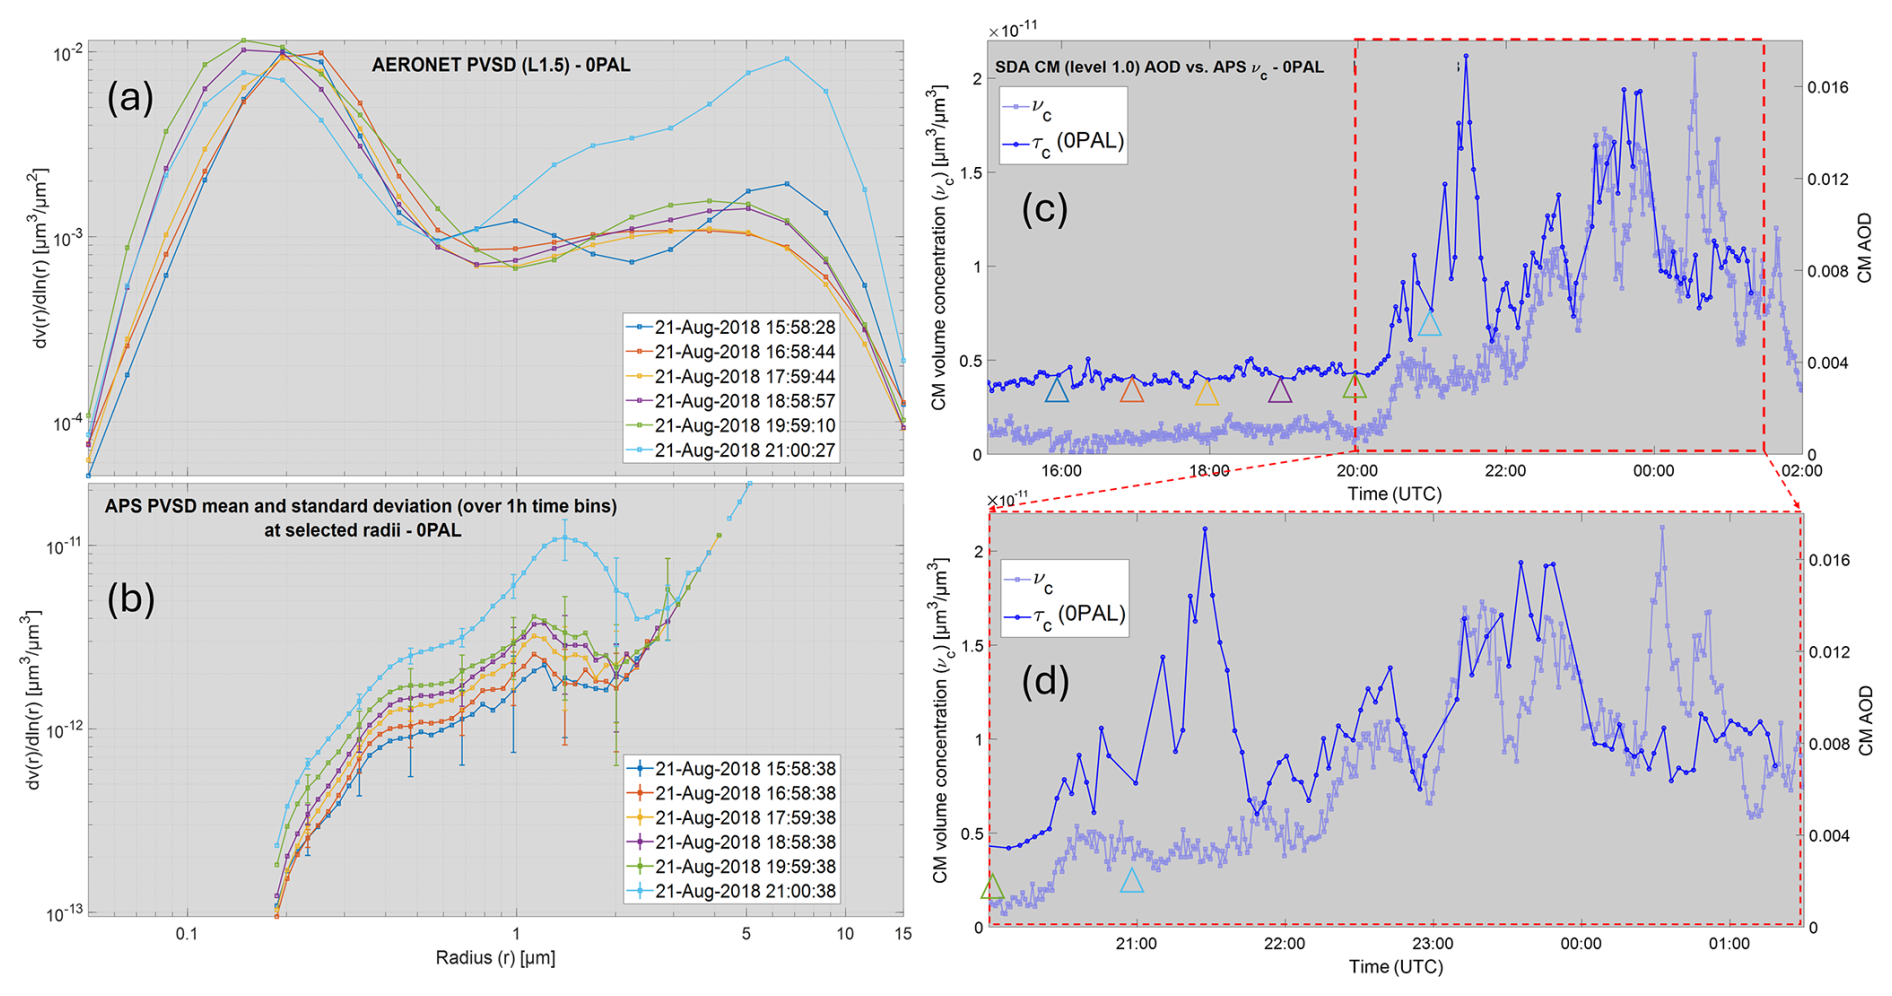
Figure 3(a) AERONET inversion PVSDs for the claimed dust event of 21 August 2018, (b) APS hourly-averaged PVSDs at the times of the AERONET PVSDs (with standard deviations shown as error bars). Note that the APS points beyond ∼ 3 µm radius were either superimposed and/or free of counts in a given bin (c) SDA Level 1.5 CM AOD () and APS vc time series and (d) a zoom of (c) at the claimed time of the dust event. The triangles shown in panel (c) indicate the approximate time of the AERONET and APS PVSDs (color coded to match the colors of the 6 PVSD cases in panels a and b). The original high-frequency 3D (1 min sample frequency) time series of APS PSDs are available upon request from the authors.
The inferred approximate position of a smaller-radius AERONET PVSD peak in Fig. 3a and the APS peak in Fig. 3b (the cyan curves at 21:00 UTC) suggests a common mode peak ∼ 1.3–1.5 µm (with the AERONET peaks at radii 6 µm being outside the radius range of the APS). The 1.3–1.5 µm peak radius is ∼ 1.3 µm AERONET inversion peak reported by SDN in their analysis of local dust at the Kluane Lake19 AERONET station in the Canadian Yukon (while the 6 µm AERONET peak is near the upper limit of the reported KLRS peak radius range from ∼ 4 to 7 µm for the 5 largest CM AOD cases; see Fig. 9 of that paper). However, the KLRS CM AODs were ∼ 2 to 14 times the CM AODs of the event shown in Fig. 3c (after the onset of the significant rise around 20:30 UTC for which the CM AODs are ∼ 0.006 to 0.016 or a Δ(CM AOD) ∼ 0.01). In general, dust plumes in the Lhù'ààn Mân' region (associated with drainage basins of significantly greater relief than the region of Eureka) demonstrated a CM AOD domination relative to the dust plumes that we claim to have found at 0PAL (Fig. 3c).
SDN speculated that the smaller CM (1.3 µm) AERONET-inversion peak was more likely ascribable to springtime Asian dust (while noting that the PVSDs measured with the TSI Optical Particle Sizer (OPS) device at KLRS showed no distinguishable peak that was comparable with the 1.3 µm AERONET-inversion peak). However, the results presented in Fig. 3b suggest a ∼ 1.4 µm (small CM) APS peak that is clearly not due to springtime Asian dust (and thus could be ascribable to phenomenologically different dust PVSDs and CM AODs than those of the much more dynamic and optically strong KLRS site).
We believe that (i) the levels of PVSD-shape correspondence found between the AERONET and APS PVSDs as well as the higher-frequency temporal correspondence between the AERONET CM AOD values and the APS vc values and (ii) the purely optical low-level plume evidence presented above for the 23 July 2007 case (the correspondence between and ), lend credence to a claim of having measured, two independent low-level and optically weak (local) dust events at the Eureka 0PAL site (the CIMEL Δ(CM AOD) increases during both events were respectively 0.007 − 0.004 = 0.003 and 0.016 − 0.006 = 0.010). The detection of such optically weak events (which effectively amount to lower limits of precision in ground-based dust AOD detectability) help to inform (appreciate certain limitations of) any satellite-based (CM AOD) search for optically detectable local dust events across the CAA. In the first instance, such weak events would seem to be detectable from a satellite sensor such as MODIS whose nominal precision appears to be significantly smaller20. However, MODIS AOD precision is clearly an excessively optimistic (out of context) statement since that (coarse numeric scale) precision estimate in the presence of very small AODs would, no doubt, dramatically change (not to mention the fact that the nominal accuracy of the 3 km MODIS product (±0.04) is much larger than the nominal precision).
4.1.3 Satellite imagery vs. ground-based measurements at Eureka
The synchronicity between the CM APS vc and the time series on 21 August 2018 (after 20:30 UTC) coupled with evidence of what were likely dust plumes over Eureka Sound (notably weak, grey-white plumes that appear to stretch across Eureka Sound21 at and south of the entrance of Slidre Fjord) provide regional evidence for the possibility of a very weak dust event at 0PAL (that was probably incited by the strong (generally north to south) winds of Fig. S12 as they travelled over the Fosheim Peninsula landmass north of 0PAL). While Sentinel-2 clearly sees apparent dust plumes in Eureka sound (that MODIS AOD imagery suggests is 22) even the Sentinel-2 imagery, would likely not detect a sub 0.01 CM AOD (the post 20:30 UTC 0PAL CM AOD values of Figs. 3c and d): the explicit image evidence for weak plumes over or near the 0PAL site is ambiguous at best.
Figure 4 shows the temporal variation of the Eureka wind speed (ws) and wind direction for 21 and 22 August. The rapid increase at ∼ 21:00 UTC in the vc and time series of Fig. 3c is within the period of significantly high-amplitude ws values from 18:00 on 21 August to 18:00 on 22 August (the red-filled points of Fig. 4). This behavior is broadly consistent with CARRA (Copernicus Arctic Regional Reanalysis) near-surface simulations in the neighbourhood of Eureka Sound to the west of 0PAL (the region of the 21 August dust plumes in the Sentinel-2 image of Fig. S12). We would argue, based on the CARRA spatio-temporal simulations of generally weaker ws values at 18:00 UTC to generally stronger values at 21:00 UTC over the Eureka Sound/0PAL region23, that a significantly strong regional wind event24 incited the Eureka Sound 21 August dust plumes and the attendant vc and increases near 0PAL (the latter plumes likely being induced by northerly winds traversing the slopes of the Fosheim Peninsula).
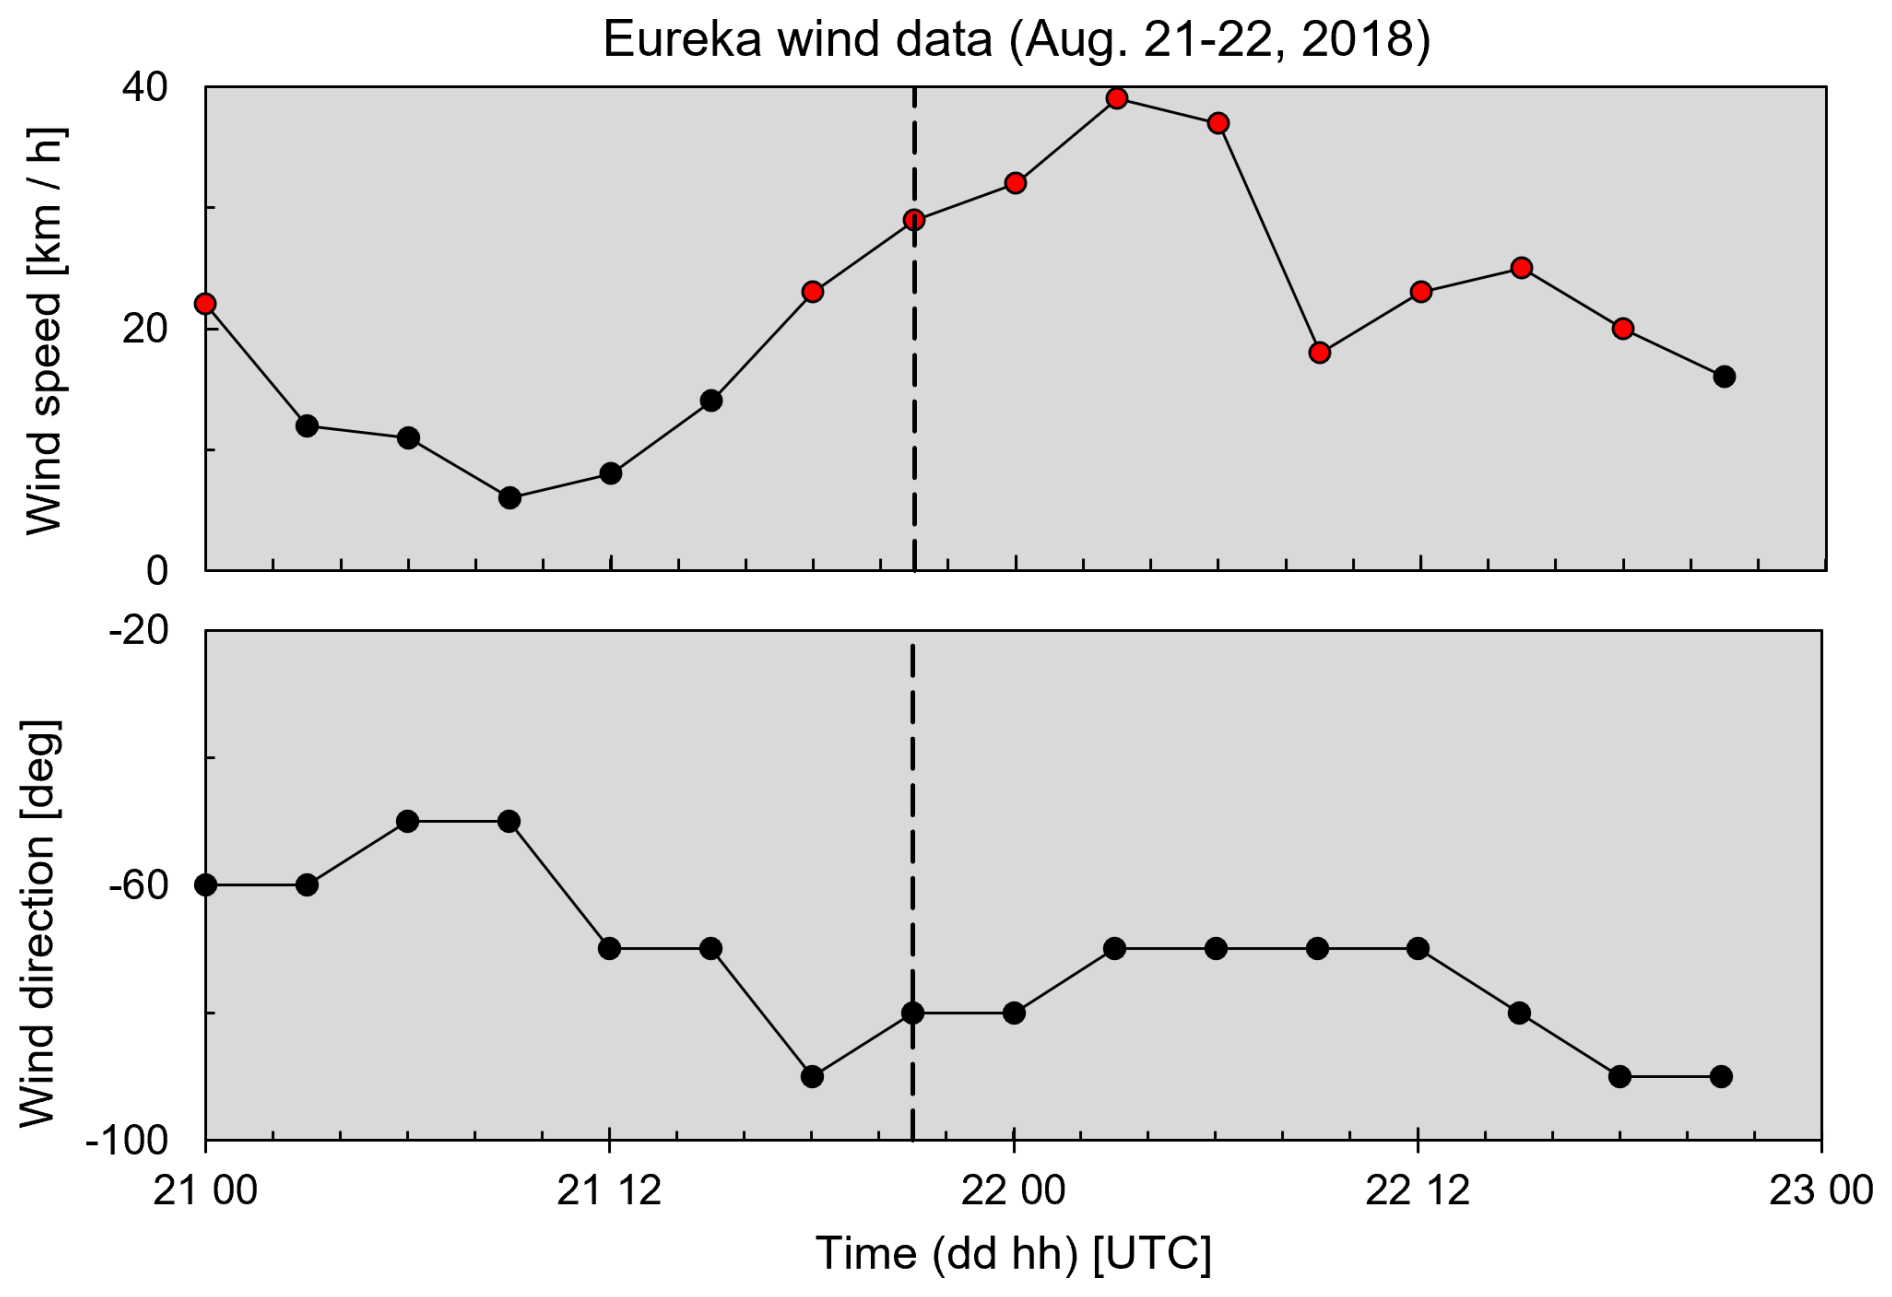
Figure 4Temporal variation of the wind speed and wind direction for 21 and 22 August 2018 (data from the ECCC “Eureka Climate” station very near 0PAL). The wind direction is defined as the direction that the wind is coming from relative to the station meridian. Positive and negative wind directions refer to CW and CCW angular departures from the meridian. The red-filled points indicate wind speeds that are above the mean + standard deviation (15.5 + 2.5 = 18 km h−1) value of the Eureka (August) windspeed climatology reported in Fig. 5 of Lesins et al. (2010). The dashed vertical line shows a time (21:00 UTC) that is representative of the significant rise in CM AOD () and APS vc values in Fig. 3.
4.2 Satellite-based RS of local dust events across the CAA
We employed satellite-based RS to investigate potential dust events over CAA sites where there was no ground-based sensors. Our goal here was to gain more insight into satellite-based RS capabilities in different types of Arctic environments. A strong motivation for the CAA analysis was our belief that satellite-based dust RS findings over a variety of CAA sites would help build confidence in the satellite-based RS of dust events in general and weaker dust events in particular. Each one of our dust event cases below includes a small CAA map with the position of the event indicated by a green star.
4.2.1 Large-scale dust event in the northern part of the CAA
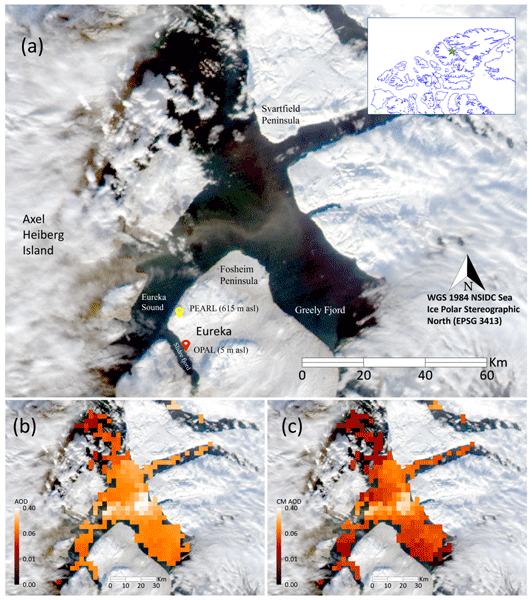
Figure 5a shows an Aqua true color image25 of a dust plume that appears to originate from Axel Heiberg Island26 and flow along the open water of Eureka Sound and Greely Fjord. The thumbnail images of Figs. 5b and c show respectively, the MODIS-Aqua AOD and CM AODs (3 km resolution product) superimposed on the color image. Figure S14a27 shows a zoom of the Aqua color image blinking with the AOD and CM AOD products alongside a map of the region (we recommend looking at such zooms for details). The plume is most evident as it crosses Greely Fjord along its northeastward path and then appears to veer northwestward towards the coast of the Svartfjeld Peninsula. This flow pattern is generally supported by the surface ws vector field of Fig. S14b (including a final CCW turning (backing) in Greely Fjord followed by a CW turn (veering) of the dust plume towards Svartfjeld Peninsula28). The CM AOD values of Fig. S14a show a spatial pattern that includes a band of moderately stronger CM AOD values which are coherent with the northeast-flowing spatial pattern of greyish intensity variations in the true-color image (less evident but still notable is the CM AOD and greyish-intensity pattern matching of the weaker plume that has veered in the northwesterly direction). The CM AOD values vary from extremes of ∼ 0.02 to 0.31 (AOD extremes of 0.06 to 0.42).
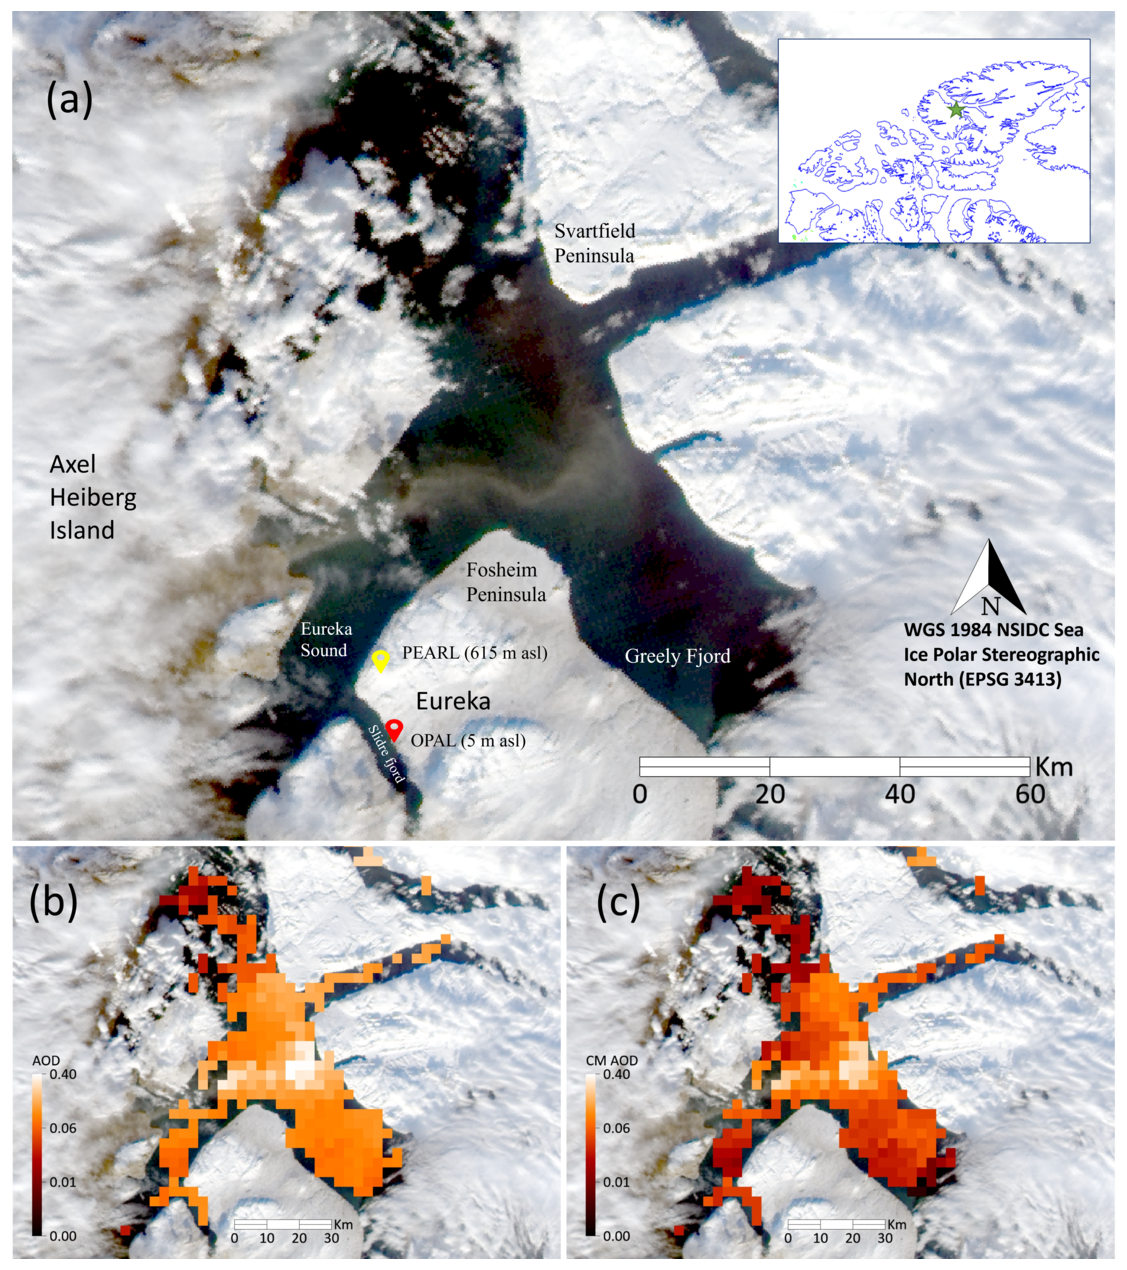
Figure 5(a) MODIS Aqua true color image acquired at 15:20 UTC on 8 September 2020, (b, c) MODIS Aqua AOD product and derived CM AOD products respectively (superimposed on the true color image: see Fig. S14a for a detailed (zoomed) overlain comparison of panels a–c). See Sect. 3.4.1 above for the expression relating CM AOD to AOD.
4.2.2 Dust event in the central southern part of the CAA
Figure 6a shows a (26 September 2015) MODIS-Terra, true color image of local dust plumes apparently emanating from Prince of Wales Island (in the central southern part of the CAA) and moving in a northwesterly direction towards Victoria Island (image acquired at 19:10 UTC). The true color image, along with the MODIS AOD products of Figs. 6b and c, supported by the MISR stereoscopic multi-look animation (see Fig. S1629 and its caption for details) reaffirm the presence of dust plumes flowing in a northwesterly direction. The color image and MODIS AOD products of Fig. 6 (see Fig. S17 for greater detail) support a claim of distinct individual dust plumes. The CM AOD and AOD values of the plumes (whose spatial variation is visually coherent with the variations of the plume-like structure seen in the color image) vary respectively, across extremes of 0.02 to 0.56 and 0.06 to 0.73). The landcover map (Fig. S18) shows a 20 km wide barren region which appears to be the dominating influence as the source of the dust plumes (judging by the color image combined with the MODIS AOD product).
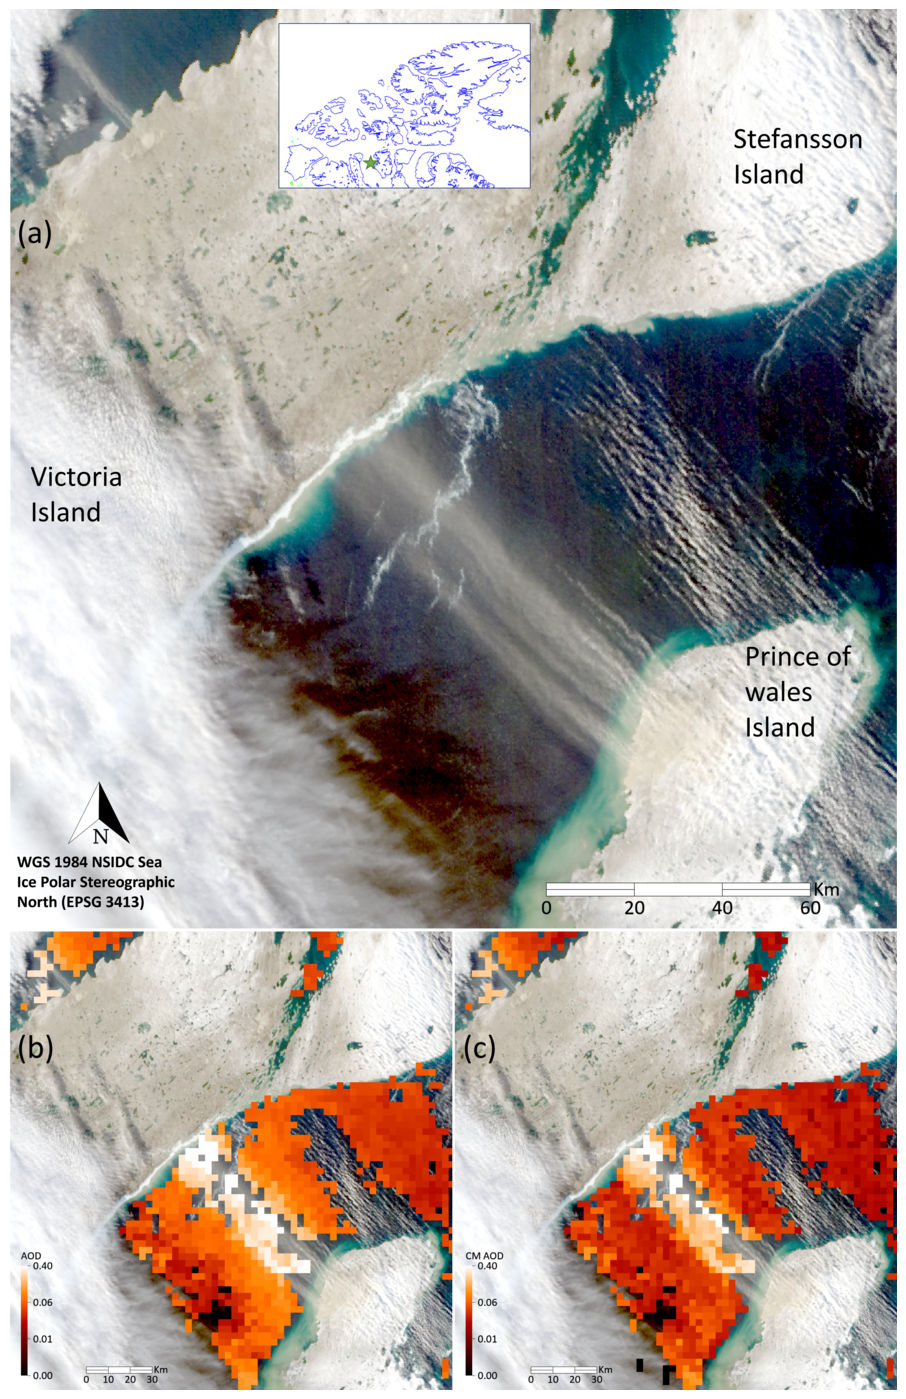
Figure 6Local dust event (over Prince of Wales Island and Victoria Island) captured on 26 September 2015. (a) MODIS Terra true-color image acquired at 19:10 UTC (b) AOD product, (c) CM AOD. Note that there appear to be distinct water plumes before and after the barren region on Prince of Wales Island (water plumes that were captured by the MODIS cloud OD product and are distinctly unique in the color image).
A sampled MISR trajectory in the direction of the dust plume (the orange-colored trajectory on the MISR color image of Fig. 7a) shows wind-corrected plume height along that trajectory while Fig. 7b and c show, respectively, plume heights as a function of trajectory-sample number and the plume heights histogram. The analogous pair of trajectory and histogram graphs for plume speed are shown in Fig. 7d and e. The average MINX (MISR) plume height ± its standard deviation is 298 ± 230 m a.s.l.30. The mean and standard deviation of the MISR wind (plume) speed histogram ( km h−1 or 54 ± 17 km h−1 when normalized to near surface conditions31). This 〈ws〉 value is ∼ the 19:00 UTC 26 September 2015 Stefansson Island met station ws value of 49 km h−1 and ∼ 3-times the (2002–2024) Stefansson Island climatological mean for the month of September (17.7 ± 10.9 km h−1).
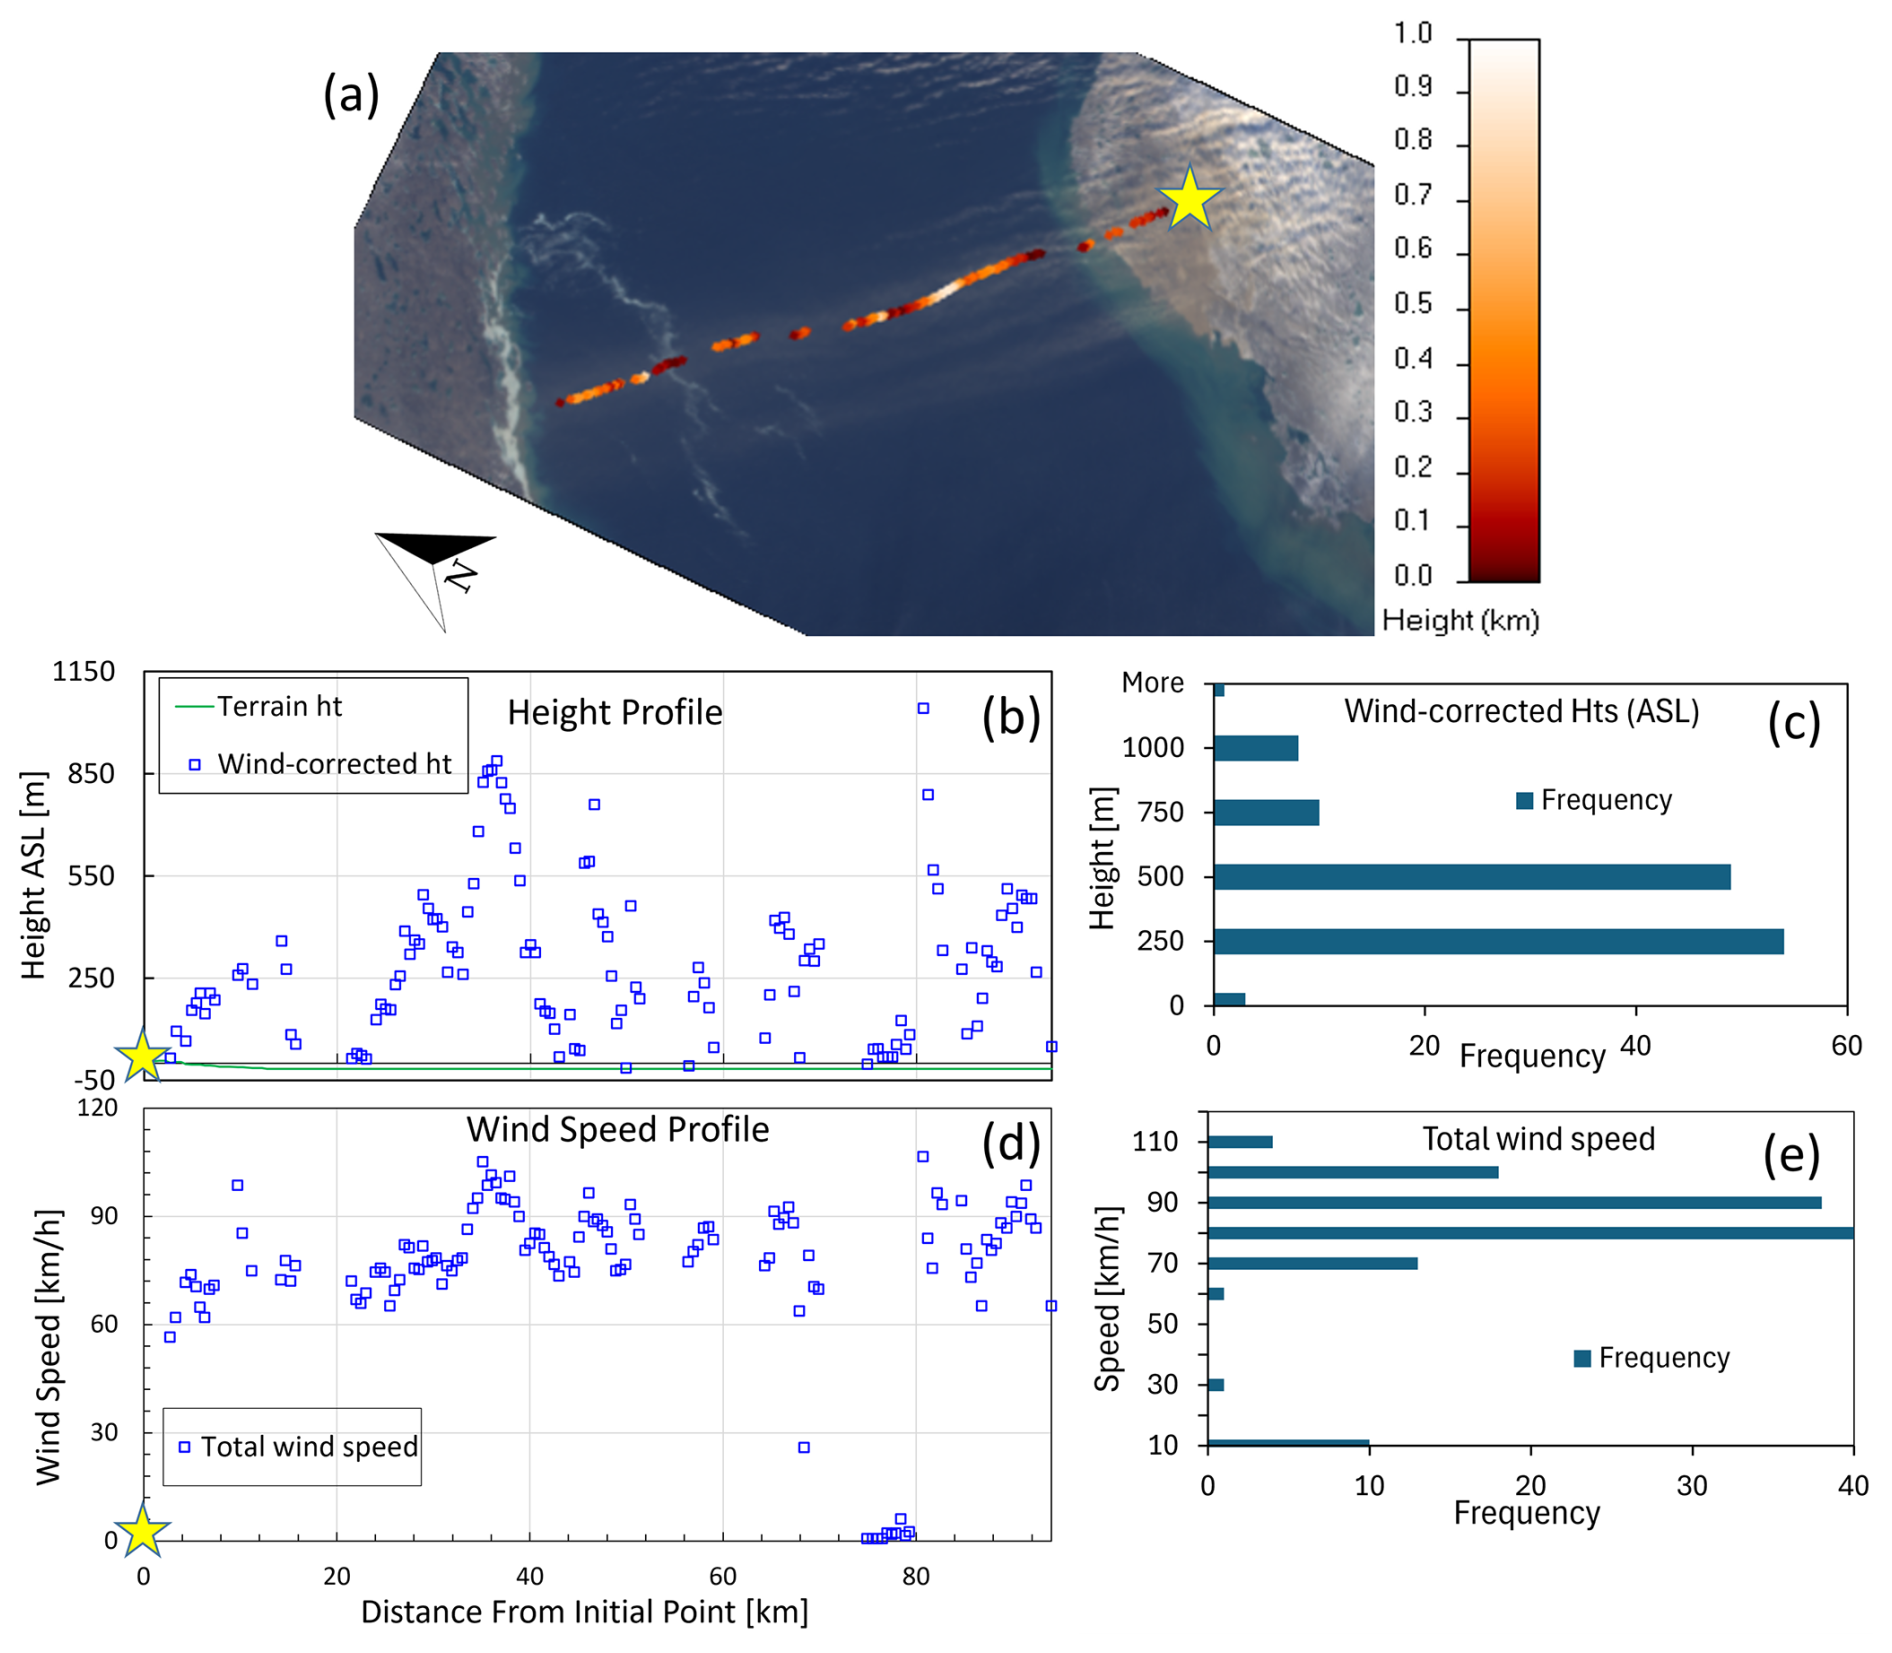
Figure 7(a) MISR nadir (An camera) true color image acquired at 19:12 UTC (275 m resolution) with retrieved MISR plume height values along a selected trajectory (the red-orange path that begins with a yellow star and whose color legend appears to the right of the image) superimposed on the color image, (b) trajectory plume heights as a function of distance from the reference point (yellow star) and (c) the histogram of those selected plume heights. (d, e) Graphs are the corresponding wind (plume) speed trajectory values and histogram. We note that the MINX assumption of no vertical plume motion may reduce the plume height retrieval accuracy (Nelson et al., 2013).
4.2.3 Dust event in the southwest corner of the CAA
The red arrows of Fig. 8a delineate what we argue are a pair of local dust plumes emanating from largely vegetation-free areas on Banks Island (the southwest corner of the CAA) and flowing south over the Amundsen Gulf (MODIS-Terra color image acquired at 20:20 UTC on 1 October 2018). Some plume widths are sufficiently thin that the moderate resolution MODIS and MISR color imagery (as well as the coarser resolution of the MODIS 3 km AOD product) diffuses out much of the fine spatial detail. The AOD product and the derived CM AOD (Fig. 8b and c) appear to capture the general individual plume patterns seen in the color imagery (and their apparent broadening into a single plume). The MODIS CM AOD values in the vicinity of those plumes range from ∼ 0.03 to 0.26 (while AOD values range from ∼ 0.04 to 0.37).
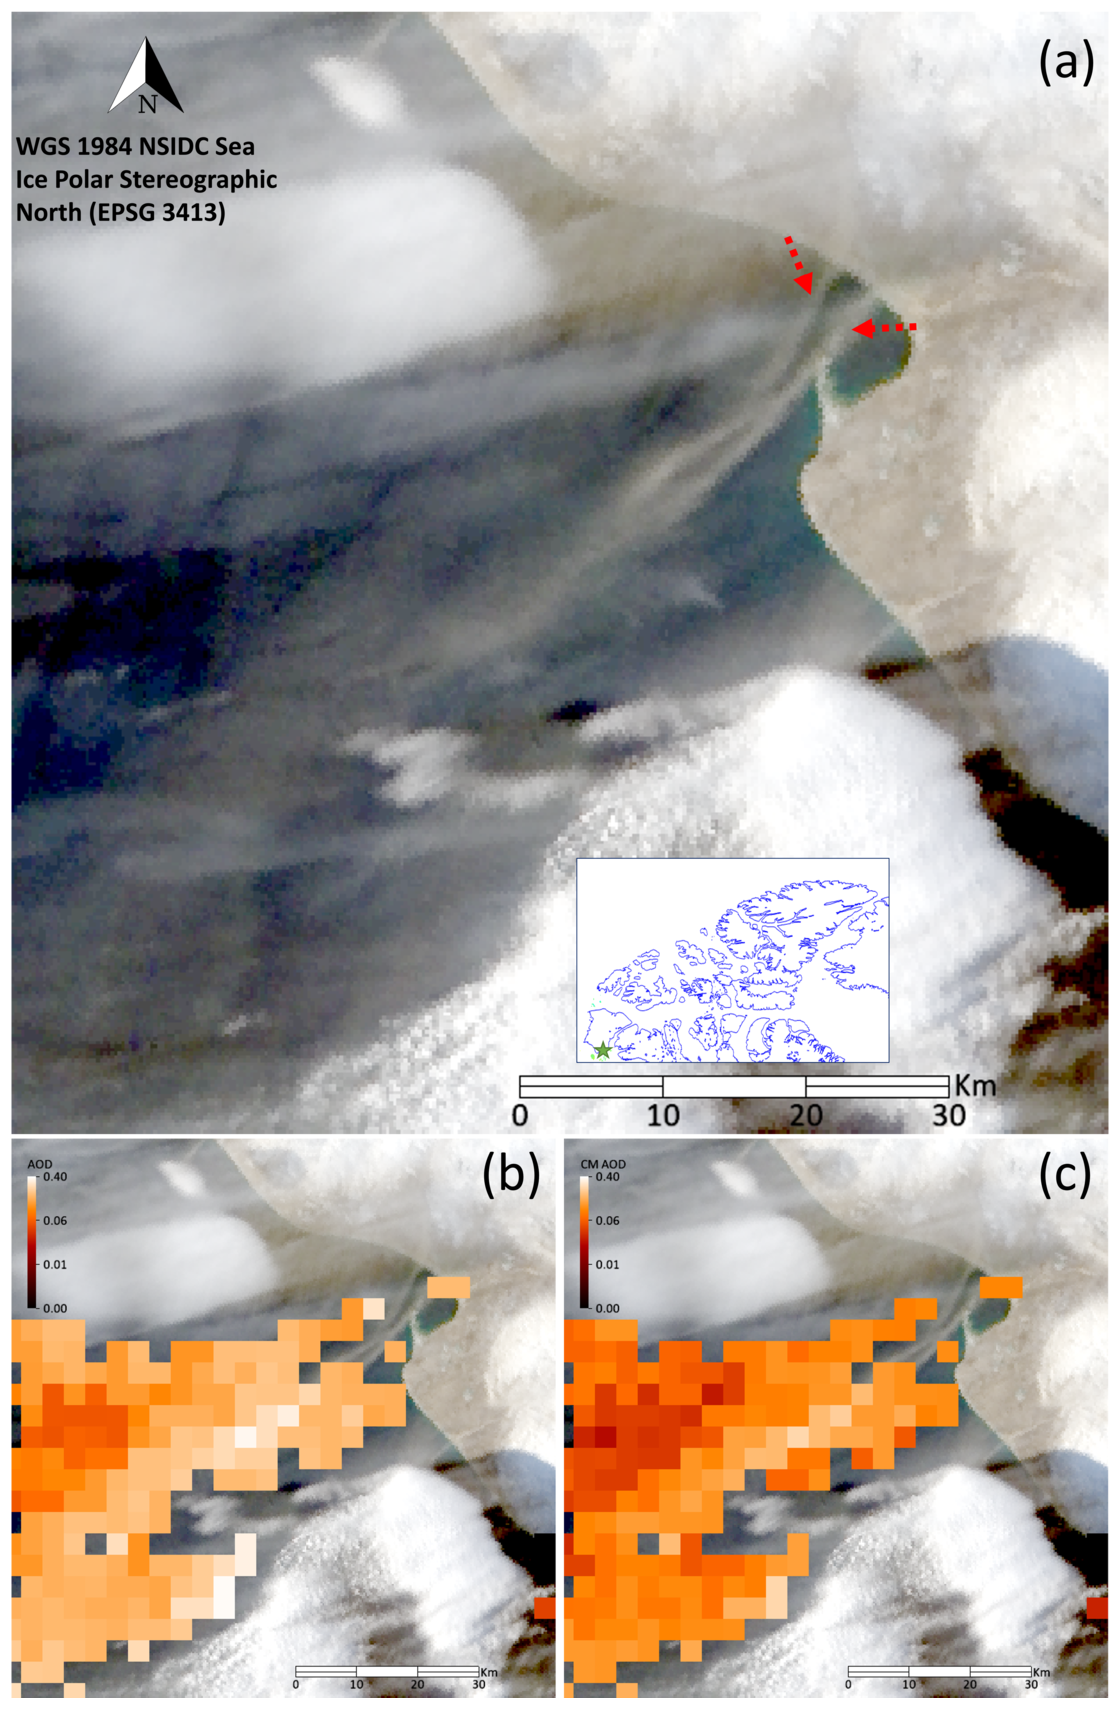
Figure 8(a) Local dust plumes emanating from Banks Island on 1 October 2018 (MODIS Terra true color image acquired at 20:20 UTC). Panels (b) and (c) show the MODIS Terra AOD and the derived CM AOD superimposed on the color image.
This was a complicated case with high altitude cirrus being (at least qualitatively) confused with the very low altitude dust plumes. The issue can, on a visual level, be resolved by deferring to animations of the multi-angle MISR views where the separation of the former from the latter (in terms of their apparent stereoscopic ground speed relative to the fixed ground scene) is evident (see that animation in Fig. S19). Figure S20 shows a sampling trajectory of the double dust plumes that are pointed to by the red arrows of Fig. 8a. The mean and standard deviation of the MISR plume height and wind (plume) speed histograms along this trajectory are respectively 196 ± 155 and 25 ± 25 km h−1 (the latter value belonging to a distinctly non-normal distribution).
The geographic details of the two thin dust plumes seen in the MODIS-Terra color image of Fig. 8a along with even weaker and thinner dust plumes elsewhere in the region are brought into rather striking relief in zooms of a high-resolution Sentinel-2 image. Figure S21 shows, what amounts to, apparent source information for five different plumes (including source information for one of the two thin dust plumes seen in the MODIS image). Those zoomed images give valuable, if indirect, contextual information on the source and dynamics of the plumes. One can, for all five cases, see a water to land dust plume continuity with the plume origins being either (a) very low altitude dust plumes over the land or (b) surface features of the sources.
4.2.4 Dust plumes emanating from Ellef Ringnes Island (eastern part of the central CAA)
The 20:10 UTC, 13 September 2014 MODIS-Terra true color image of Fig. 9a shows what appear to be local dust plumes emanating from dark brown regions of Meteorologist Peninsula32 and flowing over the open-water region at the southern tip of that peninsula. Figure 9b and c show the MODIS AOD product and estimated CM AODs over a part of that open-water region: the spatial variation of those AODs and CM AODs are qualitatively coherent with the perceived spatial variations of the dust plumes in the true color image of Fig. 9a. Figure S23 shows zoomed-in details: one can observe that the thickest part of the plumes as seen on the color image and the largest CM AODs are aligned with the brownish regions (presumably sources) on Meteorologist Peninsula. CM AOD values in Fig. 8b and c range from ∼ 0.05 to 0.47 while the AOD values range from ∼ 0.11 to 0.50.
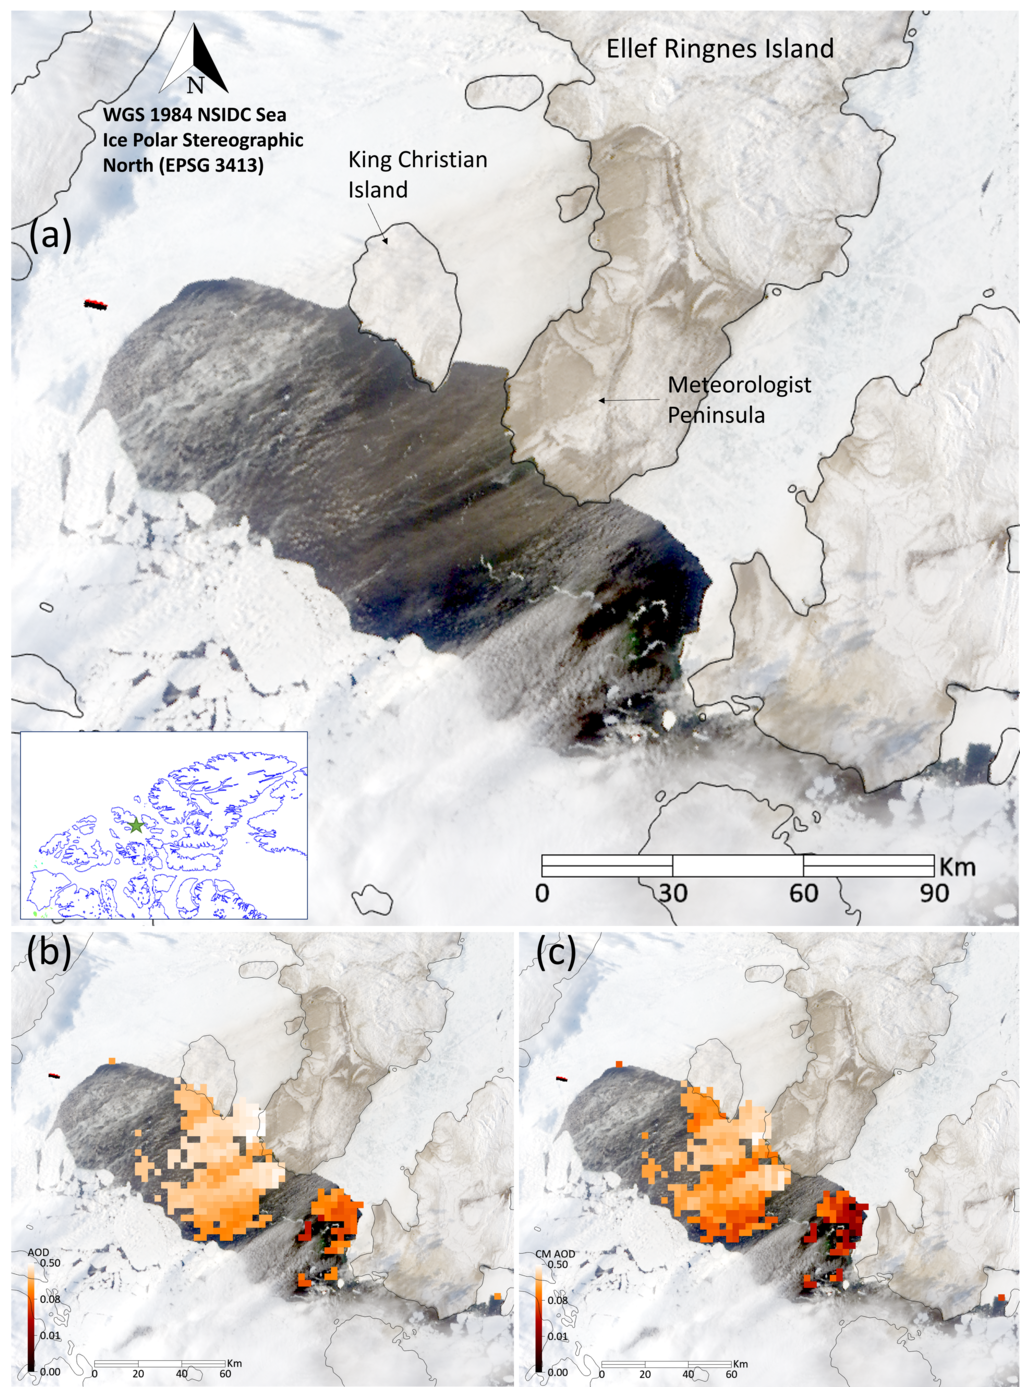
Figure 9MODIS-Terra true color imagery (logarithmic enhancement) acquired at 20:10 UTC over Ellef Ringnes Island on 13 September 2014 (a) local dust plumes over the water emanating from Meteorologist Peninsula on Ellef Ringnes Island. Panels (b) and (c) show the MODIS Terra AOD and derived CM AOD superimposed on the color image (see Fig. S23 in the PowerPoint file “Satellite_Analysis” of Sayedain and O'Neill, 2026, for a full resolution comparison of the AODs and the color image).
Figures S24 and S25 show a selected MISR trajectory case over the open water west of Meteorologist Peninsula (Fig. S22 shows the [subjective] investigation that was carried out to determine the color image enhancement that best permitted one to appreciate how the trajectory was embedded in the dust plume33). The mean wind-corrected plume height is 264 ± 162 m for the trajectory while the mean plume speed is 38 ± 14 km h−1. Normalizing the latter value to the height of the nearest met station34 yields normalized wind speeds of 32 km h−1. This is moderately lower than the 20:20 AUT met station value of 51 km h−1 and 1.7-times its climatologically (1996–2025) mean wind speed for the month of September (18.8 ± 13.5 km h−1).
In the absence of a standard AOD product we developed an ad hoc AOD retrieval technique for the dirty brown snow/ice region between Meteorologist Peninsula and King Christian Island (see Fig. S26 and its caption for details on that ad hoc technique). The results of that retrieval showed a coarse degree of AOD continuity across the ice/snow to water interface35 (see the blinking animation of Fig. S27). Evidence that the dirty brown area was (at least in part) a dust plume and not deposited dust is provided by a MISR height profile showing plume heights varying between 0 to ∼ 500 m (Fig. S28). The corresponding plume speeds of 42 ± 20 km h−1 are moderately greater than the plume speeds over water.
4.3 Surface plume deposition/snow melt; snow/ice reflectance changes as optical precursors of dust plumes
The RS of airborne Arctic dust can be advantageously complemented by the RS of reflectance changes (darkening) induced by the deposition of airborne dust on snow or ice and/or reduced reflectance incited by premature snow melt due to dust deposition. Woo et al. (1991) noted that the presence of snow-melt zones over the Fosheim Peninsula on Ellesmere Island corresponded to dark spots in early AVHRR imagery. Ranjbar et al. (2021) found roughly the same dark patterns in true color MODIS imagery and showed visual evidence of deposition of dust on snow (or underlying soil subsequent to snow melt) in a mosaic of true color MODIS imagery acquired over the whole of Ellesmere Island.
O'Neill et al. (2025) argued that the combination of persistent day to day dark zones in MODIS imagery and the lack of movement of those features in MISR multi-angle imagery was indicative of local-dust surface deposition in the case of Prince Patrick Island and neighbouring Eglinton Island (west central CAA). We found what appeared to be a more dynamic MISR example of deposited dust across the Strand Bay region of Axel Heiberg Island over a three-day period (see Fig. S29). Figure S30a shows the MISR height profile of a 8 June 2007, airborne dust plume and the position of its sampling trajectory on the associated MISR (nadir) image36. The plume profile of Fig. S30b (acquired 2 d later) shows what appears to be near-zero heights in a region where the color image indicates a much darker pattern than that of Fig. S30a37 (accompanied by a rise in plume height near the northern shore of Strand Bay). We would suggest that the darkest region of Strand Bay in the color image is likely a dynamic example of the process of dust deposition. In this particular case, the source of the (very dark) dust is likely the volcanic deposits known to characterize much of the Strand Fjord Formation (Williamson and MacRae, 2015).
Ground-based RS and microphysical measurements acquired at the PEARL complex in Eureka were employed to investigate the potential for satellite-based and ground-based RS of local dust plumes. This analysis supported and/or complemented explicit examples of satellite-based RS of local dust events near Eureka and across the CAA.
Ground-based RS validation results were obtained (in terms of the identification and characterization of local dust events) with significant correlations in 2007 data between the 0PAL (ground-based) CM AOD and the lidar-derived CM AOD (and the lack of correlation with the 615 m above-plume CM AOD at the Ridge Lab). The late-summer correlations (21 August 2018 data) between APS CM particle-volume concentration (vc) measurements and 0PAL CM AODs along with the similarity between the APS and AERONET PVSDs suggest a significant 1.3–1.5 µm radius peak that was due to local dust of weak CM AOD (). This is notable given the near-1.3 µm radius AERONET peaks reported by SDN for a springtime (May) measurement campaign at the KLRS site in the Yukon (a peak which they ascribed to springtime Asian dust).
Indirect linkages were made between the surface RS and microphysical data and available satellite on 21 August 2018, RS imagery acquired in the neighbourhood of Eureka: we argued that a weak but detectable plume over Eureka Sound (MODIS AODs ) might be related to the very weak CM AODs measured by the 0PAL CIMEL (values of that are typically undetectable by satellite RS). More direct linkages were made with 0PAL wind speed (ws) measurements and regional ws (reanalysis) values. It was argued that above normal 0PAL ws values and above normal regional ws values coupled with co-incident increases in CM AOD and vc(0) measurements at 0PAL were evidence of a region-wide wind event that caused local and regional dust disturbances.
Table 1Summary of CAA dust events captured using satellite-based RS. See footnote 37 concerning the reporting of means and standard deviations for plume height and plume speed.
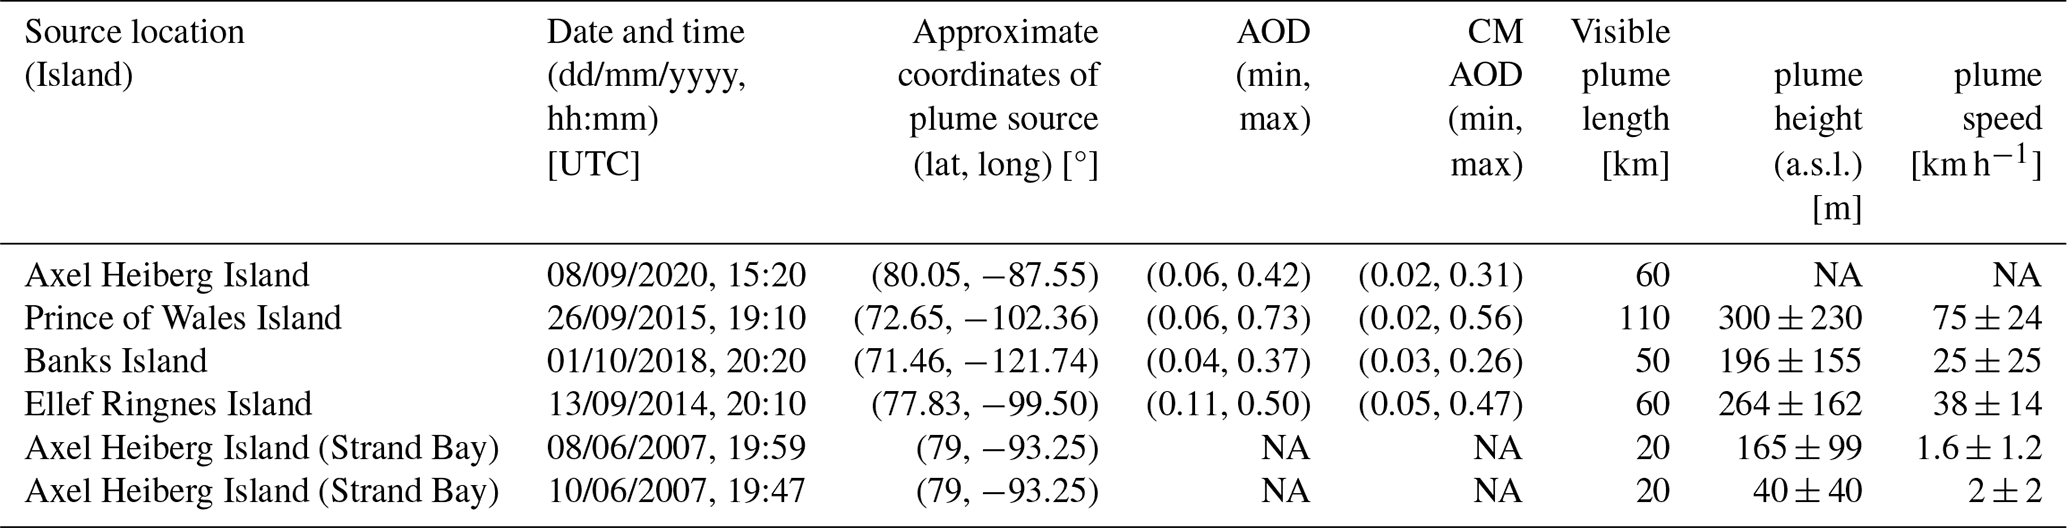
A pan-CAA analysis using the multi-dimensional information available from MODIS color imagery and its AOD products, MISR multi-camera, stereoscopic imagery, MINX (MISR) estimates of plume height and speed and high spatial resolution Sentinel-2 imagery supported by measured and/or regional ws products indicated that local dust plumes of relatively weak to strong optical thickness (CM AOD ranging from ∼ 0.02 to 0.60) at generally sub-km plume heights could be detected from available satellite products. A sampling of key parameters for all plume events is given in Table 1. In what follows we give a summary of those pan-CAA conclusions.
A 20 September 2020 plume event north of the Fosheim Peninsula showed evidence of plume dynamics that were roughly coherent with CARRA wind vector patterns and whose spatial variation (colour image pattern) was similar to the spatial pattern of the derived CM AODs. The MINX (MISR) plume height and speed of (26 September 2015) dust plumes flowing from Prince of Wales Island to Victoria Island (southern part of the CAA) were 300 ± 230 m a.s.l. and 75 ± 24 km h−1 (while MODIS CM AOD values ranged from 0.02 to 0.56). The 54 km h−1 value38 for that event is abnormally large (3 times the climatological mean for September).
Information from MISR, MODIS and Sentinel-2 color imagery was employed to identify dust plumes (partially obscured by higher altitude clouds) emanating from local dust sources on Banks Island (southwest corner of the CAA) in October of 2018. The MODIS CM AOD values, for the Banks Island satellite events varied from to 0.03 to 0.26 and visually corresponded to what appeared to be dust plumes in the MODIS color imagery (supported by the stereoscopically determined distinctions between clouds and low-level plumes provided by the MISR imagery). The Sentinel-2 color imagery provided a unique high-spatial-resolution perspective that enabled the distinction of the land to water continuity of a few local dust plumes. A moderately strong dust event emanating from Ellef Ringnes Island in September of 2014 was characterized by CM AODs between ∼ 0.05 to 0.47, mean plume heights of m and mean plume speed (normalized to the elevation of the nearby met station) of 32 ± 12 km h−1 (1.7 times the climatological mean of the nearby [Stefansson Island] met station for the month of September).
We employed MINX (MISR) color imagery and plume height retrievals to argue that June 2007 Strand Bay (Axel Heiberg Island) MISR images of a dirty snow/ice surface showed both a plume above the surface and what appeared to be plume deposition (zero altitude plume retrievals) over the surface 2 d later (with a much darker reflectance). This appears to be a rather rare example of a commonly cited phenomenon (dust plume deposition effects). The RS identification of dust deposition events on snow presents a unique opportunity for monitoring the attendant changes in snow reflectance (and premature snow melt events) across different Arctic regions.
In summary, a series of dust events involving distinct, narrow plumes, at least partly over dark water, downwind of likely dust sources and typically under contemporaneous high-wind conditions were identified. The use of the MODIS and/or MISR and/or Sentinel-2 imagery (coupled with geographical and meteorological information) for identifying and characterizing local dust plumes requires careful analysis: however, the benefits often include a synergistic characterization of plume properties that significantly exceed what can be extracted from a single sensor. The specialized advantages of each of these RS sensors should be understood before undertaking such an approach: our greatest strategic realization, for example, was that, in spite of the obvious advantages of the CALIOP lidar in characterizing dust plume properties, the MISR imager has a much greater chance of detecting a spatially constrained plume (CALIOP being limited to a single orbit line rather than broad, along-track, MISR images).
A1 Comparing CIMEL- and AHSRL-derived AODs
A1.1 CIMEL-based FM and CM attribution
Given the unique arrangement of the two CIMELs at Eureka, one near the 0PAL site (superscript “O” and one at the higher altitude PEARL (Ridge lab) site (“P” subscript), the (500 nm) FM, CM and total AODs of the layer between the two sites (assuming optical homogeneity above P between the two different lines of site) are,
and
A1.2 Temporal resampling considerations for the two CIMELs and the lidar
- 1.
represents resampled to times while we use Nl,O to describe the number of resampled points. For the sake of keeping the nomenclature as simple as possible, we dropped the “O” superscript from (i.e. there is only one lidar).
- 2.
represents resampled to times39 while using NP,O to represent the number of resampled points. NP,O ≠ Nl,O if, for example, the PEARL measurements are limited in temporal extent relative to the 0PAL temporal extent.
- 3.
Accordingly, Δτc is more precisely defined as − . We employ NO to represent the common lidar and PEARL resample points (NO = Nl,O = NP,O).
The resampling applied to estimate or was respectively nearest neighbour40 and linear interpolation41
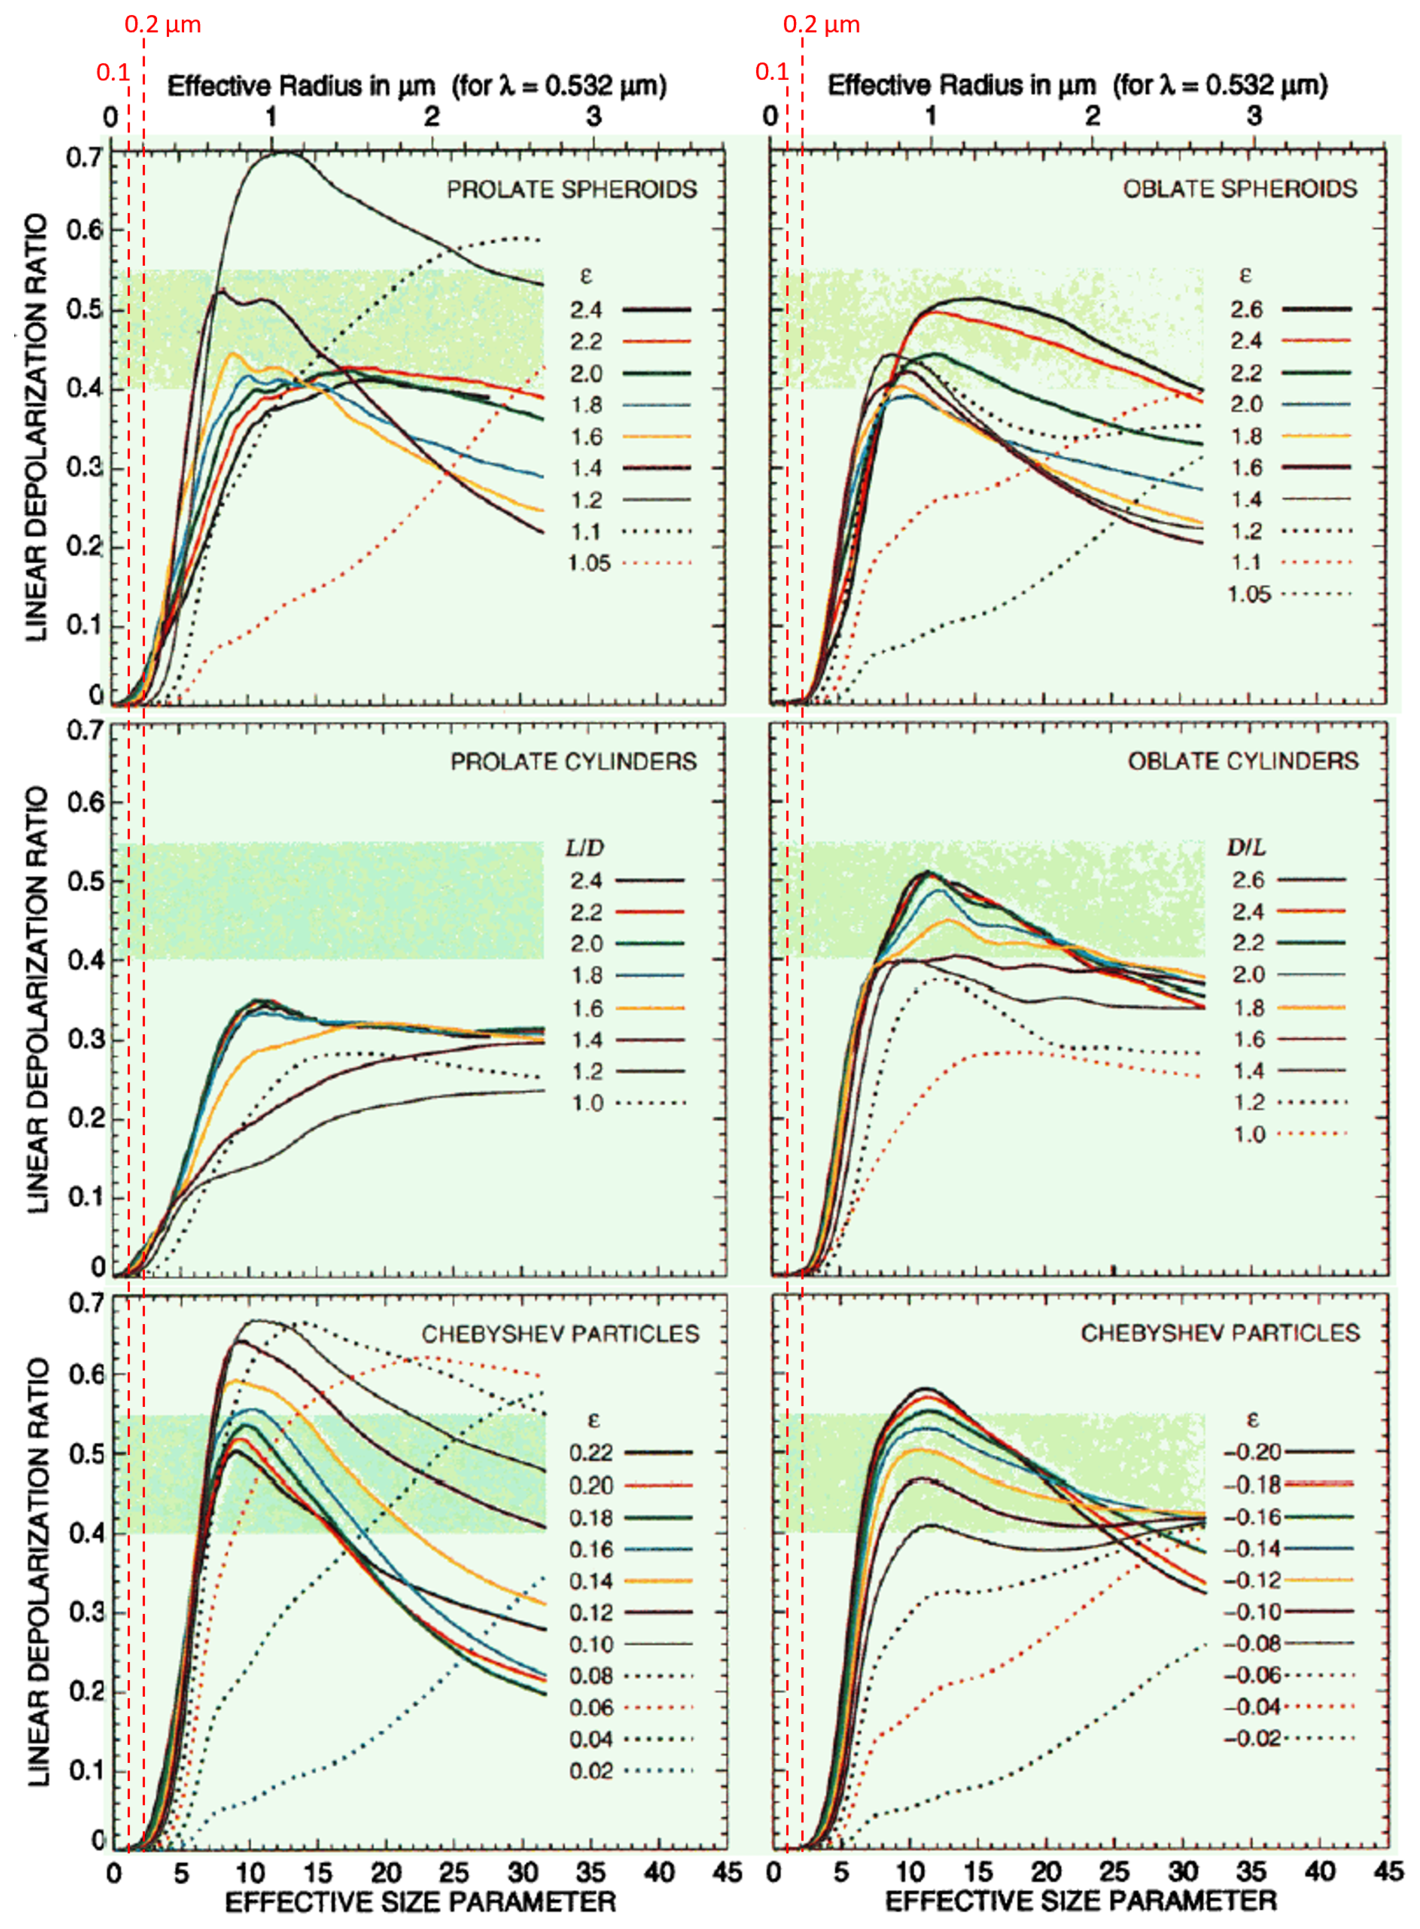
Figure A1Computed variation of the 532 nm DR as a function of effective radius (top horizontal scale) and various assumed ice particle shapes (Fig. 1 of Mishchenko and Sassen, 1998). Optically significant, column-integrated FM particles are largely contained within a radius range of 0.1 to 0.2 µm (indicated by the red-dotted vertical lines which we appended to the original figure). This demonstrates that the PDR of FM particles is a few % for all particle shapes considered by the authors.
A2 FM and CM attributions for the AHSRL lidar
If the FM and CM PDR (particle depolarization ratio42) candidates are defined by holistic FM and CM PDR distributions (whose size-averaged PDRs are δf and δc) then the optically weighted average VDR can be written as;
where FM and CM (lidar profile) pixels can be defined, respectively by δ ≤ δthr and δ > δthr if there is a δthr saddle between the PDRs.
where we define
As we will argue below, the lidar optical depths ( and in the main text43) can provide reasonable estimates of τc and τf for a strategic choice of δthr. If the FM and CM PDRs are defined in a binary fashion by a δthr threshold then those PDRs can be written,
The “〈VDR〉” symbolism represents some weighted or unweighted VDR mean in altitude (or in altitude as well as time) where the δthr criterion is applied to every single lidar pixel. Equation (A2) represents a tool for seeking out information about the PDRs of holistic depictions of FM and CM components. One must be wary of the opto-physical differences between δf and δc versus and respectively44 and their link with the measured VDR (or averages of measured VDRs). The two formulations can be investigated by varying δthr until some optimal solution is obtained for any given event. Part of the process is the recognition that δf is known (empirically and theoretically) to be small ( a few %; see Fig. A1 for example) while δc of dust particles generally increases with increasing δthr in the range where dust-particle population is significant45. We suppose that the PDR of other particulate species (clouds, for example) are easily separable from our FM and CM aerosol species.
A3 The need for vertically-averaged VDR weighting
AHSRL β and VDR profiles (along with derived values of lidar, 0PAL and PEARL CM AODs) for the 7 Eureka dust events that we investigated can be observed in the supplementary PowerPoint file “AHSRL_CIMEL_event_profiles”. The VDR values ranged from small-amplitude negative to positive values to large-amplitude negative and positive outliers (see Sect. A3.1 for a detailed discussion of how we processed that data). Dörnbrack et al. (2010) reported on airborne lidar observations and characterization of local dust events over Svalbard in May of 2004. Their results included dust plumes whose VDRs ranged from quite small ( %) to values larger than 10 % inside the plumes to maximum values of % very close to the surface. In the context of the discussion presented in Sect. A2, VDRs of local dust profiles can achieve (extreme FM to CM) values ∼ 15 %–40 %46. MA report that their holistic FM component47 produces PDRs (∼ 5 %48) while also demonstrating that their sub-µm FM dust tail49 can induce a significant VDR increase relative to the holistic FM component50 and that super-µm particles can induce even larger VDRs. See Fig. 3a and b above for empirical examples showing a super-µm CM peak radius at our 0PAL site (after the advent of the stronger dust event at 20:30 UTC).
A3.1 VDR weighting options
VDR profile averages (〈VDR〉) between 82 and 615 m51 were found, in the initial processing run, to be systematically too large52. This was suspected to be due to the initial choice of not including negative VDR pixels in any given VDR profile average53. Indeed, Fig. A2 shows that the simple removal of negative VDR pixels (blue-colored circles) produced 〈VDR〉 estimates that were systematically greater than the two more statistically justifiable methods54. Two alternate methods were investigated to mitigate the impacts of removing negative VDRs :
-
The 1st method (green circles) employs no weighting but does not exclude negative VDRs.
-
The 2nd method includes a weighted mean of all VDRs in any given profile ( where ω = 1/RE2 for each profile pixel55. This takes all VDRs into consideration (does not suffer from the negative-VDR limitations) and seems to produce more realistic 〈VDR〉 values than the 1st method (values whose 〈VDR〉 range extends less into (both) the negative region and the positive region). Averaging in time (averaging over the event using an optical weighting factor of τβ) would then be written as;
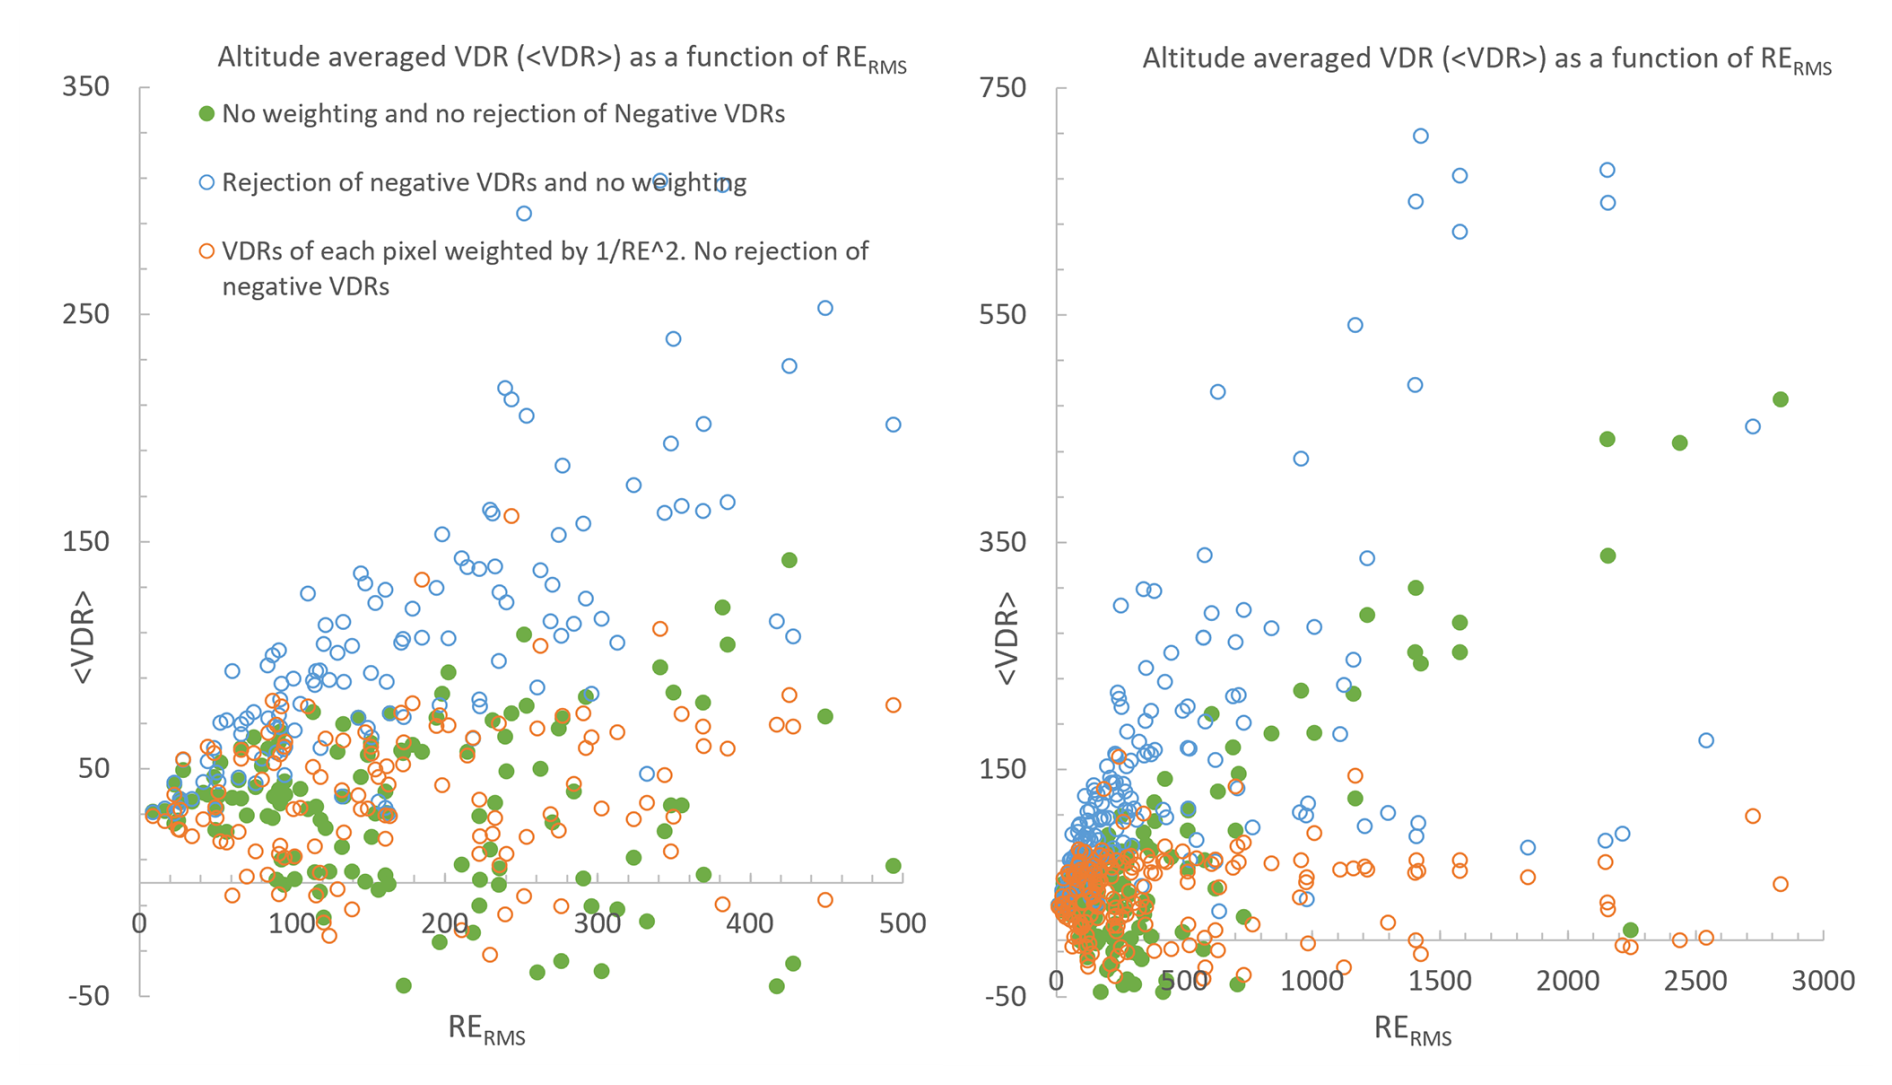
Figure A2Altitude-averaged VDRs vs RMS residual errors (RERMS) for the 23 July 2007 dust event (the LH graph is a zoom of the RH graph). According to our notation, the orange-colored weighted averages should be labelled 〈VDR〉ω. These statistics were computed for the lidar altitude range from 82 to 615 m.
A3.2 VDR weighting: profile-level impacts and resulting event-averaged statistics
The impact of the ω weighting discussed in the previous sections is seen in Figs. S1b to S7b56. In a nutshell the weighting significantly reduced the intra-profile standard deviations for all events (the bottom graphics of Figs. S1b to S7b). We would also argue that the event-wide average of the intra-profile standard deviation is the best candidate to describe the event-wide precision (noise) of our VDR estimates (see the Fig. S8 caption for details). On the other hand, the weighting introduced a significant amount of VDR variance in 2 events where very little variance existed prior to the weighting process (Events 1 and 6 of Figs. S1b and S6b)57. The Event 1 and 6 standard deviations of intra-profile, event-level statistics that are summarized in the table of Fig. S8 are accordingly to be treated with caution. Indeed, the table shows explicitly that weighting did dramatically reduce the intra-profile standard deviations of all events excluding Events 1 and 6. We accordingly use the intra-profile statistics in the following section on the derivation of the PDRs for each event.
A3.3 Estimation of the event-averaged CM PDR
Figure A4 shows the event-averaged VDR and τβ values for both the FM and CM components as a function of δthr (Eq. A3 above58). The CM event averages are rather insensitive to small values of δthr (arguably because the weak PDR of the FM component and perhaps the weak DR of the sub-µm tail of the holistic CM PDR have little impact at small values of δthr). They only begin to rise when, we would argue, the sub-µm tail begins to play a more significant optical role (the larger DR of the sub-µm tail incites the beginning of a positive slope that starts to rise at δthr values ranging from 5 % to 15 %. A stable estimate of the dust PDR would occur at any value before the rises begin, say at δthr ∼ 5 %
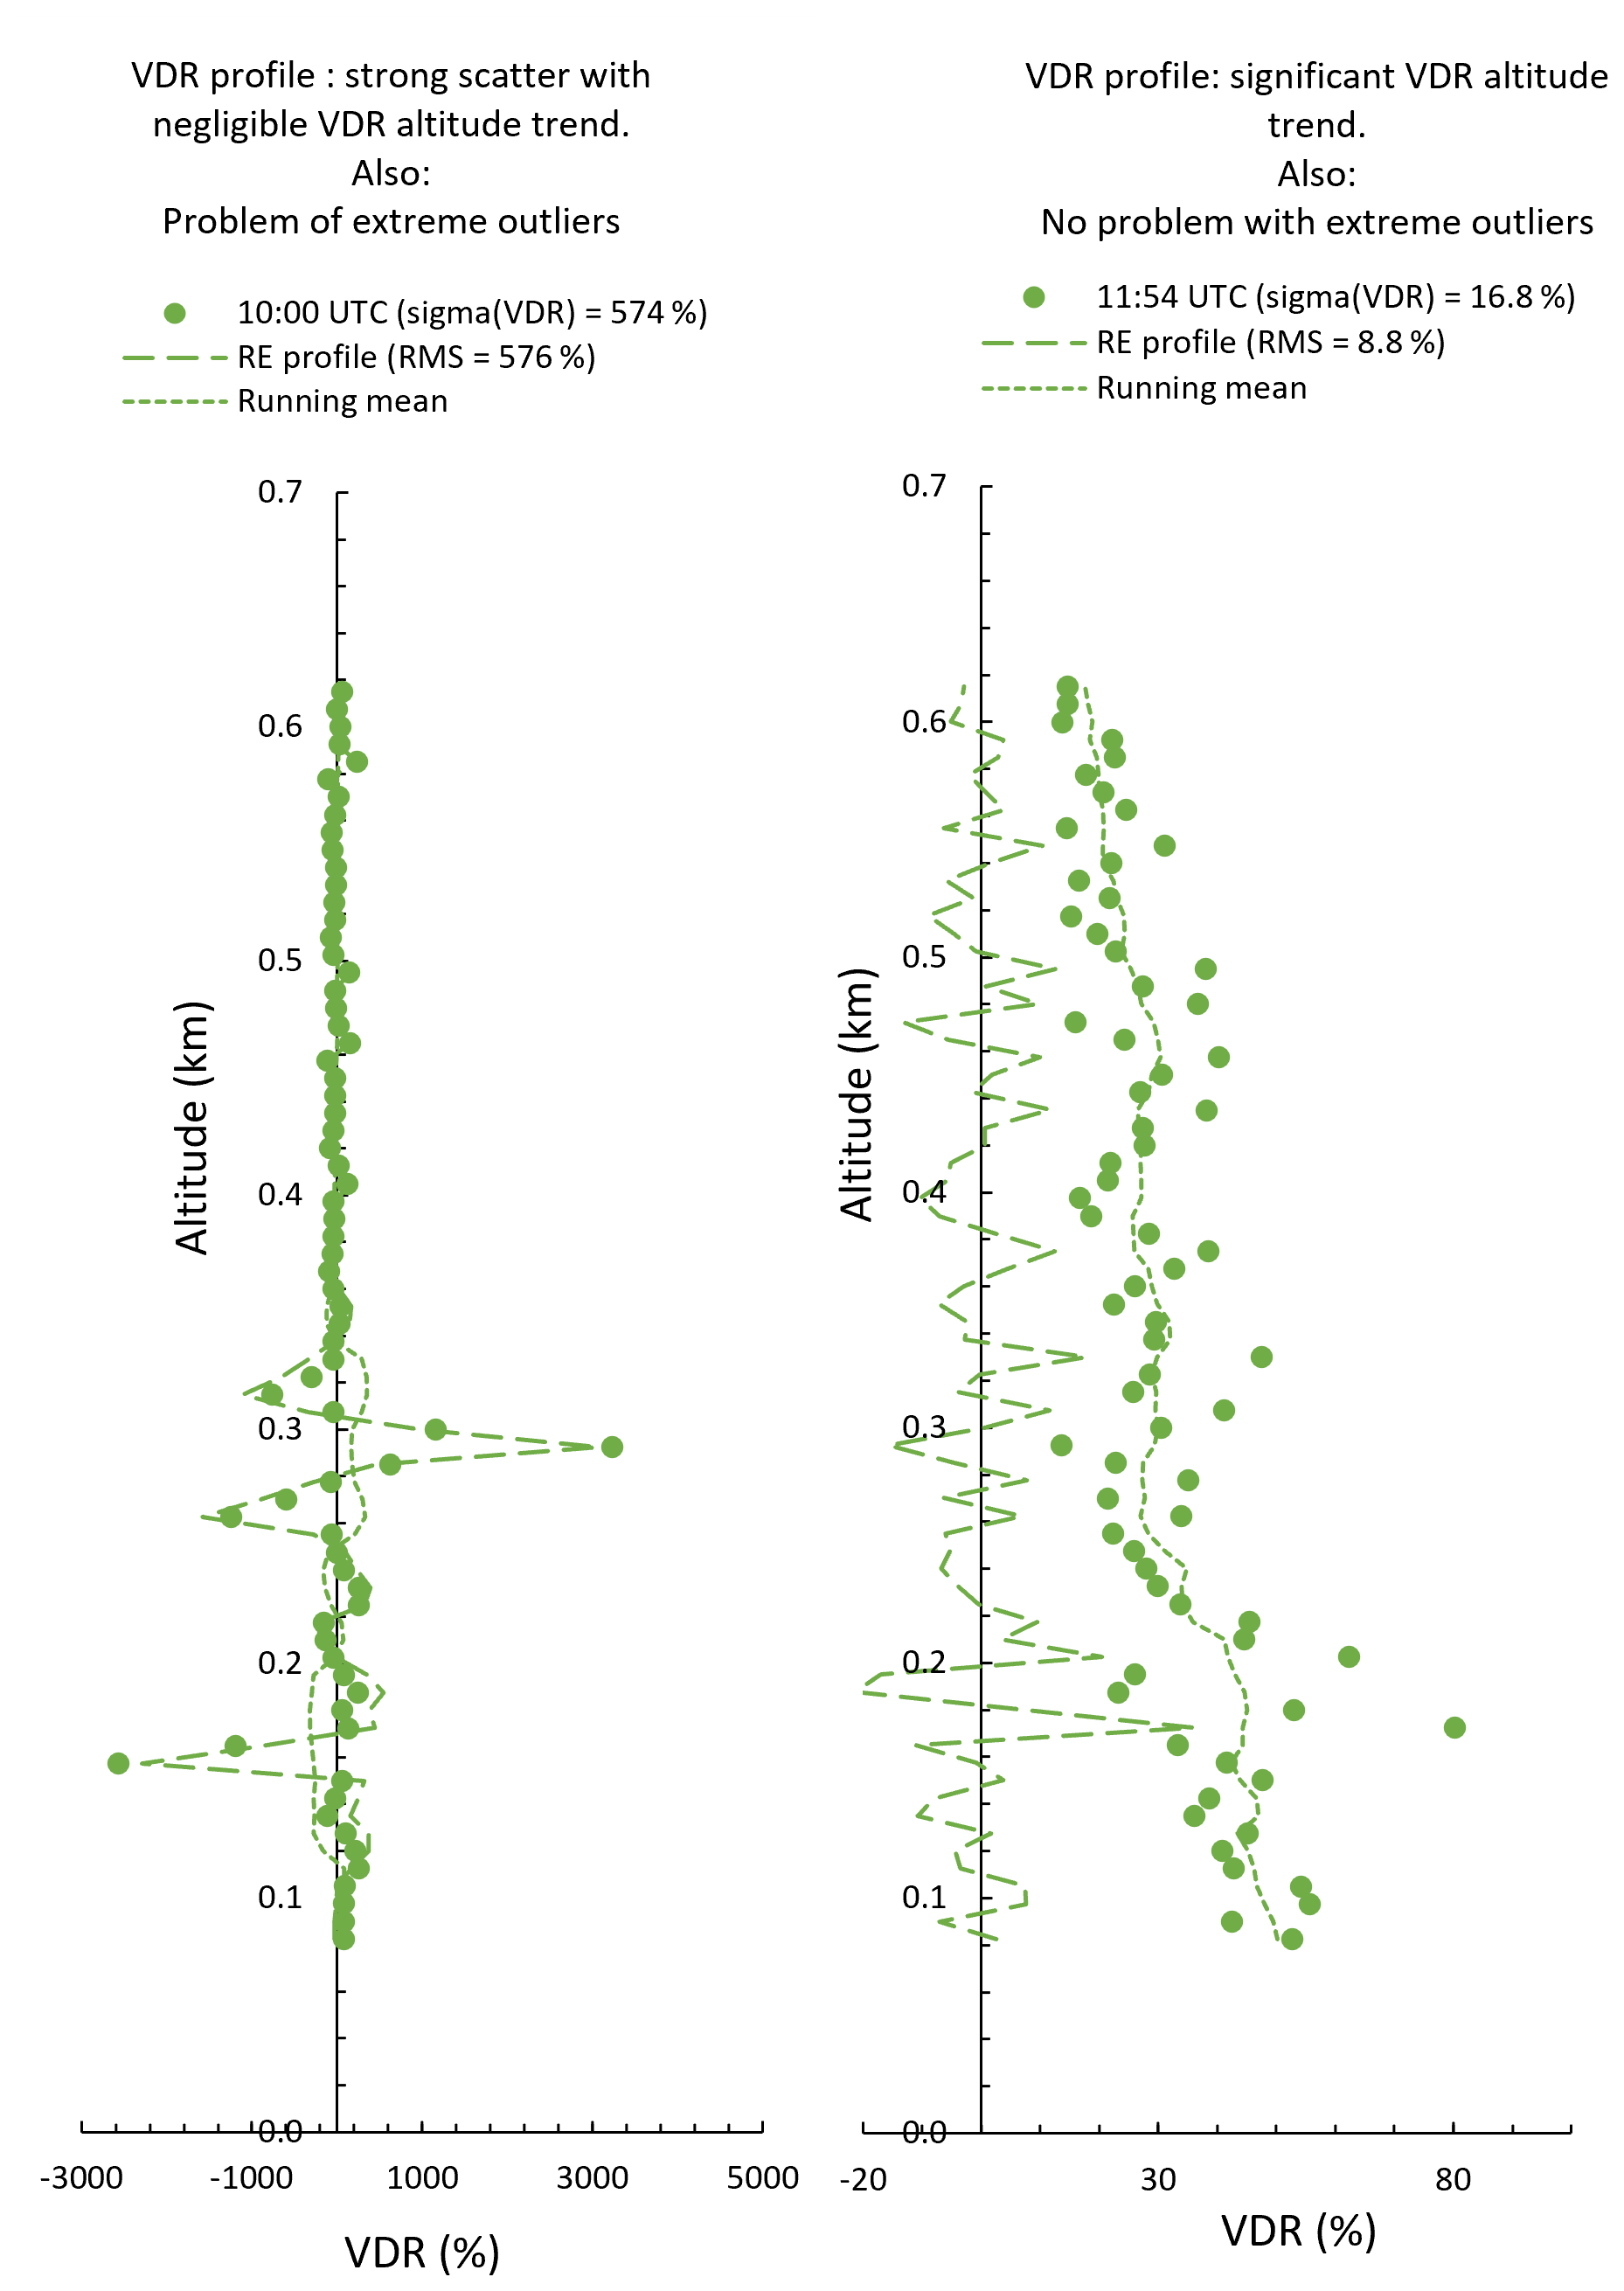
Figure A3Two representative lidar profiles (solid-shaded circles), their running mean (dotted curve) and their residual error (RE) difference (dashed curve).
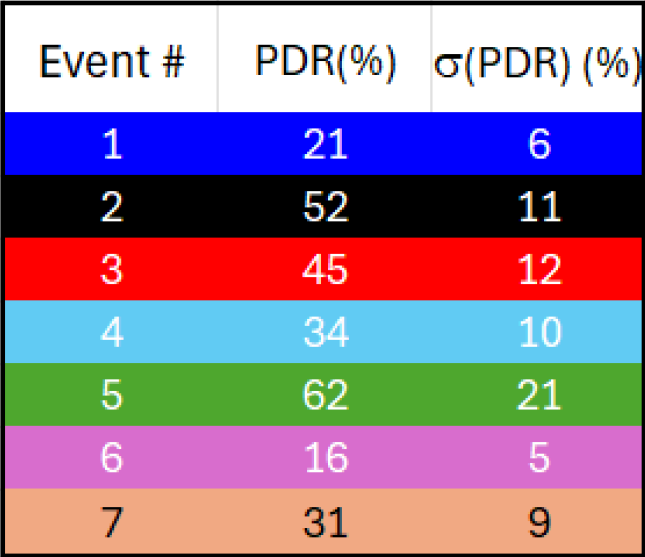
That 5 % value was chosen to populate the event-dependent 532 nm PDR values of Table A1. Two of the Table A1 values are beyond the (780 nm) VDR upper limit for CM dust found, for example, in Fig. 1 of Tian et al. (2020, their upper limit was ∼ 50 % for dust particles ranging in radius from ∼ 1 to 5 µm59). On the other hand, all the Table A1 PDR values are largely contained within the 532 nm lidar ratio spread of “giant” near-source Saharan dust particles reported by Esselborn et al. (2009): their Fig. 9 lidar ratios vary between 40 and 60 sr for dust particles of volume median radii ranging from 4 to 15 µm (a spread that encompasses the 7 µm radius AERONET inversion dust peak that we report above in Fig. 3a). It should be emphasized that choices such as the (“ω”) weighting scheme and the optimal δthr value contain a level of subjective variability (in terms of, for example, the strengths of the weights applied). These factors and other sources of variability produce uncertainties that we estimate as being ∼ ± the “σ(PDR)” values of Table A1.
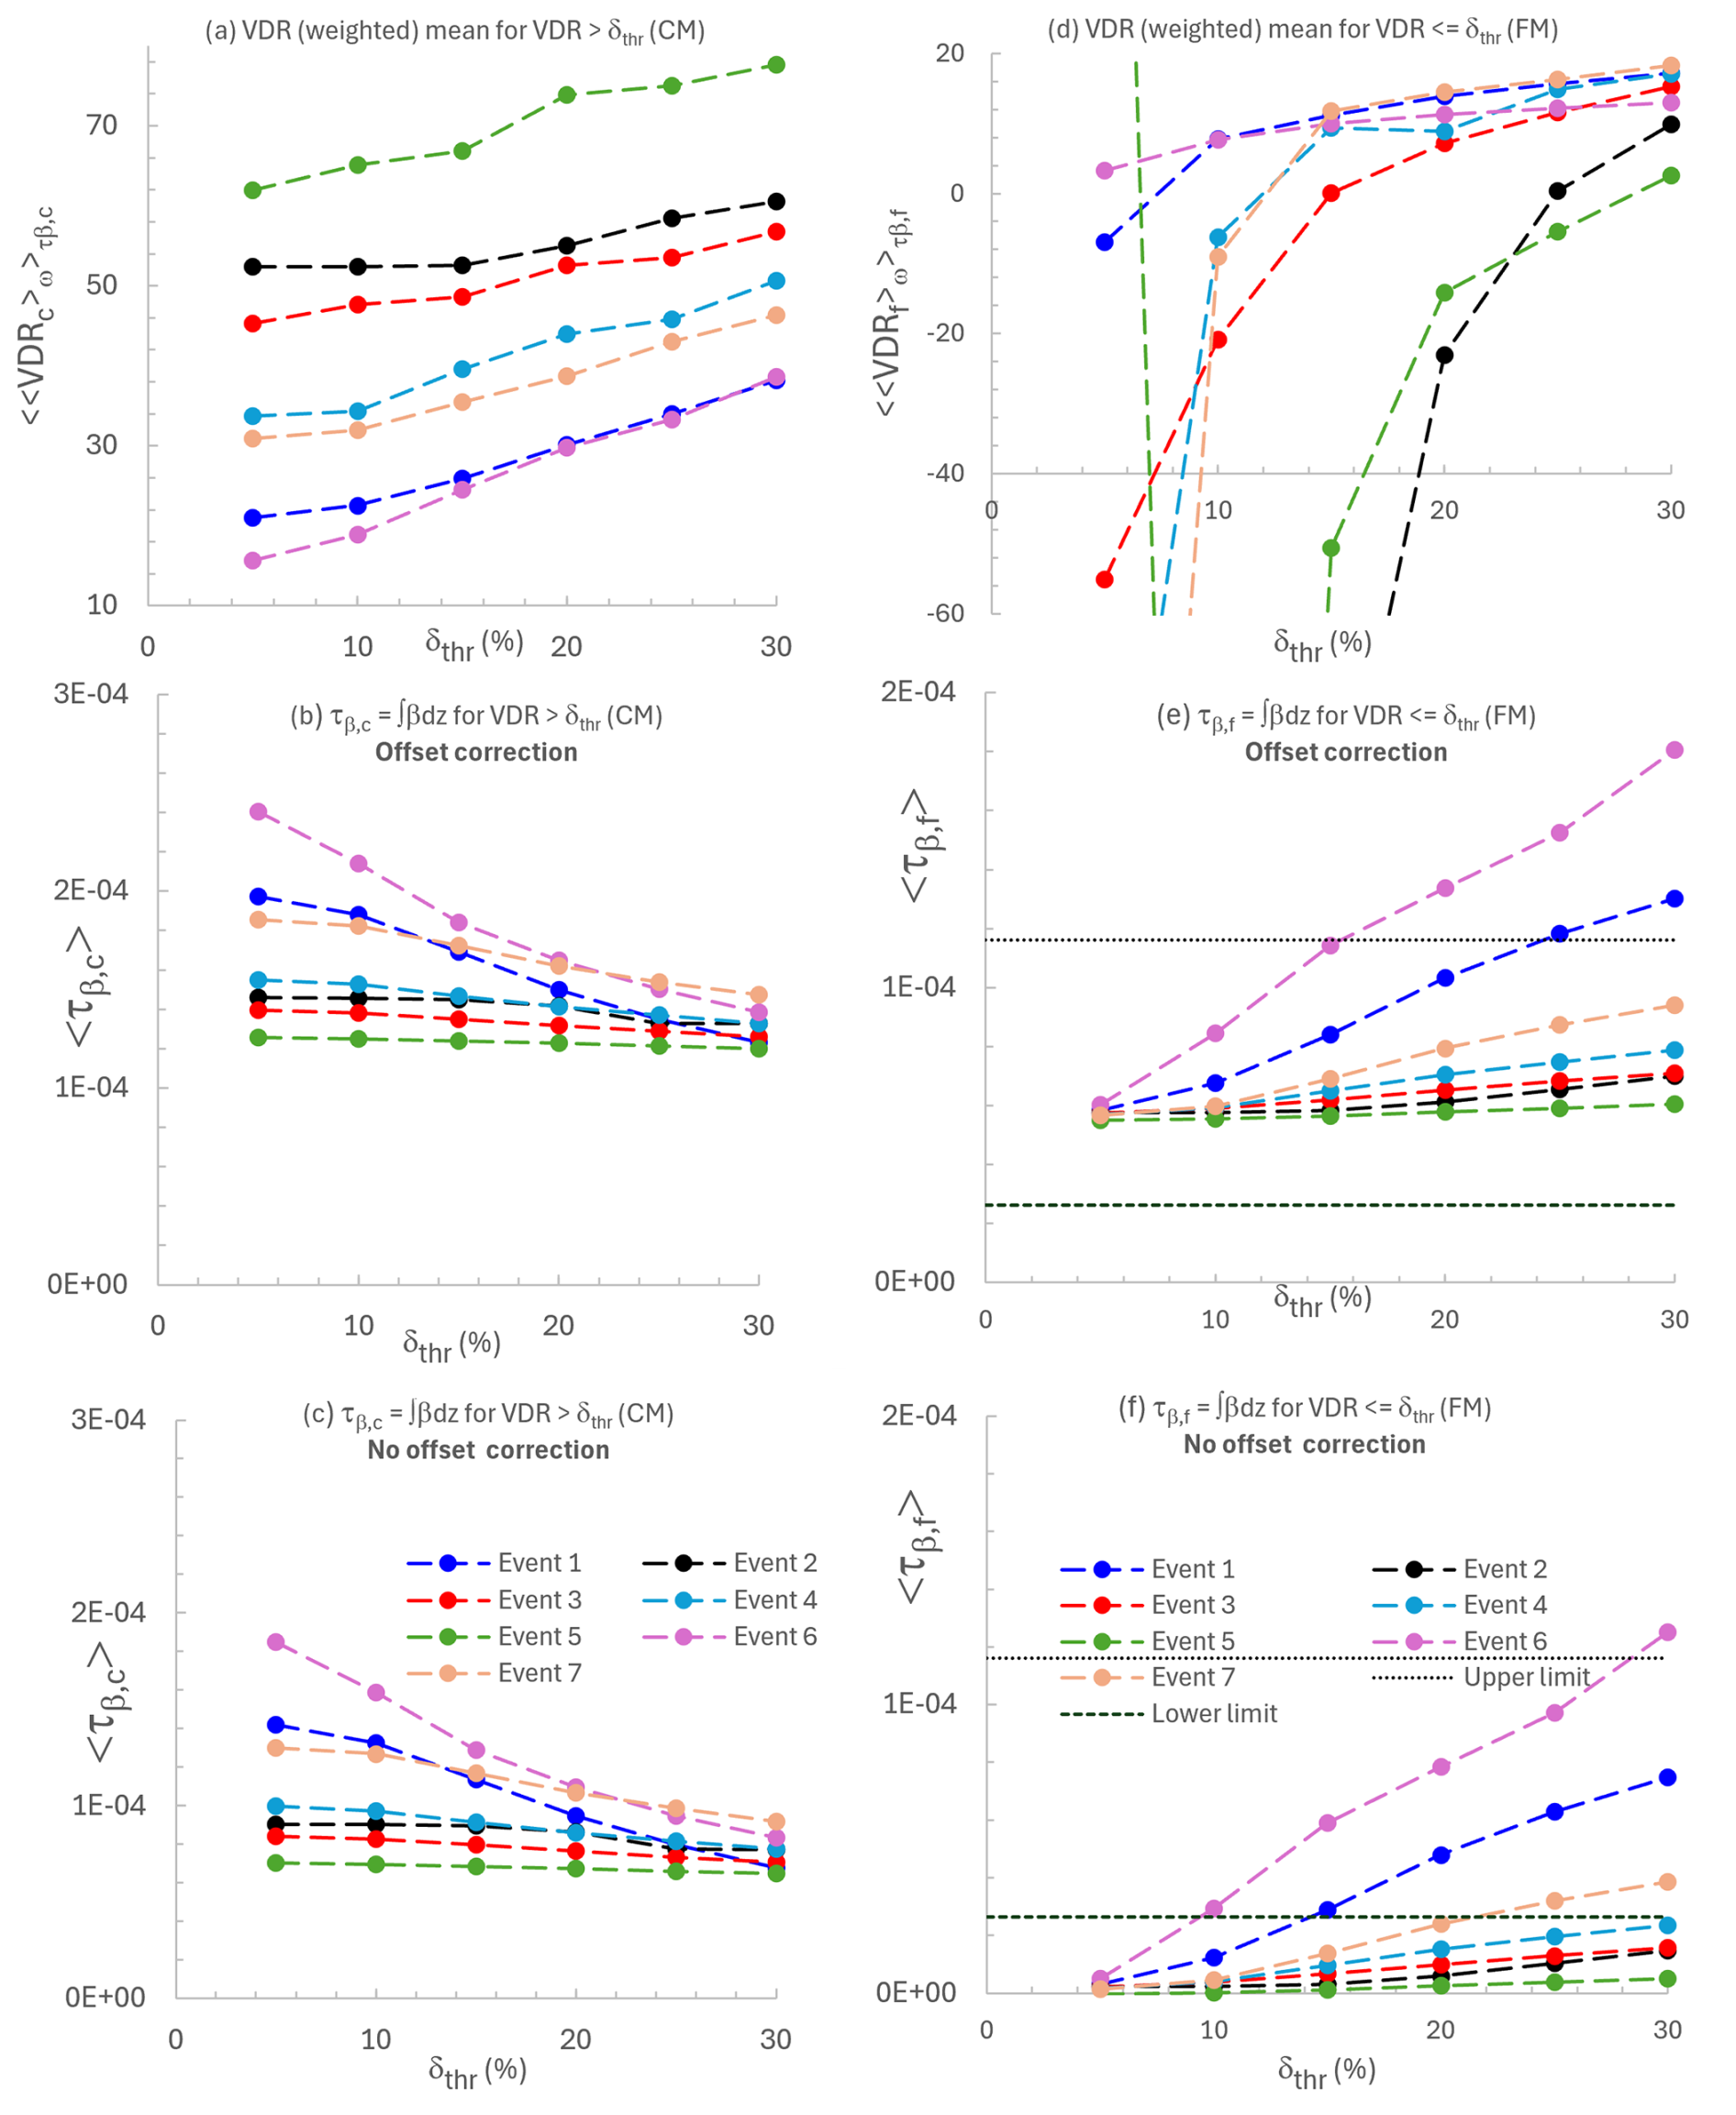
Figure A4VDR averaged results as a function of δthr for our 7 dust events. LH graphs (CM; the CM component of the “binary” model defined in Sect. A2 above; for VDR values > δthr): (a) Altitude- and event-averaged VDRc values, (b) τβ,c values with offset correction and (c) τβ,c with no offset correction. RH graphs (d, e, f): the same array of graphs as the left-hand side but for the FM (VDR values ≤ δthr). The “offset correction” was a constant offset added on to βc and βf values to eliminate weakly negative β values (due, we presume, to a small calibration inconsistancy). The “Lower limit” and “Upper limit” are roughly-estimated expected bounds (the extremes of 0PAL values of computed for each event using a Eureka (experience-based) estimate of the optically active FM lidar backscatter region (∼ 5 to 11 km) and the 0.615 km value of L (the atmospheric layer between 0PAL and PEARL)) on (the FM backscatter optical depth across L). These statistics were computed for the lidar altitude range from 7.5 to 615 m (a more extensive range than that which was reported in the legend of Fig. A2; tests showed that the averaged VDR values were very similar in the face of such small changes in the profile range).
The FM VDR averages are significantly more sensitive to δthr changes at smaller values of that parameter. This is due to a combination of relatively small numbers of VDR pixels being available at small δthr values and the fact that there seemed to be a small negative bias in the β values. The τβ weighting across each event then produces wildly oscillating VDR averages at δthr values of 5 % and 10 % (Event 2, 3, 4, 5 and 7 cases of Fig. A4d) that were enhanced by the very small τβ weights in the denominator of the weighting expression. The small negative bias was the cause of unrealistically small τβ,f values for the δthr = 5 % case in Fig. A4f. Adding a small β offset to all the β values produced the more realistic “Offset correction” values of Fig. A4f (values that fit into a range of expected τβ,f values between the horizontal dotted lines; see the caption of Fig. A4 for further details).
Table A1Dust PDRs for our 7 dust events (δthr = 5 %). The event colors are consistent with Fig. A4. The precision estimates are event-averaged, intra profile standard deviations discussed in Sect. A3.2
A4 Does it help to perform a (ω) weighted CM and FM classification?
If the VDR is so noisy that it requires weighting in the production of altitude-averaged VDRs then the question arises as to the variability of the VDR-dependent classification of CM and FM aerosols. An approach, which is arguably coherent with our VDR (residual error) weighting scheme, is to associate the VDR weights (which could be thought of as a “number of virtual pixels” that increase the importance attributed to a given lidar pixel). Our unweighted FM/CM backscatter AOD separation is, for the Jth lidar-profile at time ti,J;
This equation explicitly indicates that the βi,J summations are mutually exclusive and carried out over all altitude bins of a given lidar profile. A weighted version of the FM and CM backscatter ODs for lidar profile J60, is61,
We then force to equal τβ (this simply means that KJ is set to . Dividing both sides by τβ yields a familiar-looking CMF, FMF (CM fraction, FM fraction) type of relation:
(Note that CMFω can be > 1 if (negative β values from the real data and attendant underestimates of τβ can wreak havoc with the “conservation of unity” equation).)
A heuristic expression (showing explicitly that 0 ≤ CMFω≤1) is; CMF. The explicit link with the unweighted stats is to employ τβ when calculating and from CMFω.
The forcing guarantees that the lidar-profile-integrated differences of and of each profile cancel each other out .
The results shown in Fig. A5 indicate that the “ω” weighting can effectively incite what we attribute to artificial Δτβc and Δτβf spikes62 (the lidar profiles show no corresponding anomalies), These spikes aside, the CM vs FM classification using a weighting approach generally showed no significant vs. τβc changes. Accordingly, any attempt to improve the quality of τβc by VDR-noise-based weighting results in either very little change or is the victim of significant outliers generated by the VDR weighting. Unlike the VDR weighting approach improvements (indicated by Fig. A2) there appears to be no significant advantage in a VDR-based filtering of the CM/FM classification.
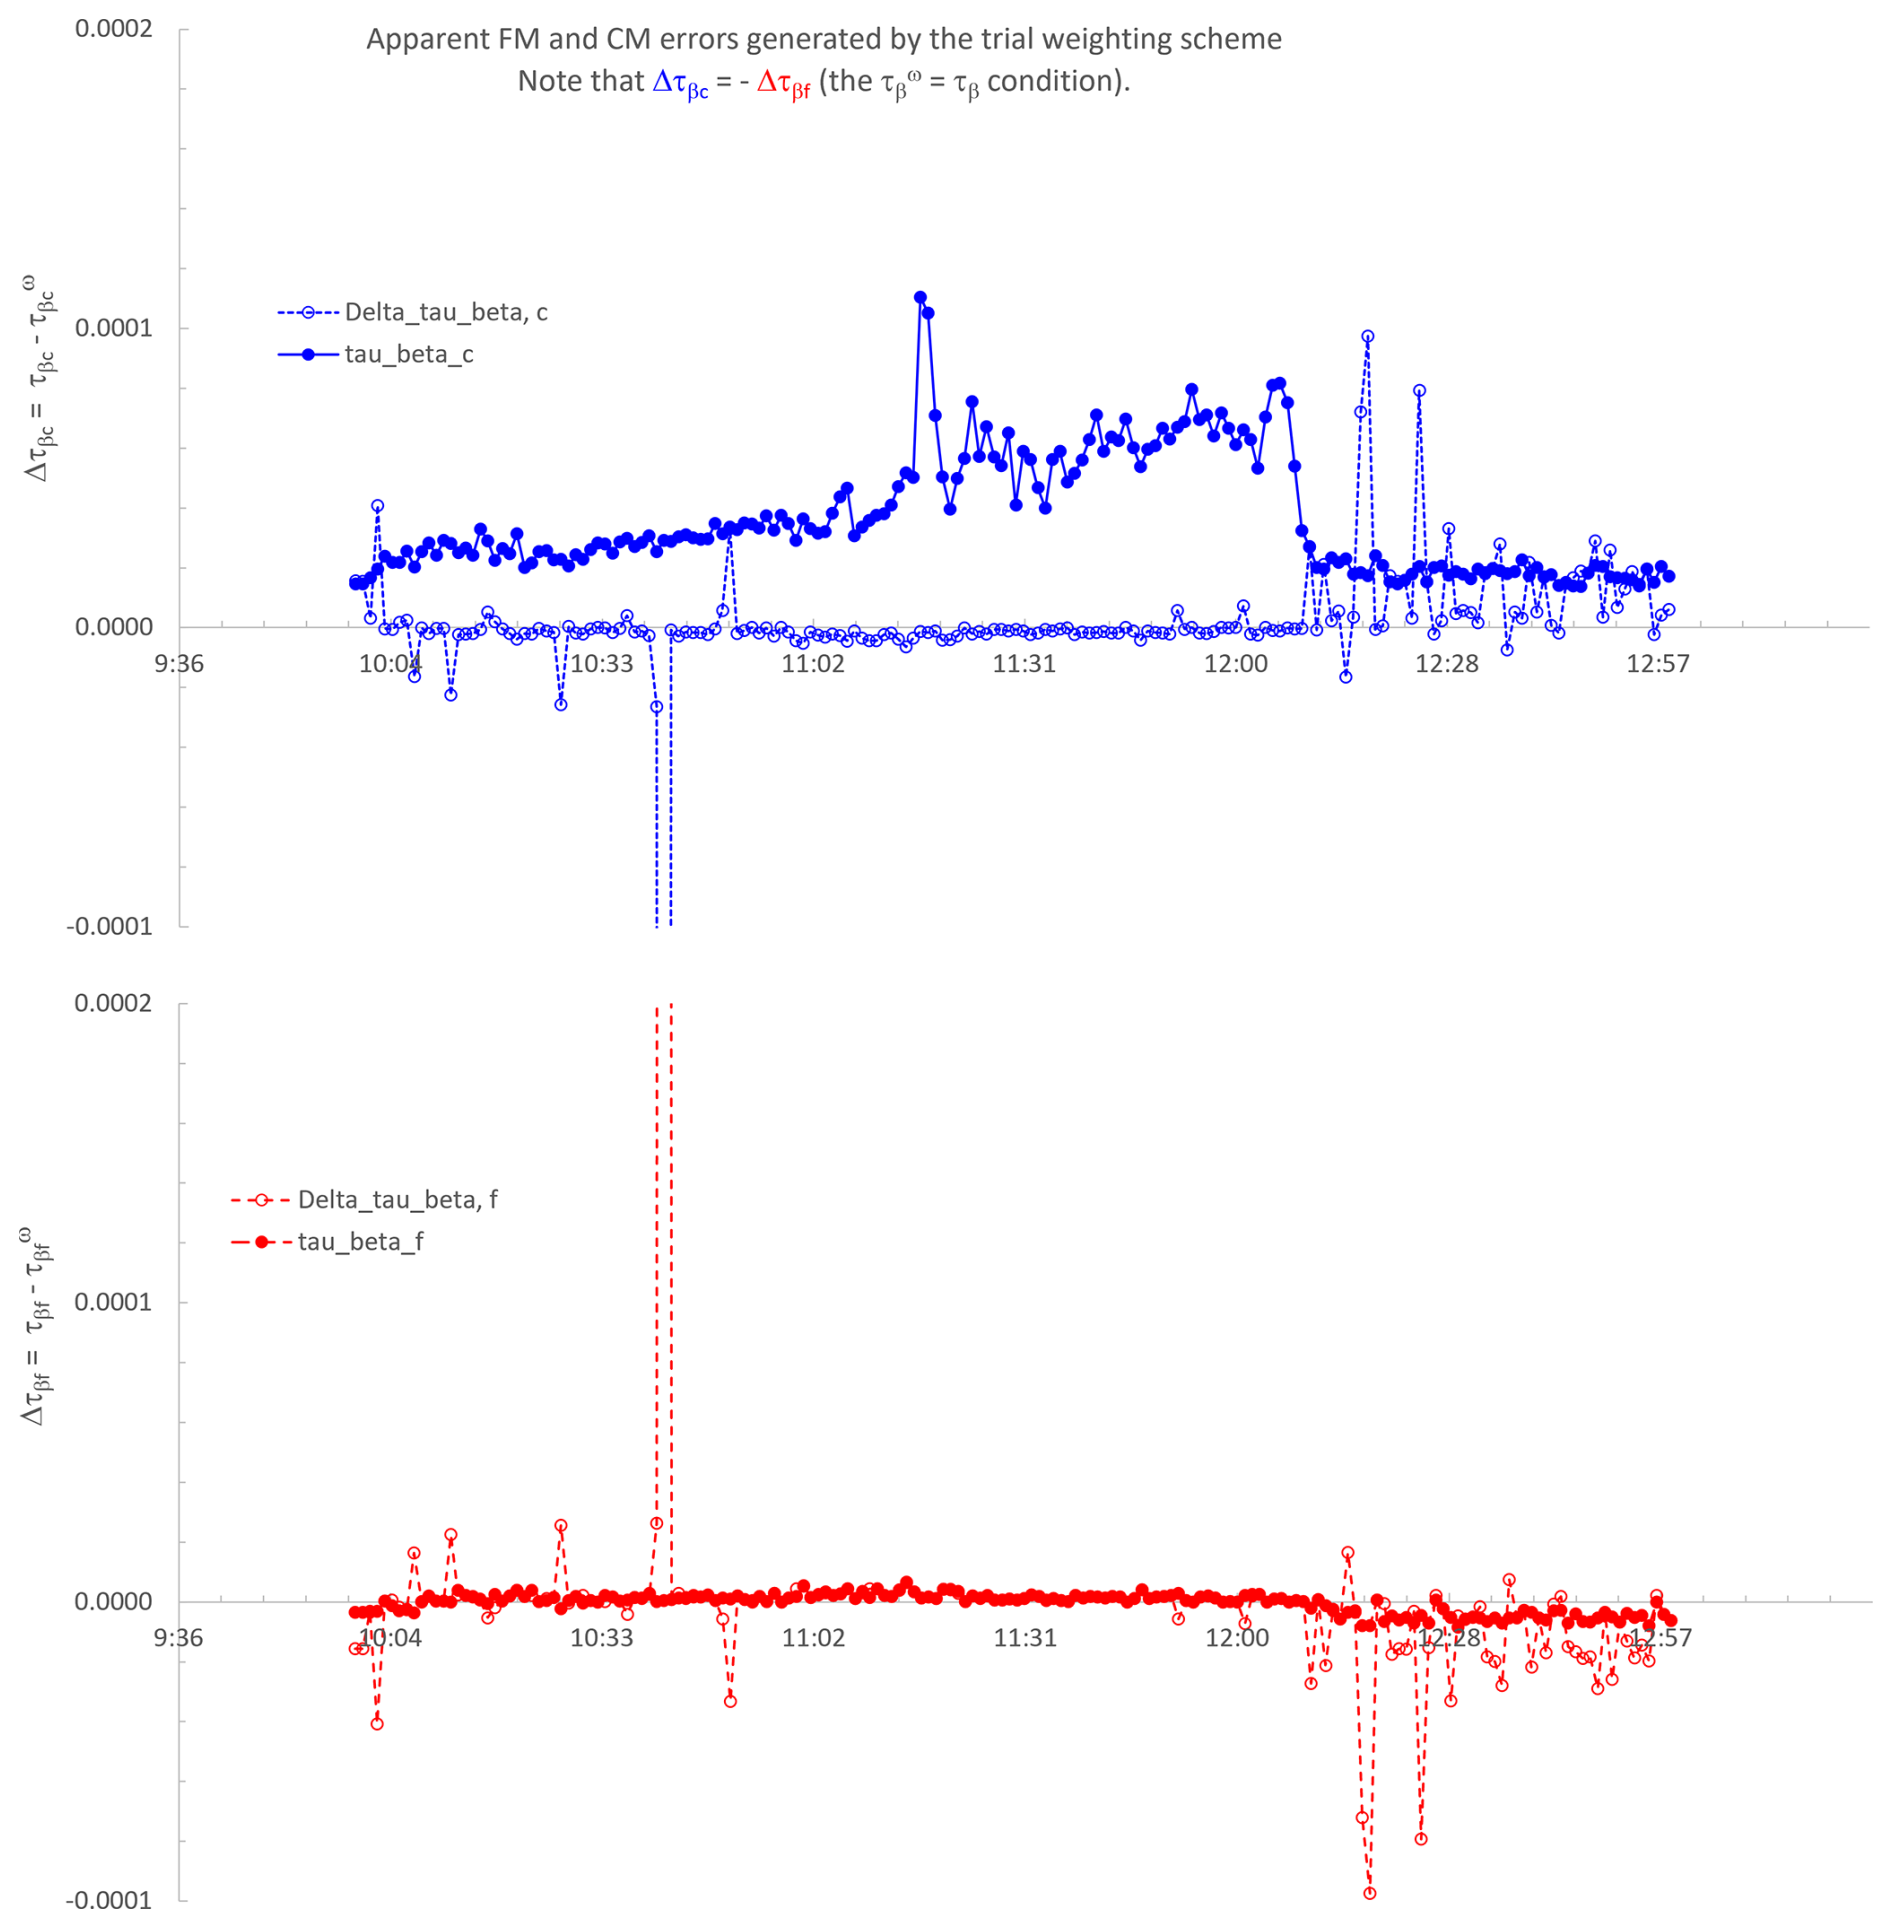
Figure A5Δτβc = vs. time (top) and Δτβf = vs. time (bottom). Example of the 23 July 2007 event.
| AERONET | AErosol RObotic NETwork |
| AEROCAN | Canadian sub-network of AERONET |
| AHSRL | Arctic High Spectral Resolution Lidar |
| AOD | Aerosol Optical Depth |
| APS | Aerodynamic Particle Sizer |
| a.s.l. | Above Sea Level |
| CAA | Canadian Arctic Archipelago |
| CARRA | Copernicus Arctic Regional ReAnalysis |
| CALIOP | Cloud-Aerosol Lidar with Orthogonal Polarization |
| CANDAC | Canadian Network for the Detection of Atmospheric Change |
| CM | Coarse Mode |
| CMF | Coarse Mode Fraction (1-FMF) |
| CW | ClockWise |
| CCW | CounterClockWise |
| DB | Deep Blue (MODIS AOD retrieval algorithmover bright surfaces) |
| DT | Dark Target (MODIS AOD retrieval algorithm over dark targets (water and vegetated land) |
| DOD | Dust Optical Depth |
| DR | Depolarisation Ratio |
| ECCC | Environment and Climate Change Canada |
| FM | Fine Mode |
| FMF | Fine Mode Fraction (MODIS product) |
| HLD | High Latitude Dust |
| INP | Ice Nucleating Particle |
| IR | InfraRed |
| KLRS | Kluane Lake Research Station |
| MISR | Multi-angle Imaging SpectroRadiometer |
| MINX | MISR INteractive eXplorer |
| MODIS | Moderate Resolution Imaging Spectroradiometer |
| NA | Not Available |
| NASA | National Aeronautics and Space Administration |
| OD | Optical Depth |
| 0PAL | Zero Altitude PEARL Auxiliary Laboratory |
| OPS | Optical Particle Sizer |
| PEARL | Polar Environment Atmospheric Research Laboratory |
| PDR | Particle Depolarization Ratio |
| PMSD | Particle-Mass Size Distribution |
| PVSD | Particle-Volume Size Distribution |
| R | Correlation Coefficient |
| RE | Residual Error |
| RMS | Root Mean Square |
| RS | Remote Sensing |
| sr | Steradian |
| SD | Standard Deviation |
| SWIR | Short-Wave InfraRed |
| UTC | Coordinated Universal Time |
| UV | UltraViolet |
| VDR | Volume Depolarization Ratio |
| WMO | World Meteorological Organization |
| β | Backscatter Coefficient |
| βc | CM Backscatter Coefficient |
| τβ | Particulate Backscatter Optical Depth |
| τβ,c | CM τβ |
| τβ,f | FM τβ |
| Lidar CM AOD | |
| Lidar FM AOD | |
| 0PAL CM AOD | |
| 0PAL cloud-screened (L 1.5) CM AOD | |
| PEARL CM AOD | |
| PEARL cloud-screened (L 1.5) CM AOD | |
| Sc | CM Lidar Ratio |
| Sf | FM Lidar Ratio |
| vc | Particle-Volume Concentration |
| δc | CM PDR |
| δf | FM PDR |
| δthr | VDR threshold |
| Δτc | 0PAL minus PEARL CM AOD difference () |
| ws | Wind Speed (km h−1) |
MATLAB codes employed for computations reported in this manuscript can be obtained from Seyed Ali Sayedain (seyed.ali.sayedain@usherbrooke.ca).
AERONET data are available for download at https://doi.org/10.17616/R3VK9T (Lind and Gupta, 2023). The PEARL AHSRL data are accessible from the University of Wisconsin HSRL data archives at https://hsrl.ssec.wisc.edu/by_site/2/bscat/2007/07/ (last access: 2 December 2025). APS data can be obtained from Seyed Ali Sayedain (seyed.ali.sayedain@usherbrooke.ca). ECCC hourly climate data for different stations can be downloaded at https://climate-change.canada.ca/climate-data/#/hourly-climate-data (last access: 2 December 2025). MODIS Terra and Aqua images and products along with MISR datasets can be downloaded from the Earth Science Data Systems (ESDS) at https://search.earthdata.nasa.gov/search (last access: 2 December 2025). Sentinel-2 data can be downloaded from Copernicus Browser (https://browser.dataspace.copernicus.eu/, last access: 2 December 2025). CARRA data at different levels (single, pressure, height and model) can be downloaded from the Copernicus Climate Data Store (CDS) at https://cds.climate.copernicus.eu/datasets (last access: 2 December 2025). Underlying supplementary data related to this article can be accessed at https://doi.org/10.5281/zenodo.20561203 (Sayedain and O'Neill, 2026).
SAS: writing – original draft preparation – review and editing, visualization, investigation, conceptualization, methodology, formal analysis, data curation, validation, software, resources. NTO: writing – review and editing, supervision, visualization, conceptualization, methodology, formal analysis, data curation, validation, funding acquisition, resources. KR: review and editing, data curation, resources. PGB: review and editing, data curation, validation. RC: review and editing, data curation, validation, funding acquisition, resources. PLH: review and editing, data curation, validation, funding acquisition, resources. JK: review and editing, data curation, validation, funding acquisition.
The contact author has declared that none of the authors has any competing interests.
Publisher's note: Copernicus Publications remains neutral with regard to jurisdictional claims made in the text, published maps, institutional affiliations, or any other geographical representation in this paper. The authors bear the ultimate responsibility for providing appropriate place names. Views expressed in the text are those of the authors and do not necessarily reflect the views of the publisher.
Valuable in-kind support was provided by the AEROCAN network of Environment and Climate Change Canada (ECCC), the NASA AERONET network, the Canada Research Chairs Program (CRC), and the Canadian Network for the Detection of Atmospheric Change (PAHA/CANDAC) team. We also acknowledge the use of imagery from the NASA Worldview application (https://worldview.earthdata.nasa.gov, last access: 2 December 2025), part of the NASA Earth Science Data and Information System (ESDIS). We also acknowledge the use of Sentinel-2 data from the Copernicus Programme and MISR data provided by NASA. We thank ESA and NASA for making these remote-sensing datasets freely accessible.
Financial support was provided by the Discovery Grant (DG) program of the Natural Sciences and Engineering Research Council of Canada (grant nos. RGPIN-2023-04943, RGPIN-2022-03785, RGPIN-2022-04963), the Canada Research Chairs Program (CRC-2020-00285) and the SACIA-2 (Signatures of Aerosol-Cloud Interaction over the Arctic) project funded by the Canadian Space Agency's ESS-DA (Earth System Science – Data Analysis) program (grant no. 21SUASACOA). SACIA-2 is a collaborative project with Dalhousie University and the Université de Montréal.
This paper was edited by Sebastian Schmidt and reviewed by two anonymous referees.
AboEl-Fetouh, Y., O'Neill, N. T., Ranjbar, K., Hesaraki, S., Abboud, I., and Sobolewski, P. S.: Climatological-Scale Analysis of Intensive and Semi-intensive Aerosol Parameters Derived From AERONET Retrievals Over the Arctic, J. Geophys. Res.-Atmos., 125, https://doi.org/10.1029/2019jd031569, 2020.
Arnalds, O.: Dust sources and deposition of aeolian materials in Iceland, Iceland. Agr. Sci., 23, 3–21, https://www.moldin.net/uploads/3/9/3/3/39332633/olafur_arnalds_2010_ias.pdf (last access: 22 November 2025), 2010.
Adams, P. and Dunbar, M.: Arctic Archipelago, in: The Canadian Encyclopedia, https://www.thecanadianencyclopedia.ca/en/article/arctic-archipelago (last access: 22 November 2025), 2015.
Bachelder, J., Cadieux, M., Liu-Kang, C., Lambert, P., Filoche, A., Galhardi, J. A., Hadioui, M., Chaput, A., Bastien-Thibault, M. P., Wilkinson, K. J., King, J., and Hayes, P. L.: Chemical and microphysical properties of wind-blown dust near an actively retreating glacier in Yukon, Canada, Aerosol Sci. Tech., 54, 2–20. https://doi.org/10.1080/02786826.2019.1676394, 2020.
Baddock, M., Hall, A., Rideout, J., Bryant, R., Bullard, J., and Gassó, S.: Satellite observations of Arctic blowing dust events > 82° N, Weather, 80, 61–66, https://doi.org/10.1002/wea.7617, 2024.
Barford, N. C., Experimental measurements: precision, error and truth, Addison-Wesley Publishing Company, Inc., Don Mills, Ontario, ISBN 10: 0201003953, ISBN 13: 9780201003956, 1967.
Barr, S. L., Wyld, B., McQuaid, J. B., Neely III, R. R., and Murray, B. J.: Southern Alaska as a source of atmospheric mineral dust and ice-nucleating particles, Sci. Adv., 9, eadg3708, https://doi.org/10.1126/sciadv.adg3708, 2023.
Bullard, J. E., Matthew, B., Tom, B., John, C., Eleanor, D., Diego, G., Santiago, G., Gudrun, G., Richard, H., Robert, M., Cheryl, M.-N., Tom, M., Helena, S., and Thorsteinsson, T.: High latitude dust in the Earth system, Rev. Geophys., 54, 447–485, https://doi.org/10.1002/2016RG000518, 2016.
Dörnbrack, A., Stachlewska, I. S., Ritter, C., and Neuber, R.: Aerosol distribution around Svalbard during intense easterly winds, Atmos. Chem. Phys., 10, 1473–1490, https://doi.org/10.5194/acp-10-1473-2010, 2010.
Dubovik, O., Holben, B., Eck, T. F., Smirnov, A., Kaufman, Y. J., King, M. D., Tanré, D., and Slutsker I.: Variability of absorption and optical properties of key aerosol types observed in worldwide locations, J. Atmos. Sci., 59, 590–608, https://doi.org/10.1175/1520-0469(2002)059<0590:VOAAOP>2.0.CO;2, 2002.
Eloranta, E. W., Razenkov, I. A., Garcia, J. P., and Hedrick, J.: Observations with the University of Wisconsin Arctic High Spectral Resolution Lidar, 22nd International Laser Radar Conference, 12–16 July, Matera, Italy, https://lidar.ssec.wisc.edu/papers/conferences/ilrc22/hsrl_v1_color.pdf (last accessed: 2 December 2025), 2004.
Esselborn, M., Wirth, M., Fix, A., Weinzierl, B., Rasp, K., Tesche, M., and Petzold, A.: Spatial distribution and optical properties of Saharan dust observed by airborne high spectral resolution lidar during SAMUM 2006, Tellus B, 61, 131–143, https://doi.org/10.1111/j.1600-0889.2008.00394.x, 2009.
Freudenthaler, V., Esselborn, M., Wiegner, M., Heese, B., Tesche, M., Ansmann, A., Müller, D., Althausen, D., Wirth, M., Fix, A., Ehret, G., Knippertz, P., Toledano, C., Gasteiger, J., Garhammer, M., and Seefeldner, M.: Depolarization ratio profiling at several wavelengths in pure Saharan dust during SAMUM 2006, Tellus B, 61, 165–179,https://doi.org/10.1111/j.1600-0889.2008.00396.x, 2009.
Garay, M. J., Witek, M. L., Kahn, R. A., Seidel, F. C., Limbacher, J. A., Bull, M. A., Diner, D. J., Hansen, E. G., Kalashnikova, O. V., Lee, H., Nastan, A. M., and Yu, Y.: Introducing the 4.4 km spatial resolution Multi-Angle Imaging SpectroRadiometer (MISR) aerosol product, Atmos. Meas. Tech., 13, 593–628, https://doi.org/10.5194/amt-13-593-2020, 2020.
Giles, D. M., Sinyuk, A., Sorokin, M. G., Schafer, J. S., Smirnov, A., Slutsker, I., Eck, T. F., Holben, B. N., Lewis, J. R., Campbell, J. R., Welton, E. J., Korkin, S. V., and Lyapustin, A. I.: Advancements in the Aerosol Robotic Network (AERONET) Version 3 database – automated near-real-time quality control algorithm with improved cloud screening for Sun photometer aerosol optical depth (AOD) measurements, Atmos. Meas. Tech., 12, 169–209, https://doi.org/10.5194/amt-12-169-2019, 2019.
Groot Zwaaftink, C. D., Grythe, H., Skov, H., and Stohl, A.: Substantial contribution of northern high-latitude sources to mineral dust in the Arctic, J. Geophys. Res., 121, 13678–13697, https://doi.org/10.1002/2016JD025482, 2016.
Groß, S., Tesche, M., Freudenthaler, V., Toledano, C., Wiegner, M., Ansmann, A., Althausen, D., and Seefeldner, M.: Characterization of Saharan dust, marine aerosols and mixtures of biomassburning aerosols and dust by means of multi-wavelength depolarization and Raman lidar measurements during SAMUM 2, Tellus B, 63, 706–724, https://doi.org/10.1111/j.1600-0889.2011.00556.x, 2011.
Hansen, J. E. and Travis, L. D.: Light scattering in planetary atmospheres, Space Sci. Rev., 16, 527–610, https://doi.org/10.1007/BF00168069, 1974.
Huang, Y., Adebiyi, A. A., Formenti, P., and Kok, J. F.: Linking the different diameter types of aspherical desert dust indicates that models underestimate coarse dust emission, Geophys. Res. Lett., 48, e2020GL092054, https://doi.org/10.1029/2020GL092054, 2021.
Justice, C. O., Townshend, J. R. G., Vermote, E. F., Masuoka, E., Wolfe, R. E., Saleous, N., Roy, D. P., and Morisette, J. T.: An overview of MODIS Land data processing and product status, Remote Sens. Environ., 83, 3–15, https://doi.org/10.1016/S0034-4257(02)00084-6, 2002.
Kahn, R. A., Li, W.-H., Moroney, C., Diner, D. J., Martonchik, J. V., and Fishbein, E.: Aerosol source plume physical characteristics from space-based multiangle imaging, J. Geophys. Res.-Atmos., 112, D11205, https://doi.org/10.1029/2006JD007647, 2007.
Kaltschmitt, M., Streicher, W., and Wiese, A.: Renewable Energy – Technology, Economics and Environment (XXXII), Springer, Berlin, Heidelberg, New York, ISBN 3-540-70947-9, ISBN 978-3-540-70947-3, p. 55, http://www.springer.com/us/book/9783540709473 (last access: 22 November 2025), 2007.
Kawai, K., Matsui, H., and Tobo, Y.: Dominant Role of Arctic Dust With High Ice Nucleating Ability in the Arctic Lower Troposphere, Geophys. Res. Lett., 50, 1–10, https://doi.org/10.1029/2022GL102470, 2023.
Lesins, G., Duck, T. J., and Drummond, J. R.: Climate trends at Eureka in the Canadian high arctic, Atmos. Ocean, 48, 59–80, https://doi.org/10.3137/AO1103.2010, 2010.
Levy, R., Hsu, C., et al.: MODIS Atmosphere L2 Aerosol Product, NASA MODIS Adaptive Processing System [data set], Goddard Space Flight Center, USA, https://doi.org/10.5067/MODIS/MOD04_3K.061, 2015a.
Levy, R., Hsu, C., et al.: MODIS Atmosphere L2 Aerosol Product, NASA MODIS Adaptive Processing System [data set], Goddard Space Flight Center, USA, https://doi.org/10.5067/MODIS/MYD04_3K.061, 2015b.
Levy, R., Hsu, C., et al.: MODIS Atmosphere L2 Aerosol Product, NASA MODIS Adaptive Processing System [data set], Goddard Space Flight Center, USA, https://doi.org/10.5067/MODIS/MOD04_L2.061, 2015c.
Levy, R., Hsu, C., et al.: MODIS Atmosphere L2 Aerosol Product, NASA MODIS Adaptive Processing System [data set], Goddard Space Flight Center, USA, https://doi.org/10.5067/MODIS/MYD04_L2.061, 2015d.
Lind, E. and Gupta, P.: Registry of Research Data Repositories, AERONET [data set], https://doi.org/10.17616/R3VK9T, 2023.
Liu, Z., Fairlie, T. D., Uno, I., Huang, J., Wu, D., Omar, A., Kar, J., Vaughan, M., Rogers, R., Winker, D., Trepte, C., Hu, Y., Sun, W., Lin, B., and Cheng, A.: Transpacific transport and evolution of the optical properties of Asian dust, J. Quant. Spectrosc. Ra., 116, 24–33, https://doi.org/10.1016/j.jqsrt.2012.11.011, 2013.
Mamouri, R. E. and Ansmann, A.: Fine and coarse dust separation with polarization lidar, Atmos. Meas. Tech., 7, 3717–3735, https://doi.org/10.5194/amt-7-3717-2014, 2014.
Mamouri, R.-E. and Ansmann, A.: Potential of polarization/Raman lidar to separate fine dust, coarse dust, maritime, and anthropogenic aerosol profiles, Atmos. Meas. Tech., 10, 3403–3427, https://doi.org/10.5194/amt-10-3403-2017, 2017.
Martonchik, J. V., Diner, D. J., Kahn, R. A., Ackerman, T. P., Verstraete, M. M., Pinty, B., and Gordon, H. R.: Techniques for the retrieval of aerosol properties over land and ocean using multiangle imaging, IEEE T. Geosci. Remote, 36, 1212–1227, https://doi.org/10.1109/36.701027, 1998.
Meinander, O., Dagsson-Waldhauserova, P., Amosov, P., Aseyeva, E., Atkins, C., Baklanov, A., Baldo, C., Barr, S. L., Barzycka, B., Benning, L. G., Cvetkovic, B., Enchilik, P., Frolov, D., Gassó, S., Kandler, K., Kasimov, N., Kavan, J., King, J., Koroleva, T., Krupskaya, V., Kulmala, M., Kusiak, M., Lappalainen, H. K., Laska, M., Lasne, J., Lewandowski, M., Luks, B., McQuaid, J. B., Moroni, B., Murray, B., Möhler, O., Nawrot, A., Nickovic, S., O’Neill, N. T., Pejanovic, G., Popovicheva, O., Ranjbar, K., Romanias, M., Samonova, O., Sanchez-Marroquin, A., Schepanski, K., Semenkov, I., Sharapova, A., Shevnina, E., Shi, Z., Sofiev, M., Thevenet, F., Thorsteinsson, T., Timofeev, M., Umo, N. S., Uppstu, A., Urupina, D., Varga, G., Werner, T., Arnalds, O., and Vukovic Vimic, A.: Newly identified climatically and environmentally significant high-latitude dust sources, Atmos. Chem. Phys., 22, 11889–11930, https://doi.org/10.5194/acp-22-11889-2022, 2022.
Mishchenko, M. I. and Sassen, K.: Depolarization of lidar returns by small ice crystals: An application to contrails, Geophys. Res. Lett., 25, 309–312, https://doi.org/10.1029/97GL03764, 1998.
MISR Handbook: Multi-angle Imaging SpectroRadiometer Project Handbook, Atmospheric Science Data Center, NASA Langley Research Center, https://asdc.larc.nasa.gov/documents/misr/guide/misr_ov2.pdf (last access: 21 December 2024), 2000.
Nelson, D. L., Garay, M. J., Kahn, R. A., and Dunst, B. A.: Stereoscopic height and wind retrievals for aerosol plumes with the MISR INteractive eXplorer (MINX), Remote Sens., 5, 4593–4628, https://doi.org/10.3390/rs5094593, 2013.
O'Neill, N. T., Ranjbar, K., Ivănescu, L., Blanchard, Y., Sayedain, S. A., and AboEl-Fetouh, Y.: Remote-sensing detectability of airborne Arctic dust, Atmos. Chem. Phys., 25, 27–44, https://doi.org/10.5194/acp-25-27-2025, 2025.
Ranjbar, K., O'Neill, N. T., Ivanescu, L., King, J., and Hayes, P. L.: Remote sensing of a high-Arctic, local dust event over Lake Hazen (Ellesmere Island, Nunavut, Canada), Atmos. Environ., 246, 118102, https://doi.org/10.1016/j.atmosenv.2020.118102, 2021.
Remer, L. A., Mattoo, S., Levy, R. C., and Munchak, L. A.: MODIS 3 km aerosol product: algorithm and global perspective, Atmos. Meas. Tech., 6, 1829–1844, https://doi.org/10.5194/amt-6-1829-2013, 2013.
Sayedain, S. A., O'Neill, N. T., King, J., Hayes, P. L., Bellamy, D., Washington, R., Engelstaedter, S., Vicente-Luis, A., Bachelder, J., and Bernhard, M.: Detection and analysis of Lhù'ààn Maân’ (Kluane Lake) dust plumes using passive and active ground-based remote sensing supported by physical surface measurements, Atmos. Meas. Tech., 16, 4115–4135, https://doi.org/10.5194/amt-16-4115-2023, 2023.
Sayedain, S. A. and O'Neill, N. T.: Remote sensing of local-dust across the Canadian Arctic - Supplementary Material, Zenodo, https://doi.org/10.5281/zenodo.20561203, 2026.
Sayer, A. M., Munchak, L. A., Hsu, N. C., Levy, R. C., Bettenhausen, C., and Jeong, M.-J.: MODIS Collection 6 aerosol products: Comparison between Aqua's e-Deep Blue, Dark Target, and “merged” data sets, and usage recommendations, J. Geophys. Res.-Atmos.., 119, 13,965–13,989. https://doi.org/10.1002/2014JD022453, 2014.
Sinyuk, A., Holben, B. N., Eck, T. F., Giles, D. M., Slutsker, I., Korkin, S., Schafer, J. S., Smirnov, A., Sorokin, M., and Lyapustin, A.: The AERONET Version 3 aerosol retrieval algorithm, associated uncertainties and comparisons to Version 2, Atmos. Meas. Tech., 13, 3375–3411, https://doi.org/10.5194/amt-13-3375-2020, 2020.
Song, Q., Zhang, Z., Yu, H., Ginoux, P., and Shen, J.: Global dust optical depth climatology derived from CALIOP and MODIS aerosol retrievals on decadal timescales: regional and interannual variability, Atmos. Chem. Phys., 21, 13369–13395, https://doi.org/10.5194/acp-21-13369-2021, 2021.
Tian, Y., Pan, X., Wang, Z., Wang, D., Ge, B., Liu, X., Zhang, Y., Liu, H., Lei, S., Yang, T., Fu, P., Sun, Y., and Wang, Z.: Transport patterns, size distributions, and depolarization characteristics of dust particles in East Asia in spring 2018, J. Geophys. Res.-Atmos., 125, e2019JD031752, https://doi.org/10.1029/2019JD031752, 2020.
Tobo, Y., Adachi, K., DeMott, P. J., Hill, T. C. J., Hamilton, D. S., Mahowald, N. M., Nagatsuka, N., Ohata, S., Uetake, J., Kondo, Y., and Koike, M.: Glacially sourced dust as a potentially significant source of ice nucleating particles, Nat. Geosci., 12, 253–258. https://doi.org/10.1038/s41561-019-0314-x, 2019.
TSI Incorporated: Aerodynamic Particle Sizer® (APS™) Model 3321 [Specification sheet], https://www.tsi.com/getmedia/7fd20aa0-8540-4b8d-8572-d164366dd08c/3321-Spec-Sheet-US?ext=.pdf (last access: 11 November 2025), 2022.
Uno, I., Eguchi, K., Yumimoto, K., Takemura, T., Shimizu, A., Uematsu, M., Liu, Z., Wang, Z., Hara, Y., and Sugimoto, N.: Asian dust transported one full circuit around theglobe, Nat. Geosci., 2, 557–560, https://doi.org/10.1038/ngeo583, 2009.
Weitkamp, C.: Lidar: range-resolved optical remote sensing of the atmosphere, HSRL chapter 5 by E. Eloranta, Springer Science and Business Media, New York, https://doi.org/10.1007/b106786, 2005.
Williamson, M.-C. and MacRae, R. A.: Mineralization potential in volcanic rocks of the Strand Fiord Formation and associated intrusions, Axel Heiberg Island, Nunavut, Canada, Geological Survey of Canada, Open File, 7981, 34 pp., Natural Resources Canada, https://doi.org/10.4095/297365, 2015.
Witek, M. L., Garay, M. J., Diner, D. J., Bull, M. A., Seidel, F. C., Nastan, A. M., and Hansen, E. G.: Introducing the MISR level 2 near real-time aerosol product, Atmos. Meas. Tech., 14, 5577–5591, https://doi.org/10.5194/amt-14-5577-2021, 2021.
Woo, M. K., Edlund, S. A., and Young, K. L.: Occurrence of early snow-free zones on Fosheim Peninsula, Ellesmere Island, Northwest Territories, Current Research, Part B, Geological Survey of Canada Paper, 91, 9–14, ISBN: 0-660-56282-0, https://publications.gc.ca/collections/collection_2017/rncan-nrcan/M44-91-1B.pdf (last access: 22 November 2025), 1991.
Xi, Y., Xu, C., Downey, A., Stevens, R., Bachelder, J. O., King, J., Hayes, P. L., and Bertram, A. K.: Ice nucleating properties of airborne dust from an actively retreating glacier in Yukon, Canada, Environmental Science: Atmospheres, 2, 714–726. https://doi.org/10.1039/d1ea00101a, 2022.
Yang, S., Preißler, J., Wiegner, M., von Löwis, S., Petersen, G. N., Parks, M. M., and Finger, D. C.: Monitoring dust events using doppler lidar and ceilometer in Iceland, Atmosphere, 11, 1–23, https://doi.org/10.3390/atmos11121294, 2020.
Zhao, X., Huang, K., Fu, J. S., and Abdullaev, S. F.: Long-range transport of Asian dust to the Arctic: identification of transport pathways, evolution of aerosol optical properties, and impact assessment on surface albedo changes, Atmos. Chem. Phys., 22, 10389–10407, https://doi.org/10.5194/acp-22-10389-2022, 2022.
roughly speaking, particles of super µm (radius) size
their CM AODs corresponded to integrations of the retrieved AERONET particle-volume size distribution across retrieval radii ranging from a fixed (interpolated) value of 0.6 µm (Dubovik et al., 2002) to an upper bin edge of 17.18 µm (AboEl-Fetouh et al., 2020 explicitly define the bin centers and the bid edges in their Table S1)
Their source and receptor regions represent broad “cap” areas that are greater than a certain latitude
The Kluane Lake Research Station about 8 km east of the Ä'äy Chù measurement station
The AERONET database name for “0PAL” is written as “OPAL”
supplemented by 4 additional AOD/almucantar measurement series at solar airmasses of 4, 3, 2 and 1.7 (Sinyuk et al., 2020).
from bin (i) = 21 to 52. This bin range corresponds to geometric bin center diameters of D = 1.47 to 13.66 µm. Geometric diameters are taken as the aerodynamic diameter1.45 (see, for example, Huang et al., 2021).
What the lidar community refers to as backscatter cross section (but which we have adapted to better fit into the extinction coefficient vocabulary of the radiative transfer community; see, for example, Hansen and Travis, 1974)
For purposes of symbolic brevity, we also employ δ to represent VDR in any equation context.
https://worldview.earthdata.nasa.gov/ (last access: 2 December 2025)
https://dataspace.copernicus.eu/browser (last access: 2 December 2025)
Local-time equatorial crossings of 10:30 and 13:30, respectively
over the extended period that the two data sets were mutually available (August 2005 to June 2010)
Appendix A3.1 is a discussion of how we filtered (weighted) out severe outliers that could appear in the VDR profiles
Supplementary PowerPoint file “AHSRL_CIMEL_event_profiles”
Across that layer we found and to be quite small (< ∼ 0.0003) and < ∼ 0.0002 respectively).
beyond the support provided in the AERONET literature for the efficacy of their cloud screening algorithm
The MISR multi-angle (stereoscopic) capabilities permitted an estimate of the time that the roughly 8 km altitude cirrus cloud (located over Axel Heiberg Island) incited a spike in the Level 1.0 CM AOD.
This is the name AERONET ascribed to the CIMEL of the Lhù'ààn Mân' region. SDN referred to the AERONET CIMEL measurements being made at KLRS (Kluane Lake Research Station): KLRS is the acronym that we will associate with the “Kluane Lake” CIMEL
A nominal precision of 0.04 × ΔAOD which for our 2018 CM AOD range yields 0.04 × 0.01 = 0.0004 (i.e. 0.04 × ΔAOD for the best precision case of the 3 km DT over the open-ocean AOD product; Remer et al., 2013).
See Figs. S12 and S13 in the supplementary PowerPoint file “Satellite_Analysis”. The high spatial resolution (10 m pixels) of the Sentinel-S2A image and the overlain wind-vector field of Fig. S12 along with the blinking Sentinel-S2A images of 19:49 and 20:40 UTC acquisition times, suggest that dust plumes in Eureka Sound likely originated from the barren western slopes of Axel Heiberg Island.
Very spatially coarse AOD pixels of 3 km resolution: Eureka Sound is ≲ 3 MODIS-AOD pixels in width
as per Figs. S32g and S32h of the Supplementary PowerPoint file “CARRA_wind_ simulations”
Roughly (qualitatively) lasting from 18:00 on 21 August (Fig. 32g) to 06:00 on 23 August (Fig. 32s).
Acquired at 15:20 UTC (late morning local time) on 8 September 2020
it appears to be emanating from the largely barren drainage basin whose watershed empties into Eureka Sound (see Fig. S15 for details).
Supplementary PowerPoint file “Satellite_Analysis”
There are no MINX (MISR) plume height or speed retrievals to report because the plume was basically obscured by clouds at the MISR orbit time of 19:50 UTC.
Supplementary PowerPoint file “Satellite_Analysis”
We note that in general, neither the plume height or the plume speed sampling trajectories are subject to any objective sampling protocol and that the plume height (and plume speed) histograms generally represent significant departures from a normal distribution. While we report means and standard deviations of plume height and wind speed, they are meant to be order-of-magnitude height and height variability indicators for subjectively selected plume structures seen in the color imagery.
An ECCC met station (WMO ID: 71017, coordinates 73° 46′ N, 105° 18′ ) at 11 m elevation is located on Stefansson Island (see Fig. 6). We normalized the MISR plume speed to the plume speed at the elevation of the station by applying a standard wind gradient expression (see e.g. Kaltschmitt et al., 2007) with an open-water wind shear (Hellman) exponent of 0.1: ,
Meteorologist Peninsula is located at the extreme south of Ellef Ringnes Island (again, see Fig. 9a)
Figure S24 shows the MISR camera animation where one can more readily appreciate the positions and stereoscope movement of higher altitude clouds.
The 58 m ECCC met station of “ISACHSEN (AUT)” in the north of Ellef Ringnes Island (78° 47′ N, 103° 33′ W). The normalization approximation for wind-shear (wind gradient) effects was carried out as per Sect. 4.2.2 above.
there is no CM AOD option for the snow/ice retrievals since we have no CMF estimate for those retrievals
The MISR image shows numerous dust plumes which appear to be associated with dark sources on the southern shore of Strand Bay.
Note that the MISR times of S30a and S30b images are nearly identical (solar illumination conditions are nearly identical)
the measured value normalized to the height of the nearby met station
but is shown in the PowerPoint profiles
the value of at the nominal time contained within a particular 0PAL (1 min) time bin (where the general AERONET sampling frequency is every 3 min: see Giles et al., 2019 for details on CIMEL sampling),
between the two values at the two nominal PEARL times on either side of a particular time
PDR is a common (intensive-parameter) label for that is typically (if rather simplistically) associated with a given type of atmospheric particle. See, for example, Liu et al. (2013)
where = Scτβ,c and = Sfτβ,f (Sc and Sf being their respective lidar ratios)
Equation (A2) represents a continuously varying function of ηc or ηf while Eq. (A3) is a step function of δthr (stepping from δthr-dependent values of 〈VDR〉 for δ≤δthr to δthr-dependent values of 〈VDR〉 for δ>δthr)
Where the particle volume sized distribution is significant: see, e.g., Mamouri and Ansmann, 2014 (MA)
See, e.g. MA who argue that their FM and CM dust PDRs [“δdf” and “δdc” respectively] of 16 % and 39 % respectively can generate near-source (Sahara) VDR (δ) values of ∼ 31 ± 3 % (the values of Freudenthaler et al., 2009 and Grob et al., 2011 as cited in MA).
e.g., the complete (and ubiquitous) FM AERONET-inversion component between ∼ 0.05 and 0.2 µm (radius) seen in their Fig. 4.
for what they call “non-dust” particles but whose distinctive feature is arguably the limitation to a holistic FM component. See also, for example, the precipitous drop in simulated δ values of ice particles (to magnitudes < 5 %) for (ice) between the specific cases of 0.05 and 0.2 µm radius (effective size parameter between 0.6 and 2.4) in Fig. A1.
the tail of what might be called a holistic CM component between ∼ 0.2 to 10 µm radius as seen in their Fig. 4
MA's AERONET PSD shows a not insignificant (sub-µm) FM tail of that CM component. It is this tail that surely drives their FM (“δdf”) estimate of 16 %.
the difference in elevation between 0PAL and PEARL (except that the 82.5 m is above the 0PAL elevation of 5 m). The statistics start at 82.5 m because the VDR below 82.5 m was judged to be too noisy.
too many values well above the typical VDR range for CM dust (see, for example, Fig. 1 of Tian et al., 2020).
While retaining the rest of the (positive) VDR pixels in the given profile
Simply put the exclusion of the negative values acted to increase the 〈VDR〉 values. This exclusion is debatable given that those negative values could well have a physical sense (they are likely associated with system constants whose range of variability could facilitate the production of negative VDR values for a fraction of the VDRs).
The “RERMS” of the x axis in Fig. A2 represents the RMS residual error of the individual residual of any lidar pixel in any given vertical profile (the “individual residual” being the difference between a given VDR value at a given altitude and its running average; see the example for two representative lidar profiles in Fig. A3). This RE parameter enables an estimation of the noise magnitude by eliminating the systematic trend of the natural VDR variation. The inverse square weighting approach was inspired by standard texts on linear regression analysis (see, for example, Sect. 3.5 of Barford, 1967)
Supplementary PowerPoint file “AHSRL_CIMEL_event_profiles”
we could have reduced that variance with an appropriate smoothing approach but decided to forgo that added complication by the simple expedient of choosing the unweighted statistics since those statistics were largely free of the type of extreme VDR variation that one sees in the unweighted VDR means of Events 2, 3, 4, 5 and 7.
to be mathematically precise, those CM event averages (the y-axes labels of the LH graphs of Fig. A4) represent and where the VDR vs. δthr test is applied to each lidar pixel. The RH FM y-axis labels represent and
Values which would tend to be moderately larger at 532 nm (see, for example, Table 1 of Mamouri and Ansmann, 2017).
that takes into account the fact that all parameters (those enclosed in the square brackets) must be restricted by the FM and CM conditions
where ωi,J is the weighting defined above
The weighting appears to enhance what would otherwise be nondescript points in the βi,J profile values.
- Abstract
- Introduction
- Study Area
- Instrumentation and Methodology
- Results and Discussion
- Conclusions
- Appendix A
- Appendix B: Acronym and symbol glossary
- Code availability
- Data availability
- Author contributions
- Competing interests
- Disclaimer
- Acknowledgements
- Financial support
- Review statement
- References
- Abstract
- Introduction
- Study Area
- Instrumentation and Methodology
- Results and Discussion
- Conclusions
- Appendix A
- Appendix B: Acronym and symbol glossary
- Code availability
- Data availability
- Author contributions
- Competing interests
- Disclaimer
- Acknowledgements
- Financial support
- Review statement
- References