
the Creative Commons Attribution 4.0 License.
the Creative Commons Attribution 4.0 License.
 | 21 Jul 2026
Vertical profiles of aerosol chemical species concentration retrieved through synergy of spaceborne lidar and polarimeter observations
Abou Bakr Merdji
Juan Cuesta
Fazzal Qayyum
Anton Lopatin
Oleg Dubovik
Durgesh Nandan Piyush
Laaziz El Amraoui
Paolo Di Girolamo
Charles R. Trepte
We present a novel methodology, AEROCHEMPro/GRASP (AEROsol CHEMical PROfiling), for retrieving vertical concentration profiles of aerosol chemical species by synergistically combining co-located measurements from a multiwavelength lidar and a multi-angular polarimeter. AEROCHEMPro represents the first retrieval framework for remote sensing of the vertically-resolved aerosol chemical composition. It is based on an improved version of the GRASP (Generalized Retrieval of Aerosol and Surface Properties) chemical component framework. The methodology is developed within the context of the Atmosphere Observing System (AOS) international initiative, which proposes a spaceborne observing system to advance our knowledge of aerosols, clouds, convection, and precipitation. Moreover, the retrieval strategy remains broadly applicable to future satellite missions and observing systems involving combined lidar and multi-angular polarimeter aerosol remote sensing.
Based on a statistically optimized and physically-constrained inversion, AEROCHEMPro/GRASP delivers three distinct aerosol vertical profiles: (i) a fine mode composed of black carbon, brown carbon, inorganic salts, and associated water uptake; (ii) a hydrophobic coarse mode representing mineral dust, decomposed into iron oxide and quartz species; and (iii) a hydrophilic coarse mode consisting of sea salt particles and their associated water content. The approach explicitly retrieves these three aerosol profiles, along with the fractional abundance of each of the six mentioned aerosol chemical species and their water content. This retrieval of aerosol chemical composition vertical profiles offers, for the first time, a direct observational link between aerosol optical measurements and their speciation resolved in altitude. We demonstrate the feasibility and performance of this technique through an innovative retrieval experiment, where synthetic lidar and polarimeter observations are generated using the MOCAGE chemical transport model and a comprehensive radiative transfer simulator (GRASP forward model). These pseudo-observations include multi-wavelength attenuated backscatter and depolarization ratios, along with polarized radiances across multiple viewing angles and spectral bands.
Results from global-scale transects spanning marine, urban, dust, and complex mixture-dominated regions show that the retrieval captures with good fidelity the main features of vertical aerosol composition and their bulk optical properties. Fine-mode species are well retrieved, particularly in the boundary layer, even for atmospheres with complex mixtures of multiple aerosol species. Dust is accurately retrieved and well defined in terms of vertical extent, load, and composition, and sea salt concentrations are very well reproduced. Some limitations for deriving water content in the upper atmospheric layers are remarked. AEROCHEMPro/GRASP reliably derives optical properties such as aerosol optical depth (AOD), single scattering albedo (SSA), and lidar ratio (LR), demonstrating the approach's robustness. As this initial validation relies on a self-consistent simulation framework over a spatially uniform surface baseline, these results represent an optimistic, idealized theoretical performance limit. This new retrieval approach represents a significant advancement in spaceborne aerosol remote sensing, as it provides vertically resolved chemical speciation that is directly related to chemical transport model results. It offers new opportunities to improve our understanding of aerosol processes and their effects on climate and air quality.
- Article
(11849 KB) - Full-text XML
-
Supplement
(599 KB) - BibTeX
- EndNote


Aerosols are minute particles suspended in the atmosphere that play an essential role in Earth's climate by absorbing and reflecting solar radiation and serving as nuclei for ice or cloud condensation. Numerous studies have shown that climate forcing is affected by such particles (IPCC, 2021; Boucher et al., 2013). However, not all aerosols are equally efficient in their relevance for clouds. This is closely related to the specific chemical composition, sizes, and mixtures of aerosols, which are associated with their origin or formation pathway. Droplet and ice crystal formation is strongly tied to the number concentration, size, and hygroscopicity of the available aerosols (Dusek et al., 2006; Murray et al., 2020; Burrows et al., 2022). It's crucial to understand how aerosols are spatially distributed and composed to estimate their radiative effects on climate, improve forecasts in climate models, and determine adaptation strategies. Owing to their sporadic and highly variable temporal and spatial nature, the spatio-temporal variability of aerosol characteristics is challenging to integrate accurately into climate models.
Among other harmful effects, aerosols can also adversely affect human health, reduce visibility, and disrupt ecosystems (WHO, 2013; Lelieveld et al., 2015). They are responsible for causing or aggravating respiratory, cardiovascular, and even neurological diseases; for instance, soot (black carbon) has been classified as carcinogenic by the World Health Organization (IARC, 1985). A particle's ability to cause additional morbidity and mortality depends on the degree of penetration into the human respiratory system, which is a function of particle size, and on its toxicity. Recent studies have shown a much larger toxicity of organic matter and black carbon aerosols linked to combustion sources than those composed of nitrate and sulfate inorganic sources (Park et al., 2018). Their abundance is linked to both natural phenomena, such as volcanic eruptions and desert dust, and human activities, such as the burning of biomass and fossil fuels (Seinfeld and Pandis, 2016; Mhawish et al., 2022). Desert dust, for instance, can be transported across thousands of kilometers, affecting air quality, human health, and climate far from its source (Gandham et al., 2022; Liu et al., 2019; Merdji et al., 2023b; Singh et al., 2022; Xu et al., 2023). There remain significant uncertainties about the intensity and spatial distribution of the direct and indirect effects of aerosols on the radiative budget (Myhre et al., 2013). These uncertainties highlight a strong need for more advanced observational and modeling approaches to accurately capture the key aerosol properties associated with their impacts.
In this framework, our capacity to quantify the numerous environmental impacts of aerosols is closely related to the ability to provide a detailed characterization of both vertical distribution and chemical composition of aerosol particles. Aerosol speciation, which is the quantification of distinct chemical species composing the aerosols, is fundamental for understanding their sources, evolution, and impacts on the environment (Jacobson, 2001). Similarly, aerosols at different altitudes may have different climatic, ecological, and health effects. While near-surface aerosols directly degrade air quality and public health, absorbing particles located at higher altitudes, such as black carbon, can dramatically alter the Earth's energy balance (Ramanathan et al., 2001). Recent analyses of aerosol characteristics further highlight the large spatial and seasonal diversity of aerosol optical and absorbing properties e.g. (Merdji et al., 2023a, 2025; Mukhopadhyay et al., 2025).
On-site measurement techniques, such as filter sampling and online in situ instruments, are appropriate for determining the aerosol chemical composition but often lack characterization of their continuous vertical distribution and are inherently limited on spatial and temporal coverage, e.g. Zhang et al. (2007) and Jayne et al. (2000). Moreover, chemistry-transport modeling (CTM) of aerosols for climate and air quality applications is very rarely confronted with reference observations of vertically resolved aerosol chemical speciation, which are nonexistent at regional to global spatial scales. Indeed, the accuracy of these models and the corresponding assumptions on aerosol physical and/or chemical properties are directly related to the availability of comprehensive observational data for validation (Chin et al., 2000; Kukkonen et al., 2012).
Remote sensing techniques, such as polarimetry and lidar (Light Detection and Ranging), are the most promising means of filling this observational gap. Polarimeters can retrieve particle size, shape, and refractive index (Dubovik et al., 2011, 2019), while lidar instruments provide high-resolution vertical profiles of aerosol scattering properties (Dubovik et al., 2011; Winker and Pelon, 2010). However, the synergy between these instruments has yet to be fully exploited, particularly for retrieving chemically resolved aerosol vertical profiles. A more comprehensive understanding of aerosol composition and transport may be acquired by integrating data from these datasets, which can potentially complement each other and overcome the limitations of individual techniques.
Recent studies demonstrate the effectiveness of integrating multispectral satellite observations for monitoring tropospheric composition. Cuesta et al. (2018, 2022) and Okamoto et al. (2023) employed Infrared Atmospheric Sounding Interferometer (IASI) and Global Ozone Monitoring Experiment-2 (GOME-2) data to monitor near-surface ozone variability, identify precursor emission sources, and assess the influence of anthropogenic and natural emissions on large-scale pollution events. Similarly, Lemmouchi et al. (2022, 2023) and Maheshwarkar et al. (2024) developed the AEROS5P approach, which uses the Tropospheric Monitoring Instrument (TROPOMI) to retrieve three-dimensional aerosol distributions and provides new perspectives on aerosol transport and vertical structure. These studies show that multispectral and multi-instrument satellite observations improve the detection of near-surface pollution and the retrieval of vertical ozone and aerosol profiles, boosting climate and air quality evaluations.
A significant breakthrough in aerosol remote sensing is the Generalized Retrieval of Aerosol and Surface Properties (GRASP) algorithm. Initially, GRASP set out to obtain reflectance and aerosol optical parameters, but later its scope was broadened to include the retrieval of some aerosol chemical constituents as well (Dubovik et al., 2011, 2021; Lopatin et al., 2021). Thanks to the incorporation of a versatile forward model with a numerical inversion module with original formulations of multiple and flexible constraints, GRASP processes multiple aerosol remote sensing datasets of different instruments and is thus suited for their synergisms. The versatility of the algorithm has been shown through its implementation on data from various instruments, such as POLDER/PARASOL (Chen et al., 2020; Dubovik et al., 2011), TROPOMI/Sentinel-5p (Chen et al., 2024; Litvinov et al., 2024), OLCI/Sentinel-3 (Chen et al., 2022), AHI/HIMAWARI-8 (Li et al., 2025) as well as their combinations (Litvinov et al., 2025), including future plans to be used as operational retrieval for recently launched Sentinel-4 and 3MI missions (Dubovik et al., 2021).
This study introduces the innovative AEROCHEMPro (AERosol CHEMical Profiling) approach. This novel methodology synergistically combines lidar and polarimeter observations to retrieve vertical concentration profiles of several distinguished aerosol chemical species. AEROCHEMPro represents the first framework that explicitly implements the synergism of level 1 measurements, combining multispectral lidar and multi-angle polarimetry, to derive chemically resolved aerosol vertical profiles from space-based observations. The development of this method is initially motivated by the Atmosphere Observing System (AOS) program, aiming to significantly advance aerosol and cloud observations through next-generation instruments, including the multiwavelength lidar and a multi-angular polarimeter e.g. (Brogniez et al., 2023). In the latest configuration of AOS, this active/passive combination was expected to be achieved by the synergism of the multi-angular polarimeter on the so-called AOS-Sky part of the program (polar orbit) and LUCE lidar mission (Di Girolamo et al., 2023, 2024). AOS is conceived to address critical gaps in the quantification of aerosol and environmental properties by advanced monitoring with a tandem of a new generation lidar and polarimeters. AEROCHEMPro is also highly relevant for future satellite missions combining active and passive remote sensing to retrieve vertically resolved aerosol properties. The approach is expected to enhance the understanding of aerosol chemical processes and their impacts by retrieving vertical profiles of distinct aerosol species, including black carbon, brown carbon, inorganic salts, minerals of dust particles, and sea salt. As this study establishes a new retrieval framework for satellite-based aerosol chemical speciation and its vertical distribution, AEROCHEMPro lays the groundwork for future missions using synergetic observations. It contributes to advancing aerosol research with profound implications for climate studies and air quality monitoring.
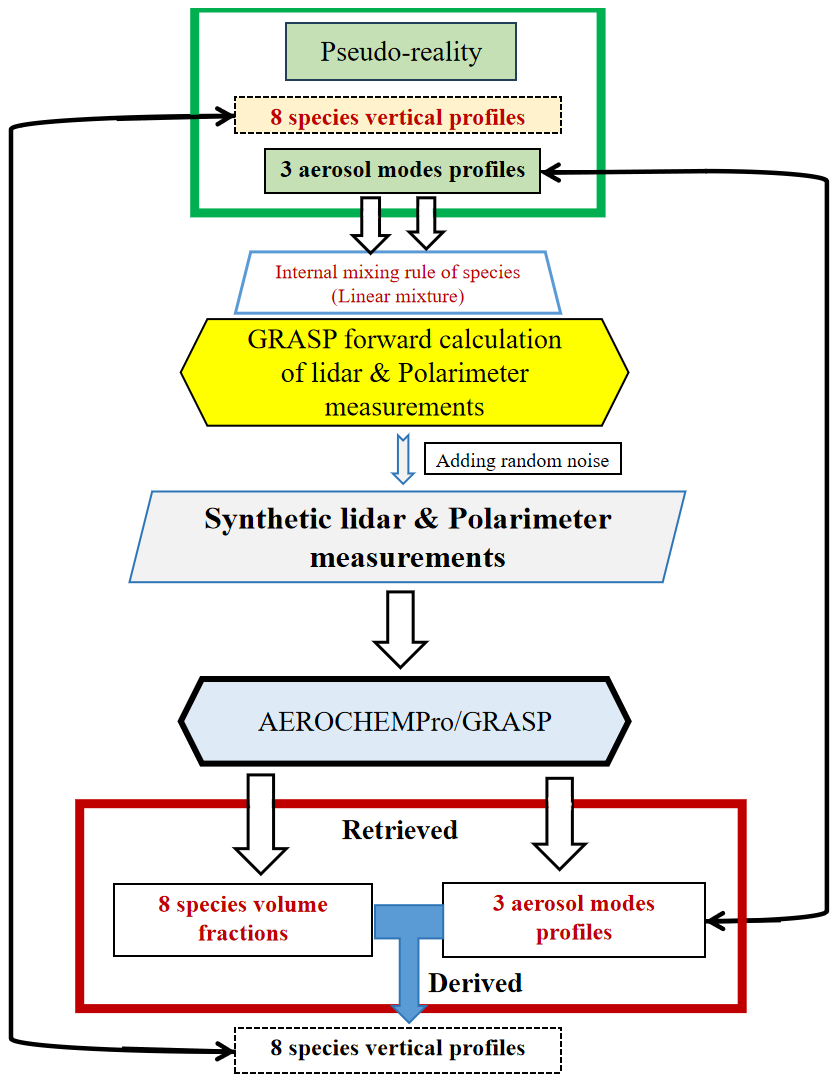
The development of the AEROCHEMPro approach is conducted in the framework of a full retrieval experiment from the measurements of the aerosol payload of AOS. This experiment comprises several steps, from the pseudo-reality simulation to retrieval and comparison (see Fig. 1). The pseudo-reality introduces inputs from MOCAGE and additional considerations as a valid representation of reality, providing synthetic datasets of aerosol concentration profiles, optical properties, and species-specific volume fractions. The experiment is based on Lidar and Polarimeter pseudo-observations, each with specific characteristics. While polarimeters provide multi-angular, polarized radiance measurements, lidars describe high-resolution vertical profiles of aerosol backscatter and depolarization ratio, which are first calculated by the forward radiative transfer code integrated within GRASP. These simulations assume the representation of complex externally and internally aerosol mixtures of several chemical species. Then, the GRASP inversion algorithm derives vertical profiles of aerosol chemical species and their optical characteristics from the combination of lidar and polarimeter synthetic observations. The polarimeter provides information on particle size distributions, detailed chemical composition, and shape, while lidar measurements reveal the vertical distributions of these aerosol species. Finally, the retrieved aerosol profiles from GRASP are compared with the pseudo-reality to assess how well AEROCHEMPro derives vertically-resolved aerosol speciation.
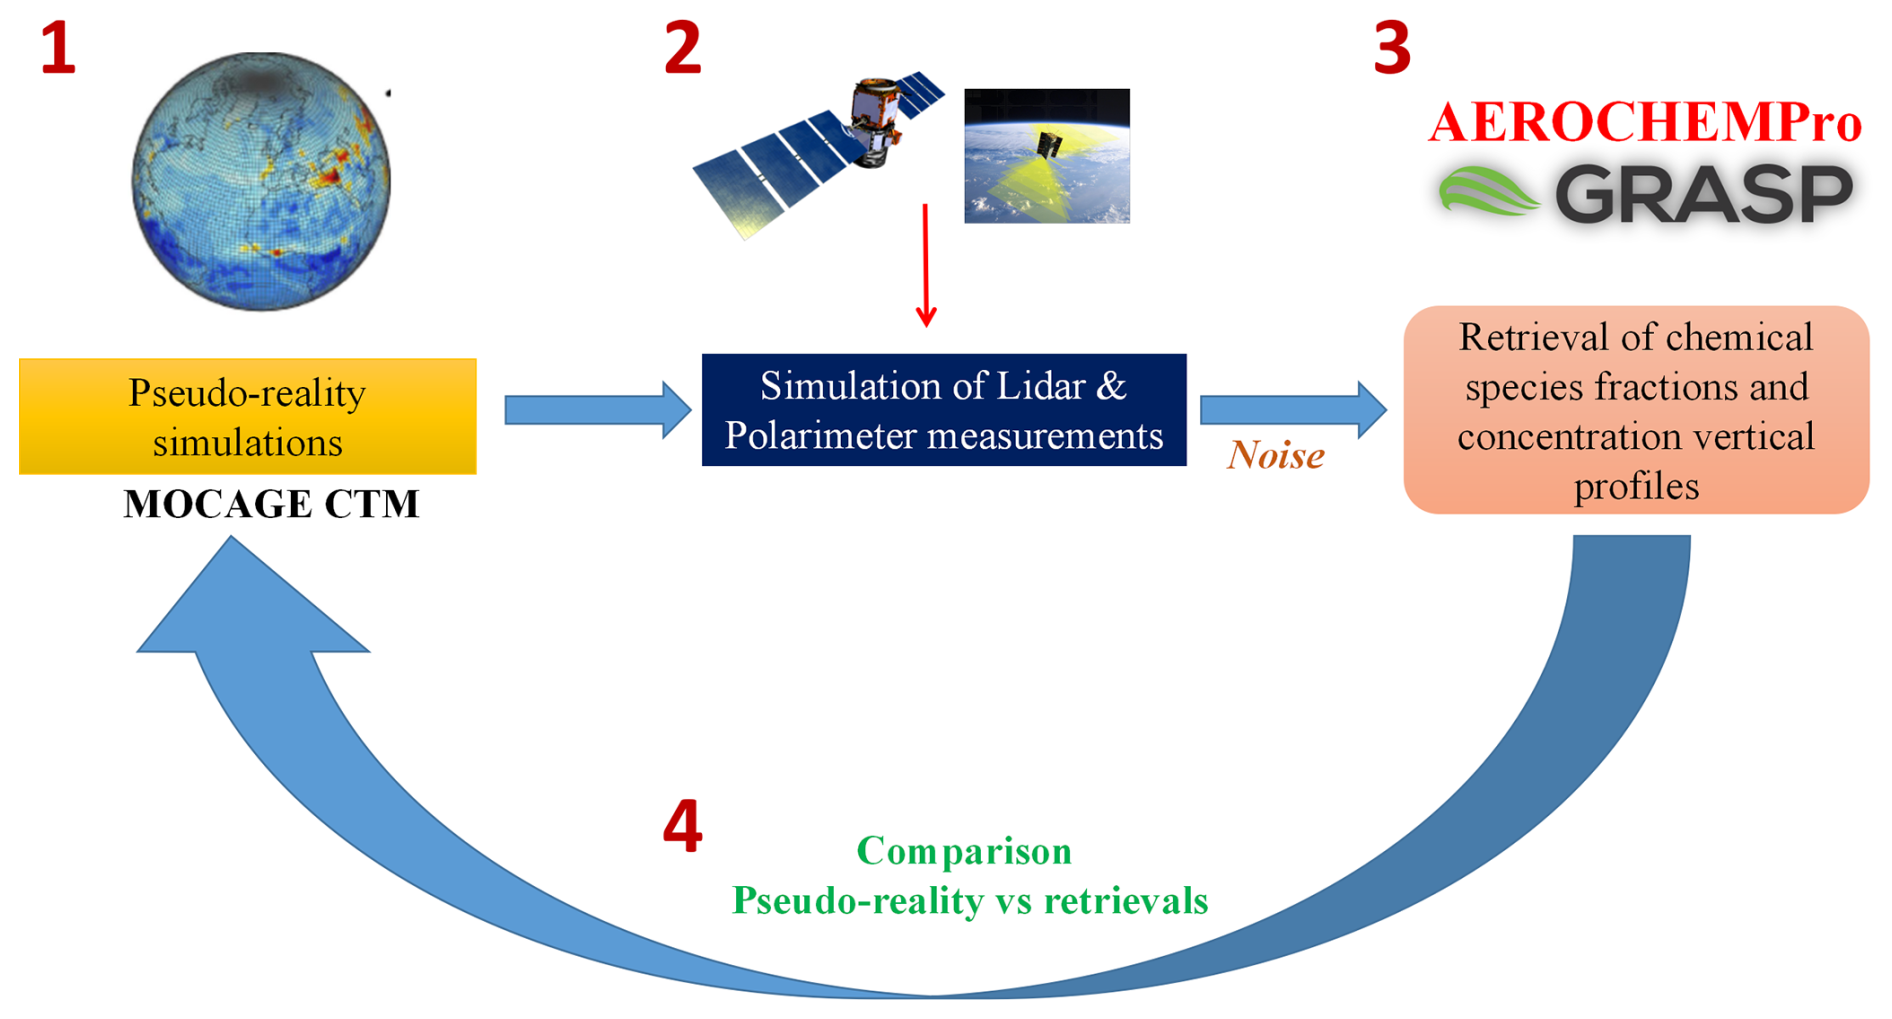
Figure 1Scheme of the full observing system simulation experiment implemented for evaluating the performance of AEROCHEMPro.
2.1 Pseudo-reality
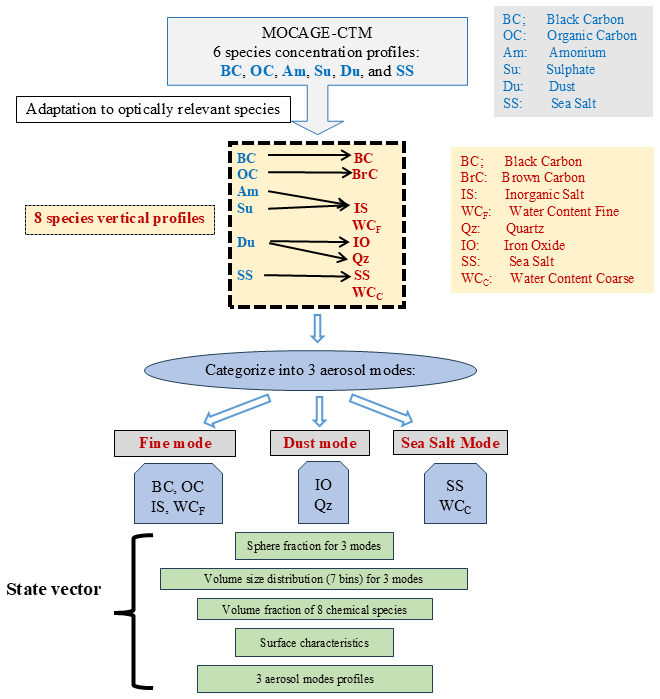
This study develops a comprehensive approach to build a pseudo-reality of aerosol properties, including vertically-resolved aerosol speciation, accounting for optically relevant species for which lidar and polarimeter are sensitive. These aerosol properties are: (i) volume mixing ratios of 6 aerosol chemical species (their fractional abundance are Fraci), (ii) water content absorbed by hydrophilic aerosols, (iii) vertical profiles (Profi) of these aerosol species, (iv) aerosol volume size distribution (), and (v) sphericity (Csph) of each aerosol mode. These aerosol properties, constituting the pseudo-reality, are used to evaluate the accuracy of the retrievals obtained from the inversion scheme. The steps for obtaining the pseudo-reality are shown in the comprehensive scheme in Fig. 2 and described in detail in the following subsections.
2.1.1 MOCAGE chemistry-transport model
In the context of the current full retrieval experiment, the chemistry transport model (CTM), namely Modèle de Chimie Atmosphérique à Grande Echelle (MOCAGE), serves as a key element of the pseudo-reality, providing the spatio-temporal distribution of key atmospheric aerosol chemical species. MOCAGE is a three-dimensional global and regional CTM initially developed by Météo-France (El Amraoui et al., 2020; Guth et al., 2016). It is used for data assimilation (El Amraoui et al., 2010), tropospheric-stratospheric composition (El Amraoui et al., 2020), air quality forecasting, and climate change research, among other areas. It can be run at several configurations with various geometric domains, resolutions, and for physical and chemical parameterization. Emissions, meteorological fields, and atmospheric composition are the primary inputs of the MOCAGE model.
MOCAGE's chemical composition is represented at 47 vertical levels, extending from the surface to 5 hPa, with vertical resolutions ranging from 40 to 400 m in the boundary layer and from 400 to 800 m in the free troposphere. The model's horizontal resolution depends on the scale: local (0.5°×0.5°), regional (0.1°×0.1°), and global (1 or 2°). Although MOCAGE cannot calculate meteorological variables, it can directly extract them from other models, such as the IFS model, ARPEGE, ERA-INTERIM, and ARPEGE-Climat. Modelled aerosol species for this study include black carbon (BC), organic carbon (OC), desert dust (Du), sea salt (SS), sulfate (Su), nitrate (Ni), and ammonium (Am). As described in El Amraoui et al. (2020), these species are represented using the schemes of Martet et al. (2009) and Sič et al. (2015), with the secondary inorganic aerosols (Su, Ni, Am) following the parameterizations of Guth et al. (2016). The atmospheric composition is further defined by the assimilation of MODIS Aerosol Optical Depth (AOD) data to constrain the aerosol fields within the 3D-FGAT variational assimilation framework (El Amraoui et al., 2022). Biomass-burning sources of BC and OC aerosols used in this study are the same as those used in Sič et al. (2016), and are based on a daily frequency from the Global Fire Assimilation System (GFAS) (Kaiser et al., 2012). More details regarding this specific model configuration and the treatment of aerosol sources can be found in El Amraoui et al. (2022).
By simulating the spatio-temporal distribution of the most abundant aerosol species and their interactions with atmospheric processes, MOCAGE serves as a realistic proxy for real-world observations. This synthetic environment enables testing and validation of retrieval techniques while providing a reliable standard (i.e., pseudo-reality) against which to compare them. In particular, MOCAGE outputs provide aerosol mass concentration profiles (in µg m−3) of six species: BC, OC, Am, Su, Du, and SS. MOCAGE data is extracted along the trajectories of the study's targeted geographical transects. As a first illustration, we use a transect observed by the CALIOP (Cloud-Aerosol LIDAR with Orthogonal Polarization) instrument on 15 May 2020 (see Fig. 3), measuring the aerosol vertical distribution over the Indian Ocean (Indian-O), Bangladesh, Tibetan Plateau (TP), Taklamakan Desert (TD), Kazakhstan, Russia, Arctic Ocean (Arctic-O), and then reaching Greenland. During this day, significant aerosol diversity is remarked along the trajectory, ensuring a robust case study for comparison and an adequate evaluation of the retrieval method's performance.
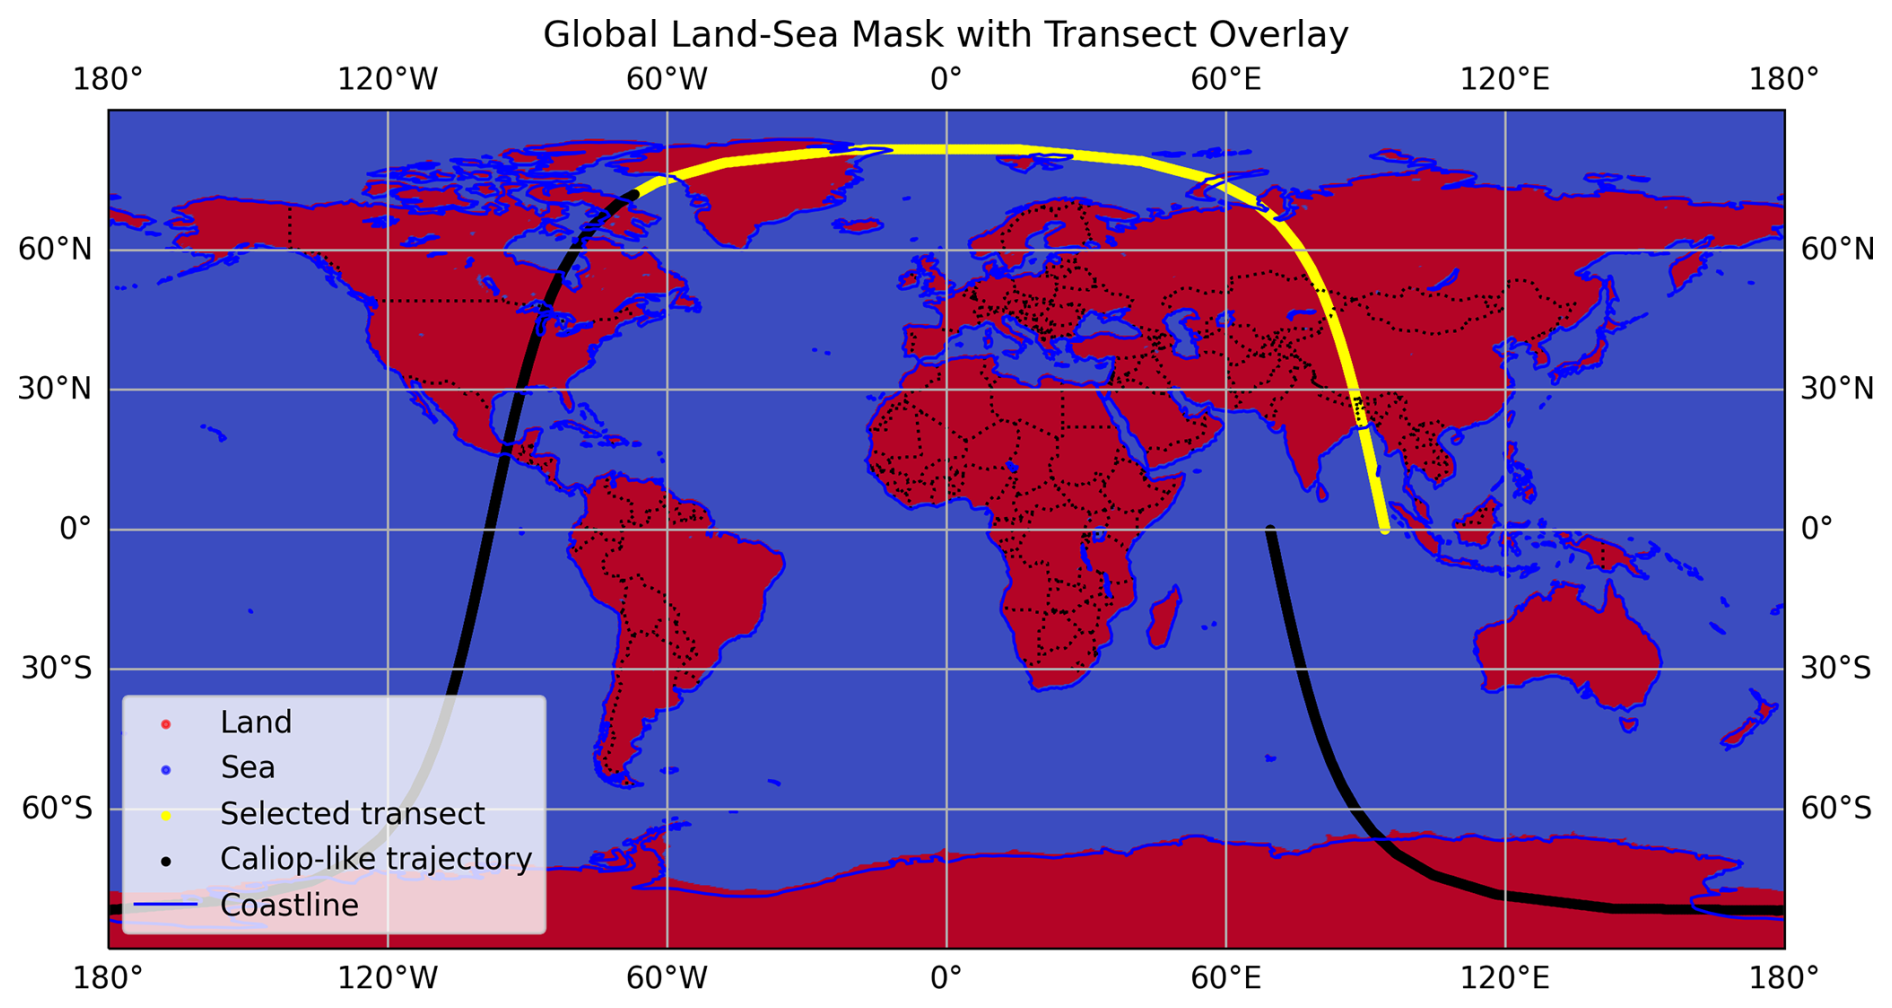
Figure 3The selected transect extracted from MOCAGE data along the CALIOP-like trajectory and interpolated to match the spatial and temporal resolution of the observations on 15 May 2020 passing by the Indian Ocean, Bangladesh, Tibetan Plateau (TP), Taklamakan Desert (TD), Kazakhstan, Russia, Arctic Ocean, then reaching Greenland.
2.1.2 Aerosol species considered in the pseudo-reality
In this work, the pseudo-reality considers eight distinct aerosol chemical species: black carbon (BC), brown carbon (BrC), inorganic salt (IS), fine-mode water content (WCF), quartz (Qz), iron oxide (IO), sea salt (SS), and coarse-mode water content (WCC). These species correspond to those that can be optically distinguished with advanced satellite measurements (Dubovik et al., 2021) and they are derived from MOCAGE primary aerosols (BC, OC, SS, Du) and secondary inorganic aerosols (Ni, Su, and Am). The correspondence between MOCAGE outputs and the AEROCHEMPro species is summarized in Table 1 and described in the next paragraphs.
Table 1Species and their properties, combining MOCAGE-CTM output and AEROCHEMPro inputs.
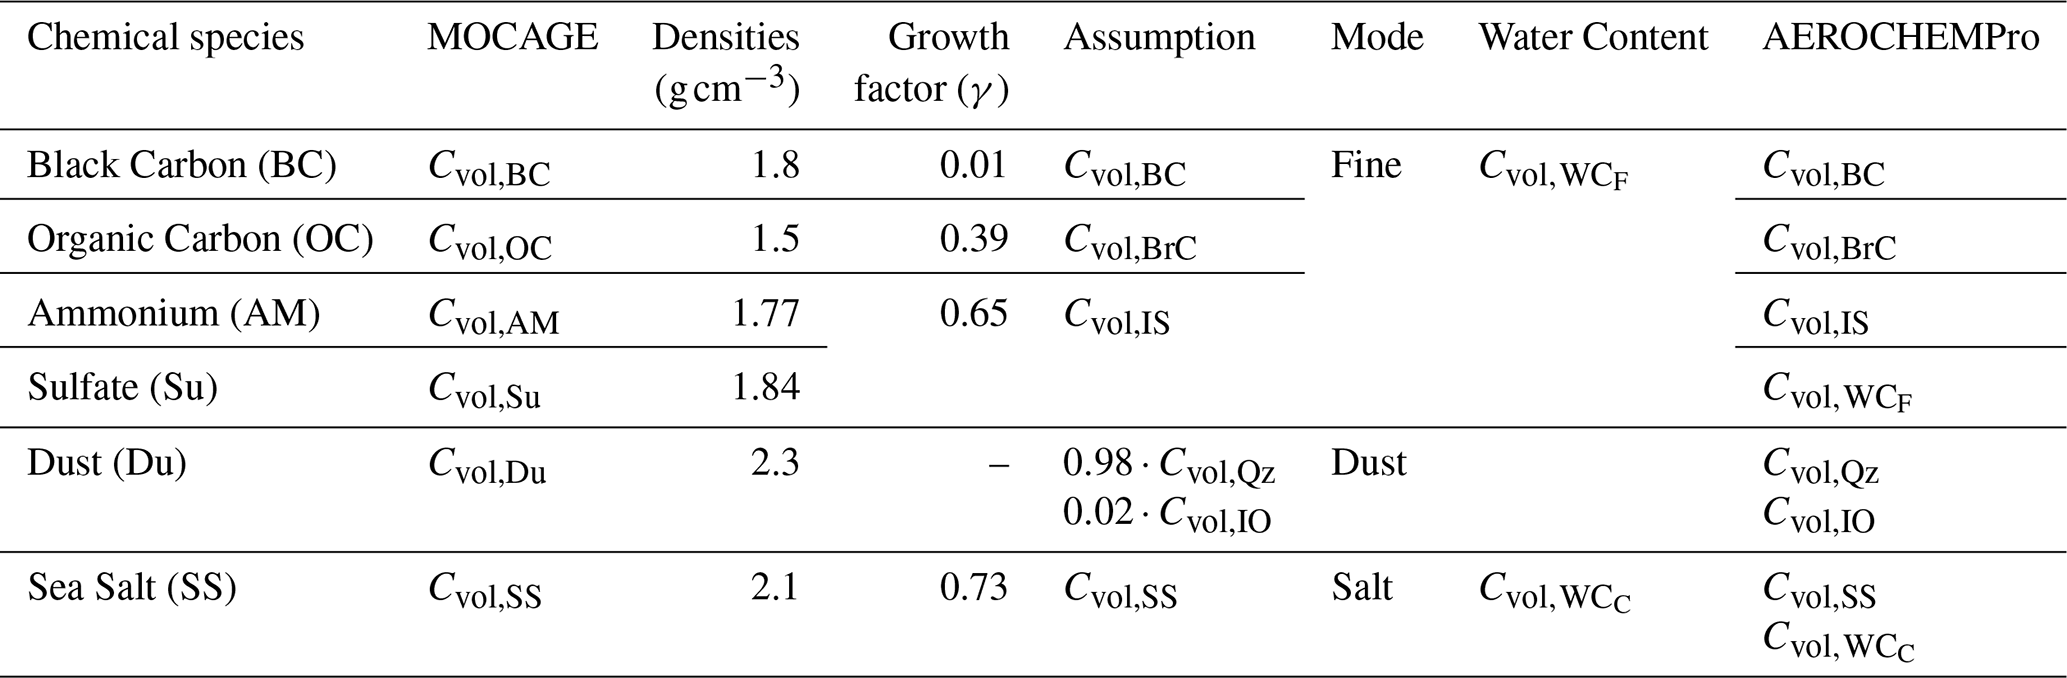
To obtain the aerosol properties considered in the pseudo-reality, the first step is to convert the dry mass concentrations (Cmass) of the species, calculated as outputs of the MOCAGE model, into dry volume mixing ratios (Cvol) using the known densities of each species (ρi). The general relationship used is:
where Cmass is the mass concentration in µg m−3 and ρi is the density of the species, expressed here in µg m−3. The species and their corresponding densities are listed in Table 1. Each species' mass concentration is divided by its corresponding density to yield unitless aerosol volume mixing ratios. This step is essential for comparing the contribution of different species to the total aerosol volume.
After calculating the volume mixing ratio of each species from the MOCAGE model at each altitude, some modifications of the aerosol chemical species are considered. They allow alignment with those to which polarimeter measurements are sensitive and that are intended to be retrieved using the AEROCHEMPro/GRASP algorithm. We consider concentrations of inorganic salts (IS), which are assumed to be the sum of the concentrations of those simulated by MOCAGE for ammonium and sulfate (as polarimeter measurements do not allow us to distinguish these two species). Black carbon (BC) and sea salt (SS) remain unchanged, with their respective volume mixing ratios carried over directly. A second carbonaceous species within the pseudo-reality is brown carbon (BrC), whose abundance is assumed to equal that of organic carbon for simplicity. For mineral dust, specific fractions are defined based on its composition: Iron oxide (IO) and quartz (Qz) are represented as 2 % and 98 % of the total dust concentration simulated by MOCAGE, respectively; these fractions follow the typical values adopted from Li et al. (2019). This redefinition enables consistent comparisons between aerosol species in the pseudo-reality and those retrieved from AEROCHEMPro/GRASP, thereby facilitating the analysis of aerosol properties and their radiative effects.
The choice of these aerosol chemical species is a refinement of previous works that exploits measurements of either the AERONET sun photometer or the POLDER multi-angular polarimeter (Dubovik et al., 2021; Li et al., 2019, 2020a, b). In these previous studies, the method is called GRASP/Component approach considering BC, BrC, fine- and coarse-mode non-absorbing soluble and insoluble particles, coarse-mode absorbing particles, and aerosol water content. In the current work, we distinguish between the water content for fine (BC, BrC, and IS) and coarse (SS) hydrophilic species. Non-absorbing soluble fine and coarse particles are identified as inorganic salts (IS) and sea salt (SS), while dust particles are composed of IO and Qz.
2.1.3 Water content estimation
To estimate the mixing ratio of water content absorbed by aerosol particles, we first calculate the humidified volume of hygroscopic species based on ambient relative humidity (RH). Since aerosol particles take up water with increasing RH, we correct the dry volume mixing ratios accordingly, particularly for species such as ammonium sulfate and sea salt. The growth factor, GF, depends on the ambient RH and is applied to the fine and sea-salt modes. Note that this correction modifies the particle volume ratios to account for water uptake, but the particle radii themselves are not explicitly adjusted.
The hygroscopic growth factor GF(RH) is estimated using the Hänel (1976) parameterization, which quantifies the increase in particle size/volume with increasing relative humidity (RH). The growth factor GFmin, with respect to the particle size at RHmin, is defined as:
Since direct comparisons require a standard reference RH, the growth factor is further scaled to a reference RH of RHref=40 % (without hygroscopic growth), following recommendations from previous studies:
where RHmin corresponds to the minimum RH in each pixel, and γ is the hygroscopic growth parameter value, as listed in Table 1. This method for calculating the growth factor follows Sicard et al. (2022), who applied it to a multi-wavelength lidar system to study aerosol hygroscopicity. It ensures consistency across different humidity conditions and captures water uptake of hygroscopic aerosol species, such as inorganic and sea salts.
For each hygroscopic species, the aerosol water content is determined as the difference between the ambient humidified volume and the dry volume:
where Cvol (RH), the volume mixing ratio of species i at ambient humidity, is given by:
and Cvol,i is its original dry volume mixing ratio. The total water content in each mode is obtained by summing the contributions from all hygroscopic species within that mode.
2.1.4 Volume size distribution estimation
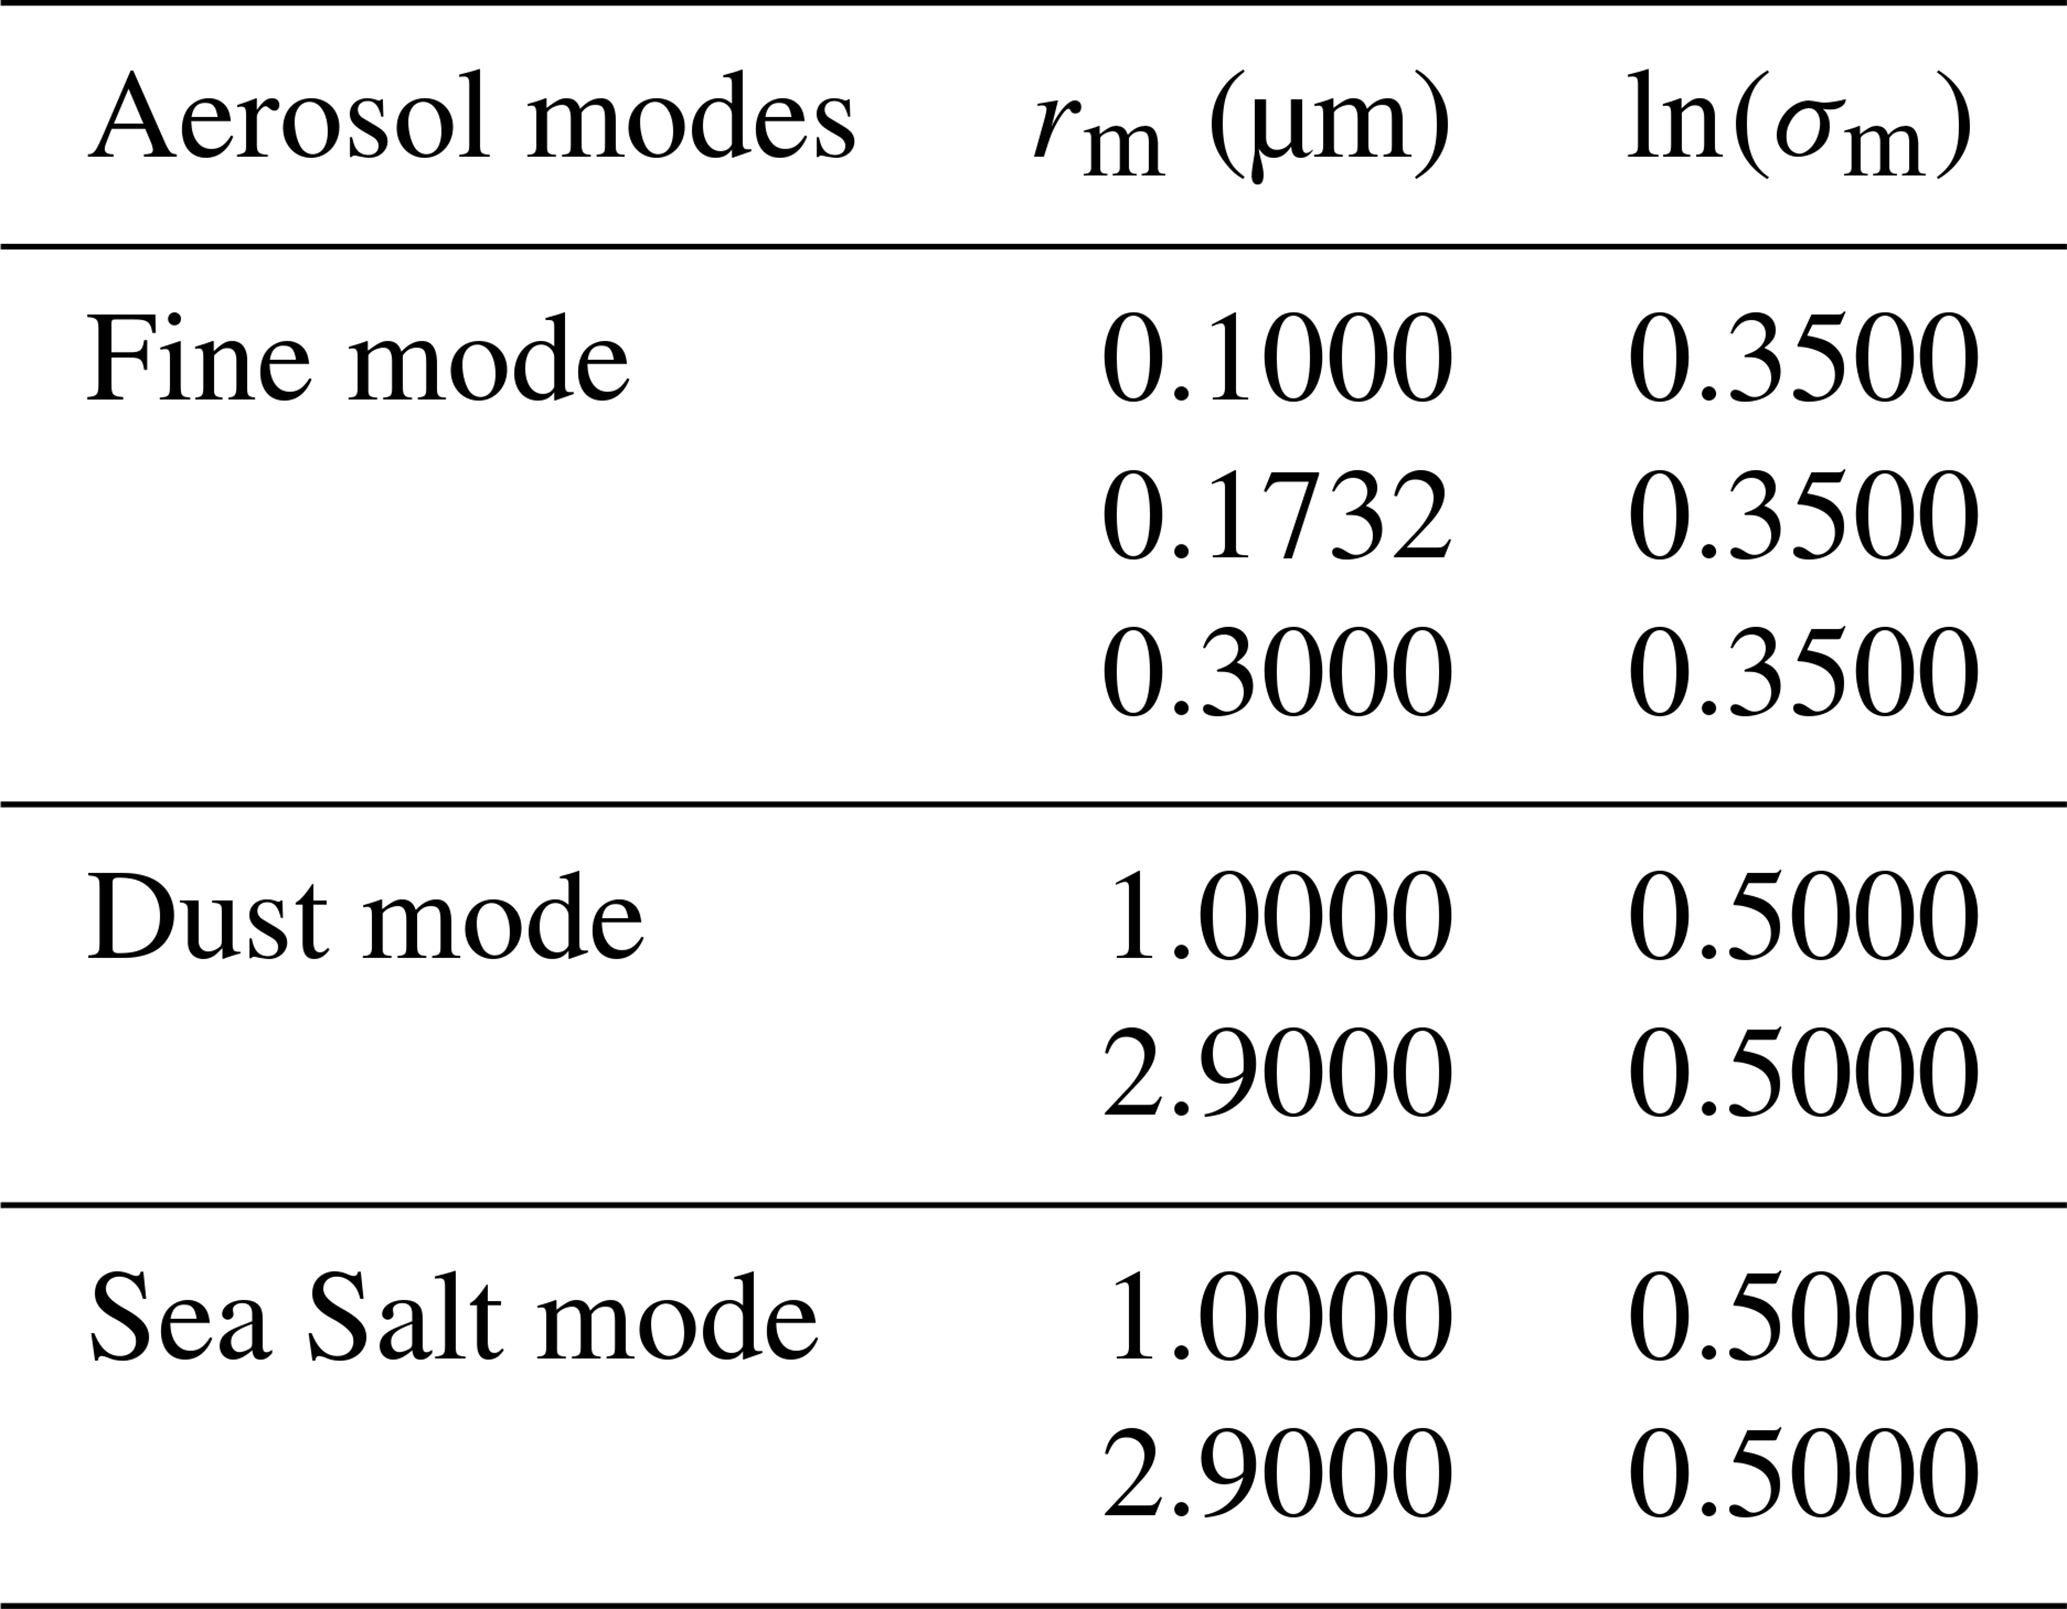
The volume size distribution for each aerosol mode is derived by distributing the mode's total volume mixing ratios across multiple size bins. In this approach, the aerosol volume in each size bin is obtained by multiplying a predefined weighting factor (cm) – representing its relative contribution – by the modeled total volume for that mode. This ensures that the shape of the assumed log-normal distribution is preserved, while its magnitude adapts to the local aerosol load at each pixel. A total of seven size bins are considered: three for the fine mode, two for dust, and two for sea-salt aerosol modes. The corresponding mean radii and the geometric standard deviations are shown in Table 2. The weighting factors (cm) are chosen to mimic the average AERONET-retrieved size distributions reported by Dubovik et al. (2002). This configuration produces a total size distribution that resembles the average size distribution of the fine mode for urban and biomass-burning aerosols reported by Dubovik et al. (2002), peaking at a modal radius of approximately 0.17 µm and a geometric width of the log normal distribution of about 0.45. Likewise, the coarse mode closely resembles the characteristics of dust and oceanic aerosols described by Dubovik et al. (2002), peaking around 2.71 µm with a width of roughly 0.6.
Table 2Modal radii (rm) and standard deviations (ln (σm)) of lognormal volume size distribution for each size bin associated with the Fine, Dust, and Sea Salt aerosol modes. These values are adapted from Dubovik et al. (2011, 2006), and Lopatin et al. (2021).
2.1.5 Aerosol sphericity
In this study, aerosol sphericity is assumed for each species based on its physical properties, as reported in previous studies. We quantify it as a spherical fraction, where 1 represents pure spheres, and 0 represents pure spheroids (the assumed shape for non-spherical particles). Fine particles corresponding to inorganic salt, brown carbon, and black carbon are considered as optically spherical, thus their spherical fraction is taken as 0.9999, consistent with the approach of Dubovik et al. (2006). Similarly, the spherical fraction for sea salt is considered to be 0.9999, as they are known to be highly spherical due to their hygroscopic nature and formation processes (Dubovik et al., 2006). In contrast, dust species (quartz and iron oxide) account for the irregular shapes of mineral dust particles, assigning a near-zero spherical fraction of 0.01. These particles originate from natural mechanical processes, such as erosion and transport, that result in non-spherical shapes (Kandler et al., 2009).
2.1.6 Surface reflectance
To derive aerosol properties from passive measurements, it is necessary to account for surface reflectance properly. In our study and the GRASP environment, land surface reflectance is represented using the Bidirectional Reflectance Distribution Function (BRDF), which follows the kernel-driven Ross-Li model (Li and Strahler, 1992; Roujean et al., 1992; Wanner et al., 1995) in combination with a semi-empirical formulation of the BPDF (Maignan et al., 2009). Over ocean surfaces, the reflective properties are modeled similarly to earlier approaches used in the POLDER algorithm (Deuzé et al., 2001; Herman et al., 2005; Tanré et al., 2011). The Cox and Munk model (Cox and Munk, 1954) accounts for Fresnel reflection from the roughened sea surface.
While GRASP allows joint retrieval of surface and aerosol properties (Dubovik et al., 2021), we adopted a constrained single-pixel retrieval strategy for this baseline evaluation. Surface parameters were jointly adjusted in the state vector. On the other hand, they were initialized with spatially uniform values across the transects and subject to strong a priori constraints (Lagrange multipliers), thus significantly limiting their spatial variability during retrievals. Specifically, a high weight was assigned to the spatial variability constraint of the polarized surface component and the BRDF kernels to maintain stability (See Table 6 for details). This configuration effectively minimizes pixel-to-pixel surface variability, allowing the inversion to focus on the vertical aerosol speciation without significant interference from surface-aerosol signal mixing. We acknowledge that this approach represents an idealized scenario; while it establishes a theoretical performance baseline for AEROCHEMPro, future work will involve more flexible surface-atmosphere retrievals to explicitly capture the complexities of heterogeneous terrain.
2.2 Lidar and polarimeter pseudo-observations
The next step in the AOS innovative retrieval experiment is the calculation of lidar and polarimeter level-1 pseudo-observations based on the pseudo-reality (Sect. 2.1) and illustrated in Fig. 4, together with the additional assumptions (Sects. 2.2.1–2.2.4), and instrumental characteristics (Sects. 2.2.5 and 2.2.6). This is performed with a forward radiative transfer model integrated within the GRASP environment (Dubovik et al., 2021). Within this model, aerosol optical properties are derived using kernels pre-calculated with T-matrix, Mie, and geometrical optics codes for spherical and spheroidal particles, covering a broad range of complex refractive indices, size parameters, and non-sphericity (Dubovik et al., 2006). More details on this forward model are provided in previous studies (Dubovik et al., 2011, 2021; Li et al., 2019; Lopatin et al., 2013). These optical calculations require both the aerosol characteristics provided by the pseudo-reality and further considerations on how aerosol profiles are represented and on how aerosol species are mixed to estimate their refractive indices (respectively, Sects. 2.2.1, 2.2.3, and 2.2.4). These atmospheric and surface optical properties are used to calculate noise-free instrumental signals with the radiative transfer model. In this study, all synthetic observations were calculated within the principal plane geometry. In this configuration, the solar and viewing vectors are co-planar, and the Stokes U component is essentially zero. This provides an idealized polarimetric signal, allowing us to isolate the sensitivity of the Q component to aerosol microphysics and chemical speciation. While this represents a “best-case scenario” for polarimetric retrieval, it serves as a necessary baseline for evaluating the vertical profiling capability of the AEROCHEMPro framework. Then, pseudo-observations are generated by adding random noise based on the lidar and polarimeter instrumental characteristics (Sects. 2.2.5 and 2.2.6).
2.2.1 Three modes for aerosol vertical profiles
LUCE lidar measurements are not expected to provide sufficient information to distinguish all the aerosol chemical species considered in AEROCHEMPro vertically. They are typically used to distinguish between aerosol types with clearly different lidar-derived optical properties (e.g., Qayyum et al., 2026). Therefore, we assume a simplified representation of the vertical distribution of the aerosol chemical species, categorizing them into three modes based on their size distribution and sphericity. A so-called “fine mode” is the mixture of black carbon, brown carbon, inorganic salt, and the water uptake associated with these species. A “dust mode” includes mineral non-spherical coarse compounds of desert dust, corresponding here to iron oxide and quartz. A third one, called “sea-salt” mode, is composed of spherical coarse sea salt and the water it absorbs. Each of these three modes is represented by an independent vertical profile of aerosol total volume mixing ratio, a size distribution, and specific mixing rules for determining the refractive index (see Sects. 2.2.2–2.2.4). This distinction between several aerosol modes' vertical profiles and their chemical composition is enabled by the multispectral synergism of radiance and depolarization measurements, which allow for a more detailed separation of aerosol species across fine, dust, and sea-salt modes.
We describe the abundance of each aerosol species as a volume fraction of each of the three aerosol modes. These fractions are computed by normalizing the vertically integrated volume mixing ratios of each species provided by the pseudo-reality by the total volume of the mode to which it belongs. A trapezoidal integration is performed over the vertical layers of the atmosphere, and the total column volume fraction (Fraci) for a species is given by:
where Cvol,i and Cvol,mode are the volume mixing ratios of the aerosol species i and the total volume mixing ratios of mode it integrates.
Moreover, calculations consider and normalize vertical profiles of each mode (Profmode(z)) independently. By normalizing the vertical distribution of a given mode (Cvol,mode(z)) with respect to its column-integrated total concentration (Cvol,mode,tot), the profile distribution is expressed as:
where zmax is the height of the atmospheric top, here considered as ∼20 km, and a vertical step of 150 m.
2.2.2 Lognormal size distribution parameters for precomputed size bins
For the size distribution, we use a log-normal representation pre-calculated in GRASP, where the size distribution is expressed by a set of size bins with associated volume fractions. Although earlier texts refer to “five lognormal modes”, our GRASP configuration actually implements three retrieved modes (fine, coarse spherical, and coarse non-spherical) whose size is represented by a total of seven size bins (independent parameters): three size bins representing the fine mode, two bins for dust (coarse non-spherical) mode, and two bins for the sea-salt (coarse spherical) mode. Thus, the theoretical number of independent parameters for the size distribution in this setup is 7 (3 fine + 2 sea-salt + 2 dust), which are jointly derived with the other aerosol properties in the inversion procedure. Each of the seven size bins corresponds to a log-normal size distribution with specific modal radii and widths presented in Table 2.
2.2.3 Aerosol mixing rules
A volume-weighted (VW) mixing rule is used in this study as an empirical method for estimating the complex refractive index of an “internally mixed” aerosol mixture. This rule calculates an effective refractive index as a volume-weighted average of the real and imaginary parts of the index, based on the proportions of the individual compounds in the mixture. Within the GRASP/Component framework, the VW mixing rule has been integrated by Li et al. (2019). It is expressed as:
where nmode and kmode are the real and imaginary parts of the refractive index of the fine, dust, and sea-salt modes, and ni and ki those of the chemical species composing these modes.
2.2.4 Refractive indices of each aerosol chemical species
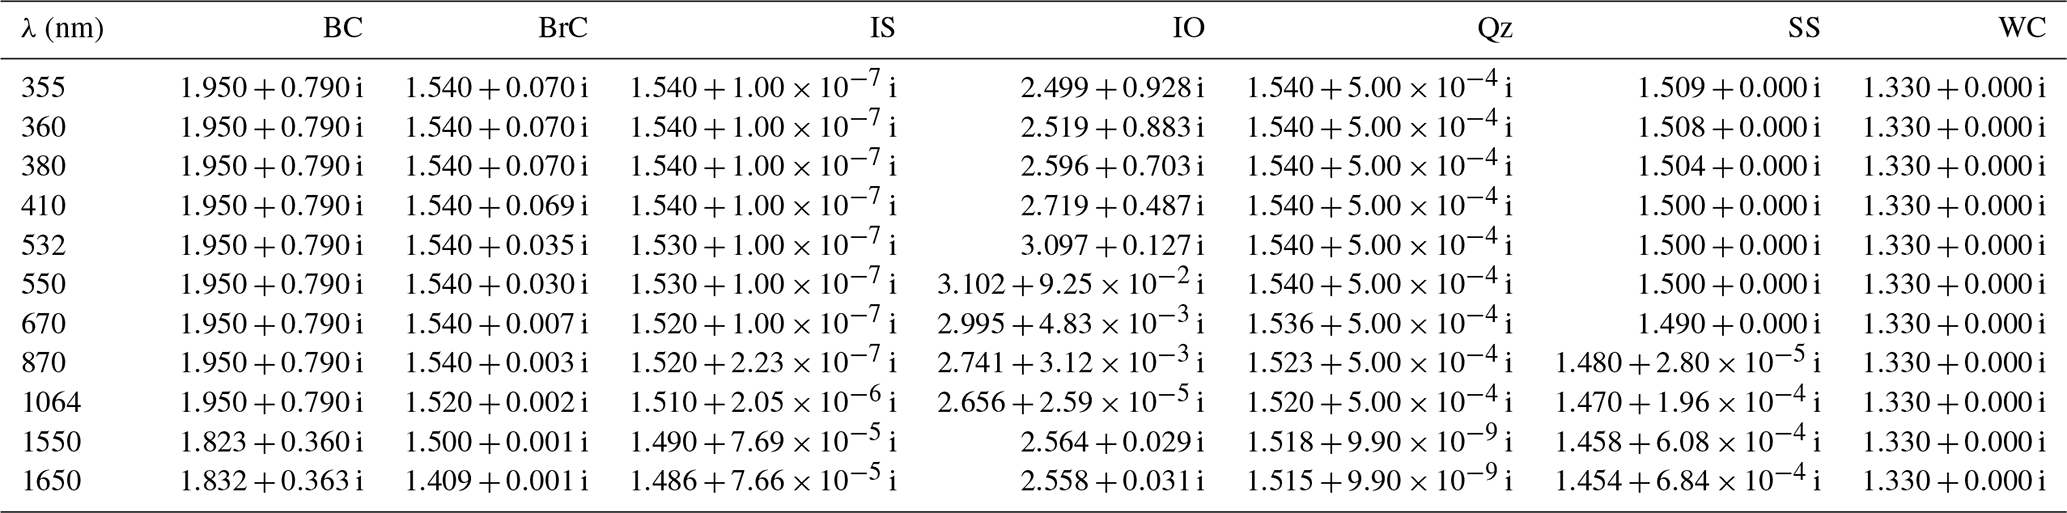
The complex refractive index values for all aerosol species in the pseudo-reality, spanning wavelengths from 355 to 1650 nm, are listed in Table 3. These values are taken from Longtin et al. (1988), Bond and Bergstrom (2006), Querry (1987), Shettle and Fenn (1979), and Sun et al. (2007). In the current work, we consider these refractive indices for each species both in the pseudo-reality and the retrievals. Therefore, the performance analyses shown here are rather optimistic regarding the ability to distinguish different aerosol species. Other works considering aerosol typing from lidar alone (Qayyum et al., 2026) suggest a moderate effect on retrievals due to differences in intensive aerosol properties (size distribution and refractive indices) between the pseudo-reality and the retrievals. Future work will further analyze these aspects.
Table 3Refractive indices used for each aerosol chemical species were interpolated from 355 to 1650 nm in the AEROCHEMPro approach.
2.2.5 Instruments
LUCE multiwavelength Lidar
The active remote sensing sensor used in this study is the LUCE multiwavelength lidar (Di Girolamo et al., 2023, 2024), formerly called CALIGOLA (which stands for Cloud Aerosol Lidar for Global Scale Observations of the Ocean-Land-Atmosphere System). LUCE is a spaceborne multiwavelength lidar with potentially Raman capabilities developed by the Italian Space Agency (ASI), in collaboration with the National Aeronautics and Space Administration (NASA), designed to study interactions within the ocean–land–atmosphere system (Behrenfeld et al., 2023; Franco et al., 2023; Di Girolamo et al., 2023, 2024). The mission's scientific objectives include (1) investigating atmospheric and oceanic processes, (2) measuring key geophysical variables from space, and (3) satisfying stringent requirements on accuracy, precision, vertical and horizontal resolution, and sounding range. As no real measurements from LUCE are yet available, simulated lidar data are generated using the GRASP forward model configured to replicate LUCE's instrument characteristics. LUCE's laser emission operates at three wavelengths (354.8, 532.2, and 1064.4 nm) to measure the attenuated backscatter and depolarization ratios at these wavelengths (Di Girolamo et al., 2023, 2024), providing both daytime and nighttime measurements (see Table 4). An additional Raman channel in the UV is proposed for nighttime aerosol retrievals. However, we only consider the elastic channels of attenuated backscatter and the depolarization ratio of LUCE in the current work, as synergism with a polarimeter is only possible during daytime (when the Raman channel is not likely to provide useful information). LUCE combines high-energy multi-wavelength lasers – 157 mJ at 354.8 nm, 47 mJ at 532.2 nm, and 144 mJ at 1064.4 nm – with a large 1 m telescope, 51 Hz pulse rate, and 8–22 m surface footprint (Di Girolamo et al., 2023, 2024). This configuration delivers higher photon collection efficiency and significantly larger signal-to-noise ratio (SNR) compared to CALIOP (532 nm at 110 mJ, 1064 nm at 230 mJ, same aperture, 20.25 Hz PRF, ∼333 m shot spacing; Winker et al., 2009) and ATLID (355 nm at ∼35 mJ, effective ∼70 mJ, 0.62 m telescope, ≈0.302 m2 area, 51 Hz nominal, 25.5 Hz effective; Illingworth et al., 2015; Feofilov et al., 2023). LUCE's higher repetition rate than CALIOP improves along-track and vertical sampling, while its three wavelengths offer richer spectral discrimination than CALIOP's two and ATLID's single wavelength. The large aperture and high UV energy enhance aerosol detection in optically thin and high-altitude layers, especially under daytime background, whereas ATLID trades energy and aperture for high-spectral-resolution lidar (HSRL) capability, and CALIOP offers strong NIR returns but coarser sampling (Winker et al., 2007; Illingworth et al., 2015).
Table 4List of measured characteristics considered in LUCE and AOS polarimeter, currently decided by ASI and NASA.
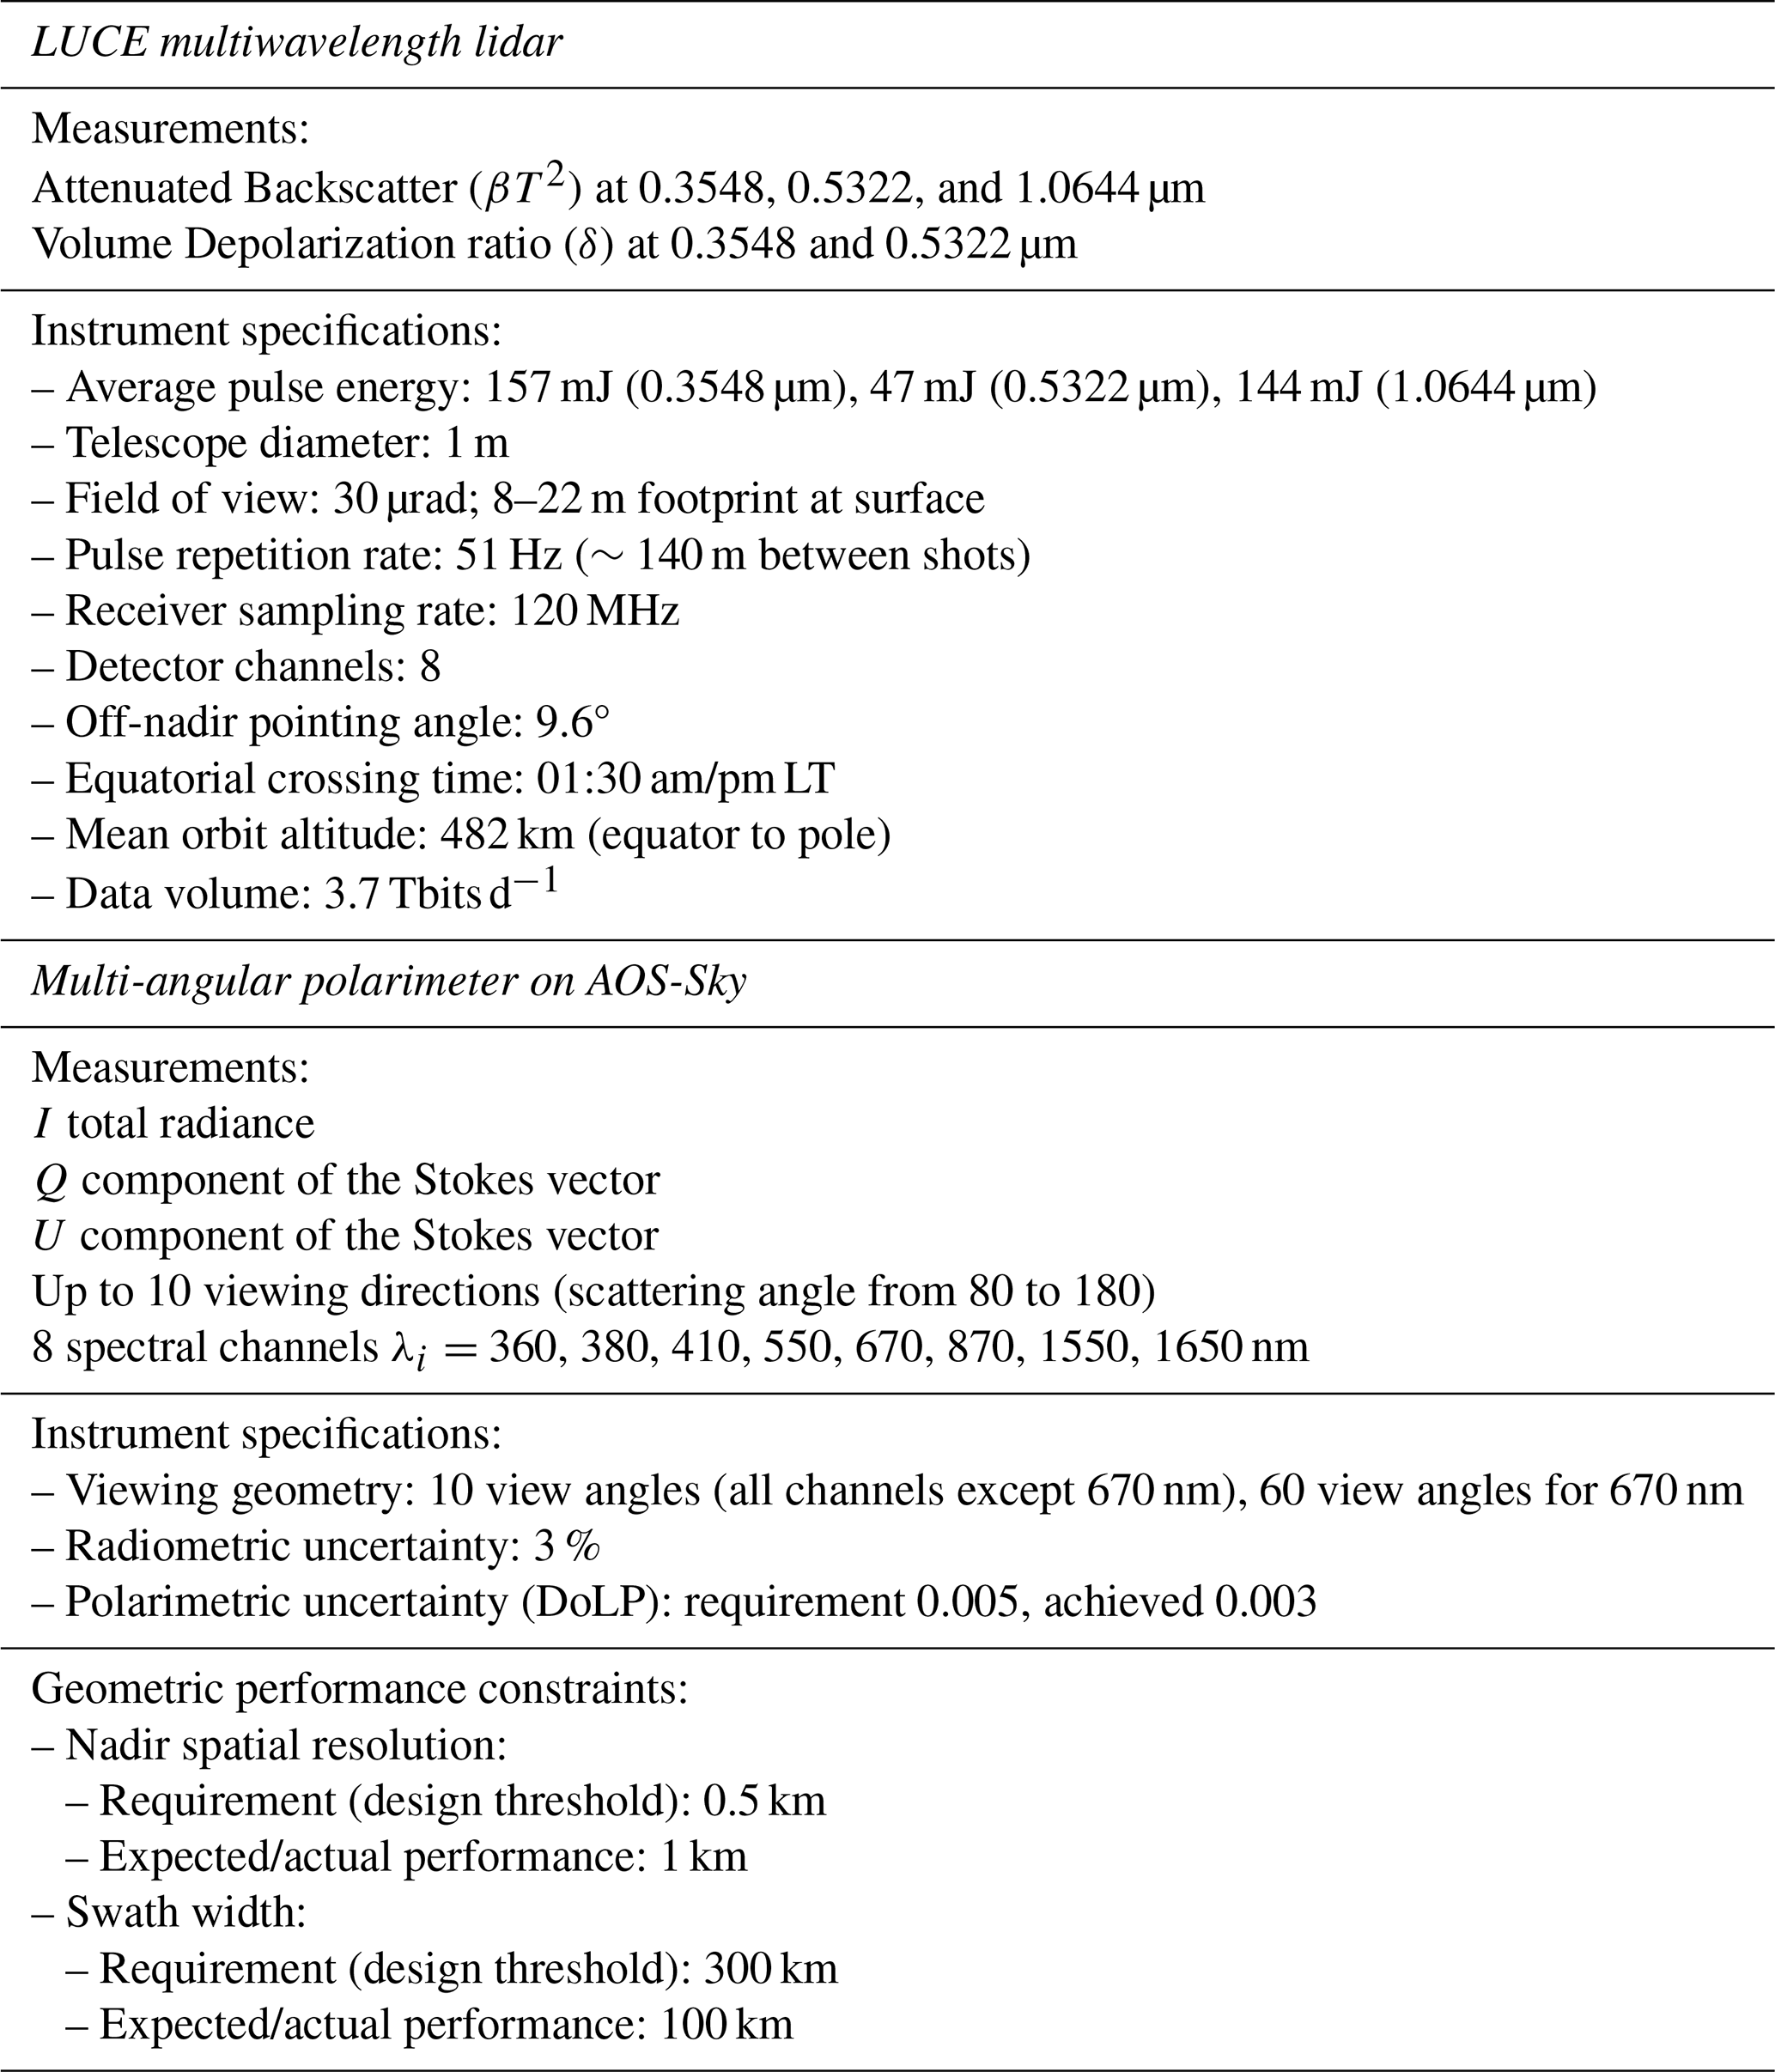
Multi-angular polarimeter onboard AOS-Sky
The polarimeter used in this study is an advanced UV-VIS-NIR-SWIR instrument designed to provide multi-angular polarized radiance measurements at multiple wavelengths. With a spatial resolution of 0.5 km and a 300 km swath, it enables large-scale, high-precision monitoring of atmospheric and surface features. The polarimeter captures radiance across eight spectral bands, ranging from 380 to 1570 nm, at 10 different viewing angles and two polarization states, significantly improving the retrieval of aerosol properties, including particle size, shape, and composition (adapted from a preliminary assessment by the AOS; AOS Study Team, 2021). Compared to earlier instruments like POLDER onboard PARASOL, which measures polarized radiance at 3 to 7 spectral bands between approximately 443 and 910 nm and at 14 viewing angles, the AOS polarimeter offers several essential improvements. Its spectral coverage extends from UV to shortwave infrared (SWIR), improving sensitivity to aerosol composition and particle size, especially for larger particles and complex mixtures. The increased number of spectral channels enhances spectral resolution. It improves the discrimination of aerosol and cloud properties. While the AOS polarimeter was designed to typically utilize 10 viewing angles – slightly fewer than POLDER – it features a specialized 670 nm channel with 60 viewing angles. This high-density angular sampling, combined with the extended spectral range into the SWIR, is expected to provide a particularly detailed characterization of the scattering phase function and aerosol microphysical retrievals. Additionally, enhanced SNR boost retrieval accuracy, particularly under challenging atmospheric conditions. Together, these advancements enable more detailed and accurate characterization of aerosol optical and microphysical properties, as well as enhanced cloud characterization compared to POLDER.
2.2.6 Noise simulation for Lidar and polarimeter measurements
A realistic noise simulation is essential for evaluating the performance of retrieval algorithms under conditions that mimic actual observations. For the LUCE lidar system, noise is modeled by a theoretical estimation of the signal-to-noise ratio (SNR) in comparison with CALIOP, which is adjusted for environmental and instrumental factors. For the polarimeter, noise is introduced to the Stokes parameters I, Q, and U to simulate uncertainties in polarimetric measurements. This approach simulates noise variances encountered in advanced polarimeters, ensuring a satisfactory representation of instrument performance.
LUCE Lidar Noise
To simulate the noise characteristics of the LUCE lidar system, we implement a methodology based on theoretical relationships derived from prior studies and calibration datasets. This approach accounts for variations in SNR across different environmental conditions and wavelengths.
An approximate relationship between the SNR of LUCE and that of CALIOP (Cloud-Aerosol Lidar with Orthogonal Polarization) is established following (Trepte et al., 2024), based on theoretical estimations accounting for background sunlight and sensor detection noises. Due to larger laser energy, a larger collection area, and a lower orbit, the SNR of LUCE is estimated to be 7.5 to 16.9 times larger than that of CALIOP at 532 nm, specifically for the LUCE channels at 355 and 532 nm. Additionally, we use an empirical relationship between CALIOP SNR for different values of attenuated backscatter coefficients taken from Mao et al. (2022). Using these two relationships, we derive LUCE's SNRs as a linear function of backscatter coefficients. We assume the same relationship for 532 nm as for 1064 nm; the specific SNR values change with the backscatter coefficient at each wavelength.
In this work, we use LUCE lidar measurements with an average horizontal resolution of ∼3.4 km and a vertical resolution of ∼200 m. To reduce the impact of random noise and ensure reliable performance of AEROCHEMPro, the lidar signals are averaged over a larger horizontal window of 50 km and a vertical window of 200 m. The corresponding noise standard deviations are calculated from the original signal-to-noise characteristics and reduced by dividing by the square root of the number of averaged points. Finally, random noise with these reduced standard deviations and zero mean is added to the noise-free signals computed by the radiative transfer model.
AOS-Sky Polarimeter Noise
The noise introduced in the polarimeter measurements is modeled to reflect the performance of an advanced multi-angle polarimeter design. For radiometric measurements, uncertainties are considered to be below 3 %. In contrast, uncertainties in the Degree of Linear Polarization (DoLP) are estimated to be less than 0.005, based on preliminary assessments by the AOS team (AOS Study Team, 2021). To evaluate the inversion performance against these mission requirements within our self-consistent simulation framework, the synthetic error model applies a 3 % relative noise floor to the total intensity (I) and an absolute noise floor of 0.005 directly to the linear polarized Stokes parameters (Q and U). This absolute configuration directly governs the target uncertainty of the mathematically derived DoLP. For bright viewing geometries where the normalized intensity baseline scales above unity (I>1), the absolute contribution of the standalone polarimetric components is suppressed, yet the combined total error on DoLP remains robust due to the simultaneous propagation of the intensity noise. Conversely, under low-signal conditions where I<1, the framework allows the simulated noise to dynamically exceed the 0.005 specification. This configuration provides a conservative signal-to-noise magnitude of the retrieval logic, guaranteeing that the framework evaluates and proves the stability of AEROCHEMPro under realistic instrument performance constraints.
2.3 The AEROCHEMPro/GRASP retrieval algorithm
The AEROCHEMPro method retrieves vertical profiles of aerosol chemical species and their optical and microphysical properties by leveraging the synergy between lidar and polarimeter measurements, using the GRASP algorithm (Fig. 5). This method simultaneously fits five lidar profiles (three attenuated backscatter profiles at 355, 532, and 1064 nm, and two depolarization ratio profiles at 355 nm, 532 nm) and 240 polarimeter measurements (spanning eight wavelengths, 10 viewing angles, and radiance with two additional polarization states). This level 1 synergism enables the joint retrieval of three distinct vertical profiles composed by six aerosol chemical species and their water uptake: a fine mode (consisting of black carbon, brown carbon, inorganic salt, and water content), a dust mode (including hydrophobic non-spherical particles such as quartz and iron oxide), and a sea salt mode (comprising sea salt spherical particles and associated water content).
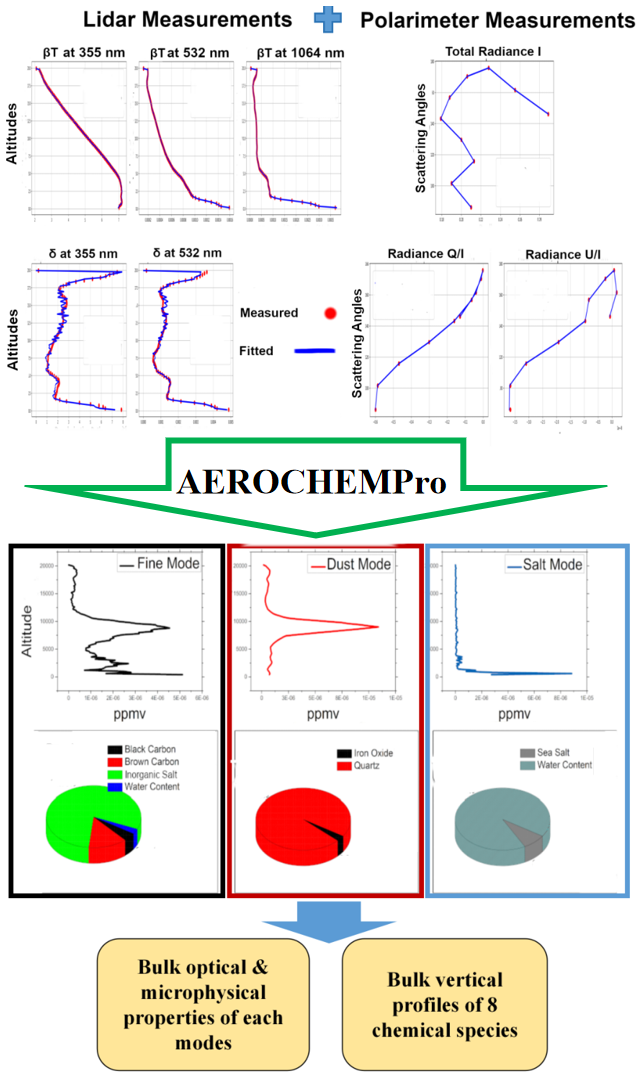
Figure 5Scheme of AEROCHEMPro retrieval method based on GRASP algorithm for deriving vertical profiles of aerosol species optical and microphysical properties using synergy of LUCE lidar-AOS Polarimeter.
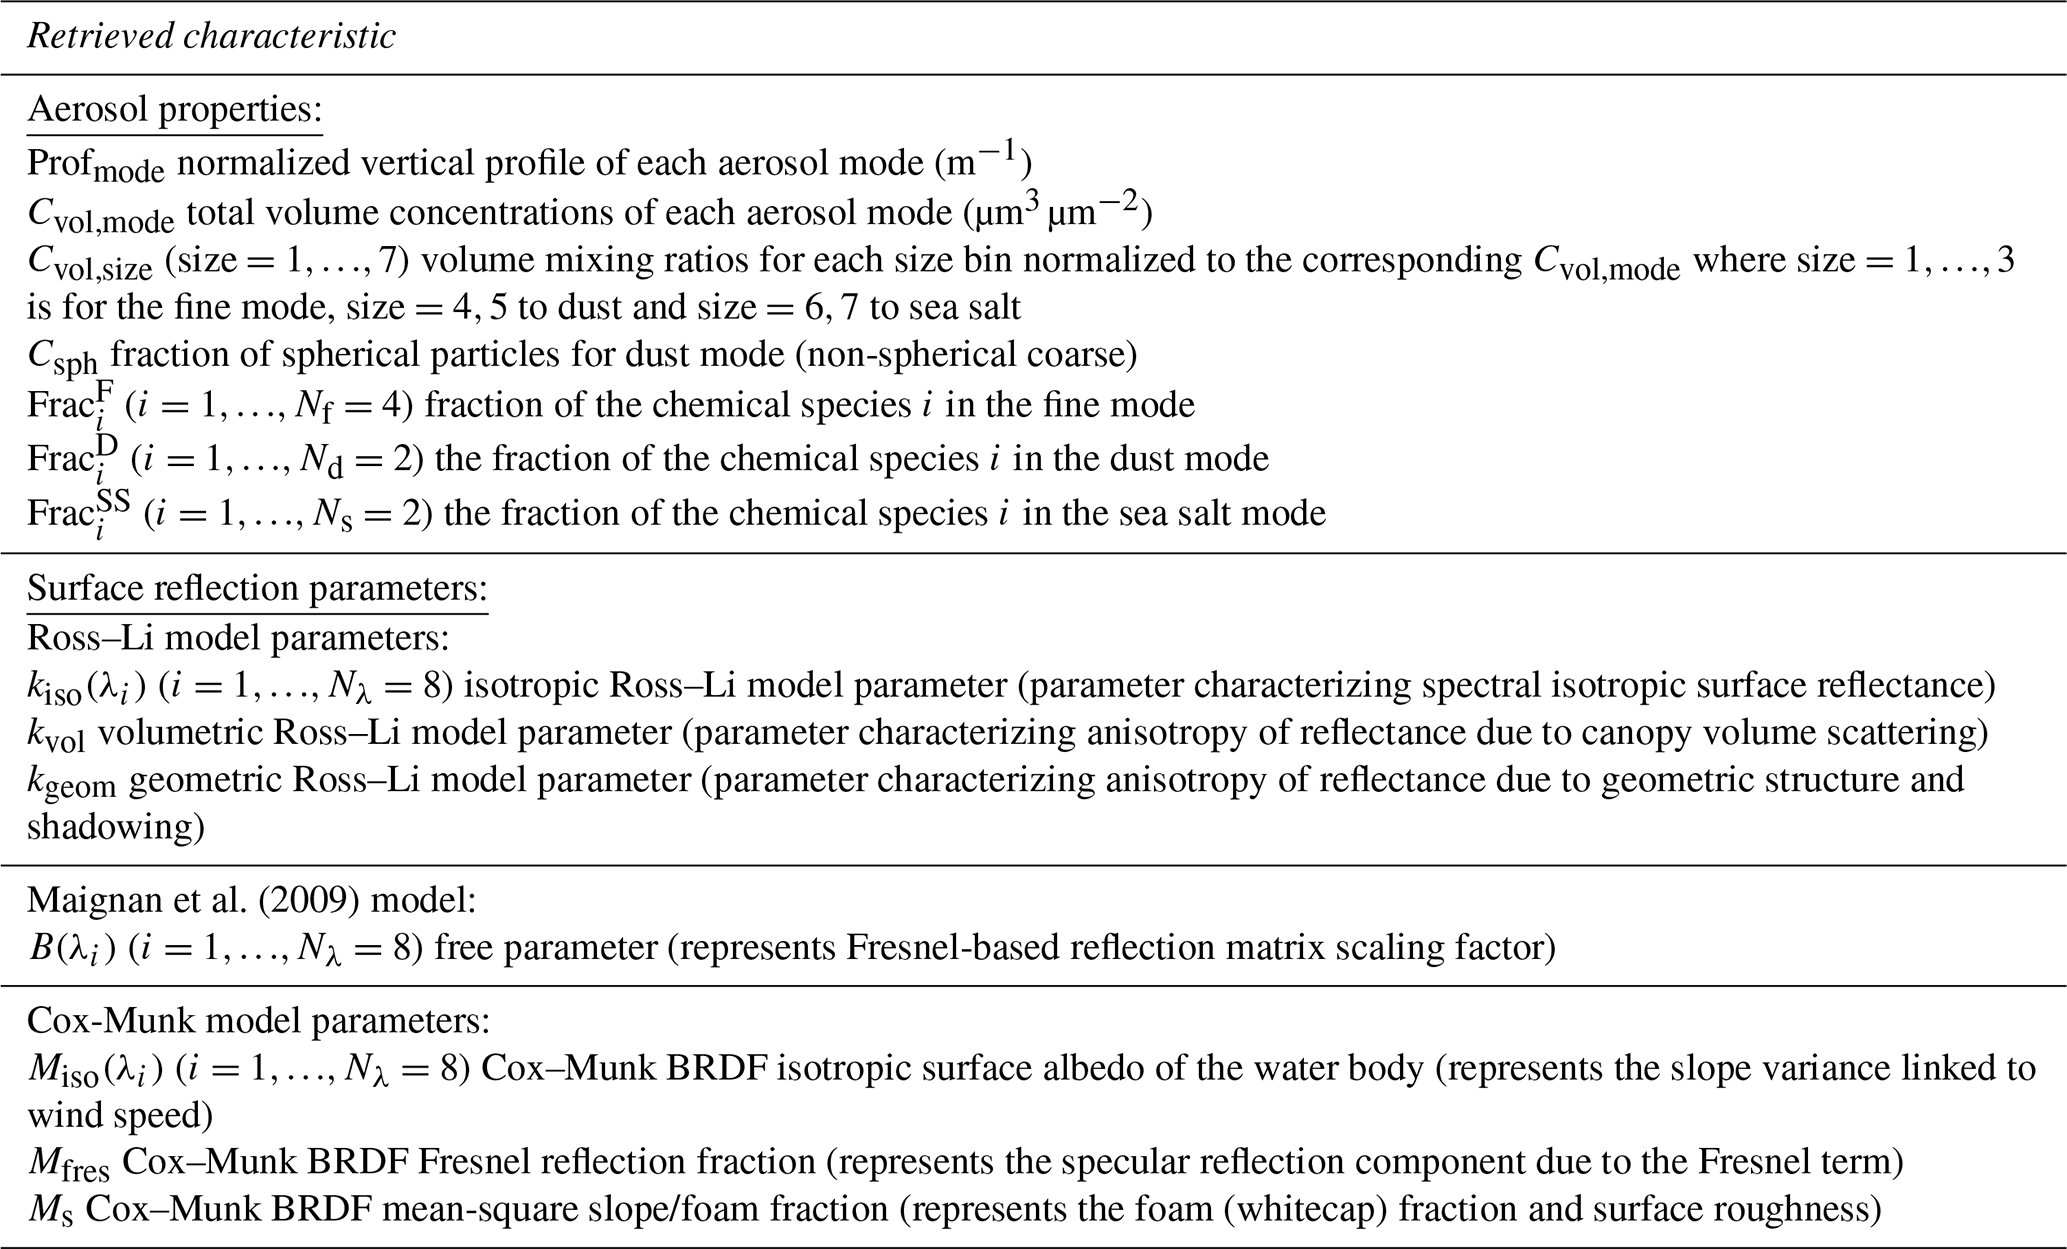
The ensemble of aerosol properties retrieved by AEROCHEMPro, which are the same variables used in the forward model to simulate measurements, is presented in Table 5. It is important to note that the forward model used to generate these pseudo-observations and the inversion framework are fully consistent; this setup establishes the theoretical baseline performance of AEROCHEMPro before introducing the complexities of real-world instrument-to-model mismatches. Thus, the current results correspond to a best-case scenario. Assuming a common normalized vertical distribution for chemical species within each mode (thus vertically constant mixing ratios), the vertical profiles of six chemical species and water uptake in fine and sea salt modes (8 profiles in total) are derived by multiplying the fractional contribution of each species by the mode's vertical profile concentration. Additionally, bulk optical and microphysical properties of the aerosol mixture are computed using the optical properties associated with each species. By integrating multi-wavelength, multi-angular, and polarized measurements using the GRASP algorithm, the AEROCHEMPro method enables advanced aerosol characterization, including the retrieval of vertical profiles of volume concentration, species fraction, aerosol optical depth, and single-scattering albedo.
Table 5List of measured characteristics considered in LUCE and AOS polarimeter currently decided by ASI and NASA.
The inversion procedure
The numerical inversion is implemented as a statistically optimized fit of observations using the multi-term least-squares method (LSM), which combines the advantages of various approaches (Dubovik et al., 2011, 2021). This strategy searches for a solution in a continuous space of solutions under statistically formulated criteria, optimizing the distribution of errors in the retrieved parameters, and it does not rely on pre-assumed potential solutions.
To achieve stable inversion, the numerical inversion module for single pixel fitting follows:
where a is called the state vector, is the LUCE and AOS polarimeter observation vector, which includes attenuated backscatter and depolarization values at 3 and 2 wavelengths, respectively, in addition to polarimeter radiance and polarization states at eight different wavelengths, fn(a) is representing the simulated observations by the forward model, and Δfn depicts the uncertainty of the observations.
In the case of AEROCHEMPro/GRASP single pixel retrieval, the retrieved state vector a is composed as follows:
where aV, afrac, aprof, asph have the following structure,
and abrdf, acox,
where F, D, and SS denote the vectors corresponding to the fine, dust, and sea salt modes.
Where the elements of the unknown vector a correspond to:
-
aV(i) denotes the aerosol size distribution (expressed as the normalized abundance of 7 size bins associated with log normal functions with fixed modal radii and widths, see Sect. 2.2.2) in 3 modes (fine, dust, sea salt);
-
aFrac,F, aFrac,D, aFrac,SS are the volume fractions of chemical species in each mode;
-
asph,F, asph,D, asph,SS contains particle sphericity fractions of fine, dust, and sea-salt modes;
-
aprof,F, aprof,D, aprof,SS represent vertical profiles of the fine, dust, and sea-salt modes;
-
abrdf,i correspond to surface bidirectional reflectance (Ross–Li model);
-
abpdf correspond to Polarized bidirectional reflectance over land (Maignan–Breon model);
-
acox,i correspond to water surface bidirectional reflectance (Cox–Munk model).
The second part of Eq. (10) describes the single-pixel a priori smoothness constraints applied to the inversion, where the denotes the zero vector, Δ(Δai) stands for the vector of the uncertainties characterizing the deviations finite differences from the zeros, and S is the matrix that includes the coefficients for calculating differences of m-th order (numerical equivalent of the derivatives of the same order). Smoothness matrix for a state vector described in Eq. (12) will have the following array structure (Dubovik et al., 2011, 2021):
where
In Eq. (12), several blocks of the smoothness matrix Sa correspond to matrices that apply smoothness constraints to specific groups of variables.
-
afrac, aprof, asph rows remain zero, as vertical profiles, species volume fractions, and sphericity are unconstrained, resulting in zeros in the corresponding rows of Sa;
-
SV is a matrix enforcing smoothness across seven size bins of three aerosol modes (fine-mode: second-order; dust and sea-salt: first-order);
-
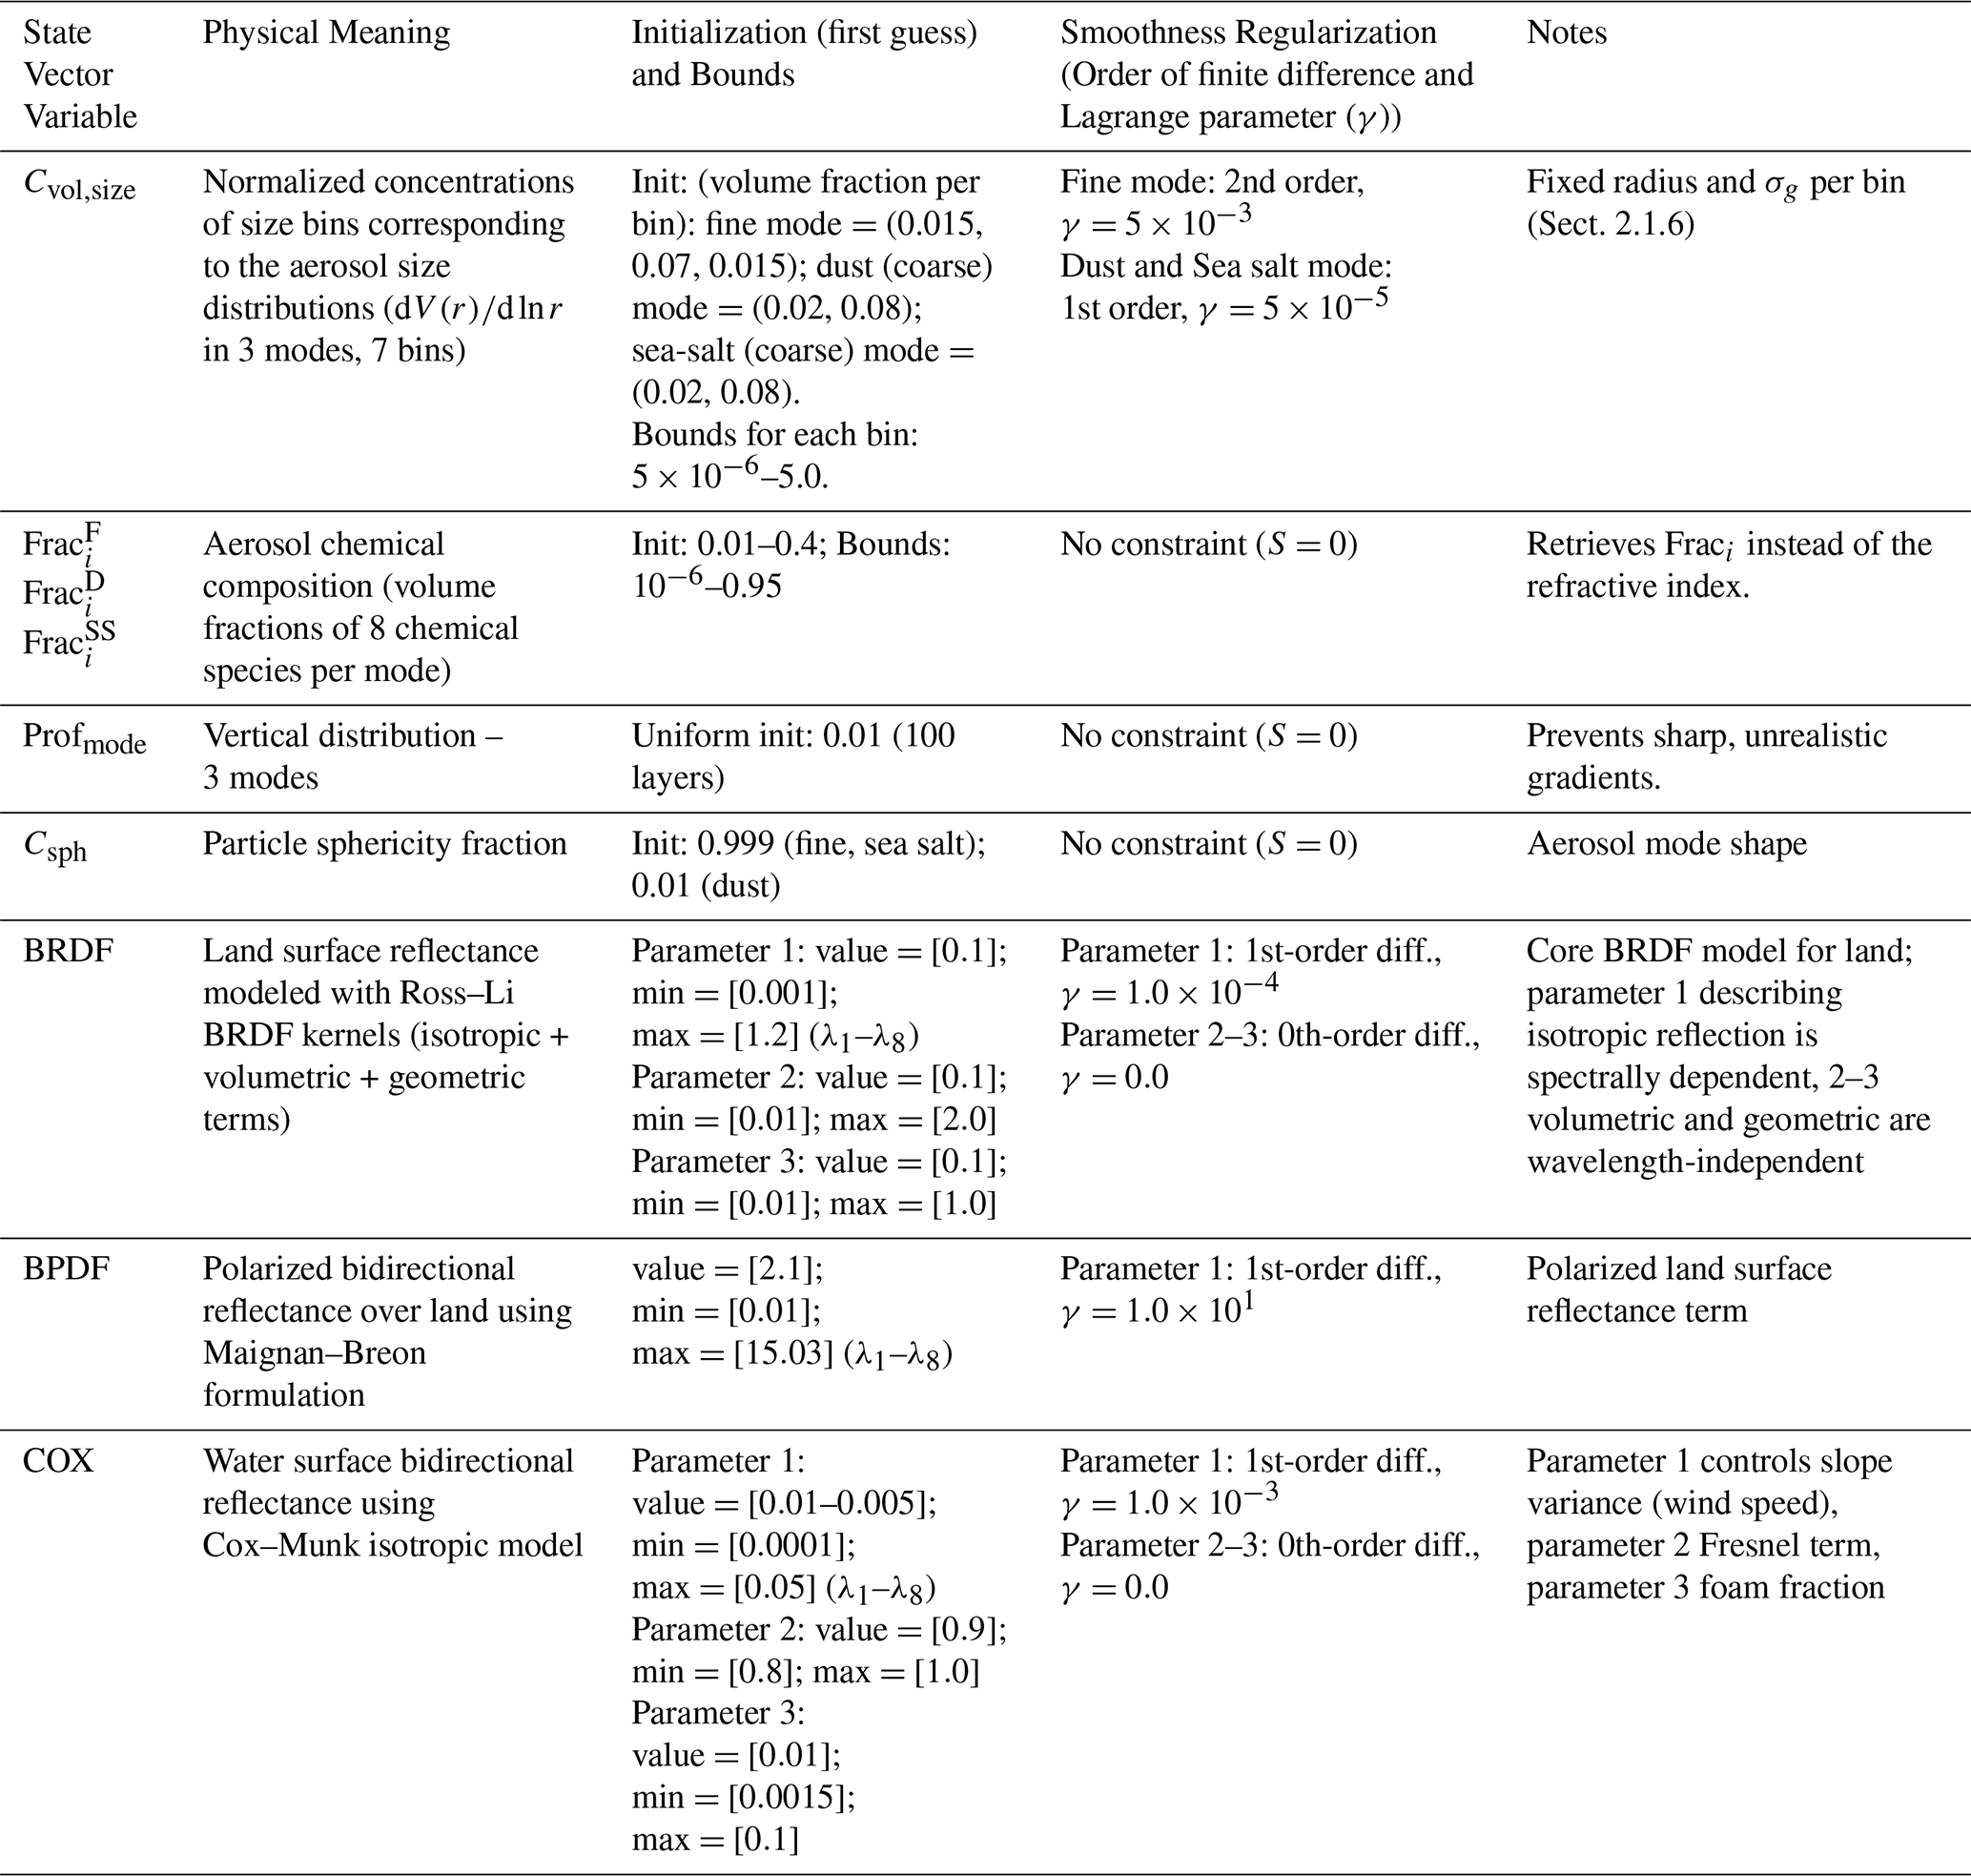
Sbrdf,iso, Sbpdf,iso, and Scox,iso are matrices for surface reflectance parameters regularized using first-order smoothness to maintain stable retrievals while avoiding unrealistic variability.
All details regarding the construction, parameterization, and smoothness orders of these blocks are summarized in Table 6 and described in detail in Dubovik et al. (2011, 2021). The errors Δ(Δa) are independent for each component of the vector (Δa)∗, and the smoothness matrix is expressed:
where uses the derivative matrices Si (), aV, abrdf,iso, abpdf,iso, acox,iso.
Table 6Summary of AEROCHEMPro/GRASP Single-Pixel Retrieval Parameters, Initialization (first guess), Bounds, and Smoothness Regularization.
By including the noise (explained in Sect. 2.2.6) for LUCE lidar and AOS polarimeter, the optimum solution considering the minimal error variance is obtained by minimizing the following cost function in Eq. (14):
where contains the observed lidar and polarimeter signals of ith pixel. γk are Lagrange multipliers controlling smoothness, and Wk and Ωk is the weighting function and the smoothness matrices, respectively (Dubovik et al., 2011, 2021).
The minimization of Eq. (14) is performed using the Levenberg–Marquardt algorithm with a logarithmic convention to ensure the physical positivity of retrieved quantities. To ensure a robust global minimum is reached and to completely avoid dependence on the initial state, the state vector is initialized globally using a generic, spatially uniform “cold-start” configuration. This includes fixed initial chemical species volume fractions and a flat vertical profile distribution across all layers, as detailed in Table 6, ensuring the initialization is sufficiently generic and does not favor specific solutions. We apply a stringent convergence threshold of for the relative change in the cost function, with a maximum of 15 iterations per pixel. Furthermore, the Jacobian matrix is computed with a finite difference scale of to precisely capture the sensitivities between the aerosol species concentrations and the multifaceted observations.
The AEROCHEMPro/GRASP simultaneously retrieves multiple groups of variables – including aerosol size distribution, chemical composition, vertical profiles, particle sphericity, and surface reflectance – using physically consistent first guesses, bounds, and smoothness constraints. The main retrieval settings, including initialization values, bounds, and smoothness orders, are summarized in Table 6.
2.4 Performance indicators for AEROCHEMPro
Within the AOS full retrieval experiment, we compare the aerosol properties retrieved by AEROCHEMPro with those of the pseudo-reality. This comparison assesses how well the retrievals match the pseudo-reality, helping validate the retrieval process using lidar and polarimeter measurements. The comparison uses three statistical indicators:
Correlation coefficient (R) – measures the strength of the linear relationship between AEROCHEMPro outputs and the pseudo-reality:
Mean Bias Error (MBE) – represents the average signed difference between retrieval and pseudo-reality:
A positive MBE indicates overestimation by AEROCHEMPro, while a negative value suggests underestimation.
Root Mean Square Error (RMSE) – measures the overall accuracy by combining both bias and random error:
This section presents a comprehensive analysis of the retrieval performance of AEROCHEMPro compared against the pseudo-reality. The simulated measurements include realistic noise added to mimic instrument uncertainties, providing a more representative test of the retrieval algorithm. First, the analysis focuses on a case study that evaluates the retrieval results in detail, highlighting strengths and limitations. It is followed by a broader statistical comparison across multiple transects covering the whole globe to generalize findings, estimate the AEROCHEMPro precision, and identify patterns in retrieval accuracy.
3.1 Case Study
3.1.1 Fitting of lidar and polarimeter pseudo-observations
Figures 6 and 7 present a comparison between Level-1 synthetic measurements obtained from the pseudo-reality and the lidar profiles, along with polarimeter radiances fitted by AEROCHEMPro for the selected case study. They are both derived from the forward model (Dubovik et al., 2021); the first case corresponds to the aerosol concentration profiles from the pseudo-reality (Sect. 2.1), and the second to those retrieved by the AEROCHEMPro inversion scheme. The results demonstrate that the AEROCHEMPro method accurately reproduces both lidar and polarimeter measurements simultaneously by adjusting the concentration profiles of 3 aerosol modes.
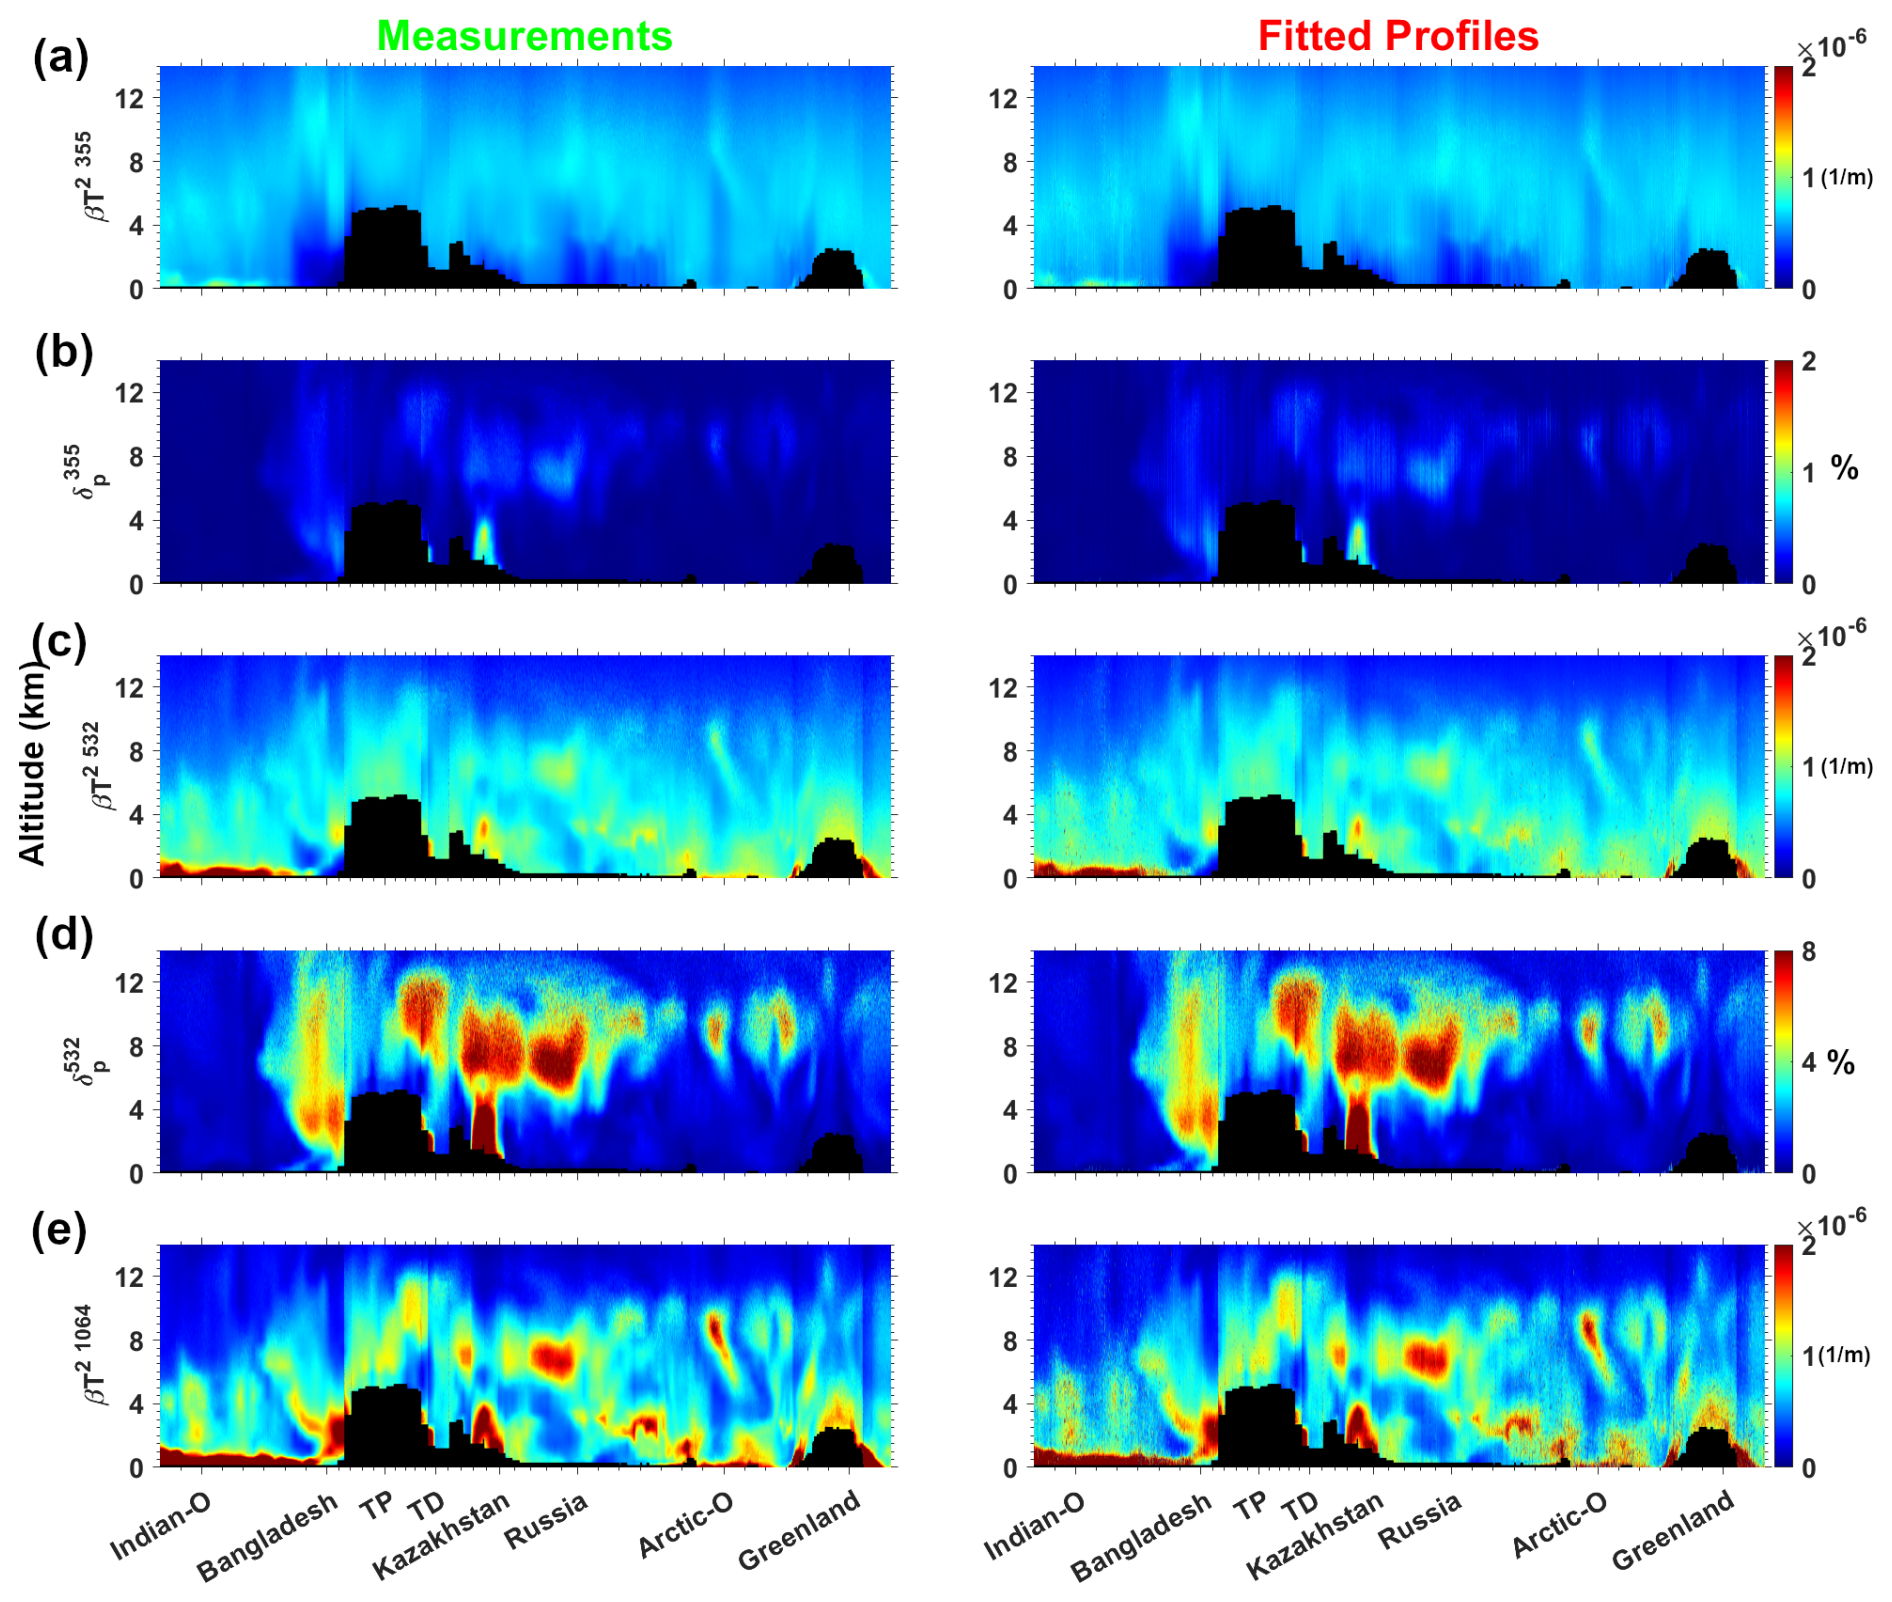
Figure 6Comparison of Lidar pseudo-observations (left) and fitted profiles (right): Attenuated Backscatter (βT) at (a) 355 nm, (c) at 532 nm, and (e) at 1064 nm, and Volume Depolarization (δ) at (b) 355 nm, (d) 532 nm across the selected transect. (The black shading area indicates the elevation.)
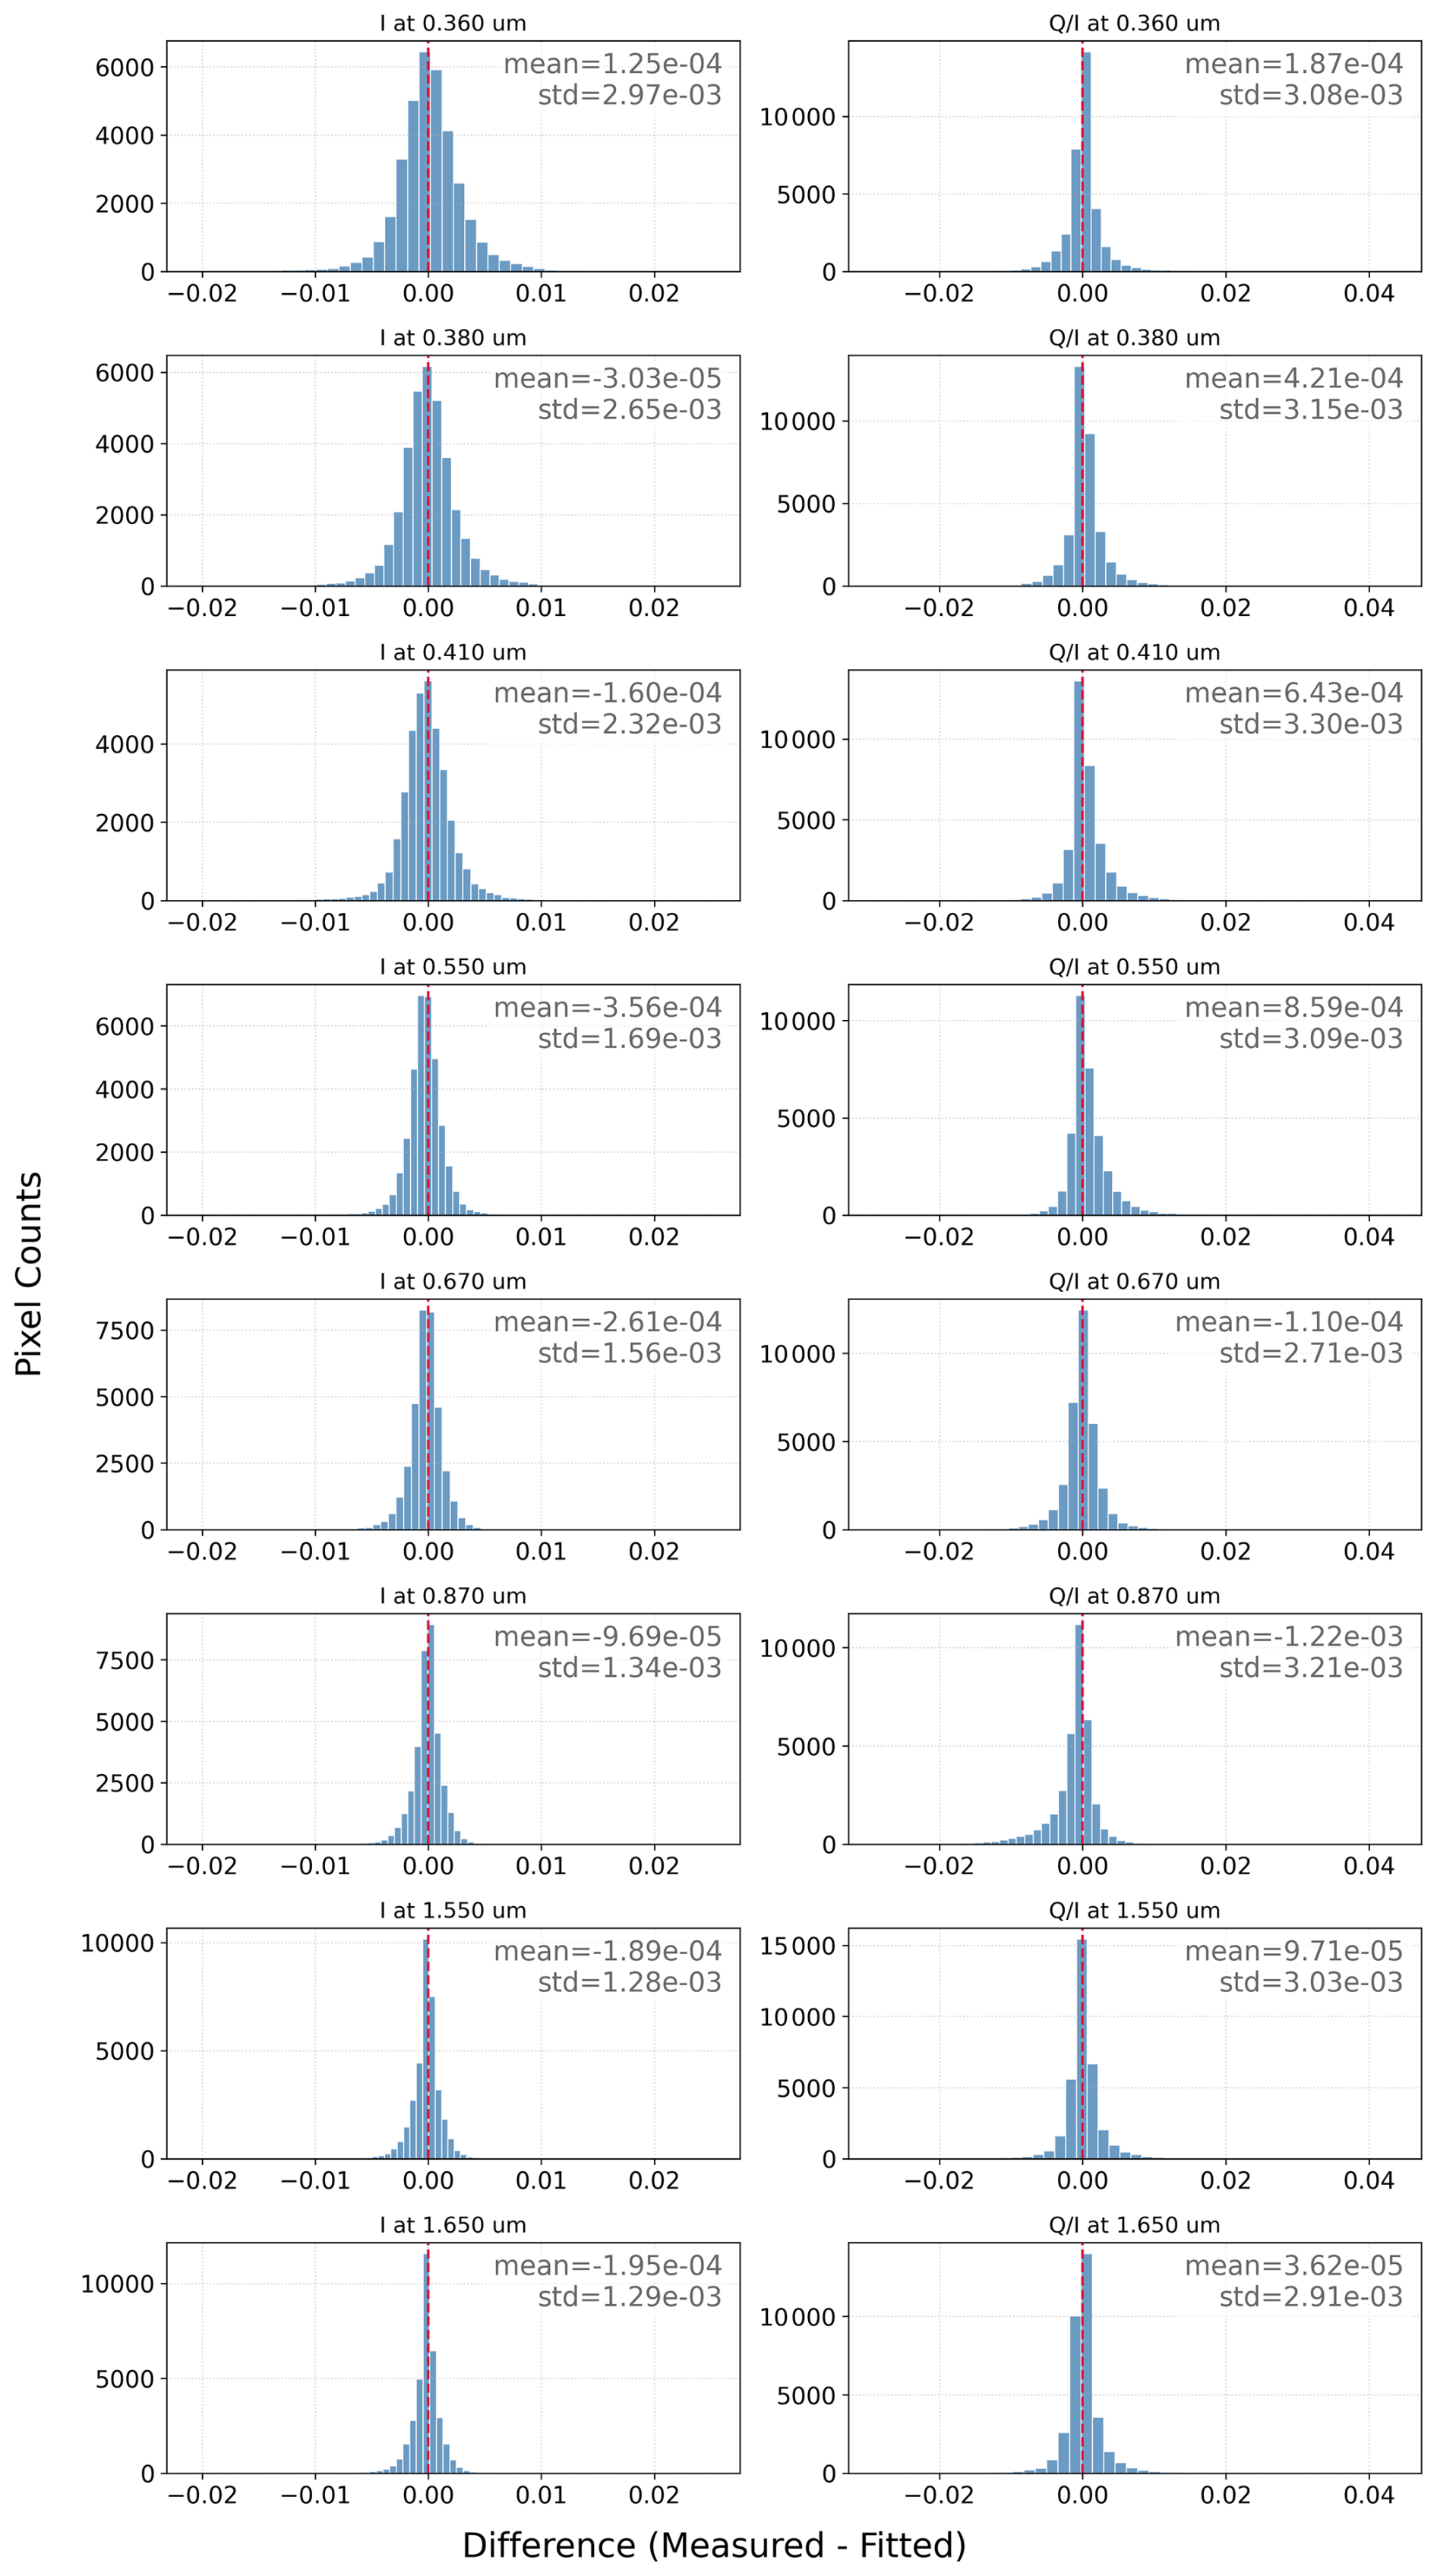
Figure 7Histograms of Residuals (Measured−Fitted) for AOS polarimeter observations in 8 wavelengths across all scattering angles and pixels of the selected transect.
Figure 6 compares measured and fitted profiles of attenuated backscatter at 355, 532, and 1064 nm, as well as volume depolarization at 355 and 532 nm, along a transect that covers several regions from the Indian Ocean to Greenland. Averaging over 50 km horizontally and 200 m vertically introduces random noise in the synthetic signals, reaching up to 8 % for attenuated backscatter and ranging between 10 % and 20 % for depolarization. The AEROCHEMPro method captures the spatial variability and vertical structures seen in the observed profiles. Key properties, such as elevated aerosol layers and high depolarization ratios, are accurately depicted, indicating the presence of non-spherical particles such as dust. The method can reproduce lidar signals under various atmospheric conditions, as demonstrated by a good match between the fitted and measured attenuated backscatter profiles at all wavelengths. Any minor differences are likely due to instrumental noise or assumptions in the retrieval process, but they are acceptable for practical use.
Figure 7 illustrates the agreement between measured and fitted polarimeter observations for all pixels and spectral channels across the selected transect, providing a direct verification of how the residuals relate to the injected noise levels. For the intensity component (I), the mean biases are negligible, with normalized absolute values ranging from to , and standard deviations ranging between and . These standard deviations align with the relative 3 % noise floor applied to the typical fractional normalized radiance levels of the scene. The normalized polarization residuals () show minimal mean biases ranging from to , with standard deviations remaining stable across wavelengths, hovering around 0.003 (from to ). This specification falls within the absolute noise floor of 0.005 assigned to the underlying Stokes parameters for the AOS polarimeter. As the simulations are performed in the principal plane, the U component is excluded from the analysis, as it does not carry independent information in this geometry. The consistency of the method is confirmed by the absence of systematic biases across the eight spectral bands.
3.1.2 Vertical aerosol concentration profiles and total column chemical species concentrations
This sub-section presents a point-by-point comparison between AEROCHEMPro retrievals of vertical aerosol volume mixing ratio distributions by mode and total column volume concentrations of each chemical species, as directly derived within the state vector adjusted through iterations, relative to the pseudo-reality as depicted in Fig. 8.
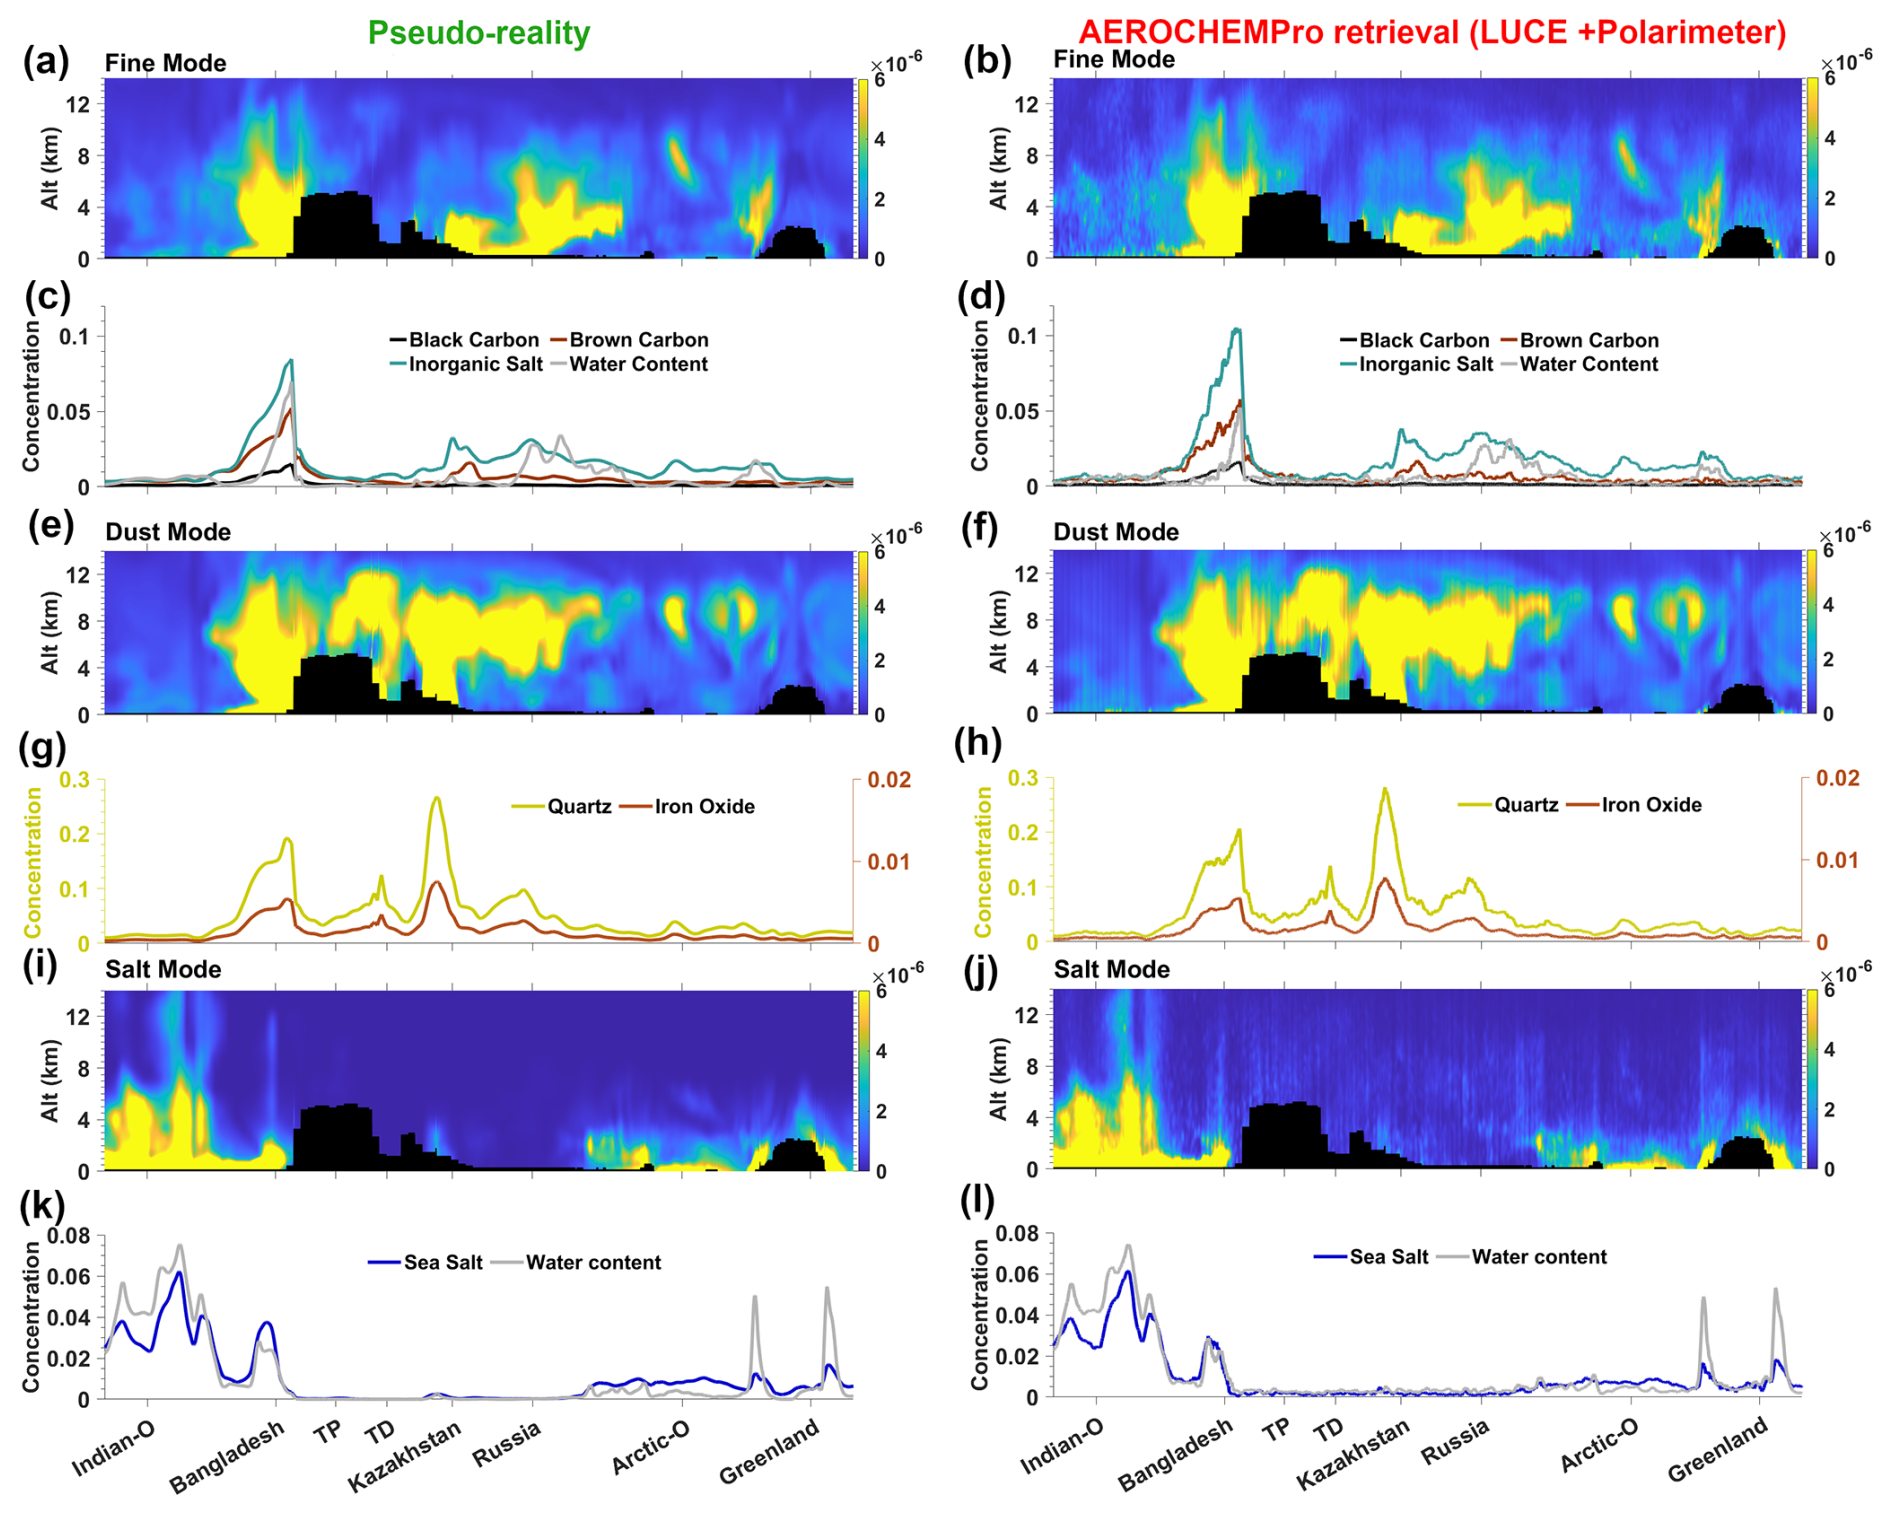
Figure 8Comparison of vertical profiles for aerosol mode volume mixing ratio in ppmV (shaded) and total column volume concentrations in um3 um−2 (line) along the transect: left – pseudo reality, right – retrieved. (The black shading area indicates the elevation.)
The profiles are organized into three aerosol modes: fine, dust, and sea salt. The fine-mode vertical profiles demonstrate the predominance of inorganic salt, followed by brown carbon, particularly over Bangladesh and eastern Kazakhstan. This distribution is attributed to anthropogenic emissions and transported pollution. The retrieval accurately represents the overall structure of the fine aerosol volume mixing ratio profile, including the vertical extent of the boundary layer. However, it slightly overestimates the volume mixing ratios at the surface, especially over Bangladesh and Greenland near the land surface, with a bias of roughly , likely resulting from vertical smoothing associated with lidar–polarimeter synergy. The total column volume concentrations of black carbon, brown carbon, and inorganic salt correspond closely with the pseudo-reality, indicating reliable retrieval of fine-mode species contributions. At the peak of the pseudo-reality concentration along the transect, inorganic salt and water content are retrieved with relative errors of 21.2 % and 25.6 %, respectively, above Bangladesh. The absolute overestimation of inorganic salt (+0.018 um3 um−2) is largely balanced by the underestimation of water content (−0.018 um3 um−2), indicating that while a minor partitioning offset sometimes exists between these two hygroscopic species, the total fine-mode volume is recovered with high accuracy. In the dust mode, the pseudo-reality shows significant dust activity across Bangladesh, the TP, and the TD, with enhanced iron oxide and quartz mixing ratios reaching up to around 12 km of altitude and extending into Kazakhstan and Russia at higher levels. The lofted dust layers span vertically from approximately 4 to 10 km, suggesting long-range transport. The retrieval captures the principal features of the dust plume, particularly its vertical extent and surface-level volume mixing ratio. The remarkable consistency between retrieved and pseudo-reality total column species volume concentrations for iron oxide and quartz validates the retrieval's ability to observe dust particles. Sea salt is primarily found at the surface, reflecting emissions from marine environments. Both pseudo-reality and retrieval show consistent patterns, with high sea salt volume mixing ratios limited to the boundary layer. A slight underestimation of sea salt mixing ratio off the coast of Bangladesh is observed, corresponding to background sea salt transported inland above this region, revealing very small biases under complex aerosol mixing conditions, such as with fine particles. Generally, the retrieval accurately resolves the horizontal distribution and total column concentrations of sea salt in most locations, indicating that it is appropriate for characterizing marine aerosol contributions.
3.1.3 Aerosol optical properties
Figure 9 compares the performance of AEROCHEMPro in retrieving essential aerosol properties, including aerosol optical depth (AOD), surface mixing ratio, total-column single scattering albedo (SSA), and total-column lidar ratio (LR) at 532 nm, differentiated by aerosol mode. For AOD and Csurf (Fig. 9a–d), the contributions of the fine, dust, and sea salt modes are presented as stacked area plots. In regions where a single mode dominates (such as the high AOD dust events), the areas for the remaining modes may appear negligible or invisible near the baseline, rather than being hidden by overlap. The figure shows a direct comparison between the retrieval results with the pseudo-reality dataset.
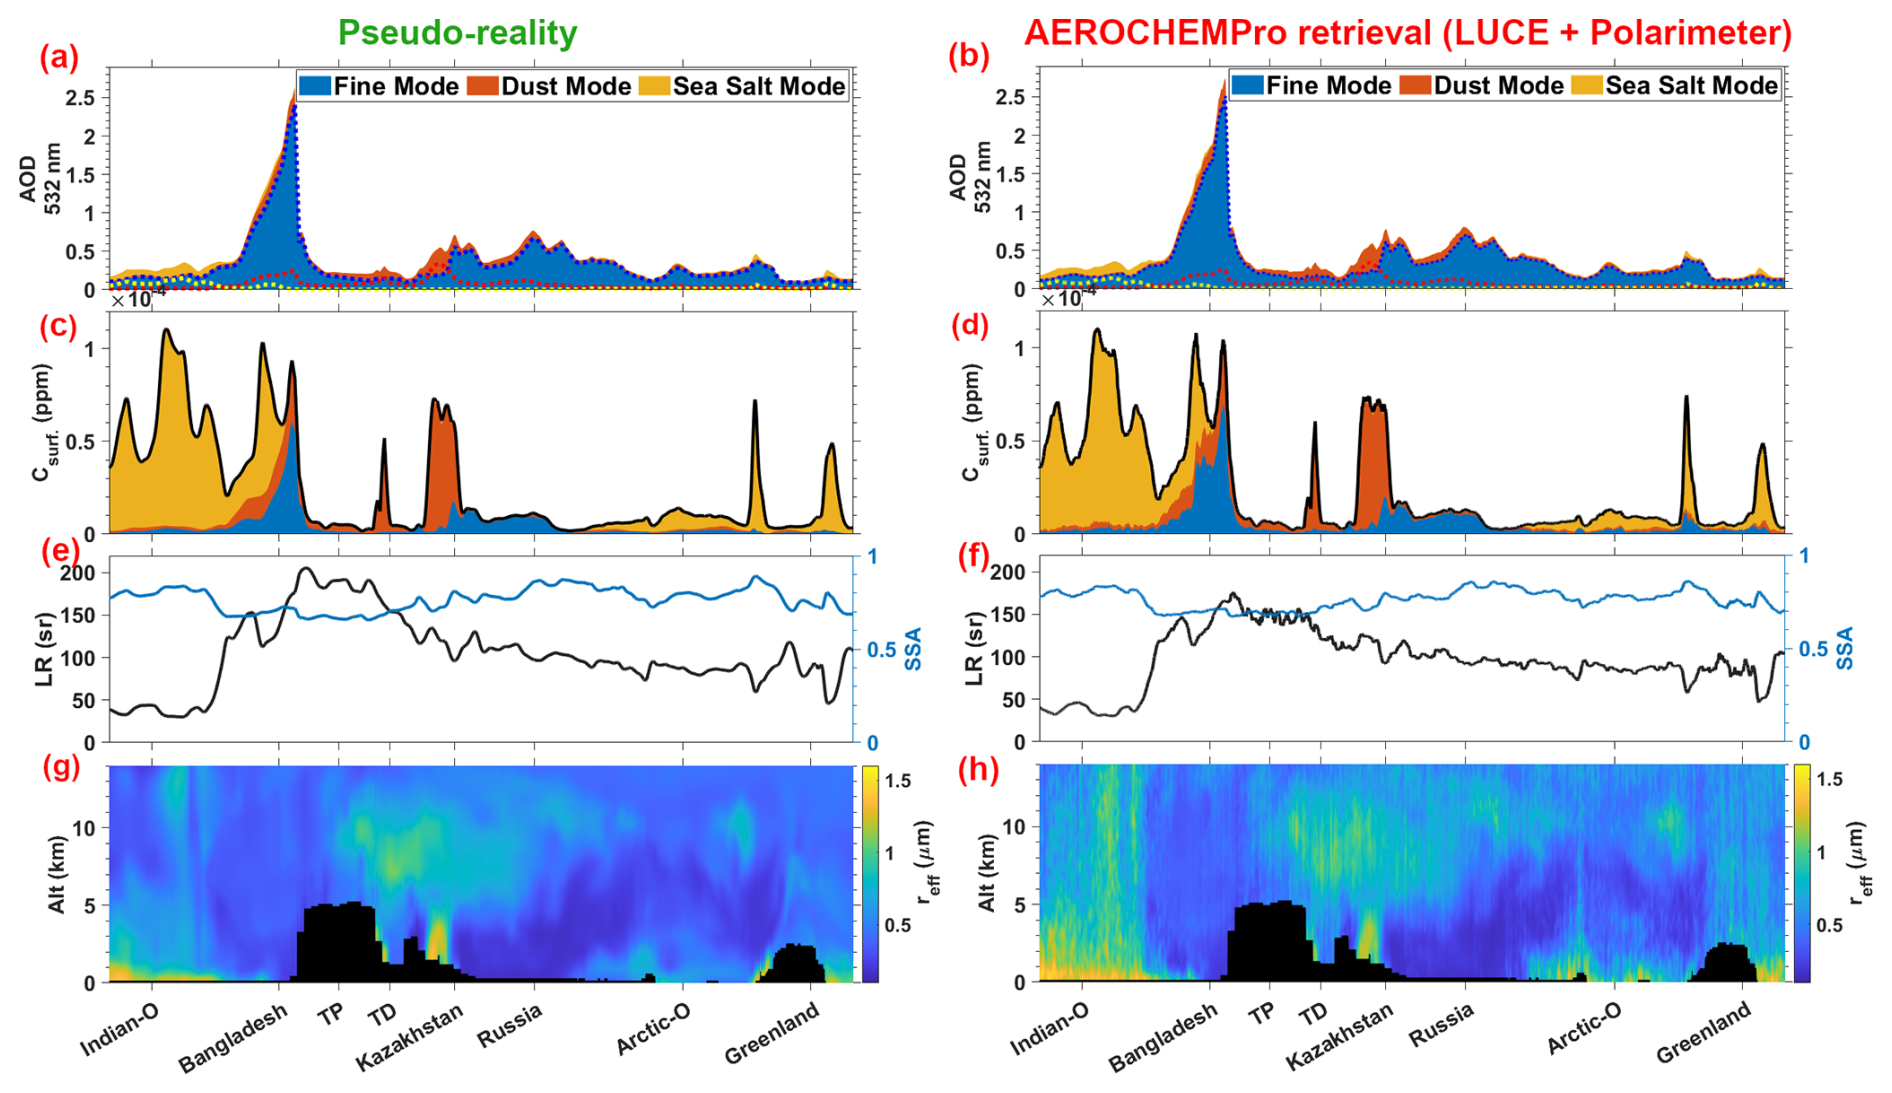
Figure 9Comparison of (a, b) aerosol optical depth (AOD), (c, d) Surface mixing ratio (Csurf) in ppmV, (e, f) total-column SSA and LR at 532 nm and (g, h) total aerosol effective radius (reff) in µm, from top to bottom, respectively: Pseudo-reality left and retrievals right along the transect for fine mode, dust mode, and sea salt mode. For AOD and Csurf (a–d), stacked area plots represent the cumulative contribution of the fine, dust, and sea-salt modes. In the AOD plots (a, b), dashed lines indicate the absolute values for each mode: blue for fine mode, red for dust mode, and yellow for sea-salt mode. (The black shading area indicates the elevation.)
AEROCHEMPro-derived modal AODs exhibit a clear agreement in terms of patterns and absolute values with respect to pseudo-reality for all modes (Fig. 9a and b). The retrieval effectively captures fine-mode AOD peak amplitudes and occurrences, notably over Bangladesh, where anthropogenic and secondary aerosols are common. The method also reproduces high AOD values associated with dust plumes transported over Bangladesh. Sea salt retrievals correspond closely to the pseudo-reality over the Indian Ocean. AEROCHEMPro reproduces the expected spatial distribution of AOD at 532 nm across major aerosol species. Combustion-related species dominate over anthropogenic source regions, while mineral dust components are enhanced in arid regions such as Central Asia, and marine aerosols are prevalent over oceanic areas. Detailed species-resolved AOD distributions are provided in Fig. S1 in the Supplement.
Comparisons of surface mixing ratios (Csurf) in Fig. 9c and d further demonstrate the good retrieval's ability to quantitatively capture the spatial distribution of multiple species of aerosols. The method accurately retrieves enhanced surface volume mixing ratios for fine and dust modes near source regions. Still, it slightly overestimates them in Bangladesh, whereas the sea salt Csurf retrieval is clearly consistent with the pseudo-reality.
Figure 9e and f show the total-column single scattering albedo (SSA) retrievals that closely match the pseudo-reality dataset, reflecting variations in aerosol absorption properties over the transect. The total-column lidar ratio (LR) comparisons highlight the retrieval's ability to discern aerosol scattering and absorption features. Here, “total-column” SSA and LR refer to bulk optical properties derived from column-integrated scattering, extinction, and backscatter coefficients at 532 nm. Retrievals are consistent with pseudo-reality values in most locations. Still, a moderate underestimation of about 20 to 30 sr is detected stretching from the Tibetan Plateau to the Taklamakan Desert, which could imply some difficulties in distinguishing the scattering properties of coarse, elevated dust particles.
Vertical profiles of aerosol effective radius (reff) (Fig. 9g and h) display substantial spatial and vertical variability along the transect. Over the Indian Ocean, the effective radius increases near the sea surface, indicating that sea salt particles dominate at lower altitudes. The Tibetan Plateau shows a transition to larger coarse-mode particles, most likely transported dust. The profile of reff over Kazakhstan indicates a complex structure, with low-altitude layers denoting contributions from dust and mixed aerosol particles. This shows that the retrieval method generally aligns very well with the pseudo-reality dataset. However, there are minor overestimations of sea salt particle size over the Indian Ocean, at higher altitudes above the marine boundary layer, and a slight underestimation of reff at the surface above Kazakhstan.
3.1.4 Vertical profiles of aerosol chemical species
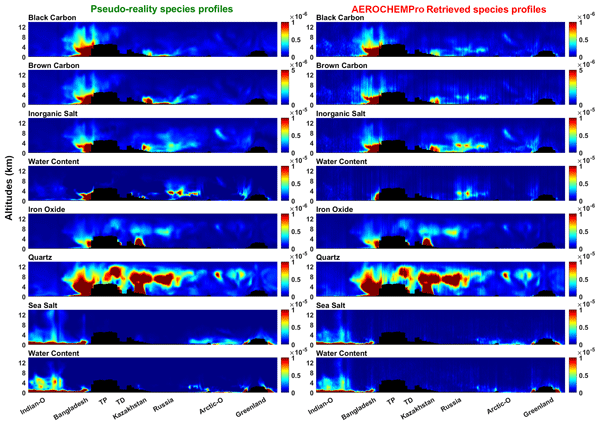
Figure 10 shows a comparison of transects of vertical profiles of volume mixing ratio of individual aerosol chemical species using pseudo-reality data against those derived from AEROCHEMPro retrievals. This figure differs from previous figures (Figs. 8 and 9) by displaying direct comparisons of the state-vector variables. Figure 10 presents an AEROCHEMPro product derived from those variables. The aerosol profiles are independent for each aerosol species in the pseudo-reality, and they are estimated using simulations from MOCAGE-CTM. In contrast, the aerosol chemical species profiles, derived from AEROCHEMPro retrievals and assuming vertically constant mixing ratios per mode, are calculated by multiplying the fractions (Fraci) of each chemical species by the corresponding modal concentration vertical profiles (Fig. 8b, f, and j). This derived product is indicated in the scheme of Fig. 4.
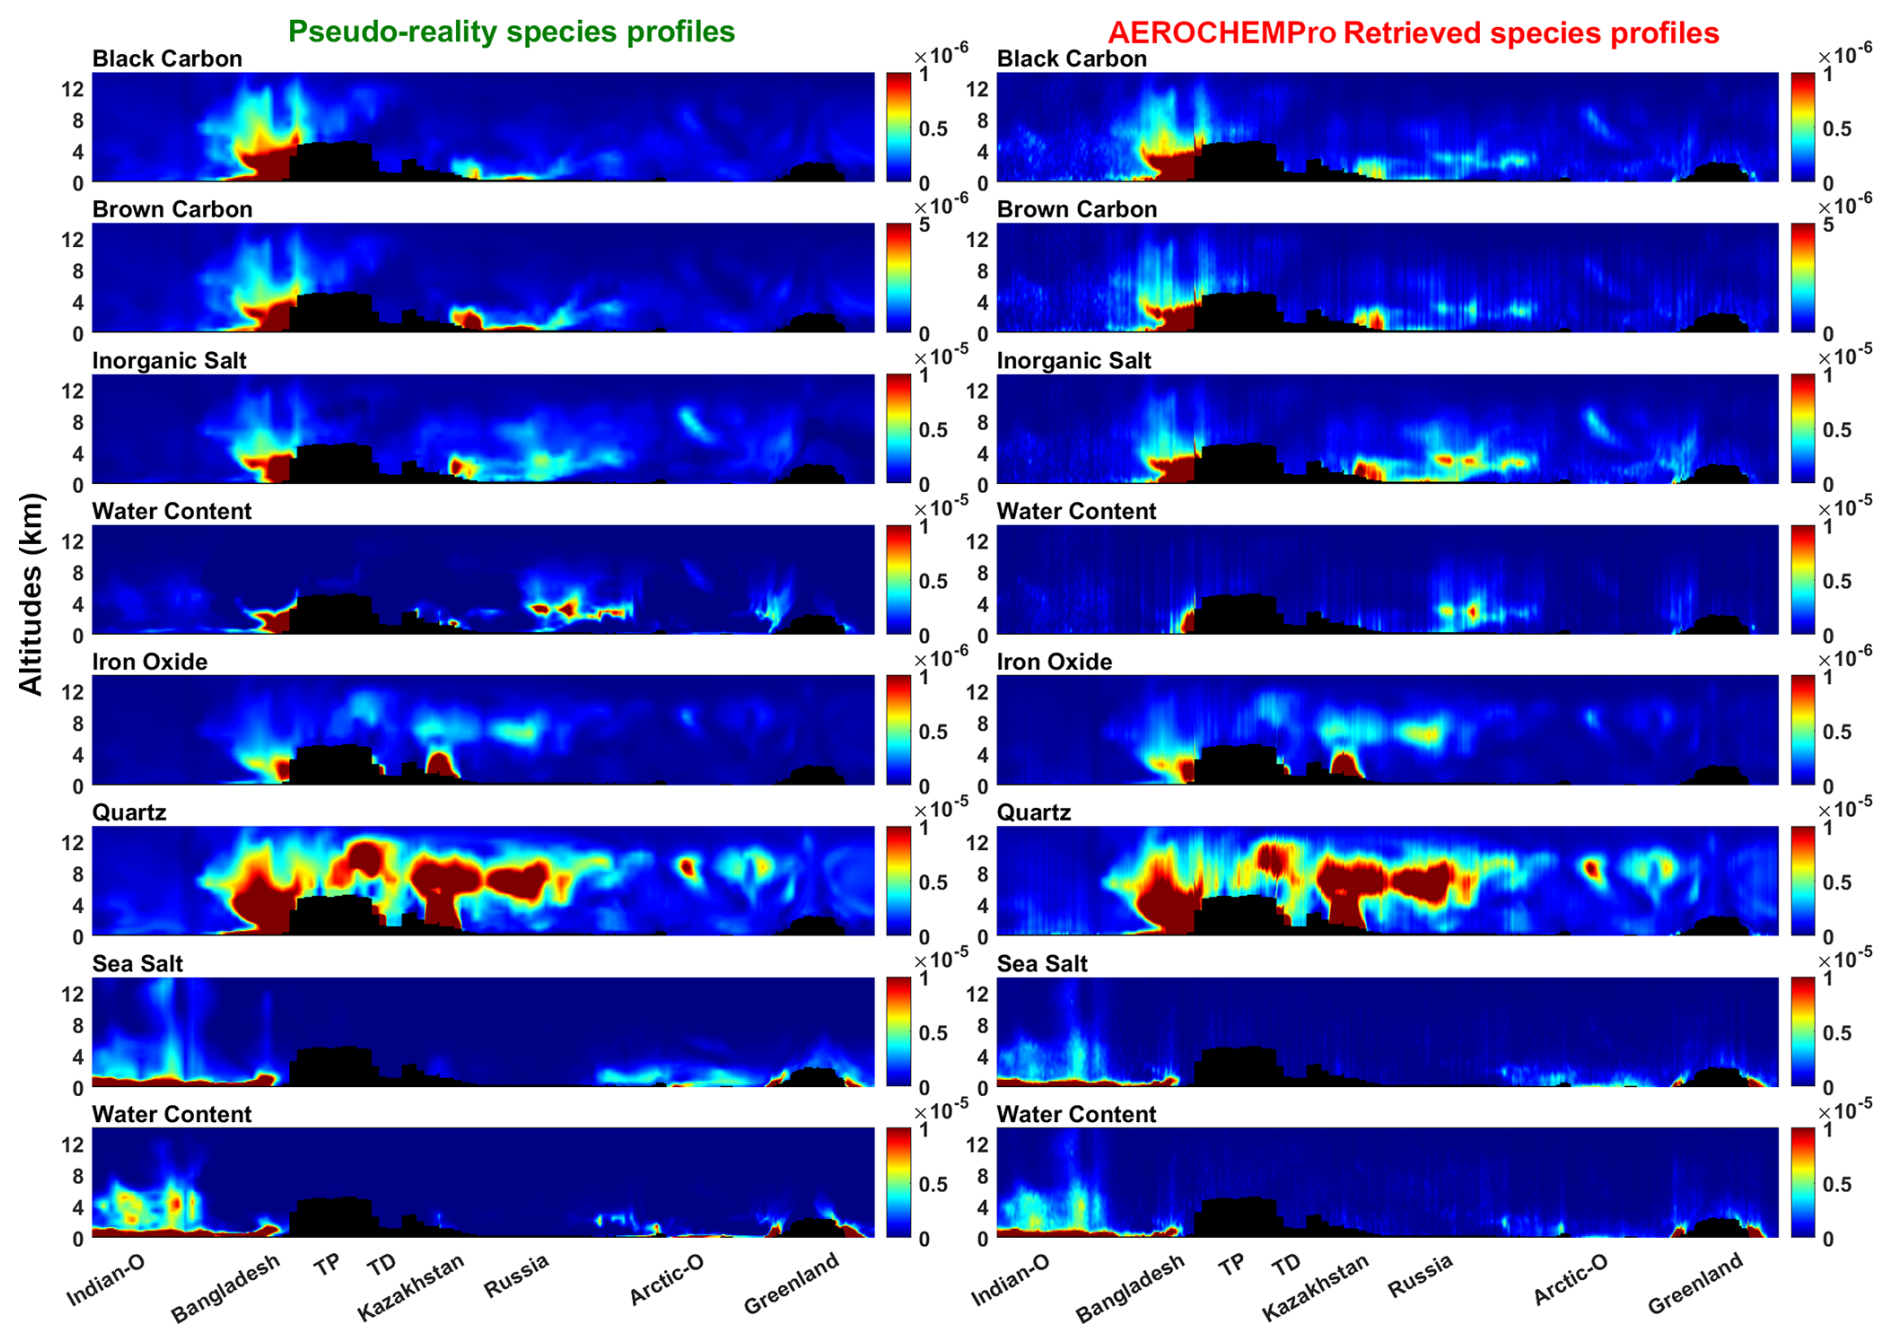
Figure 10Vertical volume mixing ratio (ppmV) profiles of individual aerosol chemical species (left: Pseudo-reality, right: AEROCHEMPro retrieval) along a transect from the Indian Ocean to Greenland. From top to bottom: black carbon, brown carbon, inorganic salt, water content associated with fine particles, iron oxide, quartz, sea salt, and water content associated with it. (The black shading area indicates the elevation.)
The results illustrate the unprecedented capacity of AEROCHEMPro to retrieve vertical profiles of the volume mixing ratio of multiple aerosol chemical species in good overall agreement with the pseudo-reality. Except in situations in which chemical species of the same aerosol mode display clearly different relative vertical distributions (not very often in this example), this derived product of AEROCHEMPro shows a good match for eight distinct transects describing the aerosol chemical composition.
Pseudo-reality BC and BrC profiles show high surface mixing ratios across Bangladesh and Kazakhstan, indicating emissions from biomass burning and industrial activities. The retrieval reproduces these near-surface plumes over most locations with high accuracy. Inorganic salt retrievals closely match pseudo-reality, particularly in Bangladesh and parts of Kazakhstan. However, overestimations occur between the surface and 2 km, along with a simultaneous underestimation of water content linked to fine particles, near coastal locations. Over specific and localized regions, the use of a single profile to represent the fine mode limits the ability to distinguish vertical variations in black carbon and brown carbon, as well as in inorganic salt and aerosol water content. Iron oxide and quartz, both dust mineral constituents, generate unique plumes in the pseudo-reality, especially over the Tibetan Plateau, Taklamakan Desert, and parts of Russia. The retrievals reproduce the shape and extent of these dust layers. Sea salt and its associated water content are very well represented in the retrieval, particularly near the surface over the Indian and Arctic Oceans. Generally, AEROCHEMPro retrieval of aerosol chemical species profiles accurately reproduces magnitudes and patterns, with minor limitations in differentiating species in complex mixtures, mainly resulting from vertically constant mixing ratios.
3.2 Performance of AEROCHEMPro at the global scale
To assess the overall performance of the AEROCHEMPro retrieval method, we conduct a point-by-point statistical comparison of retrieval outputs with the pseudo-reality across multiple globally distributed transects. These transects span a wide range of aerosol conditions, including diverse geographical regions, source types, and meteorological regimes. The analysis emphasizes total aerosol optical properties, aerosol species optical depths, and volume mixing ratios of individual aerosol species. We exclude AEROCHEMPro outputs from the statistical performance indicators when aerosol abundance is very low or atmospheric conditions are pristine, based on total AOD values, where only pixels with are retained. The lower limit acts as a vital quality control mask; under near-pristine conditions (AOD<0.1), the atmospheric signal-to-noise ratio degrades significantly, particularly for intensive properties like SSA at high southern latitudes (above 60° S). The upper limit avoids extremely high aerosol loadings where strong multiple scattering and saturation effects can degrade retrieval accuracy.
3.2.1 Aerosol total-column optical properties
Figure 11 provides a comparative analysis of key column-integrated aerosol properties at 532 nm, specifically total-column single scattering albedo (SSA), aerosol optical depth (AOD), total-column lidar ratio (LR), and total-column effective radius (). The AEROCHEMPro retrievals show high agreement with the pseudo-reality for most optical properties, which indicates robust algorithm performance. SSA retrievals show a high correlation (R=0.96) and low root mean square error (), with a minor negative bias (mean bias error, ). The retrieval spread widens at lower SSA values, notably below 0.9, when results become more dispersed in comparison to the pseudo-reality. This enhanced dispersion is often associated with low aerosol loading or the presence of absorbing aerosols like black or brown carbon. These conditions decrease the sensitivity of polarimetric measurements while increasing retrieval uncertainty.
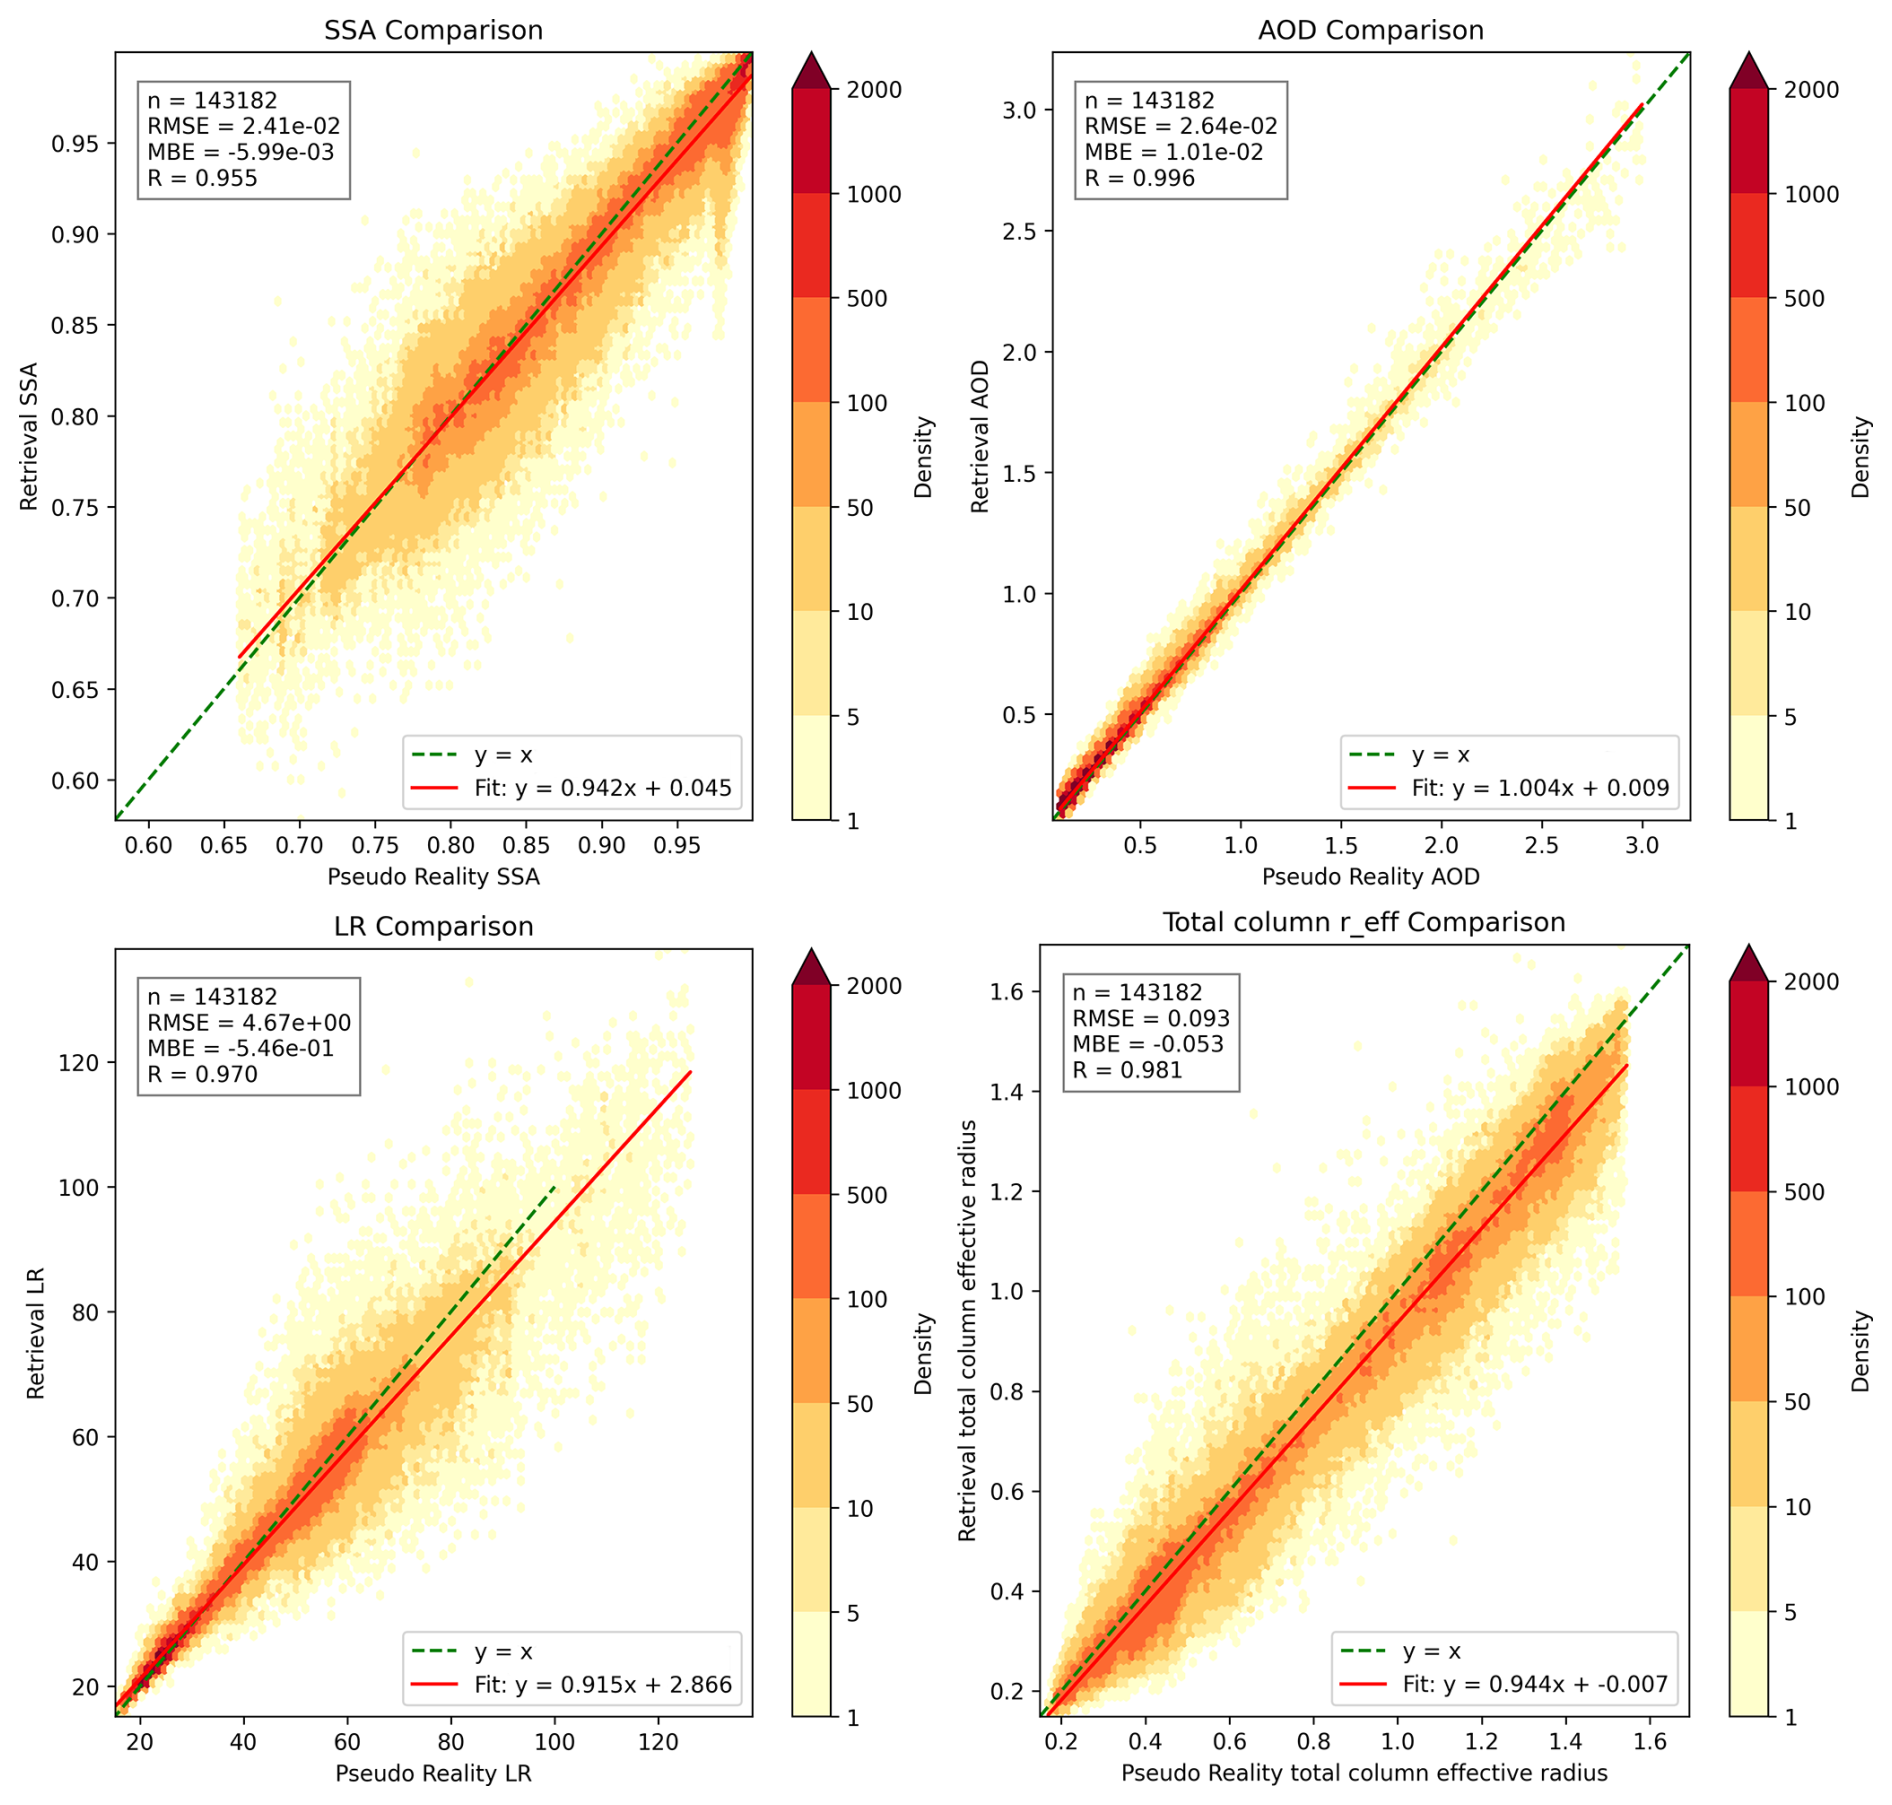
Figure 11Comparison of column-integrated aerosol optical properties at 532 nm (Single Scattering Albedo (SSA), Aerosol Optical Depth (AOD), Lidar Ratio (LR), and Total column effective radius ()) covering the entire globe.
The AOD comparison has excellent agreement, with a correlation coefficient around unity (R≈1.00), RMSE of , and negligible bias (). This result demonstrates the algorithm's ability to accurately capture columnar aerosol loading. The lidar ratio, which varies with aerosol type and size distribution, shows a very high correlation (R=0.97) and an acceptable RMSE of 4.67. Most of the residual disparities occur in high LR cases, which are frequently linked to complex aerosol mixtures (fine dust mixed with smoke or marine aerosols). In these mixtures, different components may have similar column-integrated optical properties, and vertical overlap can reduce the retrieval's ability to distinguish their contributions, resulting in LR biases. The retrieval of performs well (R=0.98), though it has a negative bias ( µm). A slight underestimation is noticeable for particles with µm, possibly due to the assumption of fixed, uniform size distributions within each aerosol mode (fine, dust, and sea salt) in the retrieval. See Table 2 for details. This simplification may not adequately account for the broad range of particle sizes in pseudo-reality, especially in mixed environments where the actual size distribution differs from the assumed modal.
3.2.2 AOD of aerosol chemical species
Figure 12 presents global-scale AOD comparison results at 532 nm for fine aerosol species, including black carbon, brown carbon, inorganic salts, and their water content. Black carbon retrievals demonstrate the highest accuracy, as indicated by a high correlation coefficient (R=0.93), low root mean square error (), and a regression slope near unity (1.03). These results show the retrieval algorithm's effectiveness in detecting absorbing aerosols with distinct spectro-polarimetric signatures. Brown carbon retrievals display a moderately good performance (R=0.81), with an MBE of and a slope of 0.99. An increased scatter at higher loading suggests a small bias in retrieving BrC contributions in regions with complex aerosol mixtures. This is most likely due to spectral overlaps with other weakly absorbing fine particles, which affects aerosol discrimination. Inorganic salts show a high R (∼0.89), with an MBE of and a slope of 1.18, indicating a slight overestimation. This could be due to the retrieval algorithm compensating for the low LR and low absorption of sulfate-dominated particles. Water uptake associated with fine particles demonstrates good performance (R=0.85), a slope of 0.82, and a positive MBE of .
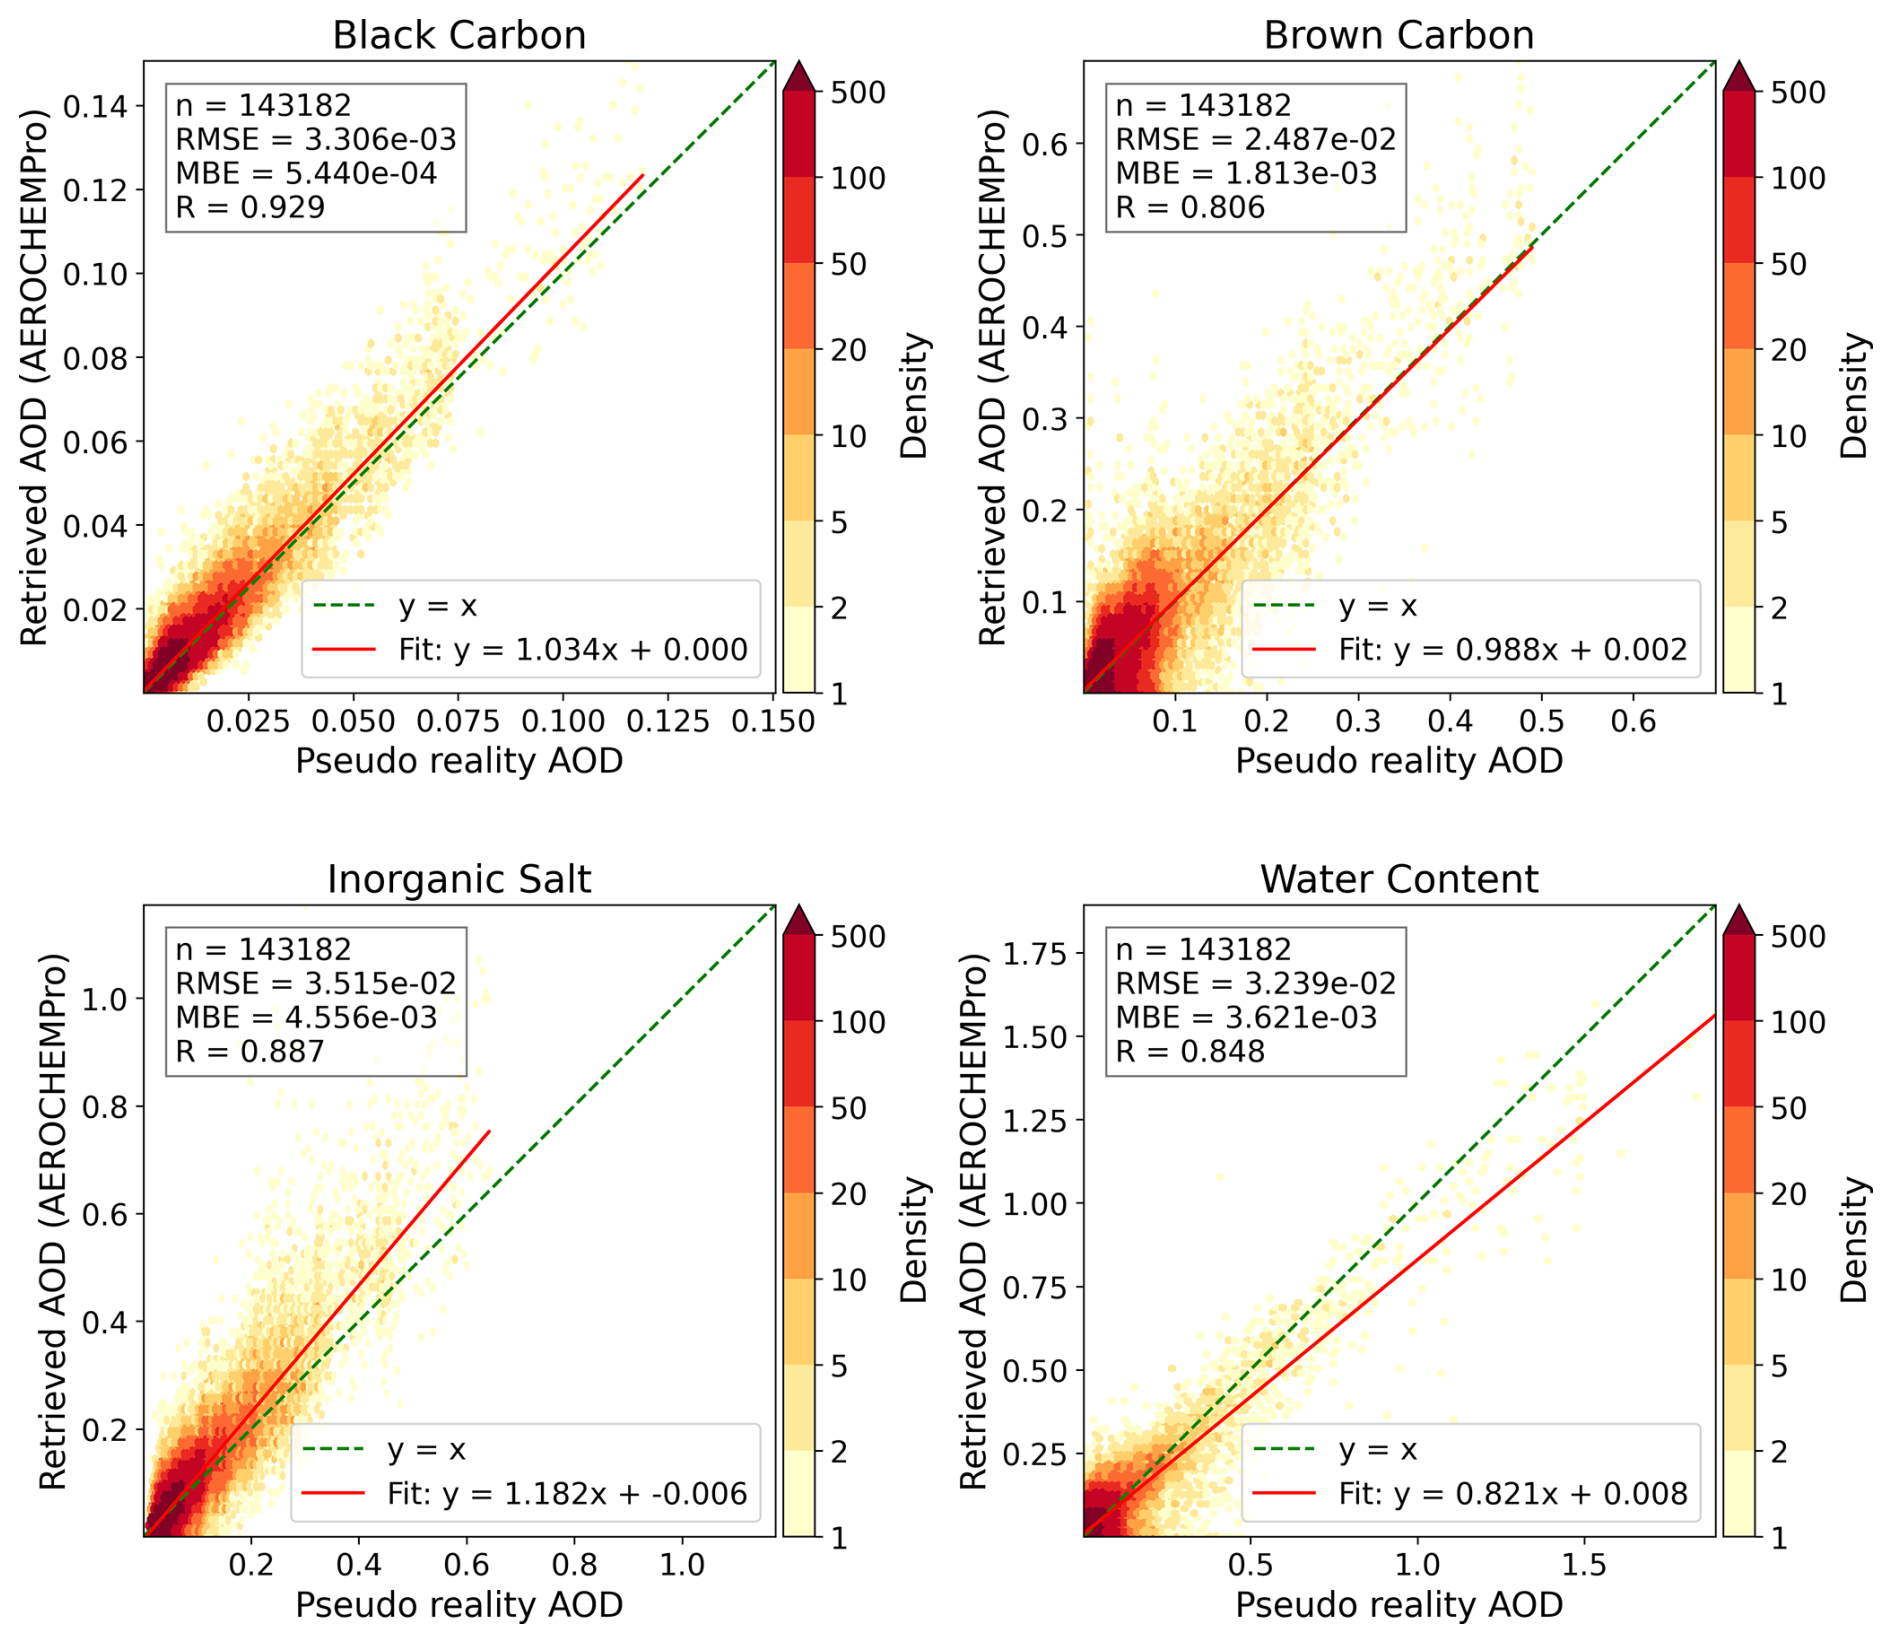
Figure 12Comparison of aerosol optical depth (AOD) at 532 nm for fine particles (black carbon, brown carbon, inorganic salt) and AOD contribution by water uptake, covering the entire globe.
AOD retrievals at 532 nm for coarse particles, including iron oxide, quartz, and sea salt, along with the water content uptake by sea salt, are shown in Fig. 13. Iron oxide retrievals show a very high correlation coefficient of 0.99, a slope of 0.96 near unity (), likely due to the elevated absorption signal of iron oxide in dusty conditions. Quartz retrievals are the most accurate among all species, achieving the best correlation (R nearly 1.00) and a slope near unity (0.97), with a low MBE of . This high accuracy shows the robust retrieval of the mineral dust signature, which dominates the coarse mode in arid regions. Sea salt retrievals show excellent performance (R=1.00), with a slope of 0.97 and MBE of . Water uptake by sea salt AOD shows a perfect correlation (R∼1.00), a slope of 0.97, and an MBE of .
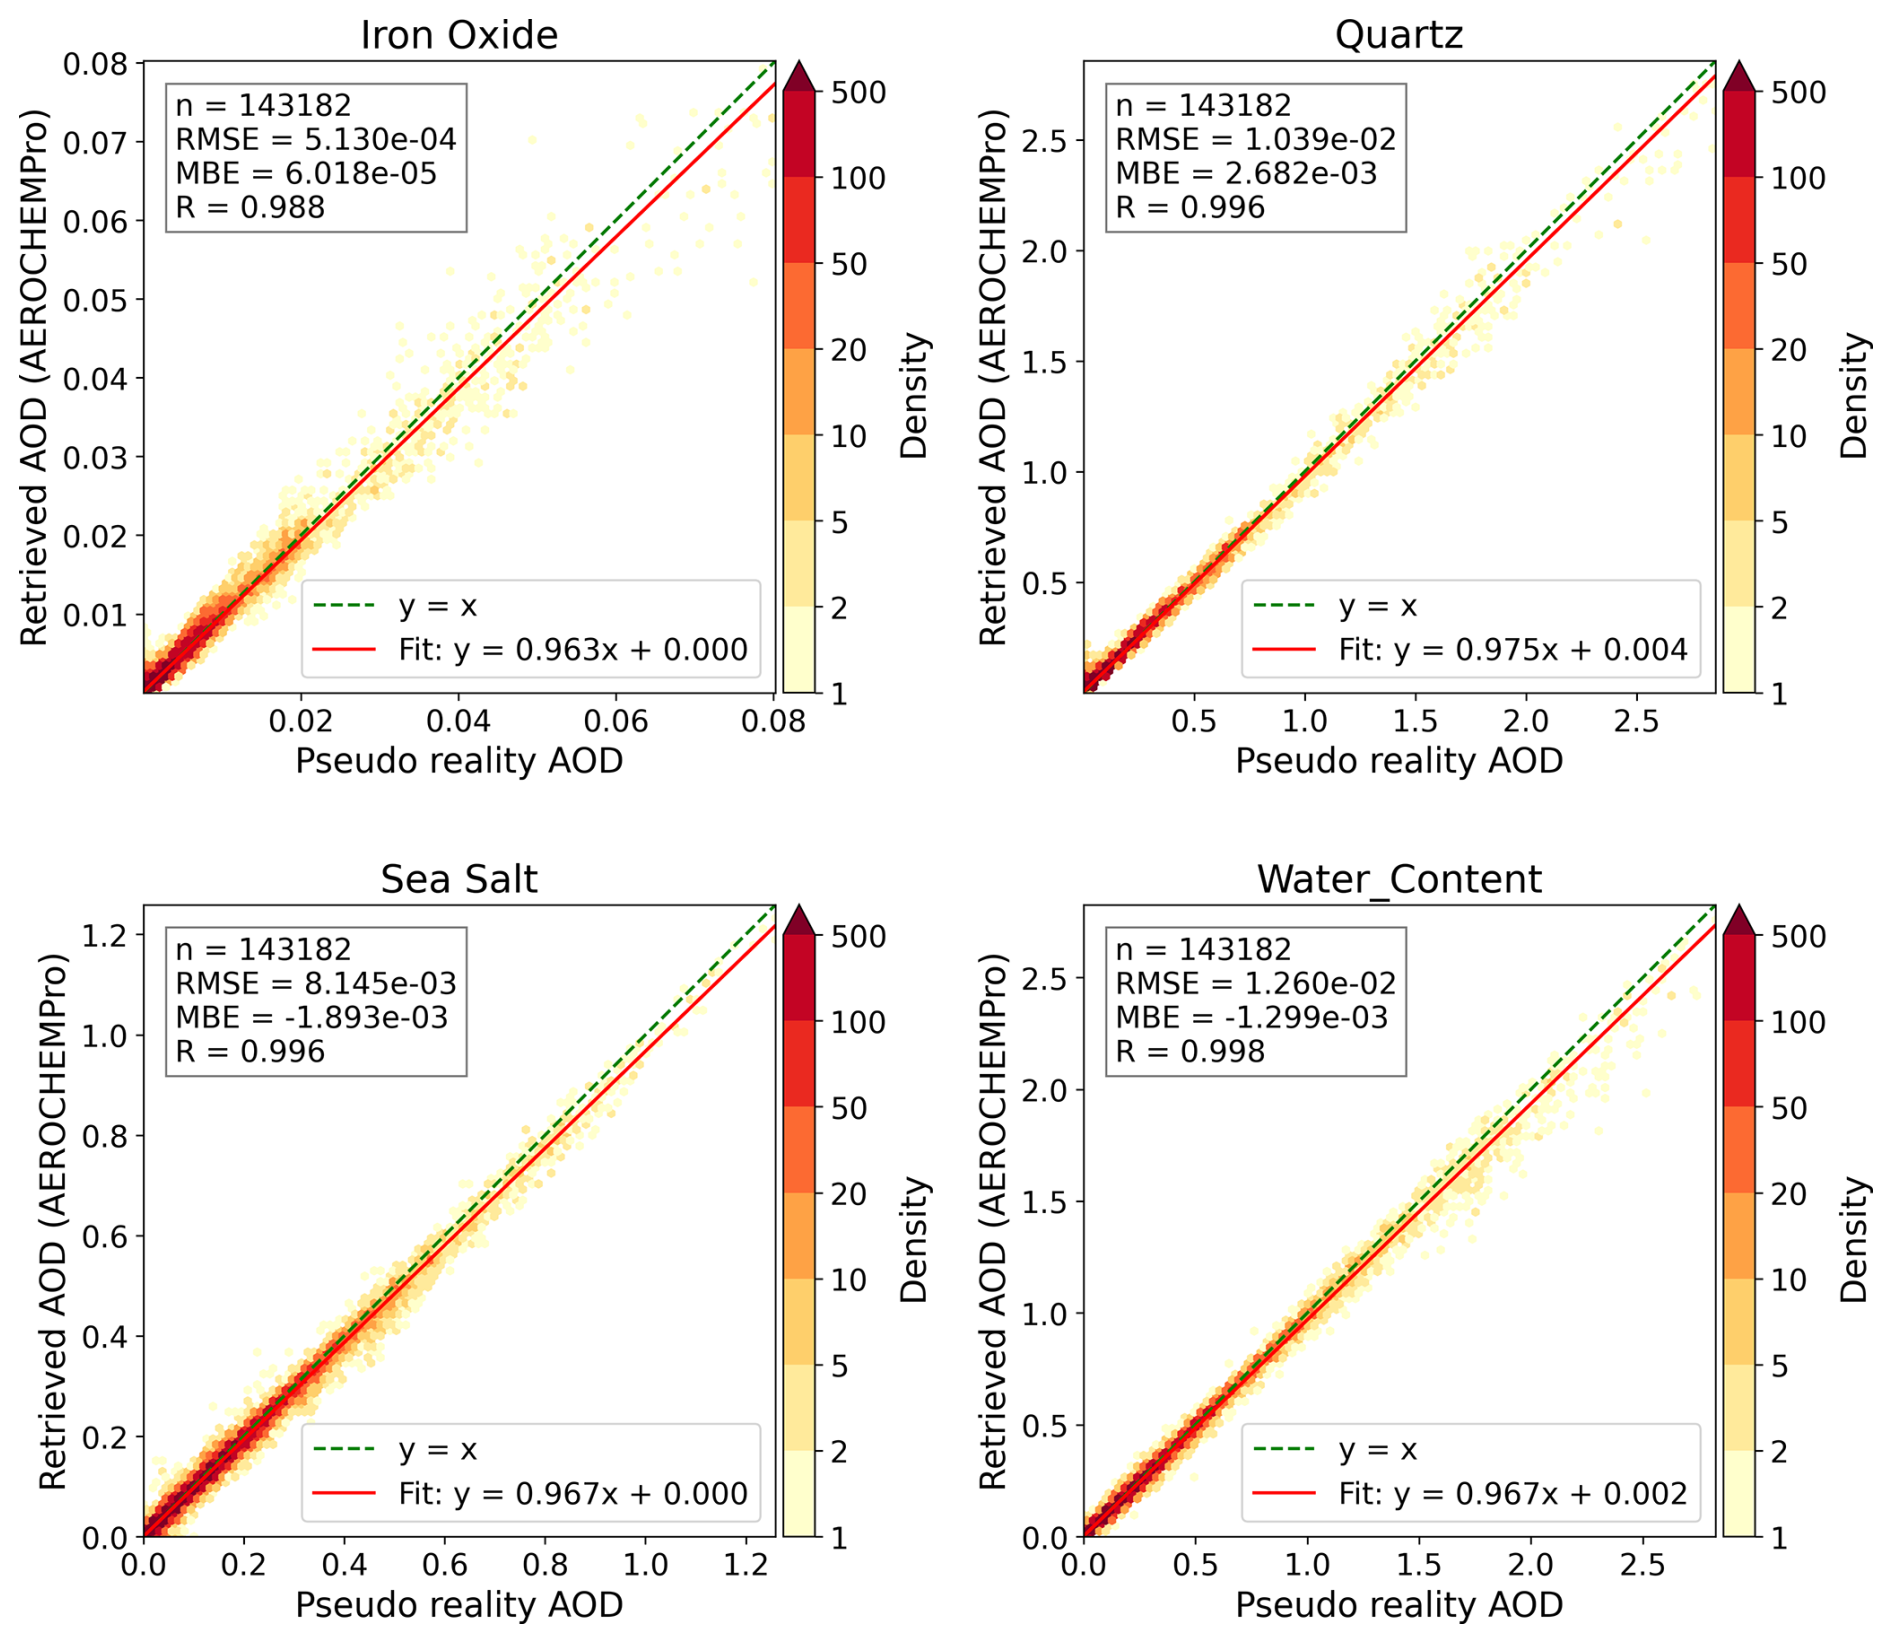
Figure 13Comparison of aerosol optical depth (AOD) at 532 nm for coarse particles (iron oxide, quartz, sea salt) and AOD contribution by water uptake, covering the entire Globe.
In summary, AEROCHEMPro is highly efficient for distinguishing key chemical species in both fine- and coarse-mode aerosols. Absorbing and dust-like species, such as black carbon, iron oxide, and quartz, along with sea salt, showed the most accurate AOD retrievals.
3.2.3 Aerosol chemical species concentrations
Figure 14 depicts an examination of AEROCHEMPro' s retrieval capabilities for aerosol chemical species volume mixing ratios in the troposphere (covering altitudes from the surface to 12 km), emphasizing both its strengths and specific limitations. AEROCHEMPro performs well in retrieving most aerosol species, with R values greater than 0.67 for all species, showing a generally good agreement with pseudo-reality. For BC and BrC, the method indicates moderately good accuracy, with R values of 0.78 and 0.67, respectively, and slopes close to unity (1.06 and 1.04). MBE values of and . Inorganic salt likewise performs well, with an R of 0.80, a slope of 1.19, and MBE of , indicating a slight overestimation. On the other hand, a slight underestimation of the volume mixing ratios of water content associated with fine particles, with R value of 0.85, slope of 0.80, and MBE of . Iron oxide and quartz are among the best-retrieved species, with R values of 0.98 each, slopes approaching unity (0.96 and 0.97, respectively), and MBE of ( and ), illustrating the robustness of AEROCHEMPro for non-spherical species. Similarly, sea salt and water content uptake associated with it have a very good agreement with pseudo-reality, with R values of 0.98 and 0.97, slope=0.96 and 0.94, and an MBE of and , resulting in near-perfect scaling. Overall, while the approach performs very well in many situations, there are some areas, particularly brown carbon, where improvements might be made to improve accuracy. Future enhancements will focus on refining the a priori refractive index models used for organic species. This would better account for the inherent variability in these components and further reduce partitioning uncertainties between absorbing species.
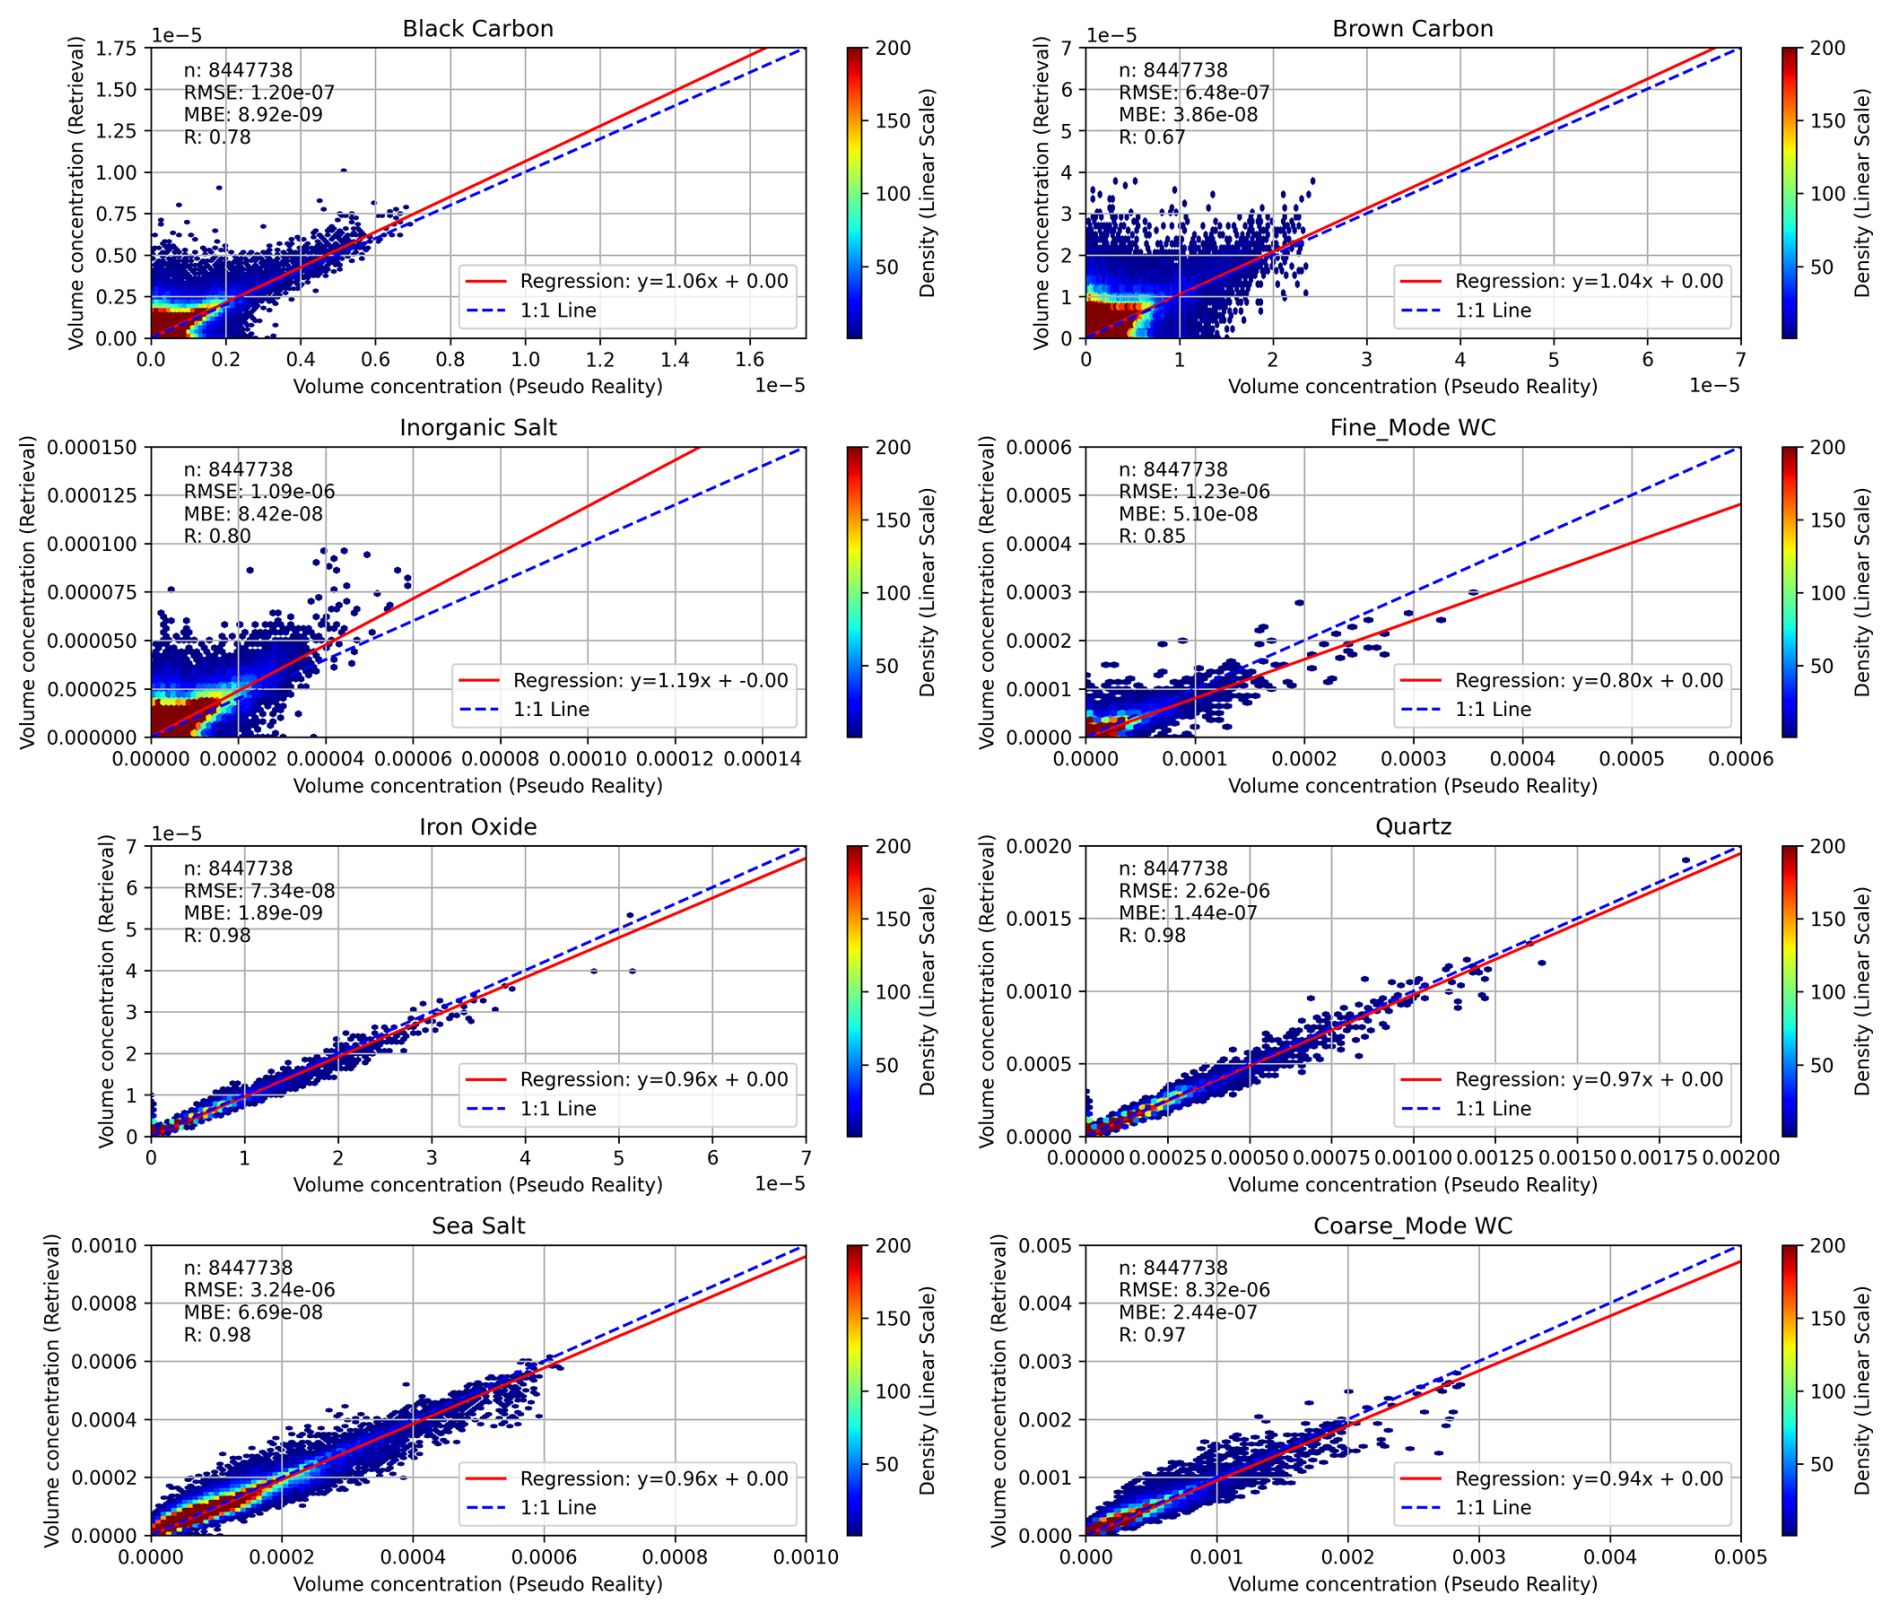
Figure 14Comparison of chemical species volume mixing ratios (ppmV) for altitudes of the tropospheric layer (0–12 km) covering the entire globe.
Table 7 summarizes the global evaluation of AEROCHEMPro retrievals for aerosol chemical species volume mixing ratio at four atmospheric levels (0–2, 2–4, 4–8, and 8–12 km), based on layer-averaged values per pixel. The findings reveal altitude-dependent performance patterns, providing valuable insights for future refinements of the retrieval method.
The R shows strong agreement between derived values and pseudo-reality for most species. The highest correlations, always above 0.97, are seen for mineral species (IO, Qz) and sea salt (SS). In comparison, water content in fine species (WCF) has lower correlations at higher altitudes, dropping to 0.55 to 0.63. MBE values are generally small, around 10−8 to 10−7, with no clear pattern of overestimation or underestimation across atmospheric layers. RMSE values get smaller with altitude for most species, which matches the lower concentrations found at higher altitudes, and are lowest for BC and IO. The slopes show a slight overestimation for BC, BrC, and IS in the lower layers, and a slight underestimation for WCF, especially above 4 km. Overall, these results show consistent retrieval accuracy worldwide, with better agreement for coarse-mode species and somewhat lower performance for fine-mode water content aerosols at higher altitudes. The overall observed altitude-dependent performance is determined by signal strength, species abundance, and the information content of measurements at each atmospheric layer.
Table 7Comparison of Chemical Species Volume mixing ratio (ppmV) covering the entire Globe for different altitude layers (0–2, 2–4, 4–8, 8–12 km).
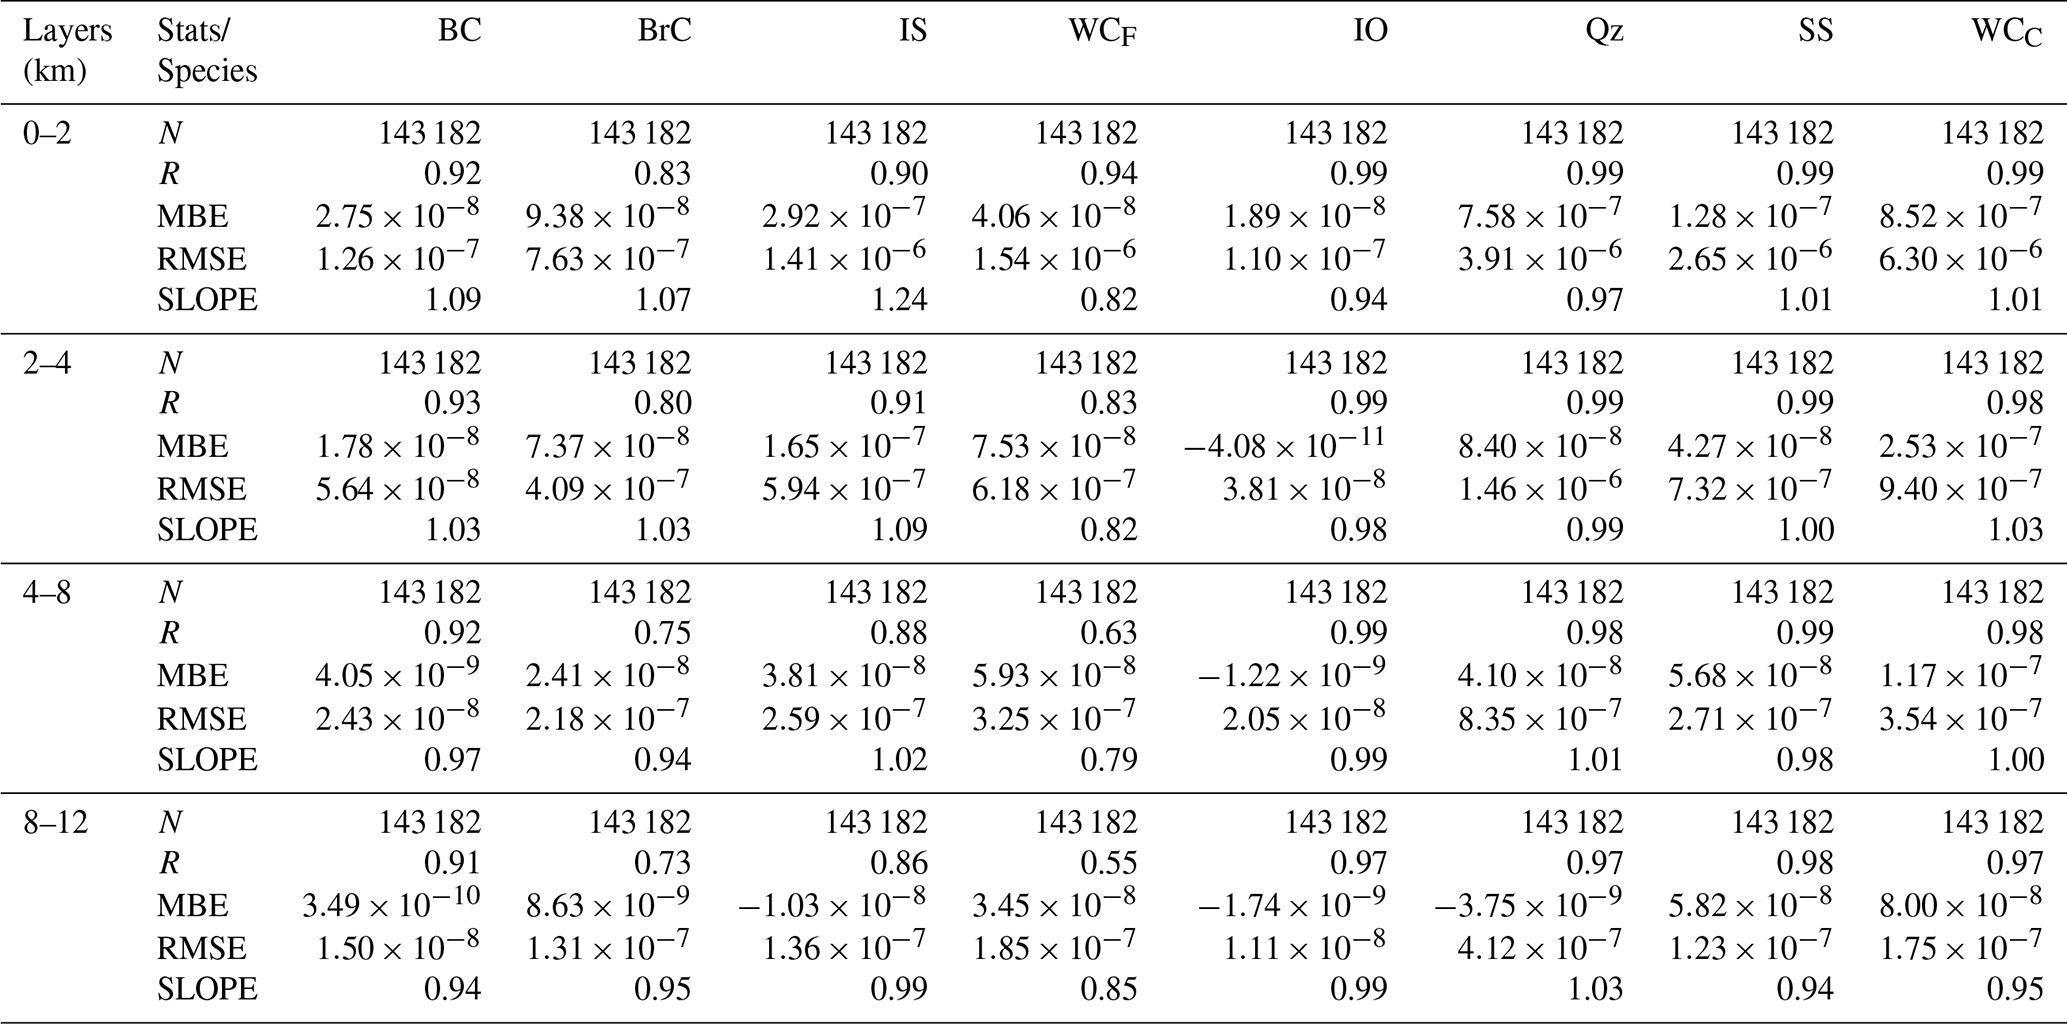
This study presents the innovative AEROCHEMPro retrieval approach, designed to retrieve vertical profiles of aerosol chemical species and their optical properties across diverse atmospheric conditions and regions. Detailed case study analysis and statistical comparisons based on a simulated atmosphere across multiple transects at a global scale reveal both its principal strengths, its unprecedented capabilities, and some limitations of the approach. In particular, because this study relies on a self-consistent simulation framework over a spatially uniform surface baseline, these results represent an idealized theoretical performance limit and a lower bound on retrieval uncertainty. Performing single-pixel retrievals over a homogeneous surface minimizes complex surface-aerosol signal mixing, presenting an optimistic baseline. Future validation phases will incorporate cross-model testing and spatially heterogeneous terrain configurations to evaluate AEROCHEMPro against real-world surface discrepancies rigorously.
The case study analysis shows that the method successfully fits all lidar and polarimeter measurements, including volume depolarization and attenuated backscatter profiles, radiance, and polarimetric Stokes elements. These findings demonstrate the method's robustness across diverse environments, capturing most aerosol-layer properties with minimal inconsistencies due to instrumental noise. Also, it demonstrates strong skills for retrieving the vertical distribution and optical properties of aerosols along a complex multi-source transect. The retrievals show consistent agreement with the pseudo-reality in terms of aerosol volume mixing ratio profiles, chemical species contributions, and optical properties, particularly in regions of high aerosol loading.
The retrieval approach accurately captures fine-mode aerosols and reproduces the boundary layer's vertical extent. A slight overestimation is seen just above the surface, up to approximately 1 km, in localized regions. Total column volume concentrations of black carbon, brown carbon, and inorganic salts closely match pseudo-reality, confirming the method's reliability in representing anthropogenic and secondary aerosols. Dust plumes are also accurately illustrated, with precise vertical extent, surface concentrations, and long-range transport, and the retrieval accurately distinguishes total column concentrations of iron oxide and quartz. Sea salt retrievals effectively represent near-surface abundance and total column concentrations, with minor underestimations inland where marine aerosols mix with continental air masses. Under aerosol mixing conditions, especially in coastal transition zones, a small bias range of is observed with/or occasional species misclassification.
Aerosol optical properties, such as modal aerosol optical depth (AOD), surface mixing ratio (Csurf), column-integrated single scattering albedo (SSA), and column-integrated lidar ratio (LR), are well matched to pseudo-reality, with peak values captured. Minor differences occur mostly in mixed aerosol environments at lower altitudes, where fine, dust, and sea-salt particles coexist, or in high-dust layers, where distinguishing species-specific optical signals is challenging. The vertical structure of the effective radius reproduces spatial and vertical variability, with only slight deviations in maritime regions and areas with heavy dust and sea salt loading. Species-specific AODs are accurately retrieved, including notable black carbon (BC) and brown carbon (BrC) peaks around emission sources, as well as wider inorganic salt distributions that match vertical profiles. In general, AEROCHEMPro accurately reproduces spatial patterns and md with remarkable fidelity. Aerosol optical depth (AOD, R roughly 1.00) and single scattering albedo (SSA, R approximately 0.96) show excellent performance. At the same time, lidar ratio (LR, R approximately 0.97) and effective radius (R approximately 0.98) are similarly well constrained. Species-specific AOD retrievals are remarkably accurate for dust and absorbing aerosols, such as quartz, iron oxide, sea salt, and black carbon, as well as inorganic salts and organic species, which are also reliably retrieved.
AEROCHEMPro offers an unprecedented capability to retrieve vertical profiles of multiple aerosol chemical species simultaneously. Instead of distinguishing eight fully independent aerosol profiles, AEROCHEMPro retrieves three composite profiles and their fractional chemical composition, providing a practical and physically consistent compromise. We consider composites of species of similar origin that often exhibit limited relative vertical variability, according to MOCAGE simulations. The method guarantees stable, well-constrained retrievals, as evidenced by consistently good performance across all tropospheric layers and accurate estimation of the eight aerosol chemical species mixing ratio profiles. Retrieval performance is remarkably high for mineral and absorbing aerosols such as iron oxide, quartz, and sea salt, with high correlation coefficients and slopes close to unity. Minor uncertainties exist in complex chemical mixtures, specifically for brown carbon and water content associated with fine particles, exhibiting slightly reduced accuracy at higher altitudes due to lower signal intensity and concentrations. Such localized limitations do not detract from the method's overall robustness. In summary, the results highlight a very strong general agreement across nearly all retrieved properties, with particularly high fidelity achieved for mineral dust. Furthermore, while the retrieval remains robust across all sizes, the performance demonstrates a notable advantage in representing coarse-mode particles compared to fine-mode aerosols. The results support the generality of AEROCHEMPro for global-scale retrievals of aerosol optical, microphysical, and chemical characteristics, giving a realistic approach to constrain aerosol composition and vertical structure in combination with lidar and polarimeter observations.
Future work will include a comprehensive uncertainty analysis of intensive properties and the application of AEROCHEMPro to real measurements from airborne instruments such as the High Spectral Resolution Lidar-2 (HSRL-2) and the Research Scanning Polarimeter (RSP), as well as satellite sensors including the Cloud-Aerosol Lidar with Orthogonal Polarization (CALIOP) and the Polarization and Directionality of the Earth's Reflectances (POLDER). Upcoming missions such as Earth Clouds, Aerosols and Radiation Explorer (EarthCARE) with its Atmospheric Lidar (ATLID) and Plankton, Aerosol, Cloud, ocean Ecosystem (PACE) with its polarimeters (SPEXone, HARP2) will provide opportunities for cross-validation of optical properties. Furthermore, the validation of vertical chemical profiles will require coincident in-situ measurements from aircraft-based field campaigns (e.g., using mass spectrometry for speciation and optical particle counters for size distributions), ground-based in situ measurements for surface validations, or ground-based aerosol profiling networks for characterizing the vertical distribution of aerosols. These independent datasets will enable rigorous testing of the retrieval framework beyond optical consistency. These initiatives will strengthen AEROCHEMPro's role in global monitoring of aerosol composition and vertical structure.
The GRASP software used in this study is publicly available at http://www.grasp-open.com (last access: 6 November 2025). Data are available upon request by email (abou.merdji@lisa.ipsl.fr).
The supplement related to this article is available online at https://doi.org/10.5194/amt-19-4669-2026-supplement.
ABM: Writing – original draft, Visualization, Methodology, Formal analysis, Validation, Conceptualization, Software, Investigation; JC: Writing – review and editing, Conceptualization, Visualization, Validation, Supervision, Software, Resources, Project administration, Methodology, Funding acquisition; FQ: Writing – review and editing, Formal analysis, Investigation, Software; AL: Writing – review and editing, Conceptualization, Validation, Methodology; OD: Writing – review and editing, Conceptualization, Validation; DNP: Proofreading; LEA: MOCAGE model run, nature run definition,. PDG: Provided the reference documentation and updated specifications for the LUCE lidar and contributed to the revision of the LUCE lidar description in the manuscript. CRT: Provided the reference documentation and updated specifications for the LUCE lidar and contributed to the revision of the LUCE lidar description in the manuscript.
At least one of the (co-)authors is a member of the editorial board of Atmospheric Measurement Techniques. The peer-review process was guided by an independent editor, and the authors also have no other competing interests to declare.
Publisher's note: Copernicus Publications remains neutral with regard to jurisdictional claims made in the text, published maps, institutional affiliations, or any other geographical representation in this paper. The authors bear the ultimate responsibility for providing appropriate place names. Views expressed in the text are those of the authors and do not necessarily reflect the views of the publisher.
We thank the support of the Centre National des Etudes Spatiales (CNES), the Centre National des Recherches Scientifiques (CNRS) – Institut National de Sciences de l'Univers (INSU), the Université Paris Est Créteil (UPEC) and the Meso-centre Institut Pierre Simon Laplace. The authors thank the scientists who developed the Modèle de Chimie Atmosphérique de Grande Echelle (MOCAGE) chemistry Transport Model (CTM), and Generalized Retrieval of Aerosol and Surface Properties (GRASP) algorithm. We would also like to thank GRASP-Earth, a French-based scientific company, for providing the technical assistance. The GRASP software used in this study is publicly available at http://www.grasp-open.com (last access: 6 November 2025). Moreover, the other data sets used in this work will be made available on a reasonable request.
This research has been supported by the Centre National d'Etudes Spatiales (grant no. AOS France project funded by CNES/TOSCA).
This paper was edited by Vassilis Amiridis and reviewed by two anonymous referees.
AOS Study Team: Science and Applications Traceability Matrix, Public Release Candidate G, NASA Atmosphere Observing System (AOS) mission, https://science.nasa.gov/mission/aos/aos-document-library/ (last access: 16 July 2026), 2021
Behrenfeld, M. J., Lorenzoni, L., Hu, Y., Bisson, K. M., Hostetler, C. A., Di Girolamo, P., Dionisi, D., Longo, F., and Zoffoli, S.: Satellite lidar measurements as a critical new global ocean climate record, 15, 5567, https://doi.org/10.3390/rs15235567, 2023.
Bond, T. C. and Bergstrom, R. W.: Light absorption by carbonaceous particles: An investigative review, Aerosol Sci. Tech., 40, 27–67, https://doi.org/10.1080/02786820500421521, 2006.
Boucher, O., Randall, D., Artaxo, P., Bretherton, C., Feingold, G., Forster, P., Kerminen, V.-M., Kondo, Y., Liao, H., Lohmann, U., Rasch, P., Satheesh, S. K., Sherwood, S., Stevens, B., and Zhang, X.-Y.: Clouds and aerosols, in: Climate Change 2013: The Physical Science Basis. Contribution of Working Group I to the Fifth Assessment Report of the Intergovernmental Panel on Climate Change, edited by: Stocker, T. F., Qin, D., Plattner, G.-K., Tignor, M., Allen, S. K., Boschung, J., Nauels, A., Xia, Y., Bex, V., and Midgley, P. M., Cambridge University Press, Cambridge, UK, 571–657, https://doi.org/10.1017/CBO9781107415324, 2013.
Brogniez, H., Cuesta, J., Noël, V., and Deschamps, A.: La mission spatiale Atmosphere Observing System (AOS), La Météorologie, 002, https://doi.org/10.37053/lameteorologie-2023-0084, 2023.
Burrows, S. M., McCluskey, C. S., Cornwell, G., Steinke, I., Zhang, K., Zhao, B., Zawadowicz, M., Raman, A., Kulkarni, G., China, S., Zelenyuk, A., and DeMott, P. J.: Ice-nucleating particles that impact clouds and climate: observational and modeling research needs, Rev. Geophys., 60, e2021RG000745, https://doi.org/10.1029/2021RG000745, 2022.
Chen, C., Dubovik, O., Fuertes, D., Litvinov, P., Lapyonok, T., Lopatin, A., Ducos, F., Derimian, Y., Herman, M., Tanré, D., Remer, L. A., Lyapustin, A., Sayer, A. M., Levy, R. C., Hsu, N. C., Descloitres, J., Li, L., Torres, B., Karol, Y., Herrera, M., Herreras, M., Aspetsberger, M., Wanzenboeck, M., Bindreiter, L., Marth, D., Hangler, A., and Federspiel, C.: Validation of GRASP algorithm product from POLDER/PARASOL data and assessment of multi-angular polarimetry potential for aerosol monitoring, Earth Syst. Sci. Data, 12, 3573–3620, https://doi.org/10.5194/essd-12-3573-2020, 2020.
Chen, C., Dubovik, O., Litvinov, P., Fuertes, D., Lopatin, A., Lapyonok, T., Matar, C., Karol, Y., Fischer, J., Preusker, R., Hangler, A., Aspetsberger, M., Bindreiter, L., Marth, D., Chimot, J., Fougnie, B., Marbach, T., and Bojkov, B.: Properties of aerosol and surface derived from OLCI/Sentinel-3A using GRASP approach: Retrieval development and preliminary validation, Remote Sens. Environ., 280, 113142, https://doi.org/10.1016/j.rse.2022.113142, 2022.
Chen, C., Litvinov, P., Dubovik, O., Bindreiter, L., Matar, C., Fuertes, D., Lopatin, A., Lapyonok, T., Lanzinger, V., Hangler, A., Aspetsberger, M., de Graaf, M., Tilstra, L. G., Stammes, P., Dandocsi, A., Gasbarra, D., Fluck, E., Zehner, C., and Retscher, C.: Extended aerosol and surface characterization from S5P/TROPOMI with GRASP algorithm. Part II: Global validation and Intercomparison, Remote Sens. Environ., 313, 114374, https://doi.org/10.1016/j.rse.2024.114374, 2024.
Chin, M., Savoie, D. L., Huebert, B. J., Bandy, A. R., Thornton, D. C., Bates, T. S., Quinn, P. K., Saltzman, E. S., and De Bruyn, W. J.: Atmospheric sulfur cycle simulated in the global model GOCART: Comparison with field observations and regional budgets, J. Geophys. Res.-Atmos., 105, 24689–24712, https://doi.org/10.1029/2000JD900385, 2000.
Cox, C. and Munk, W.: Measurement of the Roughness of the Sea Surface from Photographs of the Sun's Glitter, J. Opt. Soc. Am., 44, 838, https://doi.org/10.1364/josa.44.000838, 1954.
Cuesta, J., Kanaya, Y., Takigawa, M., Dufour, G., Eremenko, M., Foret, G., Miyazaki, K., and Beekmann, M.: Transboundary ozone pollution across East Asia: daily evolution and photochemical production analysed by IASI + GOME2 multispectral satellite observations and models, Atmos. Chem. Phys., 18, 9499–9525, https://doi.org/10.5194/acp-18-9499-2018, 2018.
Cuesta, J., Costantino, L., Beekmann, M., Siour, G., Menut, L., Bessagnet, B., Landi, T. C., Dufour, G., and Eremenko, M.: Ozone pollution during the COVID-19 lockdown in the spring of 2020 over Europe, analysed from satellite observations, in situ measurements, and models, Atmos. Chem. Phys., 22, 4471–4489, https://doi.org/10.5194/acp-22-4471-2022, 2022.
Deuzé, J. L., Bréon, F. M., Devaux, C., Goloub, P., Herman, M., Lafrance, B., Maignan, F., Marchand, A., Nadal, F., Perry, G., and Tanré, D.: Remote sensing of aerosols over land surfaces from POLDER-ADEOS-1 polarized measurements, J. Geophys. Res.-Atmos., 106, 4913–4926, https://doi.org/10.1029/2000JD900364, 2001.
Di Girolamo, P., Cosentino, A., Longo, F., Franco, N., Dionisi, D., Summa, D., Lolli, S., Suetta, E., Perna, A., and Zoffoli, S.: Introducing the Cloud Aerosol Lidar for Global Scale Observations of the Ocean-Land-Atmosphere System: CALIGOLA, in: Proceedings of the 30th International Laser Radar Conference, edited by: Sullivan, J. T., Leblanc, T., Tucker, S., Demoz, B., Eloranta, E., Hostetler, C., Ishii, S., Mona, L., Moshary, F., Papayannis, A., and Rupavatharam, K., Springer International Publishing, Cham, Switzerland, 625–630, https://doi.org/10.1007/978-3-031-37818-8_80, 2023.
Di Girolamo, P., Dionisi, D., Franco, N., Di Paolantonio, M., Summa, D., Lolli, S., Mona, L., Santoleri, R., Zoffoli, S., Tataranni, F., Venafra, S., Scopa, T., Longo, F., Votta, R., Sacchieri, V., Coppola, F., Perna, A., Cosentino, A., Hu, Y., Hostetler, C. A., Thorsen, T., Smith, J., Behrenfeld, M. J., Braun, S., Holz, B., Mace, G. J., Maring, H., Lorenzoni, L., Hall, S. R., and Trepte, C. R.: The CALIGOLA mission: An overview of the present status and the forthcoming steps, EPJ Web Conf., 362, 08003, https://doi.org/10.1051/epjconf/202636208003, 2026.
Dubovik, O., Holben, B., Eck, T. F., Smirnov, A., Kaufman, Y. J., King, M. D., Tanré, D., and Slutsker, I.: Variability of absorption and optical properties of key aerosol types observed in worldwide locations, J. Atmos. Sci., 59, 590–608, https://doi.org/10.1175/1520-0469(2002)059<0590:VOAAOP>2.0.CO;2, 2002.
Dubovik, O., Sinyuk, A., Lapyonok, T., Holben, B. N., Mishchenko, M., Yang, P., Eck, T. F., Volten, H., Muñoz, O., Veihelmann, B., van der Zande, W. J., Leon, J. F., Sorokin, M., and Slutsker, I.: Application of spheroid models to account for aerosol particle nonsphericity in remote sensing of desert dust, J. Geophys. Res.-Atmos., 111, 1–34, https://doi.org/10.1029/2005JD006619, 2006.
Dubovik, O., Herman, M., Holdak, A., Lapyonok, T., Tanré, D., Deuzé, J. L., Ducos, F., Sinyuk, A., and Lopatin, A.: Statistically optimized inversion algorithm for enhanced retrieval of aerosol properties from spectral multi-angle polarimetric satellite observations, Atmos. Meas. Tech., 4, 975–1018, https://doi.org/10.5194/amt-4-975-2011, 2011.
Dubovik, O., Li, Z., Mishchenko, M. I., Tanré, D., Karol, Y., Bojkov, B., Cairns, B., Diner, D. J., Espinosa, W. R., Goloub, P., Gu, X., Hasekamp, O., Hong, J., Hou, W., Knobelspiesse, K. D., Landgraf, J., Li, L., Litvinov, P., Liu, Y., Lopatin, A., Marbach, T., Maring, H., Martins, V., Meijer, Y., Milinevsky, G., Mukai, S., Parol, F., Qiao, Y., Remer, L., Rietjens, J., Sano, I., Stammes, P., Stamnes, S., Sun, X., Tabary, P., Travis, L. D., Waquet, F., Xu, F., Yan, C., and Yin, D.: Polarimetric remote sensing of atmospheric aerosols: Instruments, methodologies, results, and perspectives, J. Quant. Spectrosc. Ra., 224, 474–511, https://doi.org/10.1016/j.jqsrt.2018.11.024, 2019.
Dubovik, O., Fuertes, D., Litvinov, P., Lopatin, A., Lapyonok, T., Doubovik, I., Xu, F., Ducos, F., Chen, C., Torres, B., Derimian, Y., Li, L., Herreras-Giralda, M., Herrera, M., Karol, Y., Matar, C., Schuster, G. L., Espinosa, R., Puthukkudy, A., Li, Z., Fischer, J., Preusker, R., Cuesta, J., Kreuter, A., Cede, A., Aspetsberger, M., Marth, D., Bindreiter, L., Hangler, A., Lanzinger, V., Holter, C., and Federspiel, C.: A Comprehensive Description of Multi-Term LSM for Applying Multiple a Priori Constraints in Problems of Atmospheric Remote Sensing: GRASP Algorithm, Concept, and Applications, Frontiers in Remote Sensing, 2, 1–52, https://doi.org/10.3389/frsen.2021.706851, 2021.
Dusek, U., Frank, G. P., Hildebrandt, L., Curtius, J., Schneider, J., Walter, S., Chand, D., Drewnick, F., Hings, S., Jung, D., Borrmann, S., and Andreae, M. O.: Size matters more than chemistry for cloud-nucleating ability of aerosol particles, Science, 312, 1375–1378, https://doi.org/10.1126/science.1125261, 2006.
El Amraoui, L., Attié, J.-L., Semane, N., Claeyman, M., Peuch, V.-H., Warner, J., Ricaud, P., Cammas, J.-P., Piacentini, A., Josse, B., Cariolle, D., Massart, S., and Bencherif, H.: Midlatitude stratosphere – troposphere exchange as diagnosed by MLS O3 and MOPITT CO assimilated fields, Atmos. Chem. Phys., 10, 2175–2194, https://doi.org/10.5194/acp-10-2175-2010, 2010.
El Amraoui, L., Sič, B., Piacentini, A., Marécal, V., Frebourg, N., and Attié, J.-L.: Aerosol data assimilation in the MOCAGE chemical transport model during the TRAQA/ChArMEx campaign: lidar observations, Atmos. Meas. Tech., 13, 4645–4667, https://doi.org/10.5194/amt-13-4645-2020, 2020.
El Amraoui, L., Plu, M., Guidard, V., Cornut, F., and Bacles, M.: A Pre-Operational System Based on the Assimilation of MODIS Aerosol Optical Depth in the MOCAGE Chemical Transport Model, Remote Sens.-Basel, 14, 1949, https://doi.org/10.3390/rs14081949, 2022.
Feofilov, A. G., Chepfer, H., Noël, V., and Szczap, F.: Incorporating EarthCARE observations into a multi-lidar cloud climate record: the ATLID (Atmospheric Lidar) cloud climate product, Atmos. Meas. Tech., 16, 3363–3390, https://doi.org/10.5194/amt-16-3363-2023, 2023.
Franco, N., Di Girolamo, P., Summa, D., Di Paolantonio, M., and Dionisi, D.: Preliminary Studies and Performance Simulations in support of the mission “CALIGOLA”, EGU General Assembly 2023, Vienna, Austria, 24–28 Apr 2023, EGU23-16695, https://doi.org/10.5194/egusphere-egu23-16695, 2023.
Gandham, H., Dasari, H. P., Karumuri, A., Ravuri, P. M. K., and Hoteit, I.: Three-dimensional structure and transport pathways of dust aerosols over West Asia, npj Clim. Atmos. Sci., 5, 1–15, https://doi.org/10.1038/s41612-022-00266-2, 2022.
Guth, J., Josse, B., Marécal, V., Joly, M., and Hamer, P.: First implementation of secondary inorganic aerosols in the MOCAGE version R2.15.0 chemistry transport model, Geosci. Model Dev., 9, 137–160, https://doi.org/10.5194/gmd-9-137-2016, 2016.
Hänel, G.: The properties of atmospheric aerosol particles as functions of the relative humidity at thermodynamic equilibrium with the surrounding moist air, in: Advances in Geophysics, Vol. 19, Academic Press, New York, NY, USA, 73–188, https://doi.org/10.1016/S0065-2687(08)60142-9, 1976.
Herman, M., Deuzé, J. L., Marchand, A., Roger, B., and Lallart, P.: Aerosol remote sensing from POLDER/ADEOS over the ocean: Improved retrieval using a nonspherical particle model, J. Geophys. Res.-Atmos., 110, 1–11, https://doi.org/10.1029/2004JD004798, 2005.
Illingworth, A. J., Clerbaux, N., Cole, J. N. S., and Canada, E.: The EarthCARE Satellite: The next step forward in global measurements of clouds, aerosols, precipitation and radiation, Bull. Am. Meteorol. Soc., 96, 1311–1332, https://doi.org/10.1175/BAMS-D-12-00227.1, 2015.
International Agency for Research on Cancer (IARC): IARC Monographs on the Evaluation of the Carcinogenic Risk of Chemicals to Humans, Volume 35: Polynuclear Aromatic Compounds, Part 4: Bitumens, Coal-Tars and Derived Products, Shale-Oils and Soots, World Health Organization, Lyon, France, ISBN 92-832-1535-4, 1985.
IPCC: Climate Change 2021: The Physical Science Basis. Contribution of Working Group I to the Sixth Assessment Report of the Intergovernmental Panel on Climate Change, edited by: Masson-Delmotte, V., Zhai, P., Pirani, A., Connors, S. L., Péan, C., Berger, S., Caud, N., Chen, Y., Goldfarb, L., Gomis, M. I., Huang, M., Leitzell, K., Lonnoy, E., Matthews, J. B. R., Maycock, T. K., Waterfield, T., Yelekçi, O., Yu, R., and Zhou, B., Cambridge University Press, Cambridge, United Kingdom and New York, NY, USA, 2391 pp., https://doi.org/10.1017/9781009157896, 2021.
Jacobson, M. Z.: Global direct radiative forcing due to multicomponent anthropogenic and natural aerosols, J. Geophys. Res.-Atmos., 106, 1551–1568, https://doi.org/10.1029/2000jd900514, 2001.
Jayne, J. T., Leard, D. C., Zhang, X., Davidovits, P., Smith, K. A., Kolb, C. E., and Worsnop, D. R.: Development of an aerosol mass spectrometer for size and composition analysis of submicron particles, Aerosol Sci. Tech., 33, 49–70, https://doi.org/10.1080/027868200410840, 2000.
Kandler, K., Schütz, L., Deutscher, C., Ebert, M., Hofmann, H., Jäckel, S., Jaenicke, R., Knippertz, P., Lieke, K., Massling, A., Petzold, A., Schladitz, A., Weinzierl, B., Wiedensohler, A., Zorn, S., and Weinbruch, S.: Size distribution, mass concentration, chemical and mineralogical composition and derived optical parameters of the boundary layer aerosol at Tinfou, Morocco, during SAMUM 2006, Tellus B, 61, 32–50, https://doi.org/10.1111/j.1600-0889.2008.00385.x, 2009.
Kaiser, J. W., Heil, A., Andreae, M. O., Benedetti, A., Chubarova, N., Jones, L., Morcrette, J.-J., Razinger, M., Schultz, M. G., Suttie, M., and van der Werf, G. R.: Biomass burning emissions estimated with a global fire assimilation system based on observed fire radiative power, Biogeosciences, 9, 527–554, https://doi.org/10.5194/bg-9-527-2012, 2012.
Kukkonen, J., Olsson, T., Schultz, D. M., Baklanov, A., Klein, T., Miranda, A. I., Monteiro, A., Hirtl, M., Tarvainen, V., Boy, M., Peuch, V.-H., Poupkou, A., Kioutsioukis, I., Finardi, S., Sofiev, M., Sokhi, R., Lehtinen, K. E. J., Karatzas, K., San José, R., Astitha, M., Kallos, G., Schaap, M., Reimer, E., Jakobs, H., and Eben, K.: A review of operational, regional-scale, chemical weather forecasting models in Europe, Atmos. Chem. Phys., 12, 1–87, https://doi.org/10.5194/acp-12-1-2012, 2012.
Lelieveld, J., Evans, J. S., Fnais, M., Giannadaki, D., and Pozzer, A.: The contribution of outdoor air pollution sources to premature mortality on a global scale, Nature, 525, 367–371, https://doi.org/10.1038/nature15371, 2015.
Lemmouchi, F., Cuesta, J., Eremenko, M., Derognat, C., Siour, G., and Dufour, G.: Three-Dimensional Distribution of Biomass Burning Aerosols from Australian Wildfires Observed by TROPOMI Satellite Observations, Remote Sens., 14, 2582, https://doi.org/10.3390/rs14112582, 2022.
Lemmouchi, F., Cuesta, J., Lachatre, M., Brajard, J., Coman, A., Beekmann, M., and Derognat, C.: Machine Learning-Based Improvement of Aerosol Optical Depth from CHIMERE Simulations Using MODIS Satellite Observations, Remote Sens.-Basel, 15, https://doi.org/10.3390/rs15061510, 2023.
Li, C., Dubovik, O., Li, J., Fuertes, D., Lopatin, A., Litvinov, P., Lapyonok, T., Bindreiter, L., Matar, C., Chu, Y., and Tan, W.: Retrieval and validation of diurnal properties of aerosol and surface from geostationary satellite Himawari-8 using multi-pixel approach, Atmos. Meas. Tech., 18, 6609–6643, https://doi.org/10.5194/amt-18-6609-2025, 2025.
Li, L., Dubovik, O., Derimian, Y., Schuster, G. L., Lapyonok, T., Litvinov, P., Ducos, F., Fuertes, D., Chen, C., Li, Z., Lopatin, A., Torres, B., and Che, H.: Retrieval of aerosol components directly from satellite and ground-based measurements, Atmos. Chem. Phys., 19, 13409–13443, https://doi.org/10.5194/acp-19-13409-2019, 2019.
Li, L., Che, H., Derimian, Y., Dubovik, O., Luan, Q., Li, Q., Huang, X., Zhao, H., Gui, K., Zheng, Y., An, L., Sun, T., and Liang, Y.: Climatology of Fine and Coarse Mode Aerosol Optical Thickness Over East and South Asia Derived From POLDER/PARASOL Satellite, J. Geophys. Res.-Atmos., 125, https://doi.org/10.1029/2020JD032665, 2020a.
Li, L., Che, H., Derimian, Y., Dubovik, O., Schuster, G. L., Chen, C., Li, Q., Wang, Y., Guo, B., and Zhang, X.: Retrievals of fine mode light-absorbing carbonaceous aerosols from POLDER/PARASOL observations over East and South Asia, Remote Sens. Environ., 247, 111913, https://doi.org/10.1016/j.rse.2020.111913, 2020b.
Li, X. and Strahler, A. H.: Geometric-optical bidirectional reflectance modeling of the discrete crown vegetation canopy: Effect of crown shape and mutual shadowing, IEEE T. Geosci. Remote, 30, 276–292, https://doi.org/10.1109/36.134078, 1992.
Litvinov, P., Chen, C., Dubovik, O., Bindreiter, L., Matar, C., Fuertes, D., Lopatin, A., Lapyonok, T., Lanzinger, V., Hangler, A., Aspetsberger, M., de Graaf, M., Tilstra, L. G., Stammes, P., Dandocsi, A., Gasbarra, D., Fluck, E., Zehner, C., and Retscher, C.: Extended aerosol and surface characterization from S5P/TROPOMI with GRASP algorithm. Part I: Conditions, approaches, performance and new possibilities, Remote Sens. Environ., 313, 114355, https://doi.org/10.1016/j.rse.2024.114355, 2024.
Litvinov, P., Chen, C., Dubovik, O., Zhai, S., Matar, C., Li, C., Lopatin, A., Fuertes, D., Lapyonok, T., Bindreiter, L., Dornacher, M., Lehner, A., Dandocsi, A., Gasbarra, D., and Retscher, C.: Synergetic retrieval from multi-mission spaceborne measurements for enhanced aerosol and surface characterization, Atmos. Meas. Tech., 18, 7679–7716, https://doi.org/10.5194/amt-18-7679-2025, 2025.
Liu, D., Chen, S., Cheng, C., Barker, H. W., Dong, C., Ke, J., Wang, S., and Zheng, Z.: Analysis of global three-dimensional aerosol structure with spectral radiance matching, Atmos. Meas. Tech., 12, 6541–6556, https://doi.org/10.5194/amt-12-6541-2019, 2019.
Longtin, D. R., Shettle, E. P., Hummel, J. R., and Pryce, J. D.: A Wind Dependent Desert Aerosol Dust Model: Radiative Properties, Scientific Report No. 6, Air Force Geophysics Laboratory, Hanscom AFB, MA, USA, AFGL-TR-88-0112, 1988.
Lopatin, A., Dubovik, O., Chaikovsky, A., Goloub, P., Lapyonok, T., Tanré, D., and Litvinov, P.: Enhancement of aerosol characterization using synergy of lidar and sun-photometer coincident observations: the GARRLiC algorithm, Atmos. Meas. Tech., 6, 2065–2088, https://doi.org/10.5194/amt-6-2065-2013, 2013.
Lopatin, A., Dubovik, O., Fuertes, D., Stenchikov, G., Lapyonok, T., Veselovskii, I., Wienhold, F. G., Shevchenko, I., Hu, Q., and Parajuli, S.: Synergy processing of diverse ground-based remote sensing and in situ data using the GRASP algorithm: applications to radiometer, lidar and radiosonde observations, Atmos. Meas. Tech., 14, 2575–2614, https://doi.org/10.5194/amt-14-2575-2021, 2021.
Maheshwarkar, P., Cuesta, J., Formenti, P., and Lemmouchi, F.: Three-dimensional distribution of aerosols of multiple types at daily scale using TROPOMI spaceborne observations, Sci. Total Environ., 955, 177037, https://doi.org/10.1016/j.scitotenv.2024.177037, 2024.
Maignan, F., Bréon, F. M., Fédèle, E., and Bouvier, M.: Polarized reflectances of natural surfaces: Spaceborne measurements and analytical modeling, Remote Sens. Environ., 113, 2642–2650, https://doi.org/10.1016/j.rse.2009.07.022, 2009.
Mao, F., Shi, R., Rosenfeld, D., Pan, Z., Zang, L., Zhu, Y., and Lu, X.: Retrieving instantaneous extinction of aerosol undetected by the CALIPSO layer detection algorithm, Atmos. Chem. Phys., 22, 10589–10602, https://doi.org/10.5194/acp-22-10589-2022, 2022.
Martet, M., Peuch, V. H., Laurent, B., Marticorena, B., and Bergametti, G.: Evaluation of long-range transport and deposition of desert dust with the CTM MOCAGE, Tellus B, 61, 449–463, 2009.
Merdji, A. B., Xu, X., Lu, C., Habtemicheal, B. A., and Li, J.: Accuracy assessment and climatology of MODIS aerosol optical properties over North Africa, Environ. Sci. Pollut. R., 30, 13449–13468, https://doi.org/10.1007/s11356-022-22997-8, 2023a.
Merdji, A. B., Lu, C., Xu, X., and Mhawish, A.: Long-term three-dimensional distribution and transport of Saharan dust: Observation from CALIPSO, MODIS, and reanalysis data, Atmos. Res., 286, 106658, https://doi.org/10.1016/j.atmosres.2023.106658, 2023b.
Merdji, A. B., Xu, X., Mhawish, A., Cuesta, J., and Lu, C.: Comparison of Aerosol Properties over Six Major Deserts from Africa to Asia Using AERONET and CALIPSO Observations, J. Climate, 1–25, https://doi.org/10.1175/JCLI-D-25-0008.1, 2025.
Mhawish, A., Sarangi, C., Babu, P., Kumar, M., Bilal, M., and Qiu, Z.: Observational evidence of elevated smoke layers during crop residue burning season over Delhi: Potential implications on associated heterogeneous PM2.5 enhancements, Remote Sens. Environ., 280, 113167, https://doi.org/10.1016/j.rse.2022.113167, 2022.
Mukhopadhyay, S., Ningombam, S. S., Amoghavarsha, A. V., Madhavan, B. L., Eck, T. F., Dumka, U. C., Khatri, P., and Gupta, P.: Classification of global aerosol types and its radiative effects using Aerosol Robotic Network (AERONET) data, Atmos. Environ., 362, 121530, https://doi.org/10.1016/j.atmosenv.2025.121530, 2025.
Murray, B. J., Carslaw, K. S., and Field, P. R.: Opinion: Cloud-phase climate feedback and the importance of ice-nucleating particles, Atmos. Chem. Phys., 21, 665–679, https://doi.org/10.5194/acp-21-665-2021, 2021.
Myhre, G., Samset, B. H., Schulz, M., Balkanski, Y., Bauer, S., Berntsen, T. K., Bian, H., Bellouin, N., Chin, M., Diehl, T., Easter, R. C., Feichter, J., Ghan, S. J., Hauglustaine, D., Iversen, T., Kinne, S., Kirkevåg, A., Lamarque, J.-F., Lin, G., Liu, X., Lund, M. T., Luo, G., Ma, X., van Noije, T., Penner, J. E., Rasch, P. J., Ruiz, A., Seland, Ø., Skeie, R. B., Stier, P., Takemura, T., Tsigaridis, K., Wang, P., Wang, Z., Xu, L., Yu, H., Yu, F., Yoon, J.-H., Zhang, K., Zhang, H., and Zhou, C.: Radiative forcing of the direct aerosol effect from AeroCom Phase II simulations, Atmos. Chem. Phys., 13, 1853–1877, https://doi.org/10.5194/acp-13-1853-2013, 2013.
Okamoto, S., Cuesta, J., Beekmann, M., Dufour, G., Eremenko, M., Miyazaki, K., Boonne, C., Tanimoto, H., and Akimoto, H.: Impact of different sources of precursors on an ozone pollution outbreak over Europe analysed with IASI+GOME2 multispectral satellite observations and model simulations, Atmos. Chem. Phys., 23, 7399–7423, https://doi.org/10.5194/acp-23-7399-2023, 2023.
Park, M., Joo, H. S., Lee, K., Jang, M., Kim, S. D., Kim, I., Borlaza, L. J. S., Lim, H., Shin, H., Chung, K. H., Choi, Y., Park, S. G., Bae, M., Lee, J., Song, H., and Park, K.: Differential toxicities of fine particulate matters from various sources, Sci. Rep., 8, 1700, https://doi.org/10.1038/s41598-018-35398-0, 2018.
Qayyum, F., Cuesta, J., Merdji, A. B., Lopatin, A., Dubovik, O., Nandan, D., and El Amraoui, L.: Vertical distribution of type-discriminated aerosol concentration from a three-wavelength backscatter spaceborne lidar, Remote Sens. Environ., 339, 115399, https://doi.org/10.1016/j.rse.2026.115399, 2026.
Querry, M. R.: Optical Constants of Minerals and Other Materials from the Millimeter to the Ultraviolet, CRDEC-CR-88009, U.S. Army Chemical Research, Development and Engineering Center, Aberdeen Proving Ground, MD, USA, 1987.
Ramanathan, V., Crutzen, P. J., Kiehl, J. T., and Rosenfeld, D.: Atmosphere: Aerosols, climate, and the hydrological cycle, Science, 294, 2119–2124, https://doi.org/10.1126/science.1064034, 2001.
Roujean, J.-L., Leroy, M., and Deschamps, P.-Y.: A bidirectional reflectance model of the Earth's surface for the correction of remote sensing data, J. Geophys. Res., 97, 20455–20468, https://doi.org/10.1029/92JD01411, 1992.
Seinfeld, J. H. and Pandis, S. N.: Atmospheric Chemistry and Physics: From Air Pollution to Climate Change, John Wiley & Sons, Hoboken, NJ, USA, ISBN 978-1-118-94740-1, 2016.
Shettle, E. P. and Fenn, R. W.: Models for the Aerosols of the Lower Atmosphere and the Effects of Humidity Variations on Their Optical Properties, Environmental Research Papers No. 676, AFGL-TR-79-0214, Air Force Geophysics Laboratory, Hanscom Air Force Base, MA, USA, 1979.
Sič, B., El Amraoui, L., Marécal, V., Josse, B., Arteta, J., Guth, J., Joly, M., and Hamer, P. D.: Modelling of primary aerosols in the chemical transport model MOCAGE: development and evaluation of aerosol physical parameterizations, Geosci. Model Dev., 8, 381–408, https://doi.org/10.5194/gmd-8-381-2015, 2015.
Sič, B., El Amraoui, L., Piacentini, A., Marécal, V., Emili, E., Cariolle, D., Prather, M., and Attié, J.-L.: Aerosol data assimilation in the chemical transport model MOCAGE during the TRAQA/ChArMEx campaign: aerosol optical depth, Atmos. Meas. Tech., 9, 5535–5554, https://doi.org/10.5194/amt-9-5535-2016, 2016.
Sicard, M., Fortunato dos Santos Oliveira, D. C., Muñoz-Porcar, C., Gil-Díaz, C., Comerón, A., Rodríguez-Gómez, A., and Dios Otín, F.: Measurement report: Spectral and statistical analysis of aerosol hygroscopic growth from multi-wavelength lidar measurements in Barcelona, Spain, Atmos. Chem. Phys., 22, 7681–7697, https://doi.org/10.5194/acp-22-7681-2022, 2022.
Singh, A., Anchule, A., Banerjee, T., Aditi, K., and Mhawish, A.: Three-dimensional nature of summertime aerosols over South Asia, Sci. Total Environ., 842, 156834, https://doi.org/10.1016/j.scitotenv.2022.156834, 2022.
Sun, H., Biedermann, L., and Bond, T. C.: Color of brown carbon: A model for ultraviolet and visible light absorption by organic carbon aerosol, Geophys. Res. Lett., 34, 1–5, https://doi.org/10.1029/2007GL029797, 2007.
Tanré, D., Bréon, F. M., Deuzé, J. L., Dubovik, O., Ducos, F., François, P., Goloub, P., Herman, M., Lifermann, A., and Waquet, F.: Remote sensing of aerosols by using polarized, directional and spectral measurements within the A-Train: the PARASOL mission, Atmos. Meas. Tech., 4, 1383–1395, https://doi.org/10.5194/amt-4-1383-2011, 2011.
Trepte, C., Di Girolamo, P., Franco, N., Dionisi, D., Lolli, S., Santoleri, R., Valentina, S., Coppola, F., Zoffoli, S., Luciani, R., Hu, Y., Thorsen, T., Hostetler, C., Smith, J., Behrenfeld, M., Holz, B., and Mace, G. J.: CALIGOLA: A new spaceborne lidar mission, CALIPSO International Symposium on Spaceborne Lidar, Saint-Malo, France, 4–6 June 2024, https://ntrs.nasa.gov/citations/20240006526 (last access: 16 July 2026), 2024.
Wanner, W., Li, X., and Strahler, A. H.: On the derivation of kernels for kernel-driven models of bidirectional reflectance, J. Geophys. Res., 100, 21077–21089, https://doi.org/10.1029/95JD02371, 1995.
WHO: Health effects of particulate matter: policy implications for countries in eastern Europe, Caucasus and central Asia, WHO Regional Office for Europe, Copenhagen, Denmark, 15 pp., https://iris.who.int/handle/10665/344854 (last access: 16 July 2026), 2013.
Winker, D. M. and Pelon, J.: The CALIPSO MISSIOn A Global 3D View of Aerosols and Clouds, Int. Geosci. Remote Se., 2, 1329–1331, https://doi.org/10.1175/2010bams3009.1, 2010.
Winker, D. M., Hunt, W. H., and McGill, M. J.: Initial performance assessment of CALIOP, Geophys. Res. Lett., 34, 1–5, https://doi.org/10.1029/2007GL030135, 2007.
Winker, D. M., Vaughan, M. A., Omar, A., Hu, Y., Powell, K. A., Liu, Z., Hunt, W. H., and Young, S. A.: Overview of the CALIPSO mission and CALIOP data processing algorithms, J. Atmos. Ocean. Tech., 26, 2310–2323, https://doi.org/10.1175/2009JTECHA1281.1, 2009.
Xu, X., Yang, Y., Xiong, Z., Gong, J., and Luo, T.: Three-Dimensional Distribution and Transport Features of Dust and Polluted Dust over China and Surrounding Areas from CALIPSO, Remote Sens.-Basel, 15, https://doi.org/10.3390/rs15245734, 2023.
Zhang, Q., Jimenez, J. L., Canagaratna, M. R., Allan, J. D., Coe, H., Ulbrich, I., Alfarra, M. R., Takami, A., Middlebrook, A. M., Sun, Y. L., Dzepina, K., Dunlea, E., Docherty, K., DeCarlo, P. F., Salcedo, D., Onasch, T., Jayne, J. T., Miyoshi, T., Shimono, A., Hatakeyama, S., Takegawa, N., Kondo, Y., Schneider, J., Drewnick, F., Borrmann, S., Weimer, S., Demerjian, K., Williams, P., Bower, K., Bahreini, R., Cottrell, L., Griffin, R. J., Rautiainen, J., Sun, J. Y., Zhang, Y. M., and Worsnop, D. R.: Ubiquity and dominance of oxygenated species in organic aerosols in anthropogenically-influenced Northern Hemisphere midlatitudes, Geophys. Res. Lett., 34, 1–6, https://doi.org/10.1029/2007GL029979, 2007.