
the Creative Commons Attribution 4.0 License.
the Creative Commons Attribution 4.0 License.
 | 31 Jul 2026
Performance and methodological evaluation of a quantum-cascade-laser photoacoustic aerodynamic gradient system for field-scale NH3 flux measurements
János Fekete
Zoltán Bozóki
Csilla Gombi
László Horváth

Zoltán Nagy
Krisztina Pintér
Tamás Weidinger
Anna Szabó
Helga Huszár
Reliable quantification of ammonia (NH3) surface–atmosphere exchange remains challenging due to the compound's reactivity, inlet interactions, and the sensitivity of gradient-based flux estimates to instrumental response characteristics. We present the field evaluation and methodological assessment of a quantum-cascade-laser (QCL) based photoacoustic (PA) aerodynamic gradient system for half-hourly NH3 flux measurements under agricultural conditions. The campaign covered a 54 d post-fertilization period under predominantly dry soil conditions, including the transition from bare soil to a developing winter rapeseed canopy. Instrumental performance was assessed through co-located inlet comparison experiments, yielding a random uncertainty of ±2 ppb (1σ) and demonstrating negligible systematic bias between sampling channels. The system operated continuously under field conditions with active thermal stabilization and humidity management. Fluxes were calculated using Monin–Obukhov similarity theory (MOST) across an ensemble of universal stability functions to evaluate methodological sensitivity. Sensitivity analysis indicated that variability attributable solely to stability-function selection remained small relative to observed diurnal flux amplitudes. The mean NH3 loss over the investigated period was 1.85 nmol m−2 s−1, corresponding to a cumulative loss of 1.21 kg N ha−1 or 4.0 % of the applied fertilizer nitrogen. Based on instrumental uncertainty (±2 ppb) and literature-reported uncertainty ranges of MOST-based aerodynamic gradient flux calculations, the overall uncertainty is estimated to be approximately ±25 %, corresponding to ±0.30 kg N ha−1. A pronounced diurnal asymmetry was observed, with daytime emissions approximately 1 order of magnitude higher than nighttime values, reflecting strong coupling between turbulent exchange and radiation-driven surface processes. Complementary machine-learning analysis indicated that incorporating short-term temporal memory substantially improved the representation of NH3 flux dynamics and revealed distinct daytime and nighttime exchange regimes. The combined QCL–photoacoustic gradient system demonstrated robust field performance and low instrumental bias, supporting its applicability for long-term field-scale studies of agricultural NH3 exchange under post-fertilization conditions.
Please read the corrigendum first before continuing.
-
Notice on corrigendum
The requested paper has a corresponding corrigendum published. Please read the corrigendum first before downloading the article.
-
Article
(1830 KB)
-
The requested paper has a corresponding corrigendum published. Please read the corrigendum first before downloading the article.
- Article
(1830 KB) - Full-text XML
- Corrigendum
- BibTeX
- EndNote


The accumulation of reactive nitrogen (Nr) in the Earth system is a major environmental consequence of modern agriculture. Since the industrial fixation of atmospheric dinitrogen, large amounts of Nr have been introduced into ecosystems, where a single nitrogen atom may contribute sequentially to multiple impacts – air pollution, eutrophication, acidification, biodiversity loss and climate forcing – described as the nitrogen cascade (Galloway et al., 2003).
Ammonia (NH3) is a central component of this cascade. It is the dominant alkaline gas in the atmosphere and a key precursor of secondary inorganic aerosol formation, thereby contributing to PM2.5 burdens and associated health impacts (Seinfeld and Pandis, 2016). Deposition of NH3 NH also perturbs nutrient balances in sensitive ecosystems and can reduce plant species richness under elevated nitrogen inputs (Bobbink et al., 2010). Volatilized NH3 may also contribute indirectly to climate change as part of the nitrogen cascade, since redeposited reactive nitrogen can subsequently undergo nitrification and denitrification, leading to N2O formation.
Agriculture accounts for the majority of global NH3 emissions, with mineral fertilizer use being a major driver. Fertilizer-related NH3 emissions have increased strongly since the 1960s and may further rise under future food demand and changing climate conditions (Sutton et al., 2013; Xu et al., 2019). From an agronomic perspective, NH3 volatilization represents a direct loss of applied nitrogen and contributes to low nitrogen use efficiency at the global scale (e.g. Coskun et al., 2017; Bindraban et al., 2020).
Robust quantification of fertilizer-derived NH3 losses is therefore essential both for environmental assessments and for evaluating mitigation options. However, NH3 exchange measurements remain challenging because NH3 is reactive and “sticky”, shows strong interactions with wet surfaces, and commonly exhibits bidirectional exchange, with the surface acting as either a sink or a source depending on ambient concentrations and compensation point dynamics (Flechard et al., 2013). This complexity is amplified after fertilization, when soil emission potentials are high but canopy development increasingly promotes within-canopy uptake and recapture processes.
Micrometeorological flux methods (e.g., aerodynamic gradient, relaxed eddy accumulation, eddy covariance) are suitable for field-scale quantification, but they require accurate, fast-response concentration measurements. The performance of NH3 instrumentation under field conditions has therefore been a long-standing focus, including large intercomparison efforts (von Bobrutzki et al., 2010). Besides chemical ionization mass spectrometry approaches enabling fast EC-type measurements (Sintermann et al., 2011), photoacoustic (PA) techniques have also been used in NH3 monitoring and gradient applications (Pogány et al., 2010; Nelson et al., 2019; Kamp et al., 2020).
Photoacoustic approaches are attractive for long-term field deployment because of their sensitivity and continuous operation, but they are prone to practical issues relevant for gradient flux work: (i) humidity-related interferences, (ii) adsorption/desorption in sampling lines, and (iii) inlet switching and time-lag effects that can distort gradients if not handled carefully. Response-time and delay characteristics of PA multi-gas monitors have been explicitly investigated (Rom and Zhang, 2010), and diode-laser-based photoacoustic instruments have been developed and evaluated specifically for surface–atmosphere NH3 flux applications (Pogány et al., 2010).
The primary objective of this study was to evaluate the field performance and methodological robustness of a Quantum Cascade Laser (QCL) based photoacoustic aerodynamic gradient system for NH3 flux measurements under agricultural conditions. NH3 losses following mineral fertilizer application were quantified using aerodynamic gradient flux measurements combined with photoacoustic NH3 mixing ratio observations. By covering the transition from bare soil shortly after fertilization to a developing crop canopy later in the season, the study targets a critical period when emission strengths and recapture processes change rapidly. Particular emphasis was placed on instrumental performance, methodological aspects of gradient-based flux calculations, and the robustness of Monin–Obukhov similarity-based flux estimates under field conditions. In addition, machine-learning analysis was applied as a complementary interpretative tool to investigate temporal dynamics and regime-dependent controls of the measured NH3 fluxes.
2.1 Study Site and Experimental Conditions
Field measurements were carried out on an arable plot located near Kartal, Hungary, at the Gödöllő Experimental Farm. The observation period covered the late summer to early autumn growing season, extending from 28 August to 21 October 2025. The geographic coordinates of the site are 47°39′42.56′′ N, 19°31′43.21′′ E, with an elevation of approximately 153 m above sea level.
The region is characterized by a continental climate, with a long-term (1991–2020) mean annual precipitation of 550–600 mm. During the measurement campaign, cumulative precipitation amounted to 65 mm, resulting in predominantly dry soil conditions.
The soil at the site is classified as a Haplic Phaeozem (Humic, Pantoloamic) according to the World Reference Base for Soil Resources. Particle size analysis indicated a composition of 32.3 % clay, 49.1 % silt, and 18.6 % sand, corresponding to a silty clay loam texture under the USDA classification scheme.
Field management prior to and during the experiment included mineral fertilization and crop establishment. On 25 August, the field was fertilized with 200 kg ha−1 of granular diammonium phosphate, equivalent to 30 kg N ha−1 and 80 kg P ha−1. Winter rapeseed (Brassica napus L.) was sown 2 d later, on 27 August. As a result, the measurement period encompassed a transition from bare soil conditions immediately after fertilization to a developing crop canopy by mid-October.
2.2 Measurement Techniques and Instrumentation
2.2.1 Ammonia mixing ratio measurements
Ammonia mixing ratios were determined using a photoacoustic spectroscopy analyzer developed at the University of Szeged. One of the main components of the instrument is the data acquisition and control unit, which is a highly integrated embedded system developed by Videoton Holding Zrt. specifically for photoacoustic measurement systems.
The photoacoustic cell, thermostated at 50 °C, separates the internal volume of the instrument from the sample gas flow. Acoustic signal generation takes place in one of the two resonators machined into the cell. This configuration is referred to as a differential photoacoustic cell (Miklós et al., 2001).
Acoustic signal detection is performed using two MEMS microphones (SisonicTM SPU0410HR5H-PB, Knowles). The microphones are connected to a differential amplifier, which performs signal preamplification, filtering, and analogue-to-digital conversion using a 16-bit ADC. Lock-in detection is implemented digitally; the Fourier transformation is carried out by an FPGA. The sampling rate is 50 kHz, resulting in a frequency resolution of approximately 12 Hz.
A quantum cascade laser (QCL) operating at a wavelength of 10.39 µm was used. This wavelength is suitable for ambient ammonia measurements, as ammonia is one of the dominant atmospheric absorbers at this wavelength under typical ambient conditions, minimizing spectral interference effects. In photoacoustic measurements, VOCs may cause a positive bias in the 10.39 µm (≈ 962 cm−1) region due to spectral overlap (Liu et al., 2020); however, in our case, the use of a narrow-linewidth, small-bandwidth QCL allows targeting a specific, isolated absorption line, thereby effectively eliminating this interference. The optical output power of the QCL (model: QD10500CM1, Thorlabs) is approximately 50 mW. A mirror was placed at the end of the photoacoustic cell to double the effective optical path length and thereby enhance signal generation. Laser driving and temperature control were provided by a Thorlabs ITC4002QCL unit, while the modulation signal was generated by the control electronics of the instrument.
Air was sampled at two vertical levels, positioned at 0.39 and 3.00 m above the soil surface, to enable flux estimation using the aerodynamic gradient method. Each measurement point consisted of 1 min of flushing, followed by 2 min of data acquisition, repeated for each sampling level. Level selection was achieved using two solenoid valves (Asco SCH284B015). The sampling system was primarily constructed from PTFE tubing with an outer diameter of 6 mm and an inner diameter of 4 mm. The length of each PTFE sampling line was 4 m. Given the inner diameter of 4 mm and the volumetric flow rate of 800 cm3 min−1, the internal volume of one sampling line was approximately 50 cm3, corresponding to a residence time of about 3.8 s.
The photoacoustic cell itself is made of stainless steel and was coated with a sodium hydroxide (1.5 M) solution to reduce ammonia adsorption. The volumetric flow rate was set to 800 cm3 min−1. A flow meter, a solenoid valve, and a needle valve were installed between the pump and the cell to ensure a stable and constant flow rate.
The sensitivity of the instrument was 17.9 µV ppb−1, and the minimum detectable mixing ratio (DL) was approximately 3 ppb with 2 min of signal averaging, determined from the standard deviation (SD) and the slope of the calibration line as DL = 3 × SD (Shrivastava and Gupta, 2011). Approximately 97.5 % of the measured values fell within the range 3–87 ppb, with a mean value of 20 ppb.
The complete system was installed in a standard electrical enclosure with additional thermal insulation. The enclosure has an IP66 rating, allowing operation under various outdoor weather conditions. The internal temperature of the enclosure was actively controlled and set to 42 °C. During periods of high ambient temperature, a protective tent was installed above the instrument to shield it from direct solar radiation and prevent overheating.
Prior to the field deployment, both inlet lines were temporarily placed at the same height to assess instrumental and sampling-related measurement uncertainty. During this co-located inlet comparison, both sampling channels were positioned at 300 cm above the soil surface, so that no systematic vertical concentration gradient was expected. The comparison therefore reflects the combined uncertainty associated with the two sampling lines, valve switching, and instrumental response. Results are detailed in Sect. 3.1.
For the flux calculations, mixing ratios (ppb) were converted to concentrations (nmol m−3) using the molar volume at the given temperature and pressure.
To minimize gradient attenuation due to inlet adsorption–desorption effects, identical tubing materials and lengths were applied for both sampling heights, and inlet switching was preceded by a dedicated flushing period. Under steady-state conditions, the effective equilibration time of the system was shorter than the 2 min averaging interval, thereby limiting gradient distortion during half-hourly flux calculations.
2.2.2 Auxiliary meteorological and surface measurements
A comprehensive set of ancillary measurements was conducted to support flux calculations and interpretation. Three-dimensional wind speed and turbulence parameters were measured at 10 Hz using a METEK USA-1 ultrasonic anemometer. Soil physical conditions were monitored with a Campbell Scientific CS650 reflectometer, providing soil temperature and volumetric water content, from which water-filled pore space (WFPS) was derived. Air temperature and relative humidity were measured with a CS215 probe; precipitation was recorded using an ARG100 tipping bucket rain gauge; photosynthetically active radiation (PAR) was measured with an SKP215 quantum sensor; and global radiation (Ig) was measured with a CM3 pyranometer. Crop development was characterized by repeated canopy transmittance measurements at seven permanent field locations using an AccuPAR LP-80 ceptometer, from which leaf area index (LAI) was derived. Leaf surface wetness was monitored with a PHYTOS-31 sensor. All instruments were connected to and synchronized by a Campbell Scientific CR3000 data logger, ensuring consistent time alignment across measurement systems.
High-frequency wind and scalar data from the sonic anemometer and a LiCor 7500 open-path infrared gas analyzer were processed using EddyPro software (version 7.0.9). Wind velocity, wind direction, friction velocity (u*), temperature scale parameter (T*), momentum flux, sensible and latent heat fluxes, and the Monin–Obukhov length were calculated from the 10 Hz measurements.
2.3 Flux Calculations
The turbulent ammonia flux was calculated using the aerodynamic gradient method with a 30 min averaging time interval at two measurement heights (z1 = 0.39 m, z2 = 3.00 m). During the calculations, the displacement height (d) was assumed to be 0.05 m. The friction velocity (u*) and the Monin-Obukhov length (L) were measured and/or derived using an eddy-covariance measurement system. Flux calculations were based on Monin–Obukhov similarity theory (MOST) using a range of universal similarity functions reported in the literature; additionally, turbulent fluxes were also determined using the simplest logarithmic profile approximation.
A widely used approach for flux calculations based on trace gas gradient measurements is the application of universal stability functions that depend on atmospheric stability. Since NH3 can generally be treated as a passive scalar in the surface layer, universal similarity functions developed for sensible heat transfer are commonly applied in aerodynamic gradient studies. This methodology has been used, among others, by Phillips et al. (2004), Spirig et al. (2010), Toyota et al. (2016), Kułek and Weidinger (2023), Zahn et al. (2023), and Abdulwahab et al. (2025), and is also described in methodological overviews of modern micrometeorological measurement techniques (Trebs et al., 2021).
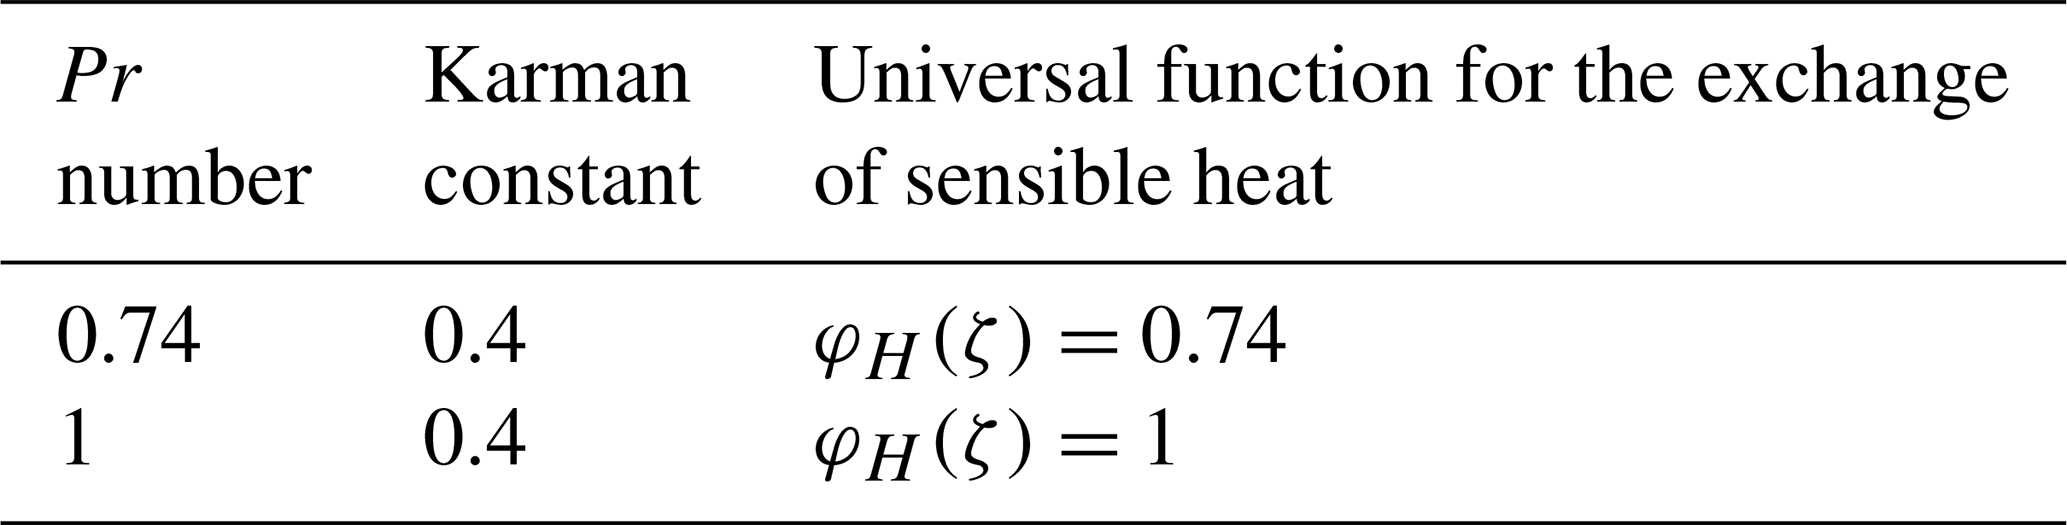
In the case of stable stratification, 30 universal functions were applied together with logarithmic profiles characterized by two different Prandtl numbers (Tables A1 and A3), whereas under unstable stratification 22 universal functions were used together with two logarithmic profile formulations (Tables A2 and A3). These were selected based on the synthesis studies of Högström (1988), Weidinger et al. (2000), Prueger and Kustas (2005), Kramm and Herbert (2009), Foken (2017), and a case study by Kułek and Weidinger (2023), as well as studies addressing turbulent exchange processes of trace gases. In addition to the classical logarithmic profile assumption (Prandtl number Pr = 1), several universal functions widely used in the literature were applied, such as those proposed by Businger et al. (1971) and Dyer (1974), later reformulated by Högström (1988).
The concentration gradient (Eq. 1) was expressed based on Monin–Obukhov similarity theory, adopting the commonly used assumption that the universal function describing trace gas transport has the same functional form as that for sensible heat transport φc(ζ) ≡ φH(ζ) (Mayer et al., 2011; Zahn et al., 2023; Abdulwahab et al., 2025). The profile equation for concentration gradient is
where c∗ is the dynamical concentration scale for the NH3 flux calculation, and are the 30 min mean concentrations.
Assuming a near-logarithmic profile, the dimensionless height was defined as ζk = , where zk denotes the geometric mean height of the two measurement levels:
Although the integral form of Eq. (1) could also be applied (Weidinger et al., 2000; Foken, 2017; Foken and Mauder, 2024), for two closely spaced measurement levels the direct calculation using Eq. (1) provides sufficiently accurate results. Comparative calculations were performed using the two most commonly applied universal functions (Businger et al., 1971; Dyer, 1974), revealing negligible differences between the two approaches.
Universal functions have generally been validated within the interval −1 ≤ ζ ≤ + 1. In extremely stable (ζ > 1) or extremely unstable (ζ < −1) conditions – representing approximately 2 % of the cases – the critical dimensionless heights (ζkrit = 1, if ζ > 1, ζkrit = −1, if ζ < −1) was applied in the calculations, while retaining the original stability classification.
The ith type of dynamical concentration scale, was calculated based on the corresponding universal function, φci(ζk) and von Karman-constant, κi from Eq. (1):
The 30 min ammonia flux was obtained by averaging the individual flux estimates:
where N = 30 for stable or neutral stratification (ζk ≥ 0) and N = 22 for unstable (ζk < 0) stratification, including the two logarithmic profile approaches in both cases (Appendix, Tables A1–A3).
To evaluate methodological robustness, fluxes were calculated using a comprehensive ensemble of universal similarity functions under both stable and unstable stratification. Sensitivity analysis showed that the variability attributable solely to stability-function selection remained small relative to observed diurnal flux amplitudes, indicating that the dominant uncertainty did not arise from similarity-function choice.
2.4 Machine Learning Analysis
Because ammonia flux time series inherently exhibit strong autocorrelation and non-stationarity, strict chronological validation was implemented to prevent temporal leakage. This design ensures that predictive performance reflects genuine forward extrapolation in time rather than artefacts arising from random data partitioning.
Half-hourly NH3 fluxes (nmol m−2 s−1) were analyzed over a multi-day post-fertilization period (n = 2590 observations). The dataset included a comprehensive set of candidate predictors encompassing structural variables (leaf area index), soil physical properties (volumetric water content, water-filled pore space, soil temperature), meteorological drivers (air temperature, relative humidity, precipitation, global radiation, photosynthetically active radiation), turbulent exchange parameters (friction velocity, momentum flux, sensible and latent heat fluxes, wind speed and direction, Monin–Obukhov length), chemical variables (NH3 concentration at 3 m), management-related variables (days after fertilization), and derived aerodynamic and boundary layer resistances. All predictors were initially included in the model without subjective pre-selection.
The flux time series exhibited three dominant structural characteristics: a pronounced diurnal cycle with nighttime minima and daytime maxima, a progressive decay following fertilizer application, and strong short-term autocorrelation at sub-daily scale. Because these properties violate assumptions of independence and stationarity, a time-aware modelling framework was adopted.
To prevent temporal leakage, model validation was conducted using a strictly chronological split. The first 80 % of days were used for training and the remaining 20 % were reserved as an independent test set representing forward prediction in time. No random cross-validation was applied.
Model performance was evaluated exclusively on the final 20 % of days, chronologically withheld from model training to represent forward prediction in time, using the coefficient of determination (R2), root mean square error (RMSE) and mean absolute error (MAE).
To account for short-term dynamical persistence, autoregressive lag features were introduced to represent short-term temporal persistence in the NH3 flux time series.
Specifically, NH3 flux values from the previous six half-hour intervals (NH3t−1 to NH3t−6), corresponding to a 3 h memory window, were included as predictors. Lagged values crossing day boundaries were masked to avoid artificial carryover effects.
The term “memory” is used here to describe the apparent temporal persistence of the NH3 flux time series, rather than instrumental carry-over. Since the residence time in the sampling line was only about 3.8 s and each inlet switch was followed by a 1 min flushing period, instrumental memory cannot explain the observed persistence over several half-hourly intervals. The lag dependence is therefore interpreted as a property of the soil–surface–canopy exchange system, reflecting the gradual evolution of the surface NH NH3 reservoir, soil temperature and moisture conditions, adsorption–desorption processes, and persistent turbulence regimes.
A tree-based ensemble regression model was employed to capture nonlinear relationships and high-order interactions among meteorological, surface, turbulence-related, and autoregressive predictors without assuming linearity. Missing values were handled using median imputation fitted on the training dataset and applied consistently to the test data.
To interpret model structure and underlying mechanisms, three complementary approaches were applied: impurity-based and permutation feature importance to identify dominant predictors, Partial Dependence (PDP) and Individual Conditional Expectation (ICE) curves to visualize nonlinear responses, and Friedman's H-statistic to quantify the strength of pairwise nonlinear interactions. Residual autocorrelation within days was additionally evaluated using autocorrelation functions (ACF) to assess remaining temporal structure after modelling. Finally, regime-specific analyses were performed separately for daytime (PAR > 0) and nighttime (PAR = 0) conditions to identify potential shifts in dominant environmental controls.
3.1 Uncertainty Estimation and Measurement Reliability
To assess the measurement reliability and random uncertainty of the system, samples were collected at a single inlet height, applying two-minute temporal averaging. This averaging strategy suppresses short-term fluctuations and ensures that the comparison predominantly reflects instrumental and sampling uncertainties, rather than environmental variability.
During the comparison period, both sampling channels operated at an identical height of 300 cm. Under these conditions, the agreement between the two datasets was excellent. The Pearson correlation coefficient (r = 0.97) indicates a strong linear relationship. Linear regression yielded a = 0.97 × b + 0.60, demonstrating an almost one-to-one correspondence with only a minor offset (Fig. 1).
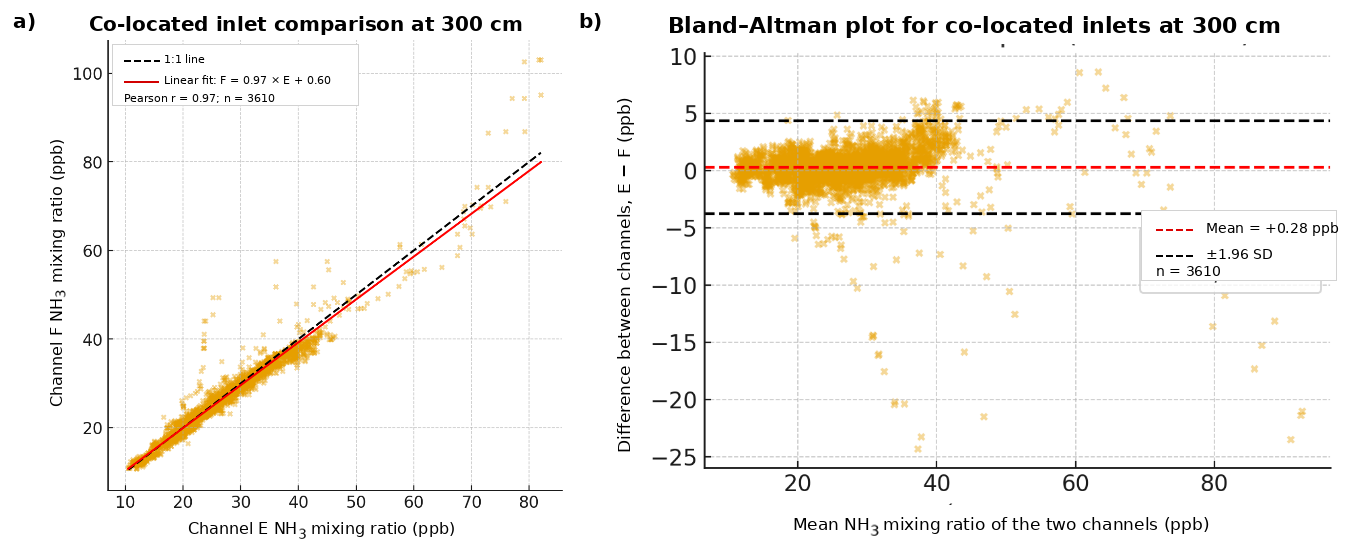
Figure 1Co-located inlet comparison of the two NH3 sampling channels at 300 cm above the soil surface. (a) Scatter plot with the 1:1 line and linear regression fit. (b) Bland–Altman plot of the channel differences. The mean difference was +0.28 ppb and the standard deviation of the differences was 2.06 ppb (r = 0.97, n = 3610).
The small mean offset of +0.28 ppb was negligible relative to the standard deviation of the differences (2.06 ppb), suggesting that the observed deviations were dominated by instrumental noise and sampling uncertainty.
Based on these results, the typical random measurement uncertainty between the two channels under identical sampling conditions is estimated to be ±2 ppb (1σ). Accordingly, the upper bound of the random error at the 95 % confidence level (±1.96σ) is approximately ±4 ppb.
Because inlet-related adsorption/desorption may represent a potential source of bias in NH3 measurements, an additional in situ inlet-length test was performed to evaluate its effect under the operating conditions of this study. The test showed that the dynamic inlet-induced bias was negligible compared with the measurement uncertainty; the test design and results are presented in Appendix B.
3.2 Diurnal Variation of Ammonia Flux and Turbulent Exchange
Ammonia fluxes during nighttime were relatively stable, ranging between −0.08 and 0.72 nmol m−2 s−1. In contrast, the daytime period exhibited a pronounced diurnal pattern characterized by a distinct maximum in the late morning hours. This behavior can be attributed primarily to the diurnal dynamics of turbulent exchange.
Ammonia fluxes were calculated using Monin–Obukhov similarity theory (MOST) based on vertical concentration gradients and micrometeorological parameters. For diagnostic purposes, an effective turbulent transfer coefficient (Kc) was derived such that
where Kc represents the stability-corrected exchange coefficient obtained from the MOST framework rather than an independently fitted parameter.
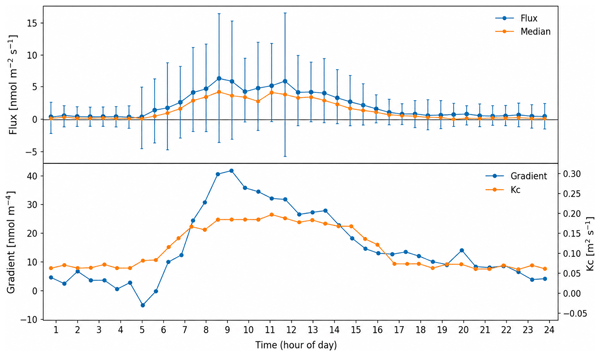
The turbulent diffusion coefficient (Kc), calculated from 2 min averaged flux and concentration gradient data, demonstrated a clear diurnal course. During the nighttime period (16:00–03:00 UTC, zonal time is UTC+2), Kc averaged 0.06 m2 s−1, indicating suppressed turbulent mixing due to limited surface energy input. In contrast, daytime values increased substantially, reaching approximately 0.17 m2 s−1 (Fig. 2), reflecting enhanced convective turbulence under higher radiation and thermal forcing.
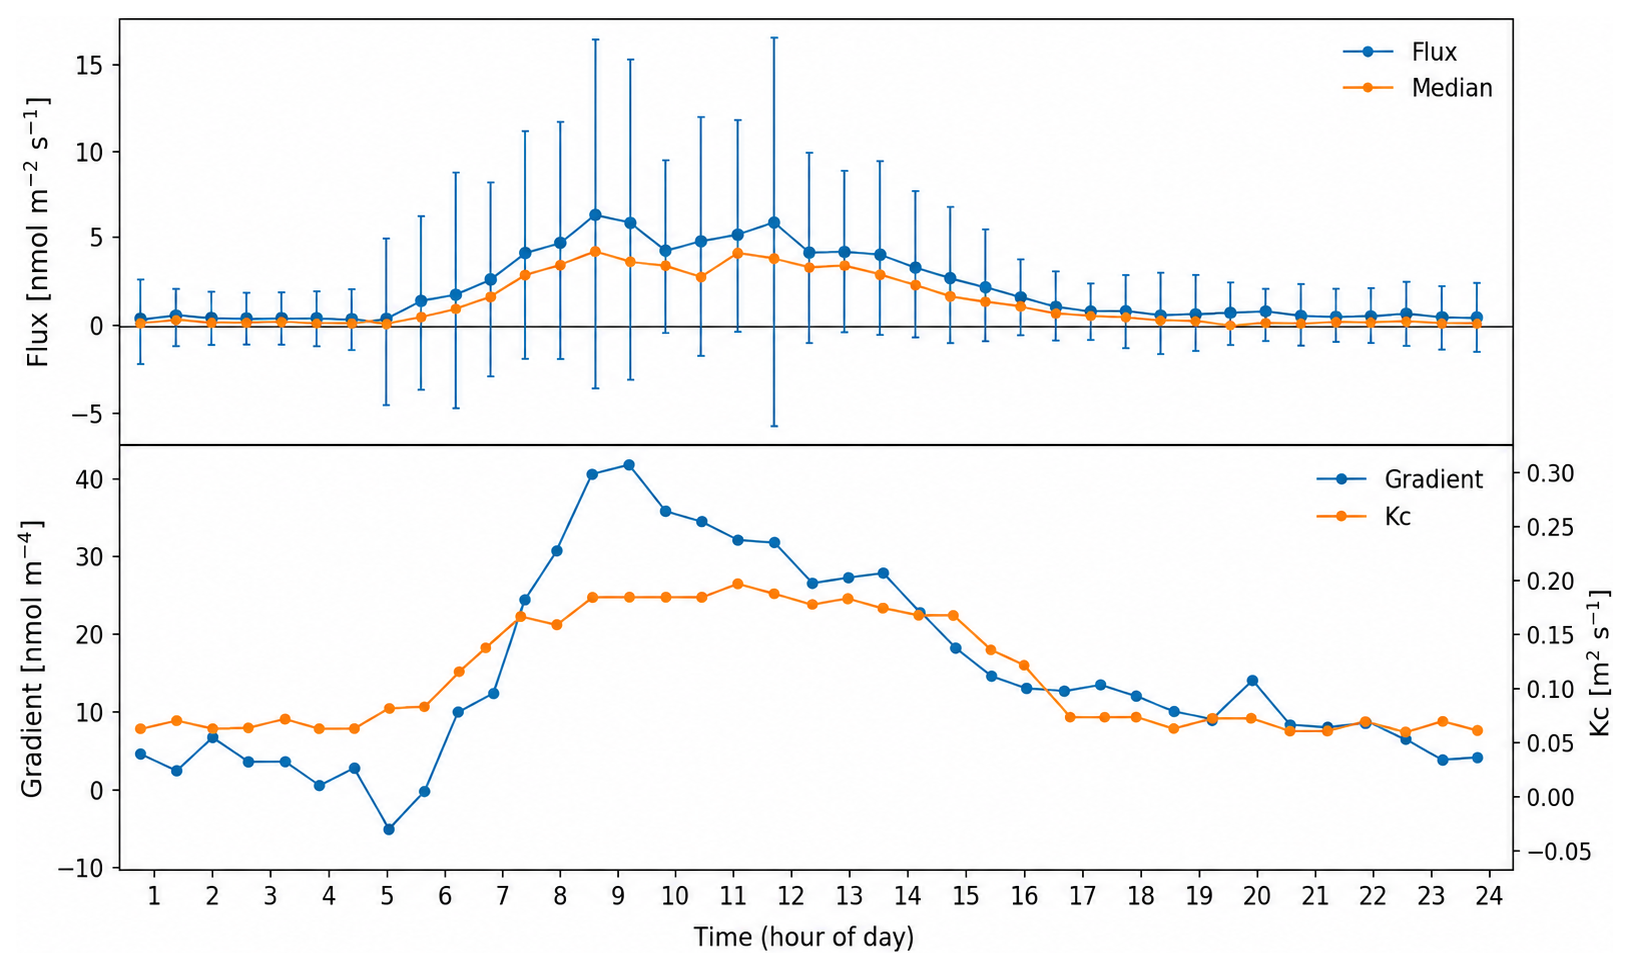
Figure 2Upper panel: diurnal cycle of NH3 flux. Vertical bars indicate ±1 standard deviation (SD) of half-hourly flux values. Lower panel: half-hourly gradients and diffusion coefficients. The horizontal axis represents half-hourly time steps (1–48). Time is given in UTC; local civil time/CEST at the measurement site is UTC+2.
The concentration gradient exhibited a similar daytime maximum, and together with Kc, governed the diurnal evolution of ammonia flux. Fluxes peaked at approximately 09:00 (11:00 local time), followed by a local minimum around midday. This midday reduction may be consistent with commonly observed stomatal regulation phenomena.
Ammonia emission via plant stomata appears to be partially constrained during midday hours. Elevated temperature and high vapor pressure deficit increase transpiration demand, leading to transient plant water stress. In response, plants regulate stomatal aperture through abscisic acid (ABA)-mediated signaling, resulting in partial stomatal closure even under high irradiance conditions. Midday stomatal closure is primarily driven by high vapor pressure deficit and plant water stress (Oren et al., 1999), and stomatal regulation functions as an active, ABA-mediated control of photosynthesis (Flexas and Medrano, 2002).
Despite reduced turbulent exchange during nighttime, the concentration gradient remained small. This suggests that nocturnal ammonia emissions were limited, resulting in near-equilibrium conditions between the surface and the overlying air layer. Under such conditions, reduced mixing does not necessarily lead to concentration build-up, as the source strength is insufficient to generate a pronounced vertical gradient (Sutton et al., 1995; Nemitz et al., 2000).
In our study, as shown in Fig. 2, emission dominates during the daytime hours, with a maximum around noon, whereas during the nighttime it shows relatively constant, low values and occasionally shifts to deposition. When separated based on global radiation and photosynthetically active radiation, the mean emission was 3.11 nmol m−2 s−1 under Ig > 0 and PAR > 0 conditions, while during nighttime hours (Ig = PAR = 0) it was an order of magnitude lower, 0.448 nmol m−2 s−1.
The daytime dominance of ammonia flux has long been recognized. For example, Harper et al. (1983) reported that the daily NH3 cycle was pronounced, with substantial emission during the day and small emissions or even deposition at night. During the summer season, soil surface temperature was the factor most strongly correlated with NH3 flux. During the remainder of the year, evapotranspiration showed the highest correlation, although the increased midday flux was likely attributable to the parallel increase in soil temperature and wind speed. All of the main influencing factors are interrelated through their dependence on solar radiation.
In a review study, Hargrove (1988) listed several factors determining ammonia flux. Environmental variables such as temperature, soil moisture content, and air exchange at the soil surface are primary determinants of the magnitude of NH3 loss. Soil moisture and surface air exchange are particularly important. Under field conditions, these factors fluctuate widely on a daily basis due to the combined effects of dew formation and evaporation. Studies cited in Hargrove (1988) indicate that, on a daily scale, high NH3 loss rates are generally associated with periods of rapid soil drying, when moist (near field capacity) surface soil is followed by several days with little or no rainfall (< 1 mm). It is also evident that NH3 loss is related to wind speed under field conditions, and that low air exchange rates at the soil surface – such as those expected within a plant canopy or in no-till production systems – may limit NH3 loss.
Recent research has reinforced that ammonia emissions are strongly controlled by interactions among soil properties, meteorological conditions, and management practices. Advanced atmospheric emission models show that incorporating spatial and temporal variability in agricultural activities, such as manure and fertilizer application timing, as well as explicit representation of soil moisture and temperature, significantly improves simulation of observed NH3 emission dynamics across Europe and beyond (Ge et al., 2020). Field and satellite-based studies further highlight that environmental drivers and atmospheric lifetime of NH3 vary considerably with local conditions, affecting both emission rates and dispersion patterns (Xie et al., 2024). Reviews also emphasize the profound contribution of agriculture to global ammonia emissions and their impacts on particulate formation and human health, underscoring the need to account for complex environmental dependencies when estimating NH3 fluxes (Wyer et al., 2022).
It is therefore clear that identifying the factors controlling emission is not straightforward, as their relative importance varies depending on the specific environmental conditions.
3.3 Temporal Variation of Ammonia Emission
During the investigated period (4.662 × 10⁶ s), the mean ammonia emission was 1.85 nmol m−2 s−1, corresponding to a cumulative loss of 1.21 kg N ha−1. Based on instrumental uncertainty (±2 ppb) and literature-reported uncertainty ranges of MOST-based aerodynamic gradient flux calculations, the overall uncertainty is estimated to be approximately ±25 %, corresponding to ±0.30 kg N ha−1 when expressed as nitrogen, representing 4.0 % of the applied fertilizer nitrogen.
Emission dynamics were strongly time-dependent (Fig. 3). Immediately after fertilization, elevated fluxes were observed under bare soil conditions, reflecting high surface emission potential. In the following days, fluxes declined progressively, consistent with depletion of readily volatilizable ammonium and changes in soil-surface equilibrium conditions.
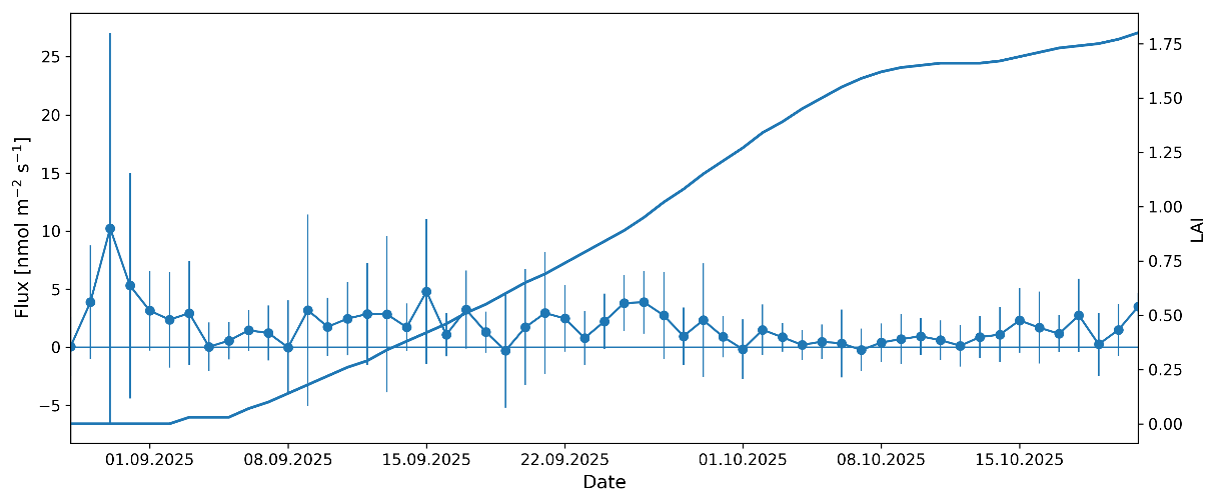
Figure 3Temporal variation of NH3 flux and increase of leaf area index (LAI). Vertical bars indicate ±1 standard deviation (SD) of half-hourly fluxes for each day.
Superimposed on this seasonal-scale decay, pronounced short-term variability was observed, driven by diurnal changes in radiation and turbulent exchange as discussed in Sect. 3.2. The overall fertilizer-related nitrogen loss (4 %) falls within the lower range reported in the literature for similar mineral fertilizer applications under relatively dry soil conditions.
Synthetic nitrogen fertilizers are applied in various forms, including urea, ammonium nitrate, ammonium sulphate, calcium ammonium nitrate, UAN, and phosphate-based ammonium fertilizers (Amhamed et al., 2022). Following application, a portion of ammonium is taken up by plants or transformed through nitrification, while a significant fraction may be lost via gaseous emissions – particularly as NH3, which typically peaks shortly after fertilization and can account for 6 %–20 % of applied nitrogen depending on fertilizer type, soil properties, climate, and management practices (Génermont and Cellier, 1997; Sommer et al., 2004; Zhan et al., 2020; Ma et al., 2021). Emission responses are strongly nonlinear and often increase exponentially with application rate (Jiang et al., 2017). Huang et al. (2017) reported that under mineral fertilizer treatments (NK/NP/NPK), total NH3 volatilization losses were ≤ 4.2 % of the applied nitrogen, whereas substantially higher losses were observed under combined organic and mineral fertilization.
In the present study, di-ammonium phosphate (DAP) was applied at a moderate rate and compared to urea-based fertilizers its volatilization potential is generally lower; consequently, the expected NH3 loss response is less pronounced even under nonlinear dose–response relationships.
Regarding the operational range of the measurement system, the upper measurable NH3 loss is not primarily limited by the fraction of fertilizer nitrogen lost through volatilization. Substantially higher volatilization losses than those observed in the present study could in principle be quantified, provided that the NH3 mixing ratios remain within the calibrated response range of the analyzer or are measured using appropriate dilution/calibration. Thus, the upper limit is determined by the instrumental linear range and sampling configuration rather than by the percentage loss of applied nitrogen itself.
The lower quantification limit is more difficult to define, because it depends on ambient NH3 mixing ratios, the magnitude of the vertical concentration gradient, atmospheric turbulence, averaging time, and the duration of the integration period. For aerodynamic gradient measurements, the critical factor is the detectability of the vertical NH3 concentration gradient rather than the absolute concentration alone. Based on the inter-channel uncertainty of approximately ±2 ppb and the estimated overall uncertainty of about ±0.30 kg N ha−1 for the cumulative loss, seasonal NH3 losses below approximately 0.3–0.5 kg N ha−1 would become increasingly difficult to distinguish reliably from measurement uncertainty.
3.4 Interpretable Machine Learning Analysis of NH3 Flux Dynamics
To further interpret the temporal variability of the measured NH3 fluxes, an exploratory machine-learning analysis was performed using the observational dataset. The half-hourly NH3 flux time series exhibited a pronounced diurnal cycle, a progressive decay trend, and strong short-term autocorrelation. Therefore, model validation was conducted using a strictly chronological (day-aware) split, with the first 80 % of days used for training and the remaining 20 % reserved for forward evaluation.
Models based solely on contemporaneous meteorological predictors showed negligible predictive skill (R2_test ≈ 0.01), indicating that instantaneous environmental drivers alone were insufficient to explain cross-day variability. Residual diagnostics revealed strong within-day persistence (lag-1 autocorrelation ≈ 0.33), motivating the explicit inclusion of autoregressive lag features up to six half-hour steps (3 h). Incorporating this short-term memory structure markedly improved predictive performance (R2_test ≈ 0.31) and reduced residual autocorrelation to near white-noise levels (lag-1 ACF ≈ 0.05). For the full dataset, inclusion of lag features increased predictive skill to R2_test ≈ 0.31. Subsequent regime-specific modelling further revealed distinct daytime and nighttime control structures.
In addition to the lagged-model analysis, the agreement between measured and model-predicted NH3 fluxes was evaluated directly using the test subset. The predicted-versus-measured comparison showed a clear correspondence between the two datasets (Pearson r = 0.795, corresponding to r2 = 0.6322, n = 575) (Fig. 4).
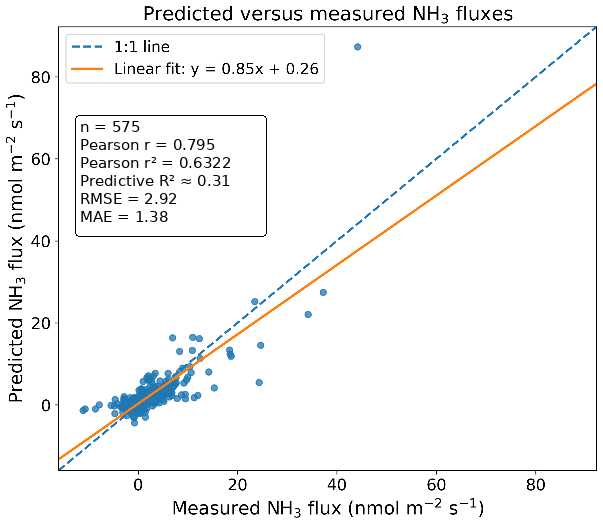
Figure 4Comparison between measured and model-predicted NH3 fluxes. The dashed line indicates the 1:1 relationship, and the solid line shows the linear regression fit.
Model interpretation revealed regime-dependent nonlinear controls. During daytime conditions (PAR > 0), radiation-related variables interacted strongly with autoregressive memory terms. ICE curves for NH3_lag_1 under daytime conditions (Fig. 5) showed consistent positive persistence effects, while two-dimensional partial dependence surfaces (Fig. 6) indicated that the influence of prior flux state was amplified under high PAR. This pattern suggests radiation-modulated volatilization from a dynamically buffered surface reservoir, where energy availability enhances release efficiency conditional on recent emission history.
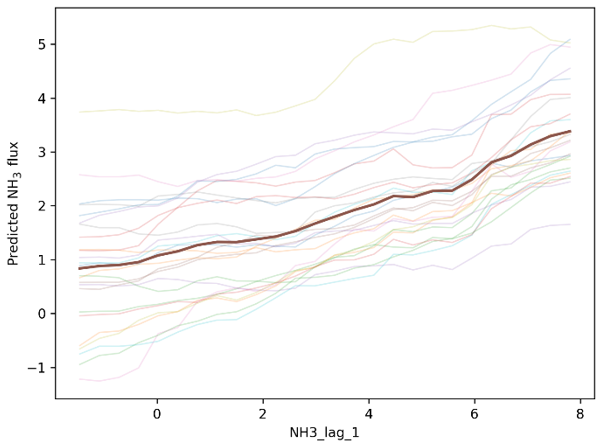
Figure 5Individual Conditional Expectation (ICE) curves for NH3_lag_1 under daytime conditions (PAR > 0). Thin lines represent individual conditional responses, while the thick line shows the mean partial dependence.
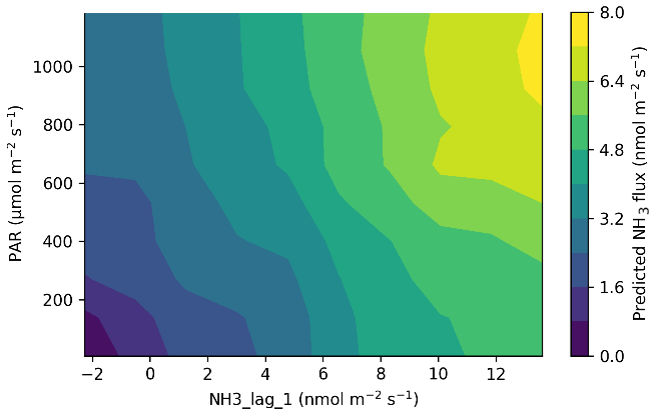
Figure 6Partial dependence surface of predicted NH3 flux as a function of NH3 lag-1 and PAR under daytime conditions (PAR > 0). Colors indicate predicted NH3 flux (nmol m−2 s−1) using the full value range of the model-predicted values for the daytime subset.
In contrast, nighttime conditions (PAR = 0) displayed a fundamentally different control structure. Radiation lost explanatory power, and turbulent transport metrics such as friction velocity (u*) and wind speed became dominant. ICE curves for u* (Fig. 7) revealed threshold-like behavior, with suppressed flux under weak turbulence and rapid increases once mixing intensified. Two-dimensional interaction surfaces (Fig. 8) confirmed that nighttime flux is primarily transport-limited, with strong nonlinear coupling between turbulence intensity and wind speed. Autoregressive memory remained relevant but interacted with mixing conditions rather than radiative forcing.
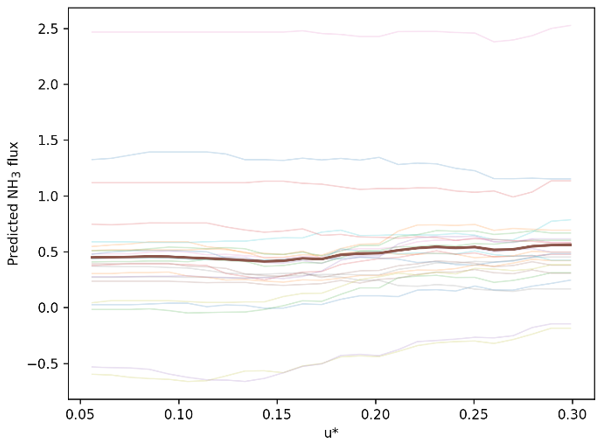
Figure 7Individual Conditional Expectation (ICE) curves for friction velocity (u*, m s−1) under nighttime conditions (PAR = 0). Predicted NH3 flux (nmol m−2 s−1) shows threshold-like behavior, with suppressed emissions at low turbulence and rapid increases once mixing intensifies.
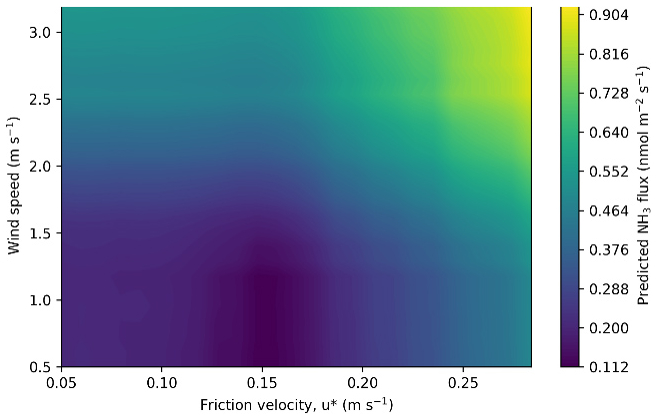
Figure 8Partial dependence surface of predicted NH3 flux as a function of friction velocity (u*) and wind speed under nighttime conditions (PAR = 0). Colors indicate predicted NH3 flux (nmol m−2 s−1) using the full value range of the nighttime subset; the color scale is not shared with Fig. 6.
Together, these results demonstrate a clear regime shift between daytime and nighttime NH3 exchange. Daytime flux is characterized by radiation-amplified persistence, whereas nighttime flux is controlled by turbulence-limited release. The temporal persistence represented by the 3 h lag window and the regime-dependent nonlinear interactions indicate that NH3 emissions reflect a transient soil–surface reservoir modulated by environmental forcing rather than a purely instantaneous response. Chronological validation further highlights that ignoring temporal structure can substantially overestimate predictive skill. These analyses suggest that incorporating temporal persistence and regime-specific environmental controls may improve the interpretation of NH3 flux dynamics.
Despite the inclusion of multiple soil, meteorological, and turbulence-related predictors, permutation importance consistently highlighted PAR and friction velocity (u*) as dominant controls. The compensation point concentration of the soil-plant system was not directly measured. The inferred reservoir behavior is consistent with, but does not directly quantify, soil–plant compensation point dynamics. Finally, regime-specific analyses were performed separately for daytime (PAR > 0) and nighttime (PAR = 0) conditions to identify potential shifts in dominant environmental controls. Separate tree-based ensemble models were fitted for the daytime and nighttime subsets to resolve regime-specific controls.
This study presented the field evaluation and methodological assessment of a photoacoustic NH3 measurement system combined with an aerodynamic gradient approach for quantifying bidirectional ammonia exchange following mineral fertilizer application under agricultural conditions. The measurement period covered the transition from bare soil to a developing winter rapeseed canopy, enabling the investigation of both emission intensity and evolving exchange dynamics under realistic field conditions.
The combined QCL-photoacoustic gradient system demonstrated robust and stable field performance during continuous long-term operation. Co-located inlet comparison experiments indicated low instrumental bias between sampling channels and a typical random uncertainty of approximately ±2 ppb (1σ). The implemented thermal stabilization, humidity management, and inlet-switching protocol proved suitable for minimizing gradient distortion and maintaining reliable operation under variable outdoor conditions.
Flux calculations based on Monin–Obukhov similarity theory (MOST) using a comprehensive ensemble of universal stability functions showed good methodological consistency. Sensitivity analysis demonstrated that variability attributable solely to stability-function selection remained small relative to the observed diurnal variability of NH3 exchange, indicating that the dominant uncertainty did not arise from the choice of similarity function itself.
The cumulative NH3 loss amounted to 1.21 ± 0.30 kg N ha−1, corresponding to 4.0 % of the applied fertilizer nitrogen. A clear and quantitatively resolved diurnal asymmetry was observed, with mean daytime emissions (Ig > 0, PAR > 0) reaching 3.11 nmol m−2 s−1, approximately one order of magnitude higher than nighttime values (0.448 nmol m−2 s−1). This pronounced day–night contrast indicates that post-fertilization NH3 exchange is strongly coupled to radiation-driven turbulent and surface processes during daytime, whereas nighttime exchange is primarily limited by turbulent transport conditions.
Complementary machine-learning analysis suggested that short-term temporal persistence plays an important role in NH3 flux dynamics and revealed distinct daytime and nighttime exchange regimes. However, the primary outcome of the study is the demonstration that the presented QCL-based photoacoustic aerodynamic gradient system provides a reliable framework for long-term field-scale NH3 flux measurements and methodological investigations of reactive trace gas exchange under agricultural conditions.
The combined QCL–photoacoustic gradient system demonstrated robust field performance and low instrumental bias under post-fertilization agricultural conditions, where NH3 mixing ratios were generally above the instrumental detection limit. Thus, the system is particularly suitable for long-term field-scale studies of agricultural NH3 exchange, whereas its applicability under relatively clean background conditions may be limited by the present detection limit.
Table A1Universal functions for sensible heat flux in stable stratification for extended interval.
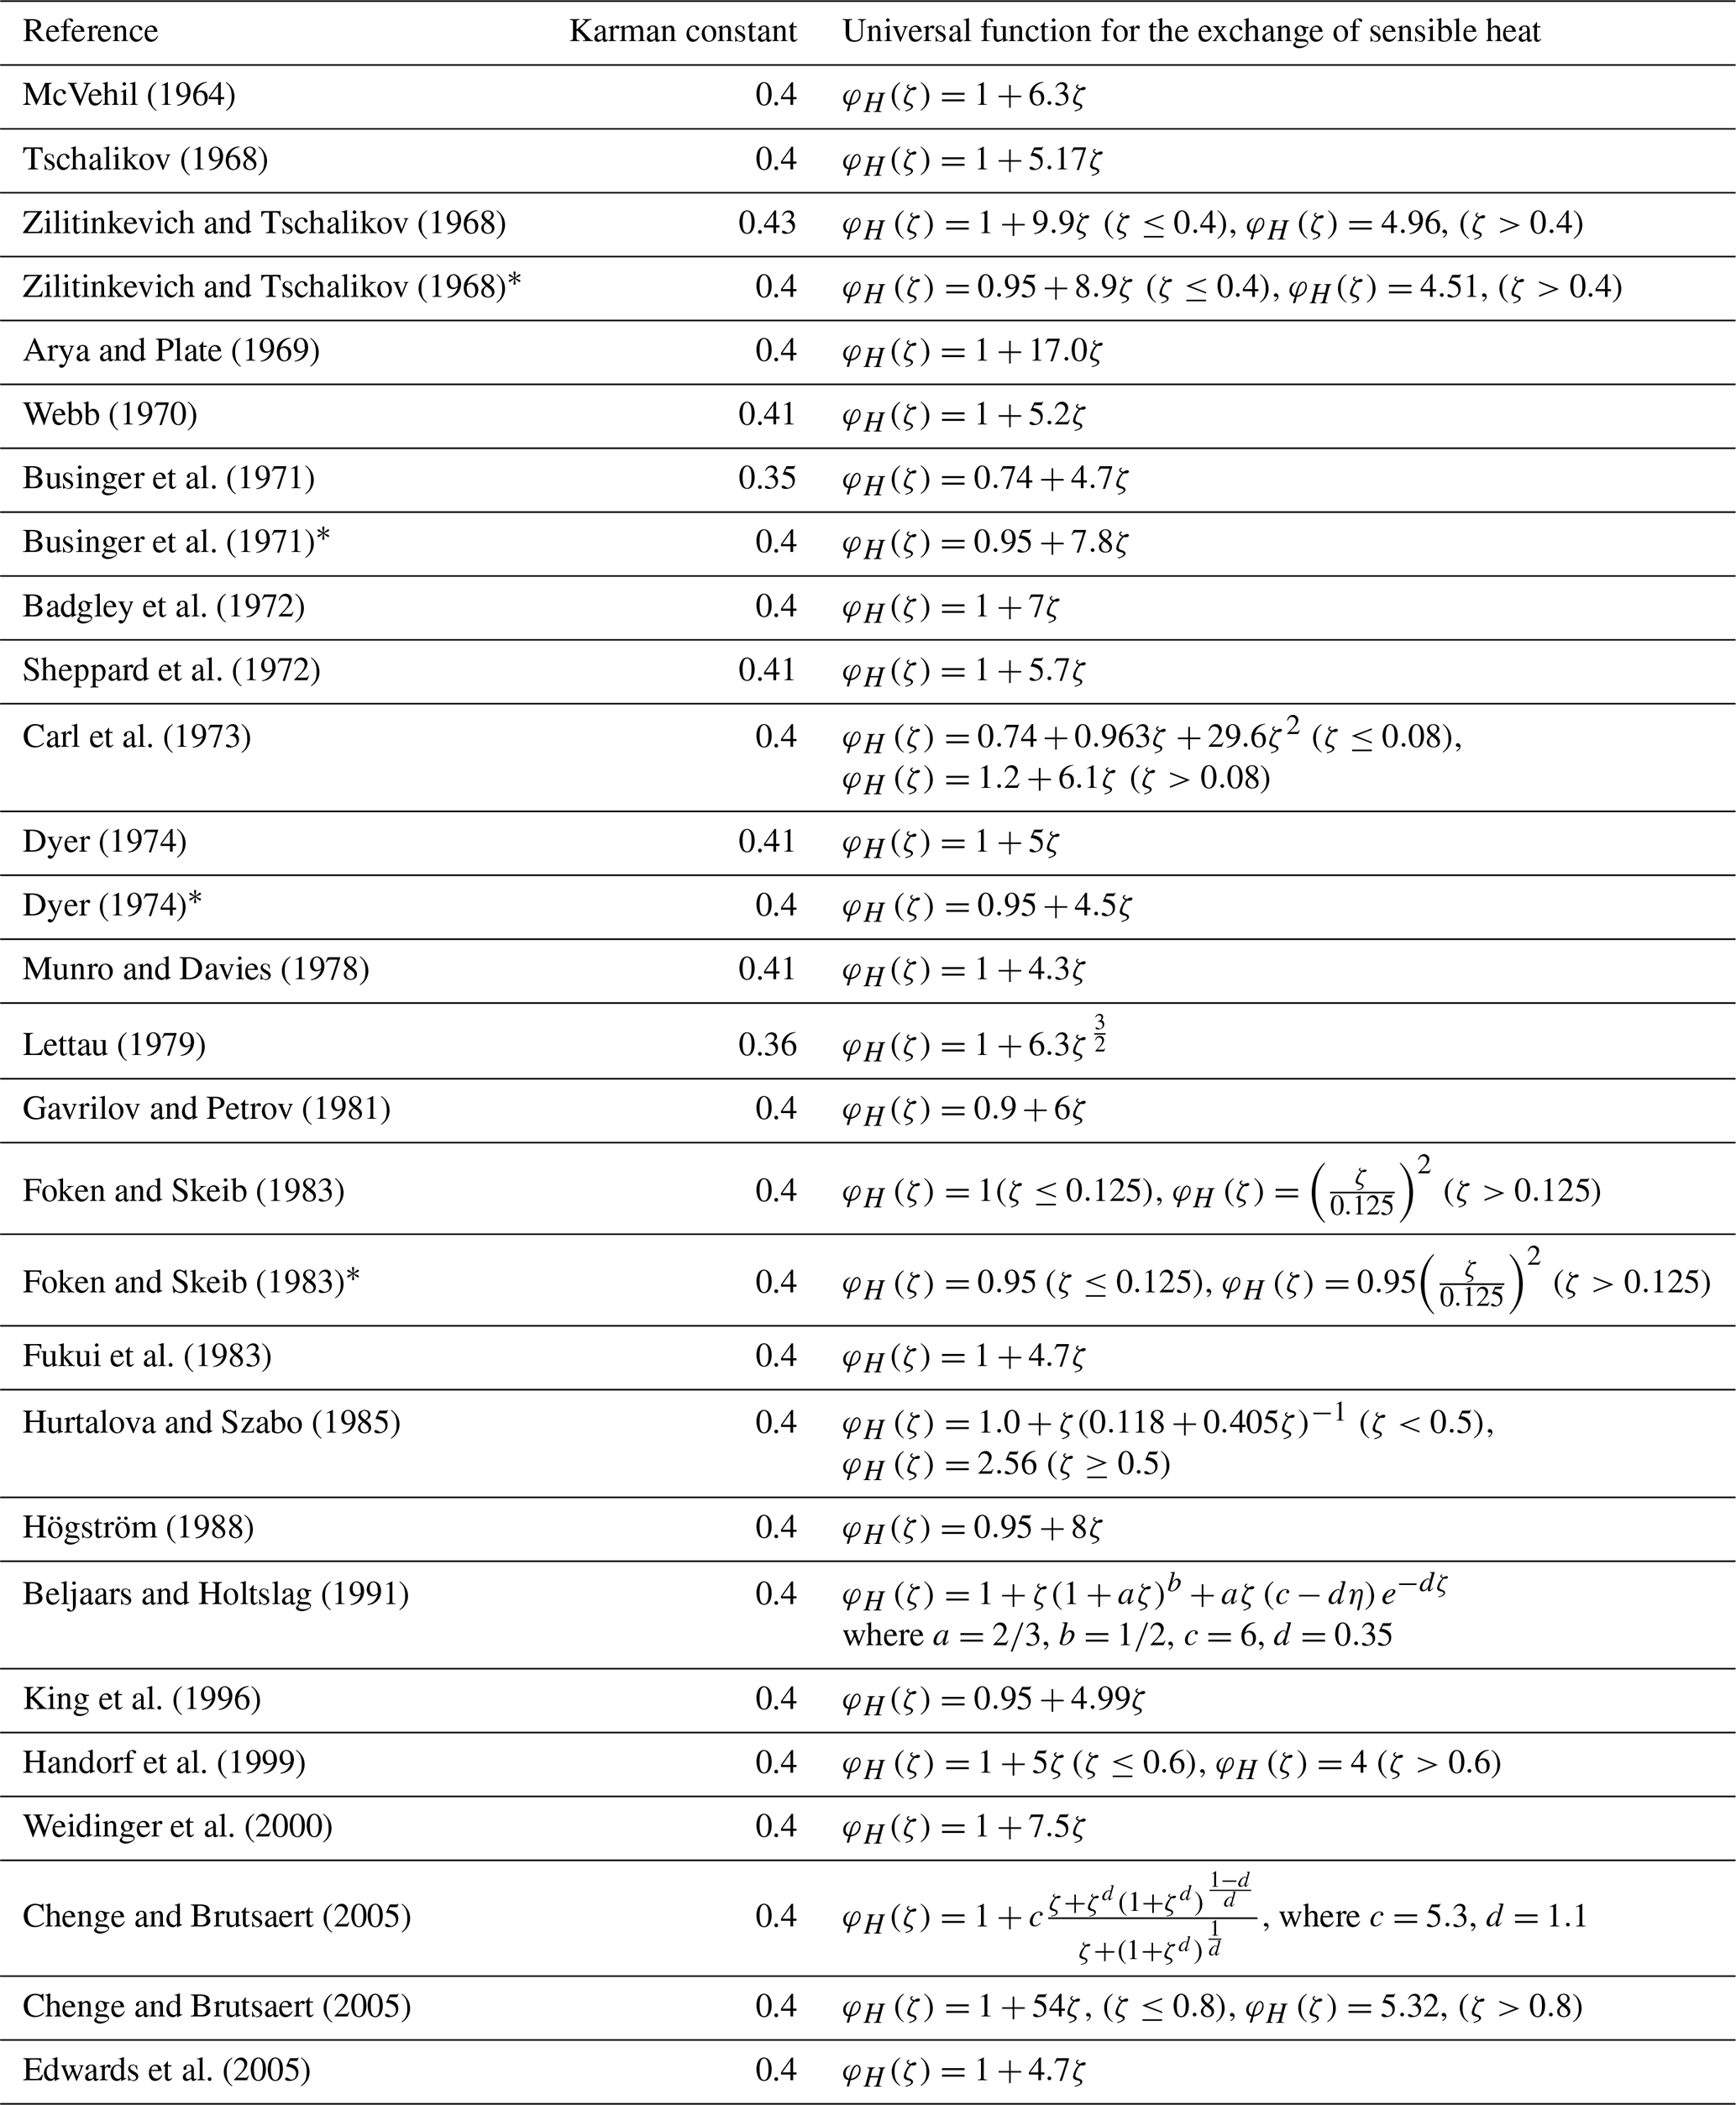
* Recalculated by Högström (1988) after Foken (2017).
Table A2Universal functions for sensible heat flux in unstable stratification for extended interval.
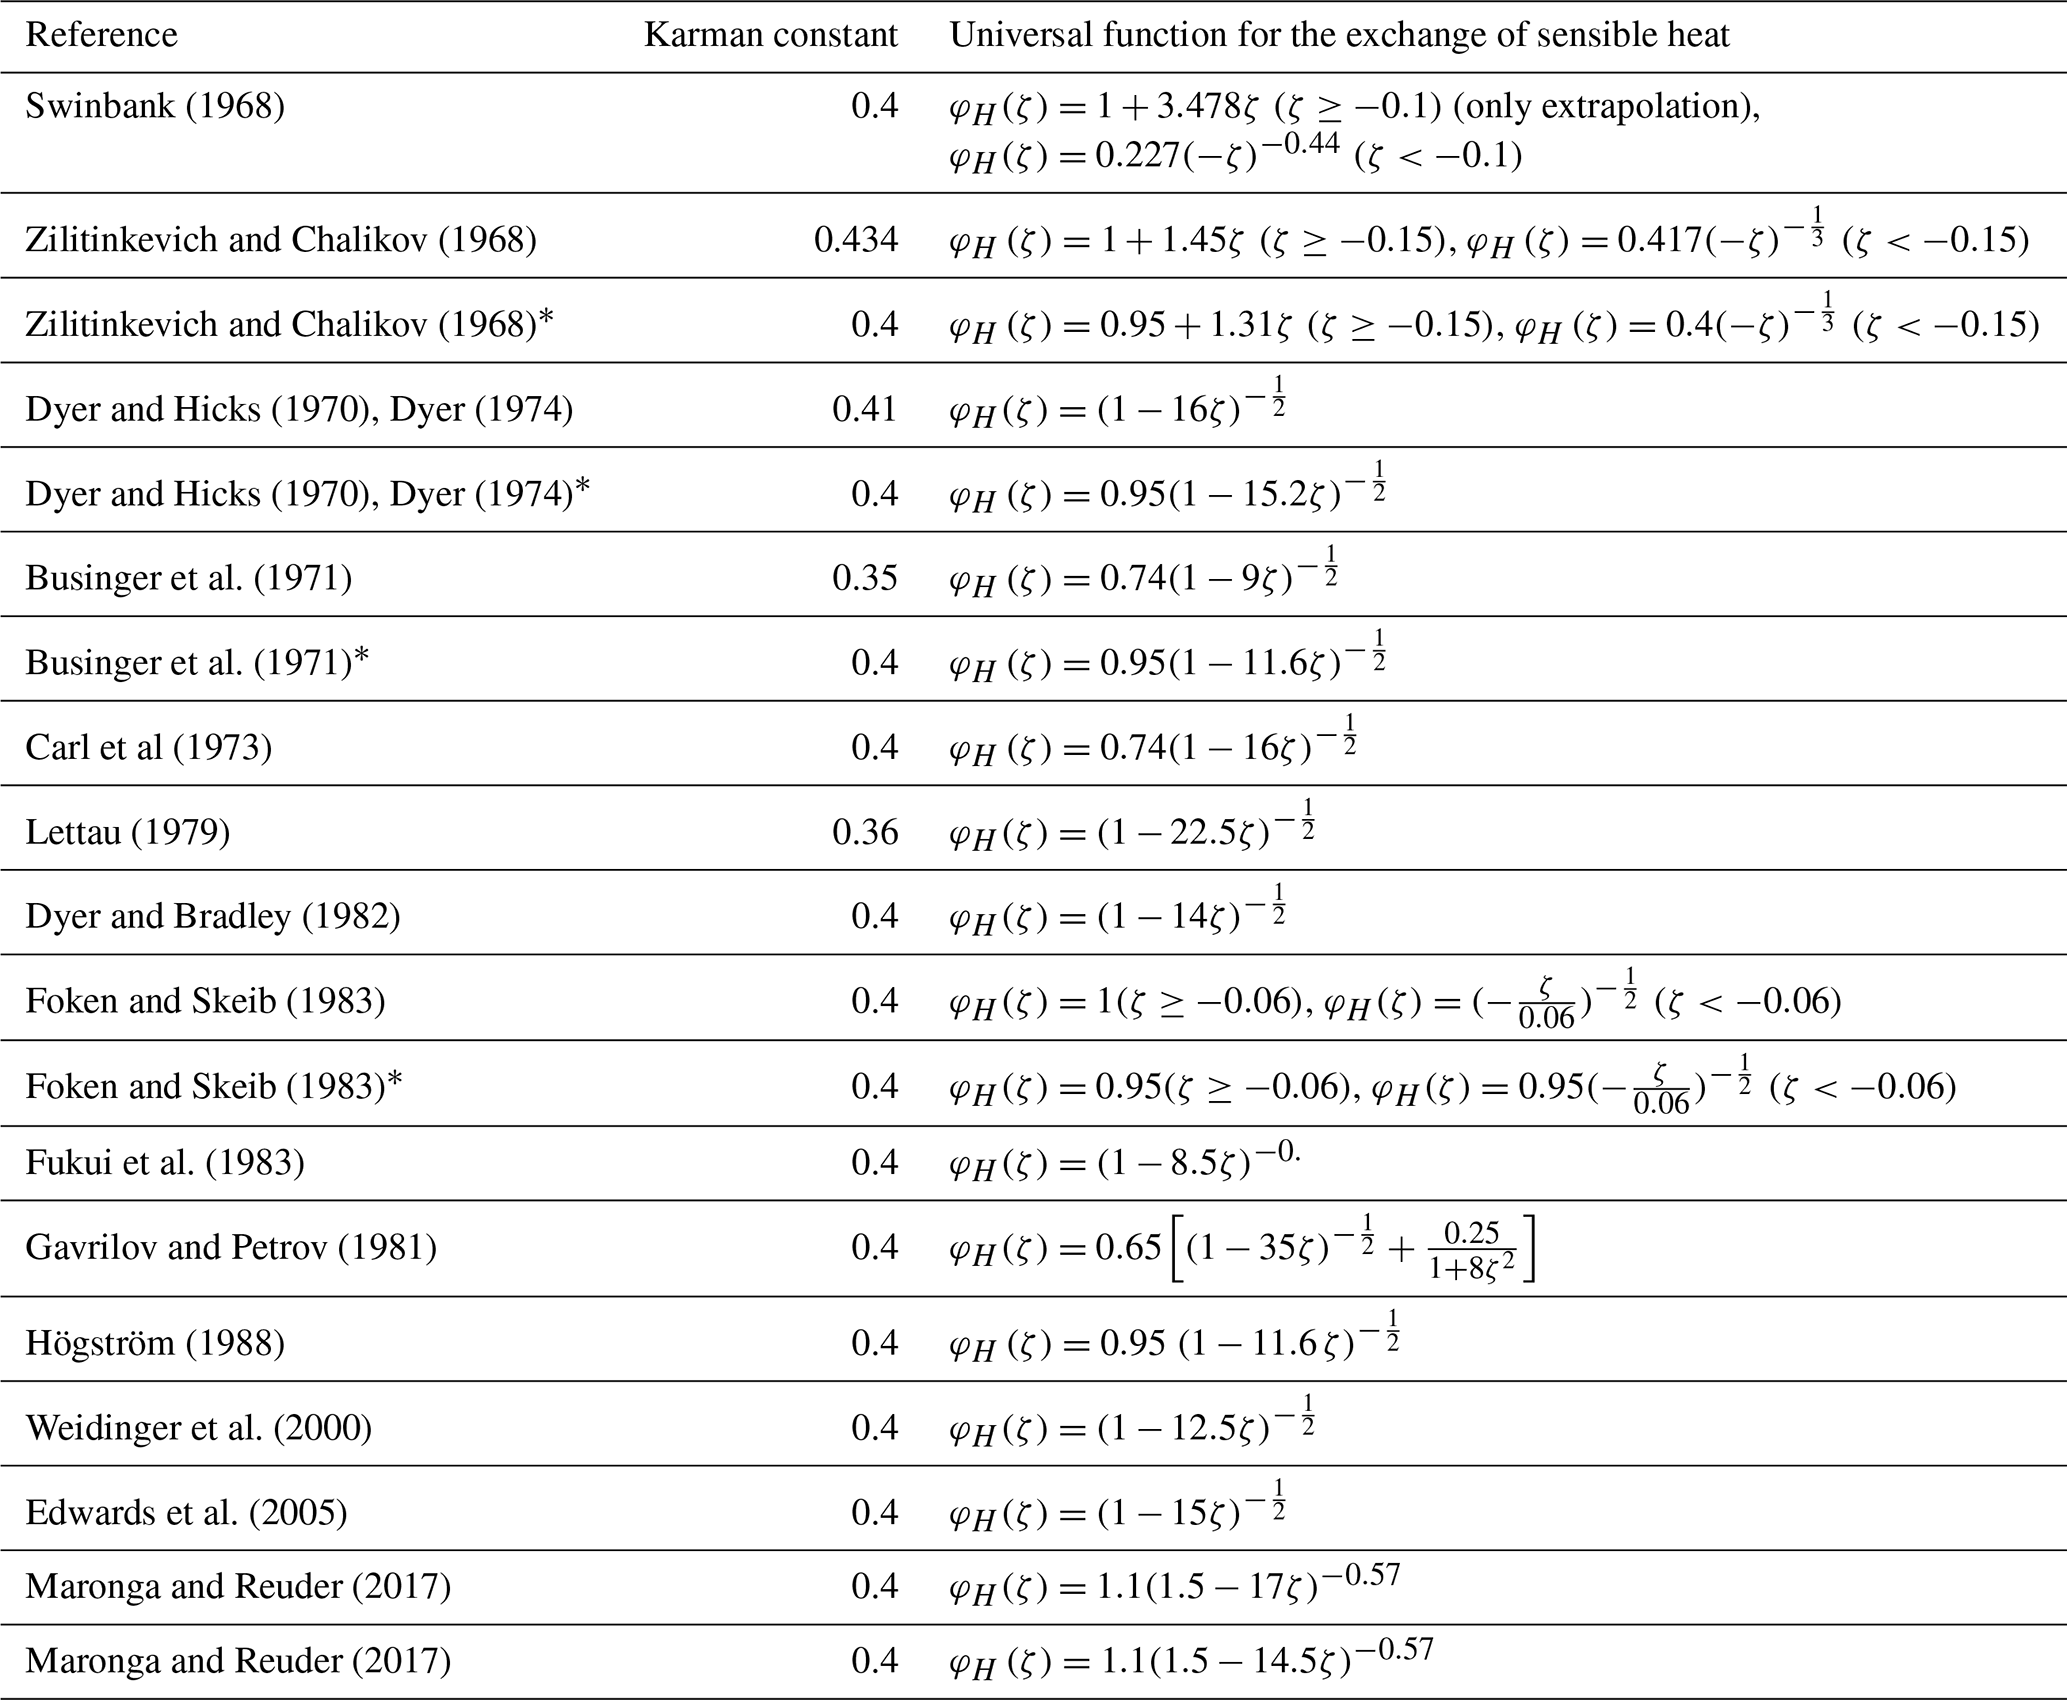
* Recalculated by Högström (1988) after Foken (2017).
Table A3Logarithmical profile function for all stability classes with widely used turbulent Prandtl (Pr) numbers.
Because NH3 is prone to wall interactions, a separate in situ test was performed to evaluate whether the inlet lines used in the aerodynamic gradient measurements introduced a dynamic adsorption/desorption bias under the operating conditions of the study. The test was carried out between 6 and 9 July 2026. The two inlet lines were positioned at the same height so that both sampled the same ambient air. One inlet was maintained at its original length of 4 m, whereas the other was shortened to 0.5 m. This represented an eightfold difference in inlet length and internal wall surface area and therefore provided a sensitive test of possible inlet-induced dynamic effects.
Table B1Summary statistics and comparison of the NH3 mixing-ratio changes measured with the 4 and 0.5 m inlet lines. The p values for the distributions were obtained using two-sided, two-sample Kolmogorov–Smirnov tests.

Calibration of the photoacoustic NH3 analyzer was performed using the same 4 m PTFE inlet configuration, flow rate of 800 cm3 min−1, and concentration range relevant to the field measurements. Consequently, after equilibration of the inlet walls, any steady-state inlet-related response was incorporated into the calibration function. The purpose of the additional inlet-length experiment was therefore specifically to evaluate whether dynamic, time-dependent adsorption/desorption or memory effects during alternating sampling could distort the measured NH3 changes.
The test used the same flow rate, alternating channel sequence, and one-minute flushing period as the field campaign. For this dedicated experiment, however, each channel was sampled in a 2 min cycle consisting of 1 min of flushing followed by one minute of averaging, whereas a 2 min data-acquisition period was used during the main field campaign. At the applied flow rate of 800 cm3 min−1, the internal volume of the original 4 m inlet was approximately 50 cm3, corresponding to a nominal residence time of about 3.8 s. This residence time was short compared with the 1 min flushing period. The measured NH3 mixing ratios during the test ranged from 33 to 75 ppb.
In total, 969 2 min measurements were obtained for each inlet configuration. For the evaluation of dynamic inlet effects, the change in NH3 mixing ratio relative to the preceding measurement from the same inlet was calculated separately for each inlet length, yielding 968 concentration-change values for each configuration. If the 4 m inlet had introduced a relevant dynamic adsorption/desorption or memory effect, this would be expected to appear as a systematic difference between the two inlet configurations in the mean concentration change, its variability, the overall distribution, or the relative occurrence and magnitude of positive and negative changes.
No meaningful difference in the average dynamic response was observed. The mean concentration change was −0.0202 ppb for the 4 m inlet and −0.0182 ppb for the 0.5 m inlet. The difference between the mean changes was therefore only 0.0020 ppb, which was negligible compared with the observed short-term variability and the measurement uncertainty reported in the main text. The corresponding standard deviations were also similar, amounting to 1.93 ppb for the 4 m inlet and 1.84 ppb for the 0.5 m inlet.
The distributions of positive and negative concentration changes were subsequently examined separately to determine whether the longer inlet produced an asymmetric dynamic response. For the 4 m inlet, 483 positive and 485 negative changes were recorded, whereas the corresponding numbers for the 0.5 m inlet were 493 and 475. The positive concentration changes had mean values of 1.460 and 1.381 ppb for the 4 and 0.5 m inlets, respectively, with corresponding standard deviations of 1.174 and 1.158 ppb. The negative concentration changes had mean values of −1.495 and −1.471 ppb, with standard deviations of 1.319 and 1.173 ppb for the 4 and 0.5 m inlets, respectively.
Non-parametric distribution tests supported the descriptive comparison. A two-sided, two-sample Kolmogorov–Smirnov test indicated no significant difference between the complete distributions of NH3 mixing-ratio changes measured with the two inlet lengths (p = 0.876). No significant differences were found when the distributions of positive and negative changes were tested separately (p = 0.219 and p = 0.305, respectively). In addition, a two-sided Fisher's exact test applied to the 2 × 2 contingency table of positive and negative changes showed that their relative frequencies did not differ significantly between the two inlet configurations (p = 0.682).
Taken together, shortening the inlet from 4 to 0.5 m did not produce a detectable change in the mean dynamic response, short-term variability, distribution of concentration changes, or balance between positive and negative changes. Under the applied flow rate, residence time, NH3 concentration range, and flushing and averaging protocol, the dynamic inlet-induced effect was therefore below the detectable level of the measurement system and negligible relative to the uncertainty of the reported NH3 fluxes.
The present experiment was designed to evaluate dynamic inlet effects during alternating measurements and does not constitute an independent determination of absolute NH3 recovery. A dedicated laboratory recovery experiment using a certified NH3 standard gas or permeation source would therefore remain valuable for further validation. Nevertheless, the calibration performed through the field inlet configuration, together with the in situ inlet-length comparison, provides no evidence that inlet-induced dynamic bias significantly affected the concentration gradients or the reported NH3 fluxes.
The datasets are available in the University of Szeged repository at https://doi.org/10.82570/SZTE_Datarepo_b7hfb-dms70 (Szabó, 2026).
ZB and LH designed the experiments. JF, CG, HH, ZN, KP, and AS carried out the field measurements and contributed to data acquisition. LH prepared the manuscript with contributions from all co-authors. TW performed the flux calculations.
The contact author has declared that none of the authors has any competing interests.
Publisher's note: Copernicus Publications remains neutral with regard to jurisdictional claims made in the text, published maps, institutional affiliations, or any other geographical representation in this paper. The authors bear the ultimate responsibility for providing appropriate place names. Views expressed in the text are those of the authors and do not necessarily reflect the views of the publisher.
The authors gratefully acknowledge the Agro-Ecological Station at the Experimental Farm in Gödöllő for providing the opportunity to conduct measurements, as well as the staff responsible for its operation for their assistance. Generative AI tools were used for language editing and figure preparation support. All analyses, interpretations, and scientific conclusions were performed and verified by the authors.
This research has been supported by the Hungarian Scientific Research Fund (grant no. K-138176) and the Magyar Tudományos Akadémia (FFT NP FTA).
This paper was edited by Huilin Chen and reviewed by two anonymous referees.
Abdulwahab, M. O., Flechard, C., Fauvel, Y., Häni, C., Jacotot, A., Graux, A.-I., Edouard, N., Buysse, P., Viaud, V., and Neftel, A.: Aerodynamic flux–gradient measurements of ammonia over four spring seasons in grazed grassland: environmental drivers, methodological challenges and uncertainties, Biogeosciences, 22, 6669–6693, https://doi.org/10.5194/bg-22-6669-2025, 2025.
Amhamed, A. I., Shuibul Qarnain, S., Hewlett, S., Sodiq, A., Abdellatif, Y., Isaifan, R. J., and Alrebei, O. F.: Ammonia production plants – a review, Fuels, 3, 408–435, https://doi.org/10.3390/fuels3030026, 2022.
Arya, S. P. S. and Plate, E. J.: Modeling of the Stable Stratified Atmospheric Boundary Layer, J. Atmos. Sci., 26, 656–665, https://doi.org/10.1175/1520-0469(1969)26<656:MOTSSA>2.0.CO;2, 1969.
Badgley, F. I., Paulson, C. A., and Miyake, M. (Eds.): Profiles of Wind, Temperature and Humidity over the Arabian Sea, The University Press of Hawaii, 62 pp., eBook ISBN: 9780824891251, https://doi.org/10.1515/9780824891251, 1972.
Beljaars, A. C. M. and Holtslag, A. A. M.: Flux parametrization over land surfaces for atmospheric models, J. Appl. Meteorol. Clim., 30, 327–341, https://doi.org/10.1175/1520-0450(1991)030<0327:FPOLSF>2.0.CO;2, 1991.
Bindraban, P. S., Dimkpa, C. O., White, J. C., Franklin, F. A., Melse-Boonstra, A., Koele, N., Pandey, R., Rodenburg, J., Senthilkumar, K., Demokritou P., and Schmidt, S.: Safeguarding human and planetary health demands a fertilizer sector transformation, Plants People Planet, 2, 302–309, https://doi.org/10.1002/ppp3.10098, 2020.
Bobbink, R., Hicks, K., Galloway, J., Spranger, T., Alkemade, R., Ashmore, M., Bustamante, M., Cinderby, S., Davidson, E., Dentener, F., Emmett, B., Erisman, J.-W., Fenn, M., Gilliam, F., Nordin, A., Pardo, L., and De Vries, W.: Global assessment of nitrogen deposition effects on terrestrial plant diversity: a synthesis, Ecol. Appl., 20, 30–59, https://doi.org/10.1890/08-1140.1, 2010.
Businger, J. A., Wyngaard, J. C., Izumi, Y., and Bradley, E. F.: Flux-profile relationships in the atmospheric surface layer, J. Atmos. Sci., 28, 181–189, https://doi.org/10.1175/1520-0469(1971)028<0181:FPRITA>2.0.CO;2, 1971.
Carl, D. M., Tarbell, T. C., and Panofsky, H. A.: Profiles of Wind and Temperature from Towers over Homogeneous Terrain, J. Atmos. Sci., 30, 788–794, https://doi.org/10.1175/1520-0469(1973)030<0788:POWATF>2.0.CO;2, 1973.
Chenge, Y. and Brutsaert, W.: Flux-profile Relationships for Wind Speed and Temperature in the Stable Atmospheric Boundary Layer, Bound.-Lay. Meteorol., 114, 519–538, https://doi.org/10.1007/s10546-004-1425-4, 2005.
Coskun, D., Britto, D. T., Shi, W., and Kronzucker, H. J.: Nitrogen transformations in modern agriculture and the role of biological nitrification inhibition, Nat. Plants, 3, 1–10, https://doi.org/10.1038/nplants.2017.74, 2017.
Dyer, J.: A review of flux-profile-relationships, Bound.-Lay. Meteorol., 7, 363–372, https://doi.org/10.1007/bf00240838, 1974.
Dyer, A. J. and Bradley, E. F.: An Alternative Analysis of Flux-Gradient Relationships at the 1976 ITCE, Bound.-Lay. Meteorol., 22, 3–19, https://doi.org/10.1007/BF00128053, 1982.
Dyer, A. J. and Hicks, B. B.: Flux-gradient relationships in the constant flux layer, Q. J. Roy. Meteor. Soc., 96, 715–721, https://doi.org/10.1002/qj.49709641012, 1970.
Edwards, G. C., Rasmussen, P. E., Schroeder, W. H., Wallace, D. M., Halfpenny-Mitchell, L., Dias, G. M., Kemp., R. J., and Ausma, S.: Development and evaluation of a sampling system to determine gaseous Mercury fluxes using an aerodynamic micrometeorological gradient method, J. Geophys. Res.-Atmos., 110, D10306, https://doi.org/10.1029/2004JD005187, 2005.
Flechard, C. R., Massad, R.-S., Loubet, B., Personne, E., Simpson, D., Bash, J. O., Cooter, E. J., Nemitz, E., and Sutton, M. A.: Advances in understanding, models and parameterizations of biosphere-atmosphere ammonia exchange, Biogeosciences, 10, 5183–5225, https://doi.org/10.5194/bg-10-5183-2013, 2013.
Flexas, J. and Medrano, H.: Drought-inhibition of photosynthesis in C3 plants: stomatal and non-stomatal limitations revisited, Ann. Bot., 89, 183–189, https://doi.org/10.1093/aob/mcf027, 2002.
Foken, T.: Applied Meteorology, In: Micrometeorology, Springer, Berlin, Heidelberg, 315–326, https://doi.org/10.1007/978-3-642-25440-6_8, ISBN: 978-3-642-25439-0, 2017.
Foken, T. and Mauder, M.: Micrometeorology, Atmospheric Science Series. Springer, Berlin, 410 pp., https://doi.org/10.1007/978-3-031-47526-9, 2024.
Foken, T. and Skeib, G.: Profile measurements in the atmospheric near-surface layer and the use of suitable universal functions for the determination of the turbulent energy exchange, Bound.-Lay. Meteorol., 25, 55–62, https://doi.org/10.1007/BF00122097, 1983.
Fukui, K., Nakajama, M., and Ueda, H.: A laboratory experiment on momentum and heat transfer in the stratified surface layer, Q. J. Roy. Meteor. Soc., l09, 661–676, https://doi.org/10.1002/qj.49710946114, 1983.
Galloway, J. N., Aber, J. D., Erisman, J. W., Seitzinger, S. P., Howarth, R. W., Cowling, E. B., and Cosby, B. J.: The nitrogen cascade, BioScience, 53, 341–356, https://doi.org/10.1641/0006-3568(2003)053[0341:TNC]2.0.CO;2, 2003.
Gavrilov, A. S. and Petrov, J. S.: Ocenka tocnosti opredelenija turbulentnych potokov po standartnym gidrometeorologitscheskim izmerenijam nad morem, Meteorol. Gidrol., 4, 52–59, 1981 (in Russian).
Ge, X., Schaap, M., Kranenburg, R., Segers, A., Reinds, G. J., Kros, H., and de Vries, W.: Modeling atmospheric ammonia using agricultural emissions with improved spatial variability and temporal dynamics, Atmos. Chem. Phys., 20, 16055–16087, https://doi.org/10.5194/acp-20-16055-2020, 2020.
Génermont, S. and Cellier P.: A mechanistic model for estimating ammonia volatilization from slurry applied to bare soil, Agr. Forest Meteorol., 88, 145–167, https://doi.org/10.1016/S0168-1923(97)00044-0, 1997.
Handorf, D., Foken, T., and Kottmeier, C.: The stable atmospheric boundary layer over an Antarctic ice sheet, Bound.-Lay. Meteorol., 91, 165–186, https://doi.org/10.1023/A:1001889423449, 1999.
Hargrove, W. L.: Evaluation of ammonia volatilization in the field, J. Prod. Agric., 1, 104–111, https://doi.org/10.2134/jpa1988.0104, 1988.
Harper, L. A., Catchpoole, V. R., Davis, R., and Weir, K. L.: Ammonia volatilization: soil, plant, and microclimate effects on diurnal and seasonal fluctuations, Agron. J., 75, 212–218, https://doi.org/10.2134/agronj1983.00021962007500020014x, 1983.
Högström, U.: Non-dimensional wind and temperature profiles in the atmospheric surface layer: A re-evaluation, Bound.-Lay. Meteorol., 42, 55–78, https://doi.org/10.1007/BF00119875, 1988.
Huang, J., Zhang, X. B., Zhang, Y. Z., and Sun, N.: Nitrogen mobility, ammonia volatilization, and estimated leaching loss from long-term manure incorporation in red soil, J. Integr. Agric., 16, 2082–2092, https://doi.org/10.1016/S2095-3119(16)61498-3, 2017.
Hurtalova, T. and Szabo, T.: Abhängigkeit der Turbulenz-Charakteristiken von der Temperaturschichtung der Atmosphäre, Z. Meteorol., 35, 349–353, ISSN 0084-5361, 1985.
Jiang, Y., Deng, A., Bloszies, S., Huang, S., and Zhang, W.: Nonlinear response of soil ammonia emissions to fertilizer nitrogen, Biol. Fert. Soils, 53, 269–274, https://doi.org/10.1007/s00374-017-1175-3, 2017.
Kamp, J. N., Häni, C., Nyord, T., Feilberg, A., and Sørensen, L. L.: The aerodynamic gradient method: implications of non-simultaneous measurements at alternating heights, Atmosphere, 11, 1067, https://doi.org/10.3390/atmos11101067, 2020.
King, J. C., Anderson, P. S., Smith, M. C., and Mobbs, S. D.: The surface energy and mass balance at Halley, Antarctica during winter, J. Geophys. Res.-Atmos., 101, 19119–19128, https://doi.org/10.1029/96JD01714, 1996.
Kramm, G. and Herbert, F.: Similarity Hypotheses for the Atmospheric Surface Layer Expressed by Non-Dimensional Characteristic Invariants – A Review, Open Atmos. Sci. J., 3, 48–79, https://doi.org/10.2174/1874282300903010048, 2009.
Kułek, B. and Weidinger, T.: The Influence of Meteorological Factors and the Time of Day on the Concentration of Ammonia in the Atmosphere Measured Using the Photoacoustic Method near a Cattle Farm–A Case Study, Atmosphere, 14, 1703, https://doi.org/10.3390/atmos14111703, 2023.
Lettau, H. H.: Wind and Temperature Profile Prediction for Diabatic Surface Layers Including Strong Inversion Cases, Bound.-Lay. Meteorol., 17, 443–464, https://doi.org/10.1007/BF00118610, 1979.
Liu, D., Rong, L., Kamp, J., Kong, X., Adamsen, A. P. S., Chowdhury, A., and Feilberg, A.: Photoacoustic measurement with infrared band-pass filters significantly overestimates NH3 emissions from cattle houses due to volatile organic compound (VOC) interferences, Atmos. Meas. Tech., 13, 259–272, https://doi.org/10.5194/amt-13-259-2020, 2020.
Ma, R., Zou, J., Han, Z., Yu, K., Wu, S., Li, Z., and Zhu-Barker, X.: Global soil-derived ammonia emissions from agricultural nitrogen fertilizer application: A refinement based on regional and crop-specific emission factors, Glob. Change Biol., 27, 855–867, https://doi.org/10.1111/gcb.15437, 2021.
Maronga, B. and Reuder, J.: On the formulation and universality of Monin–Obukhov similarity functions for mean gradients and standard deviations in the unstable surface layer: results from surface-layer resolving large-eddy simulations, J. Atmos. Sci., 74, 989–1010, https://doi.org/10.1175/JAS-D-16-0186.1, 2017.
Mayer, J. C., Bargsten, A., Rummel, U., Meixner, F. X., and Foken, T.: Distributed Modified Bowen Ratio method for surface layer fluxes of reactive and non-reactive trace gases, Agr. Forest Meteorol., 151, 655–668, https://doi.org/10.1016/j.agrformet.2010.10.001, 2011.
McVehil, G. E.: Wind and temperature profiles near the ground in stable stratification, Q. J. Roy. Meteor. Soc., 90, 136–146, https://doi.org/10.1002/qj.49709038403, 1964.
Miklós, A., Hess, P., and Bozóki, Z.: Application of acoustic resonators in photoacoustic trace gas analysis and metrology, Rev. Sci. Instrum., 72, 1937–1955, https://doi.org/10.1063/1.1353198, 2001.
Munro, D. S. and Davies, J. A.: On Fitting the Log-linear Model to Wind Speed and Temperature Profiles over a Melting Glacier, Bound.-Lay. Meteorol., 15, 423–437, https://doi.org/10.1007/BF00120604, 1978.
Nelson, A. J., Lichiheb, N., Koloutsou-Vakakis, S., Rood, M. J., Heuer, M., Myles, L., Joo, E., Miller, J., and Bernacchi, C.: Ammonia flux measurements above a corn canopy using relaxed eddy accumulation and a flux gradient system, Agr. Forest Meteorol., 264, 104–113, https://doi.org/10.1016/j.agrformet.2018.10.003, 2019.
Nemitz, E., Sutton, M. A., Gut, A., San José, R., Husted, S., and Schjoerring, J. K.: Sources and sinks of ammonia within an oilseed rape canopy, Agr. Forest Meteorol., 105, 385–404, https://doi.org/10.1016/S0168-1923(00)00205-7, 2000.
Oren, R. J. S. S., Sperry, J. S., Katul, G. G., Pataki, D. E., Ewers, B. E., Phillips, N., and Schäfer, K. V. R.: Survey and synthesis of intra-and interspecific variation in stomatal sensitivity to vapour pressure deficit, Plant Cell Environ., 22, 1515–1526, https://doi.org/10.1046/j.1365-3040.1999.00513.x, 1999.
Phillips, S. B., Arya, S. P., and Aneja, V. P.: Ammonia flux and dry deposition velocity from near-surface concentration gradient measurements over a grass surface in North Carolina, Atmos. Environ., 38, 3469–3480, https://doi.org/10.1016/j.atmosenv.2004.02.054, 2004.
Pogány, A., Mohácsi, Á., Jones, S. K., Nemitz, E., Varga, A., Bozóki, Z., Galbács, Z., Weidinger, T., Horváth, L., and Szabó, G.: Evaluation of a diode laser based photoacoustic instrument combined with preconcentration sampling for measuring surface–atmosphere exchange of ammonia with the aerodynamic gradient method, Atmos. Environ., 44, 1490–1496, https://doi.org/10.1016/j.atmosenv.2010.01.038, 2010.
Rom, H. B. and Zhang, G. Q.: Time delay for aerial ammonia concentration measurements in livestock buildings, Sensors, 10, 4634–4642, https://doi.org/10.3390/s100504634, 2010.
Prueger, J. H. and Kustas, W. P.: Aerodynamic Methods for Estimating Turbulent Fluxes, USDA-ARS/UNL Faculty, 1394, https://digitalcommons.unl.edu/usdaarsfacpub/1394 (last access: 29 July 2026), 2005.
Seinfeld, J. H. and Pandis, S. N.: Atmospheric Chemistry and Physics: From Air Pollution to Climate Change, John Wiley & sons, 1152 pp., ISBN 9781118947401, 2016.
Sheppard, P. A., Tribble, D. T., and Garratt, J. R.: Studies of turbulence in the surface layer over water (Lough Neagh), Part I. Instrumentation programme, profiles, Q. J. Roy. Meteor. Soc., 98, 627–641, https://doi.org/10.1002/qj.49709841711, 1972.
Shrivastava, A. and Gupta, V. B.: Methods for the determination of limit of detection and limit of quantitation of the analytical methods, Chron. Young Sci, 2, 21–25, ISSN 2229-5186, 2011.
Sintermann, J., Spirig, C., Jordan, A., Kuhn, U., Ammann, C., and Neftel, A.: Eddy covariance flux measurements of ammonia by high temperature chemical ionisation mass spectrometry, Atmos. Meas. Tech., 4, 599–616, https://doi.org/10.5194/amt-4-599-2011, 2011.
Sommer, S. G., Schjoerring, J. K., and Denmead, O. T.: Ammonia emission from mineral fertilizers and fertilized crops, in: Adv. Agron, edited by: Sparks, D. L., Elsevier, Academic Press, 82, 557–621, ISBN: 0 12 000780 0, 2004.
Spirig, C., Flechard, C. R., Ammann, C., and Neftel, A.: The annual ammonia budget of fertilised cut grassland – Part 1: Micrometeorological flux measurements and emissions after slurry application, Biogeosciences, 7, 521–536, https://doi.org/10.5194/bg-7-521-2010, 2010.
Sutton, M. A., Schjørring, J. K., and Wyers, G. P.: Plant–atmosphere exchange of ammonia, Philos. Trans. R. Soc. A, 351, 261–278, https://doi.org/10.1098/rsta.1995.0033, 1995.
Sutton, M. A., Reis, S., Riddick, S. N., Dragosits, U., Nemitz, E., Theobald, M. R., Sim Tang, Y., Braban, C. F., Vieno, M., Dore, A. J., Mitchell, R. F., Wanless, S., Daunt, F., Fowler, D., Blackall, T. D., Milford, C., Flechard, C. R., Loubet, B., Massad, R., Cellier, P., Personne, E., Coheur, P. F., Clarisse, L., Van Damme, M., Ngadi, J., Clerbaux, C., Skjøth, C. A., Geels, C., Hertel, O., Wichink Kruit, R. J., Pinder, R. W., Bash, J. O., Walker, J. T., Simpson, D., Horváth, L., Misselbrook, T. H., Bleeker, A., Dentener, F., and Vries, W.: Towards a climate-dependent paradigm of ammonia emission and deposition, Philos. Trans. R. Soc. B, 368, 20130166, https://doi.org/10.1098/rstb.2013.0166, 2013.
Swinbank, W. C.: A comparison between prediction of the dimensional analysis for the constant-flux layer and observations in unstable conditions, Q. J. Roy. Meteor. Soc., 94, 460–467, https://doi.org/10.1002/qj.49709440203, 1968.
Szabó, A.: Atmospheric ammonia flux dataset 2025 (Kartal, Hungary), University of Szeged [data set], https://doi.org/10.82570/SZTE_Datarepo_b7hfb-dms70, 2026.
Toyota, K., Dastoor, A. P., and Ryzhkov, A.: Parameterization of gaseous dry deposition in atmospheric chemistry models: Sensitivity to aerodynamic resistance formulations under statically stable conditions, Atmos. Environ., 147, 409–422, https://doi.org/10.1016/j.atmosenv.2016.09.055, 2016.
Trebs, I., Ammann, C., and Junk, J.: Immission and Dry Deposition, in: Springer Handbook of Atmospheric Measurements, Springer Handbooks, edited by: Foken, T., Springer, Cham, 1445–1471, https://doi.org/10.1007/978-3-030-52171-4_54, 2021.
Tschalikov, D. V.: O profilja vetra i temperatury v prizemnom sloe atmosfery pri ustojtschivoj stratifikacii (About the wind and temperature profile in the surface layer for stable stratification), Trudy GGO, 207, 170–173, ISSN 0376-1274, 1968.
von Bobrutzki, K., Braban, C. F., Famulari, D., Jones, S. K., Blackall, T., Smith, T. E. L., Blom, M., Coe, H., Gallagher, M., Ghalaieny, M., McGillen, M. R., Percival, C. J., Whitehead, J. D., Ellis, R., Murphy, J., Mohacsi, A., Pogany, A., Junninen, H., Rantanen, S., Sutton, M. A., and Nemitz, E.: Field inter-comparison of eleven atmospheric ammonia measurement techniques, Atmos. Meas. Tech., 3, 91–112, https://doi.org/10.5194/amt-3-91-2010, 2010.
Webb, E. K.: Profile Relationships: the log-linear range, and extension to strong stability, Q. J. Roy. Meteor. Soc., 96, 67–90, https://doi.org/10.1002/qj.49709640708, 1970.
Weidinger, T., Pinto, J., and Horváth, L.: Effects of uncertainties in universal functions, roughness length, and displacement height on the calculation of surface layer fluxes, Meteorol. Z., 9, 139–154, https://doi.org/10.1127/metz/9/2000/139, 2000.
Wyer, K. E., Kelleghan, D. B., Blanes-Vidal, V., Schauberger, G., and Curran, T. P.: Ammonia emissions from agriculture and their contribution to fine particulate matter: A review of implications for human health, J. Environ. Manage., 323, 116285, https://doi.org/10.1016/j.jenvman.2022.116285, 2022.
Xie, Y., Wang, W., Chen, Y., Qian, Z., Chen, J., Tong, J., Li, L., Yue, Y., Chen, K., Chu, Z., and Hu, X.: NH3 emissions and lifetime estimated by satellite observations with a differential evolution algorithm, Atmosphere, 15, 251, https://doi.org/10.3390/atmos15030251, 2024.
Xu, R., Tian, H., Pan, S., Prior, S. A., Feng, Y., Batchelor, W. D., Chen, J., and Yang, J.: Global ammonia emissions from synthetic nitrogen fertilizer applications in agricultural systems: Empirical and process-based estimates and uncertainty, Glob. Change Biol., 25, 314–326, https://doi.org/10.1111/gcb.14499, 2019.
Zahn, E., Bou-Zeid, E., and Dias, N. L.: Relaxed eddy accumulation outperforms Monin-Obukhov flux models under non-Ideal conditions, Geophys. Res. Lett., 50, e2023GL103099, https://doi.org/10.1029/2023GL103099, 2023.
Zhan, X., Adalibieke, W., Cui, X., Winiwarter, W., Reis, S., Zhang, L., Bai, Z., Wang, Q, Huang, W., and Zhou, F.: Improved estimates of ammonia emissions from global croplands, Environ. Sci. Technol., 55, 1329–1338, https://doi.org/10.1021/acs.est.0c05149, 2020.
Zilitinkevich, S. S. and Tschalikov, D. V.: Determining the Universal Wind-Velocity and Temperature Profiles in the Atmospheric Boundary Layer – Izv. Atmos. Ocean. Phys., 4, 294–302, 1968.
The requested paper has a corresponding corrigendum published. Please read the corrigendum first before downloading the article.
- Article
(1830 KB) - Full-text XML