
the Creative Commons Attribution 4.0 License.
the Creative Commons Attribution 4.0 License.
 | 12 Aug 2026
Evaluation of DMSO as working fluid in condensation particle counters
Sarah Kirchhoff
Oliver F. Bischof
Gerhard Steiner
Christian Kunath
Lothar Keck
Victoria M. Fruhmann
Helmut Krasa
Alexander Bergmann
Andreas Petzold
Ulrich Bundke
This study presents a comprehensive laboratory and field-based evaluation of dimethyl sulfoxide (DMSO) as a non-flammable working fluid for condensation particle counters (CPCs), directly compared to a butanol-operated counterpart across a wide range of pressures, temperatures, and aerosol types. Modifications to the instrument’s automatic refilling system ensured reliable operation over six months. Particle growth in the DMSO-CPC is strongly depending on the saturator temperature Tsat and the temperature difference ΔT between saturator and condenser, with optimal growth achieved at high Tsat and large ΔT values. Measurements with an optical particle counter downstream of the condenser, along with saturation and droplet size simulations, confirmed these trends and emphasized the importance of CPC internal settings for reliable particle growth. The DMSO-CPC achieved counting efficiencies and cutoff diameters comparable to the Butanol-CPC. The mean cutoff diameter was (5.8±0.9) nm for the DMSO-CPC and (5.6±0.5) nm for the Butanol-CPC. At the same time, the DMSO-CPC substantially reduced working fluid consumption and enabled stable long-term operation. The use of DMSO–H2O mixtures further extended the operational range and improved safety, making the CPC suitable for airborne measurements and remote monitoring. Recommendations regarding instrument modification, operational conditions, and hardware adjustments are made for operating a DMSO-CPC to gain results comparable to a Butanol-CPC. Overall, DMSO-based CPCs provide safe, efficient, and regulation-compliant operation without compromising measurement quality under challenging environmental conditions.
- Article
(3394 KB) - Full-text XML
- BibTeX
- EndNote


Aerosol particles play a crucial role in the Earth's atmosphere by influencing climate, weather patterns, air quality and human health (Pöschl, 2005; McNeill, 2017; IPCC, 2021). Their ability to scatter and absorb solar radiation, and to act as cloud condensation and ice nuclei, makes aerosols a key component of the global climate system (IPCC, 2021). Despite their importance, the sources, transformation processes and atmospheric distribution of aerosols remain highly uncertain, contributing significantly to the overall uncertainty in climate projections (Lee et al., 2016; Watson-Parris and Smith, 2022). High quality in-situ measurements of aerosol properties – in particular particle number concentrations – are essential to constrain models, validate satellite retrievals and improve our understanding of aerosol-related processes at regional and global scales (Kahn et al., 2023). As aerosols span several orders of magnitude in size and vary in composition, a variety of measurement techniques has been developed. Each technique is based on different physical principles and optimized for particular particle size ranges and applications (Kulkarni et al., 2011; Wendisch and Brenguier, 2013).
Among the instruments available for aerosol number concentration measurements, Condensation Particle Counters (CPCs) are widely regarded as a gold standard (Balendra et al., 2024). CPCs can detect particles as small as a few nanometers in diameter, and they are among the very few aerosol measurement techniques that are metrologically traceable in accordance with ISO 27891:201, which ensures high confidence in measurement accuracy. This makes them indispensable for a wide variety of research and monitoring applications. CPCs are routinely deployed in ground-based observatories to study new particle formation and urban pollution (Alam et al., 2003; Aalto et al., 2005). They are also operated on mobile platforms such as aircraft and drones to characterise vertical and horizontal aerosol distributions (Hermann and Wiedensohler, 2001; Bundke et al., 2015; Kim et al., 2025). And they are used in remote or high-altitude environments where particle concentrations are extremely low (Jurányi et al., 2010). CPCs are also integral to laboratory studies on instrument calibration, as well as to long-term climate monitoring networks and regulatory air quality assessments (Maring and Schwartze, 1994; Cozic et al., 2006). A leading example is the European research infrastructure ACTRIS (Aerosol, Clouds, and Trace Gases Research Infrastructure), encompassing over 100 research-performing organizations (Laj et al., 2024). Furthermore, the new EU Directive 2024/2881 of the European Parliament and the Council on ambient air quality and cleaner air for Europe (OJ EU, 2024/2881) establishes more stringent limit values for major air pollutants and requires the installation of at least one ultra fine particle concentration monitoring station per five million inhabitants.
However, the deployment of CPCs, especially on aircraft under low ambient pressure conditions, remains challenging. Strict safety regulations limit the use of flammable working fluids, such as n-butanol or isopropanol, commonly used in these instruments (Weber et al., 2023b). These fluids pose a fire hazard under the conditions typical of aircraft operation. This risk is especially pronounced in pressurized cabins or during high-altitude flights, leading to restrictions or outright prohibitions on their use in airborne applications (Hermann et al., 2005). An alternative working fluid that has been used in some low-pressure applications is Fluorinert FC-43 (Brock et al., 2000; Richter et al., 2026). However, its use is limited to very low ambient pressures and it is not considered environmentally sustainable due to its high global warming potential and persistence in the atmosphere (Hong et al., 2013). For these reasons, it is not suitable for routine atmospheric measurements in aircraft-based observing systems.
In the context of the IAGOS infrastructure (In-Service Aircraft for a Global Observing System, Petzold et al., 2015; Thouret et al., 2022), instruments are operated onboard passenger aircraft over extended periods of several months and are exposed to a wide range of ambient conditions, including cruise altitudes of approximately 8–12 km, corresponding to pressure levels of about 200–300 hPa, as well as near-surface conditions during ascent and descent.
One promising alternative working fluid is water, as employed in modern-generation CPCs (Hering et al., 2014). Using water as a working fluid avoids the health and safety concerns associated with alcohols. However, certain practical aspects may limit its suitability for long-term autonomous aircraft operation. While modern water-based CPCs can operate with very low working fluid consumption under typical ambient conditions, consumption may still increase depending on instrument design and operating conditions (Mei et al., 2021), which can become relevant when maintenance or refilling is not feasible over extended deployment periods. In addition, contamination effects during prolonged inactivity require careful mitigation strategies. Furthermore, water-based CPCs can exhibit a stronger dependence of activation behavior and cutoff diameter on particle material, which may introduce additional uncertainties in particle detection under varying conditions (Mei et al., 2021; Weber et al., 2022).
In this study, we investigate a novel, non-flammable working fluid suitable for use in CPCs. Dimethyl sulfoxide (DMSO; C2H6OS; CAS no. 67-68-5; 99.9 %) as alternative fluid has been selected for its favorable thermodynamic properties, non-toxicity, odorless and compliance with aviation safety standards. A recent study (Weber et al., 2023b) revealed that DMSO is a suitable working fluid with several advantages over butanol. They could show that the saturation vapor pressure of DMSO is significantly lower than that of butanol and water, while exhibiting an analogous temperature dependence. Consequently, the same supersaturation can be achieved with an identical temperature difference between the CPC’s saturator and condenser. At the same time, the consumption of the working fluid is greatly reduced. Importantly, DMSO can also be used in existing butanol-based CPC systems with minimal modifications, whereas water is generally not suitable for conventional alcohol-based CPCs due to poor compatibility with their operational design.
The D50 cutoff diameter, which represents the particle size at which a CPC detects 50 % of incoming particles and thus defines its lower detection limit, is a key performance parameter of CPCs. Ambiguous results regarding the pressure dependence of the D50 cutoff diameter have been reported in studies using conventional working fluids. For butanol, Hermann and Wiedensohler (2001) found that there is a shift of the D50 towards smaller particle diameters and a decrease in the asymptotic maximum counting efficiency as the pressure decreases. In contrast, both theoretical and experimental studies (Zhang and Liu, 1990, 1991; Bauer et al., 2023) reported that lower pressures cause the D50 cutoff to shift toward larger particle sizes in butanol- and water-based CPCs. Bezantakos and Biskos (2022) found no significant influence of the pressure on the cutoff diameter with isopropyl alcohol as working fluid. Table 1 provides a comprehensive overview of the D50 cutoff diameters established in the various studies. The studies by Bundke et al. (2015), Bischof (2022), and Weber et al. (2023a, b) were conducted using a similar experimental setup. While Bundke et al. (2015) reported a decrease in the cutoff diameter towards lower pressures, Bischof (2022) and Weber et al. (2023b) found no significant pressure dependence for the D50. A possible explanation for these ambiguous results are the different temperature settings of the CPCs. Bundke et al. (2015) adjusted the temperature difference of condenser and saturator to achieve a lower cut-off of 13 nm, while Bischof (2022) operated the CPC with internal temperatures as stated by the manufacturer (Tsat=36 °C and Tcon=10 °C). Besides that, a consensus has been reached among preceding studies that a shift of the D50 towards smaller particle sizes occurs as the temperature difference between the saturator and condenser of the CPC increases (Bezantakos and Biskos, 2022; Hermann and Wiedensohler, 2001; Mei et al., 2021).
Table 1A comparison of the pressure dependency of the D50 cutoff diameter reported by different studies using various types of CPCs, working fluids, particles and internal temperature settings.
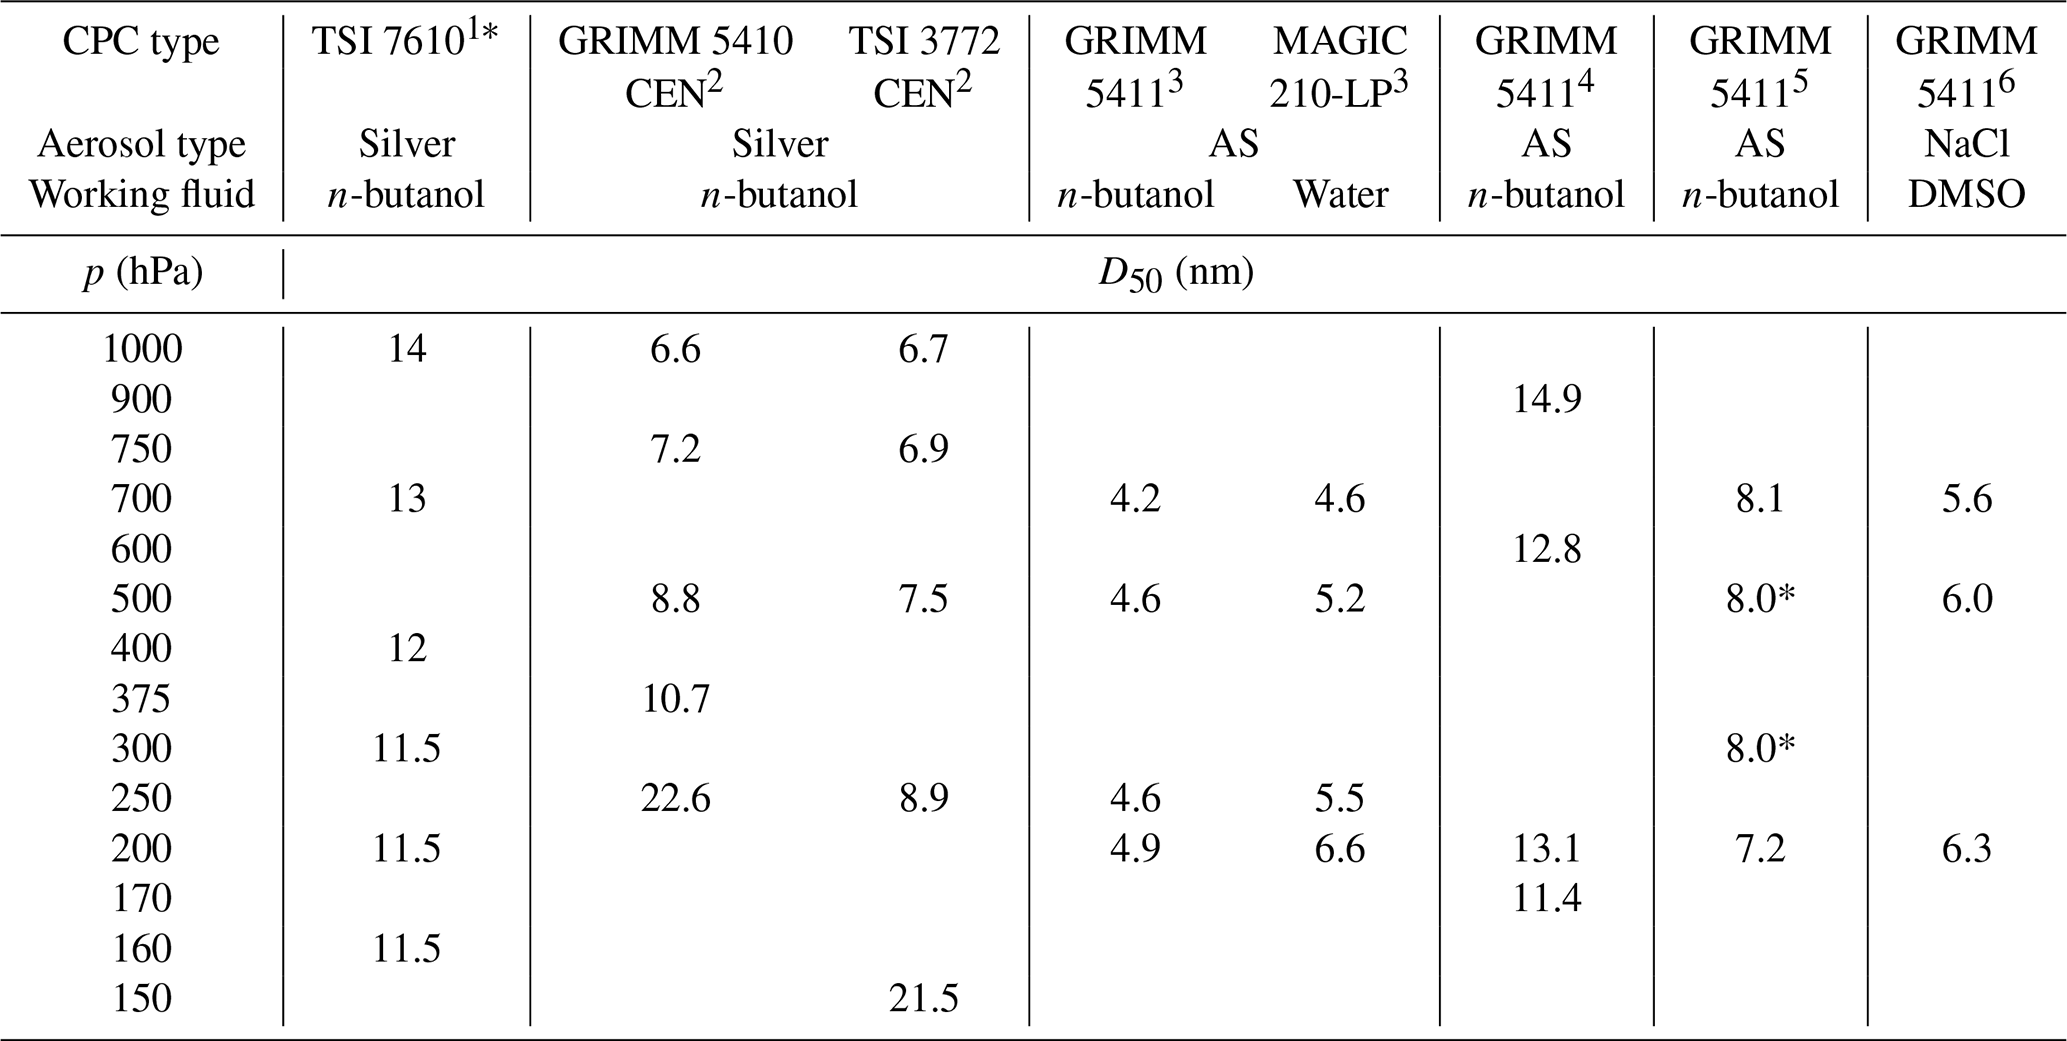
1 Hermann and Wiedensohler (2001), 2 Bauer et al. (2023), 3 Weber et al. (2023a), 4 Bundke et al. (2015),5 Bischof (2022), 6 Weber et al. (2023b)
* This data has been obtained from a graphical representation of the efficiency curves.
It was shown by Weber et al. (2023b) that, when DMSO is used as the working fluid, D50 is independent of both pressure and relative humidity within the measurement uncertainty for a saturator temperature of Tsat=40 °C and a condenser temperature of Tcon=5 °C. However, their study was limited to assessing the feasibility of DMSO as a working fluid. Continuous fluid supply and the effects of saturator and condenser temperature settings were not investigated. In this study, we build upon their work by evaluating the performance of a CPC operated with DMSO through laboratory characterisation and field-relevant measurements. Our focus includes droplet growth in the condenser, counting and cutoff efficiencies, operational long-term stability, and performance under varying temperature and pressure conditions. To support the interpretation of the experimental results, we conducted numerical simulations using a computational fluid dynamics (CFD) program.
2.1 Experimental Setup
2.1.1 Low-Pressure Characterisation
A schematic of the experimental setup for the low-pressure characterisation is shown in Fig. 1. Briefly, a constant and steady test aerosol production is provided by a continuous output nebuliser (model 3076, TSI Incorporated, Shoreview, MN, USA) or an inverted flame soot generator (Argonaut Scientific Corp., Edmonton, AB, Canada). The salt aerosol stream from the nebuliser is dried in a diffusion dryer tube filled with silica gel. The dried stream, or the soot aerosol directly, is then passed through an aerosol neutraliser containing a radioactive source of Am-241. In the next step, a monodisperse aerosol stream is generated using a Vienna-type Differential Mobility Analyser (DMA; model M-DMA 55-U, GRIMM Aerosol Technik, Muldestausee, Germany). The DMA was operated step-wise, and each voltage level corresponded to a different particle size. The sizes ranged from an upper limit of 140 nm down to 2.5 nm in diameter. The monodisperse aerosol then enters the low-pressure section through a critical orifice. For operation at pressures above 700 hPa, the orifice is removed to ensure proper flow conditions. A characterization of the orifice is described in Bundke et al. (2015). The aerosol flow is diluted in a mixing chamber which also acts as a buffer volume. The pressure in the low-pressure section is controlled by mass flow balance using mass flow controllers (MFCs) with a proportional-integral-derivative (PID) controller approach. After passing through the mixing chamber, the aerosol flow is delivered to the measuring instruments via a common sampling line. An individual isokinetic, isoaxial sample inlet in the centre of the line directs the aerosol flow to each instrument. To avoid particle losses due to electrostatic forces, all tubing and chambers are constructed of either stainless steel or minimum length conductive silicone tubing. The experiments are controlled automatically by a custom-made LabView™ (National Instruments Corp., Austin, TX, USA) program.
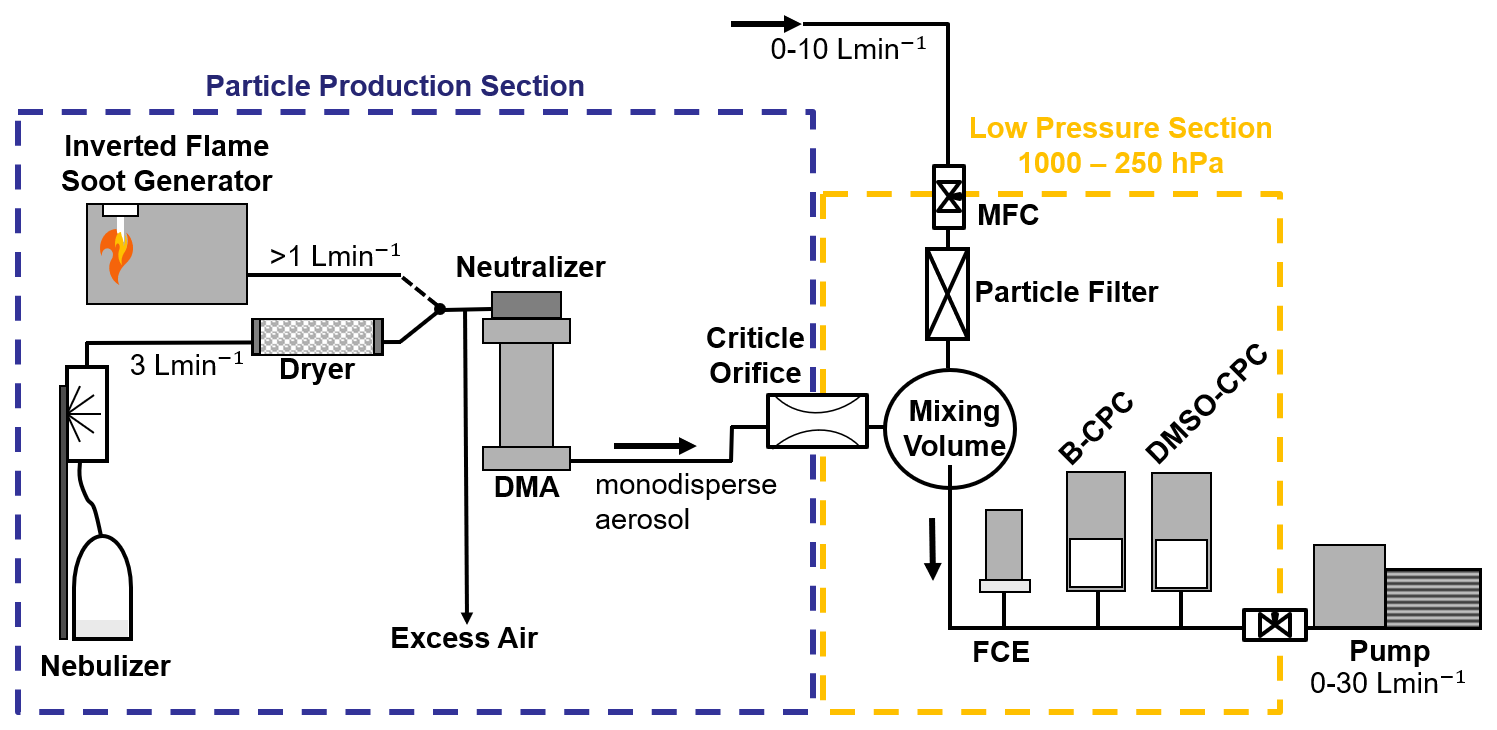
Figure 1Schematic of the experimental setup for evaluating CPC performance under controlled low-pressure conditions. Test aerosols were generated either by a nebuliser producing salt particles (NaCl or (NH4)2SO4) or by an inverted flame soot generator. The aerosol was dried, neutralised, and size-selected with a Differential Mobility Analyser (DMA) to produce a monodisperse stream. The flow then entered the low-pressure section through a critical orifice, where dilution and pressure control were achieved using a mixing chamber and mass flow controllers. Downstream, the aerosol was distributed to the reference Faraday Cup Electrometer (FCE), the butanol-based CPC (B-CPC), and the DMSO-CPC for parallel measurements. Original setup by Bundke et al. (2015), modified by and adapted from Weber et al. (2023b).
In order to investigate the performance of the CPC when utilising various aerosol types, the nebuliser was employed to nebulise salt solutions. Sodium chloride (NaCl) and ammonium sulfate (AS) were selected for this purpose. Furthermore, the measurement of fresh combustion soot was conducted. It should be noted that, unless stated otherwise, the test aerosol is NaCl.
Two Sky-CPC 5411 instruments (GRIMM Aerosol Technik) were used for all measurements. The Sky-CPC is a commercially available condensation particle counter designed for aviation applications. It is based on a laminar-flow, continuous-flow CPC design consisting of a saturator and a downstream condenser. The aerosol flow is conditioned in the saturator, where it becomes saturated with working fluid vapor, and subsequently enters the condenser, where a temperature gradient induces supersaturation and particle activation followed by droplet growth.
In this study, one CPC was operated with butanol (B-CPC) as intended by the manufacturer, while the second instrument was operated with dimethyl sulfoxide (DMSO) as working fluid (DMSO-CPC). Both instruments were operated at a constant volumetric flow rate of Q=0.6 L min−1, resulting in laminar flow conditions within the growth tube. As ambient pressure changes, the corresponding mass flow rate and residence time inside the condenser vary accordingly. The flow configuration and general instrument design follow the description given in Bundke et al. (2015). A Faraday Cup Electrometer (FCE; model 5705, GRIMM Aerosol Technik) was used as a reference instrument for particle concentration. A more detailed description of the experimental setup can be found in previous studies (Bundke et al., 2015; Bischof, 2022; Weber et al., 2023b).
As a result of the findings from a recent study (Weber et al., 2023b), some modifications had to be made to the DMSO-CPC. It was found that rubber parts of the refilling valve that are in direct contact with DMSO start swelling, which leads to a shutdown of the instrument's wetting system after some time. In particular, an o-ring and a stamp were causing those problems. To solve these issues, the rubber o-ring was replaced with a silicone o-ring and the stamp was intentionally soaked with DMSO to swell to its maximum and then cut back to its original size (see Weber et al. (2023b) for details).
2.1.2 Final Particle Size Quantification
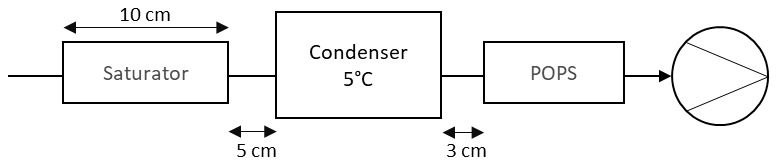
Because particle growth inside the condenser cannot be measured directly, experiments were carried out to quantify the final droplet size after the condenser. The laboratory setup is shown in Fig. B1 in the Appendix. A specially designed and self-constructed saturator-condenser-unit was used for this purpose. The saturator comprised a metal tube (length=10 cm, inner diameter=2 cm) containing a manually DMSO-wetted wick. The chosen dimensions closely represent those of the CPC used in this study. A heating element was wrapped around the tube, allowing manual control of the saturator temperature.
For reasons of feasibility, the condenser dimensions used in this experiment were slightly smaller than those of the Sky-CPC. The condenser temperature was fixed at 5 °C for all measurements. The particle size was determined immediately downstream of the condenser using a Portable Optical Particle Counter (POPS). The original instrument design by Gao et al. (2016) was modified in our laboratory. Our custom-built POPS employs a 405 nm diode laser to count and size individual particles in the range 125 nm−4 µm based on elastic light scattering.
All components of the setup were connected with conductive silicone tubing, with the tubing length minimized to reduce particle losses. The flow rate was maintained at 0.6 L min−1, consistent with all other measurements in this study. All experiments were performed using laboratory air, as the objective was to obtain a general characterisation of the resulting droplet sizes and their behaviour under varying saturator temperatures.
2.2 Model Simulations
Direct observation of vapor saturation and droplet growth inside the CPC is not feasible. To support the interpretation of experimental measurements, we employed numerical simulations. These simulations were conducted using COMSOL Multiphysics®, a three-dimensional computational fluid dynamic simulation program (CFD).
A two-dimensional axisymmetric model of the saturator and condenser stages was developed, with geometries chosen to closely reflect the actual instrument. Within the saturator, a metal rod of radius 0.2 cm is located at the centerline. It is assumed that this metal rod also has the saturator temperature Tsat. An additional insulator stage was simulated between the saturator and condenser stage. The overall flow rate was set to 0.6 L min−1, as specified for the CPC. Simulations were carried out under various pressure and internal temperature conditions. Temperature-dependent properties of the working fluids, including surface tension, density, vapor pressure, and gas-phase diffusion coefficient, were obtained from Yaw’s Handbook for both DMSO and butanol (Yaws, 2003). Atmospheric pressure effects were considered by modifying the diffusion coefficient of the working fluid in air and the carrier gas density, as lower pressure decreases gas density and proportionally increases the diffusion coefficient (Bauer et al., 2023).
The model couples laminar flow, heat transfer in fluids, and convective-diffusion modules to compute the temperature, velocity, and vapor concentration fields in the CPC. These fields are then passed to MATLAB for the calculation of the subsequent droplet growth inside the condenser (Hao et al., 2021). The minimum particle size that can be activated for condensation growth is given by the Kelvin equation, where σ is the surface tension, R the molar gas constant, T the temperature, S the supersaturation ratio, and νm the molar volume:
Due to the spatial variation of temperature, surface tension and saturation ratio, Dp,Kelvin also varies at different locations of the condenser. When the required supersaturation ratio is reached for a specific radial position and particle size Dp,Kelvin according to Eq. (1), droplet growth computation is initialized and solved using MATLAB’s ode15s solver. This solver is designed to handle stiff differential equations and differential-algebraic equations (DAEs) with a variable-order integration method. A more in-depth description of the particle growth rate can be found in Pandis and Pandis (2016). Concentration-dependent effects, such as vapor depletion and condensational heating, are not considered in the simulation, as they become significant only at high particle number concentrations (Lewis and Hering, 2013). Vapor depletion refers to the uptake of working fluid vapor by particles, while condensational heating arises from the release of latent heat during condensation, which increases the local temperature and reduces the supersaturation. A more detailed description of the model can be found in Krasa et al. (2025).
The raw data obtained from the experimental setup for low-pressure characterisation (Sect. 2.1.1) requires a series of corrections and adjustments before meaningful analysis can be performed. Figure 2 summarises the data analysis procedure, outlining the steps taken to correct and adjust the measurements and ultimately determine the counting efficiency of both CPCs.
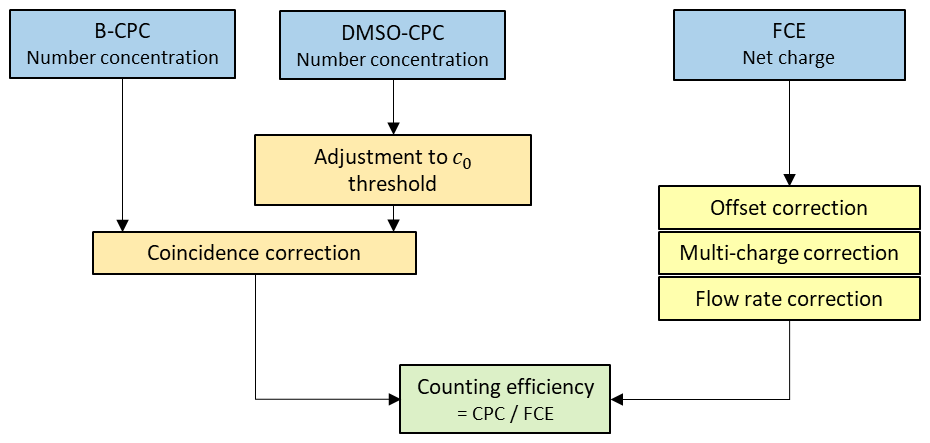
Figure 2Overview of the data processing and correction workflow for the low-pressure characterisation experiments. The flowchart illustrates the sequential steps applied to the raw measurement data (blue), including correction, adjustment, and evaluation procedures (orange and yellow), leading to the determination of the counting efficiency for both CPCs (green). Adapted from Bischof (2022).
The data analysis procedure described in this section was performed using an in-house developed Python program. The fully automated program applies all necessary corrections and adjustments, generating output files with the relevant parameters and producing several plots for graphical visualisation of the results.
3.1 Faraday Cup Electrometer
Accurate interpretation of Faraday Cup Electrometer (FCE) measurements requires correction of the raw data for instrumental offsets and pressure-dependent flow variations. The electrical offset of the FCE arises from small background currents within the electrometer circuitry or leakage currents in the measurement system. Offsets of a few femtoamperes (fA) are commonly observed and can be comparable in magnitude to the aerosol-induced signal, especially under conditions of low particle concentration (Hermann et al., 2005; Jarrett and Owen, 2013). Consequently, regular baseline measurements with particle-free air must be performed to determine and subtract the offset current from the recorded data. Proper correction for this offset is essential to ensure the accuracy of the derived charge fluxes and to avoid systematic bias in the aerosol charge or concentration estimates. Furthermore, corrections to the electrometer flow rates were made to account for the corresponding conditions of reduced pressure.
When using a diffusion charger together with a DMA and an FCE as the reference instrument, it is important to account for the presence of multiple charged particles exiting the DMA. A particle carrying n charges will be detected n times by the FCE, whereas the CPC will register it only once. To correct for this discrepancy in counting rates, the procedure described by Bundke et al. (2015) was applied. This method incorporates the actual particle size distribution to properly account for the contribution of multiple charged particles.
The FCE instrument was not calibrated immediately prior to the measurements. According to the manufacturer, the calibration factor typically does not exceed 2 %, indicating only a minor contribution to overall measurement uncertainty. Moreover, because we normalise our efficiency curves using the linearity of concentration signal (see Sect. 3.3), any systematic offset associated with the FCE calibration factor is effectively incorporated into this normalisation procedure. As a result, the absence of an externally applied FCE calibration factor is not expected to influence the interpretation of our results, especially the cutoff diameters.
3.2 Particle Growth Adjustment
The Sky-CPC 5411 provides an internal diagnostic of droplet growth. Aerosol particles enter the instrument, undergo condensational growth to droplets in the condenser, and are subsequently detected optically. This growth process is evaluated by the instrument using two fixed signal thresholds.
In the following, we refer to the particle number concentrations c0 and c1, which the instrument derives from two fixed manufacturer-defined voltage thresholds in order to distinguish different levels of droplet growth based on the scattered-light signal. These thresholds are Uth(c0)=0.5 V and Uth(c1)=1.2 V, respectively.
The lower threshold Uth(c0) represents the minimum signal required for a grown droplet to be detected above the noise level. The corresponding concentration c0 therefore includes all aerosol particles that have grown into optically detectable droplets. The higher threshold Uth(c1) requires a stronger scattered-light signal and is only exceeded by droplets that have grown to larger sizes. The concentration c1 thus represents the subset of detected droplets that produce a higher optical signal. By design, the instrument reports the c1 concentration as the particle number concentration.
The ratio , hereafter referred to as the indicative droplet growth ratio, provides a diagnostic of the growth efficiency, i.e. the fraction of optically detected droplets that reach the higher signal regime within each 1 s measurement interval. Values of indicate that a fraction of grown droplets does not reach the higher detection threshold.
As illustrated in Fig. 3, the DMSO droplet diameters corresponding to the c0 and c1 thresholds are approximately 2.5 and 4.6 µm, respectively, with smaller droplets not being counted. These values were derived by Weber et al. (2023b) from signal measurements of latex test particles combined with a model of scattered-light intensity for the GRIMM measuring cell. Since these thresholds were originally defined by the manufacturer for operation with butanol, an adjustment is required when using DMSO. This is due to the lower vapor pressure of DMSO, which reduces the available vapor for condensational particle growth. Ideally, this adjustment would be implemented in the instrument hardware through a redefinition of the voltage thresholds for DMSO operation. As a practical workaround in this study, we use the c0 count as the particle number concentration.
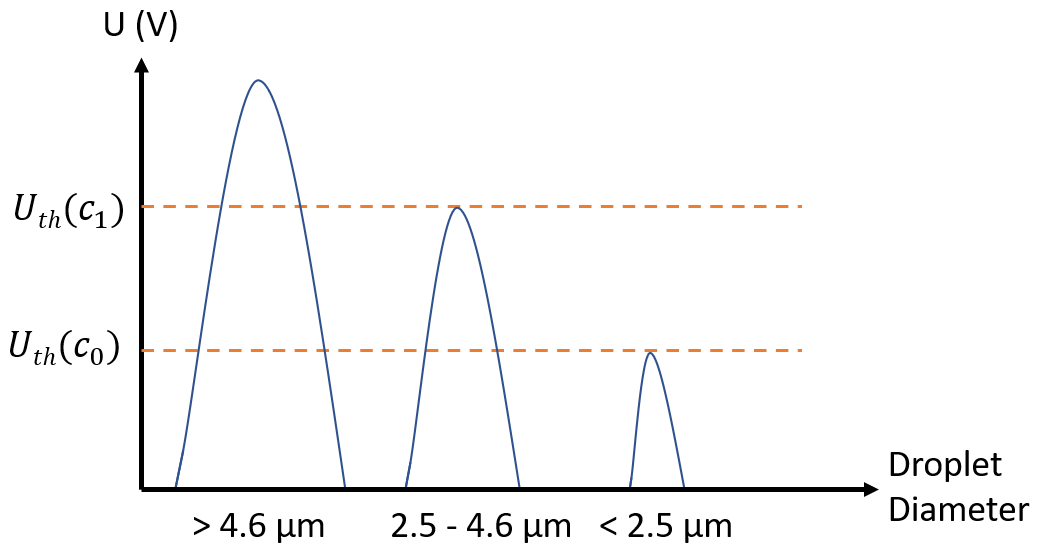
Figure 3Illustration of the CPC detection thresholds UTh(c0) and UTh(c1) and their corresponding DMSO droplet diameters used to interpret the droplet growth ratio (adapted from Weber et al. (2023b)).
3.3 Linearity of Concentration Signal
The linearity of the concentration signal of a CPC describes how its measured response varies with changes in total particle number concentration relative to a reference instrument. Calibration is necessary due to the specific configuration and instrumentation used in this study. The measurement shown in Fig. 4 was performed using the experimental setup described in Sect. 2.1.1 and illustrated in Fig. 1. A single DMA scan cycle was conducted, covering particle diameters from 140 nm down to 2.5 nm, producing monodisperse aerosol populations at each step. The reference number concentration for each size was determined using the FCE, which measures particle charge to provide an accurate, traceable count. The linear relationships between the concentrations measured by both CPCs and the FCE is characterised by the slope K0. The black dashed line represents the 1:1 relationship, while the shaded gray area indicates a ±10 % deviation. Filled squares correspond to the coincidence-corrected concentrations of the B-CPC, and circles denote the coincidence-corrected and c0-adjusted concentrations of the DMSO-CPC. Both datasets are plotted against the fully corrected FCE concentration. The slope obtained for the B-CPC is K0=0.886, which agrees well with the slope of the DMSO-CPC, for which K0=0.866. The slope of each linear fit is subsequently used to correct the data, ensuring comparability of the D50 cutoff diameters across all measurements by normalising the efficiency curves to unity (see Sect. 3.4).
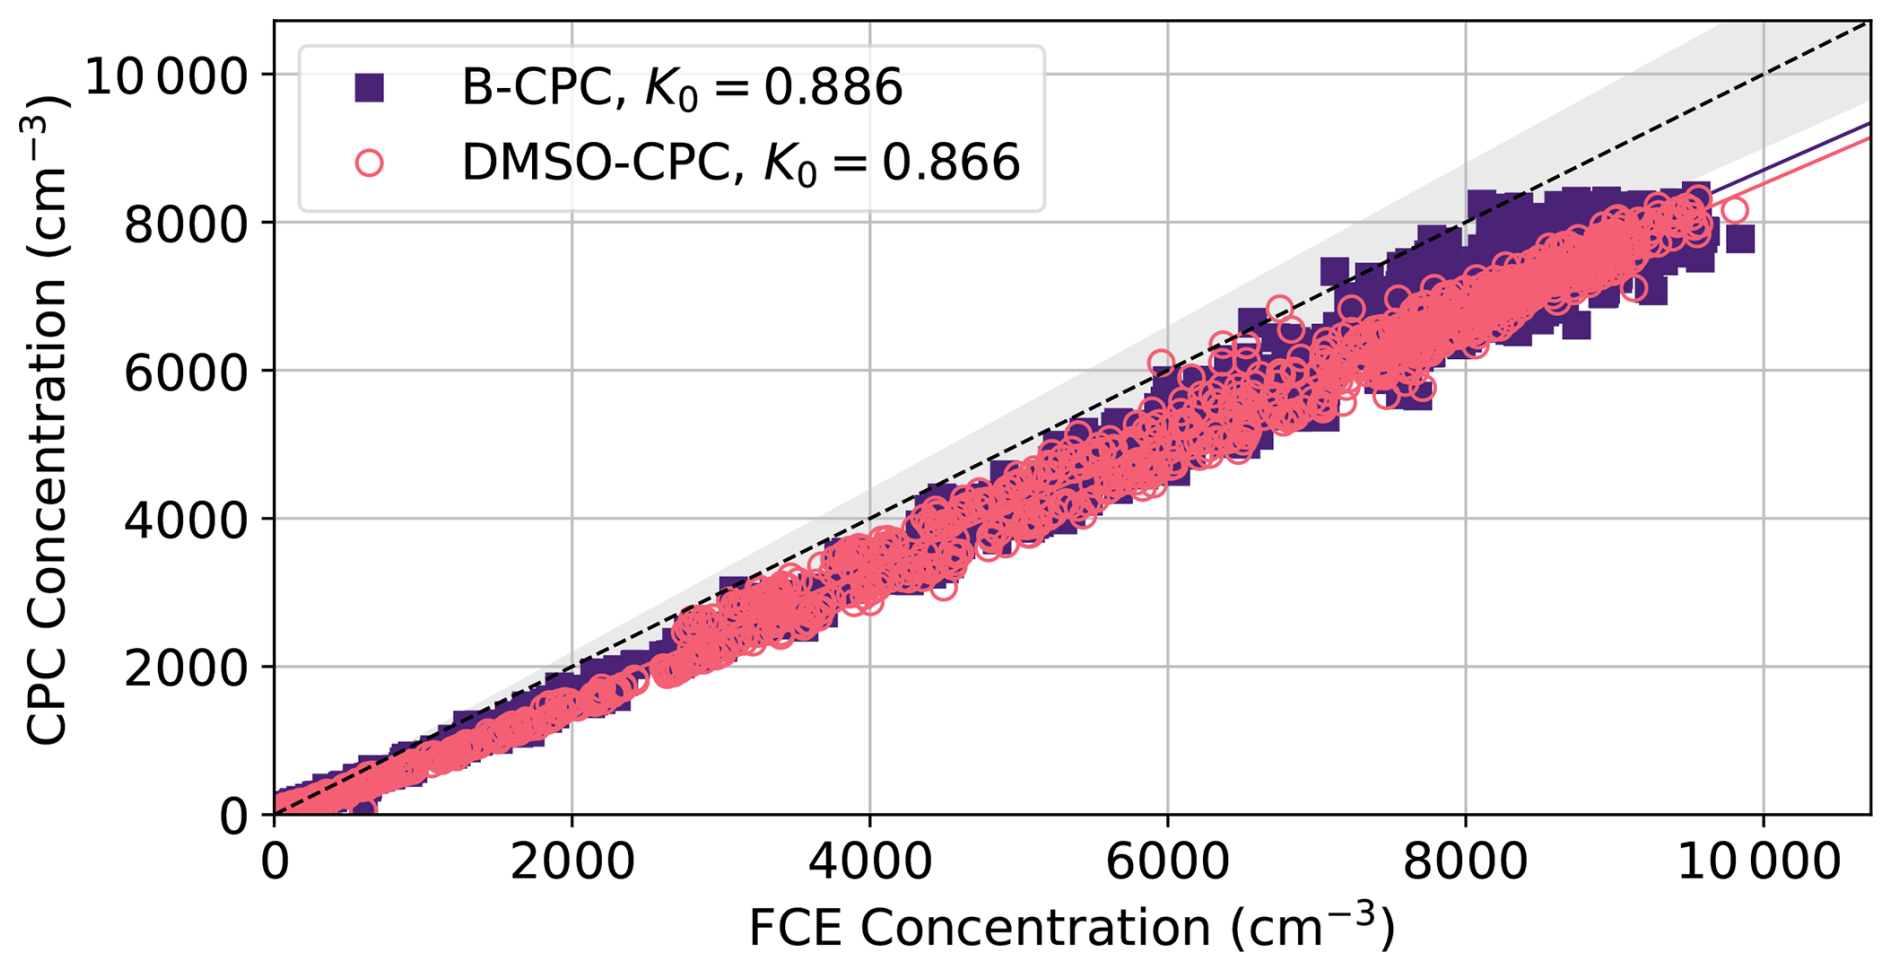
Figure 4Scatter plot comparing the concentration measurements of the B-CPC and DMSO-CPC against the FCE reference for NaCl test aerosols. The black dashed line indicates the 1:1 relationship, and the grey band represents a ±10 % deviation.
3.4 CPC Counting Efficiency and Cutoff Diameter
In order to ascertain the performance of a CPC, the counting efficiency curve with respect to a reference instrument is utilised. The calculation of the particle-size-dependent counting efficiency η is derived from the ratio of the corrected number concentration of particles detected by the CPC (NCPC) to the corrected number concentration measured by the reference instrument, in this case the electrometer (NFCE):
Figure 5 presents representative counting efficiency curves for the Sky-CPC 5411 operated with butanol and DMSO. The efficiency curves are parameterized by an exponential fit function introduced by Wiedensohler et al. (2018):
From the efficiency curves, two characteristic parameters can be determined. First, the asymptotic maximum counting efficiency ηmax. It represents the plateau region where the counting efficiency remains constant as the particle diameter increases. Second, the cutoff diameters, D50 and D90, which correspond to the particle diameters at which 50 % or 90 % of the particles are counted relative to the reference.
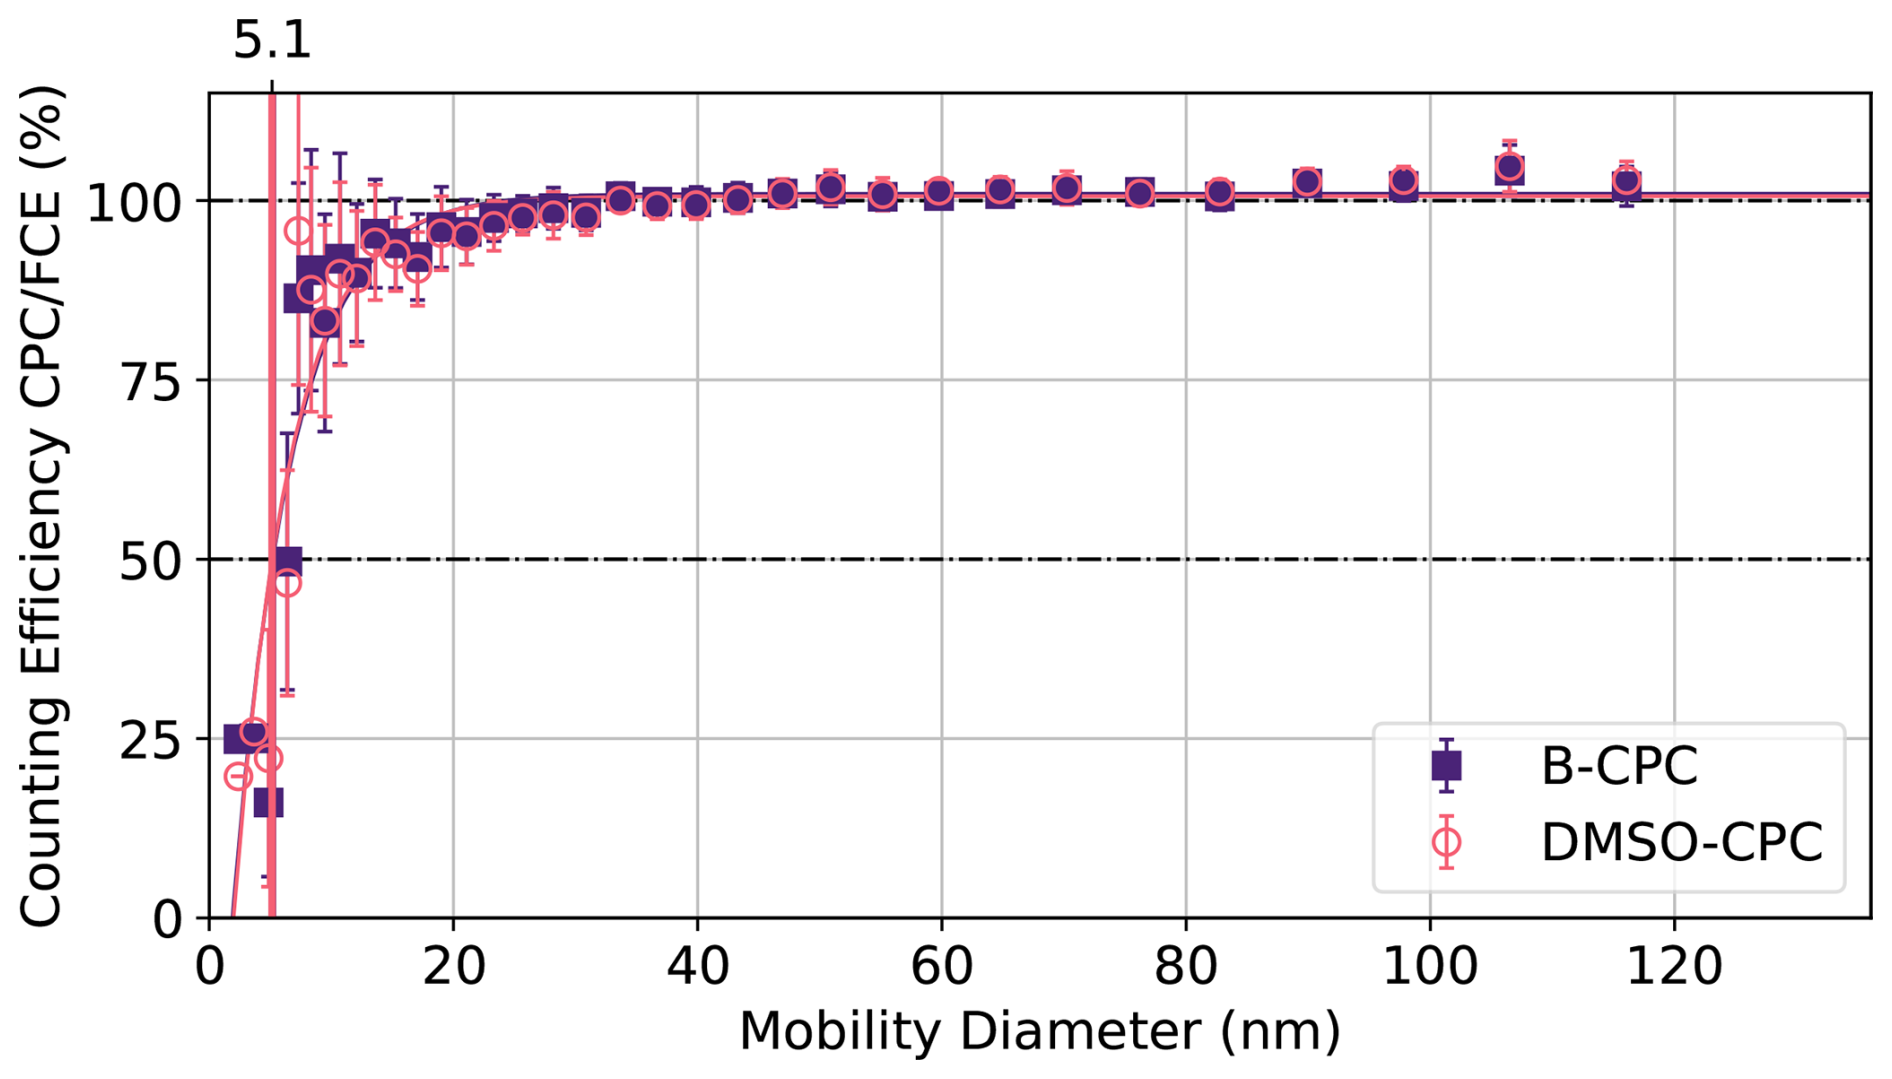
Figure 5Counting efficiency curves for NaCl particles with respect to the FCE reference instrument applying all corrections for the B-CPC (squares) and the DMSO-CPC (circles) at 700 hPa, a saturator temperature of 40 °C, and a condenser temperature of 10 °C. Both CPCs exhibit a cutoff diameter of D50=5.1 nm.
4.1 Particle Growth
4.1.1 Evaluation of the Indicative Droplet Growth Ratio ()
The internal diagnosis of the GRIMM CPC associated with droplet growth is represented by the indicative droplet growth ratio , as illustrated in Sect. 3.2. The ratio is always found to fall between zero and one. It has been determined that a ratio of corresponds to DMSO droplets with diameters between 2.5 and 4.6 µm, whilst a ratio of indicates that the DMSO droplets have grown to diameters above 4.6 µm.
All data presented in this section are based on DMA size-selected aerosol, enabling a controlled investigation of droplet growth as a function of particle size and number concentration.
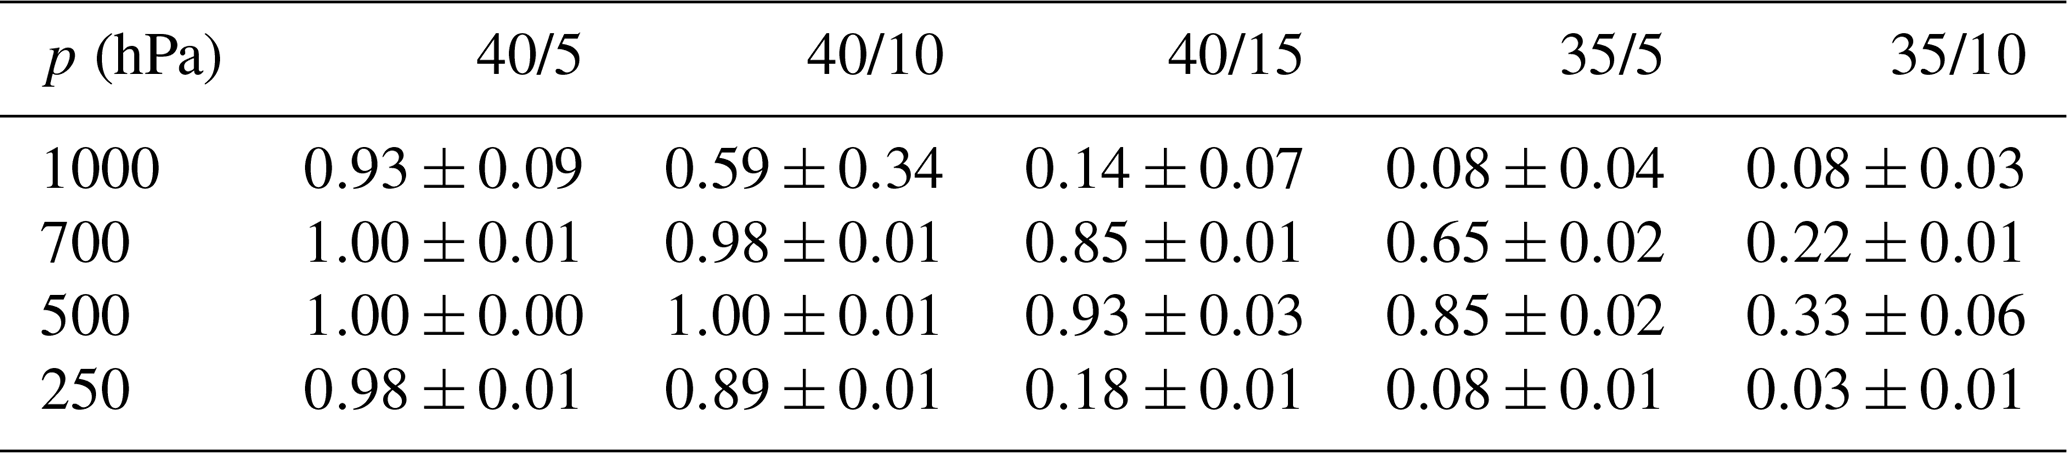
Table 2 summarizes the average indicative droplet growth ratios of the DMSO-CPC across all pressure and internal temperature settings for NaCl test aerosols. Each reported value represents the mean and standard deviation calculated from independent experiments. Although the values are not always constant during individual measurements and tend to exhibit systematic trends (see below), the overview of the average values serves to highlight the main features of droplet growth under varying conditions. The data show that droplet growth in the DMSO-CPC depends strongly on the internal temperature settings. The most efficient growth occurs at high saturator temperatures Tsat and large temperature differences ΔT. For Tsat=40 °C and ΔT≥30 °C, the ratio remains larger than 0.5. Reducing the temperature difference or the saturator temperature leads to consistently lower values across all pressures. However, the ratios at the reduced saturator temperature are exceptionally low for 1000 hPa and 250 hPa, with values as low as 0.03. Similarly low values occur at a saturator temperature of Tsat=40 °C when the temperature difference is reduced to ΔT=25 °C.
Table 2Average values of the DMSO-CPC for all pressure and temperature settings. The column headers indicate the saturator temperature and the condenser temperature in °C in the format Tsat/Tcon.
The graphical representation of the indicative droplet growth ratios as a function of the total aerosol surface area concentration and the particle diameter offers valuable insights into the condensational droplet growth mechanism. Figure 6 shows the values plotted against the total aerosol surface area concentration at 1000 hPa and various temperature settings. The surface area concentration was calculated by multiplying the number concentration by the surface area of a sphere with radius determined from the DMA classification. Each panel represents one measurement cycle of the DMA. The color scale depicts the initial particle diameter of the monodisperse aerosol generated by the DMA. Figure 6a shows results obtained with butanol as the working fluid averaged over all internal temperature settings. The indicative droplet growth ratio remains constant at unity, indicating sufficient droplet growth under all investigated conditions. The remaining panels show results for DMSO under five combinations of saturator and condenser temperatures.
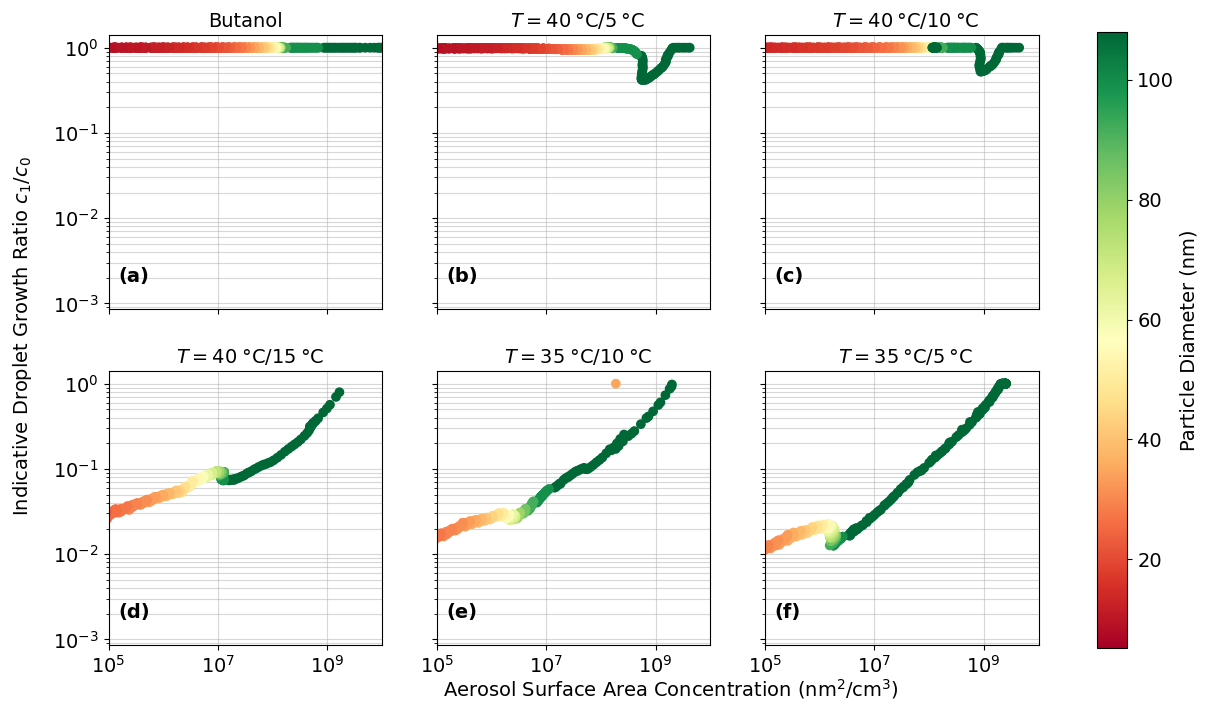
Figure 6Indicative droplet growth ratios versus total aerosol surface area concentration at 1000 hPa for NaCl aerosols. Colors indicate the initial particle diameter. (a) Butanol: across all surface area concentrations. (b–f) DMSO: optimal temperature settings (b, c) maintain , while non-optimal settings (d–f) show decreasing with smaller surface area concentrations. The kink near the yellow-shaded Dp≈50 nm reflects the peak of the NaCl size distribution, indicating growth is limited by process duration rather than vapor availability.
At optimal temperature settings, meaning high saturator temperatures and large temperature differences (Fig. 6b and c), the indicative droplet growth ratios remain close to unity for all surface area concentrations. A small local minimum near an aerosol surface area concentration of 109 nm2 cm−3 is observed in all measurements and is likely caused by an artifact in the measurement or experimental setup rather than a physical effect. Across all non-optimal temperature settings (Fig. 6d–f), the overall trend of the ratio remains consistent. Non-optimal refers to conditions yielding values below 0.3 at any point during the measurement. The indicative droplet growth ratios reach unity for large aerosol surface area concentrations but decline progressively with decreasing surface area concentration. A slight kink is visible in the yellow region around Dp≈50 nm, coinciding with the maximum of the size distribution of the generated NaCl test aerosol (see Weber et al., 2023b). That means at around Dp≈50 nm most particles are generated and towards both smaller and larger particle sizes the generated particle number concentration declines.
This observed behavior can be understood as the result of coupled particle-size-dependent activation and finite residence time in the condenser. Larger particles require lower supersaturation for activation and can therefore activate earlier along the condenser, resulting in longer effective growth times compared to particles near the cutoff diameter (Mamakos et al., 2013). This size dependence is consistent with the observed variation of with particle diameter.
Furthermore, measurements with highly agglomerated soot particles exhibit the same overall behavior, demonstrating that the CPC response is robust for both compact (NaCl) and agglomerated (soot) aerosols with highly different surface properties.
The representation as a function of aerosol surface area concentration further highlights this behavior. At low surface area concentrations, the system operates in a regime where droplet growth is primarily limited by insufficient residence time, i.e. a time-limited regime. This can equivalently be interpreted as the effective condenser length being insufficient for complete droplet growth under the given operating conditions. At higher surface area concentrations, deviations from this behavior would indicate that vapor depletion may begin to contribute, suggesting a transition toward a vapor-influenced regime.
To validate this hypothesis, we conducted an experiment with a high aerosol number concentration at 250 hPa, Tsat=40 °C and Tcon=10 °C, as these conditions also produce the characteristic trend (see Fig. 7a). The results of the high-concentration experiment are shown in Fig. 7b. The high concentration represents a doubling of the aerosol number concentration compared to the original measurement. The kink at Dp≈50 nm, now appears towards lower values with increasing surface area concentration.
This change in behavior indicates that, above a total aerosol surface area concentration of approximately 108 nm2 cm−3, droplet growth becomes limited by the availability of condensable vapor, i.e. a vapor-limited regime is reached. In addition, condensational heating due to latent heat release may further reduce supersaturation at elevated particle number concentrations. However, a quantitative separation of these effects is beyond the scope of the present study.
Overall, these observations support our hypothesis that, under the conditions of the standard measurements, the observed trends in are primarily governed by a time-limited regime, in which particles do not spend sufficient time in the condenser to reach their full droplet size.
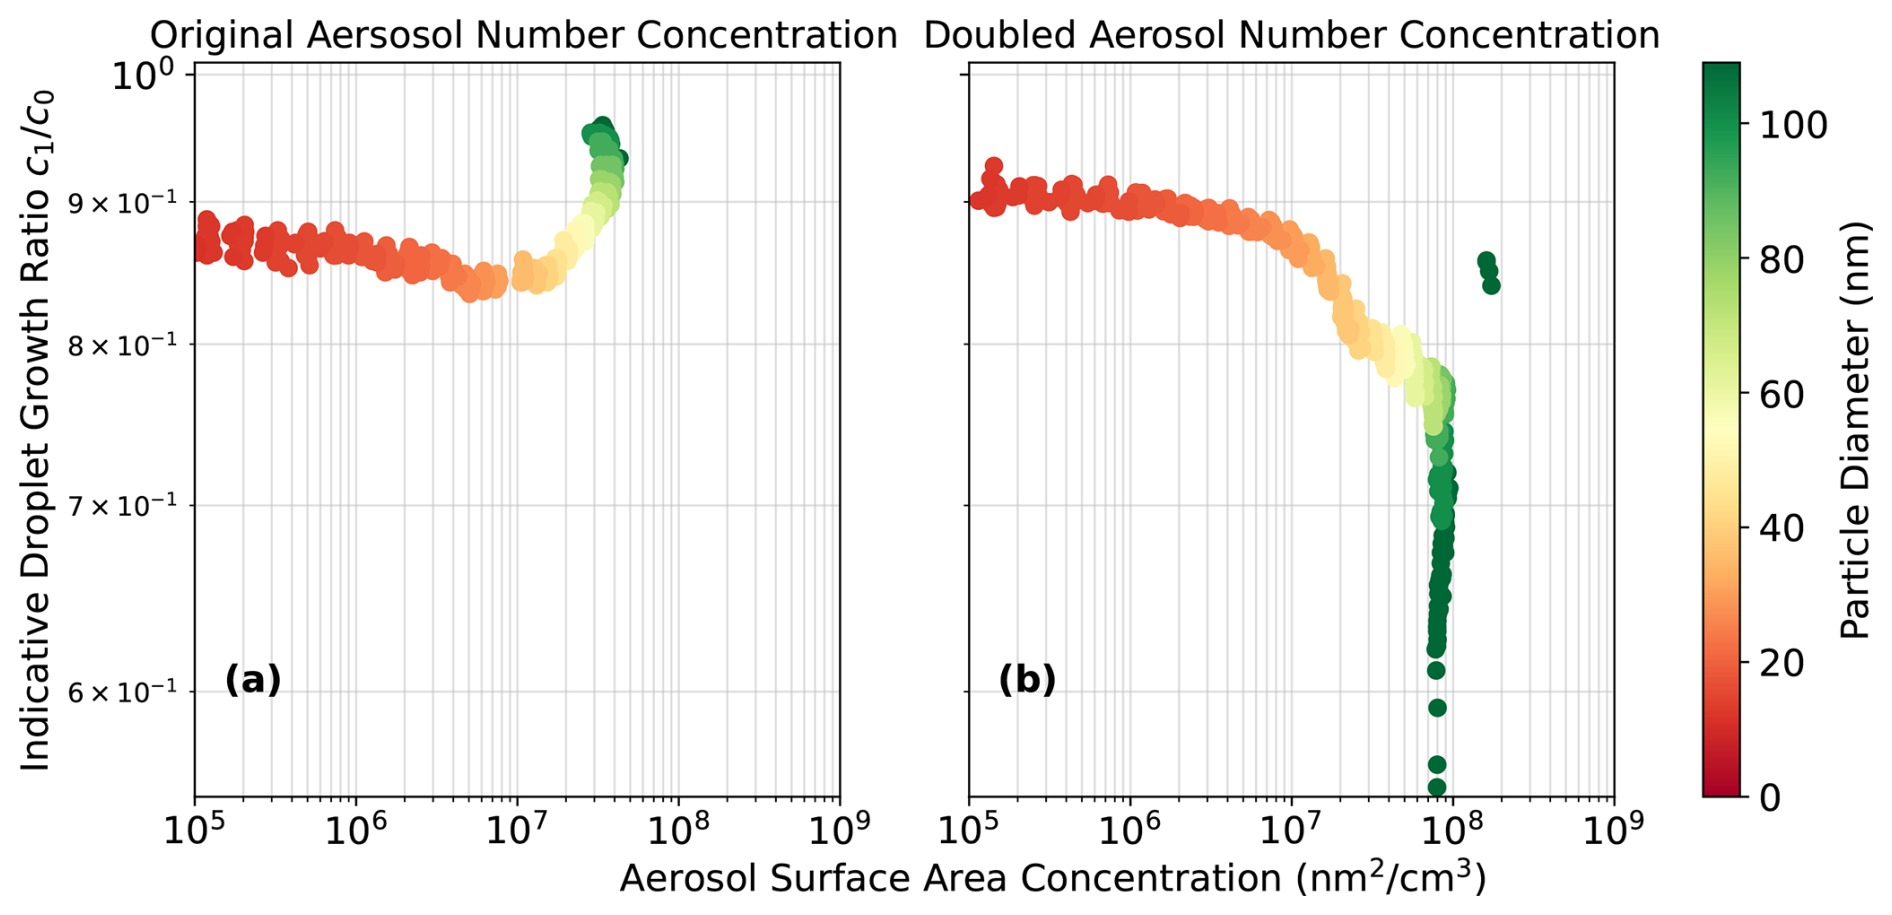
Figure 7Indicative droplet growth ratios versus total aerosol surface area concentration at 250 hPa, Tsat=40 °C, Tcon=10 °C for a high-concentration aerosol experiment. Doubling the aerosol number concentration (b) flips the kink near the yellow-shaded Dp≈50 nm to lower values at high surface areas, indicating a transition to a vapor-limited growth regime.
The study conducted by Weber et al. (2023b) did not report such low ratios under any conditions. The key difference between our study and the study conducted by Weber et al. (2023b) lies in the DMSO supply. While Weber et al. (2023b) manually wetted the wick inside the CPC with DMSO, we operated the CPC as intended by the manufacturer, with the CPC measuring the liquid level and automatically regulating the working fluid supply. With values as low as , the required level of droplet growth is not achieved inside the DMSO-CPC, indicating that the automated DMSO supply of the CPC is not sufficient and leads to lower supersaturations and therefore to less or even insufficient particle activation under specific conditions. However, sufficient droplet growth is achieved with the current settings of the refilling process when Tsat and ΔT are high. In addition, the application of the c0-adjustment to ensure the comparability of all data (Sect. 3.2) could result in a considerable degree of uncertainty for low -ratios.
4.1.2 POPS Measurement of Final Droplet Size
To quantify the final droplet size at the outlet of the condenser, a series of measurements was performed using the experimental setup described in Sect. 2.1.2. The resulting DMSO droplet size distributions at three temperature differences are shown in Fig. 8. Panel (a) corresponds to the Sky-CPC temperature setting of Tsat=40 °C and Tcon=5 °C, which yielded the highest ratios at ambient pressure (see Sect. 4.1.1). Those high ratios with indicate sufficient droplet growth to final droplet diameters larger than 4.6 µm (see Fig. 3). However, the final droplet size distribution measured by POPS yields a count median diameter (CMD) in the size bin between 2000 and 2200 nm.
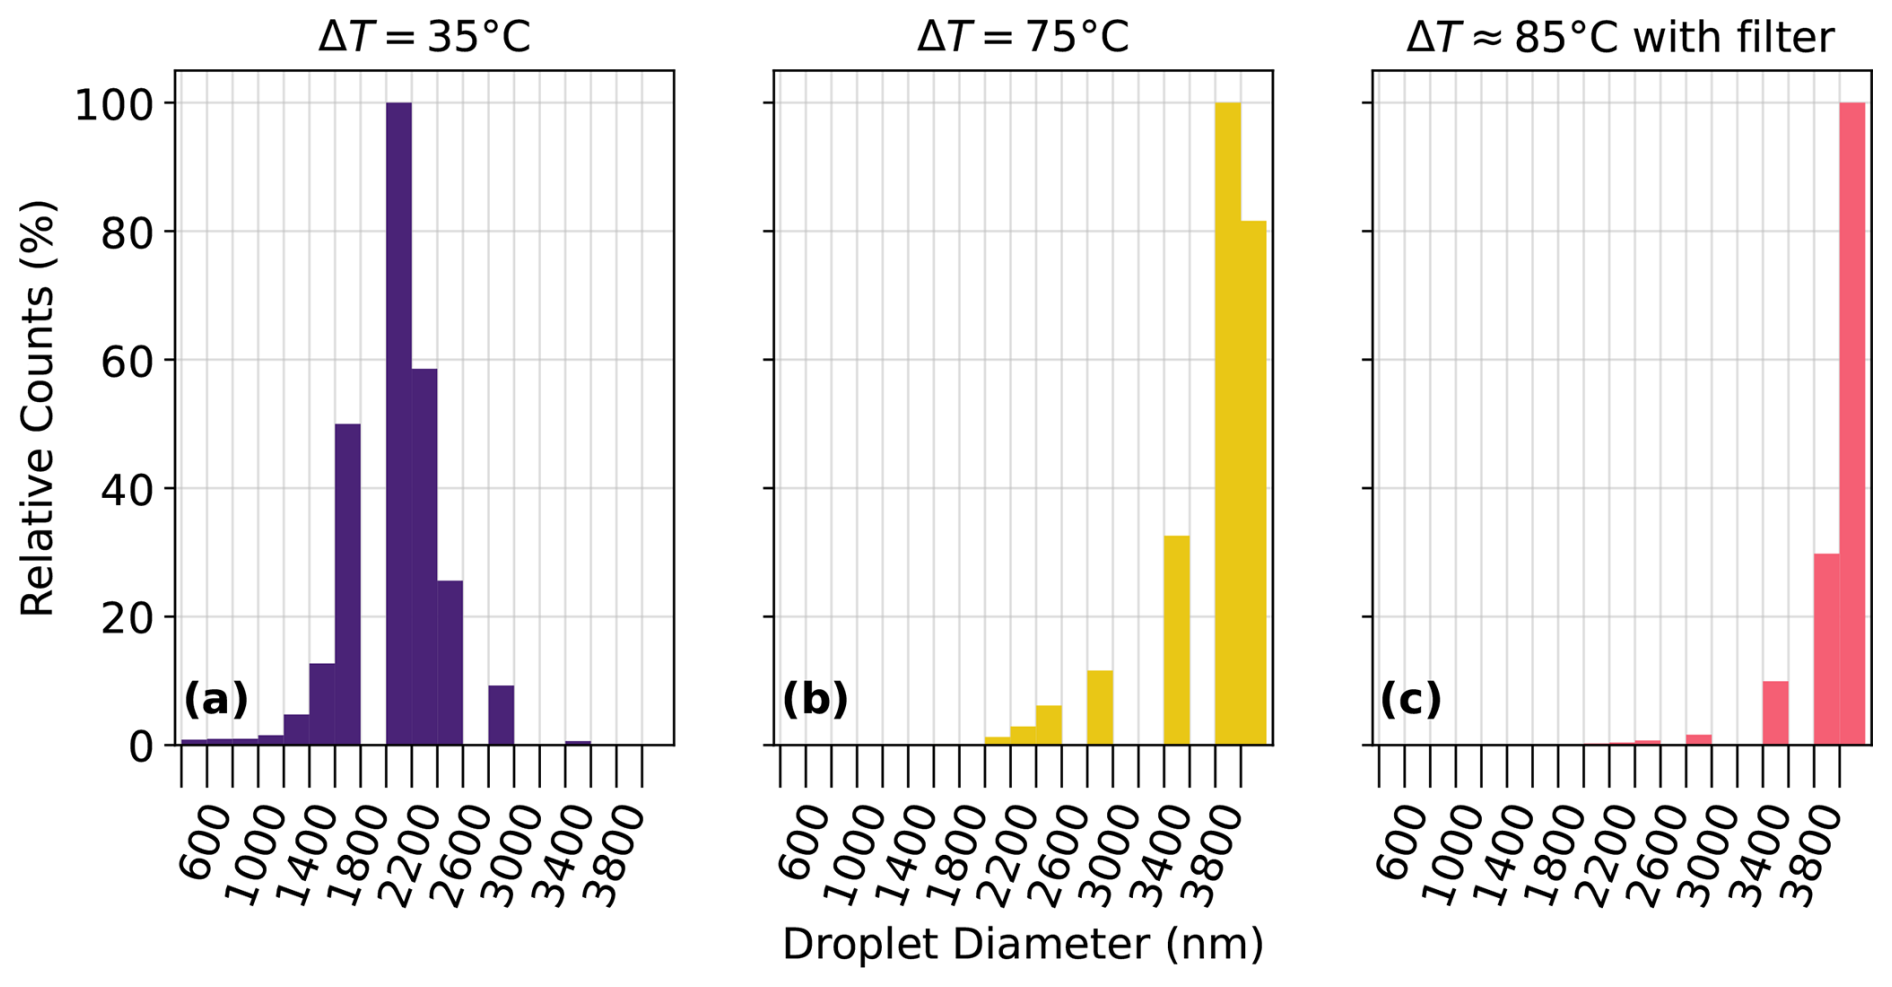
Figure 8Final DMSO droplet size distributions at three temperature differences (ΔT). The condenser temperature was fixed at Tcon=5 °C. Relative particle counts as a function of droplet diameter were measured using a POPS. Panels (a, b) show results without a filter, while (c) shows measurements with a filter, indicating homogeneous nucleation.
The significant difference between the -derived final droplet size and the POPS measurements can be attributed to two factors. First, the geometric dimensions of the condenser in this setup differ from those of the Sky-CPC. Although the Sky-CPC condenser is not directly accessible, we estimate it to be larger than the condenser used in the POPS measurements. Lewis and Hering (2013) demonstrated that condenser diameter strongly affects the final droplet size, with wider tubes producing larger droplets. Second, the difference in droplet size can also be explained by Mie theory, as the lower refractive index of DMSO compared to polystyrene latex (PSL) particles affects light scattering and the inferred size. The POPS instrument operates at a wavelength of λ=405 nm. The refractive indices of DMSO and PSL at this wavelength are 1.49 and 1.59, respectively. Note that the refractive index of DMSO at this wavelength was estimated via the dispersion relation for DMSO at 20 °C (Polyanskiy, 2024). Although this dispersion relation is an approximation and may vary with temperature, the lower refractive index of DMSO relative to PSL implies that the measured size distribution would shift slightly toward larger particle diameters. This shift was not quantified in our study. Instead, we focused on comparing the order of magnitude and general trends of the POPS data under different CPC temperature settings.
Since the self-built CPC setup allows for higher saturator temperatures than the Sky-CPC, additional experiments were conducted at larger temperature differences to determine the achievable operating range–that is, to assess how droplet growth is affected and at which temperatures homogeneous nucleation of DMSO begins. Panel (b) shows the droplet size distribution at ΔT=75 °C. The distribution shifts markedly towards larger droplet sizes, with a CMD in the size bin between 3600 and 3800 nm. As expected, larger temperature differences between the saturator and condenser result in more pronounced droplet growth. This shift would, in principle, also lead to smaller cutoff diameters. However, this could not be verified because aerosols smaller than 5 nm could not be generated with our laboratory setup.
A further increase in the temperature difference to ΔT=85 °C results in homogeneous nucleation of DMSO. Panel (c) presents the corresponding size distribution, obtained with a filter placed upstream of the saturator. Even under these particle-free conditions, droplets larger than 4 µm were detected, confirming homogeneous nucleation of DMSO under these conditions. It is worth noting that, when the filter was installed, the droplet size counts for the measurements at ΔT=35 °C and ΔT=75 °C dropped to zero.
4.2 Simulations
To validate the experimentally quantified final droplet size in the condenser (Sects. 4.1.1 and 4.1.2), model simulations of the saturation ratio and droplet growth were conducted. The temperature and vapor pressure fields were simulated for the Sky-CPC 5411 operated with butanol and DMSO, as described in Sect. 2.2. From the results, the calculation of the saturation ratio S was performed, which are presented as contour plots in Fig. 9 for the pressure stages of 1000, 500, 250 hPa and for a temperature setting of Tsat=40 °C and Tcon=10 °C. Figure 9 only shows the condenser section of the CPC, starting at 110 mm from the instrument inlet. The preceding parts, including the saturator (0–100 mm) and the 10 mm insulating section, are not shown, as the focus is on supersaturation within the condenser and the droplet growth at its outlet. The simulations were performed for all pressure stages and temperature settings of the experimental results (see Sect. 4.3 and 4.4), but for clarity only those conditions are provided.
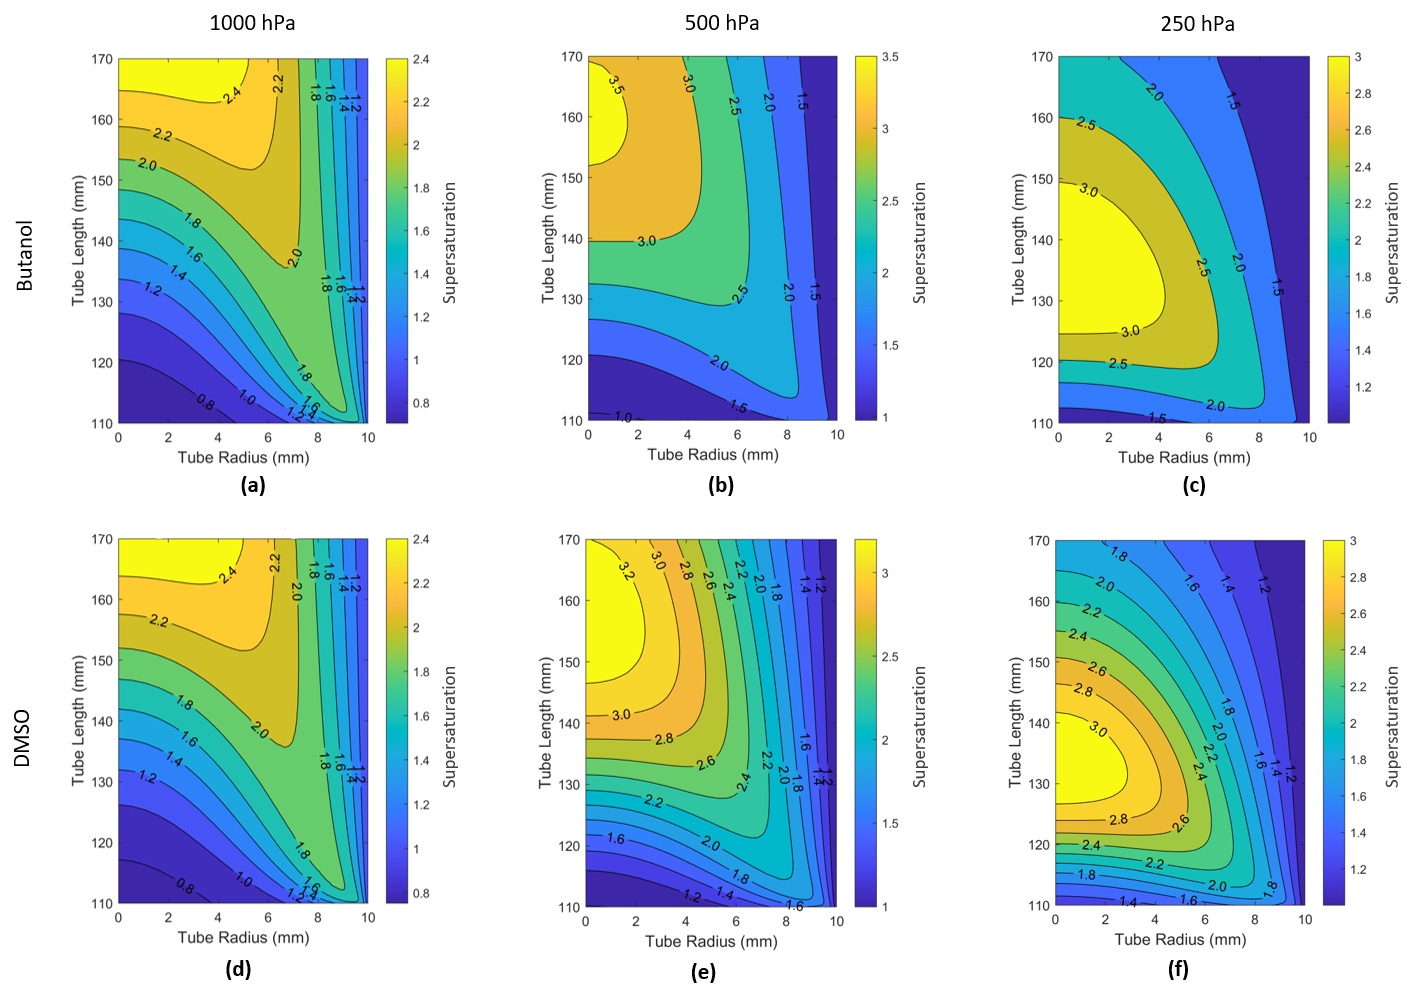
Figure 9Simulated supersaturation of the CPC's condenser for Tsat=40 °C and Tcon=10 °C under various pressures. Panels (a–c) show the results for the B-CPC and panels (d–f) for the DMSO-CPC. The region of maximum supersaturation Smax, which controls the activation of the smallest particles, shifts toward the condenser center with decreasing pressure and reaches its highest value at 500 hPa. The profiles for both fluids are nearly identical under the same conditions.
Figure 9 shows that both working fluids produce nearly identical saturation profiles inside the condenser when operated under identical conditions. This consistency holds across all simulated temperature and pressure settings. A key feature of the profiles is the region of maximum saturation ratio Smax, which determines the smallest particles that can be activated. The position of Smax depends on pressure: at 1000 hPa, it occurs near the end of the condenser, while at lower pressures it shifts progressively toward the center. This trend agrees with previous simulation studies and can be attributed to the pressure dependence of the Reynolds number Re in the heat and mass transfer equations (Hermann et al., 2005; Bauer et al., 2023). The CPCs were operated at constant volumetric flow. As diffusivity increases with decreasing pressure, heat and mass transport within the condenser become more efficient. As a result, the supersaturation maximum shifts toward the inlet of the condenser, effectively increasing the usable length of the condenser and the residence time available for particle activation and droplet growth under reduced-pressure conditions.
Furthermore, the magnitude of Smax varies with pressure, being lowest at 1000 hPa and highest at 500 hPa. The low supersaturation observed at 1000 hPa may be attributed to the limited dimensions of the condenser. Owing to its short length, the system does not allow sufficient residence time for the maximum supersaturation to be reached. Furthermore, the longer mean free path at lower pressures enhances diffusion away from the liquid surface, leading to higher saturation ratios. At the lowest pressure stage (250 hPa), however, the supersaturation decreases again due to the reduced number of vapor molecules available.
The final droplet sizes resulting from the simulated saturation profiles were calculated for all temperature and pressure settings. The results are shown in Fig. 10 for both working fluids. Consistent with the lower saturation vapor pressure of DMSO compared to butanol, droplets in the B-CPC exhibit approximately four times greater growth than those in the DMSO-CPC, although the overall behaviour remains similar. The pressure-dependent droplet growth follows the same trend as the saturation profiles: the smallest growth occurs at 1000 hPa, reaches a maximum at 500 hPa, and decreases slightly at 250 hPa. This pattern is observed for both working fluids across all temperature settings. Comparison of the different temperature conditions confirms two main trends derived from the experimental results. First, a larger temperature difference between the saturator and condenser ΔT leads to enhanced droplet growth. Second, for the same ΔT, a higher saturation temperature Tsat also promotes greater droplet growth. This is consistent with previous studies, where similar behaviour was observed (Krasa et al., 2025).
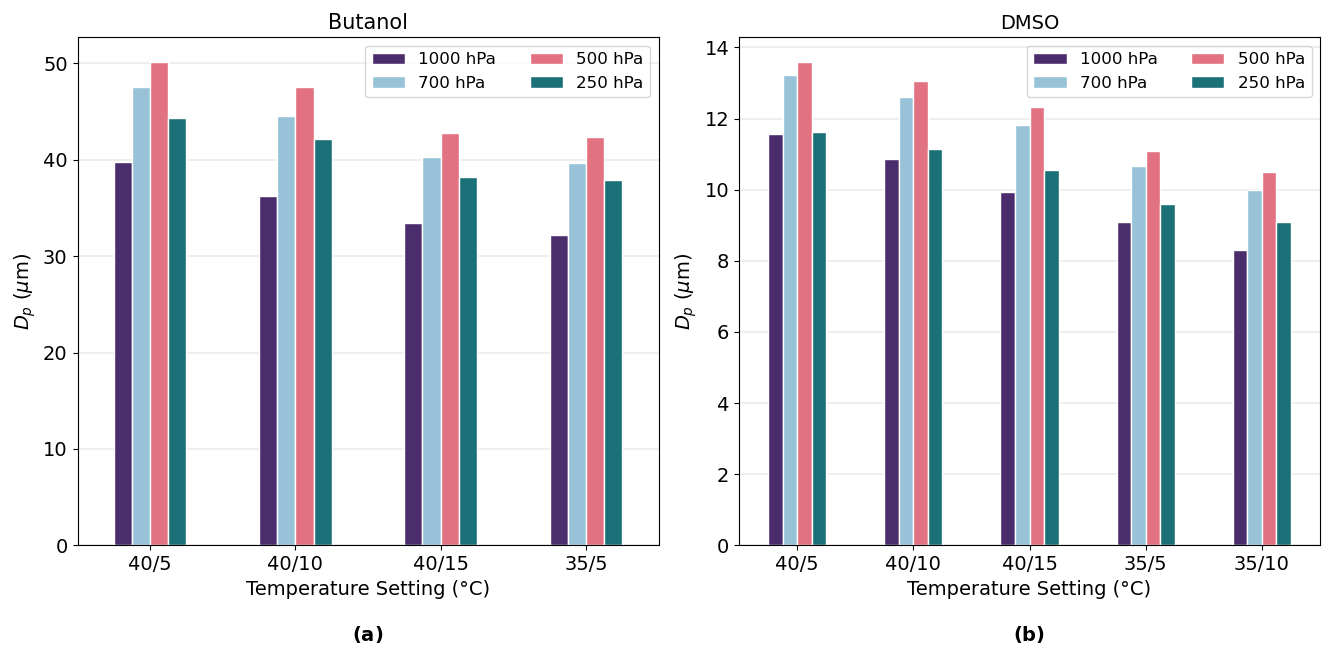
Figure 10Simulated final droplet sizes for both working fluids across different temperature and pressure settings following the notation Tsat/Tcon in °C. Droplet growth is larger in the B-CPC than the DMSO-CPC due to the higher saturation vapor pressure of butanol. Growth is smallest at 1000 hPa, peaks at 500 hPa, and decreases slightly at 250 hPa. Larger temperature differences ΔT and higher saturator temperatures Tsat enhance droplet growth for both fluids.
However, the simulated absolute final droplet sizes do not match the measured droplet sizes discussed in Sect. 4.1.1. While the values suggest insufficient droplet growth for DMSO under most conditions (see Table 2), the simulated final droplet diameters exceed 8 µm for all conditions. Two potential explanations can be proposed for this discrepancy. First, the simulations assume a perfectly wetted wick and account solely for condensation processes. Because the freezing point of DMSO is 18 °C, sublimation of the vapor may occur, which is not captured by the simulations. Second, we were limited to using estimated condenser dimensions as input for the numerical calculations in our study. Lewis and Hering (2013) demonstrated that the condenser diameter strongly affects droplet growth, with larger diameters yielding larger droplets. Also, their simulations similarly over-predicted droplet sizes compared to their experimental measurements. Accordingly, we may overestimated the Sky-CPC’s geometric dimensions, leading to larger simulated droplet sizes. Nevertheless, the overall trends and the comparison between working fluids, temperature settings, and other studies support the validity of the results.
4.3 Pressure Dependency of the CPC Counting Efficiency
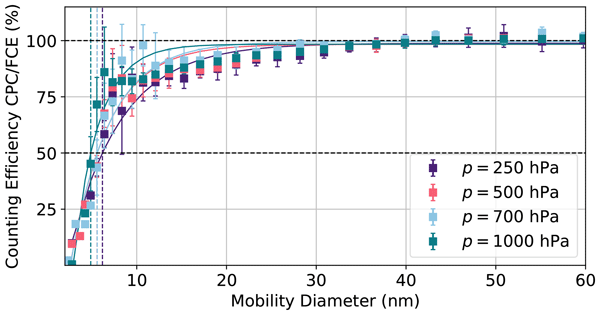
With the experimental setup described in Sect. 2.1.1 the counting efficiencies for two Sky-CPCs 5411 were determined at four different pressures of 1000, 700, 500 and 250 hPa. One CPC was operated with butanol as working fluid (B-CPC), the other with DMSO (DMSO-CPC). The chosen temperature setting for the DMSO-CPC corresponds to the setting where it was found to perform best, especially regarding its ratio which indicates sufficient particle growth. The saturator temperature of the DMSO-CPC was 40 °C, the temperature at the condenser 5 °C. The saturator temperature of the B-CPC was 36 °C, the temperature at the condenser 10 °C as intended by the manufacturer. The obtained counting efficiency curves are shown in Fig. 11. The y axis error bars indicate the standard deviation of the counting efficiency mean values and the vertical dashed lines represent the calculated D50 cutoff diameters.
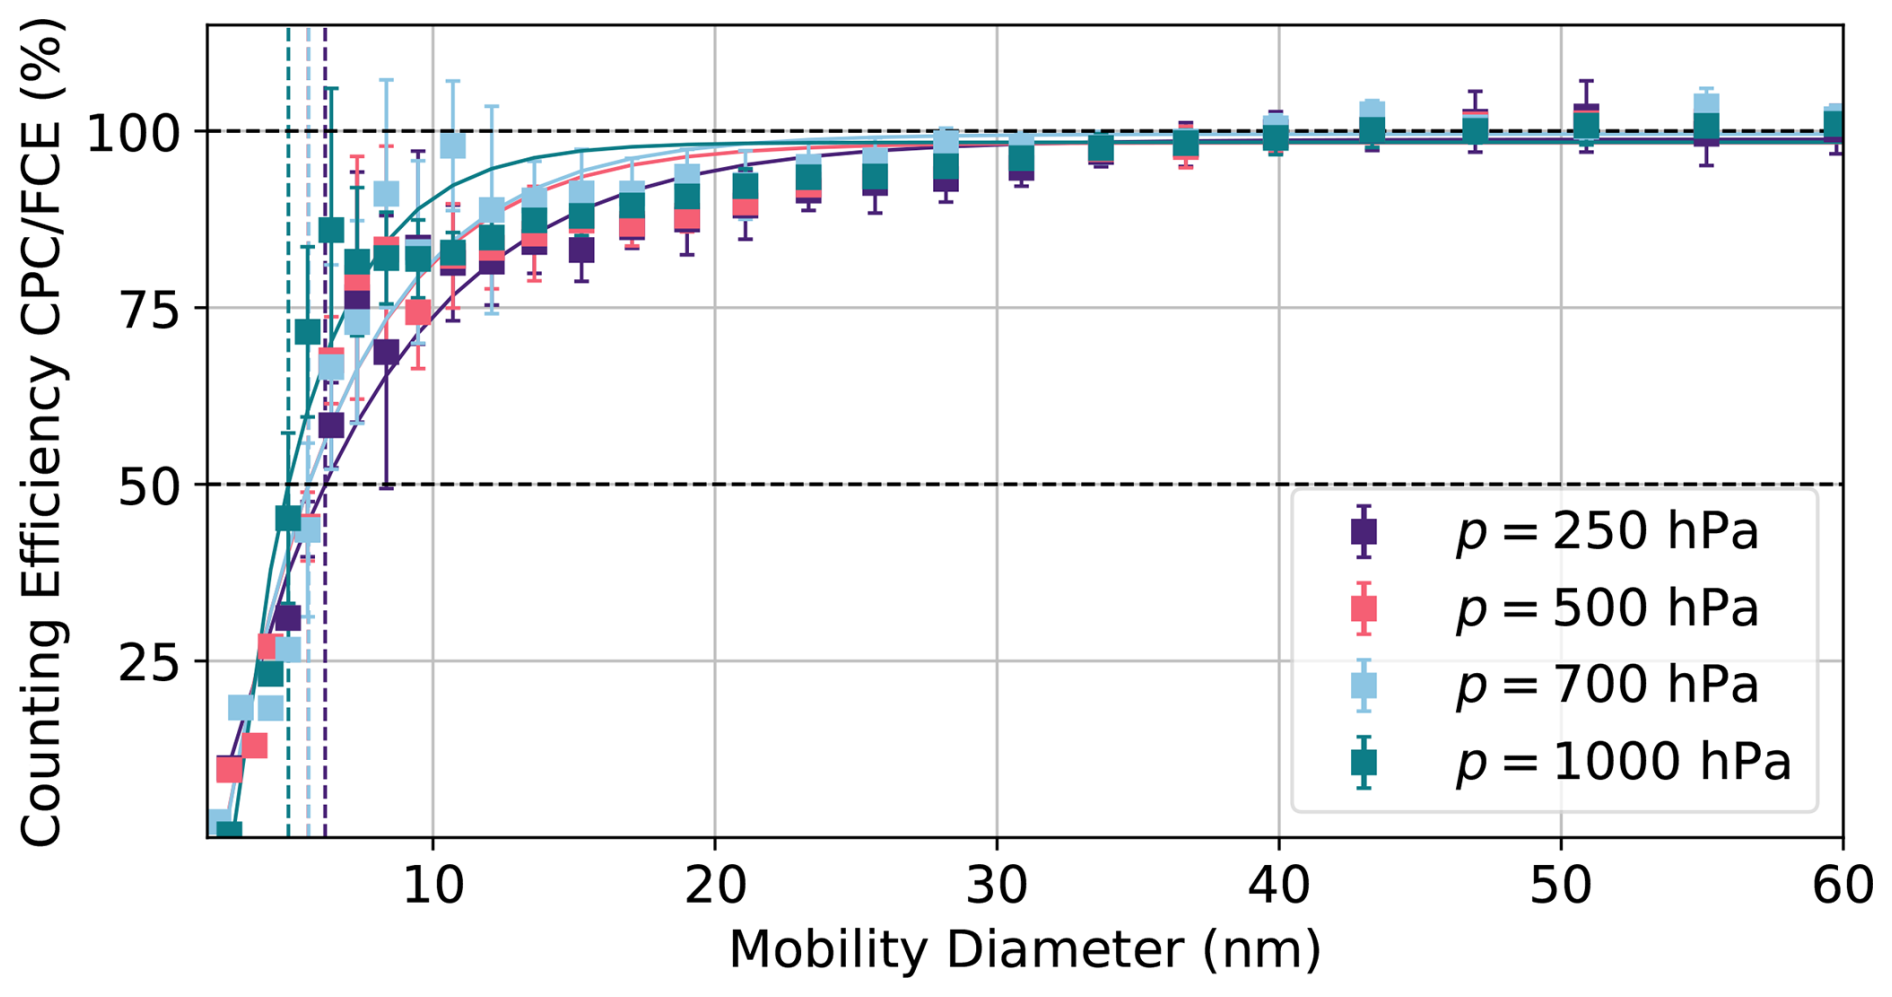
Figure 11Counting efficiency curves of the DMSO-CPC at four pressures. Error bars denote the standard deviation of mean efficiencies. Vertical dashed lines indicate calculated D50 cutoff diameters, which show no significant dependence on pressure.
The asymptotic maximum counting efficiency ηmax is normalised to unity due to the applied calibration (see Sect. 3.3). Consequently, it is not possible to directly evaluate the dependence of ηmax on pressure. However, to assess this dependence, the slope correction parameters, K0, can be compared, while the D50 cutoff diameters remain directly comparable across different measurement conditions. Figure 11 shows a slight shift in the D50 towards larger particle diameters, which is associated with a less steep slope as the pressure decreases. This shift is negligible, as it moves the cutoff from D50(1000 hPa)=4.9 nm to D50(250 hPa)=6.2 nm and lies within the uncertainty of the experiment. Figure 12 shows the K0 values plotted against the temperature difference and the different pressures are denoted by the different markers. Due to the imprecise sheath flow control within the electrometer, these K0 values cannot be treated as absolute values, but rather as a relative indicator on how the asymptotic maximum counting efficiency depends on pressure. As demonstrated in Fig. 12, there is a minor dependence of K0 on pressure for both CPCs, with reduced values as the pressure decreases. The asymptotic maximum counting efficiency, ηmax, decreases by about 14 % as drops from 0.88 at 1000 hPa to 0.75 at 250 hPa.
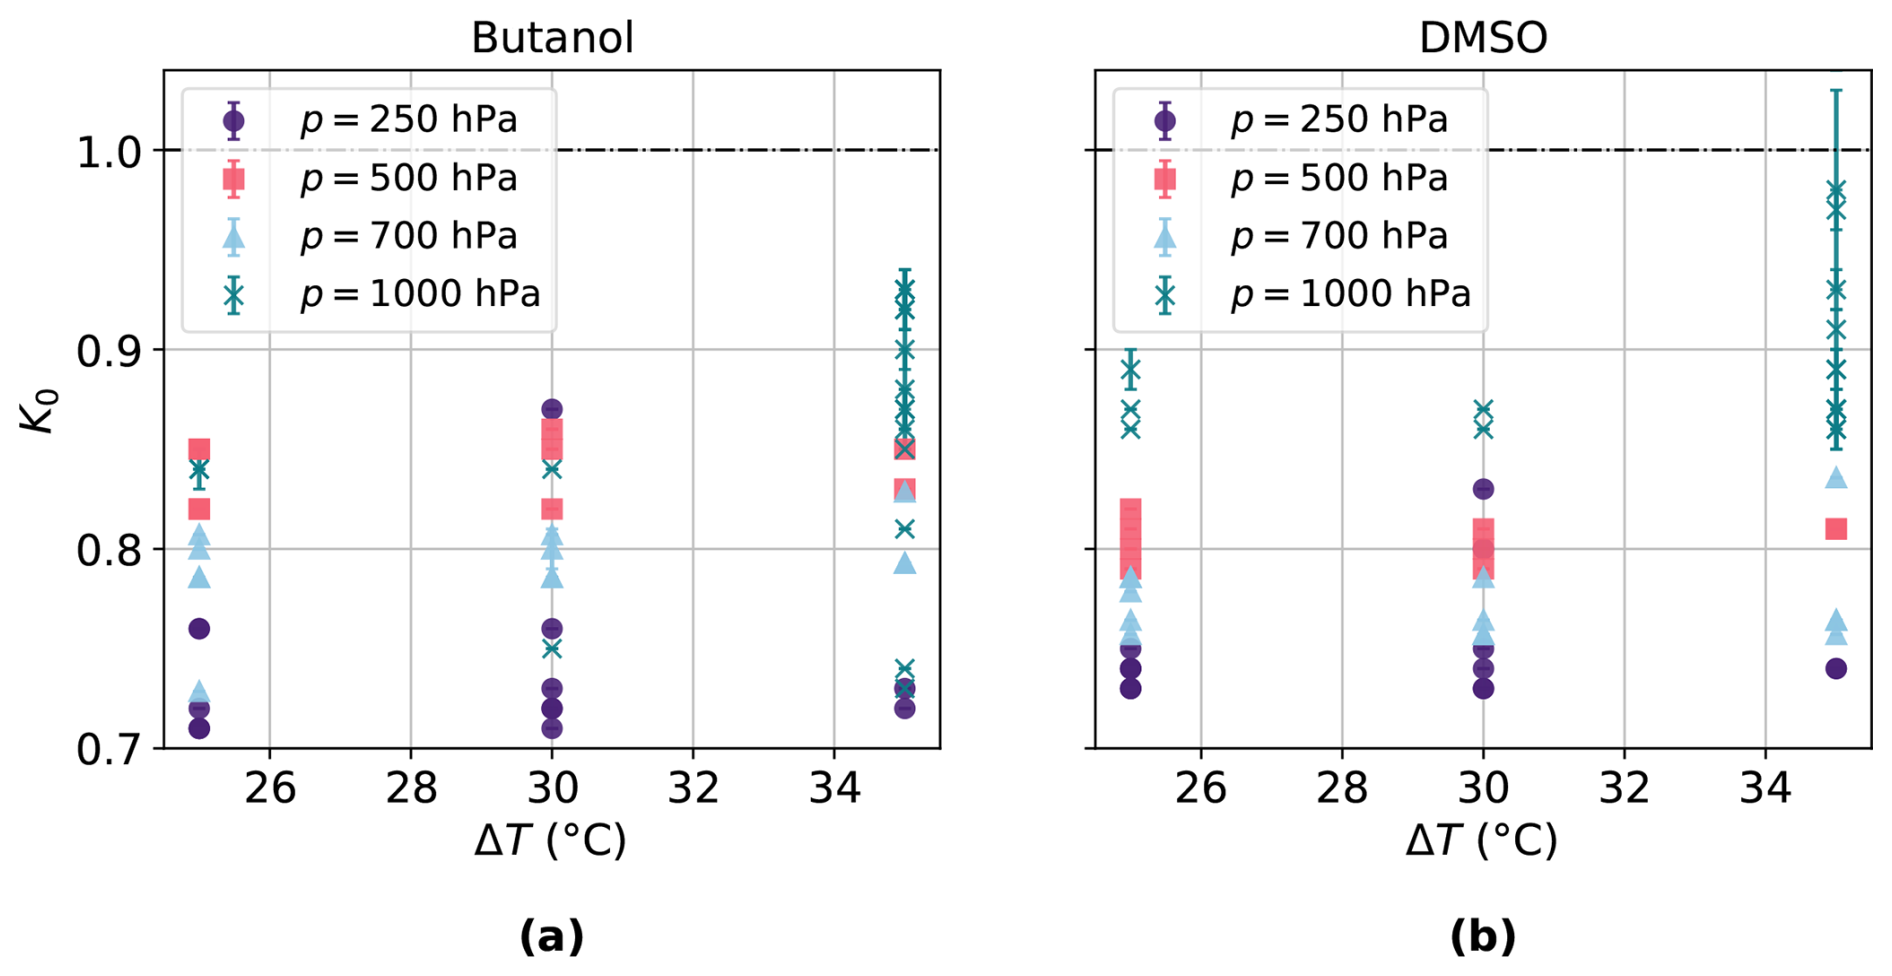
Figure 12Calibration factor K0 at different temperature differences between saturator and condenser for (a) the B-CPC and (b) the DMSO-CPC, serving as a relative indicator of the asymptotic maximum counting efficiency ηmax. The factor K0 shows no clear dependence on temperature difference but increases with pressure, indicating a decrease in ηmax with decreasing pressure.
A key finding from the pressure-dependence measurements is the close agreement between the B-CPC and the DMSO-CPC, consistent with the observations from Weber et al. (2023b). Furthermore, these results align with experimental data for a CPC operated with isopropyl alcohol reported by Bezantakos and Biskos (2022). Earlier studies consistently report a critical low-pressure point at which the CPC counting efficiency drops sharply (Hermann and Wiedensohler, 2001; Zhang and Liu, 1991; Hermann et al., 2005). As no such sharp drop was observed in our measurements, it is likely that the critical pressure for the Sky-CPC 5411 was not reached for either working fluid. Moreover, the pressure independence of D50 was confirmed for other CPC temperature settings (see Sect. 4.5).
4.4 Internal Temperature Dependence of the CPC Counting Efficiency
The counting efficiencies of the two Sky-CPCs 5411 (B-CPC and DMSO-CPC) were measured at five different internal temperature settings, as described in Sect. 2.1.1. The saturator and condenser temperatures are fixed values set via the CPCs' software, allowing investigation of both the temperature difference between saturator and condenser and the absolute temperatures of each component. The chosen settings cover a temperature difference range of 25–35 °C, with saturator temperatures varying between 35 and 40 °C. Of particular interest is the setting Tsat=40 °C and Tcon=15 °C, since the freezing point of DMSO is 18 °C. With the condenser temperature close to the freezing point, potential differences in droplet growth – whether forming solid crystals or droplets – could be observed (Weber et al., 2023b).
Figure 13 shows the counting efficiency curves of different temperature settings for the DMSO-CPC at ambient pressure of approximately 1000 hPa. As before, the y axis error bars indicate the standard deviation of the counting efficiency mean values and the vertical dashed lines represent the calculated D50 cutoff diameters. It is evident that the temperature settings of the CPC have an impact on the D50, with a higher temperature difference leading to lower D50 cutoff diameters. This finding is in good agreement with other studies and can simply be explained by higher supersaturations achieved in the condenser (Hermann and Wiedensohler, 2001; Hermann et al., 2005). Especially the reduced saturator temperature of Tsat=35 °C seems to lead to a more pronounced shift towards larger particle diameters than the temperature difference itself. This finding was also reported by Mei et al. (2021), who conducted a simulation study in which they varied the temperatures of the saturator and condenser of a water-based CPC, while maintaining the temperature difference constant.
The temperature setting of interest, with a condenser temperature near the freezing point of DMSO, does not show a significant difference compared to the other efficiency curves at the same saturator temperature. Consequently, it remains unclear whether droplet growth is unaffected or if the particle phase has no influence on the detection process.
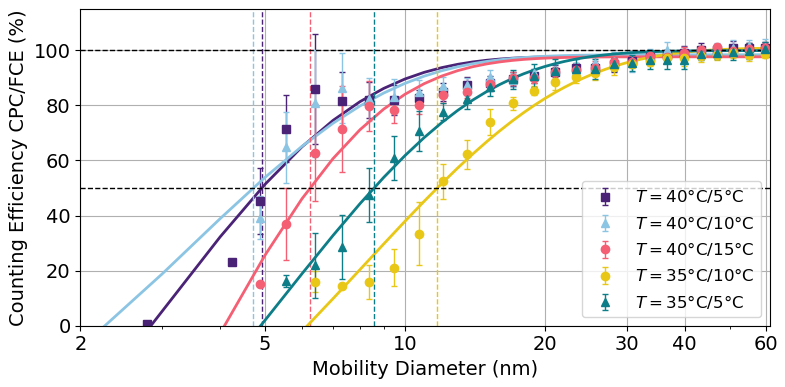
Figure 13Counting efficiency curves of the DMSO-CPC at five internal temperature settings following the notation Tsat/Tcon at 1000 hPa. Error bars represent the standard deviation of mean efficiencies. Vertical dashed lines indicate the calculated D50 cutoff diameters, which shift significantly toward smaller values with increasing temperature difference and higher saturator temperatures.
In analogy to the pressure dependence, the asymptotic maximum counting efficiency ηmax was investigated using the calibration parameter K0. As shown in Fig. 12, K0, and consequently ηmax, exhibits no significant temperature dependence for either CPC within the range of tested temperature differences. Previous studies that examined even smaller temperature differences, however, reported a decrease in the maximum counting efficiency as the temperature difference becomes very small (Hermann and Wiedensohler, 2001; Mei et al., 2021).
4.5 Combined Dependencies and Comparison to Butanol
Figure 14 shows the combined dependencies of the averaged D50 cutoff diameters for both CPCs based on repeated measurements. The CPC operated with butanol exhibits only minor variations in D50 across all temperature settings and pressures, with an average value of . This result agrees well with the value of reported by Weber et al. (2023b), measured under identical conditions for both butanol and DMSO.
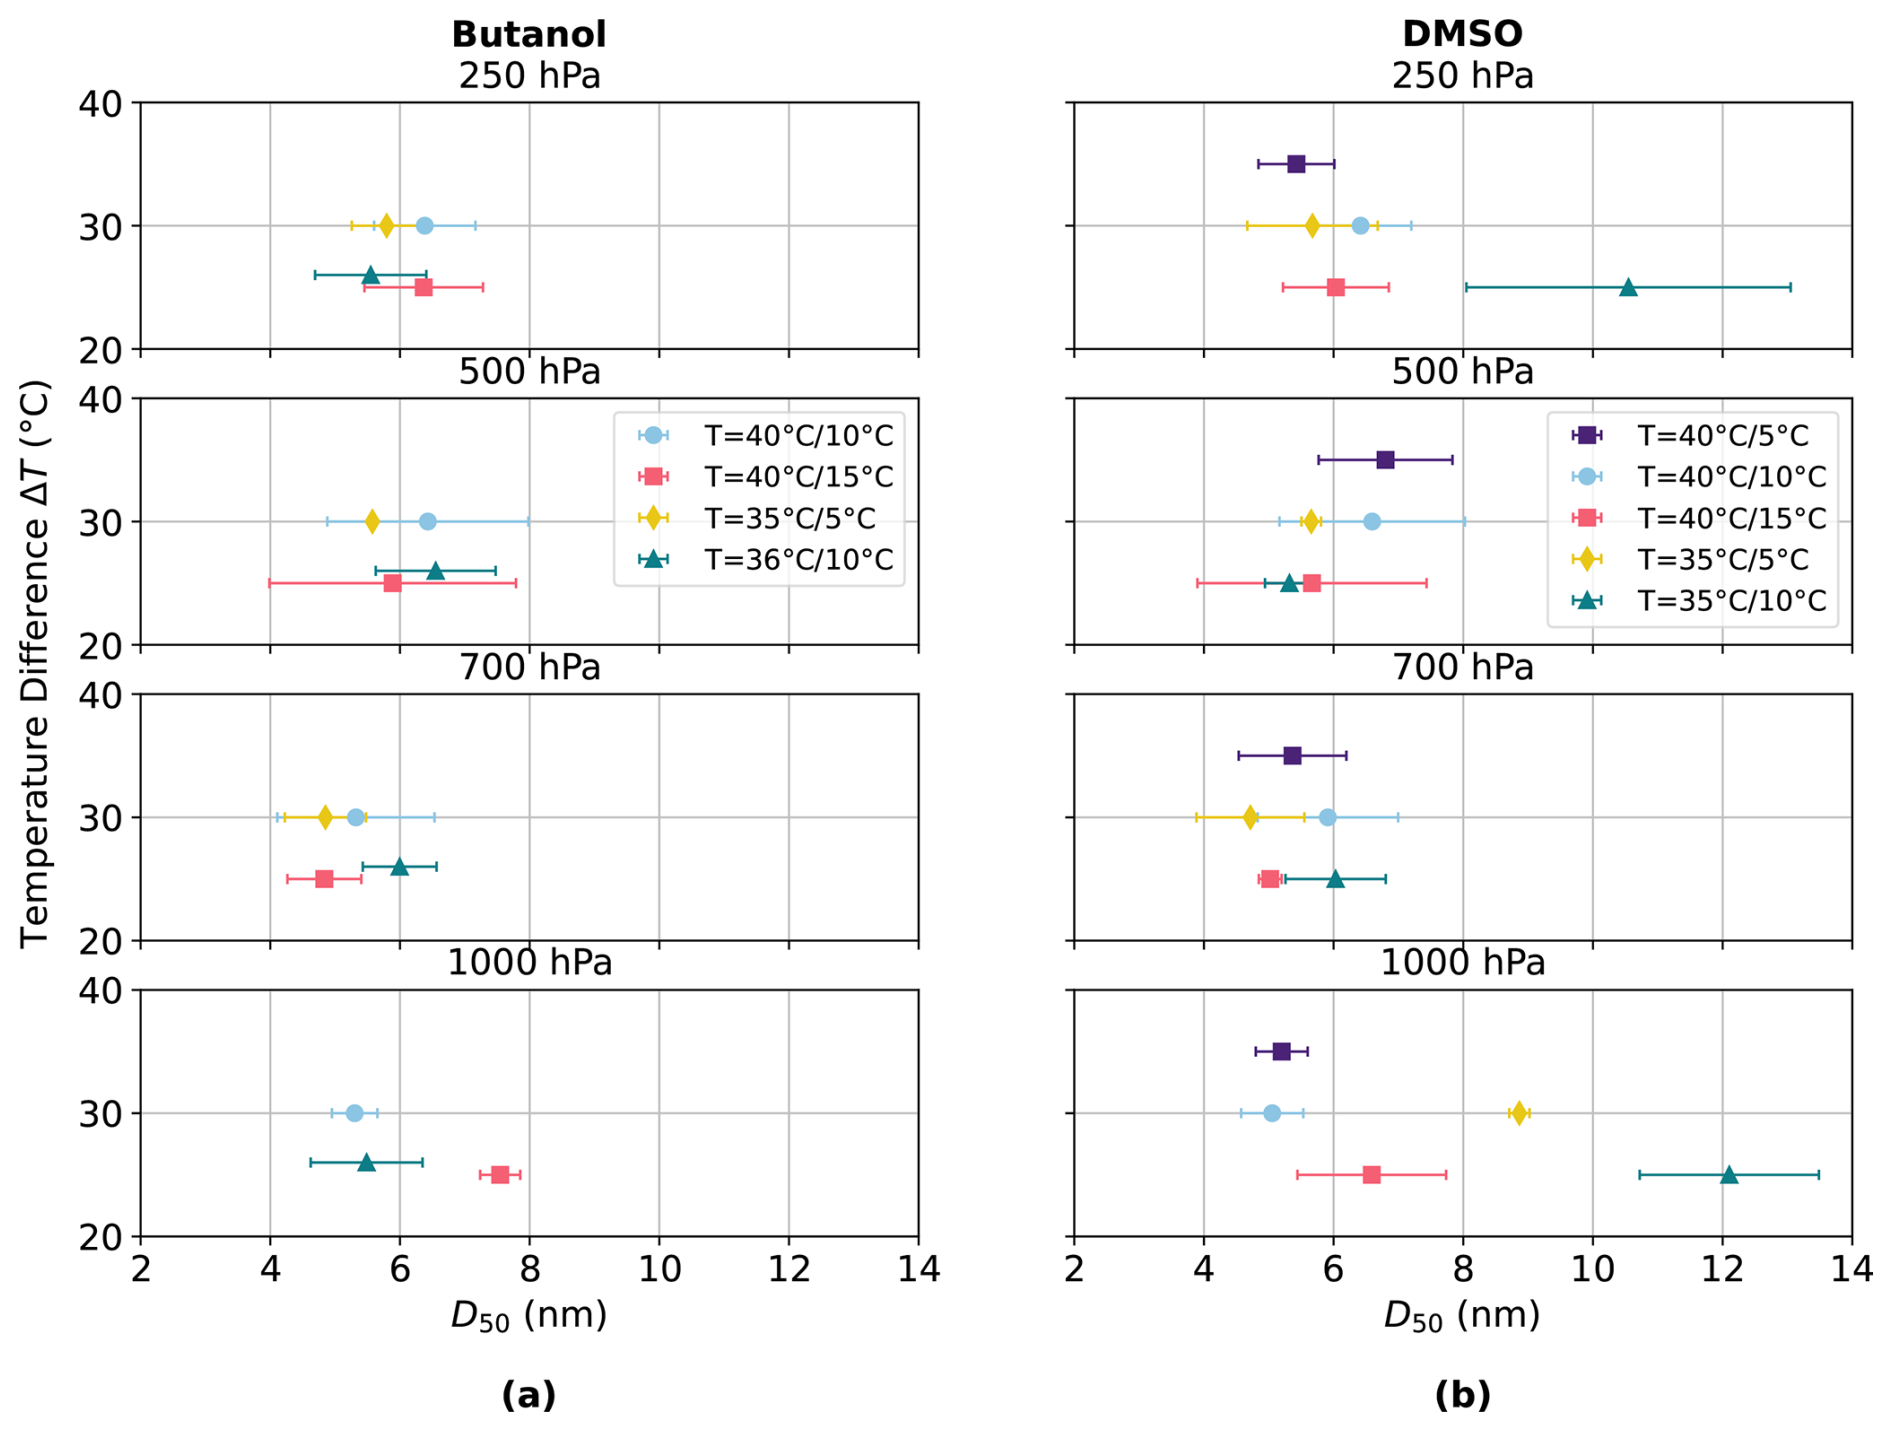
Figure 14Comparison of D50 cutoff diameters at four pressures and five temperatures for (a) the B-CPC and (b) the DMSO-CPC. Data points represent the mean of multiple measurements, with error bars showing the standard deviation. For the B-CPC, . Considering only optimal temperature settings, the DMSO-CPC yields .
In contrast, the CPC operated with DMSO shows larger variations in D50 with changing temperature differences and pressures. Compared to the findings of Weber et al. (2023b), our measurements indicate a higher variability, with across all conditions. The temperature setting of Tsat=35 °C and Tcon=10 °C, in particular, results in notably larger cutoff diameters. This can be explained by the corresponding ratios, which fall below 0.1 under these conditions, indicating insufficient particle growth. When considering only temperature settings with , the mean value reduces to , which is consistent with the result obtained using the B-CPC.
The highest temperature difference of ΔT=35 °C could not be applied to the B-CPC, as homogeneous nucleation of butanol was observed under this condition. Figure 15 shows the uncorrected counts of both CPCs and the FCE. In this measurement, both CPCs were operated at Tsat=40 °C and Tcon=5 °C. For smaller particle diameters, the number concentration recorded by the B-CPC does not decrease to zero, indicating the occurrence of homogeneous nucleation of butanol. This observation is consistent with the findings of Mordas et al. (2007), who reported homogeneous nucleation in a different model CPC at ΔT=39 °C.
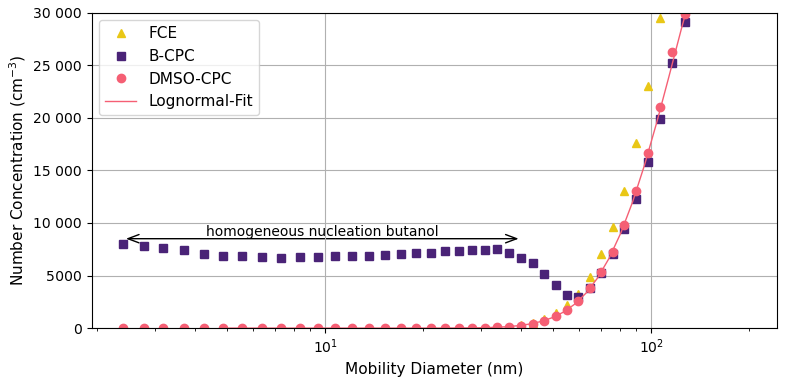
Figure 15Uncorrected particle number concentrations measured by the B-CPC, DMSO-CPC, and FCE at Tsat=40 °C and Tcon=5 °C. For small particle diameters, the B-CPC records non-zero concentrations due to homogeneous nucleation of butanol, whereas the DMSO-CPC and FCE remains unaffected.
At this point, it should be emphasized that the DMSO-CPC is capable of achieving results comparable to those of the B-CPC under appropriate conditions, where the c0 adjustment is justified. Further adaptations and optimisation steps aimed at improving the performance of the DMSO-CPC are discussed in Sect. 4.9.
4.6 Consumption and Ambient Air Measurements during Long-Term Deployment
Long-term experiments were conducted to quantify the consumption of the working fluid. The B-CPC was operated at temperatures of Tsat=36 °C and Tcon=10 °C, as intended by the manufacturer. The DMSO-CPC was operated at temperatures of Tsat=40 °C and Tcon=5 °C, were it was found to perform best. The CPC was completely dry at the beginning of the experiment and a well known amount of working fluid was filled in the supply bottle. The CPC was considered to be dry again as soon as the liquid level warning was displayed even though the CPC was still operating for several hours after the initial warning. The consumption of DMSO was calculated to be in the range of 2–3 mL d−1, whereas that of butanol was determined to be 96 mL d−1.
Furthermore, ambient air measurements were conducted over several days. It was observed that the DMSO-CPC did not exhibit any complications and functioned in a stable manner. Moreover, throughout the duration of the present study, the CPC operated with DMSO was utilised for a period of several months, encompassing all experiments conducted.
4.7 DMSO-H2O Mixture
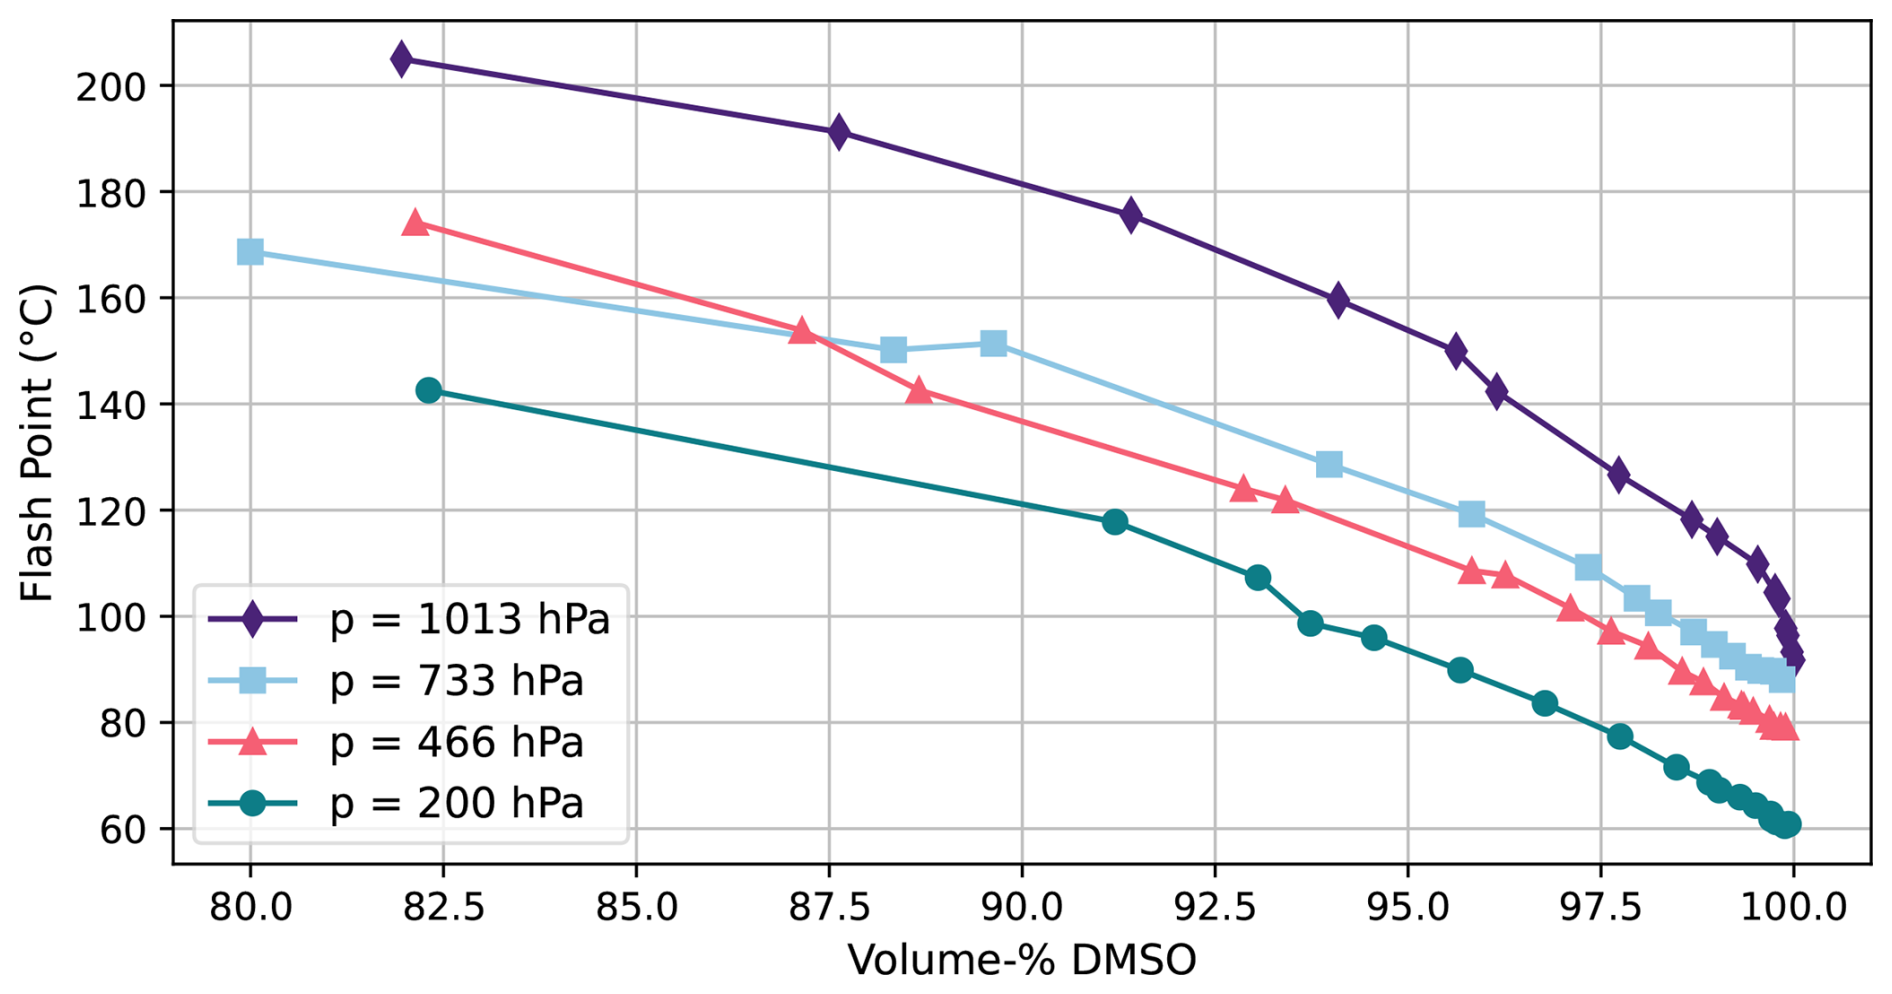
DMSO is soluble in water. The usage of a mixture of DMSO and water as working fluid brings two important advantages. First, the freezing point of DMSO of +18 °C can be adjusted to less than −100 °C by adding defined amounts of water (Havemeyer, 1966). Second, defined amounts of water also increase the flash point of DMSO from 98 °C to temperatures above 140 °C, as can be seen in Fig. B2 in the Appendix. It depicts the pressure-dependent flash points calculated according to Astbury et al. (2004), using the experimental mole fraction data for DMSO and H2O reported by Nishimura et al. (1972). Consequently, employing a DMSO–H2O mixture as the working fluid enables CPC operation under extreme conditions, such as low pressures encountered during aircraft measurements or low temperatures in polar environments.
Furthermore, as the CPC measures ambient air, water is always present in the system. This lowers the effective freezing point of DMSO, such that operation at condenser temperatures below 18 °C is not expected to result in freezing or ice buildup on the condenser walls, even during extended operation. This is supported by our observations, as continuous liquid drainage was observed in the DMSO-CPC throughout operation.
Figure 16 shows the results of an ambient air measurement at the campus of Forschungszentrum Jülich (Germany), which is located within a forest area. During this measurement the CPC was operated with a mixture of 90 % DMSO and 10 % water. To test the performance and duration of operation of the DMSO–H2O–CPC, there was no automatic refilling. Panel (a) shows the ratio over time. Panel (b) depicts the number concentration measured by both CPCs, where the DMSO-H2O data is adjusted to the c0 threshold (see Sect. 4.1). The results show a decreasing -ratio over time, indicating that the wick inside the CPC becomes drier and the saturation for particle activation decreases. Nevertheless, the c0 number concentration of the DMSO–H2O–CPC is in good agreement with the B-CPC, which was operated as intended by the manufacturer. This experiment demonstrates that the DMSO–H2O–CPC can operate accurately for at least 72 h without requiring maintenance. Nevertheless, the option of automatic refilling further enhances its suitability, making the DMSO–H2O–CPC ideal for deployment at remote measurement stations in challenging environments. Panel (c) depicts the correlation between the B-CPC and the DMSO–H2O–CPC during this ambient air experiment. The slope of the linear correlation is 1.0046±0.0001 (R2>0.99, number of data points n=253 769), indicating that the measurements made using DMSO-H2O as working fluid are not distinguishable from the measurements performed with butanol.
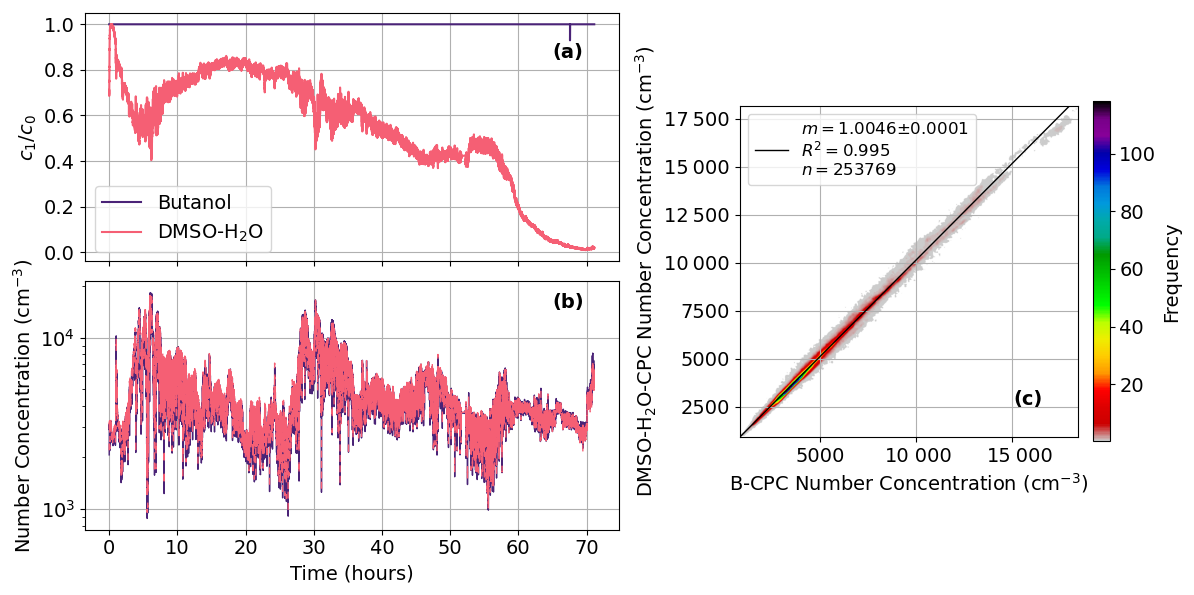
Figure 16Ambient air measurements comparing the B-CPC and the DMSO–H2O–CPC. Panel (a) shows the measured values for both instruments. Panel (b) presents the corresponding number concentrations over time. Panel (c) illustrates the correlation between the two CPCs, with the color scale indicating the frequency of occurrence data points within the 2σ uncertainty. The DMSO–H2O–CPC results are statistically indistinguishable from those of the B-CPC.
4.8 Aerosol Chemical Composition Dependence
In order to investigate the dependence of the CPCs on the chemical composition of the aerosol, we conducted systematic measurements using three types of aerosol particles: sodium chloride (NaCl), ammonium sulfate ((NH4)2SO4; AS), and soot. These seed types represent a range of hygroscopic properties and atmospheric relevance. The soot particles were generated using an inverted flame soot generator (see Sect. 2.1.1), producing a size distribution with a CMD around 140 nm. Due to this relatively large CMD, we are primarily sensitive to the left-hand side of the distribution, limiting the observable size range for these particles in the CPC, which could lead to a greater uncertainty of the resulting D50 cutoff diameters for soot particles.
Measurements were performed at two pressures, 1000 and 700 hPa. For each pressure level, the CPC was operated at three different temperature settings, corresponding to a range of temperature differences between the saturator and condenser from 35−25 °C. This range allows to systematically probe the influence of supersaturation on particle activation and detection efficiency. The resulting data provide insight into how the CPC responds to particles of varying composition and size under different environmental and operational conditions. The resulting D50 cutoff diameters are listed in Table 3 for both CPCs.
Table 3Experimentally determined D50 cutoff diameters (nm) for sodium chloride (NaCl), ammonium sulfate (AS), and soot particles at 1000 and 700 hPa, measured at three internal temperature settings (Tsat/Tcon) for both the B-CPC and DMSO-CPC.
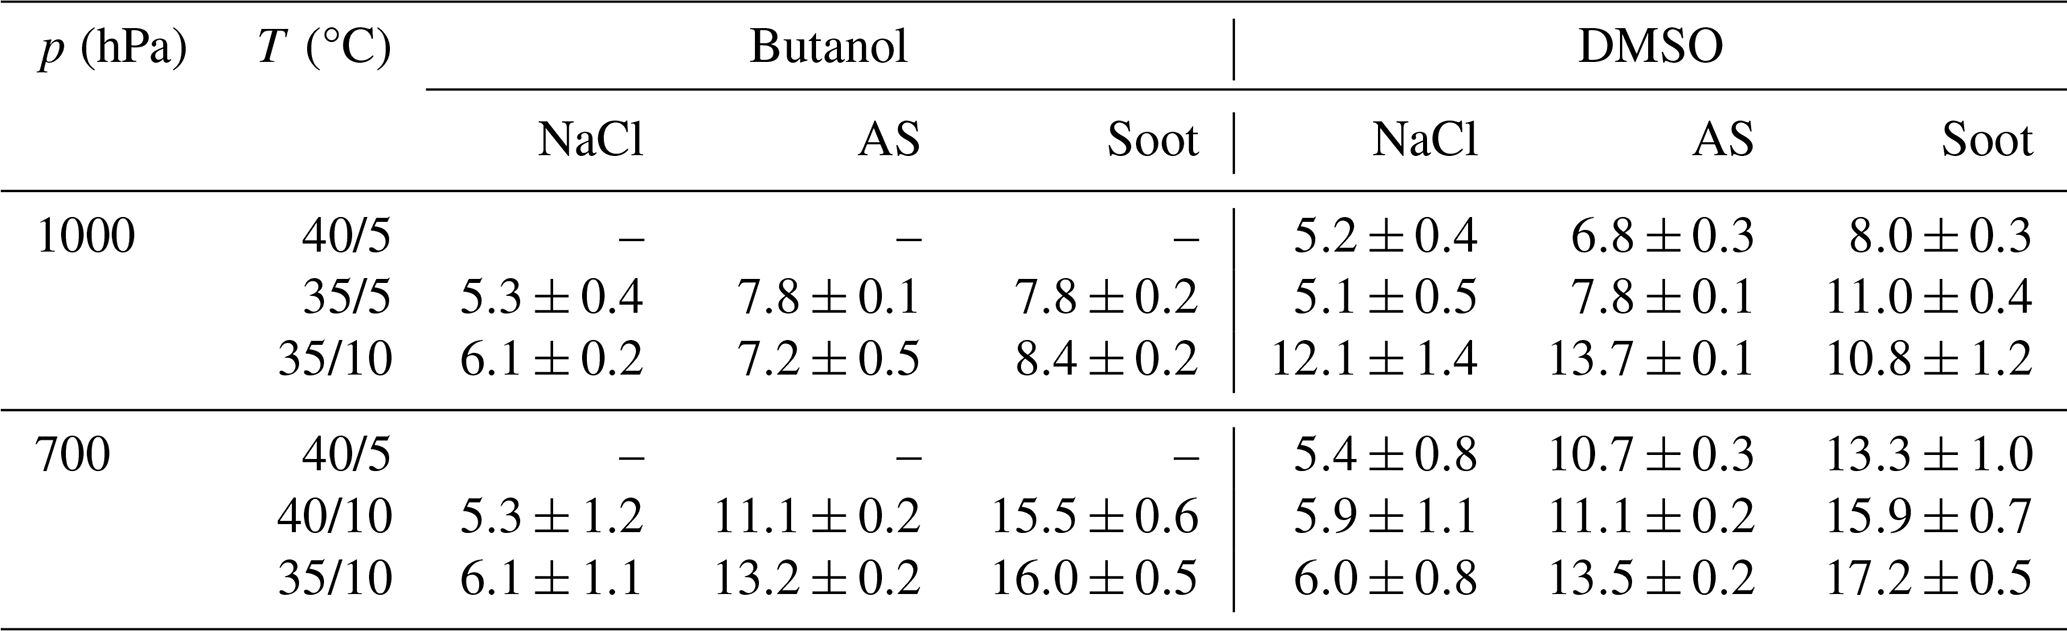
It is evident from the data presented that there is no significant difference in the D50 cutoff diameter between the B-CPC and the DMSO-CPC at 700 hPa. At ambient pressures of approximately 1000 hPa the performance of the DMSO-CPC is highly depending on the temperature difference between saturator and condenser. While the cutoff diameters from the DMSO-CPC for ΔT=35 °C and ΔT=30 °C are comparable to the ones from the B-CPC, the D50 diameters at ΔT=25 °C are shifted towards larger diameters for the DMSO-CPC. The only exception is soot, where also at ΔT=30 °C a larger D50 is observed with the DMSO-CPC. Overall, however, and particularly at the highest temperature difference, the results obtained using the CPC with DMSO are comparable to those obtained using the B-CPC. This indicates that both working fluids exhibit a similar dependence on the chemical composition of the aerosol if operated under reasonable temperature settings.
4.9 Considerations to Counterbalance Small Particle Growth
To improve the indicative droplet growth ratios under identical conditions and thus reduce the signal-to-noise ratio, the laser power for particle detection was increased. While the standard laser current of the Sky-CPC 5411 in the tested unit is approximately 24 mA, a maximum current of 28 mA was examined. At ambient pressure, this adjustment resulted in a fully stable ratio and improved linearity with respect to the reference instrument, up to concentrations of 8×10⁴ particles cm−3. Furthermore, reducing the flow rate from the manufacturer-specified 0.6 to 0.3 L min−1 enhanced linearity even further, enabling measurements exceeding 105 particles cm−3. This indicates that the lower flow rate allows sufficient time for particle growth.
In Sect. 4.1, the lowest ratios were observed at Tsat=35 °C and Tcon=10 °C at 250 hPa, as shown in Fig. 17a. This panel displays ratios as a function of total aerosol surface area concentration. Panel (b) shows results obtained under identical conditions but with increased laser power. The ratios rise dramatically – by nearly two orders of magnitude – yielding an average D50 cutoff diameter of (7.9±0.2) nm. In comparison, the lower laser power resulted in , nearly twice as large. This finding supports the hypothesis discussed in Sect. 4.5 that low ratios lead to unrepresentative D50 values with increased uncertainty.
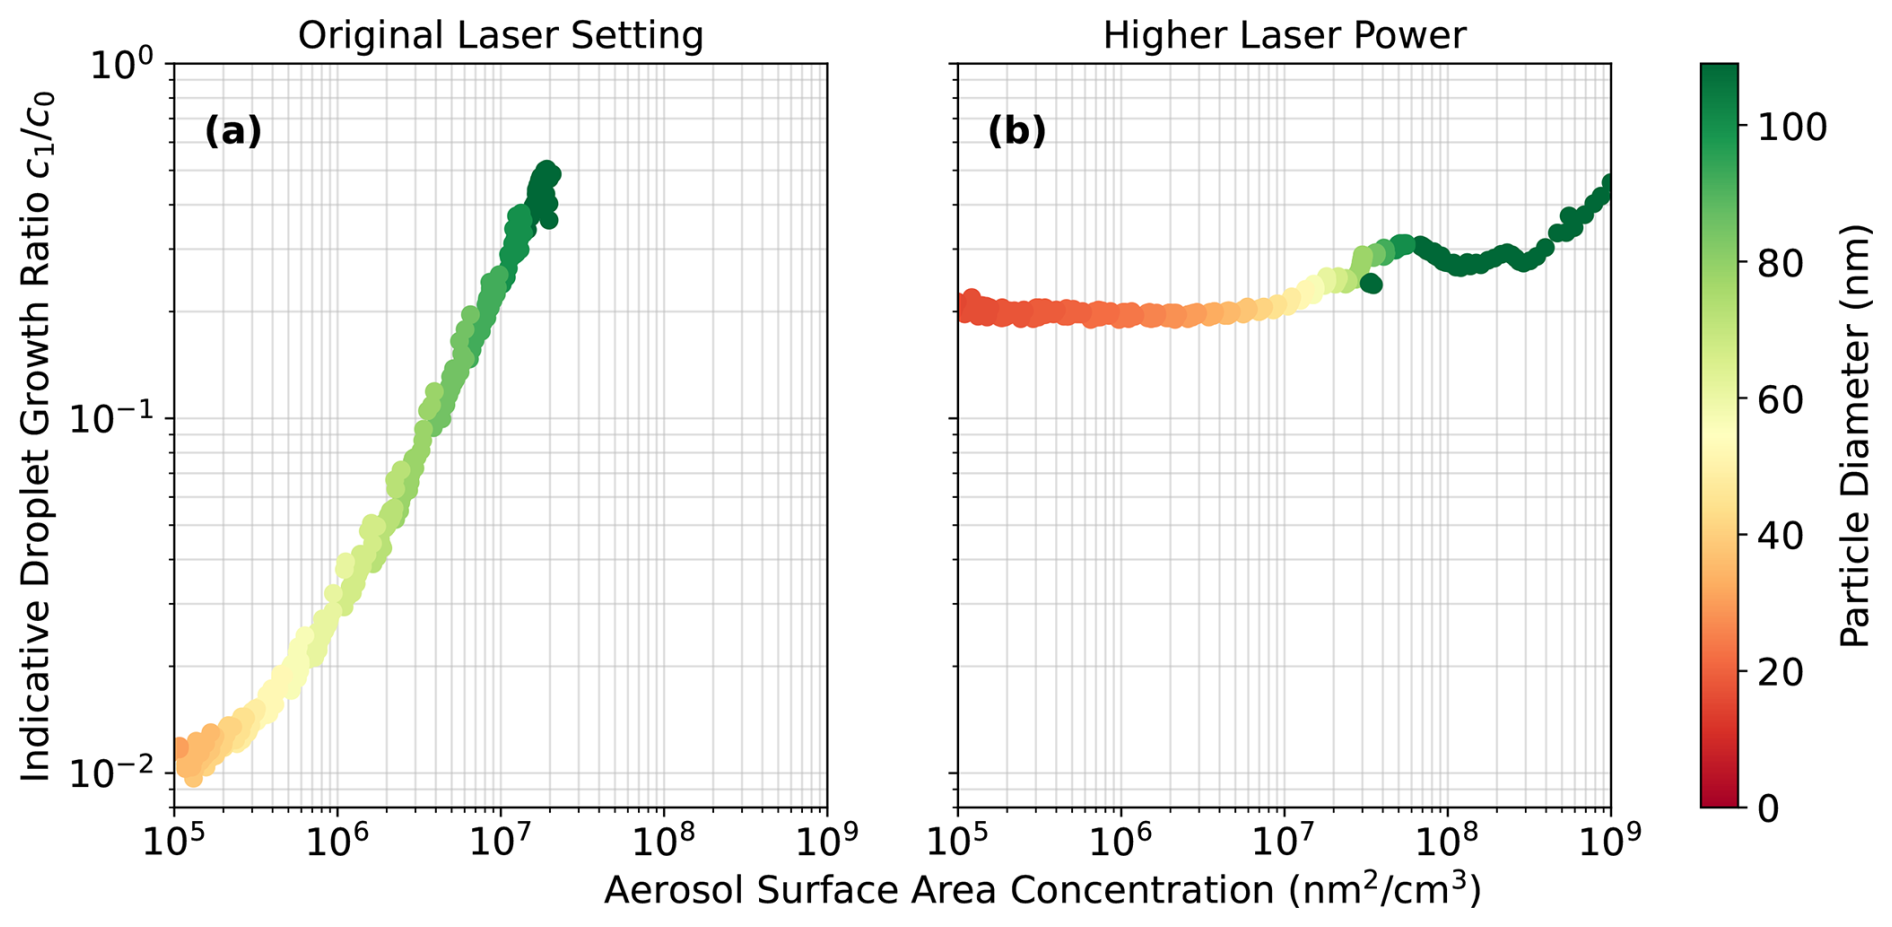
Figure 17Indicative droplet growth ratios of the DMSO-CPC at Tsat=35 °C and Tcon=10 °C at 250 hPa as a function of total aerosol surface area concentration. Panel (a): Measurement with standard laser power. Panel (b): Same conditions with increased laser power, showing a nearly one-order-of-magnitude rise in .
This study presents a comprehensive laboratory and field-based evaluation of dimethyl sulfoxide (DMSO) as a non-flammable working fluid for the Sky-CPC 5411 (GRIMM Aerosol Technik), directly compared with a butanol-operated counterpart across a wide range of operational pressures, temperature settings, and aerosol types. To enable the use of the instrument’s automatic refilling process, the automatic refilling valve was modified. These modifications were straightforward to implement and ensured reliable refilling over a period of six months of intermittent operation.
This study demonstrates that droplet growth in the DMSO-CPC strongly depends on the saturator temperature Tsat and the temperature difference between saturator and condenser ΔT. Optimal growth, indicated by ratios near unity, occurs at high Tsat and large ΔT, while lower temperatures or smaller differences reduce growth, particularly at 1000 hPa and 250 hPa. Portable Optical Particle Counter (POPS) measurements confirmed that increasing ΔT enhances droplet sizes. Simulations of the saturation inside the condenser reproduced the pressure- and temperature-dependent trends, showing that both the position and magnitude of the maximum saturation ratio Smax determine the activation of the smallest particles. Overall, the results highlight the importance of CPC internal settings for reliable particle activation and provide guidance for optimising DMSO-CPC operation under varying environmental conditions.
The DMSO-CPC achieved counting efficiencies and cutoff diameters comparable to those of the Butanol-CPC, with an overall average of compared to . While the Butanol-CPC demonstrated stable performance across all pressures and temperature settings, the DMSO-CPC exhibited a stronger sensitivity to internal temperatures, with smaller temperature differences leading to larger D50 cutoffs. The asymptotic maximum counting efficiency showed only a minor pressure dependence, decreasing by about 14 % between 1000 and 250 hPa.
Furthermore, the use of DMSO substantially reduced working fluid consumption (2–3 mL d−1 compared to 96 mL d−1 for butanol), and long-term ambient air measurements confirmed stable and reliable operation over several months. Experiments with a DMSO–H2O mixture further extended the operational range of the CPC by lowering the freezing point and improving safety margins, making the DMSO–H2O-CPC particularly suitable for airborne applications and remote monitoring stations under challenging environmental conditions.
Although limited droplet growth under certain settings introduced uncertainty in cutoff diameter determination, adjustments such as increased laser power and reduced flow rate effectively shifted the D50 to lower values.
Overall, the results demonstrate close agreement between the butanol- and DMSO-based CPC measurements. We conclude, employing DMSO or DMSO–H2O mixtures as working fluids enables safe, efficient, and regulation-compliant CPC operation without compromising measurement quality, even under low-pressure or low-temperature conditions and in remote environments.
Based on the findings presented in this study, the following recommendations are provided to support the successful and safe implementation of dimethyl sulfoxide (DMSO) as a working fluid in Condensation Particle Counters (CPCs), particularly the GRIMM Sky-CPC 5411 model.
Instrument Preparation and Modifications
-
Automatic Refilling System: The refilling valve must be adapted to ensure reliable operation with DMSO. The modification includes a replacement of the rubber O-ring with a silicon O-ring and the trimming of the rubber part of the stamp. Those steps are straightforward and essential for long-term stability.
-
Material Compatibility: Prior to operation, all tubing, seals, and fluid-contact components should be verified for chemical compatibility with DMSO. Rubber materials should be avoided.
Operational Conditions
-
Temperature Settings: The performance of the DMSO-CPC is more sensitive to the condenser–saturator temperature difference (ΔT) than a Butanol-CPC. A high ΔT of 35 °C (Tsat=40 °C and Tcon=5 °C) is recommended to ensure sufficient particle activation and stable counting efficiency.
-
Flow Rate Optimization: Reduced sample flow rates, down to 0.3 L min−1, can be applied to compensate for insufficient activation.
-
Laser Power Tuning: An increased laser power can be applied to reduce the D50 cutoff diameter without compromising the lifetime of the laser itself.
Working Fluid Handling
-
Pure DMSO Operation: For standard laboratory use, pure DMSO offers stable performance with low fluid consumption and minimal maintenance requirements.
-
DMSO–H2O Mixtures: For field or airborne applications, mixtures with up to 10 % water are recommended to lower the freezing point and enhance the flash point.
Hardware Adjustments
Based on our findings, we propose two possible modifications at the CPCs hardware in order to further optimise the performance of the CPC operated with DMSO .
-
Threshold Adjustment: The voltage thresholds Uth(c1) and Uth(c0) embedded in the instruments hardware would need to be adapted for DMSO to account for its lower vapor pressure.
-
Automated Refilling: The automatic wetting of the wick within the saturator should be optimised. It is hypothesised that a change of the liquid sensor or an adjustment in its settings would enhance the particle growth.
The analysis scripts used in this study relied exclusively on standard Python libraries.
The data used in this study are available from the first author upon request.
The Python scripts used for data analysis and visualization are available from the first author upon request.
PW and SK conceived of the study. SK performed all experiments and data analysis. PW, UB and OFB set up the instruments. UB and PW designed the LabVIEW™ environment of the experimental set-up. VMF, HK and AB performed the numerical simulations. GS, CK and LK contributed to the tuning of the CPC. SK wrote the manuscript with assistance of all co-authors.
GS, CK, and LK are employed full-time by GRIMM Aerosol Technik GmbH, which may hold direct or indirect financial interests related to the work presented in this paper.
Publisher's note: Copernicus Publications remains neutral with regard to jurisdictional claims made in the text, published maps, institutional affiliations, or any other geographical representation in this paper. The authors bear the ultimate responsibility for providing appropriate place names. Views expressed in the text are those of the authors and do not necessarily reflect the views of the publisher.
Financial support by both the HITEC Graduate School (SK) and the Innovation Fund at Forschungszentrum Jülich (PW) is gratefully acknowledged.
The article processing charges for this open-access publication were covered by the Forschungszentrum Jülich.
This paper was edited by Hang Su and reviewed by Christof Asbach and S. V. Hering.
Aalto, P., Hämeri, K., Paatero, P., Kulmala, M., Bellander, T., Berglind, N., Bouso, L., Castaño-Vinyals, G., Sunyer, J., Cattani, G., Marconi, A., Cyrys, J., von Klot, S., Peters, A., Zetzsche, K., Lanki, T., Pekkanen, J., Nyberg, F., Sjövall, B., and Forastiere, F.: Aerosol Particle Number Concentration Measurements in Five European Cities Using TSI-3022 Condensation Particle Counter over a Three-Year Period during Health Effects of Air Pollution on Susceptible Subpopulations, J. Air Waste Manage., 55, 1064–1076, https://doi.org/10.1080/10473289.2005.10464702, 2005. a
Alam, A., Shi, J. P., and Harrison, R. M.: Observations of new particle formation in urban air, J. Geophys. Res.-Atmos., 108, https://doi.org/10.1029/2001JD001417, 2003. a
Astbury, G. R., Bugand-Bugandet, J., Grollet, E., and Stell, K. M.: Flash points of aqueous solutions of flammable solvents, Institution of Chemical Engineers, Symposium Series, 150, https://api.semanticscholar.org/ (last access: 4 June 2026), 2004. a
Balendra, S., Kale, A., Pongetti, J., Kazemimanesh, M., Haugen, M., Weller, L., and Boies, A.: Condensation particle counters: Exploring the limits of miniaturisation, J. Aerosol Sci., 175, 106266, https://doi.org/10.1016/j.jaerosci.2023.106266, 2024. a
Bauer, P. S., Spät, D., Eisenhut, M., Gattringer, A., and Weinzierl, B.: Pressure-dependent performance of two CEN-specified condensation particle counters, Atmos. Meas. Tech., 16, 4445–4460, https://doi.org/10.5194/amt-16-4445-2023, 2023. a, b, c, d
Bezantakos, S. and Biskos, G.: Temperature and pressure effects on the performance of the portable TSI 3007 condensation particle counter: Implications on ground and aerial observations, J. Aerosol Sci., 159, 105877, https://doi.org/10.1016/j.jaerosci.2021.105877, 2022. a, b, c
Bischof, O. F.: Application-specific calibration of condensation particle counters under low pressure conditions: = Anwendungsspezifische Kalibrierung von Kondensationspartikelzählern unter Niederdruckbedingungen, in: Schriften des Forschungszentrums Jülich Reihe Energie und Umwelt, Bd./vol. 579, energy and environment, Forschungszentrum Jülich GmbH, Zentralbibliothek, Verlag, Aachen, ISBN 978-3-95806-629-8, 2022. a, b, c, d, e, f
Brock, C. A., Schröder, F., Kärcher, B., Petzold, A., Busen, R., and Fiebig, M.: Ultrafine particle size distributions measured in aircraft exhaust plumes, J. Geophys. Res., 105, 26555–26568, https://doi.org/10.1029/2000JD900360, 2000. a
Bundke, U., Berg, M., Houben, N., Ibrahim, A., Fiebig, M., Tettich, F., Klaus, C., Franke, H., and Petzold, A.: The IAGOS-CORE aerosol package: instrument design, operation and performance for continuous measurement aboard in-service aircraft, Tellus B, 67, 28339, https://doi.org/10.3402/tellusb.v67.28339, 2015. a, b, c, d, e, f, g, h, i, j
Cozic, J., Verheggen, B., Mertes, S., Connolly, P., Bower, K., Petzold, A., Baltensperger, U., and Weingartner, E.: Scavenging of black carbon in mixed phase clouds at the high alpine site Jungfraujoch, Atmos. Chem. Phys., 7, 1797–1807, https://doi.org/10.5194/acp-7-1797-2007, 2007 a
Gao, R. S., Telg, H., McLaughlin, R. J., Ciciora, S. J., Watts, L. A., Richardson, M. S., Schwarz, J. P., Perring, A. E., Thornberry, T. D., Rollins, A. W., Markovic, M. Z., Bates, T. S., Johnson, J. E., and Fahey, D. W.: A light-weight, high-sensitivity particle spectrometer for PM2.5 aerosol measurements, Aerosol Sci. Tech., 50, 88–99, 2016. a
Hao, W., Stolzenburg, M., Attoui, M., Zhang, J., and Wang, Y.: Optimizing the activation efficiency of sub-3 nm particles in a laminar flow condensation particle counter: Model simulation, J. Aerosol Sci., 158, 105841, https://doi.org/10.1016/j.jaerosci.2021.105841, 2021. a
Havemeyer, R. N.: Freezing Point Curve of Dimethyl Sulfoxide–Water Solutions, J. Pharm. Sci., 55, 851–853, https://doi.org/10.1002/jps.2600550822, 1966. a
Hering, S. V., Spielman, S. R., and Lewis, G. S.: Moderated, Water-Based, Condensational Particle Growth in a Laminar Flow, Aerosol Sci. Tech., 48, 401–408, https://doi.org/10.1080/02786826.2014.881460, 2014. a
Hermann, M. and Wiedensohler, A.: Counting effciency of condensation particle counters at low-pressures with illustrative data from the upper troposphere, J. Aerosol Sci., 32, 975–991, 2001. a, b, c, d, e, f, g
Hermann, M., Adler, S., Caldow, R., Stratmann, F., and Wiedensohler, A.: Pressure-dependent efficiency of a condensation particle counter operated with FC-43 as working fluid, J. Aerosol Sci., 36, 1322–1337, https://doi.org/10.1016/j.jaerosci.2005.03.002, 2005. a, b, c, d, e
Hong, A. C., Young, C. J., Hurley, M. D., Wallington, T. J., and Mabury, S. A.: Perfluorotributylamine: A novel long-lived greenhouse gas, Geophys. Res. Lett., 40, 6010–6015, https://doi.org/10.1002/2013GL058010, 2013. a
IPCC: Climate Change 2021: The Physical Science Basis, Contribution of Working Group I to the Sixth Assessment Report of the Intergovernmental Panel on Climate Change, Cambridge University Press, Cambridge, United Kingdom, and New York, NY, USA, https://doi.org/10.1017/9781009157896, 2021. a, b
Jarrett, D. G. and Owen, M. C.: Traceability for Aerosol Electrometer in the fA Range, Instrumentation Viewpoint, 14, 17, https://doi.org/10.5821/iwp.2013.14.15417, 2013. a
Jurányi, Z., Gysel, M., Weingartner, E., DeCarlo, P. F., Kammermann, L., and Baltensperger, U.: Measured and modelled cloud condensation nuclei number concentration at the high alpine site Jungfraujoch, Atmos. Chem. Phys., 10, 7891–7906, https://doi.org/10.5194/acp-10-7891-2010, 2010. a
Kahn, R. A., Andrews, E., Brock, C. A., Chin, M., Feingold, G., Gettelman, A., Levy, R. C., Murphy, D. M., Nenes, A., Pierce, J. R., Popp, T., Redemann, J., Sayer, A. M., Da Silva, A. M., Sogacheva, L., and Stier, P.: Reducing Aerosol Forcing Uncertainty by Combining Models With Satellite and Within-The-Atmosphere Observations: A Three-Way Street, Rev. Geophys., 61, e2022RG000796, https://doi.org/10.1029/2022RG000796, 2023. a
Kim, W. Y., Lee, S. G., Lee, H., and Ahn, K.-H.: Investigation of Vertical Profiles of Particulate Matter and Meteorological Variables up to 2.5 km in Altitude Using a Drone-Based Monitoring System, Atmosphere, 16, 93, https://doi.org/10.3390/atmos16010093, 2025. a
Krasa, H., Fruhmann, V. M., Schurl, S., Kupper, M., and Bergmann, A.: Condensation diffusion charging – particle number measurement of high concentrations down to 3 nm, Aerosol Research, 3, 521–534, https://doi.org/10.5194/ar-3-521-2025, 2025. a, b
Kulkarni, P., Baron, P. A., and Willeke, K.: Aerosol Measurement: Principles, Techniques, and Applications, 3rd edn., John Wiley & Sons Ltd., ISBN 978-0-470-38741-2, 2011. a
Laj, P., Lund Myhre, C., Riffault, V., Amiridis, V., Fuchs, H., Eleftheriadis, K., Petäjä, T., Salameh, T., Kivekäs, N., Juurola, E., Saponaro, G., Philippin, S., Cornacchia, C., Alados Arboledas, L., Baars, H., Claude, A., De Mazière, M., Dils, B., Dufresne, M., Evangeliou, N., Favez, O., Fiebig, M., Haeffelin, M., Herrmann, H., Höhler, K., Illmann, N., Kreuter, A., Ludewig, E., Marinou, E., Möhler, O., Mona, L., Eder Murberg, L., Nicolae, D., Novelli, A., O’Connor, E., Ohneiser, K., Petracca Altieri, R. M., Picquet-Varrault, B., Van Pinxteren, D., Pospichal, B., Putaud, J.-P., Reimann, S., Siomos, N., Stachlewska, I., Tillmann, R., Voudouri, K. A., Wandinger, U., Wiedensohler, A., Apituley, A., Comerón, A., Gysel-Beer, M., Mihalopoulos, N., Nikolova, N., Pietruczuk, A., Sauvage, S., Sciare, J., Skov, H., Svendby, T., Swietlicki, E., Tonev, D., Vaughan, G., Zdimal, V., Baltensperger, U., Doussin, J.-F., Kulmala, M., Pappalardo, G., Sorvari Sundet, S., and Vana, M.: Aerosol, Clouds and Trace Gases Research Infrastructure (ACTRIS): The European Research Infrastructure Supporting Atmospheric Science, B. Am. Meteorol. Soc., 105, E1098–E1136, https://doi.org/10.1175/BAMS-D-23-0064.1, 2024. a
Lee, L. A., Reddington, C. L., and Carslaw, K. S.: On the relationship between aerosol model uncertainty and radiative forcing uncertainty, P. Natl. Acad. Sci. USA, 113, 5820–5827, https://doi.org/10.1073/pnas.1507050113, 2016. a
Lewis, G. S. and Hering, S. V.: Minimizing Concentration Effects in Water-Based, Laminar-Flow Condensation Particle Counters, Aerosol Sci. Tech., 47, 645–654, https://doi.org/10.1080/02786826.2013.779629, 2013. a, b, c
Mamakos, A., Giechaskiel, B., and Drossinos, Y.: Experimental and Theoretical Investigations of the Effect of the Calibration Aerosol Material on the Counting Efficiencies of TSI 3790 Condensation Particle Counters, Aerosol Sci. Tech., 47, 11–21, https://doi.org/10.1080/02786826.2012.716174, 2013. a
Maring, H. and Schwartze, G.: A condensation particle counter for long-term continuous use in the remote marine environment, Atmos. Environ., 28, 3293–3298, 1994. a
McNeill, V. F.: Atmospheric Aerosols: Clouds, Chemistry, and Climate, Annu. Rev. Chem. Biomol., 8, 427–444, https://doi.org/10.1146/annurev-chembioeng-060816-101538, 2017. a
Mei, F., Spielman, S., Hering, S., Wang, J., Pekour, M. S., Lewis, G., Schmid, B., Tomlinson, J., and Havlicek, M.: Simulation-aided characterization of a versatile water-based condensation particle counter for atmospheric airborne research, Atmos. Meas. Tech., 14, 7329–7340, https://doi.org/10.5194/amt-14-7329-2021, 2021. a, b, c, d, e
Mordas, G., Sipilä, M., and Kulmala, M.: Nanoparticle Detection Using Nucleation Regime of the CPC, in: Nucleation and Atmospheric Aerosols, edited by: O'Dowd, C. D. and Wagner, P. E., Springer Netherlands, Dordrecht, 209–213, https://doi.org/10.1007/978-1-4020-6475-3_43, 2007. a
Nishimura, M., Nakayama, M., and Yano, T.: Vapor pressure of pure DMSO and vapor-liquid equilibria in DMSO−H2O system under isobaric conditions, J. Chem. Eng. Jpn., 5, 223–226, https://doi.org/10.1252/jcej.5.223, 1972. a
OJ EU, 2024/2881: ELI: http://data.europa.eu/eli/dir/2024/2881/oj (last access: 3 July 2026), 2024. a
Pandis, J. H. and Pandis, S. N.: Atmospheric Chemistry and Physics: From Air Pollution to Climate Change, 3rd edn., Wiley-VCH, New York, ISBN 978-1-118-94740-1, 2016. a
Petzold, A., Thouret, V., Gerbig, C., Zahn, A., Brenninkmeijer, C. A. M., Gallagher, M., Hermann, M., Pontaud, M., Ziereis, H., Boulanger, D., Marshall, J., Nédélec, P., Smit, H. G. J., Friess, U., Flaud, J.-M., Wahner, A., Cammas, J.-P., Volz-Thomas, A., and Team, I.: Global-scale atmosphere monitoring by in-service aircraft – current achievements and future prospects of the European Research Infrastructure IAGOS, Tellus B, 67, 28452, https://doi.org/10.3402/tellusb.v67.28452, 2015. a
Polyanskiy, M. N.: Refractiveindex.info database of optical constants, Scientific Data, 11, https://doi.org/10.1038/s41597-023-02898-2, 2024. a
Pöschl, U.: Atmospheric Aerosols: Composition, Transformation, Climate and Health Effects, Angew. Chem. Int. Edit., 44, 7520–7540, https://doi.org/10.1002/anie.200501122, 2005. a
Richter, S., Keber, T., Heinritzi, M., Beck, L., Merkel, L., Kirchhoff, S., Schrod, J., Weber, P., and Curtius, J.: Characterization and operation of a multi-channel Condensation Particle Counter (mc-CPC) for aircraft-based measurements, Atmos. Meas. Tech., 19, 1093–1116, https://doi.org/10.5194/amt-19-1093-2026, 2026. a
Thouret, V., Clark, H., Petzold, A., Nédélec, P., and Zahn, A.: IAGOS: Monitoring Atmospheric Composition for Air Quality and Climate by Passenger Aircraft, in: Handbook of Air Quality and Climate Change, edited by: Akimoto, H. and Tanimoto, H., Springer Nature Singapore, Singapore, 1–14, https://doi.org/10.1007/978-981-15-2527-8_57-1, 2022. a
Watson-Parris, D. and Smith, C. J.: Large uncertainty in future warming due to aerosol forcing, Nature Clim. Change, 12, 1111–1113, https://doi.org/10.1038/s41558-022-01516-0, 2022. a
Weber, P., Petzold, A., Bischof, O. F., Fischer, B., Berg, M., Freedman, A., Onasch, T. B., and Bundke, U.: Relative errors in derived multi-wavelength intensive aerosol optical properties using cavity attenuated phase shift single-scattering albedo monitors, a nephelometer, and tricolour absorption photometer measurements, Atmos. Meas. Tech., 15, 3279–3296, https://doi.org/10.5194/amt-15-3279-2022, 2022. a
Weber, P., Bischof, O. F., Fischer, B., Berg, M., Hering, S., Spielman, S., Lewis, G., Petzold, A., and Bundke, U.: Characterisation of a self-sustained, water-based condensation particle counter for aircraft cruising pressure level operation, Atmos. Meas. Tech., 16, 3505–3514, https://doi.org/10.5194/amt-16-3505-2023, 2023a. a, b
Weber, P., Bischof, O. F., Fischer, B., Berg, M., Schmitt, J., Steiner, G., Keck, L., Petzold, A., and Bundke, U.: A new working fluid for condensation particle counters for use in sensitive working environments, Aerosol Research, 1, 1–12, https://doi.org/10.5194/ar-1-1-2023, 2023b. a, b, c, d, e, f, g, h, i, j, k, l, m, n, o, p, q, r, s, t
Wendisch, M. and Brenguier, J.-L.: Airborne Measurements for Environmental Research, John Wiley & Sons Ltd., ISBN 978-3-527-40996-9, 2013. a
Wiedensohler, A., Wiesner, A., Weinhold, K., Birmili, W., Hermann, M., Merkel, M., Müller, T., Pfeifer, S., Schmidt, A., Tuch, T., Velarde, F., Quincey, P., Seeger, S., and Nowak, A.: Mobility particle size spectrometers: Calibration procedures and measurement uncertainties, Aerosol Sci. Tech., 52, 146–164, https://doi.org/10.1080/02786826.2017.1387229, 2018. a
Yaws, C. L.: Yaws’ handbook of thermodynamic and physical properties of chemical compounds: physical, thermodynamic and transport properties for 5000 organic chemical compounds, 1st edn., Knovel, ISBN 1591244447, 2003. a
Zhang, Z. and Liu, B. Y. H.: Performance of TSI 3760 Condensation Nuclei Counter at Reduced Pressures and Flow Rates, Aerosol Sci. Tech., 15, 228–238, https://doi.org/10.1080/02786829108959530, 1991. a, b
Zhang, Z. Q. and Liu, B. Y. H.: Dependence of the Performance of TSI 3020 Condensation Nucleus Counter on Pressure, Flow Rate, and Temperature, Aerosol Sci. Tech., 13, 493–504, https://doi.org/10.1080/02786829008959464, 1990. a
- Abstract
- Introduction
- Methods
- Data Analysis Procedure
- Results and Discussion
- Conclusions
- Appendix A: Recommendations
- Appendix B: Figures
- Code availability
- Data availability
- Code and data availability
- Author contributions
- Competing interests
- Disclaimer
- Acknowledgements
- Financial support
- Review statement
- References
- Abstract
- Introduction
- Methods
- Data Analysis Procedure
- Results and Discussion
- Conclusions
- Appendix A: Recommendations
- Appendix B: Figures
- Code availability
- Data availability
- Code and data availability
- Author contributions
- Competing interests
- Disclaimer
- Acknowledgements
- Financial support
- Review statement
- References