
the Creative Commons Attribution 4.0 License.
the Creative Commons Attribution 4.0 License.
 | 28 Aug 2026
Evaluation of Pandora HCHO and NO2 with airborne in situ observations
Glenn M. Wolfe
Timothy Canty
Jason St. Clair
Erin Delaria
Jennifer Kaiser
Nidhi Desai
Andrew Rollins
Eleanor Waxman
Kristen Zuraski
Bryan Place
Apoorva Pandey
Akanksha Singh
Allison Ring
Charles Gatebe
Jonathan Dean-Day
The Pandora Global Network (PGN) is a system of ground-based spectrometers reporting continuous daytime column HCHO and NO2. While the Direct Sun (DS) NO2 product has been well studied, the Multi Axis Differential Optical Absorption Spectroscopy (MAX DOAS) and DS HCHO products are largely unvalidated. Using the Atmospheric Emissions and Reactions Observed from Megacities to Marine Areas (AEROMMA) airborne campaign in the summer of 2023, we evaluate the performance of select Pandora monitors relative to in situ airborne observations. A case study over a Pandora in the California desert shows MAX DOAS HCHO captures the total tropospheric column (within 4 % of the integrated in situ column) but does not match the vertical shape of the HCHO profile where the Pandora is biased high near the surface and low near the top of the boundary layer. The MAX DOAS NO2 is 80 % lower for the entire profile however, the spatial heterogeneity of NO2 makes the comparison particularly sensitive to the viewing angle of the Pandora. Ten Pandoras located in the New York City (NYC) domain capture the day to day variability of HCHO as well as spatial gradients from New Jersey to NYC to Long Island. The mean NYC Pandora HCHO correlates well with mean Tropospheric Emissions Monitoring of Pollution (TEMPO) HCHO columns of a similar domain on clear sky days. On those days, MAX DOAS columns exhibit a lower slope (slope = 0.78, y-intercept = 1.08×10¹⁵ molec cm−2; R2=0.62) while DS columns show a higher offset (slope = 0.90, y-intercept = 2.83×10¹⁵ molec cm−2; R2=0.63) compared to TEMPO. These results demonstrate the value of Pandora HCHO products while highlighting the need for improved uncertainty quantification.
- Article
(4263 KB) - Full-text XML
-
Supplement
(2667 KB) - BibTeX
- EndNote


The Pandora Global Network (PGN) is comprised of ground-based UV-VIS spectrometers that report total and partial column formaldehyde (HCHO), nitrogen dioxide (NO2), sulfur dioxide (SO2), water vapor, and total ozone columns at over 150 operational monitors across six continents (https://pandora.gsfc.nasa.gov/PGN/, last access: July 2025). Pandoras operate in two modes: Direct Sun (DS) and Multi Axis Differential Optical Absorption Spectroscopy (MAX DOAS). In the DS mode, the Pandora sensor follows the sun as it moves across the sky and column amounts are derived using differential absorption. The MAX DOAS mode measures scattered light at different elevation angles to calculate a tropospheric column, near-surface partial columns, and a surface concentration also using differential absorption.
First established in 2006, PGN released its latest data version in 2020 after numerous hardware and software updates. DS NO2 is likely to have less uncertainty than the MAX DOAS NO2 retrievals due to simplified path integration (Cede et al., 2006; Herman et al., 2009). Total NO2 columns agree well with satellite retrievals such as the Ozone Monitoring Instrument and the Tropospheric Monitoring Instrument (Herman et al., 2009, 2018; Kotsakis et al., 2022) and airborne remote sensors (Judd et al., 2019, 2020; Tzortziou et al., 2023). However, each Pandora spectrometer is calibrated and operated independently, leading to variability in performance across the network (Szykman et al., 2025; Rawat et al., 2026).
The updated HCHO products (Spinei et al., 2021) are relatively new with data beginning around 2020. In contrast to NO2, the DS HCHO is likely to have more uncertainty than the MAX DOAS HCHO. MAX DOAS is able to better account for instrumentation wavelength drift by taking a new reference during every sky scan while DS retrievals rely on a fixed reference that may have been take up to a year apart from the measurement (Cede, 2025). Validation studies are crucial to improving confidence in Pandora products, especially as the PGN is a key component of the validation plan of Tropospheric Emissions Monitoring of Pollution (TEMPO), the data record for which begins August 2023 (Szykman, 2023).
Here, we evaluate Pandora retrievals against in-situ airborne observations collected in Southern California (CA) near the Edwards Air Force Base, New Jersey (NJ), New York City (NYC), and Connecticut (CT) in the summer of 2023. We directly compare in situ vertical profiles to nearby Pandora partial columns and analyze day to day and spatial variability in Pandora columns. We also compare Pandora with TEMPO and examine the influence of clouds on the relative agreement between the two measurements.
2.1 AEROMMA
The NOAA airborne mission Atmospheric Emissions and Reactions Observed from Megacities to Marine Areas (AEROMMA; https://csl.noaa.gov/projects/aeromma/; last access: July 2025) took place in the summer of 2023 with the goal of understanding urban and marine atmospheric composition. NASA's DC-8 aircraft was equipped with many in situ gas and aerosol sensors. Here we use observations from NASA's In Situ Airborne Formaldehyde instrument (ISAF; Cazorla et al., 2015) and NOAA's NO Laser-Induced Fluorescence instrument which measures NO, NO2, and NOy (NO-LIF; Rollins et al., 2020) where NOy is the sum of all reactive nitrogen oxides. Accuracies for HCHO and NO2 measurements are 15 % and 10 %, respectively. Potential temperature was measured with the Meteorological Measuring System (MMS; Scott et al., 1990). We focus primarily on four flights that took place over and around NYC on 26, 28 July, 9, and 16 August 2023, hereafter referred to as “NYC1”, “NYC2”, “NYC3”, and “NYC4”. These flights and locations were chosen due to their proximity to Pandoras that perform MAX DOAS scans as discussed in the next section. In addition, we examine a single profile from the 26 June flight over southern CA. Additional AEROMMA flights were conducted in proximity to other Pandora instruments, however, these flights are excluded from this analysis due to limitations in Pandora data availability.
2.2 Pandora Global Network
Pandoras operate in two modes: DS and MAX DOAS. During DS mode the lens of the Pandora follows the sun where the full width at half maximum field of view of the instrument is 2.5°. The DS DOAS fitting window for DS NO2 and HCHO are 400–470 and 322.5–359.2 nm, respectively. The Pandora retrieves a slant column which, given a calculated geometric air mass factor (AMF), is converted into a total vertical column. Climatological stratospheric NO2 is also provided in the DS data files based on latitude, season, and time of day (Brohede et al., 2007). The MAX DOAS product provides a “tropospheric” column (integrating a vertical distance of ∼3 km and a horizontal distance of ∼10 km), partial columns in different vertical layers, and a surface concentration using climatological air densities and differential AMFs. The sum of the partial columns beneath the maximum altitude is equal to the tropospheric column. The surface concentration is estimated by either the 89° pointing zenith angle scan or, more often, extrapolated from the largest zenith viewing angle measurement. The fitting windows for MAX DOAS NO2 and HCHO are 435–490 and 328.5–359 nm, respectively. The MAX DOAS scans can be “long” or “short” in which long scans calculate 11 or 13 slant columns and short scans provide 4 columns (covering the same range of viewing angles). There are currently no official error estimates for the MAX DOAS columns. Further details on the algorithms used in the Pandora retrievals are available in the Blick user manual (Cede, 2024). We utilize level 2 (L2) vertical column data, in which spectral fitting has been applied, and columns have been calculated. Data are available at the NASA Pandora webpage (http://data.pandonia-global-network.org, last access: July 2025).
2.2.1 Pandora Data Quality Filtering
The PGN provides two sets of quality indicators for L2 data, each with three possible values for a total of nine combinations. First, the data are determined to be “high”, “medium”, or “low” quality (denoted with a 0, 1, or 2 in the ones place) based on an automated algorithm that flags exceedance of data quality thresholds (either instrumentation error or atmospheric sources). The Pandora documentation states that users should not use low quality data for most purposes (Cede, 2025).
The data are also assigned a modifier of “assured”, “unassured”, or “unusable” (0,1, or 2 in the tens place), referring to the level of manual quality control. Once a PGN operator has inspected the data, they deem it “assured” if there are no known issues in the quality assurance process or “unusable” if there is a concern (often based on the spectral fitting or uncertainty). The rational for data being labeled “unusable” is not publicly documented with the dataset. “Unassured” data has yet to be manually examined.
Figure 1 shows the distribution of the L2 data quality flags for the 10 Pandoras used in this study (Table 1) from the start of their data collection (ranging from September 2019 to September 2022) through July 2025. As of July 2025, 52 % of the data for all four products are “unassured” due to a backlog for manual inspection. The distribution of high, medium, and low quality data varies between stations and data product. On average, 68 % of the DS NO2 data and 46 % of MAX DOAS HCHO data are high quality. On the other hand, MAX DOAS NO2 and DS HCHO are more often low quality (41 % and 65 %, respectively).
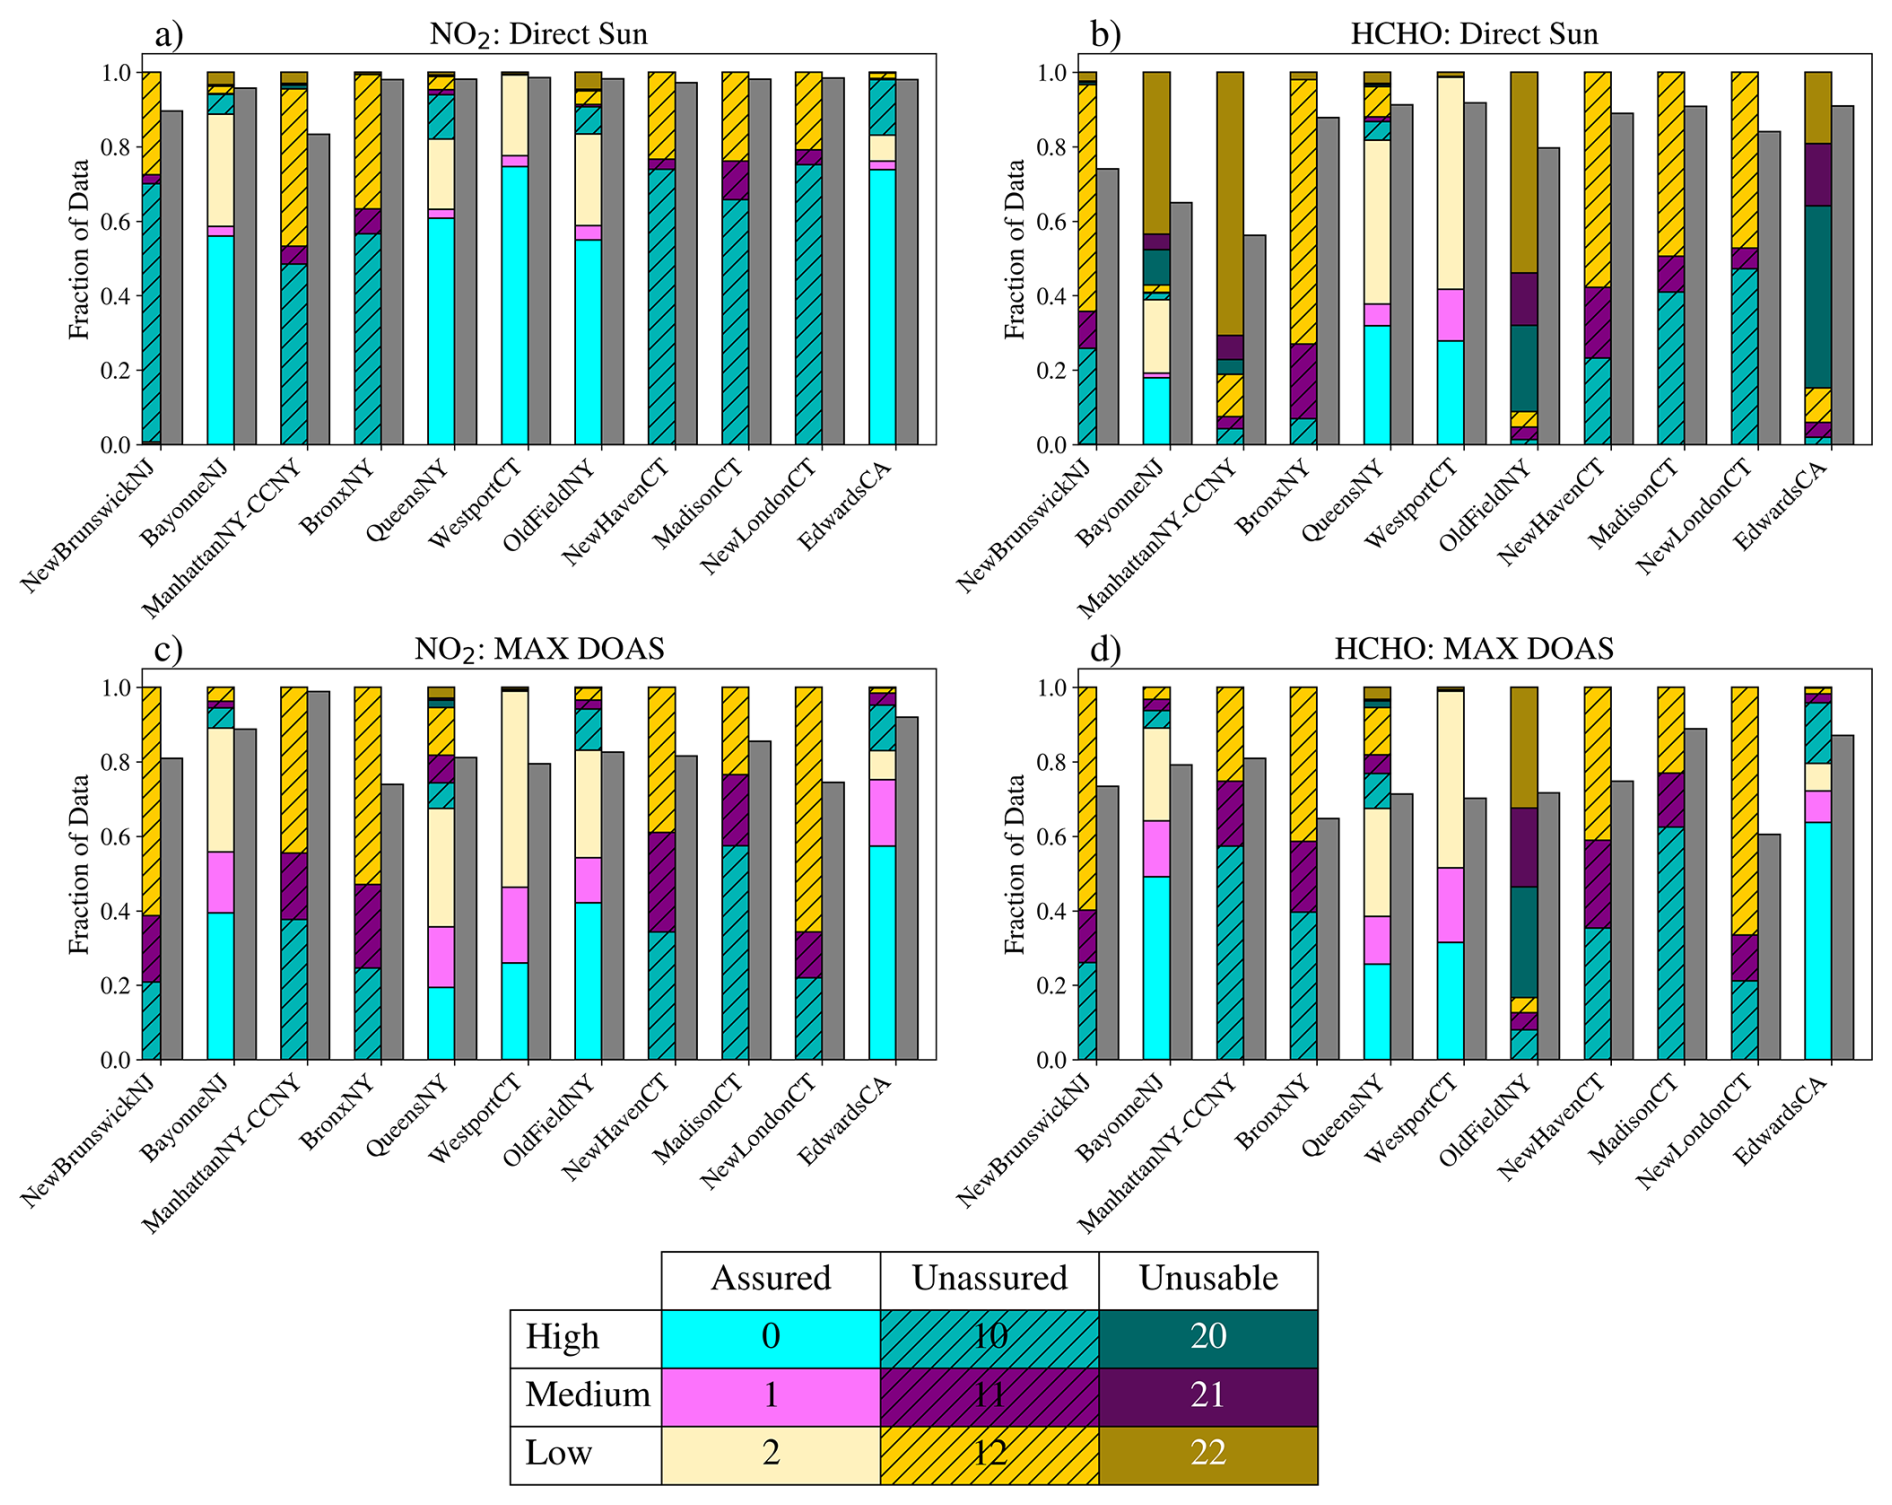
Figure 1Distribution of the data quality flags for each station used in this study for (a) DS NO2, (b) DS HCHO, (c) MAX DOAS NO2, and (d) MAX DOAS HCHO. Gray bars indicate the portion of retained data for each station after applying the filtering method described in Sect. 2.2.1.
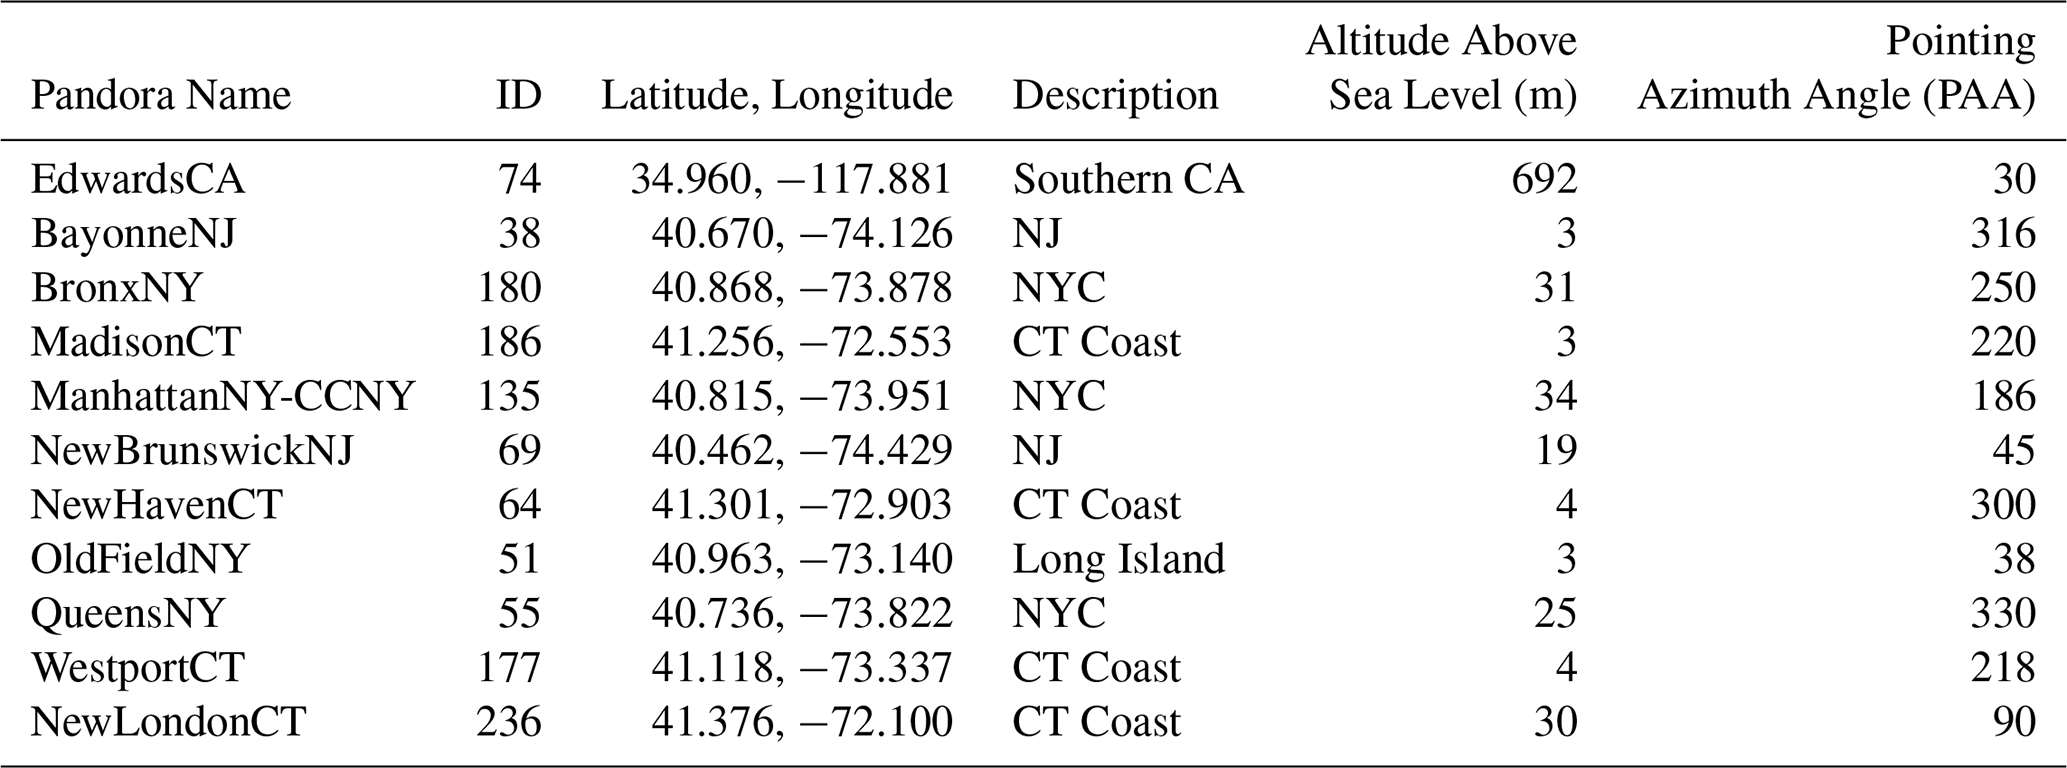
Table 1List of Pandoras used in this study including the name, spectrometer ID number, location, altitude, and pointing azimuth angle. The pointing azimuth angles apply only to the MAX-DOAS observations.
The Pandora user manual recommends eliminating low quality data for most uses. However, due to the automated nature of flagging low quality data, there is a possibility of false negatives. Rawat et al. (2025), proposes an alternative empirical method to filter for poor data quality via four steps: (1) Determine a cutoff value for independent uncertainty given for each Pandora based on the high quality data. (2) Filter the data to only include those beneath this threshold as well as data with a weighted room mean square error (wrms) <0.01 and (for MAX DOAS only) a maximum horizontal distance <20 km (range of which the MAX DOAS column spans in the horizontal direction). (3) Restore data with a percentage uncertainty under 10 %. (4) Confirm based on the improved correlation between contemporaneous DS and MAX DOAS observations. For the present study, we use this proposed method and also require that the percent uncertainty be less than 30 % for each scan. This additional criterion is particularly crucial for DS HCHO which has high uncertainty. For the monitors used in this study, removing only the low quality data retains an average of 65 % of data, while the described filtering method retains an average of 82 % (Fig. 1). Section S1 in the Supplement further discusses the data filtering process.
2.2.2 Pandora Unit Conversion
Pandora partial columns are reported in moles m−2 and must be converted into ppb for a direct comparison with airborne observations of HCHO and NO2. Climatological surface pressure and temperature (provided in the Pandora data files) are used to calculate air density, while the depth of the layer is assumed to be the distance between the layer heights given in the vertical profiles. The lowest level is assumed to extend to the surface. Section S2 in the Supplement discusses this procedure in greater detail.
2.3 TEMPO
Tropospheric Emissions Monitoring of Pollution (TEMPO) is the first geostationary satellite over North America to report column amounts of HCHO and NO2 every 40–60 min at a resolution of 2.0 km N/S × 4.75 km E/W at the center of the field of regard. TEMPO was launched in April 2023 and provides data beginning 2 August of the same year. The NO2 retrieval is in the 405–465 nm spectral window, while HCHO retrieval is in the 328.5–356.5 nm fitting window (Nowlan et al., 2025; Abad et al., 2025). These are slightly different ranges than the Pandora fitting windows for both DS and MAX DOAS modes. The validation plan for TEMPO includes diurnal and seasonal comparisons with airborne spectrometers, other satellites, and the PGN (Szykman, 2023; Szykman et al., 2025). We use version 3, level 2 HCHO data available from NASA's Earthdata website (Nasa, 2024). Using the nearest neighbor method, we grid L2 data to 2×4.5 km in the NYC domain bound by latitudes and longitudes of (40.2, 41.5°) and (−74.6, −71.7°), respectively. Data is screened to only include pixels with effective cloud fractions <0.20 and data quality flags equal to 0. Daily means of the TEMPO HCHO column are calculated by averaging the HCHO values from each hour in all grid cells, and hourly domain averages are determined by averaging all valid data across the entire NYC domain for each hourly retrieval.
2.3.1 Results
2.4 Case Study: Spiral over EdwardsCA Pandora
2.4.1 In Situ Observations
The DC-8 sampled in a vertical spiral over southern CA on 26 June 2023. The spiral began at an altitude of 10.3 km above ground level (a.g.l.) at 1:50 pm local time and ended at 0.03 km at 2:20 pm, including a low approach at Edwards Air Force Base (AFB). The flight track shown in Fig. 2 is centered over the EdwardsCA Pandora which, at this time, operated with a 30° pointing azimuth angle (PAA; red line). This is the only AEROMMA spiral that extended throughout the majority of the troposphere and took place directly over a Pandora monitor conducting MAX DOAS scans. This provides a rare opportunity for a direct comparison between Pandora vertical profiles and in situ observations.
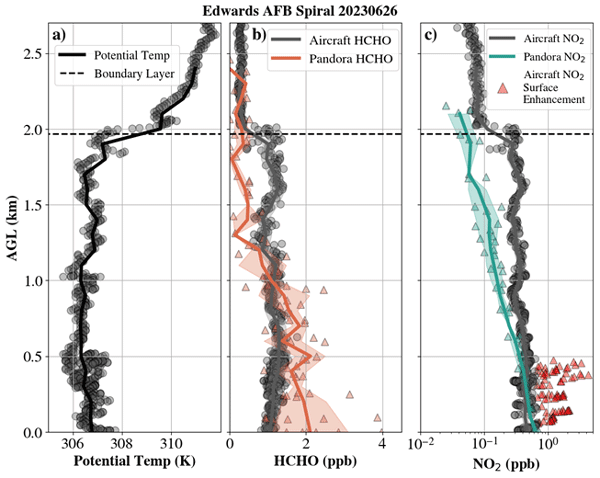
The vertical profiles of in situ potential temperature, HCHO, and NO2 are shown in Fig. 3 as the gray markers. Given the small variation in potential temperature at the lowest 2 km, followed by a sharp increase, the boundary layer (BL) appears to be well-mixed up to 1.97 km. In situ HCHO is also relatively constant in the BL (1.15±0.16 ppb; µ ±σ) and followed by a sharp decrease in mixing ratio above the inversion (0.17±0.09 ppb).
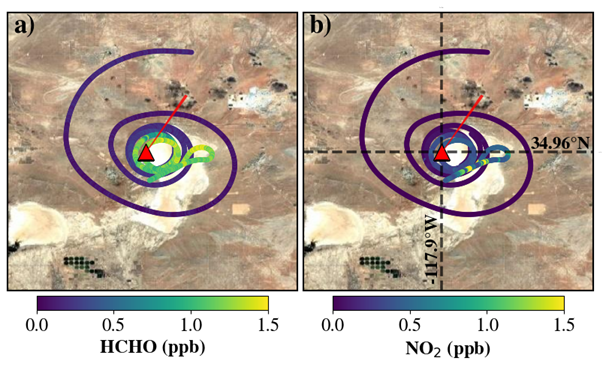
Figure 2Map of southern CA spiral colored by in situ (a) HCHO and (b) NO2. EdwardsCA Pandora (red triangle) and the viewing direction of Pandora MAX DOAS scans (red line) are included and extend to the mean integrated horizontal distance.
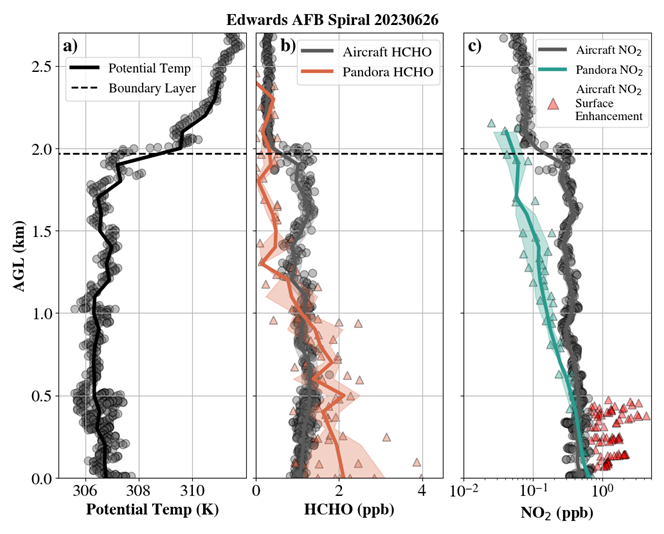
Figure 3Vertical profiles of (a) potential temperature, (b) HCHO, and (c) NO2. The boundary layer height is denoted as the dotted lines. The in situ airborne data are the gray markers and binned to 100 m (solid line). The shaded region represents measurement uncertainty. Pandora data are orange (HCHO) and blue (NO2) markers (solid lines are data binned to 100 m). The shaded region represents ±1 standard deviation. The red triangles in (c) are the NO2 enhancement observed in the southeast quadrant in Fig. 2, defined as the upper 25th percentile of the near surface observations (<0.5 km).
The in situ NO2 is more variable than HCHO, primarily near the surface (note the logarithmic x axis in Fig. 3c). Enhancements of NO2 up to 4.2 ppb are observed from 0.3 to 0.5 km in the southeast quadrant of the spiral. We define this enhancement in Fig. 3c as observations in the upper 25th percentile of data below 0.5 km (red triangles). Excluding this enhancement, the BL mean of NO2 is 0.5±0.3 ppb. There are no obvious local industrial sources (refinery, power plant, etc.) that would be a source of NO2 and there does not appear to be a consistent source of NO2 from any given wind direction based on historical Pandora data (Fig. S4). The NO2 enhancement is likely caused by local emissions from the nearby Edwards AFB airport (Fig. S5).
We include a total of 6 long scans and 16 short scans from the EdwardsCA Pandora that occurred within 1 h of the spiral. The scans included are all “high” quality data with average tropospheric HCHO and NO2 column uncertainties of 9.0×10¹⁴ molec cm−2 (18 %) and 8.0×10¹³ molec cm−2 (7 %), respectively. Uncertainty is not reported for the partial columns, thus we include the standard deviation of the points as the shaded region in Fig. 3 to represent the variability between each scan.
2.4.2 Pandora HCHO and NO2
The Pandora HCHO vertical profile does not match the shape of the in situ profile. In the lowest 1 km, Pandora HCHO is biased high by an average 0.4±0.3 ppb and the surface concentration is almost twice as high as the lowest in situ observation at 10 m (Fig. 3). From 1–2 km, the bias flips sign and Pandora HCHO are low by 0.50±0.28 ppb. Above the BL (1.97 km) there is comparatively closer agreement between the in situ and Pandora HCHO (a mean difference of 0.04 ppb). This result is consistent across the four different scan modes (Fig. S6).
Table 2 compares integrated vertical columns from the aircraft and Pandora. We vertically integrate the in situ observations to obtain two columns: one spanning the entire spiral (surface to 10.3 km a.g.l.) and another limited to Pandora MAX DOAS tropospheric column (surface to 2.5 km a.g.l.). For the in situ column integration, the HCHO and NO2 observed at the lowest height (10 m) are assumed to be constant from 10 m to the surface. The entire in situ integrated column is 6.6×10¹⁵ molec cm−2, 25 % lower than the mean total HCHO column found by the Pandora DS product during this time frame (8.8×10¹⁵ molec cm−2). Meanwhile, the average Pandora tropospheric HCHO column agrees with the integrated in situ column under 2.5 km to within uncertainty of the in situ data (5.2×10¹⁵ and 5.0×10¹⁵ molec cm−2, respectively). However, the individual partial columns have no reported uncertainty. The high bias near the surface and the low bias under the BL offset each other to produce a column amount of HCHO from the MAX DOAS scans that are very similar in value to the in-situ column.
Table 2Column HCHO and NO2 during the southern CA spiral over EdwardsCA Pandora. This includes integrated in situ columns for the entire profile (Surface-10.3km), analogous to DS total columns and a partial profile (Surface-2.5km), for comparison with MAX DOAS tropospheric columns. Additional integrated in situ NO2 columns are provided with the surface enhancement removed. For the in situ column integration, the HCHO and NO2 observed at the lowest height (10 m) are assumed to be constant from 10 m to the surface. The climatological stratospheric NO2 column has been subtracted from the NO2 DS total column.
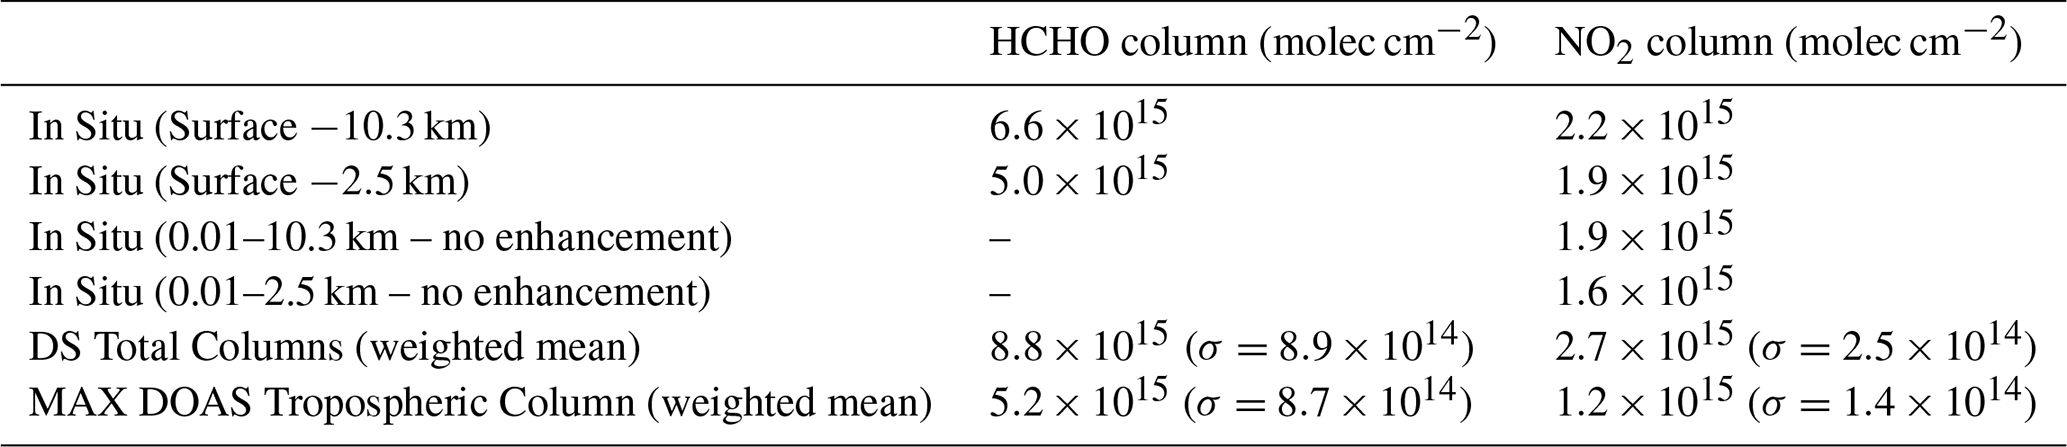
We compare the NO2 profiles in Fig. 3c. Pandora MAX DOAS NO2 is 46 % lower than the total in situ integrated column (1.2×10¹⁵ and 2.2×10¹⁵ molecules cm−2, respectively). Excluding near-surface enhancements (red triangles in Fig. 3c) reduces the Pandora MAX DOAS NO2 difference to 37 % lower than the aircraft observations. The Pandora is pointing away from the surface enhancement and therefore is not expected to capture that feature. This is an important consideration for future comparisons to both in situ observations and high-resolution satellite retrievals. HCHO is sufficiently well-mixed in this case, such that the Pandora viewing angle does not appear to significantly affect the observed concentrations. This simply reflects a lack of strong local HCHO sources (most HCHO is produced through VOC oxidation at this time of year). NO2, on the other hand, can exhibit large horizontal and vertical gradients, especially in the presence of local emissions. Looking only at the lowest 0.5 km and excluding the enhancement, the Pandora is on average 15 % greater than the in situ observations showing a similar pattern to the HCHO where the Pandora is greater at the surface. However, the turnover altitude for NO2 is lower (0.3 km) compared to the HCHO profile (1 km).
While the partial columns are, on average, lower than in situ by 50 %, this relationship is not reflected between the integrated in situ columns and the DS total column or MAX DOAS tropospheric column. The mean Pandora MAX DOAS tropospheric column NO2 is 40 % less than the integrated in situ column for lower than 2.5 km. Furthermore, the mean total DS NO2 column (excluding the climatological stratospheric column) is 22 % greater than the in situ integrated column for the entire spiral (2.7×10¹⁵ and 2.2×10¹⁵ molec cm−2, respectively). Figure S2 shows the DS NO2 is on average 52 % greater than MAX DOAS NO2 for EdwardsCA, one of the largest discrepancies for the 10 Pandoras in this study. It is possible that this low difference in MAX DOAS NO2 is not a limitation of the Pandoras in general but rather an issue with this specific spectrometer. Additionally, there is uncertainty in climatological stratospheric NO2 values, which is likely more pronounced at lower column amounts and may contribute to the observed discrepancies.
To summarize, Pandora MAX DOAS HCHO agrees with the in situ observations with respect to the total tropospheric column, but the shape of the vertical profile exhibits a strong height-dependent bias. Quantification of the uncertainty in partial columns should be a priority, especially for columns at higher altitudes. The Pandora MAX DOAS NO2 is lower than the in situ observations for the entire profile, however better agreement exists at the surface between data within the viewing angle of the Pandora. This case study also emphasizes the need for consideration in the viewing angle of the Pandora during comparisons within horizontally heterogeneous environments.
2.5 New York City
The four NYC flights during AEROMMA passed over or near ten Pandora stations (Fig. 4). During NYC1, NYC2, and NYC3 sampling began in New Jersey, continued through NYC and along the LIS into CT and then returned along the same route. The density of the monitors allows us to evaluate the daily and spatial variability of Pandora HCHO. We use both the tropospheric columns derived from the MAX DOAS mode and the total columns from the DS scans. We do not analyze NO2 because significant spatial heterogeneity in this domain degrades comparisons. Additionally, the PAA of several Pandoras are pointing away from the flight path (Table 1), making it difficult to determine whether aircraft-Pandora differences reflect instrument biases or urban NO2 gradients.
Flights occurred within distinct meteorological and air quality conditions. NYC1 and NYC2 sampled under clear skies and warm surface temperatures (upper 80s to lower 90s F and a heat advisory during NYC2). Ozone exceedances occurred on both days, and the Air Quality Index (AQI) was labeled “unhealthy for sensitive groups.” Mean observed in situ HCHO was 2.3 and 2.6 ppb for NYC1 and NYC2, respectively, with the highest mixing ratios (5.2 ppb for NYC1 and 4.4 ppb for NYC2) over Long Island (LI) in the midafternoon (Fig. 4). Observed HCHO varied across the flight track these days (standard deviation 0.94 and 0.70 ppb for NYC1 and NYC2, respectively), likely reflecting variability in both VOC emissions and oxidation rates. Afternoon winds ranged from 5–20 kts (2.5–10 m s−1) near the surface (Fig. S7).
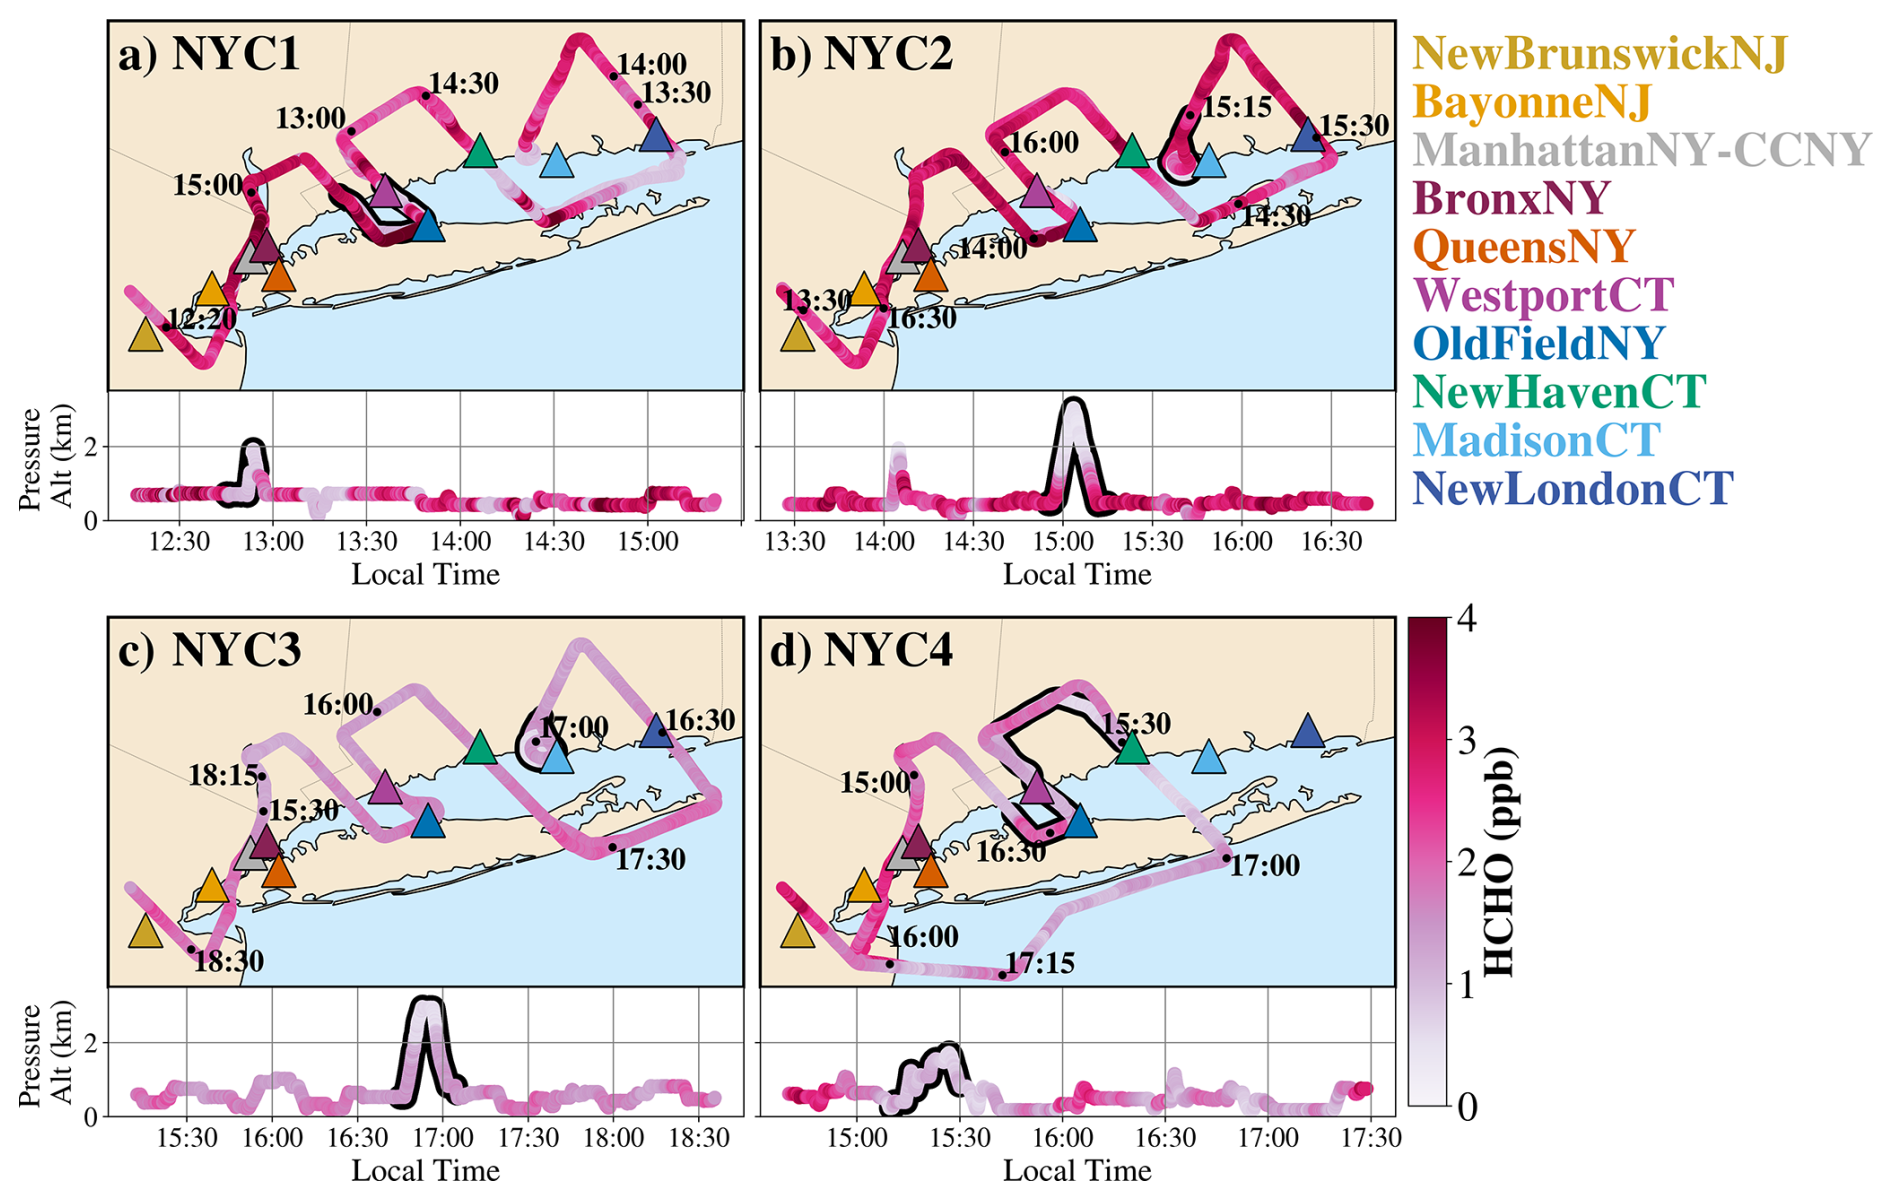
Figure 4Flight tracks for NYC1 (20230726), NYC2 (20230728), NYC3 (20230809), and NYC4 (20230816) colored by observed HCHO. Pandoras are marked as triangles. The altitude time series is included beneath the flight tracks colored by HCHO. The times and locations of vertical profiles discussed in Sect. 3.2.2 are outlined in black.
NYC3 was slightly cooler (temperatures in the mid-80s) with moderate westerly winds and generally clear skies (with a few scattered cumulus in the afternoon). The BL is well mixed with moderate winds of 5–20 kts (2.5–10 m s−1) near the surface (Fig. S7). HCHO mixing ratios were lower and less variable on this day, (mean 1.6 ppb, maximum of 2.6 ppb, standard deviation 0.3 ppb). Higher HCHO tends to be located over LI and downtown New York City.
There was scattered rain the night before and the morning of NYC4. The skies began to clear in the afternoon, but the domain remained partially cloudy all day, causing the DC-8 to take a different path than the previous flights. A stationary front to the south kept winds relatively calm (under 5 kts near the surface; Fig. S7). The mean observed HCHO remained relatively low (1.6 ppb) but with more variation than the previous flight (standard deviation 0.63 ppb). The maximum observed HCHO was 3.9 ppb with elevated levels occurring over Manhattan at 2:30 pm local time and over LI in the late afternoon. The AQI was “good” to “moderate” on both NYC3 and NYC4.
2.5.1 Pandora Tropospheric and Total Column Time Series
Figure 5 shows the 30 min averaged time series of MAX DOAS tropospheric HCHO columns (Fig. 5a–d) and DS total HCHO columns (Fig. 5e–h) for the four NYC flight days. Individual stations (colored lines) and the average of all stations (gray dotted line) are included. Continuous data from Pandoras illustrate both the diurnal cycle and spatial variability of HCHO columns across the NJ-NYC-CT domain. These observations provide important insight into the temporal evolution of VOC–NOx interactions throughout the day (Sebol et al., 2024; Singh et al., 2025)
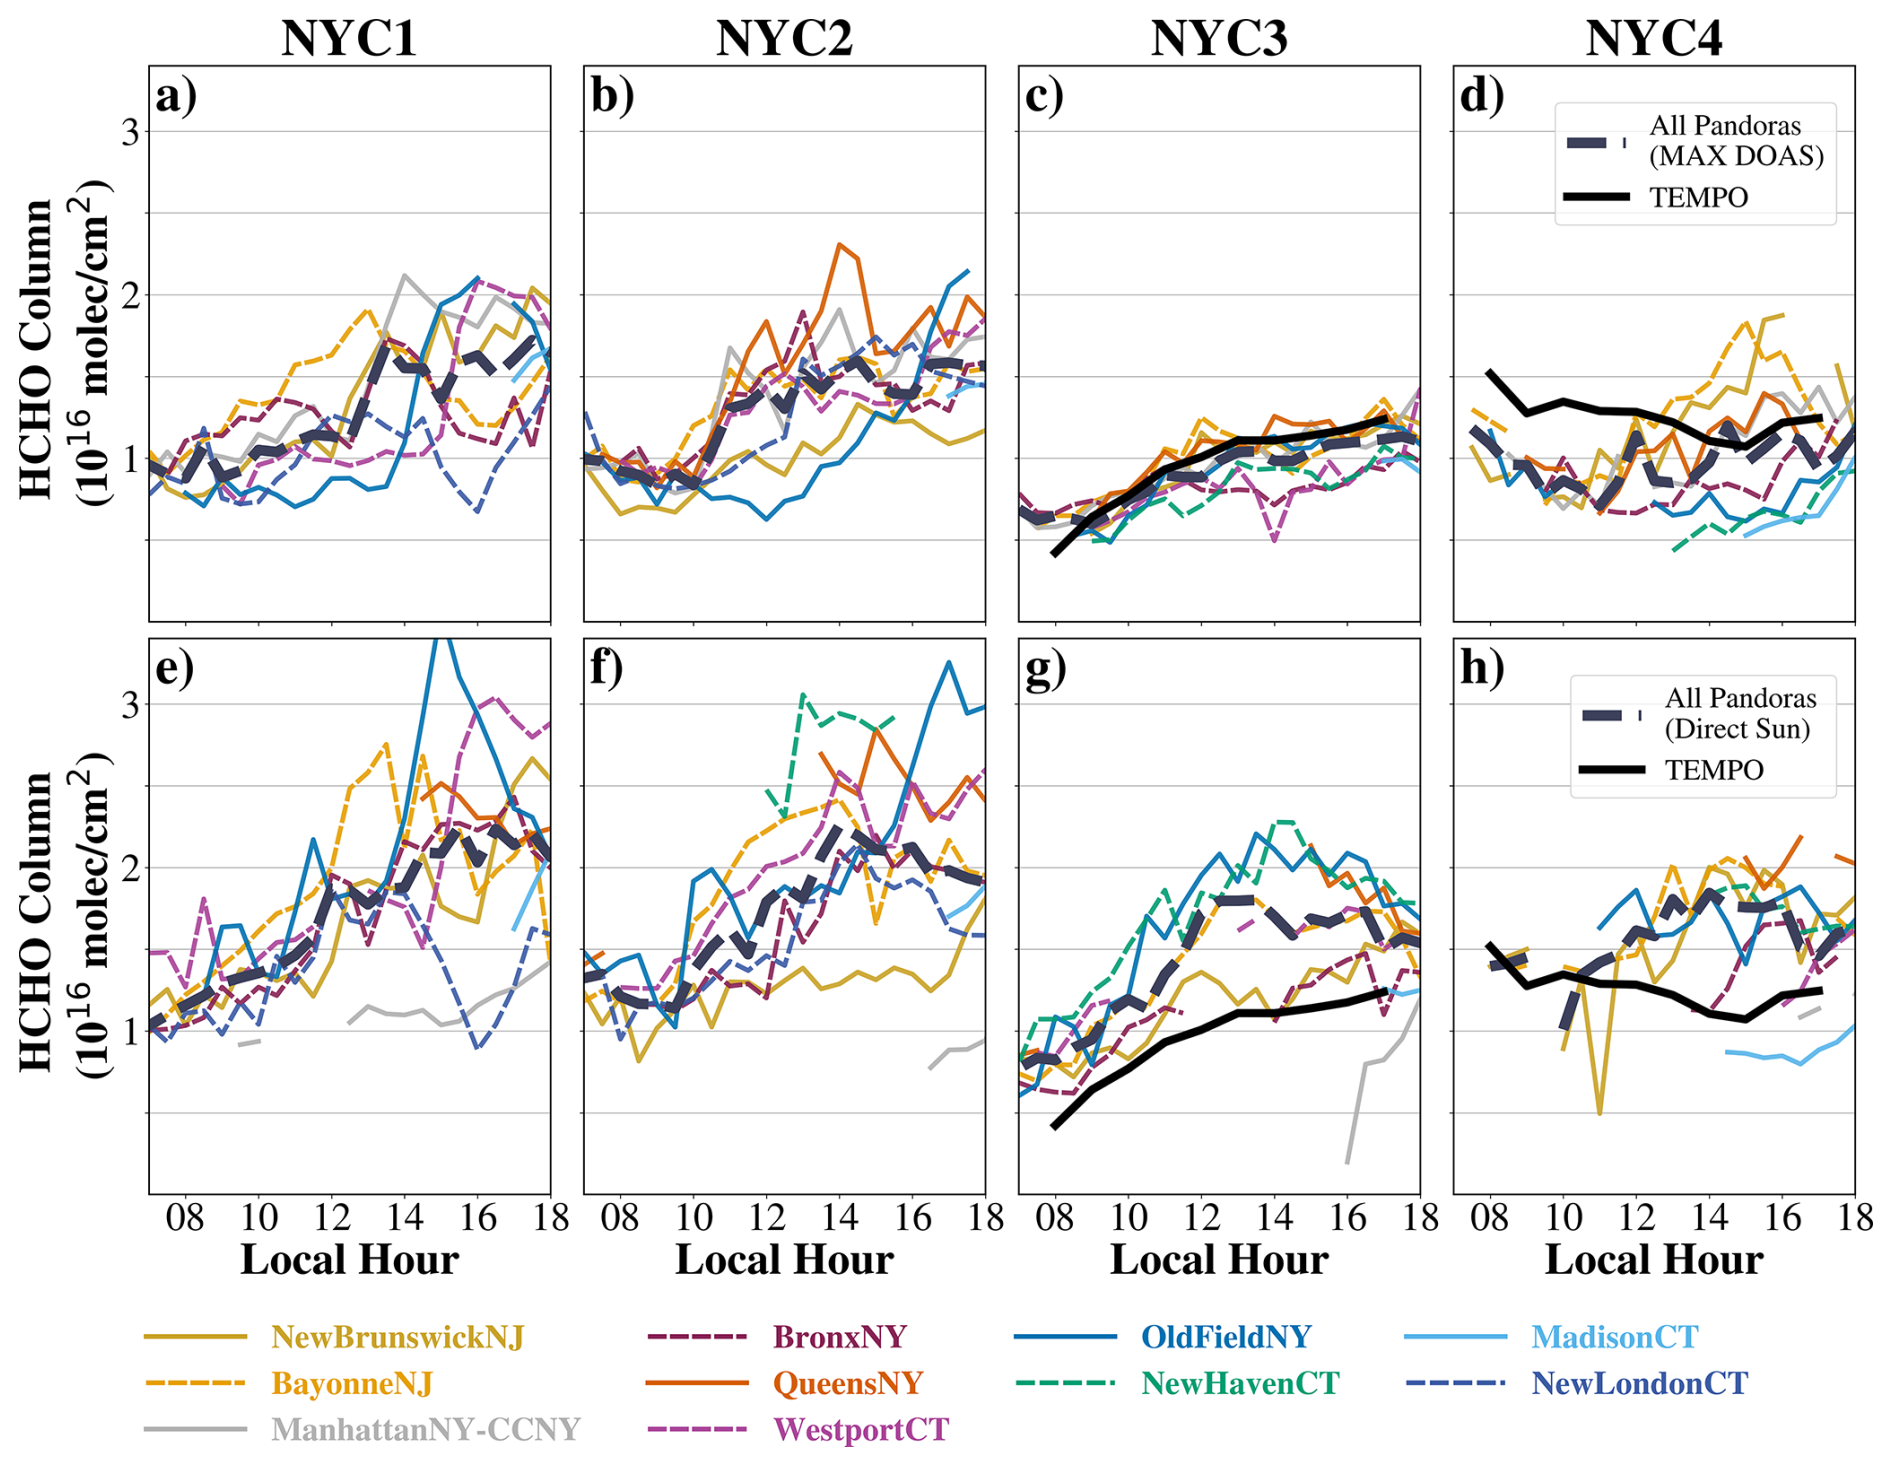
Figure 5MAX DOAS tropospheric column (a–d) and DS total column (e–h) HCHO from NYC Pandoras on the four flight days averaged to 30 min. The individual stations are colored, and the mean value is shown as the dotted gray line. The hourly NYC domain (Fig. 4) average TEMPO HCHO column is included on NYC3 and NYC4 as the solid black line.
There is evident spatial variability in MAX DOAS and DS HCHO on NYC1, NYC2, and NYC4. In contrast, the HCHO columns on NYC3 are lower and are more uniform across all monitors. This pattern aligns with the meteorological conditions on this day which featured moderately stronger horizontal winds and a deeper, well-mixed BL (Fig. S7).
Afternoon enhancements in tropospheric HCHO columns are observed on all days, however, the peak HCHO levels occur at different times across the domain. For example, on NYC1, BayonneNJ reaches its maximum HCHO at 1 pm EDT while NewBrunswickNJ, 35 km away, continues to increase until 5 pm EDT. WestportCT and OldFieldNY, both along the coastline of the Long Island Sound (LIS), remain relatively constant until approximately 2 pm EDT after which HCHO rapidly doubles. These observations highlight the ability of Pandoras to capture detailed temporal and spatial variations in HCHO, particularly near the land-ocean interface. This information complements “snapshot” aircraft measurements.
DS total column HCHO exhibits greater variability and more pronounced afternoon enhancements compared to MAX DOAS. On NYC1 and NYC2, MAX DOAS HCHO increased approximately 50 % from morning to afternoon, while DS HCHO nearly doubled. Similarly, on NYC3, MAX DOAS HCHO doubled, but DS columns increased by 125 %, with greater variability across stations. Despite clear-sky conditions, data gaps are still present in DS mode at certain sites, such as ManhattanNY-CCNY and MadisonCT, due to the higher sensitivity to atmospheric interference. ManhattanNY-CCNY has been cited as a lower confidence Pandora in previous (Rawat et al., 2026), likely due in part to obstructed viewing from surrounding tall buildings. As DS HCHO retrievals have higher uncertainty than MAX DOAS, more data are excluded during data filtering.
Limitations of both MAX DOAS and DS HCHO columns are apparent on NYC4, a mostly cloudy day. In the morning (08:00–12:00 EDT), when the clouds are most persistent, most data exceed the uncertainty threshold, however some MAX DOAS scans remain. After 12:00 EDT, once the clouds start to dissipate, all operational Pandoras produce valid MAX DOAS data revealing a strong east-west gradient in HCHO columns. However, additional validation is necessary to assess the accuracy of MAX-DOAS retrievals under cloudy conditions, particularly given the potential impacts of cloud scattering and radiative transfer assumptions on retrieval sensitivity. In contrast, DS data were largely unavailable during this day, remaining sparse even after the clouds began to clear. The uncertainty in DS columns even during partial cloudiness makes data interpretation difficult.
These results align with the in situ airborne HCHO observations. Spatial variability was greater on NYC1 and NYC2 compared to NYC3, which had a low standard deviation (σ=0.32 ppb) and a small range (∼2 ppb for the flight). An east-west gradient was observed on NYC4, with values of the western being 2–3 times greater than those on the eastern side. From 12:30–18:30 local time (the earliest and latest times of flight for this domain), the mean in situ mixing ratios (averaged from the data shown in Fig. 4), MAX DOAS columns, and DS columns are 53 % greater on NYC1 and NYC2 than on NYC3 and NYC4.
The locations of the peak Pandora HCHO generally align with the highest in situ values. The largest in situ HCHO on NYC1 and NYC2 occurred over LI and downtown NYC around 15:00 and 16:00 EDT, respectively. These observations are consistent with elevated Pandora HCHO at similar times seen at OldFieldNY, WestportCT, and ManhattanNY-CCNY, indicating spatial consistency between the in situ and ground based spectrometers.
2.5.2 Vertical Profiles
The DC-8 did not conduct high-altitude profiles over NYC as in the Edwards AFB case study preventing comparisons with Pandora DS total columns. However, partial profiling was carried out on each flight allowing for comparisons with Pandora MAX DOAS vertical profiles which extend only 2–3 km above the surface. These times and locations are outlined in black on Fig. 4. Comparisons are limited to the Pandoras closest to each aircraft profile and those that had valid long scans (11 or 13 levels). This is not ideal for evaluation of Pandora performance as differences may arise from air mass heterogeneity; however, it provides data for considering differences in vertical profiles. The DC-8 covered the approximate BL over the LIS, LI, and CT on NYC1 and NYC4 spanning from 0.11 to 1.92 km (NYC1) and 0.12 to 1.72 km (NYC4) and over a relatively large horizontal distance. The closest Pandoras to these profiles are OldFieldNY, WestportCT, and NewHavenCT. Spirals were done during NYC2 (from 0.13 to 3.02 km) and NYC3 (0.20 to 2.96 km) just west of the MadisonCT Pandora.
Figure 6a compares partial columns from in situ and Pandora observations. Pandora vertical profiles (taken within ±45 min of the aircraft profile time) and in situ profiles are integrated over the altitude range common to both the aircraft and Pandora measurements. To highlight relative differences, columns are normalized to the in situ columns values on that day. Figure 6b shows the full vertical profiles. These profile comparisons are limited to the altitudes ranges sampled by the aircraft and may not capture potential biases near the surface.
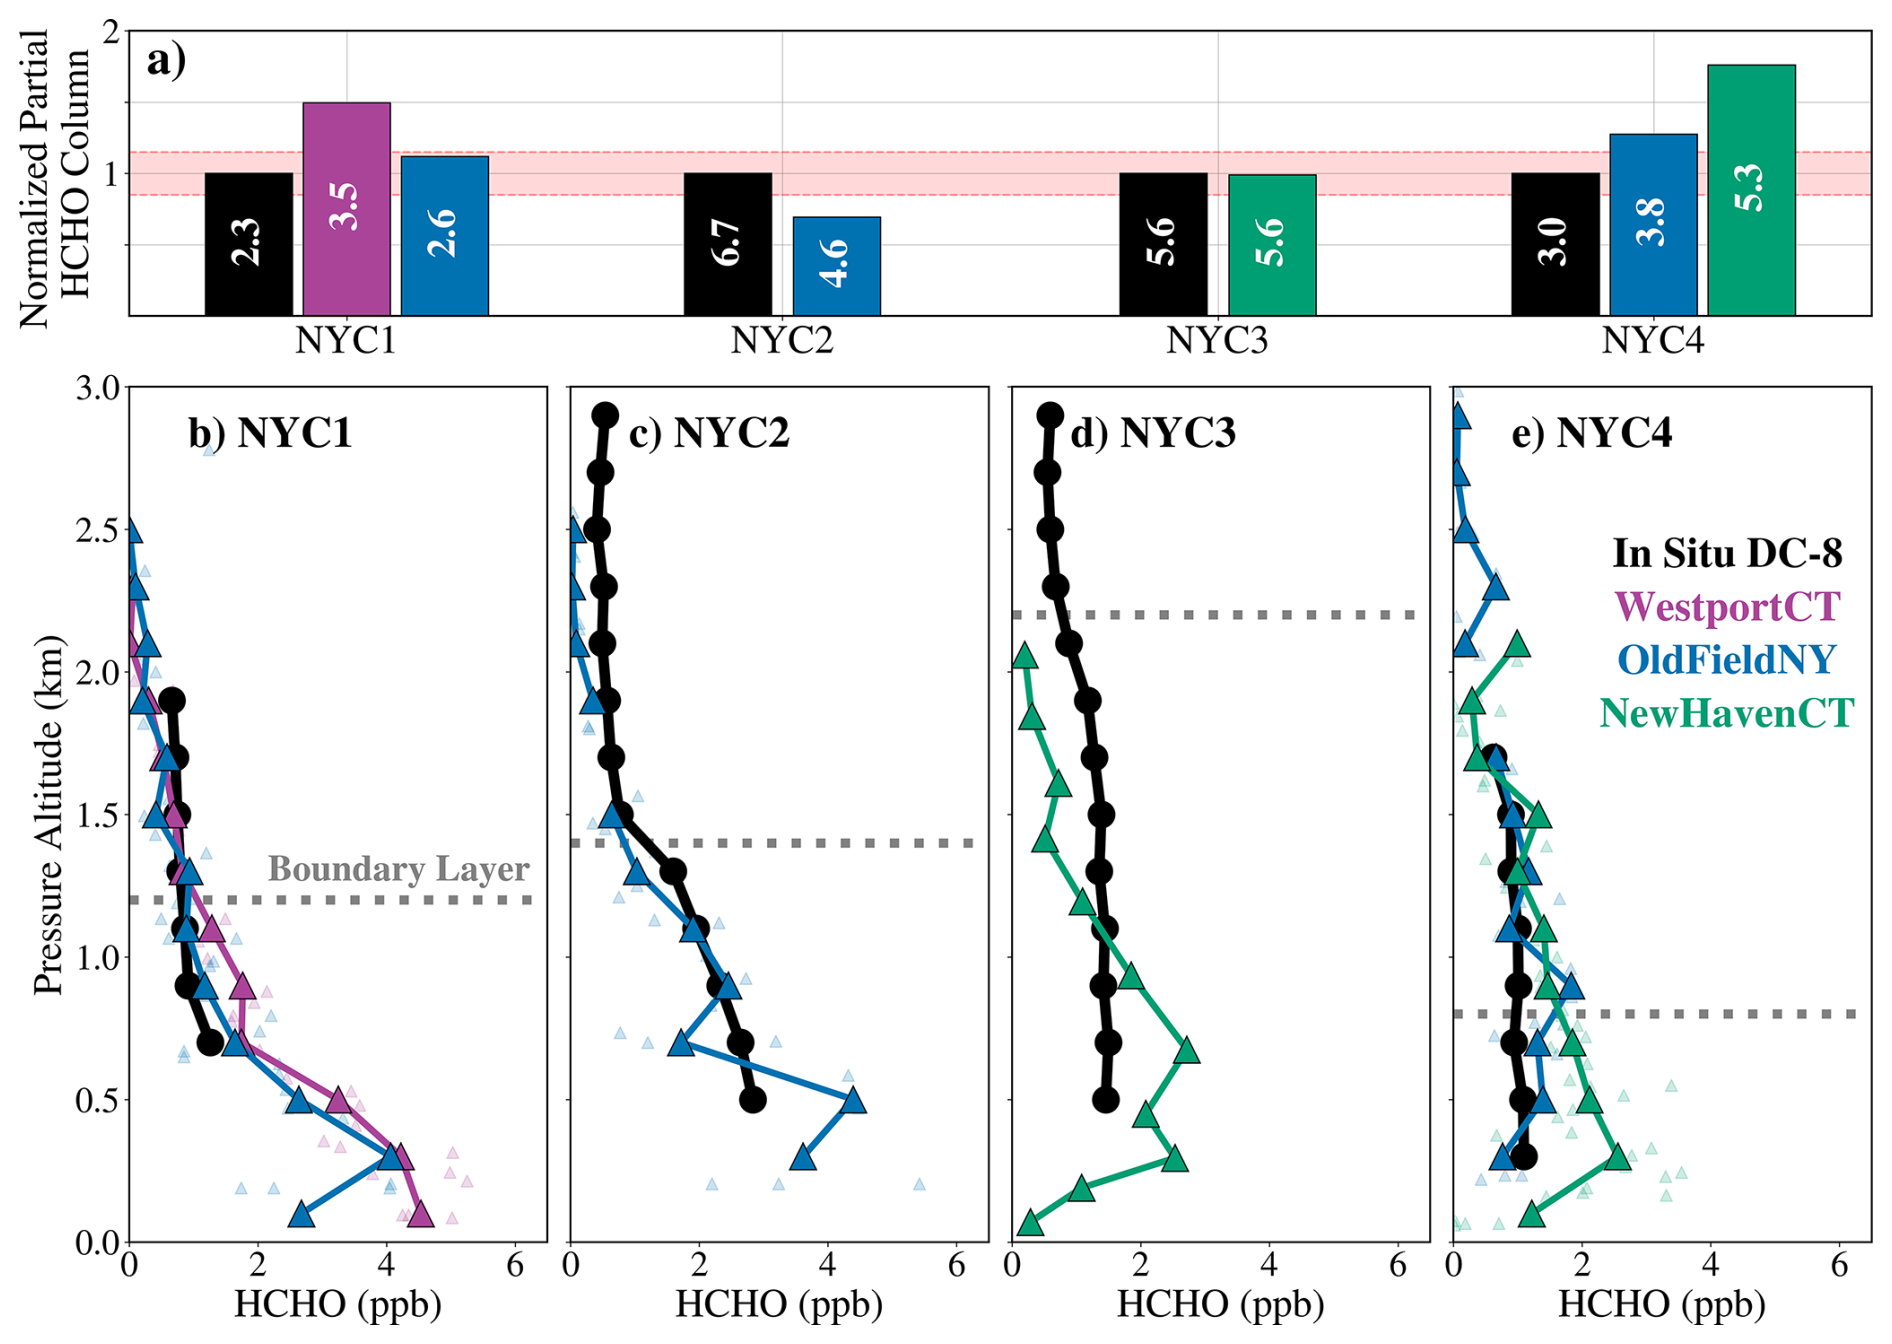
Figure 6(a) HCHO partial columns from integrated in situ observations during DC-8 profiles and mean Pandora MAX DOAS scans during the same time frame (±45 min) from the nearest operational monitors normalized to the in situ column. Actual column values in molecules cm−2 are included as the white text on the bars. We include 15 % error (shaded red area) representing instrumentation accuracy of the in situ data; uncertainties for Pandora vertical profiles are not available. (b–e) Vertical profiles of HCHO from the NYC flights including the airborne in situ data (black solid line) and individual Pandora profiles (colored lines). Data are binned to 250 m (except the NewHavenCT profile on NYC3, which only has one Pandora profile during this time range). Dotted gray lines denote approximate boundary layer heights based on potential temperature gradients (not shown).
The Pandora columns are, on average, greater than corresponding in situ columns (averaged over the same distance) primarily due to greater partial columns in the lower BL. On NYC1, WestportCT is 52 % greater than the in situ column. The vertical profile at this site shows higher Pandora values from the lowest levels up to the BL height, where the difference reverses sign. On NYC4, NewHavenCT is 77 % greater. In this case, Pandora values are greater both near the surface and above the BL. On this day, there was a lower, and less defined inversion. Neither the in situ HCHO nor these three Pandoras exhibit a distinct decrease at any altitude, rather they remain relatively constant from 0.12 to 1.72 km.
The only case when Pandora column HCHO is lower than the in situ occurs on NYC2 where OldFieldNY is 37 % lower. This notable difference may be explained by the viewing geometry of the instrument. The Pandora uses a 38° PAA, facing the LIS, away from the region sampled by the DC-8. This highlights how the distance and the heterogeneity of HCHO must be considered. Most of the low bias in column Pandora HCHO is due to partial columns above the boundary layer.
The most direct comparison to in situ data on these four days is on NYC3 with the NewHavenCT Pandora. The DC-8 completed a spiral just west of the Pandora and a single long scan was taken during the given time window. The integrated columns have near perfect agreement (both 5.6×10¹⁶ molec m−2). Pandora HCHO is greater from the lowest level (0.45 km) to 1 km. From there, the Pandora becomes lower than the in situ profile.
In New York City in the summertime, the majority of HCHO is produced through VOC oxidation (Lin et al., 2012). Additional HCHO directly emitted from combustion sources and land/water meteorological influences can result in a horizontal gradient of HCHO that must be considered when interpreting Pandora columns. However, the Pandora MAX DOAS product does depict the day-to-day variability in total column amount, even while not capturing the precise profile shape, particularly in a deep, well-mixed BL. Future validation efforts would benefit from direct coordination between flight planners and the Pandora operators. Special attention in future validation efforts should be given to days with differing meteorological conditions (BL height, wind patterns, clouds, etc.) to better understand the performance of the Pandora instruments.
2.5.3 TEMPO
Pandora column HCHO can be directly compared to TEMPO satellite retrievals during NYC3 and NYC4. Daily average TEMPO HCHO columns for these two days are shown in Fig. 7a and b. Just as in Pandora MAX DOAS columns and in situ observations, TEMPO HCHO is relatively uniform on NYC3, with only slightly elevated HCHO over downtown NYC and LI (mean molec cm−2), while on NYC4 there is greater mean HCHO column with an east-west gradient ( molec cm−2).
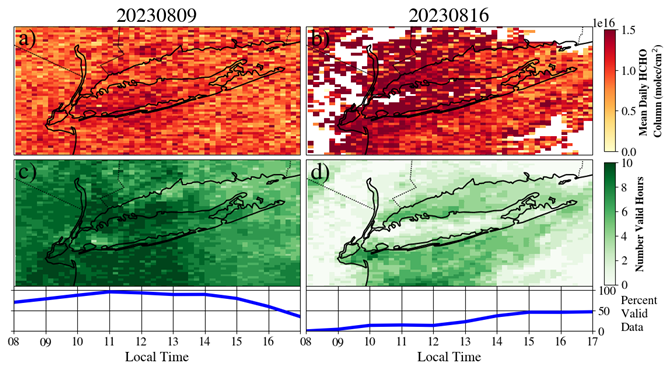
Figure 7(a, b) Daily average TEMPO HCHO columns for NYC3 and NYC4 from 08:00–17:00 EDT. (c, d) Number of data points included in the average for each grid box and time series of the percentage of valid data in the domain.
The number of valid pixels for each grid point and the total percentage of valid data for the domain are shown in Fig. 7c and d. During NYC3, there was never less than 50 % available data points until 17:00 EDT. In the late afternoon a few scattered cumulus clouds formed restricting some data along the CT coast. During NYC4, cloudiness reduced the fraction of valid pixels (>75 %) until 1 pm EDT. After that, the skies cleared marginally, and valid data increased to nearly 50 % for the rest of the day.
Mean hourly TEMPO HCHO columns are shown as the solid black line in Fig. 5c, d, g, and h. These values correspond to column averages over the entire NYC domain as shown in Fig. 4. On NYC4 the mean value represents low-cloud areas only and thus may not be representative of the whole region. The agreement between average Pandora MAX DOAS HCHO columns and TEMPO HCHO columns is within 11 % on NYC3. The standardized mean difference (SMD) takes the difference between two means and normalizes based on a weighted standard deviation of the data. In this case, SMD = 0.14, indicating a difference of less than one standard deviation. Both products show a similar afternoon increase in time and magnitude. On a clear-sky, well-mixed day, the ten Pandoras agree with the mean TEMPO retrievals for this NYC domain. In contrast, TEMPO HCHO is 30 %–40 % lower than Pandora DS HCHO across the day of NYC (SMD = 1.3; over one standard deviation difference).
The agreement on NYC4 is influenced by the clouds. TEMPO reports twice the amount of HCHO as MAX DOAS HCHO from 08:00–13:00 EDT. However, starting around 14:00 EDT, the agreement between the two datasets improves, with a mean discrepancy of only 11 % as data availability increases. At this time, valid TEMPO pixels never exceed 50 %, but all 8 operational Pandoras (WestportCT and NewLondonCT were down on this day) have valid data. While TEMPO data lacks complete coverage under partially cloudy conditions, the MAX DOAS, which observes from the bottom-up, still provides valid data based on our filtering assumptions in the afternoon. However, additional validation checks are necessary to understand the accuracy of MAX DOAS under these cloudy conditions. DS HCHO is typically not valid under even partial cloud cover. Only BayonneNJ and OldFieldNY offer continuous DS HCHO.
To provide a more robust comparison, we extend the analysis for the entire month of August 2023. Figure 8 shows the correlation between mean hourly TEMPO HCHO and MAX DOAS HCHO (Fig. 7a) and DS HCHO (Fig. 7b) averaged over all stations from 2–31 August for the same NYC domain. For this analysis, we modify the Pandora filtering methodology by not removing data with greater than 30 % uncertainty to reduce bias from eliminating low column amounts. We use the Theil Sen regression method where the slope is determined by finding the median of the slopes between all pairs of points (Ohlson and Kim, 2015) which reduces bias from outliers. Table 3 summarizes these statistics.
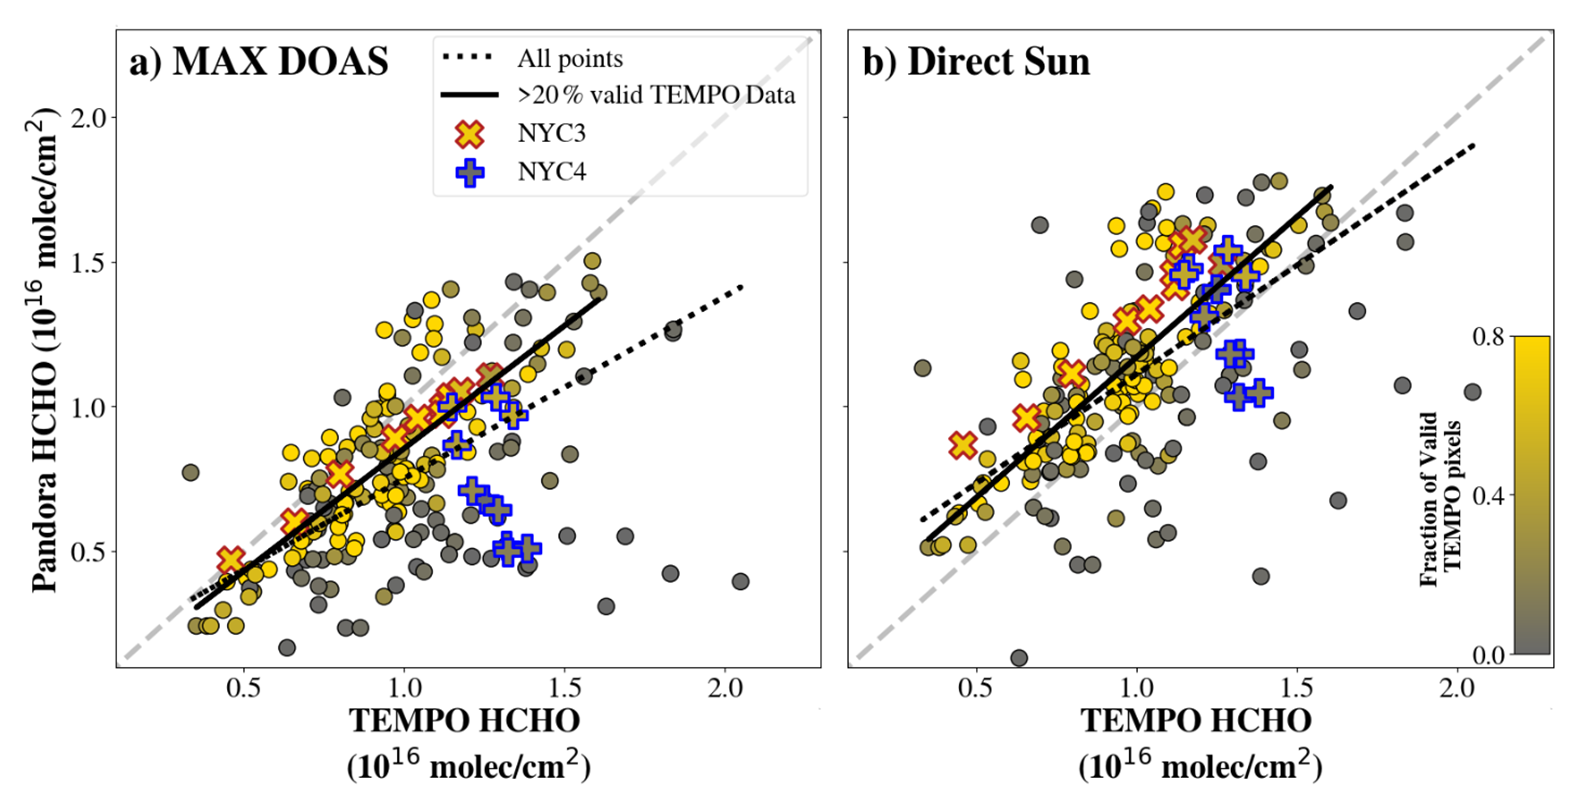
Figure 8Average TEMPO HCHO column for the entire NYC domain (Fig. 4) versus average NYC Pandora MAX DOAS tropospheric column (a) and Direct Sun total column (b) from 2–31 August 2023. Each marker represents one hour of data and are colored by the percentage of available TEMPO data for the domain. Data from NYC3 and NYC4 are outlined as the red X's and blue crosses, respectively. Theil Sen lines of best fit for all data (dotted) and those with >20 % valid data (solid) are included.
Table 3Theil Sen regression parameters (slope, y-intercept, and R2) corresponding to the data shown in Fig. 8, representing the relationship between TEMPO HCHO and Pandora HCHO. >20 % refers to the removal of data points when the fraction of valid TEMPO data across the domain is less than 20 %.
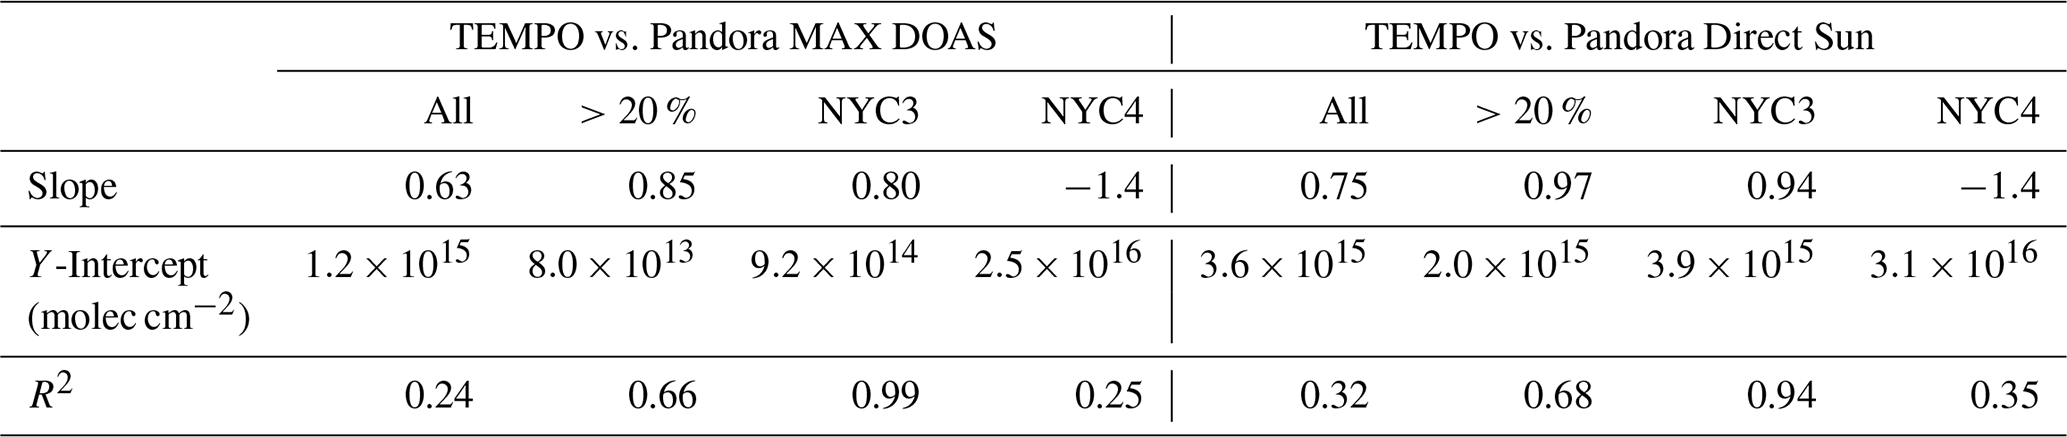
All three metrics comparing TEMPO and MAX DOAS HCHO (slope, y-intercept, and R2) improve by removing the cloudiest points or when the fraction of valid TEMPO data across the domain is less than 20 %. The cutoff value of 20 % was chosen to provide the best correlation while retaining the most data points (Fig. S8). On average, TEMPO HCHO is greater than MAX DOAS HCHO at higher concentrations. The differences between NYC3 and NYC4 are apparent where NYC3 follows the pattern of the clear sky data points and NYC4 has very little correlation to TEMPO. Similarly, removing the cloudiest of data points improves all three metrics for the TEMPO HCHO and DS HCHO comparison. The slope of 0.97 and a higher y intercept of 2.0×10¹⁵ molec cm−2 indicates a systematic difference between TEMPO HCHO and DS HCHO, not dependent on the magnitude of column HCHO. These results suggest an unidentified source of bias in either TEMPO HCHO or DS HCHO. There is also potential bias associated with the choice of domain used for the TEMPO averaging. Due to the uncertainty and noise in TEMPO HCHO retrievals, a relatively large area is required for spatial averaging. However, portions of this domain extend over the ocean where HCHO columns may be lower than what is observed by the Pandoras. This may cause a low bias in the TEMPO HCHO. According to a priori HCHO profiles provided with the TEMPO retrieval, approximately 10 %–15 % of the HCHO column should reside above the ∼3 km ceiling of the Pandora MAX DOAS retrieval.
The PGN provides long term, continuous trends of column HCHO and NO2, filling observational gaps in airborne observations and providing information under clouds where TEMPO cannot see. It is imperative to understand the strengths and limitations of the PGN, especially as it is a key component to the TEMPO validation plan and the HCHO products are relatively new and unvalidated themselves.
This evaluation includes a vertical spiral conducted by the DC-8 over the EdwardsCA Pandora monitor in southern CA and four flights that took place in and around New York City. We find that integrated HCHO columns are consistent between Pandoras and in situ airborne measurements. However, the shape of the Pandora HCHO profile is biased high near the surface (lower 0.5 km) and then biased low beneath the BL under well mixed conditions as shown in the EdwardsCA case study. This pattern of disagreement also manifests on a well-mixed day in NYC. Work is ongoing in the Pandora group to isolate and correct this artifact.
Due to the greater spatial heterogeneity of NO2, particularly in urban areas, the comparison between Pandora and other data must be taken with extra care to ensure the same space is measured. The EdwardsCA spiral showed a significant surface enhancement outside the viewing angle of the Pandora but within the horizontal range of the slant columns. Without consideration of the viewing angle, the MAX DOAS NO2 in the bottom 0.5 km is 27 % lower than the in situ tropospheric column and 15 % greater after removing the enhancement showing a similar altitude discrepancy as in HCHO. However, above this enhancement, the Pandora NO2 vertical profile is on average 55 % lower than the in situ observations. This issue is likely relevant for comparison of Pandora and TEMPO NO2, especially in urban areas. To mitigate such issues, future validation of TEMPO and Pandora NO2 should focus on more homogeneous regions, such as suburban and rural areas.
The day-to-day variability in Pandora HCHO over NYC aligns with the in situ HCHO trends, where the greatest values are observed on the first two flight days. Collectively, the ten Pandoras deployed across NYC effectively represent the relative distribution of HCHO offering context for interpreting air quality conditions and ozone exceedances. Pandoras also provide detailed information regarding spatial and diurnal variations in HCHO, such as differences between urban and coastal sites. The DS HCHO appears to be more sensitive to data availability, particularly under cloudy conditions whereas MAX DOAS HCHO exhibits lower uncertainty.
We also compared TEMPO HCHO retrievals to Pandora columns during the AEROMMA time frame. According to the current TEMPO version 3 user manual, data with a cloud fraction above 0.2 should not be used for analysis – a threshold that is more conservative than the 0.3–0.4 typically used for other satellites. As a result, data availability is limited under even moderately cloudy conditions. However, there are still continuous MAX DOAS HCHO data under partially cloudy conditions which, being observed from the ground up and through differential slant columns, is not as sensitive to the presence of clouds. When eliminating the cloudy hours (data availability <20 %) the correlation between TEMPO HCHO with Pandora MAX DOAS HCHO (R2=0.65) and DS HCHO (R2=0.70) improves. The MAX DOAS HCHO has a dependency on the magnitude of HCHO while the DS HCHO appears to have a more consistent high offset to the domain average TEMPO HCHO.
Future efforts to validate PGN data would benefit from tight coordination between the flight mission planners and the PIs of the Pandora instruments. While the PGN has guidelines for usage, individual PIs determine the frequency and schedule of each scan mode, complicating consistent comparisons between monitors. For example, some monitors prioritize short MAX DOAS scans over long scans. While this method provides more tropospheric columns to analyze, the short scans provide less detail in the full profiles. A validation plan for the MAX DOAS profiles must include long scans within 30 min of the aircraft profile. The PAA of the Pandoras is semi-fixed and usually chosen to avoid tall buildings or trees that would cause interference. Because of this the viewing angle of the Pandora is not always easy to change. Flight planners for future missions should be aware which angle the Pandoras are pointing to collect data for accurate comparisons, particularly regarding NO2. In the same vein, Pandora site selection might include consideration of air traffic restrictions. Balloon or drone-borne measurements may provide an alternative for less costly and more frequent vertical profile comparison (Bailey et al., 2024).
A clearer understanding of the Pandora data quality filtering process and quantitative uncertainties for all data products are also necessary for the broader research community. Currently, there are no official materials offering guidance on this procedure, largely due to the limited number of formal validation studies particularly on the MAX DOAS HCHO and NO2 and the DS HCHO products. Robust uncertainty estimates and transparent quality assurance procedures will enhance the scientific utility of these datasets.
Code available upon request.
All data are publicly available online at the following locations: https://csl.noaa.gov/projects/aeromma/ (last access: 10 February 2025) (AEROMMA) http://data.pandonia-global-network.org (last access: 15 July 2025) (Pandora Global Network) https://doi.org/10.5067/IS-40e/TEMPO/HCHO_L2.003 (TEMPO; NASA, 2024) .
The supplement related to this article is available online at https://doi.org/10.5194/amt-19-5539-2026-supplement.
AS prepared the manuscript with contributions from all coauthors. AS, GW, JSC, ED, JK, and ND collected ISAF data. DR, EW, and KZ collected NOy-LIF data. CG and JDD collected MMS data. BP and AP provided their expertise on the Pandora Network. AS provided guidance on using TEMPO data. GW, TC, AR contributed valuable suggestions on analysis and conclusions.
At least one of the (co-)authors is a member of the editorial board of Atmospheric Measurement Techniques. The peer-review process was guided by an independent editor, and the authors also have no other competing interests to declare.
Publisher's note: Copernicus Publications remains neutral with regard to jurisdictional claims made in the text, published maps, institutional affiliations, or any other geographical representation in this paper. The authors bear the ultimate responsibility for providing appropriate place names. Views expressed in the text are those of the authors and do not necessarily reflect the views of the publisher.
Authors thank the entire AEROMMA science team for making the airborne data collection possible through their research, flight preparations, and measurement collections. We also express our gratitude towards the Pandora team at LuftBlick, SciGlob, and NASA Goddard Space Flight Center (including Tom Hanisco) for their work in providing the Pandora data. Caroline Nowlan and Gonzalo González Abad contributed valuable advice in handling TEMPO data. Finally, we would like to recognize the EPA and PIs of all the Pandora instruments used in this study that have worked to provide data: James Podolske, Nader Abuhassan, Lukas Valin, Maria Tzortziou, James Szykman, Eric Baumann and Brooke Stutzman. CSL authors gratefully acknowledges the generous support of the NOAA NESDIS GeoXO Program, which enabled the use of the NASA DC-8 aircraft and associated costs for NASA flight crew, engineering, integration, and logistics for the AEROMMA mission.
This work was supported by the following: National Science Foundation (NSF; grant no. AGS-2023605), the NASA Tropospheric Composition program, Atmospheric Composition Campaign Data Analysis and Modeling (ACCDAM; grant no. 80NSSC21K1448), NASA UACO (NNH20ZDA001N-UACO), NOAA NA21OAR4310137, and NOAA Cooperative Agreement (NA22OAR4320151).
This paper was edited by Michel Van Roozendael and reviewed by two anonymous referees.
Abad, G. G., Nowlan, C. R., Liu, X., Wang, H., and Chance, K.: TEMPO Formaldehyde Retrieval Algorithm Theoretical Basis Document, https://asdc.larc.nasa.gov/documents/tempo/ATBD_TEMPO_CH2O.pdf (last access: 1 August 2025), 2025.
Bailey, S. A., Hannun, R. A., Swanson, A. K., and Hanisco, T. F.: A portable nitrogen dioxide instrument using cavity-enhanced absorption spectroscopy, Atmos. Meas. Tech., 17, 5903–5910, https://doi.org/10.5194/amt-17-5903-2024, 2024.
Brohede, S. M., Haley, C. S., McLinden, C. A., Sioris, C. E., Murtagh, D. P., Petelina, S. V., Llewellyn, E. J., Bazureau, A., Goutail, F., Randall, C. E., Lumpe, J. D., Taha, G., Thomasson, L. W., and Gordley, L. L.: Validation of Odin/OSIRIS stratospheric NO2 profiles, J. Geophys. Res.-Atmos., 112, https://doi.org/10.1029/2006JD007586, 2007.
Cazorla, M., Wolfe, G. M., Bailey, S. A., Swanson, A. K., Arkinson, H. L., and Hanisco, T. F.: A new airborne laser-induced fluorescence instrument for in situ detection of formaldehyde throughout the troposphere and lower stratosphere, Atmos. Meas. Tech., 8, 541–552, https://doi.org/10.5194/amt-8-541-2015, 2015.
Cede, A.: Manual for Blick Software Suite 1.8, https://www.pandonia-global-network.org/assets/manuals/BlickSoftwareSuite_Manual_v1-8-6.pdf (last access: 1 August 2025), 2024.
Cede, A.: Pandonia Global Network Data Products Readme Document, : https://www.pandonia-global-network.org/assets/manuals/PGN_DataProducts_Readme_v1-8-10.pdf (last access: 1 August 2025), 2025.
Cede, A., Herman, J., Richter, A., Krotkov, N., and Burrows, J.: Measurements of nitrogen dioxide total column amounts using a Brewer double spectrophotometer in direct Sun mode, J. Geophys. Res.-Atmos., 111, https://doi.org/10.1029/2005JD006585, 2006.
Herman, J., Cede, A., Spinei, E., Mount, G., Tzortziou, M., and Abuhassan, N.: NO2 column amounts from ground-based Pandora and MFDOAS spectrometers using the direct-sun DOAS technique: Intercomparisons and application to OMI validation, J. Geophys. Res.-Atmos., 114, https://doi.org/10.1029/2009jd011848, 2009.
Herman, J., Spinei, E., Fried, A., Kim, J., Kim, J., Kim, W., Cede, A., Abuhassan, N., and Segal-Rozenhaimer, M.: NO2 and HCHO measurements in Korea from 2012 to 2016 from Pandora spectrometer instruments compared with OMI retrievals and with aircraft measurements during the KORUS-AQ campaign, Atmos. Meas. Tech., 11, 4583–4603, https://doi.org/10.5194/amt-11-4583-2018, 2018.
Judd, L. M., Al-Saadi, J. A., Janz, S. J., Kowalewski, M. G., Pierce, R. B., Szykman, J. J., Valin, L. C., Swap, R., Cede, A., Mueller, M., Tiefengraber, M., Abuhassan, N., and Williams, D.: Evaluating the impact of spatial resolution on tropospheric NO2 column comparisons within urban areas using high-resolution airborne data, Atmos. Meas. Tech., 12, 6091–6111, https://doi.org/10.5194/amt-12-6091-2019, 2019. Judd, L. M., Al-Saadi, J. A., Szykman, J. J., Valin, L. C., Janz, S. J., Kowalewski, M. G., Eskes, H. J., Veefkind, J. P., Cede, A., Mueller, M., Gebetsberger, M., Swap, R., Pierce, R. B., Nowlan, C. R., Abad, G. G., Nehrir, A., and Williams, D.: Evaluating Sentinel-5P TROPOMI tropospheric NO2 column densities with airborne and Pandora spectrometers near New York City and Long Island Sound, Atmos. Meas. Tech., 13, 6113–6140, https://doi.org/10.5194/amt-13-6113-2020, 2020.
Kotsakis, A., Sullivan, J. T., Hanisco, T. F., Swap, R. J., Caicedo, V., Berkoff, T. A., Gronoff, G., Loughner, C. P., Ren, X., Luke, W. T., Kelley, P., Stratton, P. R., Delgado, R., Abuhassan, N., Shalaby, L., Santos, F. C., and Dreessen, J.: Sensitivity of total column NO2 at a marine site within the Chesapeake Bay during OWLETS-2, Atmos. Environ., 277, 119063, https://doi.org/10.1016/j.atmosenv.2022.119063, 2022.
Lin, Y. C., Schwab, J. J., Demerjian, K. L., Bae, M. S., Chen, W. N., Sun, Y., Zhang, Q., Hung, H. M., and Perry, J.: Summertime formaldehyde observations in New York City: Ambient levels, sources and its contribution to HOx radicals, J. Geophys. Res.-Atmos., 117, https://doi.org/10.1029/2011jd016504, 2012.
NASA: TEMPO formaldehyde total column V03 (PROVISIONAL), NASA Langley Research Center Atmospheric Science Data Center [data set], https://doi.org/10.5067/IS-40e/TEMPO/HCHO_L2.003, 2024.
Nowlan, C. R., Abad, G. G., Liu, X., Wang, H., and Chance, K.: TEMPO Nitrogen Dioxide Retrieval Algorithm Theoretical Basis Document, https://asdc.larc.nasa.gov/documents/tempo/ATBD_TEMPO_NO2.pdf (last access: 1 August 2025), 2025.
Rawat, P., Crawford, J. H., Travis, K. R., Judd, L. M., Demetillo, M. A. G., Valin, L. C., Szykman, J. J., Whitehill, A., Baumann, E., and Hanisco, T. F.: Maximizing the scientific application of Pandora column observations of HCHO and NO2, Atmos. Meas. Tech., 18, 2899–2917, https://doi.org/10.5194/amt-18-2899-2025, 2025.
Rawat, P., Travis, K. R., Henderson, B., Crawford, J. H., Judd, L. M., Demetillo, M. A. G., Lee, T. C., Flittner, D. E., Szykman, J. J., Valin, L. C., Whitehill, A., Baumann, E., Hanisco, T. F., Pandey, A., Abad, G. G., Nowlan, C. R., Liu, X., and Chance, K.: Spatiotemporal Assessment of the TEMPO Formaldehyde Column Retrieval Using the Pandonia Global Network, J. Geophys. Res.-Atmos., 131, e2025JD044788, https://doi.org/10.1029/2025JD044788, 2026.
Rollins, A. W., Rickly, P. S., Gao, R.-S., Ryerson, T. B., Brown, S. S., Peischl, J., and Bourgeois, I.: Single-photon laser-induced fluorescence detection of nitric oxide at sub-parts-per-trillion mixing ratios, Atmos. Meas. Tech., 13, 2425–2439, https://doi.org/10.5194/amt-13-2425-2020, 2020.
Scott, S. G., Bui, T. P., Chan, K. R., and Bowen, S. W.: The meteorological measurement system on the NASA ER-2 aircraft, J. Atmos. Ocean. Techno., 7, 525–540, 1990.
Sebol, A. E., Canty, T. P., Wolfe, G. M., Hannun, R., Ring, A. M., and Ren, X.: Exploring ozone production sensitivity to NOx and VOCs in the New York City airshed in the spring and summers of 2017–2019, Atmos. Environ., 324, 120417, https://doi.org/10.1016/j.atmosenv.2024.120417, 2024.
Singh, A., Ring, A. M., He, H., Allen, D. J., Dickerson, R. R., Salawitch, R. J., and Canty, T. P.: Inferring near-surface ozone production regimes: Insights from using satellite retrievals over the contiguous US, Atmos. Environ., 352, 121208, https://doi.org/10.1016/j.atmosenv.2025.121208, 2025.
Spinei, E., Tiefengraber, M., Müller, M., Gebetsberger, M., Cede, A., Valin, L., Szykman, J., Whitehill, A., Kotsakis, A., Santos, F., Abbuhasan, N., Zhao, X., Fioletov, V., Lee, S. C., and Swap, R.: Effect of polyoxymethylene (POM-H Delrin) off-gassing within the Pandora head sensor on direct-sun and multi-axis formaldehyde column measurements in 2016–2019, Atmos. Meas. Tech., 14, 647–663, https://doi.org/10.5194/amt-14-647-2021, 2021.
Szykman, J.: TROPOSPHERIC EMISSIONS: MONITORING OF POLLUTION (TEMPO)PROJECT Level 2 Science Data Product Validation Plan, https://tempo.si.edu/documents/SAO-DRD-11_TEMPO Science Validation_Plan_Baseline.pdf (last access: 1 August 2025), 2023.
Szykman, J., Pierce, B., Henderson, B., and Judd, L.: Validation and Quality Assessment of the TEMPO Level-2 Trace Gas Products, NASA Langley Research Center, Atmospheric Science Data Center, https://asdc.larc.nasa.gov/documents/tempo/TEMPO_validation_report_baseline_draft.pdf (last access: 1 August 2025), 2025.
Tzortziou, M., Loughner, C. P., Goldberg, D. L., Judd, L., Nauth, D., Kwong, C. F., Lin, T., Cede, A., and Abuhassan, N.: Intimately tracking NO2 pollution over the New York City – Long Island Sound land-water continuum: An integration of shipboard, airborne, satellite observations, and models, Sci. Total Environ., 897, 165144, https://doi.org/10.1016/j.scitotenv.2023.165144, 2023.