
the Creative Commons Attribution 4.0 License.
the Creative Commons Attribution 4.0 License.
 | 31 Aug 2026
Impact of high-volume GNSS Radio Occultation data on the Navy's global numerical weather prediction
Hui W. Christophersen

Benjamin Ruston
Dan Tyndall
This study assesses the impact of assimilating high-volume Radio Occultation (RO) data from the RO Modeling EXperiment (ROMEX) on the Navy's global operational Naval Global Environment Model (NAVGEM). A series of observing system experiments were conducted, including a control run, a standard assimilation of all ROMEX data, and two sensitivity tests: one with an empirical bias correction and another with a modified refractivity coefficient. Results indicate that while the standard assimilation of ROMEX data improved free-tropospheric moisture forecasts, it amplified existing model biases in temperature and geopotential height, leading to forecast degradation. In contrast, both sensitivity experiments led to substantial improvements in forecast skill. The empirical bias correction method proved most effective, yielding consistent forecast improvements across temperature, moisture, and geopotential height. A Forecast Sensitivity to Observation Impact (FSOI) analysis confirmed the positive contribution of all ROMEX missions, with Spire missions providing the largest total impact and COSMIC-2 showing the highest per-observation effectiveness. The findings underscore that an adjustment to the current treatment of observations was critical to fully realize the benefits of the large volume of RO observations. While the empirical bias correction delivers the greatest forecast improvements, it may obscure and reinforce persistent model biases. The refractivity coefficient adjustment offers an alternative that preserves the unbiased nature of RO observations.
- Article
(4700 KB) - Full-text XML
- BibTeX
- EndNote


Radio Occultation (RO) is a remote sensing technique that exploits the bending of radio signals as they traverse the Earth's atmosphere to retrieve highly accurate profiles of temperature, pressure, and humidity. RO tracks signals transmitted by Global Navigation Satellite Systems (GNSS) such as Global Positioning System (GPS), GLONASS, Galileo, and BeiDou, and received by a low-Earth orbiting (LEO) satellite. As the GNSS satellite sets (or rises) behind the Earth's limb from the perspective of the LEO satellite, the radio signals are refracted due to changes in atmospheric density. By analyzing the bending angle of these signals, we can reconstruct the atmospheric refractive index profile, which is then used to derive profiles of temperature, pressure, and humidity at vertical resolutions of 0.5 km in the lower troposphere (Kursinski et al., 1997). The current GNSS-RO constellation gathers measurements with near-complete global coverage daily (Anthes et al., 2024).
RO plays an important role in Numerical Weather Prediction (NWP) systems due to its ability to provide highly accurate and stable atmospheric profiles that are crucial for initializing weather models (Healy and Thépaut, 2006; Aparicio and Deblonde, 2008; Cucurull and Derber, 2008; Ruston and Healy, 2020; Samrat et al., 2025). Unlike many traditional observations, RO data are largely unaffected by cloud cover and precipitation, making it particularly valuable in data-sparse regions and challenging weather conditions. As a stable, all-weather data source, RO is a critical component of the global observing system that substantially improves forecast accuracy, especially in the stratosphere and upper troposphere.
Harnisch et al. (2013) used an ensemble data assimilation (EDA) framework to assess how GNSS RO impact scales with observation counts in the ECMWF integrated forecast system. Their result suggested GNSS RO impact increases with observation count without saturation (up to 128 000 profiles d−1), with ∼16 000 profiles delivering about half the total impact under assumed error characteristics. Using an Observing System Simulation Experiment (OSSE), Cucurull et al. (2018) found that increasing the number of assimilated RO profiles has the potential to greatly benefit NWP systems, improving both anomaly correlation and 72 h forecast skill with the addition of 12 000 COSMIC-2 refractivity profiles per day simulating both the COSMIC-2 equatorial and the COSMIC-2B polar missions. Privé et al. (2022) further concluded that information saturation remains unmet despite the addition of 100 000 RO soundings per day. In response to these findings, the International Radio Occultation Working Group (IROWG) under the Coordination Group for Meteorological Satellites (CGMS) established the RO Modeling EXperiment (ROMEX) (Anthes et al., 2024). ROMEX is a collaborative effort among various data providers, data processing centers, and NWP centers to evaluate the impact of high-volume RO data on NWP. The Naval Research Laboratory (NRL) is one of many NWP centers to independently evaluate the impact of ROMEX data on the Navy's global NWP.
This study is organized as follows: Sect. 2 describes the ROMEX data, the NWP and data assimilation system, and experiment designs. Section 3 presents the impacts of ROMEX data. The last section summarizes the findings and presents the concluding remarks.
2.1 ROMEX
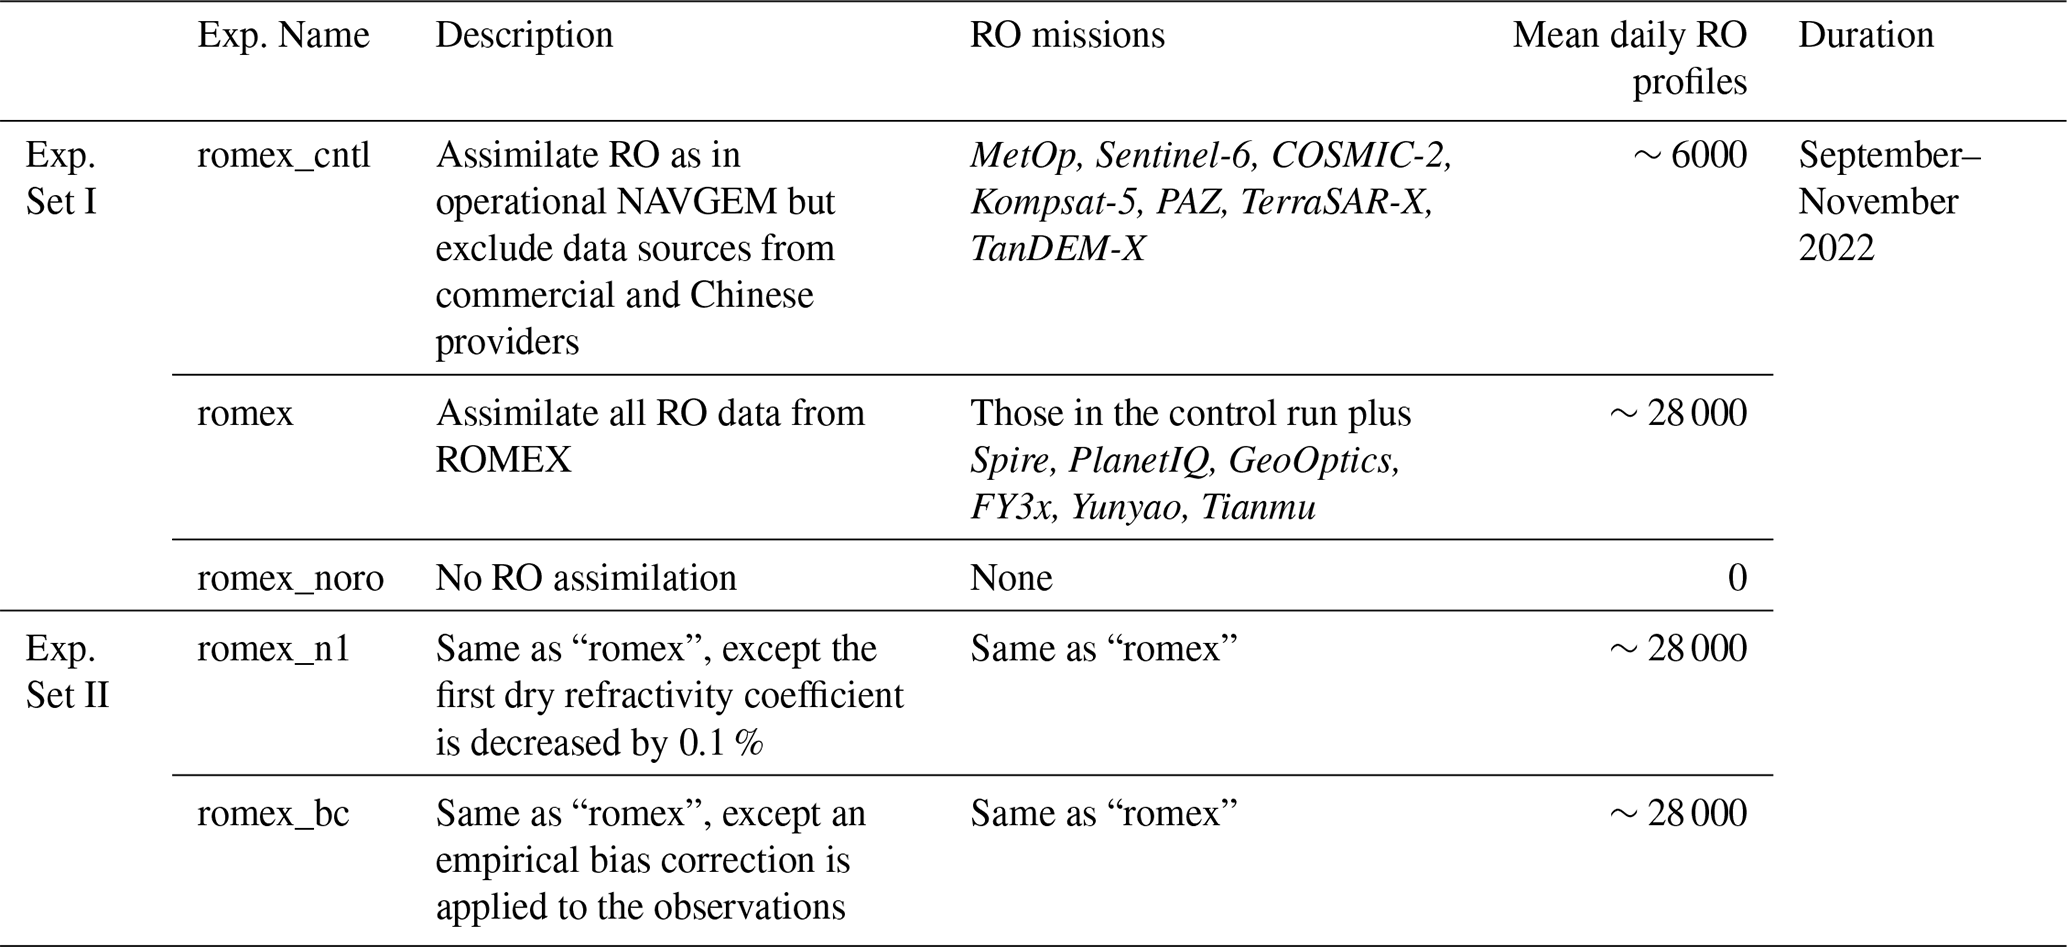
The ROMEX dataset consists of RO observations collected over a three-month period from September through November 2022. During this time, observations from all available RO missions were aggregated to create a dense global dataset. On average, approximately 30 000–40 000 RO profiles per day were obtained, representing roughly three times the number of RO observations used in operational NWP systems at that time. The dataset includes observations from both traditional government satellite missions and newer commercial RO providers. Table 1 lists all the RO missions that provide data as part of the ROMEX dataset.
ROMEX includes neutral-atmosphere profiles of bending angle and refractivity, covering the troposphere, stratosphere, and lower mesosphere. These variables are directly assimilated in many NWP DA systems and provide high-vertical-resolution information with global coverage and minimal bias. Further details on ROMEX can be found in Anthes et al. (2024).
2.2 NAVGEM and its Data Assimilation System
The operational Naval Global Environment Model (NAVGEM; Hogan et al., 2014) at T681L60 (∼19 km horizontal resolution with a model top at 0.04 hPa) was employed for this study. NAVGEM's data assimilation (DA) system is a dual-space strong constraint four-dimensional variational (4DVar) hybrid system (Kuhl et al., 2013; Rosmond and Xu, 2006; Daley and Barker, 2000). The DA system routinely ingests about 4 million observations for each 6 h DA cycle (Stone et al., 2020; Frolov et al., 2020). These observations include conventional sources such as radiosondes, aircraft, buoys, and ships, as well as satellite-derived atmospheric motion vectors and ocean surface winds. Additionally, satellite radiance data from various microwave (MW) and infrared (IR) sensors are used, along with ozone retrievals, GNSS RO and ground-based zenith total delay (Christophersen et al., 2023). The operational DA system also routinely ingests government procured commercial RO data from Spire and PlanetIQ.
GNSS RO bending angles are assimilated using a 1D variational approach that utilizes forward, tangent linear and adjoint models from the EUMETSAT Radio Occultation Processing Package (ROPP; Culverwell et al., 2015). No vertical thinning is applied to the RO bending angle assimilation. Details of the quality control procedures are provided in Bowler et al. (2026), while the observation error specification is described in Ruston and Healy (2020).
2.3 Experiment Design
Two sets of experiments were conducted (Table 1). In the first set, the control run excludes RO data from commercial providers (Spire, GeoOptics, PlanetIQ), and Chinese providers (Tianmu, Yunyao, and FengYun series) (romex_cntl). The ROMEX experiment (romex) assimilates the full ROMEX dataset. An additional experiment, romex_noro, was also performed in which all RO observations were excluded from assimilation. The second set consists of two modified ROMEX sensitivity experiments: one employing a simple empirical bias correction scheme applied to the observation (romex_bc), and the other adjusting the dry refractivity coefficient in the forward operator used to compute refractivity (romex_n1).
Specifically, the empirical bias correction was derived from statistics across the entire 3-month ROMEX background-normalized innovations, where innovation is defined as the difference between the satellite observation (O) and the model's first guess (B) from either the romex or romex_cntl experiment. A simple bias correction model was constructed using linear interpolation between several hinge points in the vertical. For each bending angle observation, a small correction (y′), expressed as a function of impact height (h) in Eq. (1), was subtracted.
Figure 1 illustrates this empirical bias correction model. Although a large negative bias in the innovations is apparent above an impact height of 40 km, we applied only a small correction to these observations. The observations at these altitudes have relatively large prescribed observation errors (Ruston and Healy, 2020), hence they are expected to have a limited impact on the analysis. The empirical model primarily focuses on corrections in the core region (right panel of Fig. 1) and in the atmospheric boundary layer.
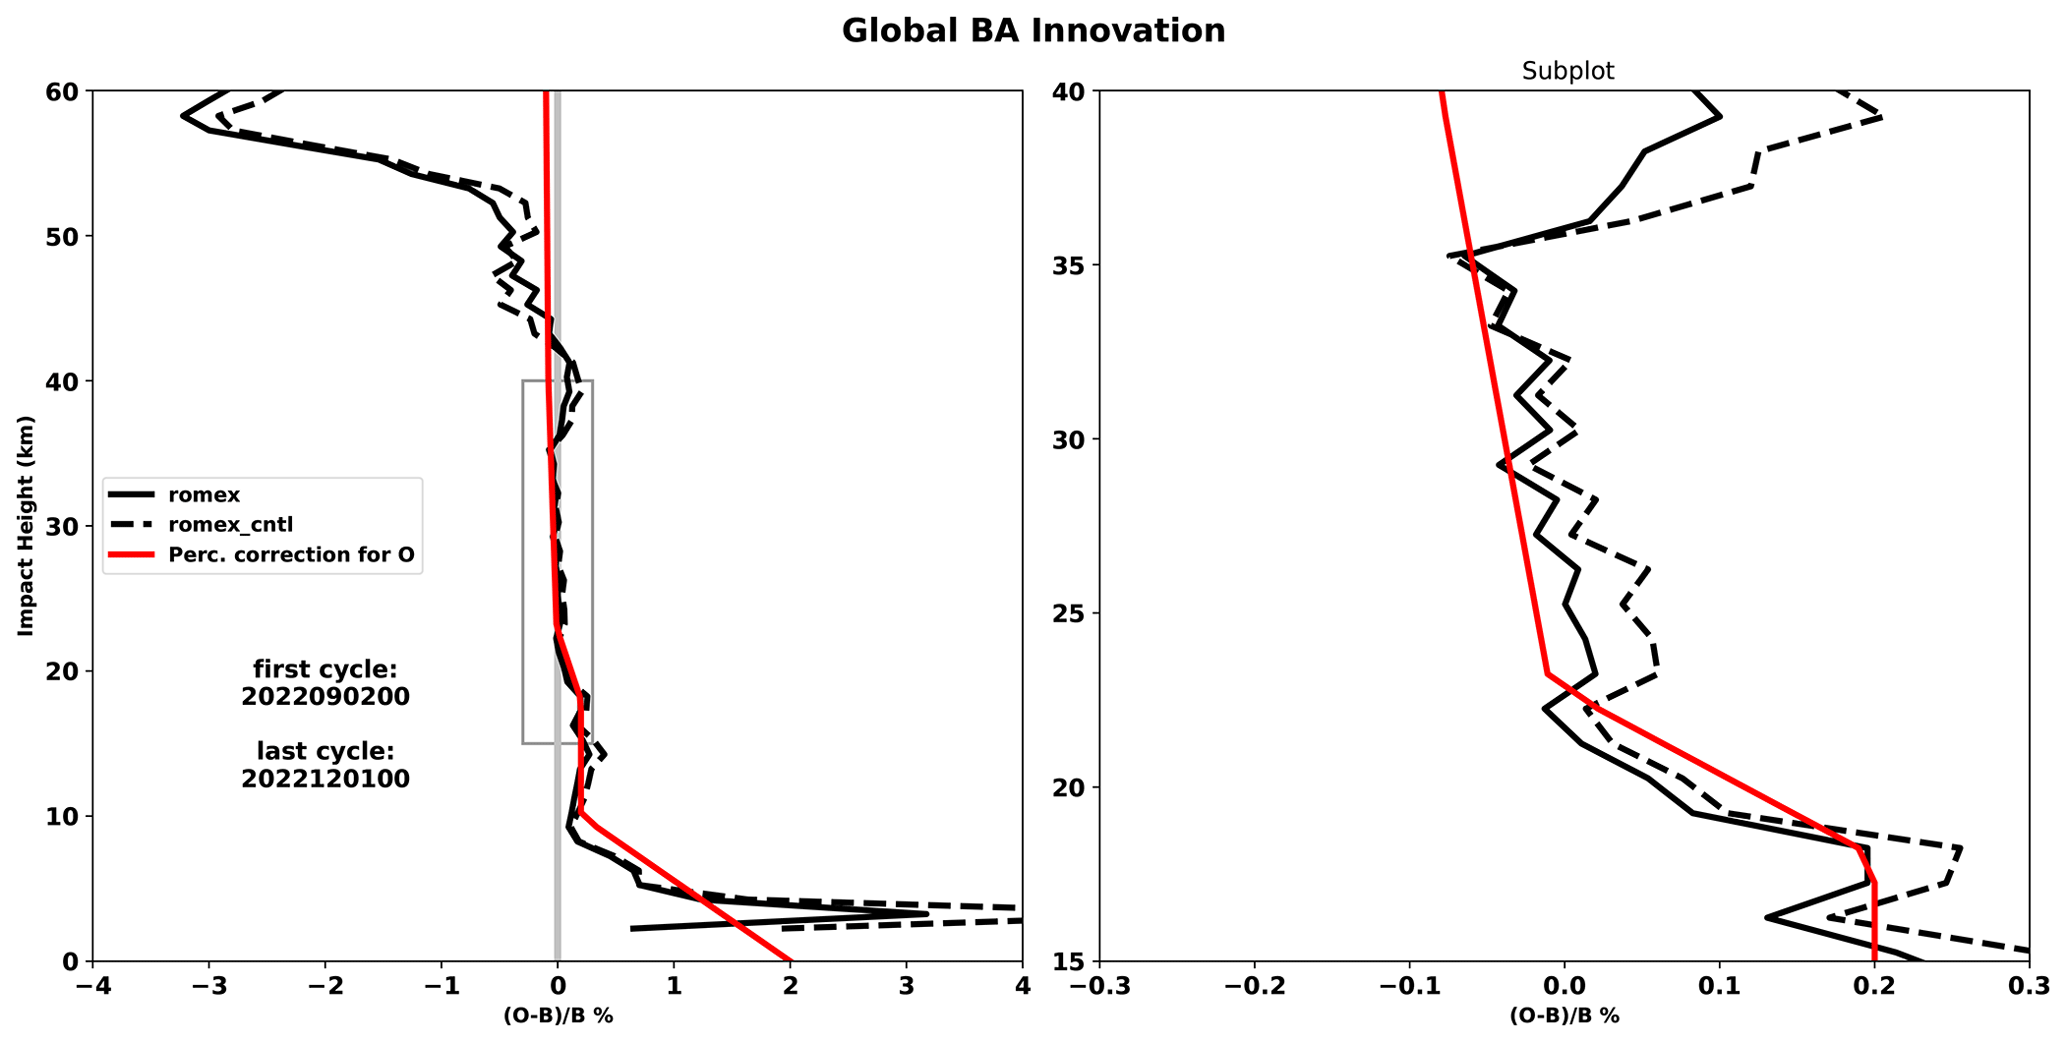
Figure 1Global bending angle normalized innovation for the ROMEX experiment (“romex”) and the control experiment (“romex_cntl”) as a function of impact height. The empirical bias correction model derived from all ROMEX RO bending angle observations is also shown (red lines). The right panel shows a subplot of the left panel for impact heights between 15 and 40 km (grey box in the left panel).
In the romex_n1 experiment, we performed a sensitivity study on the forward simulation of atmospheric refractivity (N). This was done by reducing the first refractivity coefficient (k1) by 0.1 %, changing its value from the standard 77.643 K hPa−1 to . The refractivity (N) is then calculated using the formula established by Smith and Weintraub (1953):
where Pd and Pv represent the partial pressure of dry air and water vapor, respectively, within a volume of moist air. T denotes the temperature in Kelvin. The standard coefficient values used in ROPP are , , and (Culverwell et al., 2015).
All experiments were initiated using the operational NAVGEM satellite bias correction coefficients and restart files valid at 00:00 UTC on 1 September 2022. All experiments end at 00:00 UTC on 2 December 2022. As such, all the DA cycles from 1 September–30 November 2022 except the initial cold start cycle were included in the statistical analysis.
3.1 Bending angle innovation characteristics
We first examined the characteristics of innovation profiles in all the experiments. Figure 2 presents the global bending angle innovations normalized by the background bending angles and by the estimated observation uncertainties as a function of impact height for the three ROMEX experiments from 06:00 UTC 1 September to 00:00 UTC 1 October 2022. This analysis is a critical first step in diagnosing systematic biases between the observations and the model.
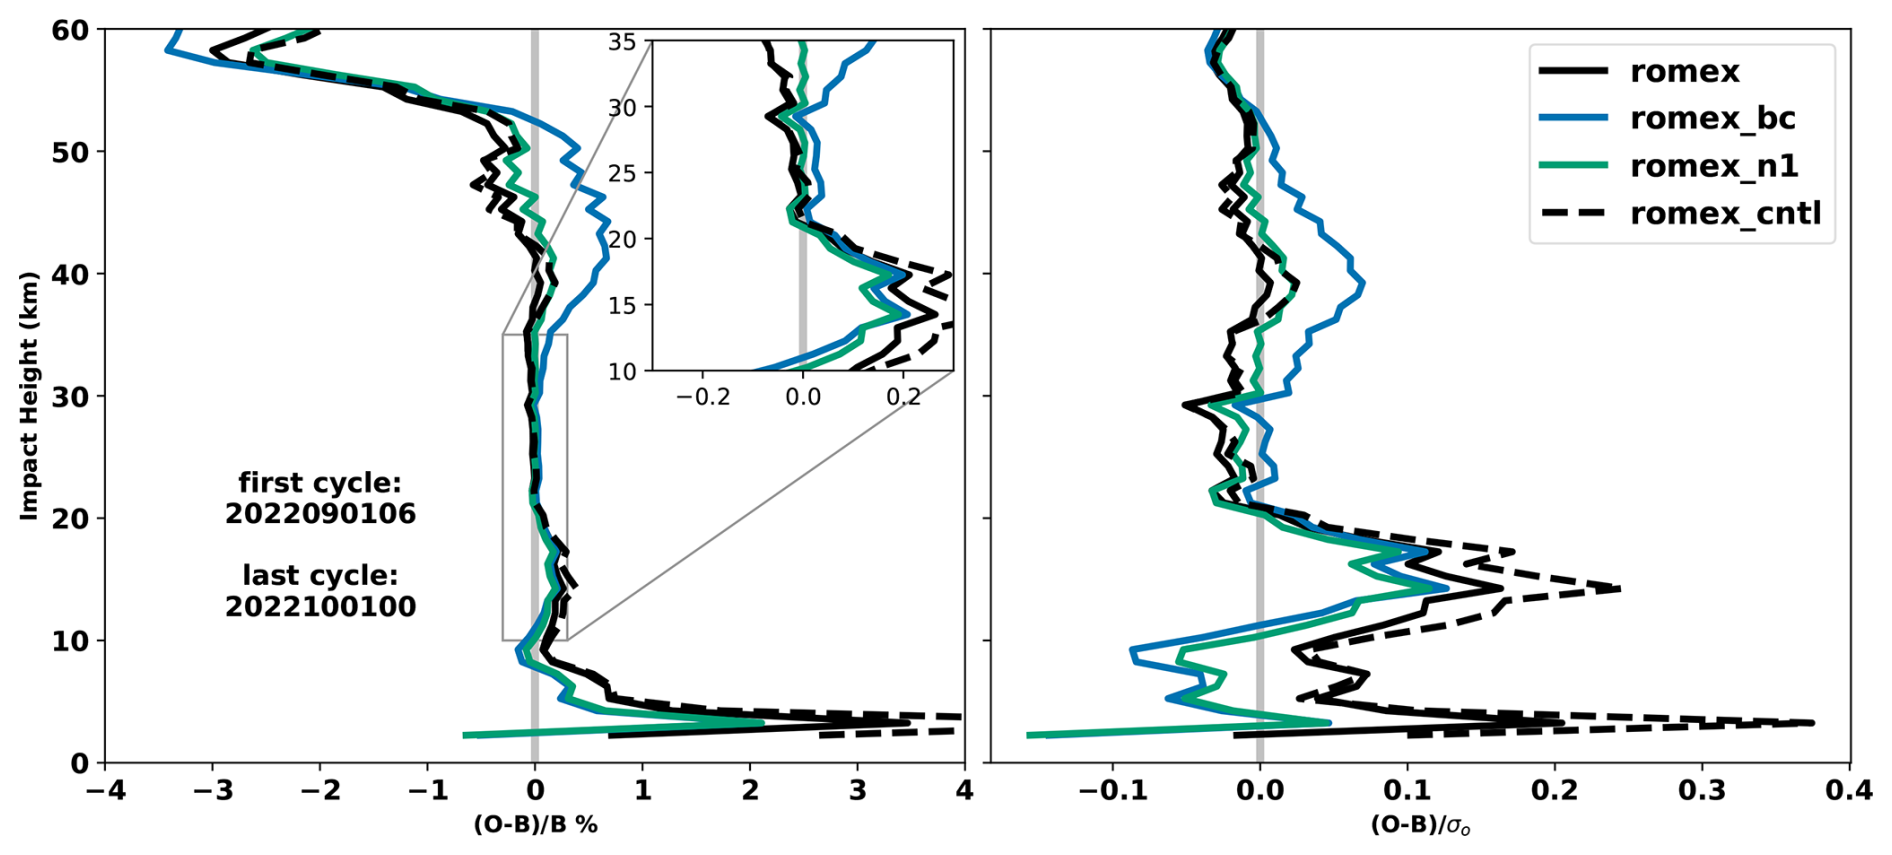
Figure 2Global bending angle innovation normalized (a) by the background (B) and (b) by the observation error (σo) for the ROMEX experiment (“romex”), bias-corrected ROMEX experiment (“romex_bc”), adjusting refractivity coefficient ROMEX experiment (“romex_n1”), and the control experiment (“romex_cntl”) as a function of impact height.
Overall, the normalized mean innovation ( remains close to zero between approximately 10 and 35 km, indicating that the model background fields are largely unbiased relative to the observations within this altitude range. However, noticeable differences among the experiments appear between roughly 35–50 km. At these higher altitudes, the mean innovations from the romex_bc experiment exhibit a larger positive bias compared to the romex and romex_n1 experiments, suggesting that the empirical observation bias correction may introduce a systematic bias in this region. In contrast, the romex_n1 experiment produces mean innovations that remain closer to those of the romex experiment while showing a slightly reduced bias, particularly above 35 km, but also from 10–35 km (Fig. 2, inset in the left panel), a critical region as the observation uncertainties are lowest in this region. In the lower troposphere (below approximately 10 km), all experiments exhibit larger positive innovations and increased variability. This behavior is expected due to the stronger influence of moisture, multipath effects, and representativeness errors in RO observations at low altitudes. Although differences between experiments are present, they are relatively small compared to the overall variability in this region.
The normalized innovation standard deviation ( (σo represents the observation error) provides an indication of consistency between observation and instrument error specifications within the data assimilation system. Ideally, when properly normalized, these values should remain close to zero mean with unity variance. The results (Fig. 2, right panel) show generally small variability throughout most of the vertical column, suggesting that the observation error specification is broadly consistent across experiments. However, romex_bc shows slightly larger deviations between approximately 35 and 45 km, implying that the correction may introduce additional noise or misrepresentation of background uncertainty. In general, the romex experiment shows larger innovation standard deviations below 15 km compared with both romex_bc and romex_n1.
Overall, this suggests that use of the ROMEX observations with the current ROPP forward operator may accentuate small systematic biases, a finding that will further be substantiated in our evaluation of impact on the analysis and short-range forecasts. To remove the small bias and ensure successful assimilation, we processed the data using either an empirical bias correction or a refractivity coefficient adjustment.
3.2 Impact on analysis and short-range forecasts
We then investigated the respective impact from the assimilation of ROMEX observations on model background by examining how well the model first guesses fit to independent data such as radiosondes, commonly also known as fit-to-observations (fit2obs) (e.g. Duncan et al., 2022). Background fit2obs assesses how well observations improve or degrade short-range (6 h) forecasts. A reduction in the standard deviation of these background departures indicates that the model's background forecast has become more accurate. This improvement is a direct result of assimilating the new ROMEX observations. We evaluated the fit2obs analysis on global radionsonde observations from September to November 2022. The performance is evaluated for four radiosonde variables: temperature (T), pseudo relative humidity (PRH), and the U- and V-components of wind. PRH is an analysis moisture variable used in the NAVGEM DA system, computed as specific humidity scaled by the saturation specific humidity using the background temperature at the observation location and time (Dee and Da Silva, 2003).
Figure 3 illustrates the impact of the different experiment configurations on the model's background forecast, showing the normalized standard deviation of the background departure from radiosonde observations across various pressure levels. The romex_bc and romex_n1 experiments consistently demonstrate significant forecast improvements, with their normalized standard deviations staying well below the 100 % baseline for most of the atmosphere. This indicates a marked reduction in forecast error, particularly for temperature at nearly all pressure levels and for PRH between 300 and 700 hPa. Both experiments also show better fit to radiosonde winds at tropospheric levels between 250 and 850 hPa, but the improvements for upper-level radionsonde winds above 200 hPa are smaller in the romex_bc and romex_n1 experiments compared to the romex experiment.
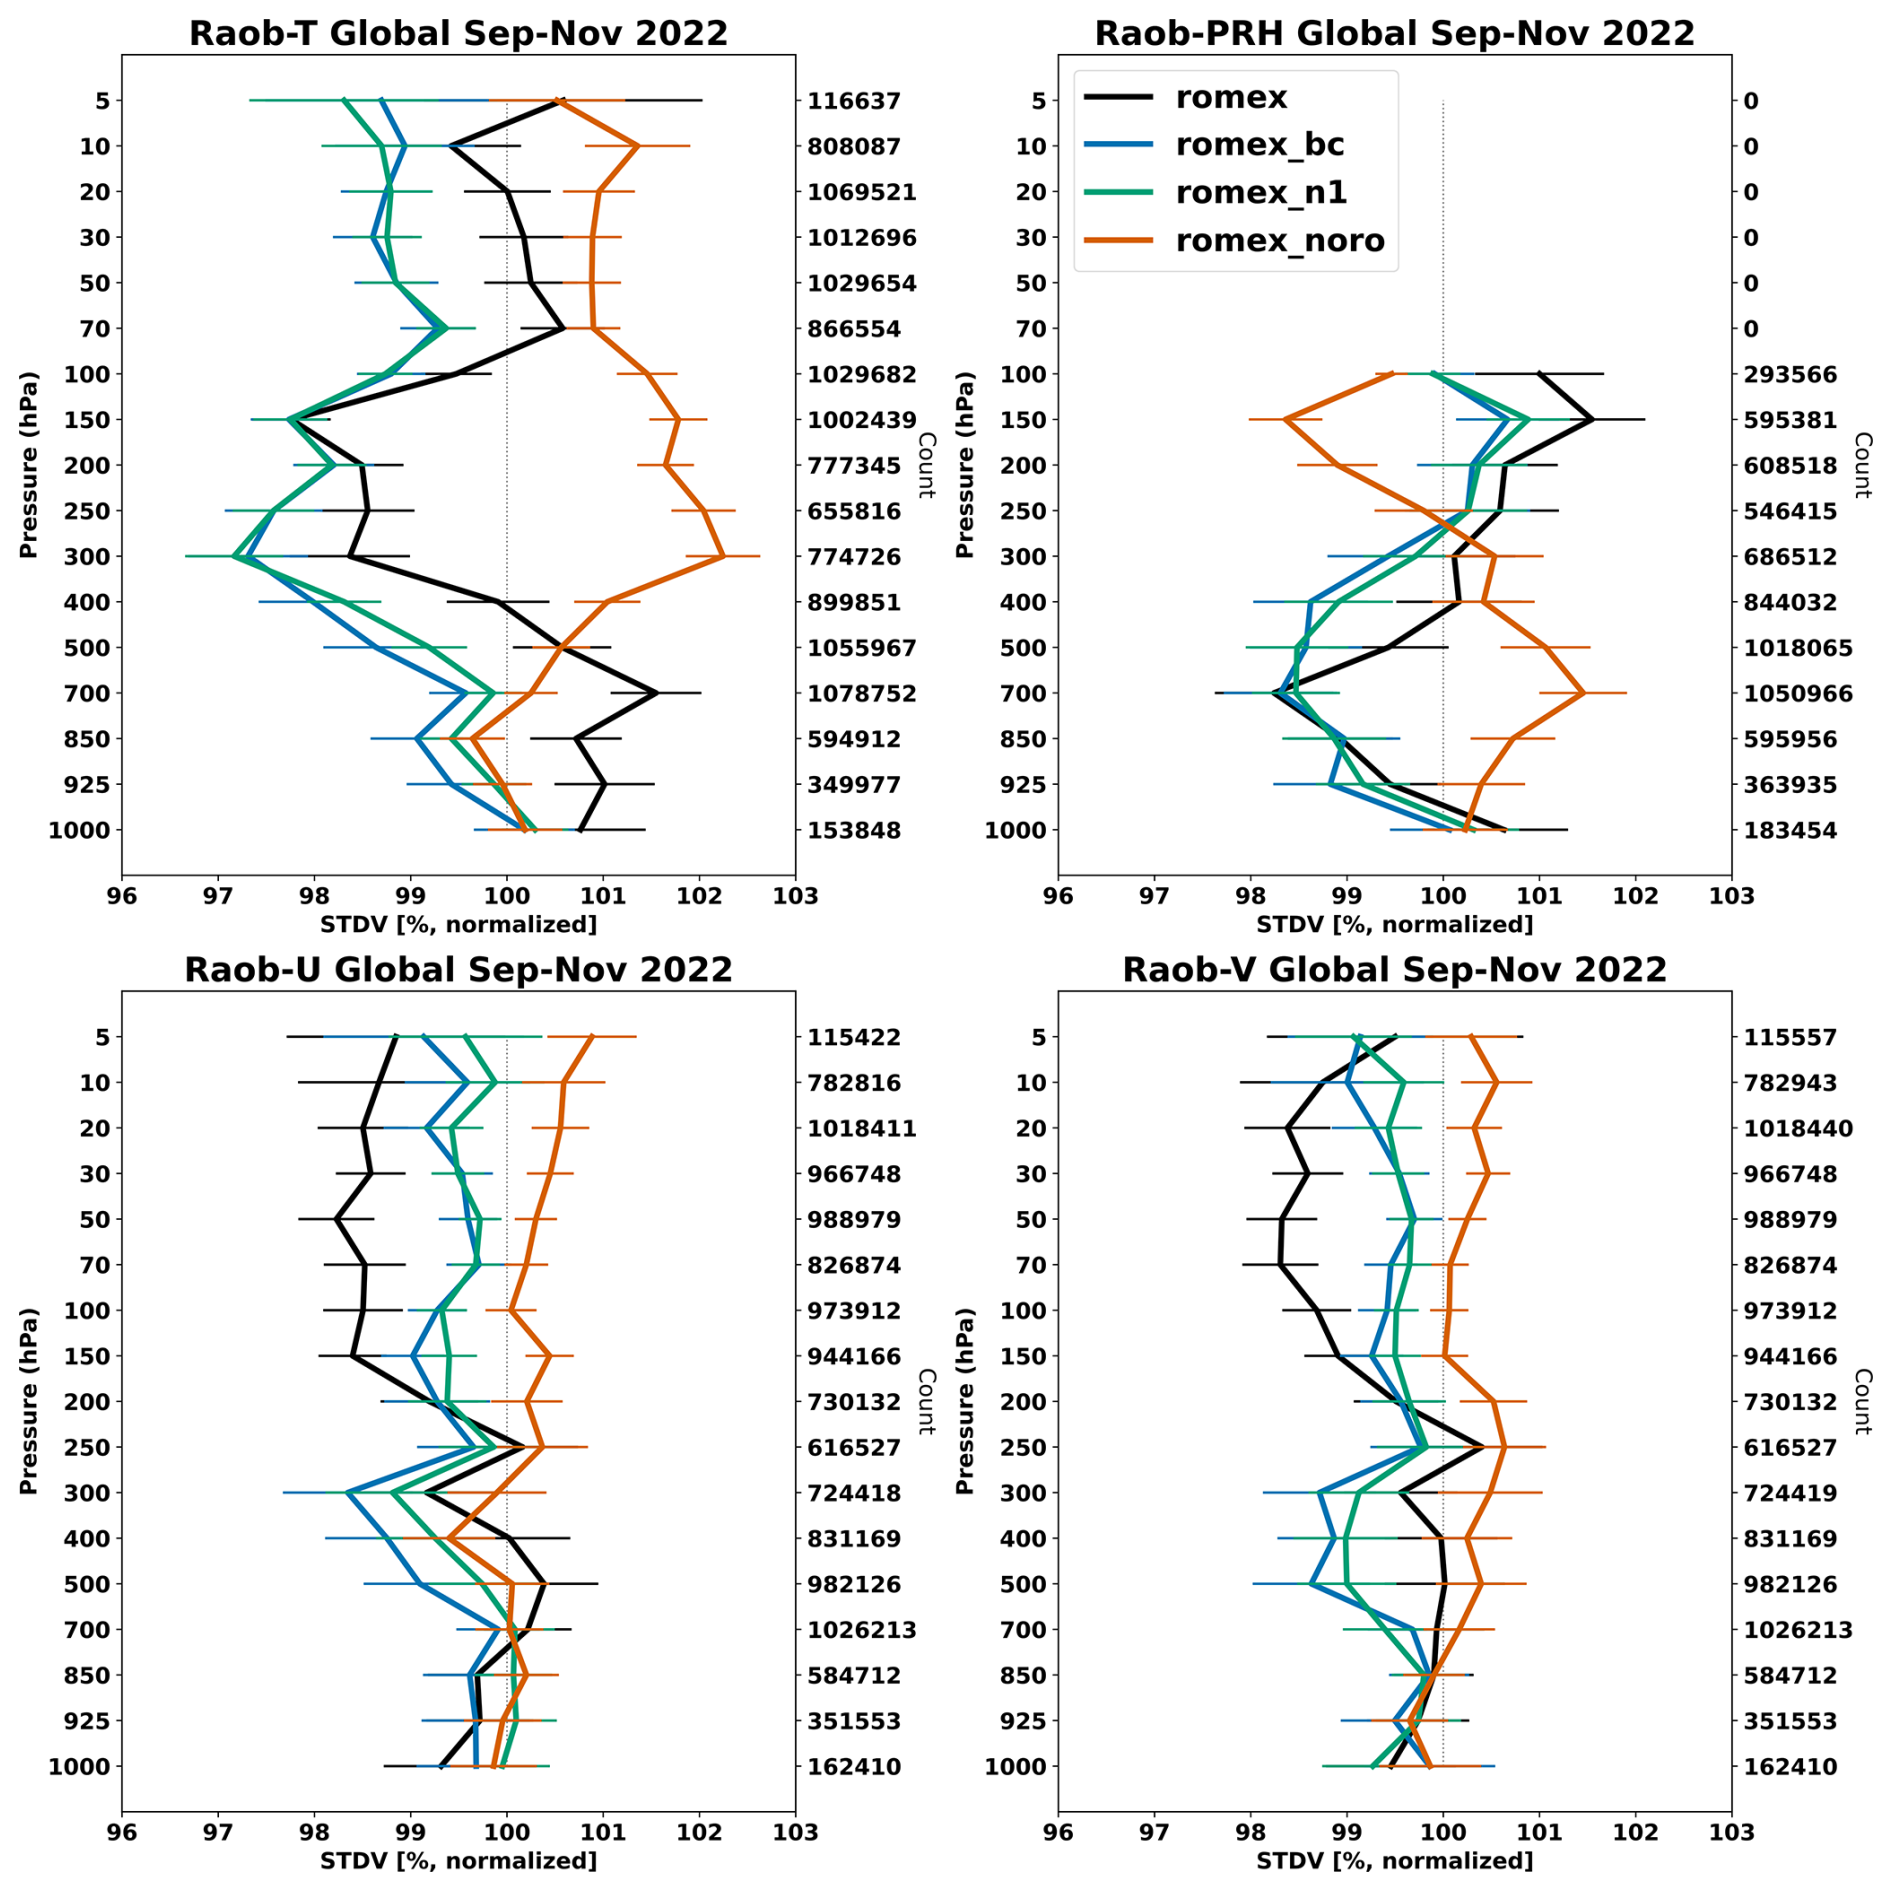
Figure 3Change in standard deviation of observed minus background for radiosondes temperature, pseudo relative humidity (PRH), and zonal and meridional wind for ROMEX (“romex”), bias-corrected romex (“romex_bc”), adjusting the first refractivity coefficient ROMEX experiment (“romex_n1”), and the one without RO data (“romex_noro”) experiment relative to the ROMEX control experiment (“romex_cntl”) from September–November 2022. The number of observations is indicated on the vertical axis to the right, and the horizontal bars represent the 95 % significance level.
The romex experiment shows more mixed improvements. Improvements are found in the model background for temperature at 100–400 hPa, PRH at 400–925 hPa, and winds at pressure levels below ∼250 hPa. Outside these vertical regions, the romex experiment exhibits mostly neutral impacts or slight degradations in the background fields. The degradation in the PRH above ∼250 hPa may be attributed to the use of PRH as analysis variables in the DA system (Baker et al., 2017), or simply model stratospheric moisture error.
It is worth noting that the romex_noro experiment, which excludes the assimilation of RO data, consistently results in a negative impact on the forecast accuracy. It shows significant degradation across all variables, as expected, confirming the critical positive contribution of RO data to the model's predictive skill.
The impact of ROMEX observation assimilation is further examined by the forecast sensitivity to observation impact (FSOI; Langland and Baker, 2004; Baker et al., 2022). FSOI uses a moist total energy norm that includes wind components, temperature, and specific humidity, integrated over all model vertical levels from the surface to the model top using pressure- or mass-weighted integration consistent with the model discretization. This yields a vertically integrated metric combining kinetic energy, dry static energy, and moisture contributions. The forecast error reduction is evaluated by comparing a 30 h background forecast and a 24 h initialized forecast, with both errors defined relative to the corresponding verifying analysis. The forecast error reduction is calculated in model state space at the verification time and is propagated backward to the assimilation time using the model adjoint. Finally, the sensitivities are projected into observation space via the adjoint of the observation operator, allowing the observation impact to be quantified as a direct contribution to the reduced forecast error. Larger FSOI values here indicate larger beneficial impact, meaning that the observation contributed to improving the forecast.
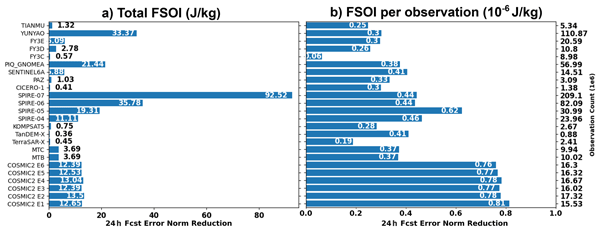
Figure 4 depicts both the cumulative impact of all RO observations as well as per-observation FSOI from the romex_n1 experiment. All ROMEX missions contribute positively to reducing forecast error. Note the right-hand y-axis of Fig. 4b contains the total observation counts over the study period. The Spire missions are grouped into families by satellite generation using receiver ID ranges: Spire-04 (99–102), Spire-05 (103–117), Spire-06 (118–125) and Spire-07 (126–169). The groupings correspond to different Spire satellite generations (mission families) with similar instrument characteristics. Spire-07 provides the largest contribution. Spire-05 (receiver range 103–117) exhibits a noticeably higher per-observation FSOI compared to other Spire groups and most other satellite systems (except COSMIC-2). While the zonal mean and standard deviation of normalized innovations for Spire-05 are qualitatively similar to those of other Spire groups, the zonal distribution for Spire-05 shows some differences, including greater coverage over the Southern Hemisphere and lower latitudes. Additionally, the global mean of normalized innovations for Spire-05 in the lower troposphere is slightly higher than for other Spire groups. We believe this, along with generally larger values of the FSOI error norm in the lower latitudes for Spire-05, may contribute to its higher per-observation FSOI. Overall, the Spire observations are cumulatively highest in number, and therefore account for the largest total beneficial impact. Among the Chinese providers, YUNYAO contributes the largest total beneficial impact. COSMIC-2 missions also provide a substantial beneficial contribution to the forecast system.
When the impact is normalized by the number of observations (Fig. 4b), the per-observation FSOI is relatively consistent across the different RO missions. The FY3C is at the lower end in terms of per-observation FSOI impact, and the bulk of RO missions lie in an approximate range of 0.3–0.45 × 10⁻⁶ J kg−1. This indicates comparable effectiveness at the individual observation level for the NAVDAS-AR system, which uses an RO receiver agnostic quality control and error model. However, the six COSMIC-2 receivers exhibit the largest per-observation FSOI among all the missions considered. Figure 4 shows the results of the romex_n1 experiment, but the FSOI characteristics for other romex experiments are similar. All experiments provide consistent evidence that assimilating the ROMEX data is beneficial for NWP.
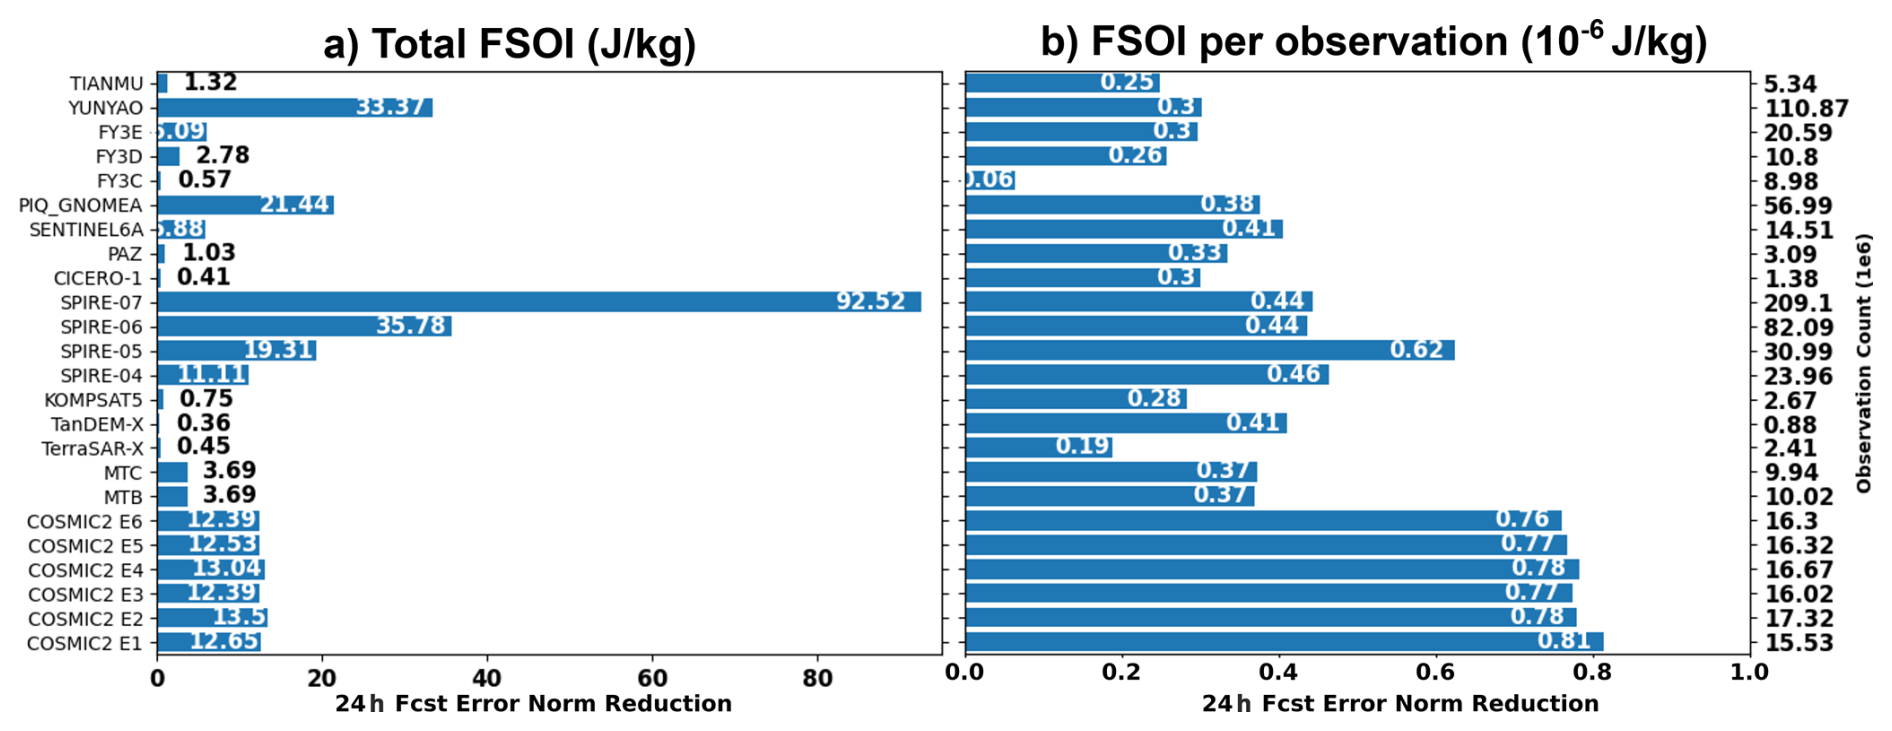
Figure 4(a) Total forecast sensitivity to observation impact (FSOI, J kg−1) and (b) per-observation FSOI for all the ROMEX missions from September to November 2022 from the romex_n1 experiment. Spire instrument receiver IDs are grouped as follows: Spire 04 (99–102), Spire 05 (103–117), Spire 06 (118–125), and Spire 07 (126–169).
3.3 Impact on medium-range forecasts
To assess medium-range forecast skill, we used our ROMEX-enhanced data assimilation and forecasting system to evaluate the percentage reduction in root-mean-square error (RMSE) for key variables (geopotential height, temperature, and specific humidity) relative to the control experiment, verified against operational ECMWF analyses. These forecast RMSE differences are evaluated as a function of forecast lead time and pressure for three latitude bands: Southern Hemisphere (SH, 20–80° S), tropics (TR, 20° S–20° N), and Northern Hemisphere (NH, 20–80° N). Although we also examined additional verification metrics, including forecast standard deviation and anomaly correlation, they yielded qualitatively similar conclusions. Therefore, for clarity and brevity, we focus on RMSE results in the following discussion.
Figure 5, from top to bottom, depicts the RMSE reduction (%) for geopotential height forecasts in the romex, romex_bc, and romex_n1 experiments relative to the romex_cntl experiment, verified against ECMWF analyses. Figure 6 complements this analysis by showing vertical profiles of the mean geopotential height analysis differences relative to ECMWF for each experiment and region. The romex experiment, the upper panels of Fig. 5, exhibits statistically significant degradation (>3 %) of the geopotential height forecast skill across most regions and forecast lead times, particularly in the mid- to upper troposphere. In the TR and NH, this degradation increases with forecast lead time, suggesting a systematic positive bias that grows during the forecast integration. This behavior is consistent with the analysis statistics shown in Fig. 6. All experiments exhibit a generally positive geopotential height bias relative to ECMWF analyses; however, the romex experiment further amplifies this positive bias relative to the control run at the analysis time across nearly all regions and throughout much of the troposphere and lower stratosphere. Further, the lower panels of Fig. 6 show that the romex experiment degrades the analysis against the control, with both the romex_n1 and romex_bc in general providing benefit by this measure. The bias in the romex experiment is particularly pronounced in the mid-troposphere of the NH (∼5 m), indicating that the standard assimilation in the romex experiment that increases the RO impact by sheer volume of observations introduces a persistent overestimation of geopotential height. However, while the bias is systematic and warrants attention, its bias magnitude remains within the uncertainty of many contemporary radiosonde geopotential height measurements, particularly those from radiosonde systems that do not use GPS for geolocation (e.g., Ingleby, 2017).
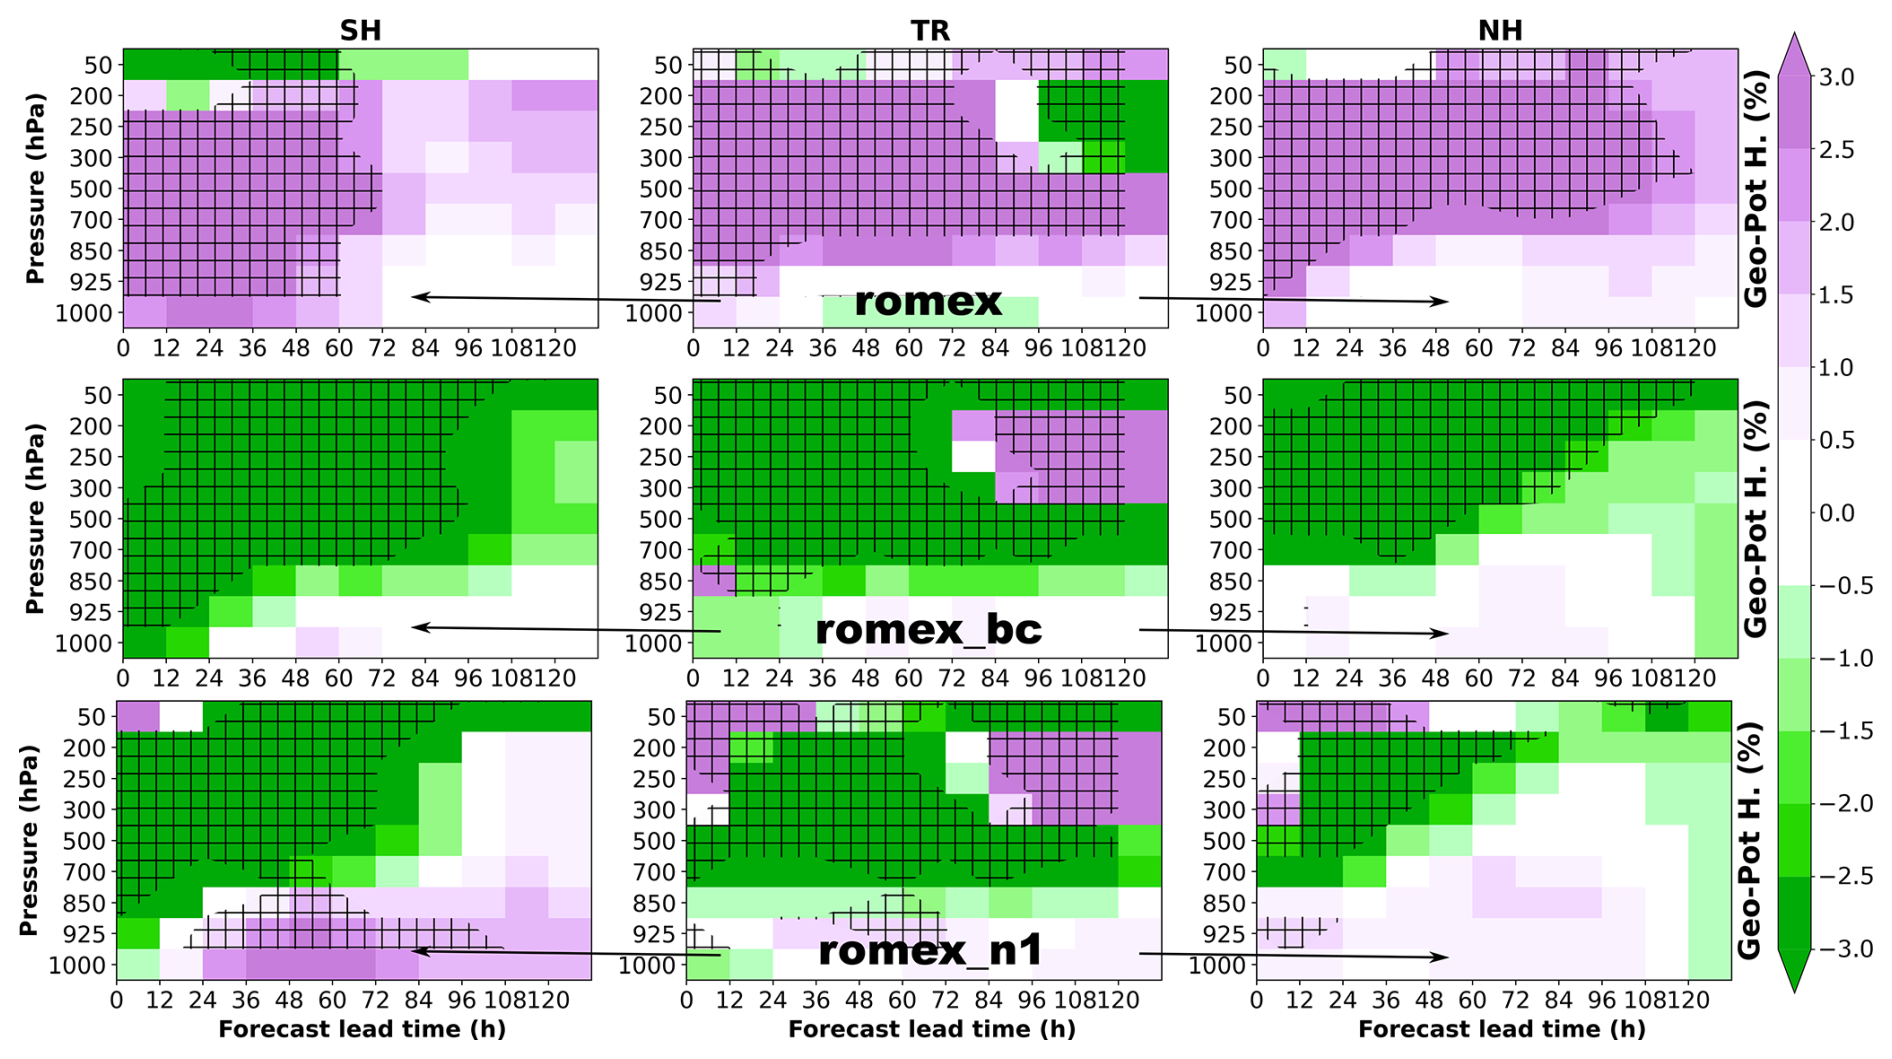
Figure 5Percentage change in root-mean-square-error (RMSE) reduction for geopotential height forecasts in the “romex”, “romex_bc”, and “romex_n1” experiments relative to the control, verified against ECMWF analyses for September-November 2022. Forecast RMSE is computed every 12 h for the control and comparison experiment at three distinct regions: Southern Hemisphere (SH, 20–80° S), tropics (TR, 20° S–20° N), and Northern Hemisphere (NH, 20–80° N). Green shading indicates improved forecast skill from the assimilation of ROMEX observations, while purple shading signifies degraded skill. Hatched areas denote impacts that are statistically significant at the 95 % confidence level.
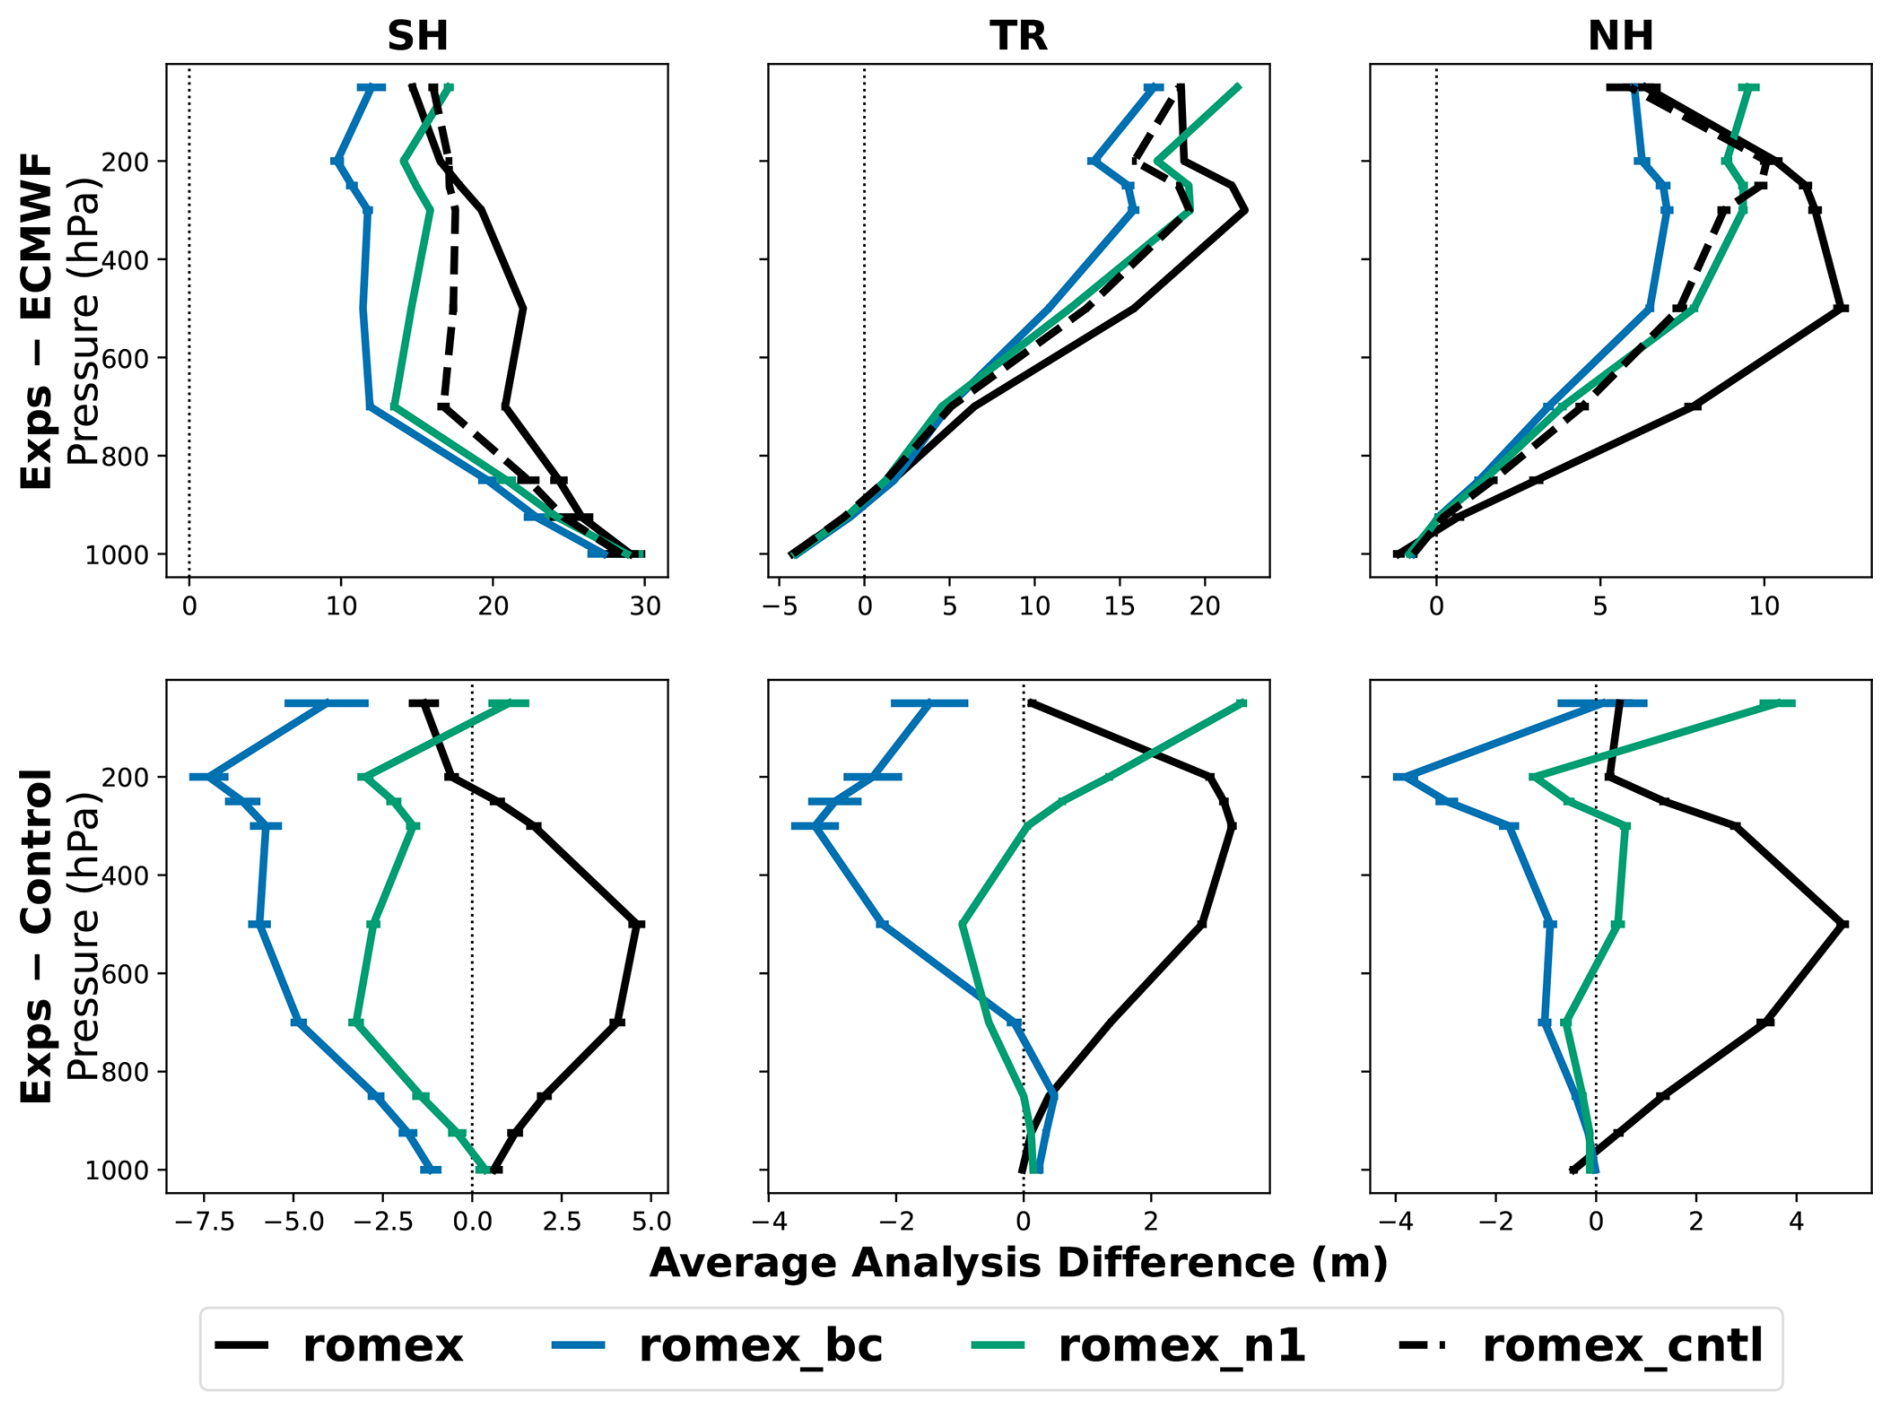
Figure 6(Top) Mean geopotential height analysis bias (units: m) between each romex experiment (romex, romex_bc, romex_n1) and ECMWF analyses, (bottom) and between each romex experiment and the control run. Statistics are computed using analyses initialized at 00:00 and 12:00 UTC from 1 September–30 November for the southern hemisphere (SH), tropics (TR) and northern hemisphere (NH). Error bars indicate the 95 % confidence interval estimated using a two-sample t-test accounting for lag-1 autocorrelation (Wilks, 2011, 145–149). Note that the x-axis range in the top panel differs from that in the bottom panel.
Applying the empirical bias correction (romex_bc) substantially alters this influence of the RO observations on the analysis and forecast. In Fig. 5, the widespread forecast degradation seen in the romex experiment is largely reduced or reversed, especially in the troposphere. Improvements of more than 3 % dominate many regions, particularly in the SH and TR, and the statistically significant areas indicate that these improvements are robust over large portions of the forecast period. Figure 6 further confirms this shift: romex_bc reduces the positive geopotential height bias at the analysis time relative to the control run across most pressure levels and regions. This reduction in analysis bias likely contributes to the improved forecast skill seen in the RMSE statistics. By nature, the empirical bias correction does not differentiate between a persistent bias in the observation and one in the background forecast. Therefore, the romex_bc would also bring the observation closer to a systematic model bias. Overall, the romex_bc experiment demonstrates a systematic improvement over the romex_cntl baseline across the majority of evaluated metrics.
The romex_n1 experiment yields a net positive impact, performing better than the romex experiment but falling short of the gains seen in romex_bc. Notably, while the response is largely positive, it introduces a few isolated negative impacts. In Fig. 5, the geopotential height differences are generally smaller in magnitude compared to romex, and broadly more consistent with the romex_bc experiment. The romex_n1 experiment does introduce a mix of improvements and degradations depending on region, pressure level, and forecast lead time. Slight degradation is observed in the SH at pressures of 850 hPa and higher, at early lead times in the NH, and at 50 hPa, particularly within the first 48 h. The vertical profiles in Fig. 6 support this interpretation: romex_n1 reduces the analysis bias relative to the control experiment, but increases this analysis bias above 200 hPa in TR and NH. This suggests that the modified refractivity coefficient used in romex_n1 can help demonstrate a positive impact of ROMEX observations on analyses and forecasts, but may not be sufficient to fully offset large model biases. This is consistent with the idea that an adjustment of the refractivity coefficient used in the romex_n1 experiment acts directly on the observation and can be used to diagnose model biases.
Regional differences are also evident. The SH shows relatively larger sensitivity to the experiment configuration, especially in the upper troposphere and lower stratosphere. This reflects the greater relative influence of satellite observations in observational data-sparse regions. In contrast, the TR exhibits strong vertical gradients in the geopotential height differences, with the largest discrepancies occurring in the mid-troposphere. The NH displays more moderate changes, likely due to the stronger constraint provided by dense conventional observations.
Temperature results show a similar relationship between analysis bias and forecast impact. The romex experiment shows statistically significant degradation in temperature forecasts throughout much of the troposphere (upper panels of Fig. 7). Only limited improvements are observed during the first 24 h of forecast lead time above 250 hPa across all regions. The analysis statistics shown in Fig. 8 indicate that, with respect to ECMWF, the NAVGEM temperature analysis exhibits a pronounced warm bias in the lower troposphere and a cold bias aloft. The romex experiment further amplifies these existing temperature biases relative to the romex_cntl throughout much of the tropospheric column, consistent with the degraded forecast performance.
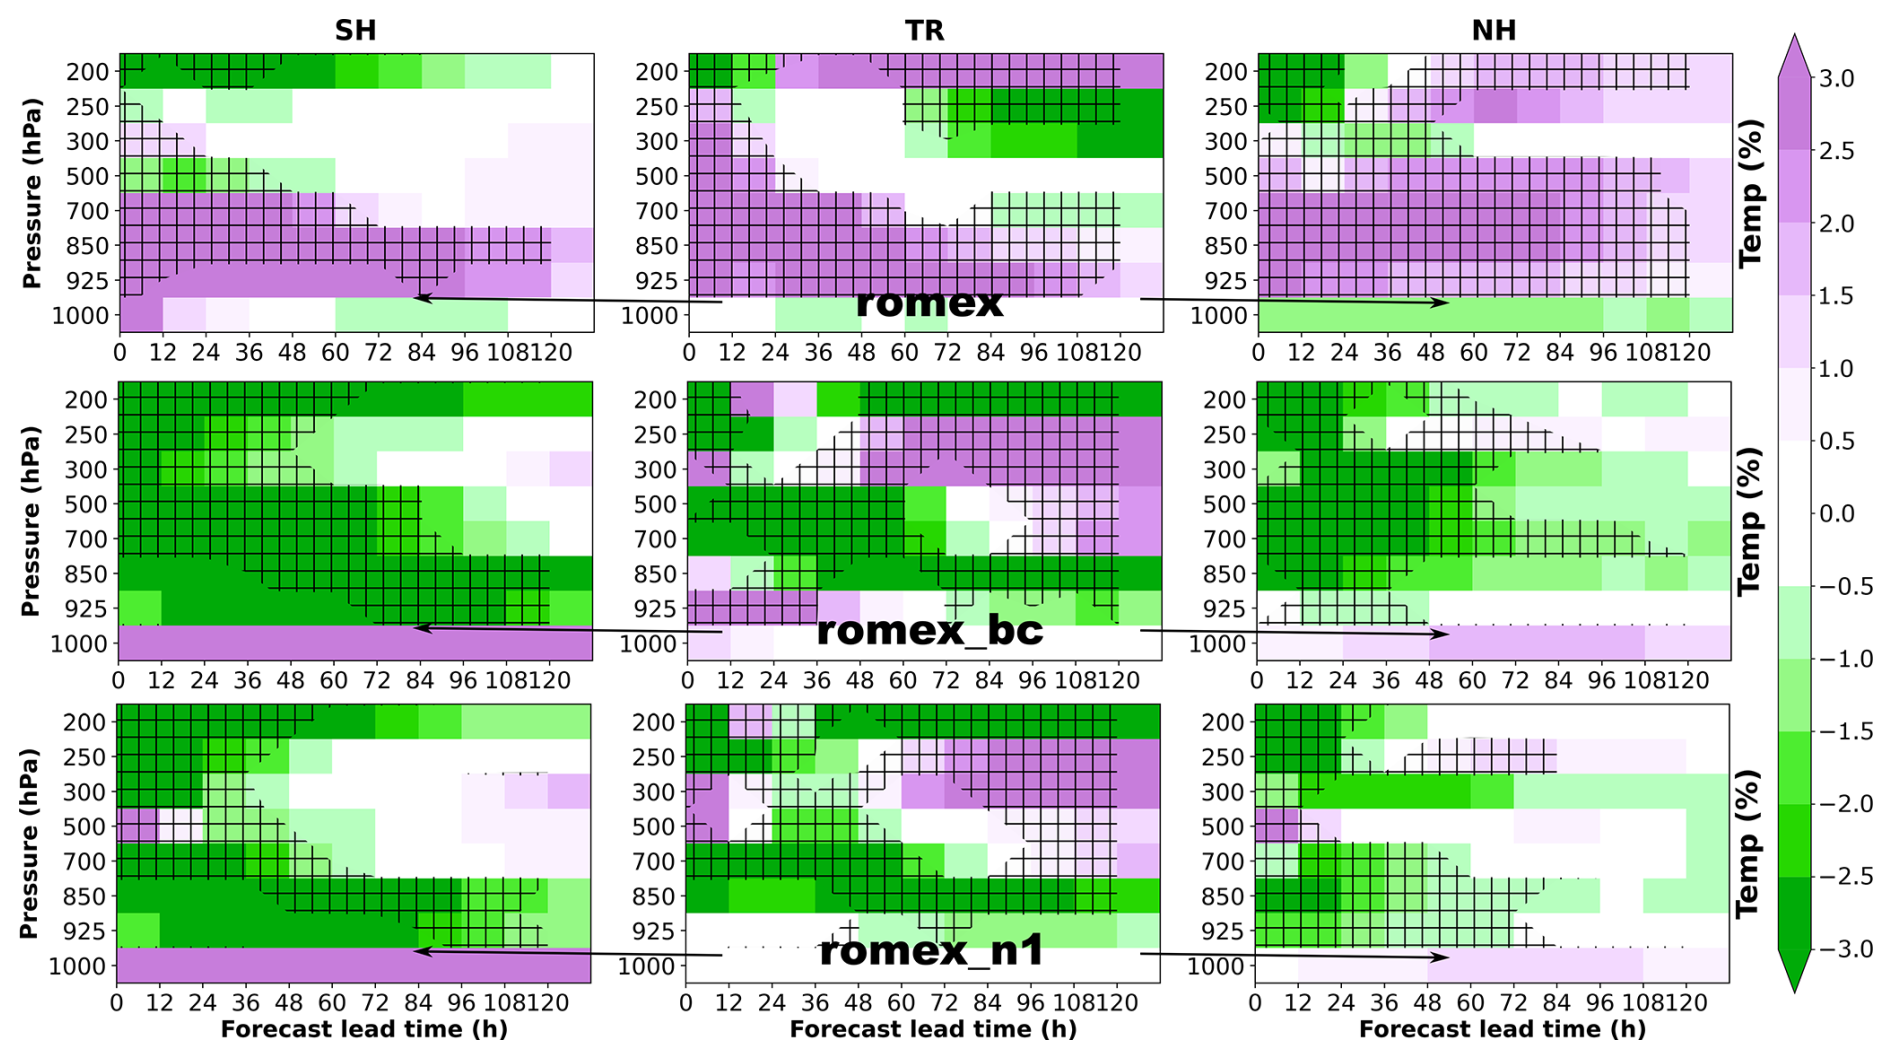
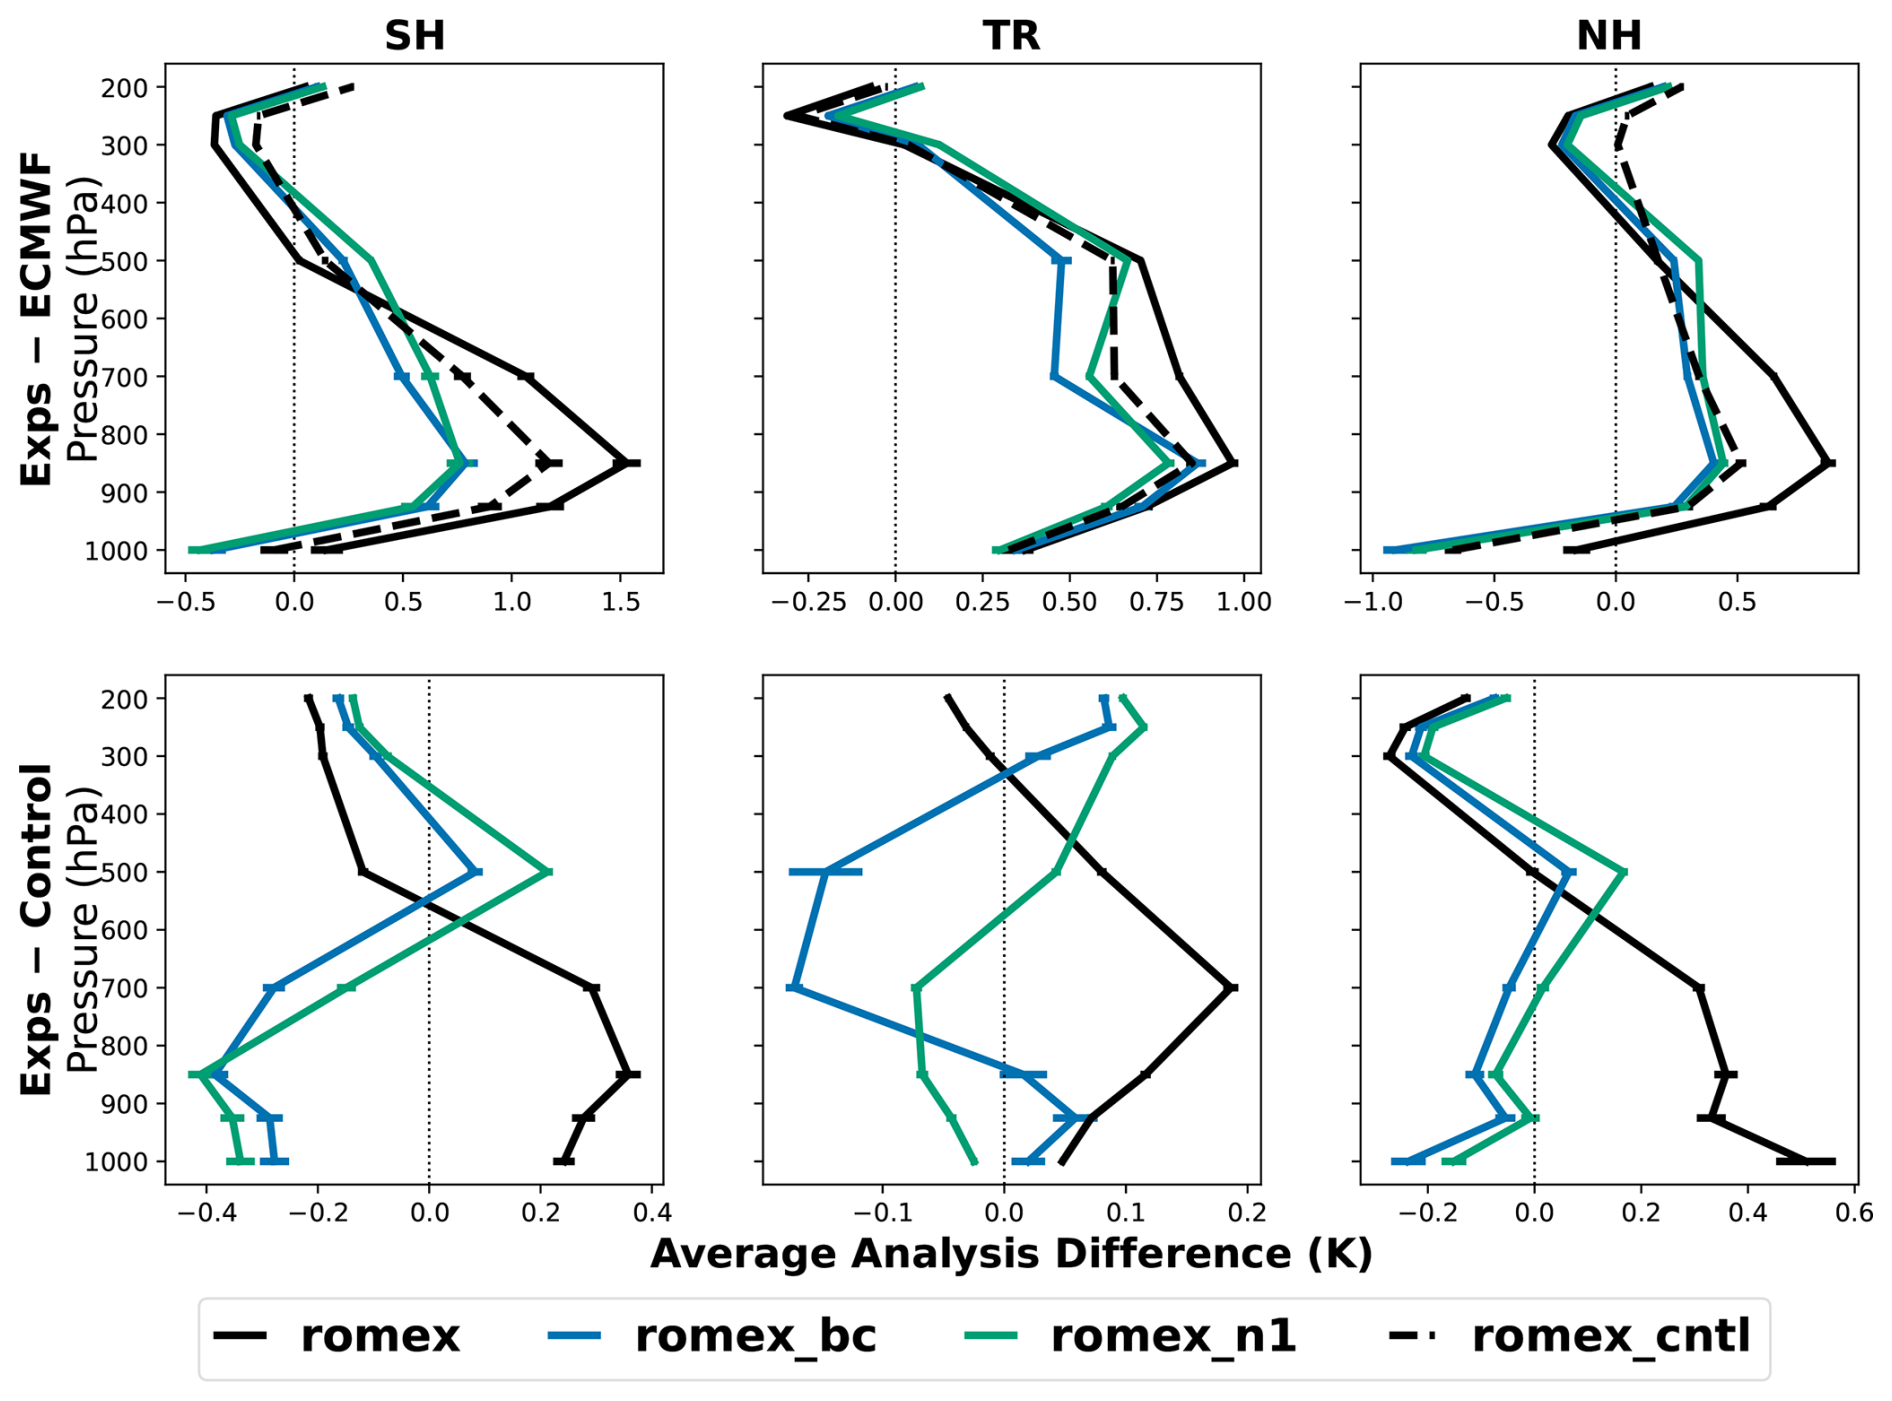
In contrast, romex_bc substantially improves temperature forecast skill. As shown in the middle row of Fig. 7, romex_bc produces a positive forecast impact exceeding 3 % in many regions, particularly in the Southern and Northern Hemispheres from 925 hPa up to the mid–upper troposphere for lead times extending to 3–4 d. In the TR, however, the impact is more mixed, with statistically significant improvements primarily confined to a narrower layer between approximately 400 and 850 hPa for lead times up to three days. The strong positive impact in the NH gradually diminishes beyond two days of forecast lead time. At the analysis time, Fig. 8 shows that romex_bc effectively reduces the lower-tropospheric warm bias in the Southern and Northern Hemispheres and produces a similar bias reduction within the narrow tropical layer where forecast improvements are observed.
The romex_n1 experiment exhibits a broadly similar pattern of forecast improvement compared to romex_bc, although the magnitude of the temperature forecast improvement is slightly smaller. Figure 8 confirms that the adjustment to the temperature analysis bias in romex_n1 follows a similar vertical structure to romex_bc but with reduced amplitude.
Moisture forecasts exhibit a different response to the ROMEX assimilation. Unlike the widespread degradations seen in geopotential height and temperature forecasts, the romex experiment produces improvement in moisture forecasts. Figure 9 shows that the romex experiment demonstrates positive forecast impact for precipitable water above ∼850 hPa extending to upper troposphere. The improvement is approximately 2 %–3 % at the initial forecast time and gradually decreases after two days for the SH and NH, while remaining evident through much of the 5 d forecast period in the TR. However, the romex experiment also introduces substantial degradation in precipitable water forecasts within the boundary layer (below 900 hPa).
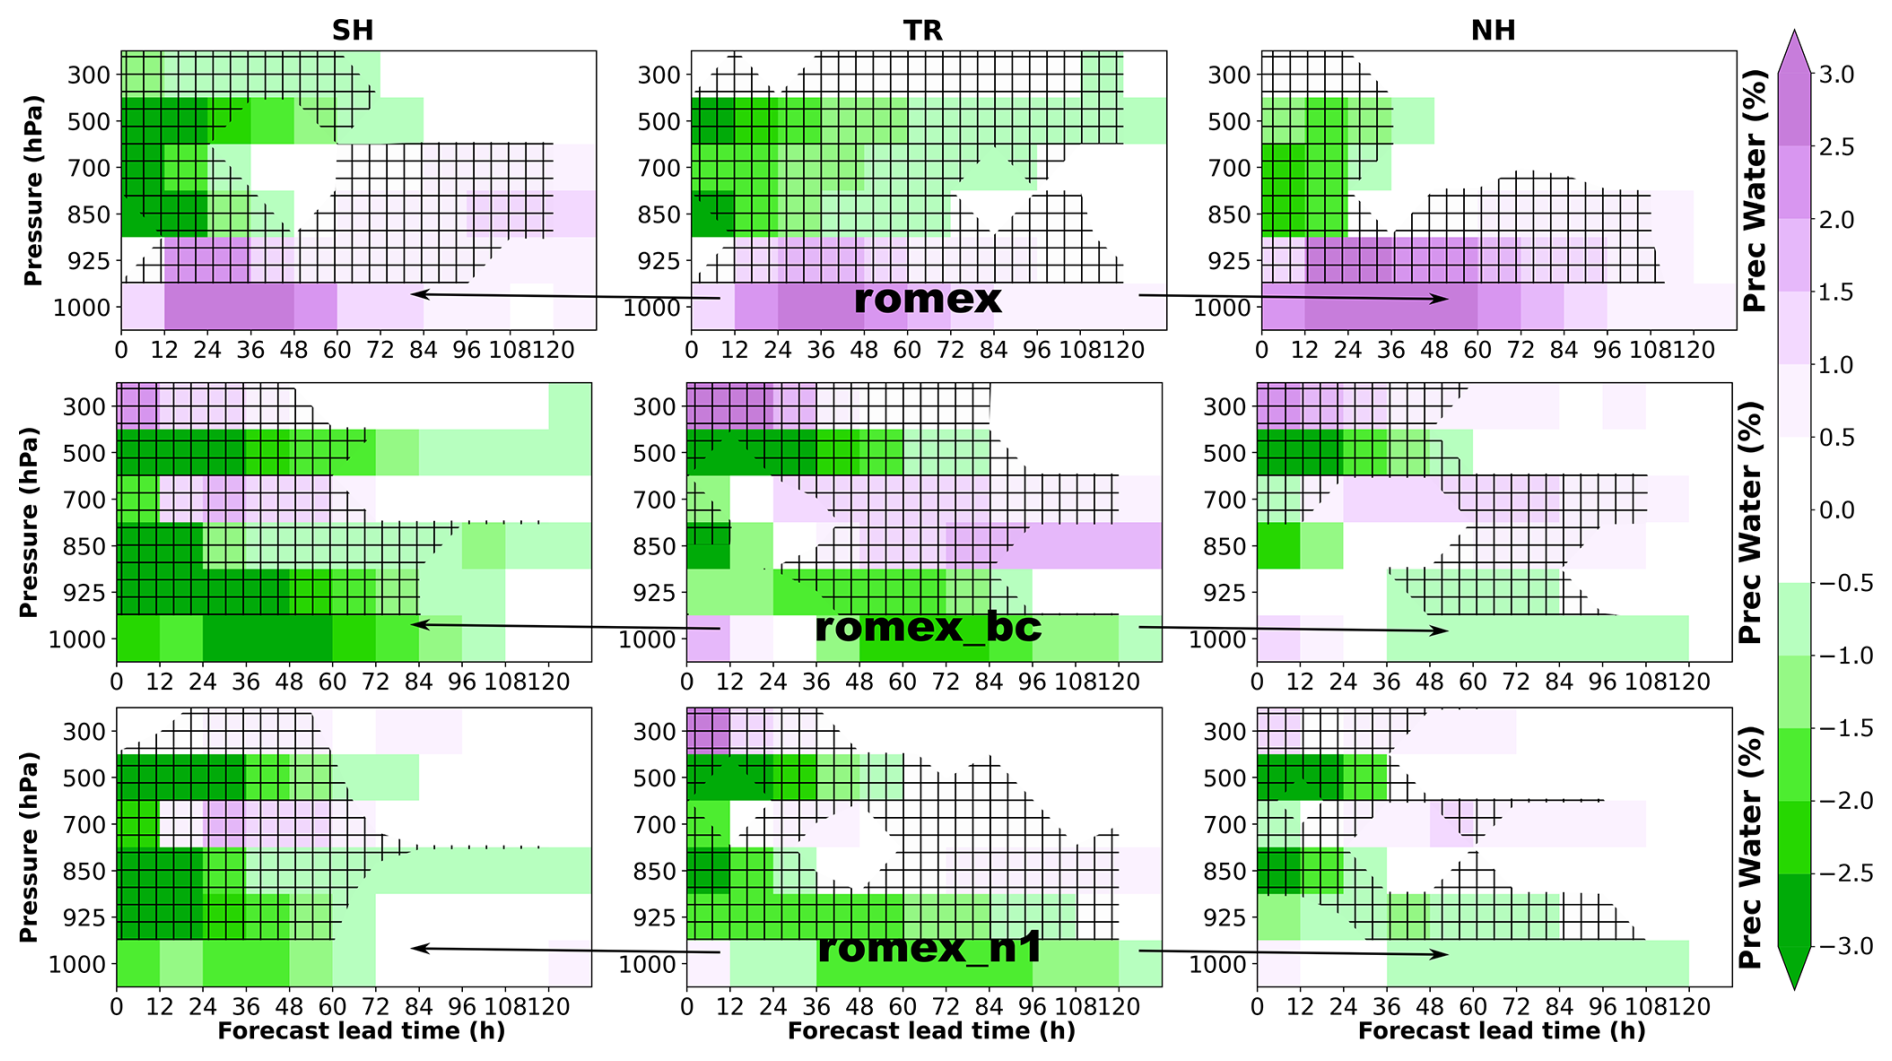
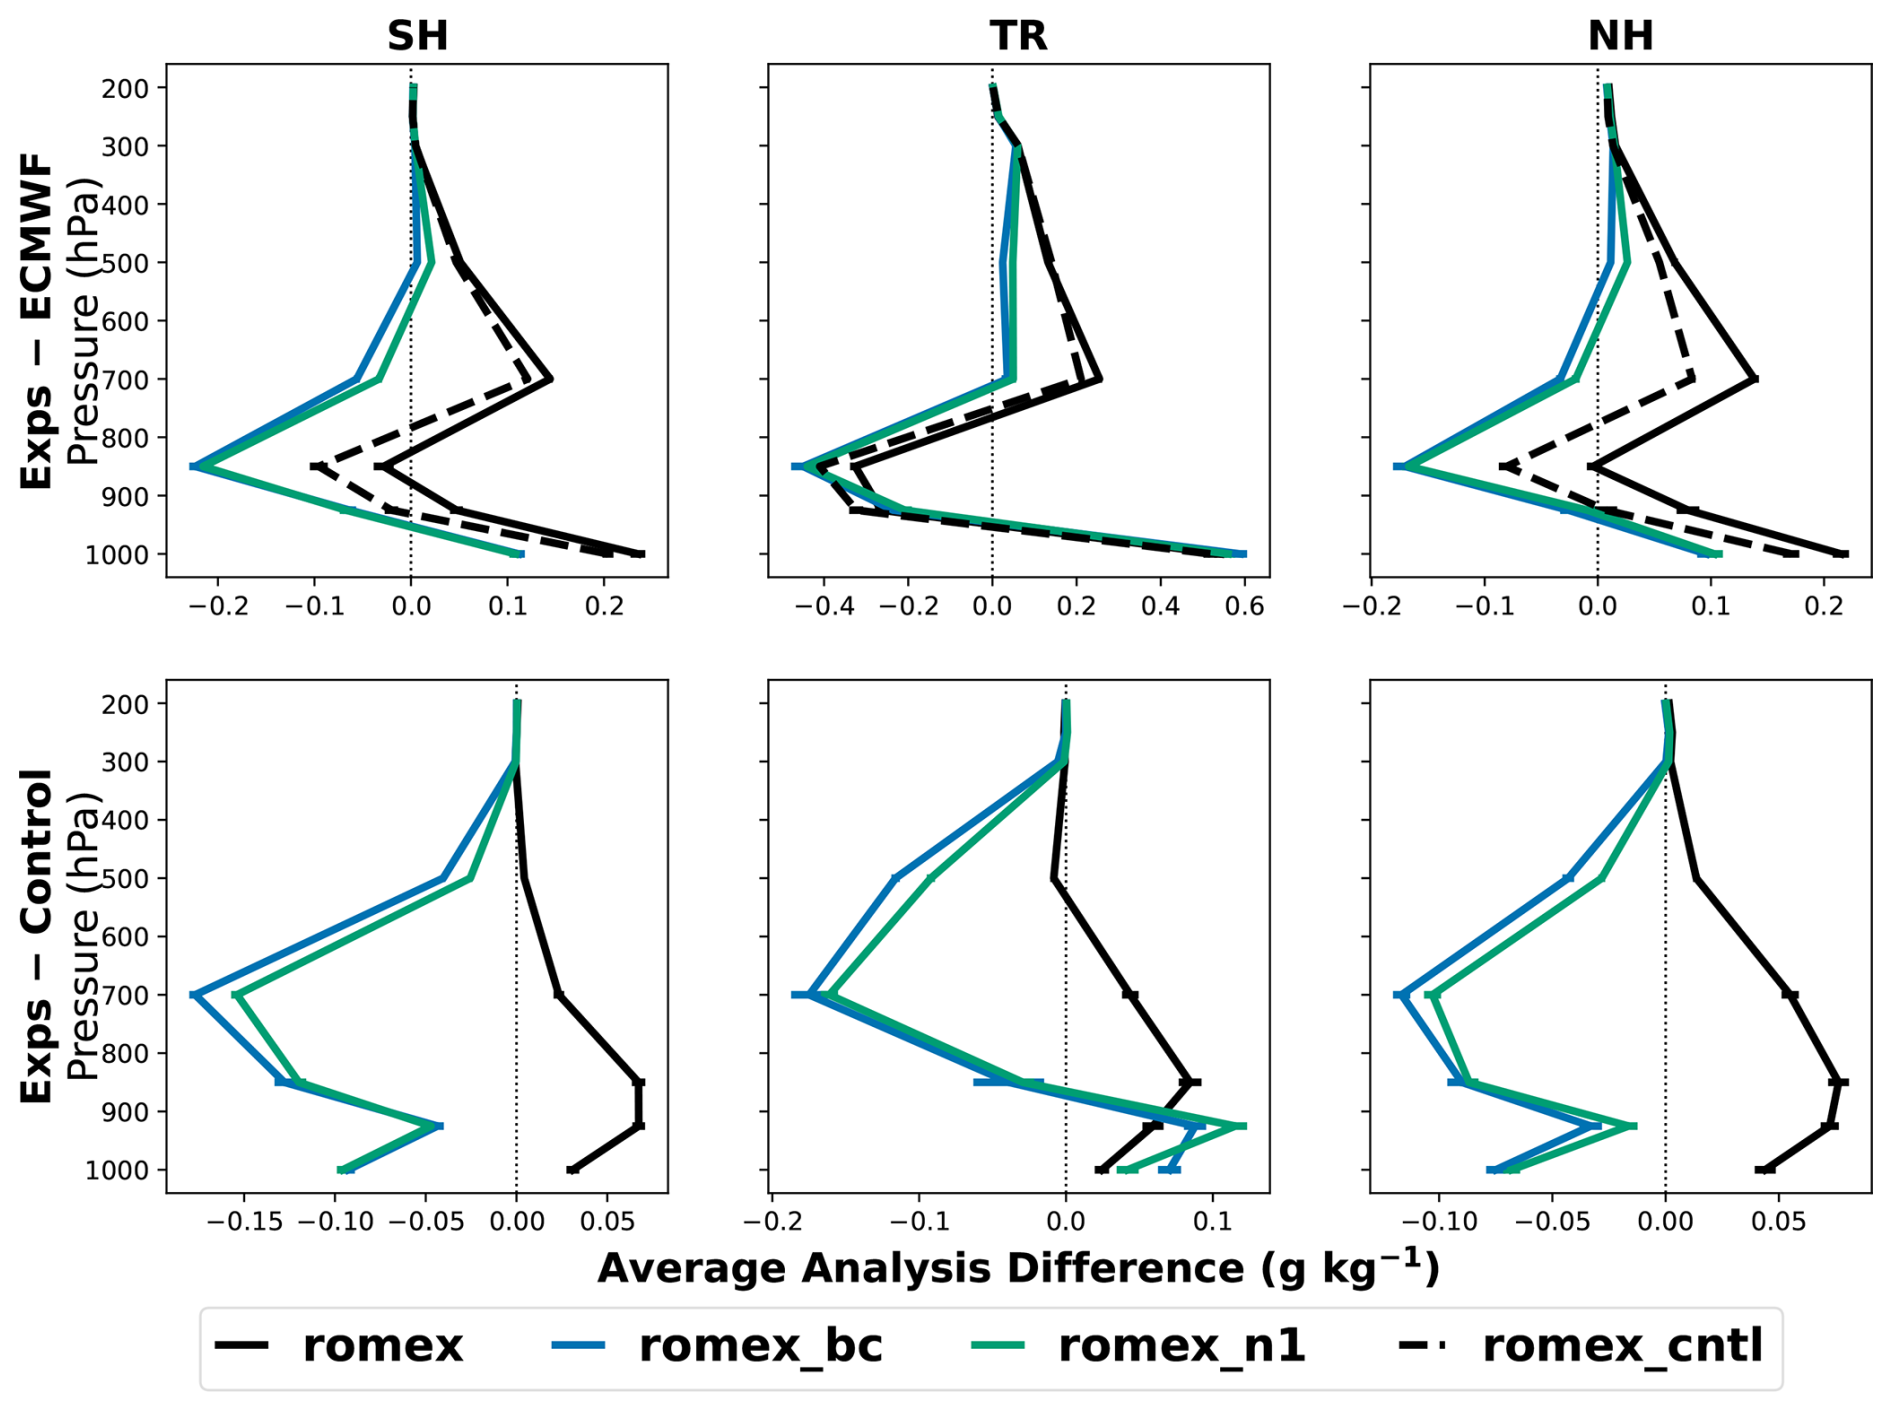
To better understand these forecast impacts, Fig. 10 examines the corresponding analysis differences using specific humidity, which provides finer vertical resolution than precipitable water in our NWP. The control experiment exhibits a dry-moist-dry bias structure relative to the ECMWF analyses from the surface to the upper troposphere. The romex experiment increases the positive moisture bias relative to the romex_cntl experiment, with the largest contribution near 900 hPa. As a result, the assimilation of ROMEX partially corrects the dry bias in the free troposphere above ∼850 hPa, leading to an improved moisture forecast in that region. However, this correction overcompensates in the lower troposphere and boundary layer, contributing to forecast degradation at these levels.
The romex_bc and romex_n1 exhibit broadly similar significant positive impacts on moisture forecasts. Both experiments produce statistically significant improvements in precipitable water forecasts up to ∼400 hPa for lead times extending beyond 2–3 d (Fig. 9), although slight forecast degradation is evident above this level. In contrast to the romex experiment, both romex_bc and romex_n1 experiments reduce the moisture analysis bias relative to the control (Fig. 10), with the largest adjustment around 700 hPa. This more balanced analysis moisture bias correction likely contributes to the improved forecast performance compared with the standard romex experiment. However, despite the reduced specific humidity biases relative to ECMWF at 700 hPa, the RMSE at this level is higher for romex_bc, and to a lesser extent for romex_n1, than for romex.
Overall, these results demonstrate that the treatment of ROMEX observations using an empirical bias correction or by adjusting the refractivity coefficient strongly influences the impact that RO data have on both analysis bias and forecast skill. The standard romex experiment tends to amplify existing model biases in geopotential height and temperature, leading to degraded forecast performance despite some improvements in free-tropospheric moisture forecasts. Applying an empirical bias correction (romex_bc) effectively reduces negative impacts with respect to ECMWF analyses, the control and radiosonde observations and yields the most consistent forecast improvements; however, the romex_bc approach will not allow the observations to address model bias. The modified refractivity formulation used in romex_n1 provides a predominantly positive impact on analysis, forecasts and fit to radiosonde, though not to the degree found with romex_bc. In addition, the romex_n1 is applied more directly to the observation and can be used to diagnose and mitigate model biases.
This study evaluates the impact of assimilating high-volume ROMEX radio occultation (RO) observations on the Navy's global NWP system using a series of observing system experiments. Results show that ROMEX data have a large impact on the resulting analyses and forecasts. In general, the ROMEX data provide beneficial contributions to forecast skill. A small but consistent bias in the innovations, particularly in the 10–35 km region, was found through the early stages of the ROMEX collaborative experiments. We examine two approaches to address this: an empirical bias correction developed using all ROMEX observations and innovation statistics, and an adjustment to the refractivity coefficient for dry air.
In particular, the fit-to-observations against global radiosondes shows improvements for all experiments using the ROMEX data for temperature (100–400 hPa), pseudo–relative humidity (400–925 hPa), and upper-level winds, with the experiments using either bias treatment (romex_bc) or adjustment of the refractivity coefficient (romex_n1) yielding the largest overall improvements. The forecast sensitivity to observation impact further confirms that all the RO missions in the ROMEX data contribute positively to reducing 24 h forecast error. The Spire missions, which provide the largest volume of RO measurements, show the greatest accumulated impact, while the COSMIC-2 mission consistently shows the highest per-observation effectiveness in the NAVDAS-AR and NAVGEM system.
The standard romex experiment amplifies existing NAVGEM analysis biases in geopotential height and temperature while reducing free-tropospheric moisture. Applying an empirical bias correction to the observation (romex_bc) or adjusting refractivity coefficient RO forward operator (romex_n1) substantially reduces these geopotential height and temperature biases and improves forecasts of these variables as well. Overall, a change in the treatment of the observations is key to realizing the forecast benefits of the massive increase in RO observation provided through the ROMEX data.
Future work will focus on identifying the sources of persistent biases and improving the representation of RO observations in the data assimilation system. In particular, further investigation is needed to better characterize lower-tropospheric observations and representativeness errors, and to evaluate alternative forward-operator and observation-processing strategies. These strategies include adjusting other coefficients in the refractivity formulation, using more accurate refractivity equations than that of Smith and Weintraub (1953), such as Lewis (2008), or exploring the use of a two-dimensional forward operator (Healy et al., 2007). Additional studies will also examine the impact of ROMEX data under different observing system configurations and model resolutions, as well as their role in improving forecasts of specific weather phenomena.
ROMEX data are available for scientific studies. Users of ROMEX data are required to sign a data license with EUMETSAT for the terms and conditions of using the data (https://irowg.org/ro-modeling-experiment-romex/, last access: 2 August 2026). Other baseline data used in the operational NAVGEM are publicly available through the World Meteorological Organization Global Telecommunications System. Users can access the data from many operational centers (e.g., https://nomads.ncep.noaa.gov/pub/data/nccf/com/gfs/prod/, last access: 2 August 2026). NAVGEM software is considered sensitive intellectual property, therefore is not accessible to the public or research community.
HWC conducted the experiments, performed the data analysis, and led the manuscript writing. BR contributed to the experimental design. DT facilitated the license agreement with NRL legal and acquired the ROMEX dataset for this study. All authors reviewed, edited, and approved the final manuscript.
At least one of the (co-)authors is a guest member of the editorial board of Atmospheric Measurement Techniques for the special issue “The Radio Occultation Modeling EXperiment (ROMEX): observational quality, processing, and numerical weather prediction (NWP) applications”. The peer-review process was guided by an independent editor, and the authors also have no other competing interests to declare.
Publisher's note: Copernicus Publications remains neutral with regard to jurisdictional claims made in the text, published maps, institutional affiliations, or any other geographical representation in this paper. The authors bear the ultimate responsibility for providing appropriate place names. Views expressed in the text are those of the authors and do not necessarily reflect the views of the publisher.
This article is part of the special issue “The Radio Occultation Modeling EXperiment (ROMEX): observational quality, processing, and numerical weather prediction (NWP) applications”. It is not associated with a conference.
The authors acknowledge the Navy's high-performance computing resources and funding support from the Office of Naval Research.
This research has been supported by the Office of Naval Research (grant nos. N0001423WX00473, N0001424WX00933, and N0001425GI02277).
This paper was edited by Richard Anthes and reviewed by three anonymous referees.
Anthes, R. A., Marquardt, C., Ruston, B., and Shao, H.: Radio Occultation Modeling Experiment (ROMEX): Determining the Impact of Radio Occultation Observations on Numerical Weather Prediction, B. Am. Meteorol. Soc., E1552–E1568, 2024.
Aparicio, J. and Deblonde, G.: Impact of the assimilation of CHAMP refractivity profiles in Environment Canada global forecasts, Mon. Weather Rev., 136, 257–275, https://doi.org/10.1175/2007MWR1951.1, 2008.
Baker, N., Rosmond, T., Hoppel, K., Pauley, P., Ruston, B., and Swadley, S.: The assimilation of water vapor information from satellite observations and the choice of the analysis variable, 17th Conference on Satellite Meteorology and Oceanography, Annapolis, MD, https://ams.confex.com/ams/17Air17Sat9Coas/techprogram/paper_174905.htm (last access: 2 August 2026), 2017.
Baker, N. L., Pauley, P. M., Stone, R. E., and Langland, R. H.: Interpretation of forecast sensitivity observation impact in data denial experiments, in: Data Assimilation for Atmospheric, Oceanic and Hydrologic Applications, vol. IV, Springer, Berlin, Germany, 2022, https://doi.org/10.1007/978-3-030-77722-7, 2022.
Bowler, N. E., Zhang, H., Anlauf, H., Aparicio, J. M., Christophersen, H. W., Kim, E.-H., Li, X., Liu, Y., Lonitz, K., Murakami, Y., Raspaud, D., and Ruston, B.: Intercomparison of GNSS-RO Quality Control Checks in NWP. Part I: Survey of Methods, J. Atmos. Ocean. Tech., 43, 701–712, 2026.
Christophersen, H., Ruston, B., and Baker, N. L.: Assimilation of GNSS Zenith Total Delay in NAVGEM, J. Geophys. Res. Atmos., 1–17, 2023.
Cucurull, L. and Derber, J.: Operational implementation of COSMIC observations into the NCEP's Global Data Assimilation System, Weather Forecast., 23, 702–711, https://doi.org/10.1175/2008WAF2007070.1, 2008.
Cucurull, L., Atlas, R., Li, R., Mueller, M., and Hoffman, R.: An observing system simulation experiment with a constellation of radio occultation satellites, Mon. Weather Rev., 146, 4247– 4259, https://doi.org/10.1175/MWR-D-18-0089.1, 2018.
Culverwell, I. D., Lewis, H. W., Offiler, D., Marquardt, C., and Burrows, C. P.: The Radio Occultation Processing Package, ROPP, Atmos. Meas. Tech., 8, 1887–1899, https://doi.org/10.5194/amt-8-1887-2015, 2015.
Daley, R. and Barker, E.: NRL Atmospheric Variational Data Assimilation System, 163 pp., https://apps.dtic.mil/sti/citations/ADA383797 (last access: 2 August 2026), 2000.
Dee, D. P. and Da Silva, A. M.: The choice of variable for atmospheric moisture analysis, Mon. Weather Rev., 131, 155–171, https://doi.org/10.1175/1520-0493(2003)131<0155:TCOVFA>2.0.CO;2, 2003.
Duncan, D. I., Bormann, N., Geer, A. J., and Weston, P.: Assimilation of AMSU-A in All-Sky Conditions, Mon. Weather Rev., 150, 1023–1041, 2022.
Frolov, S., Campbell, W., Ruston, B., Bishop, C. H., Kuhl, D., Flatau, M., and McLay, J.: Assimilation of Low-Peaking Satellite Observations Using the Coupled Interface Framework, Mon. Weather Rev., 148, 637–654, 2020.
Harnisch, F., Healy, S. B., Bauer, P., and English, S. J.: Scaling of GNSS Radio Occultation Impact with Observation Number Using an Ensemble of Data Assimilations, Mon. Weather Rev., 141, 4395–4413, 2013.
Healy, S. and Thépaut, J.-N.: Assimilation experiments with CHAMP GPS radio occultation measurements, Q. J. Roy. Meteor. Soc., 132, 605–623, https://doi.org/10.1256/qj.04.182, 2006.
Healy, S. B., Eyre, J. R., Hamrud, M., and Thepaut, J.-N.: Assimilating GPS radio occultation measurements with two-dimensional bending angle observation operators, Q. J. Roy. Meteor. Soc., 133, 1213–1227, 2007.
Hogan, T. F., Liu, M., Ridout, J. A., Peng, M. S., Whitcomb, T. R., Ruston, B. C., Reynolds, C. A., Eckermann, S. D., Moskaitis, J. R., Baker, N. L., McCormack, J. P., Viner, K. C., McLay, J. G., Flatau, M. K., Xu, L., Chen, C., and Chang, S. W.: The Navy Global Environmental Model, Oceanography, 27, 116–125, https://doi.org/10.5670/oceanog.2014.73, 2014.
Ingleby, B.: An assessment of different radiosonde types 2015/2016, ECMWF Technical Memorandum 807, https://doi.org/10.21957/0nje0wpsa, 2017.
Kuhl, D. D., Rosmond, T. E., Bishop, C. H., McLay, J., and Baker, N. L.: Comparison of hybrid ensemble/4DVar and 4DVar within the NAVDAS-AR data assimilation framework, Mon. Weather Rev., 141, 2740–2758, 2013.
Kursinski, E. R., Hajj, G. A., Schofield, J. T., Linfield, R. P., and Hardy, K. R.: Observing Earth's atmosphere with radio occultation measurements using the Global Positioning System, J. Geophys. Res.-Atmos., 102, 23429–23465, 1997.
Langland, R. H. and Baker, N. L.: Estimation of observation impact using the NRL atmospheric variational data assimilation adjoint system, Tellus A, 56, 189–201, 2004.
Lewis, H.: Refractivity calculations in ROPP, GRAS SAF Report 05, 8 pp., https://rom-saf.eumetsat.int/general-documents/gsr/gsr_05.pdf (last access: 2 August 2026), 2008.
Privé, N. C., Errico, R. M., and Akkraoui, A. E.: Investigation of the potential saturation of information for the Global Navigation Satellite System radio occultation observations with an observing system simulation experiment, Mon. Weather Rev., 150, 1293–1316, https://doi.org/10.1175/MWR-D-21-0230.1, 2022.
Rosmond, T. and Xu, L.: Development of NAVDAS-AR: Non-linear formulation and outer loop tests, Tellus A, 58, 45–58, https://doi.org/10.1111/j.1600-0870.2006.00148.x, 2006.
Ruston, B. and Healy, S.: Forecast Impact of FORMOSAT-7/COSMIC-2 GNSS Radio Occultation Measurements, Atmos. Sci. Lett., https://doi.org/10.1002/asl.1019, 2020.
Samrat, N. H., Candy, B., Lewis, O., Cotton, J., Smith, F., Halloran, G., Harlow, C., Lawrence, H., Migliorini, S., Smith, A., and Thomas, C.: Observation impact evaluation through data denial experiments in the Met Office global numerical weather prediction system, Q. J. Roy. Meteor. Soc., 151, e5002, https://doi.org/10.1002/qj.5002, 2025.
Smith, E. and Weintraub, S.: The constants in the equation for atmospheric refractive index at radio frequencies, P. IRE, 41, 1035–1037, https://doi.org/10.1109/jrproc.1953.274297, 1953.
Stone, R. E., Reynolds, C. A., Doyle, J. D., Langland, R. H., Baker, N. L., Lavers, D. A., and Ralph, F. M.: Atmospheric river reconnaissance observation impact in the Navy global forecast system, Mon. Weather Rev., 148, 763–782, https://doi.org/10.1175/MWR-D-19-0101.1, 2020.
Wilks, D. S.: Statistical Methods in the Atmospheric Sciences, Academic Press, 676 pp., ISBN 978-0123850225, 2011.