
the Creative Commons Attribution 4.0 License.
the Creative Commons Attribution 4.0 License.
 | 02 Oct 2026
Dual-frequency profiler study of hydrometeor fall speeds in tropical deep convection

Christopher R. Williams
Alain Protat
This study investigates hydrometeor fall speeds using a dual-frequency profiling radar operating during the 2005–2006 monsoon season near Darwin, Australia. Our focus is on tropical deep convection where the observations provide a new perspective on hydrometeor fall speeds within and near intense drafts having mixed-phase media. The techniques we employ avoid undue assumptions on the air motion or media distributions, offering a convenient path to estimate bulk radar reflectivity(Z)-weighted hydrometeor fall speed (Vt). While these mixed-phase media estimates are not specific to size or density, they may be replicated by models and are practical for radar-based retrievals that necessitate Vt assumptions.
Tests performed under rain and snow conditions show comparable performance to disdrometer and other references. The standard deviation of residuals for rain and snow relationships are ≅1 and ≅0.4 m s−1, respectively. In convective core regions aloft, Darwin observations align with existing graupel Vt-Z treatments, however mixed-phase media typically falls faster (>1–2 m s−1) for Z<35 dBZ than prior relationships. Breakdowns suggest that Active and Break monsoon conditions favor a similar Vt-Z behavior in strong cores. However, Break conditions – those more favorable to intense daytime tropical convection – potentially indicate the presence of additional lofted liquid or melting media mixed in volumes at convective core peripheries Z<35 dBZ. Break events also show higher variability in Vt-Z pairs, with select samples having Vt faster than rain for a given Z that argues for partially-melted graupel coupled with size-sorting.
- Article
(1939 KB) - Full-text XML
- BibTeX
- EndNote


The representation of deep convective cloud (DCC) microphysical and dynamical processes and properties remains poorly captured by cloud and Earth system modeling (e.g., Sanderson et al., 2008; Del Genio, 2012; Fan et al., 2017; Sherwood et al., 2020; Prein et al., 2022). These inadequacies may be partially explained by the difficulty in obtaining observational constraints for DCC characteristics across the temporal and spatial scales these storms operate on (e.g., Houze, 2004). Model development and evaluation has shown a renewed emphasis on exploring the fundamental role of the vertical air motions within DCCs, and in models' ability to reproduce draft behaviors consistent with scarce references towards improved cloud-aerosol hydrometeor evolution, entrainment and detrainment (e.g., Donner, 1993; Donner et al., 2001, 2016; Varble et al., 2014; Del Genio et al., 2012; Fan et al., 2018; Anber et al., 2019; Morrison et al., 2020; Peters et al., 2021; Ramos-Valle et al., 2023). In turn, there has been a push to add new platforms and retrievals to capture storm intensity and kinematics – including draft sizes and intensity – anchored to key environmental factors and lifecycle state (e.g., Heymsfield et al., 2010; Giangrande et al., 2013, 2016a, 2023; Kumar et al., 2015; North et al., 2017; Wang et al., 2019, 2020; Feng et al., 2021; Jeyaratnam et al., 2021; Öktem et al., 2023; Fiolleau and Roca, 2024; Galfione et al., 2025).
While aircraft campaigns have often been the gold standard for DCC observational understanding, only a handful of “direct” aircraft operations have collected extended datasets within the most intense storms owing to the cost and safety concerns for conducting such efforts (e.g., Byers and Braham, 1949; LeMone and Zipser, 1980; Zipser and LeMone, 1980; Detwiler et al., 2012; Field et al., 2019). An alternative path has been to improve our remote-sensing capabilities, with radar technologies in particular offering techniques at scales that may inform on the nature of individual drafts and their microphysical interactions influential to finer-grid simulations (e.g., Morrison et al., 2020; Peters et al., 2020; Hernandez-Deckers et al., 2022; Matsui et al., 2024). Profiling radar studies have recently shown that through dual-frequency methods (e.g., Protat and Williams, 2011; Williams, 2012; Schumacher et al., 2015) and/or the use of radar Doppler spectra (e.g., Atlas et al., 1973; Wakasugi et al., 1986; Lhermitte 1988; Kollias et al., 2002; Giangrande et al., 2010, 2012, 2016b), it is possible to estimate detailed (to 10 m and/or 10 cm s−1) vertical air motions and coupled hydrometeor properties in even the most intense DCCs.
Nevertheless, key information is missing on the hydrometeors in DCCs, such as their density, shape, and/or terminal fall speed; properly capturing these properties has important implications for modelled storm fidelity and remotely-sensed retrieval viability. For example, radar retrievals often adopt empirical relationships that use quantities such as radar reflectivity factor Z to approximate the particle fall speed contribution to radar-observed air motions (e.g., Steiner, 1991; Heymsfield et al., 2010; North et al., 2017; Giangrande et al., 2013, 2016a). For profiling radar applications, such assumptions are the primary source of physical process error when estimating air motion and other drop size distribution (DSD) retrievals. Scanning Doppler weather radar wind field retrieval techniques similarly apply simple rain-based constraints on fall speeds (e.g., Caya, 2001; North et al., 2017; Protat et al., 2024); the impact of these assumptions is often difficult to untangle because of how fall speed errors may couple with other changes tied to tuning parameters (e.g., gridding/smoothing choices, Oue et al., 2019). Proxy retrievals that use radar microphysical fields have more recently been proposed – including concepts that map changes in spatiotemporal Z fields to estimate quantities such as air motions or latent heating – and these offer the promise of wide network or satellite applicability (e.g., Laroche and Zawadzki, 1995; Tao et al., 2016; Kumar et al., 2016; Chase et al., 2024). These proxies may be applicable if one can assume the underlying model is capable of reproducing salient motions and convective particle complexity, for example as demonstrated by proper treatment of joint media fall speed and radar quantities viewed through forward operators (e.g., Straka and Mansell, 2005; Milbrandt and Yau, 2005; Elsaesser et al., 2017; Milbrandt et al., 2021; Lin et al., 2021, 2024; Heymsfield et al., 2023).
This study considers how hydrometeor fall speeds within tropical DCCs are associated with a primary bulk radar microphysical quantity, Z. It draws from a unique dual-frequency radar wind profiler dataset, with a focus on DCC events collected during the 2005–2006 monsoon season near Darwin, Australia. We benefit from well-established methods for the retrieval of vertical air motions from these profilers that follow Williams (2012). An advantage of the Williams (2012) techniques is that those methods avoid the need to assume hydrometeor fall speeds en route to estimates of the vertical air motion. The proposed effort capitalises on those retrievals as its starting point towards an estimate for the bulk radar reflectivity-weighted hydrometeor fall speed, Vt, following complementary ideas put forward by Protat and Williams (2011). Our study expands on their concepts by extending the ideas into precipitating DCC conditions. Similar ideas have been prototyped by the authors in Giangrande et al. (2016a) and Ovchinnikov et al. (2019), however not documented to this extent. A practical motivation is to promote better representation of fall speeds in remote-sensing based DCC retrievals wherein frozen drops, graupel, and hail exist, but few observations are available or practical.
The Protat and Williams (2011) concepts will first be applied under rain and snow conditions; these conditions have fall speed references that speak to the suitability of dual-frequency concepts in precipitation. Simple tests under rainy conditions will consider “convective-stratiform” regime sensitivity, as regime-driven changes are established for tropical rain DSDs and quintessential to previous Darwin efforts (e.g., Tokay and Short, 1996; Bringi et al., 2009; Giangrande et al., 2014). Unique to this study are observations that summarise hydrometeor fall speed properties within tropical DCC storms above the melting level. As deep convective “cores” (e.g., intense draft regions that extend across the melting layer) have few established references, studies often rely on modelled behaviors to furnish retrievals. Since the retrievals we present have no direct observational comparison, we will consider sensitivity tests that explore retrieved fall speed variability when contrasting different Darwin modes of oceanic to continental-type DCCs. For these tests, we expect that storms sampled during “Break” monsoon conditions are deeper, more intense, and associated with lower mid-level humidity when compared to “Active” monsoon regimes (e.g., May et al., 2012; Kumar et al., 2013). For instance, simulation results presented in Vagasky et al. (2025) suggest that warmer tropical environments may cause hail to melt faster, reduce in mass and thus fall slower, whereas drier mid-levels promote more evaporative cooling that helps maintain faster-falling hailstones. While we may expect that Break conditions favor the added presence of larger and/or faster-falling convective media, the characteristics of these media relative to Vt-Z treatments is less certain owing to potential melting and complex mixtures of these media in such settings.
This study uses the dual-frequency radar wind profiler system operated in Darwin, Australia, with datasets collected between the years of 2005–2006. These periods overlap with the U.S. Department of Energy's Atmospheric Radiation Measurement (ARM; Mather and Voyles, 2013) Tropical Warm Pool International Cloud Experiment (TWP-ICE) experiment (e.g., May et al., 2008) and several prior uses of these datasets in the literature (e.g., Kumar et al., 2015, 2016; Schumacher et al., 2015). During this season, a total of 43 event days were identified, where an “event” was defined as a day having at least 15 min of overpass from DCC convective core conditions (see also, Sect. 2.1). Events included a mixture of isolated ordinary, multi-cell, and organized convection, the latter often featuring widespread trailing stratiform precipitation. An example time-height image of Darwin profiler radar reflectivity factor Z and echo classification (e.g., Giangrande et al., 2013, see also Sect. 2.1) is found in Fig. 1.
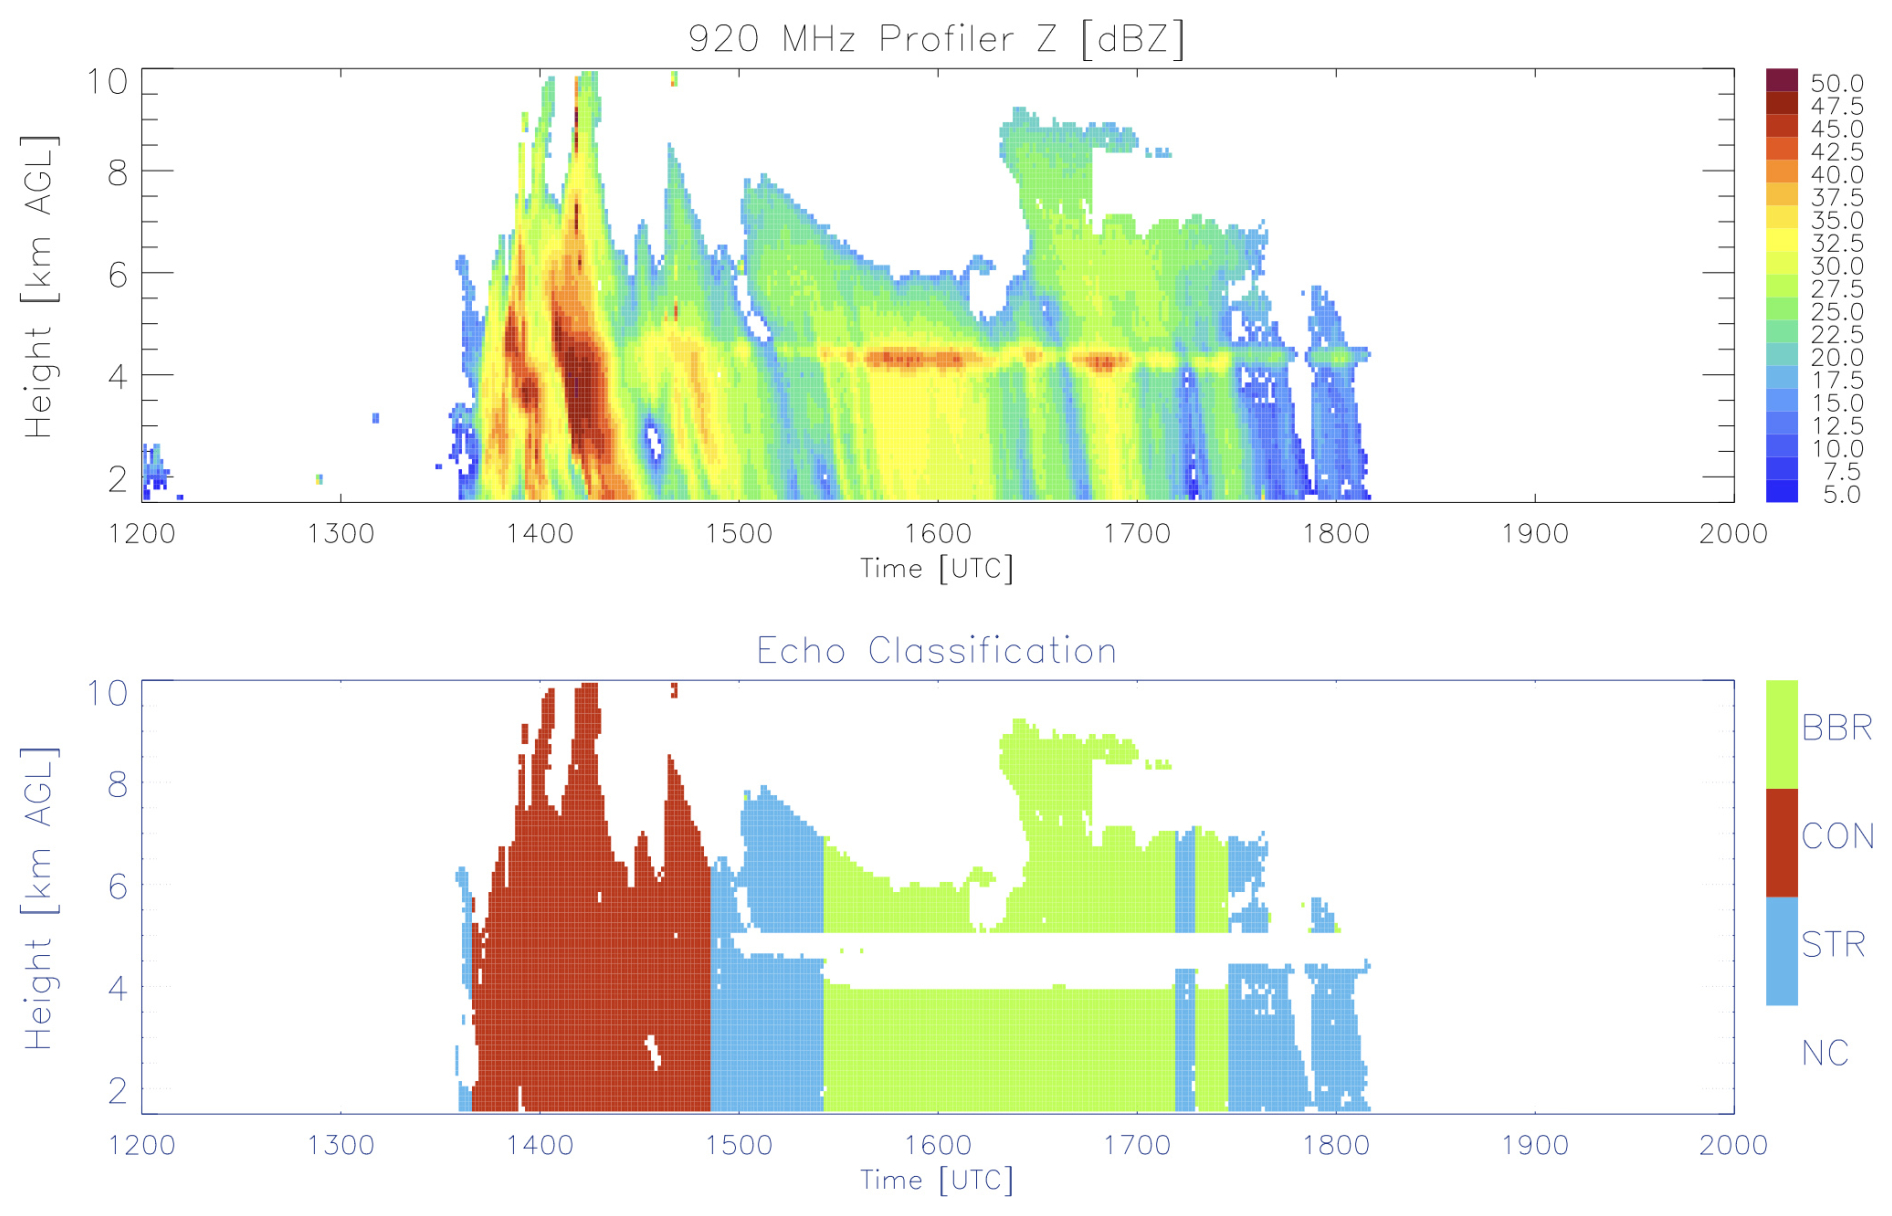
Figure 1An example of Darwin 920 MHz Profiler radar reflectivity factor Z (top) and an associated convective rain (“CON”), stratiform rain (“STR”) and “bright band” stratiform rain (“BBR”) echo classifications for an event on 17 November 2005.
2.1 The Darwin Dual-Frequency Profiler Dataset
The Darwin profilers operated at 50- and 920-MHz frequencies. This dataset has an established history in dual-frequency and Doppler spectral-based literature for retrieval of vertical air motions and other precipitation properties as outlined by Protat and Williams (2011), Williams (2012), among others. As described by Protat and Williams (2011), the 50-MHz profiler observes both Bragg scattering from turbulent inhomogeneities in refractive index (Balsley and Gage 1982) and Rayleigh scattering due to hydrometeors (Atlas et al., 1973). Since the turbulent inhomogeneities move with the vertical air motion, the 50-MHz Doppler velocity power spectra contain two peaks; one associated with vertical air motion and a more downward moving peak associated with hydrometeor motion. The 920-MHz profiler does not have the sensitivity to observe Bragg scattering at heights above approximately 2 km, however the 920-MHz profiler can observe Rayleigh scattering from hydrometeors to heights over 8 km when enough are present (see Fig. 1). The basic dual-frequency concept is to use the 920-MHz profiler Doppler velocity power spectra to mask out the hydrometeor signal in the 50-MHz profiler spectra, enabling an estimate of solely the vertical air motion component within the 50-MHz profiler spectra. Although air motion estimates are often the desirable outcome of this approach, the bulk radar reflectivity-weighted hydrometeor fall speed Vt may be estimated as a residual of the retrieved vertical air motion and the measured hydrometeor mean Doppler velocity Vd. This is a “bulk” (power-weighted) radar volume fall speed estimate that aligns with radar volume Z estimates, weighted more heavily to reflect the contributions from larger and higher density media in mixed-hydrometeor volumes. This retrieved radar fall speed Vt is conceptually the same as shifting the Doppler velocity power spectra so that vertical air motion is centered at zero velocity and the hydrometeors are falling in still air, such that Vt = Vd. This fall speed has been adjusted to sea level using an approximation by Foote and du Toit (1969).
The profiler data collection was synchronised with a 1-min dwell cadence. At the start of every minute, the radars collected data in the vertical direction for 41 s, and then collected data in either the north or east direction for 15 s. The 50-MHz profiler had a 495 m range resolution with range gates spaced every 315 m. This oversampling in range is a compromise between increased sensitivity (i.e., 495 m range resolution) with increased data samples (i.e., 315 m range gates) and the loss of independence of adjacent range gates. The 920-MHz profiler had 105 m range resolution and 105 m range gate spacing producing range independent samples. To produce “range matched” spectra for the dual-frequency method, five 920-MHz spectra centered on each 50-MHz range gate were averaged together to produce spectra with 525 m range resolution. After retrieving the vertical air motion at each 315 m range gate, the air motion was interpolated to a uniform 100 m spacing from 1.7 km a.g.l. (the lowest 50-MHz profiler range gate) to the highest range gate with a valid retrieval. The 920-MHz profiler Z and Vd were estimated at each 105 m range gate and interpolated to the uniform 100 m spacing. The 920-MHz profiler Z was corrected for calibration offsets using collocated disdrometer records (e.g., Williams et al., 2023). Due to the profiler vertical resolutions, the retrieved vertical air motion has independent samples every 500 m and the 920-MHz profiler Z and Vd have independent samples every 100 m.
A simple fuzzy logic classification was developed using an approach that follows Giangrande et al. (2013) to differentiate DCC “convective” and “stratiform” precipitation regions and remove possible radar artifacts or nonmeteorological echo (see Fig. 1). The echo classification also guides a separation for stratiform regions into columns having weaker to more prominent “bright band” Z signatures and/or snow influenced by aggregation processes (e.g., Fabry and Zawadzki, 1995). This classification performs a series of checks using 920-MHz profiler fields (Z, Vd, spectrum width, and a 5-gate standard deviation of Z) to designate likely Bragg echoes, followed by a pass to identify likely “bright band” points (e.g., Giangrande et al., 2008) and buffering/filtering thereafter. A final pass decides “convective”, “stratiform”, and stratiform that has “bright band” regions identified in the column. As suggested by previous Darwin profiler studies, our study will only consider snow properties collected up to 8.5 km and with Z>20 dBZ to avoid any concerns with profiler sensitivity or inability to properly sample media with altitude.
One advantage of the approach we take is that Vt is estimated as the residual of the air motion and Vd, avoiding undue assumptions on terminal fall speeds of individual hydrometeors. However, there are a few considerations that should be mentioned. The profiler pulse volumes are comparable to those found with scanning precipitation radar, with the horizontal dimension increasing with range for the vertically pointing radars and the vertical dimension increasing with range for the scanning radar. For the 50-MHz profiler at 5000 m range, a 3-deg (52.4 mRad) beamwidth corresponds to horizontal 260 m arclength (5000 m ⋅ 52.4 mRad) by 495 m vertical pulse-length cylindrical shaped radar pulse volume. This is similar to a scanning radar at 28 km, where a 1-deg (17.5 mRad) beamwidth produces a vertical 490 m arclength with 250 m horizontal pulse-length. For the dual-frequency method, the 920-MHz profiler 9-deg (157 mRad) beamwidth produces cylindrical radar pulse volume with a 785 m horizontal arclength and 525 m vertical length. With the 2×2 m 920-MHz profiler antenna located approximately 20 m from the 100×100 m 50-MHz profiler, the 50-MHz profiler pulse volume is always within the larger 920-MHz profiler pulse volume at ranges greater than 1.4 km. With 41 s dwell and 5 m s−1 horizontal advection, the effective horizontal resolution of the two radars are 670 m (50-MHz profiler) and 1.2 km (920-MHz profiler), as calculated using 2 ⋅ dwell ⋅ windspeed + horizontal arclength. Since only the 50-MHz profiler detects Bragg scattering, the retrieved vertical air motion horizontal scale depends only on the 50-MHz profiler beamwidth as the 920-MHz profiler data are only used to mask the hydrometeor signal in the 50-MHz profiler Doppler velocity power spectra. In convective cores, our focus is on data collected below 7.5 km (lower than for snow), to further limit beamwidth considerations on profiler observations (i.e., less than 800 m with 5 m s−1 advection); our sampling of core properties may also be helped because the strongest or widest coherent drafts are typically reported above the melting level (e.g., Giangrande et al., 2023). Potential radar misalignment is expected to be less impactful at Darwin where convection typically propagates slower (i.e., 5–10 m s−1) and in having extended time-height (15+ min) duration over the profilers (see also, Fig. 1). As a “bulk” exercise, we assume that matched volumes (scales) remain similar in the convective air motion and media conditions they capture, and no steady-state assumptions within those windows otherwise.
As noted by Heymsfield et al. (2023), aircraft observations through intense hail cores indicate that larger (and possibly fastest-falling) media sometimes are not collocated with the strongest updrafts, but closer to updraft periphery or updraft/downdraft interfaces (i.e., the largest Z echoes may not be collocated with the strongest updrafts). One final caveat for profiling radar applications is that non-uniform beam filling NBF contextually may promote lower bulk Z estimates for conditions having strong features at scales similar to the beamwidth. For example, NBF may result in conditionally faster estimates of Vt for a given Z; this is not because the Vt is improperly estimated, rather that corresponding “bulk” Z may be estimated (beam filled) low. Such factors could be impactful to “instantaneous” air motion retrievals that attempt to capture behaviors at fine scales. Since the typical spatiotemporal scales of slow-moving Darwin storms over these profilers often exceed 20 min and/or several kilometers in length, with native profiler resolution O (1 km) prior to profiler matching, NBF considerations for sub-beamwidth variations are expected as less important to the statistical properties we are reporting. Nevertheless, our discussions will be mindful of how profiler sampling may influence these results and/or intrinsic Z-Vt behaviors for a particular storm.
2.2 Darwin Precipitation Regime Breakdowns
The Darwin monsoon regime designations for this study follow radiosonde-based classifications previously documented by Pope et al. (2009) and associated precipitation behaviors reported by Giangrande et al. (2014). The primary breakdowns we consider are based on the thermodynamic profile regimes associated with the “Deep Westerly” or Active monsoon conditions (11 events), as well as the “Moist Easterly” or Break monsoon conditions (23 events) described by Pope et al. (2009) and established over multiple seasons. Typically, Active monsoon events are those associated with the highest precipitation (in terms of accumulation) at Darwin. Break monsoon events are also prolific precipitation producers, typically daytime events associated with higher values of convective available potential energy (CAPE) and drier midlevels, promoting DCCs having more intense rainfall rates and larger drop sizes.
Previous Darwin literature (e.g., Steiner et al., 1995; Tokay and Short, 1996; Bringi et al., 2009; Giangrande et al., 2014; Jackson et al., 2021) has demonstrated useful microphysical proxies to separate convective and stratiform precipitation regimes (e.g., Bringi et al., 2009). These studies attribute higher concentrations of smaller drops to convective precipitation DSDs (i.e., for a given Z). Similar concepts have been adopted by radar retrievals that apply different fall speed or rainfall rate relationships for convective and stratiform rain (e.g., Giangrande et al., 2016a). Our study consulted a multi-year (2011–2014) 2DVD video disdrometer record available through ARM as an independent reference for rain properties around Darwin (e.g., Jackson et al., 2021). For the disdrometer, we adopt a fit to Gunn and Kinzer (1949) drop fall speeds to those DSDs to obtain instrument-level mean Doppler velocity references for Vt (i.e., air motion assumed 0 m s−1 at ground level).
3.1 Examples of Dual-Frequency Profiler Fall Speed Retrievals in Rain
In Fig. 2, we plot cumulative 2D histograms for the retrieved Vt versus Z in convective (Fig. 2, left) and stratiform (Fig. 2, right) precipitation. As before, the profiler observations are drawn from 43 events, with most events featuring a mixture of echo classifications. For the stratiform samples in Fig. 2, the observations are only those collected from stratiform echo conditions identified below prominent radar bright band signatures by our column classification. For all samples shown, the observations are only included for altitudes below 2.5 km a.g.l., to avoid potential contamination of Z observations owing to the presence of partially-melted aggregates. In total, the histograms include approximately 16 000 convective rain 1-min samples, and 38 000 stratiform rain samples.
The solid lines on Fig. 2 follow a Steiner (1991) power-law fall-speed relation. This relation is of the form Vt = aZb, where Vt is the fall speed in [ms−1] adjusted to sea level, Z is the reflectivity factor in linear units [mm6 m−3], and the b coefficient is commonly fixed at a value of 0.1. The a coefficient for the left image has been assigned a value of 2.59, the matched value from this profiler convective rainfall dataset using a linear least-squares method. This value is consistent with prior convective studies, and agrees with the Darwin 2DVD record (4376, 1-min DSDs, matched a-coefficient of 2.7) if adopting Bringi et al. (2009) to identify “convective” DSDs (not shown). The standard deviation of residuals for disdrometer and profiler Vt estimates ≅1 m s−1 within the dBZ range, with higher standard deviations found at the higher rainfall rate conditions. For this least-squares fitting approach and examples that follow, the expressions are significant (e.g., p<0.001), as expected for larger datasets. The coefficient of determination R2 for this fit was 0.18, as tied to the natural variability observed in convective rain. Note, our best rain fits were found when adopting slightly lower b-coefficients (in all rain cases, approximately b≅0.08), but the impact was minor compared to the performances presented.
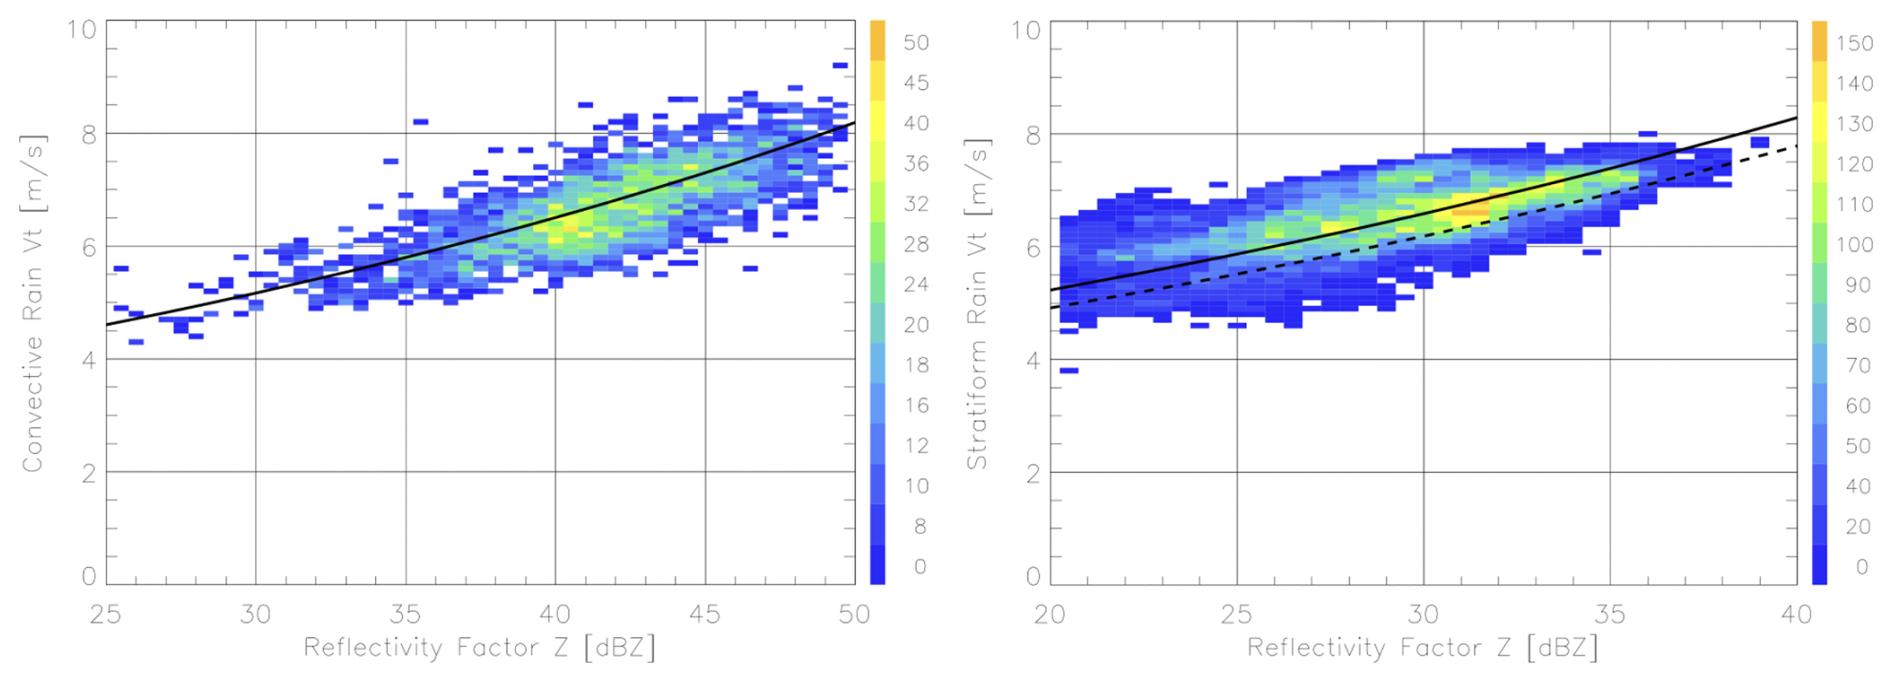
Figure 2Cumulative histograms for fall speed Vt (adjusted to sea level) versus radar reflectivity factor Z for “convective” rain (left) and “stratiform” rain (right) collected by the Darwin profiler at altitudes below 2.5 km. Solid lines represent the best-fit fall speed relationship having an “a” coefficient of 2.59 (convective, left) and 3.3 (stratiform, right) for a fixed b coefficient of 0.1. The dashed line on the stratiform plot represents a disdrometer-based fall speed relationship having an a coefficient of 3.1.
We plot the similar histograms for stratiform rain conditions in the right-hand plot on Fig. 2. The dashed line a coefficient is 3.1, which is the value associated with the 2DVD record for stratiform (27900, 1-min DSDs) following Bringi et al. (2009) classifications. The solid line on this plot is the matched behavior for the profiler stratiform observations ( dBZ), with a=3.3 (R2=0.44). The standard deviation of the residuals for stratiform is lower ≅0.6 m s−1.
Overall, the performance of the profiler approach to estimate Vt values as a function of Z is comparable to the variability found with disdrometer measurements under similar conditions. The standard deviation of residuals for profiler Vt estimates as a function of Z is typically less than 1 m s−1. The performance serves as confirmation that the profilers can characterize convective rain volumes that carry modest time-height gradients or variability in precipitation and/or air motions. Under convective rain conditions, the Darwin profiler data skews towards a “tropical” smaller-drop a-coefficient behavior (e.g., Giangrande et al., 2014). However, the stratiform a coefficient behavior for the Darwin profilers was found to be 3.3. At first glance, this may appear as an outlier compared to the 2DVD reference. Nevertheless, our choice to conditionally sample stratiform precipitation under pronounced bright bands was intentional, as we anticipated these stratiform conditions promote aggregation and/or breakup processes; conditions that favor DSDs below the melting layer having fewer and larger drops for a given Z (than a baseline “stratiform” reference, e.g., Gatlin et al., 2018). Here, the higher a coefficient result was expected, providing confidence bulk profiler concepts are sensitive to physical process changes in DSDs similar to what is currently expected from disdrometers. That is, when we consider the entire “stratiform” echo classifications to include periphery echoes (not shown), the matched a coefficient was similar to the disdrometers at 3.0 (R2=0.38).
3.2 Examples of Profiler Fall Speed Behaviors in Dry Snow in Stratiform (Above Bright Band)
As with rain properties below the melting level, we consider dual-frequency retrievals for Vt as a function of Z within snow regions above the melting level. These examples are an extension of previous work by Protat and Williams (2011), applied to lower altitudes (closer to the melting level) and/or higher Z estimates. Single radar techniques performed under these conditions are potentially less suitable for air motion retrievals using Vt-Z power-law assumptions since the variability of fall speed estimates will be on the same order as the vertical air motions. Protat and Williams (2011) previously estimated this variability for the Darwin dual-frequency profilers to be around 0.2–0.3 m s−1 in the case of anvil and other high altitude stratiform clouds. A more complete set of fall speed relationships (that follow similar power-law forms) has been reported by those authors, using habit archetypes adopted from Hong (2007).
In Fig. 3, we plot profiler Vt-Z 2D histograms at two separate altitude intervals (4.5 to 6.5 km in the left panel, and 6.5 to 8.5 km in the right panel). These intervals provide a simple proxy for bulk changes in snow density/type (e.g., standard expectation for Z profiles in stratiform to decrease with altitude) to illustrate possible variability in the relative terminal fall speed estimates. For this dataset, over 44 000 1-min profiler samples were collected for snow in this lower altitude interval, and over 16 000 samples were collected within the upper level altitude interval. For these plots, we overlay matched snow curves (solid lines) for our dataset that adopt a fixed b=0.19, as recently used by Giangrande et al. (2016a) for a coefficients that vary from 0.37 to 0.5. Previous Darwin studies by Protat and Williams (2011) developed under more generalized and/or higher altitude “stratiform” conditions (i.e., lower relative Z magnitudes) reported a coefficients that approached 0.5 for this similar b coefficient at 0.19. Recent studies by Matrosov (2023) report radar-based Vt-Z relations for dendritic and plate-type crystal sequences over ARM's Oliktok Point facility having a≈0.8 and b≈0.1. Our Darwin fits with b=0.19 yield an a coefficient of 0.45 (R2=0.02, standard deviation of residuals =0.45 m s−1) at the lower altitudes (left panel), and 0.41 (R2=0.01, standard deviation of residuals = 0.28 m s−1) at the higher altitudes. Our best-fit snow relationships (dashed lines on Fig. 3) were associated with a lower b coefficient =0.1, with a coefficients of 0.72 (lower altitudes, R2=0.06) and 0.62 (higher altitudes, R2=0.04).
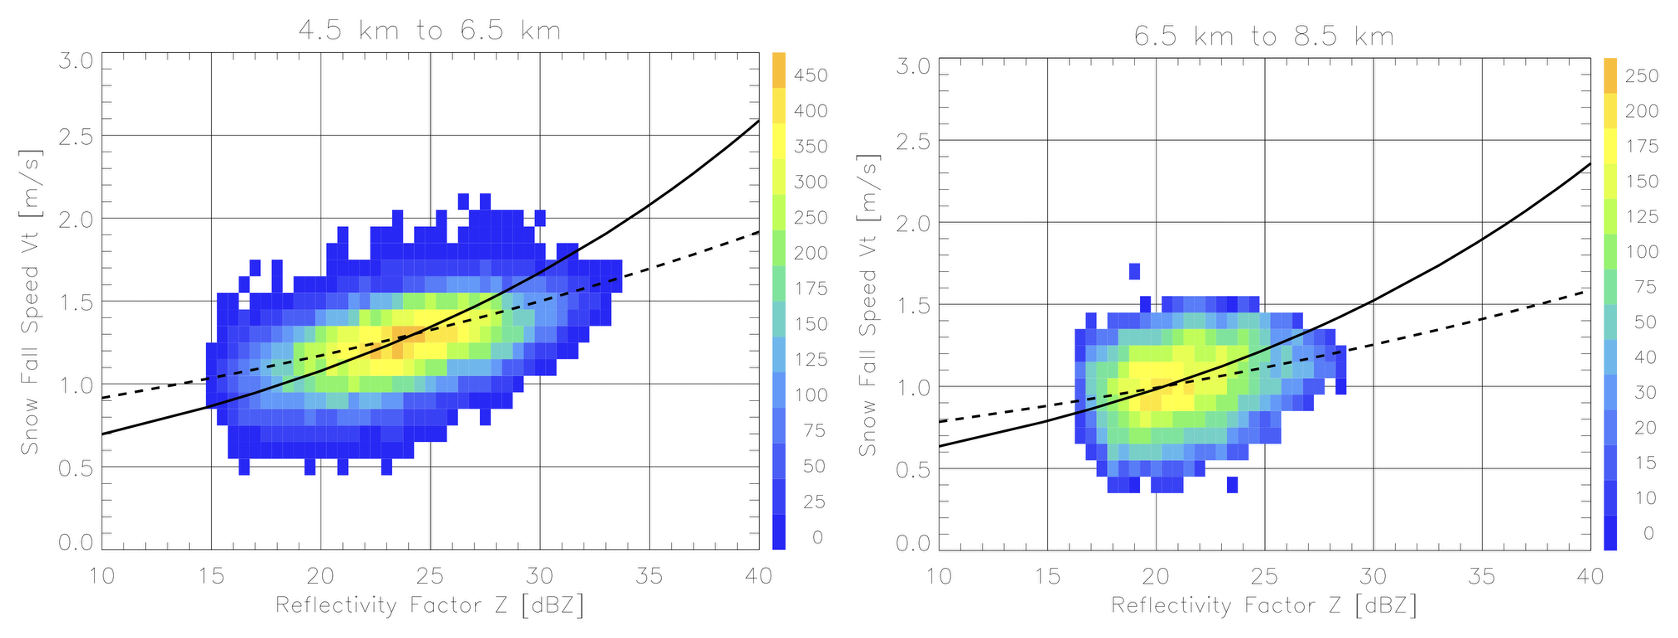
Figure 3Cumulative histograms for Darwin profiler fall speed Vt (adjusted to sea level) versus radar reflectivity factor Z for snow above bright band signatures, for heights between 4.5 km and 6.5 km a.g.l. (left panel), and 6.5 km and 8.5 km a.g.l. (right panel). The solid line represents the fall speed relationship coefficient a=0.45 (left panel) and 0.41 (right panel) for a fixed b coefficient of 0.19. The dashed lines represent our dataset best-fit a=0.72 (left panel) and 0.62 (right panel) for a fixed b=0.1.
Overall, profiler behaviors are consistent with prior fits intended for use in lower Z, higher altitude contexts. The sea level-adjusted Vt exceeds 1 m s−1 for Z greater than 20 dBZ and 1.4 m s−1 for Z of 30 dBZ. Our standard deviation of residuals for Darwin is similar to error statements found in Protat and Williams (2011), approx. 0.3–0.4 m s−1. However, these types of statements are contingent on whether one adopts an appropriate relationship for a particular ice/snow condition. As previously considered by Protat and Williams (2011), there is no expectation that a single “habit” relationship holds across all altitudes. In our examples, the best performance was associated with a lower b coefficient (0.1) similar to rain, and higher a than noted in Giangrande et al. (2016a). However, it may make physical sense for a shift towards a lower a coefficient (for a given b) contextually for dry snow near pronounced “bright bands”; these conditions promote increasing bulk Z values and slower (relative) fall speeds as associated with aggregation and/or larger aggregate snow (e.g., Zawadzki et al., 2005). In contrast, higher a coefficients and/or faster fall speeds (relative to the given Z) aloft are consistent with smaller, higher density ice that has not undergone aggregation.
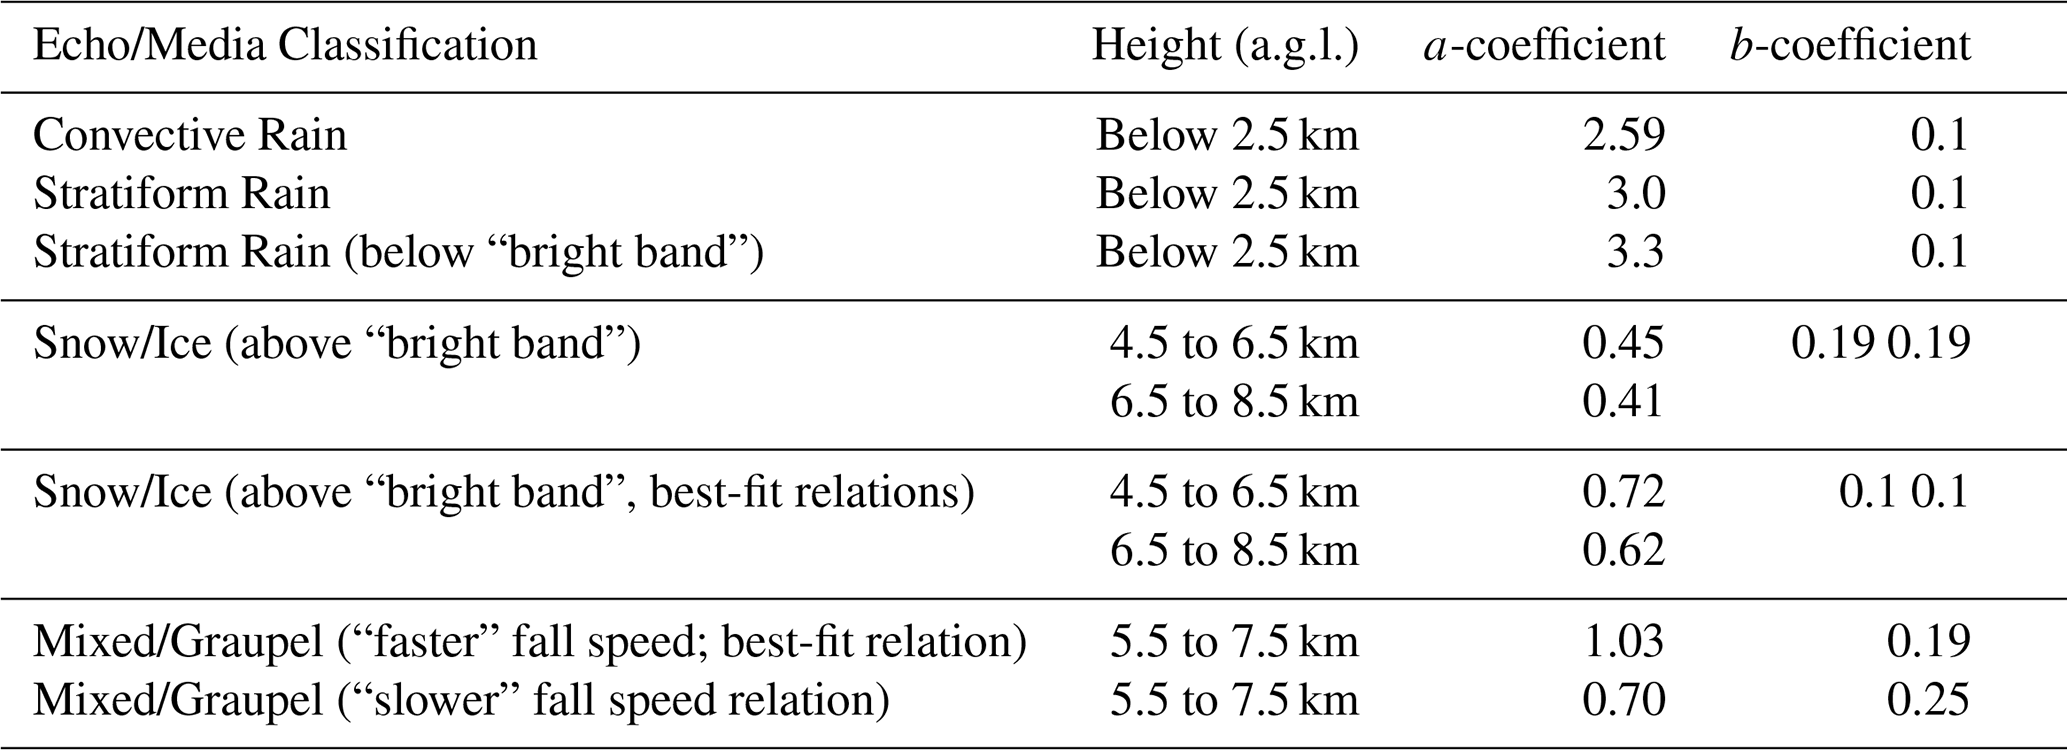
The previous sections introduced profiler estimates for bulk Vt under a variety of rain and widespread snow conditions in tropical DCCs, providing confidence this retrieval approach may yield unbiased and physical process sensitive fall speed estimates in precipitation with natural variability within 1 m s−1. This section expands into applications of these ideas for DCC updraft and/or core regions above the melting level, having radar volumes associated with more complicated mixtures of lofted rain, frozen drops, graupel and/or small hail, and where the presence of larger or higher density media may dominate bulk Z or Vd returns. Since there are no observational equivalents to these examples to author knowledge, this section adds a sensitivity study that is intended to test the natural variability in these retrievals as contingent on one classic example for larger-scale thermodynamic monsoon season regime controls on Darwin convection and its media properties. In Table 1, we provide a list of Darwin echo classifications and Vt-Z fixed coefficients from the previous and current sections.
Table 1A summary of reference Darwin profiler-matched media fall speed relationship coefficients assuming a Vt [ms−1] =aZb (Z in linear units [mm6 m−3]) functional fit. Fall speed relationship is at sea level pressure. Rain/snow relationships are expected applicable to a wide range of dBZ. Mixed/graupel relationships are expected to be applicable between dBZ as discussed in Sect. 4.1.
4.1 Cumulative Behavior in Deeper Convective Cores Aloft
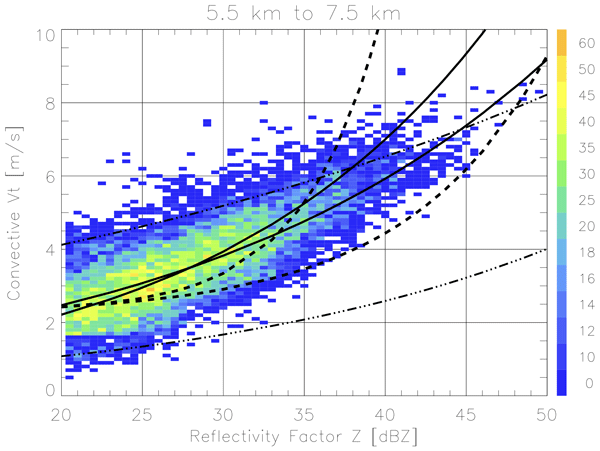
In Fig. 4, we plot a cumulative 2D histogram for Vt versus Z within the profiler columns identified as deep convective cells. This plot contains data collected at altitudes between 5.5 km and 7.5 km a.g.l. (31 000, 1-min samples). Select “graupel” fall speed relationships exist in the literature relevant to radar-based retrievals, specifically those suggested by Heymsfeld et al. (2010) from Tropical Anvils and Cirrus Layers (CRYSTAL) Florida Area Cirrus Experiment (FACE) aircraft observations and Giangrande et al., (2013, 2016a) as from modelling coupled with observational application during ARM field deployments. On Fig. 4, we include the convective rain and snow Vt-Z relationships from the previous sections (dashed-dotted lines), along with examples for Amazon (faster-falling, for a given Z) and Oklahoma (slower-falling, for a given Z) graupel relationships (dashed lines) taken from Giangrande et al. (2013, 2016a). Heymsfeld et al. (2010) provide a linear graupel relationship (not shown) with Vt values slower than the overlaid Oklahoma reference, but it is qualitatively similar. Finally, we overlay simple matched power-law fits (solid lines) from profiler datasets similar to previous sections, with these fits applied for the range dBZ. These fits were performed with two separate b coefficient assumptions, 0.19 (similar to previous “snow” concepts) and 0.25 (similar to higher-valued coefficients found in Giangrande et al., 2016a), yielding a coefficients of 1.03 (R2=0.52) and 0.70 (R2=0.40), respectively. The a coefficient of 1.03 was also the best-fit value for this dataset. The standard deviation of residuals was ≅ 1.1 to 1.3 m s−1 for these fits, respectively.
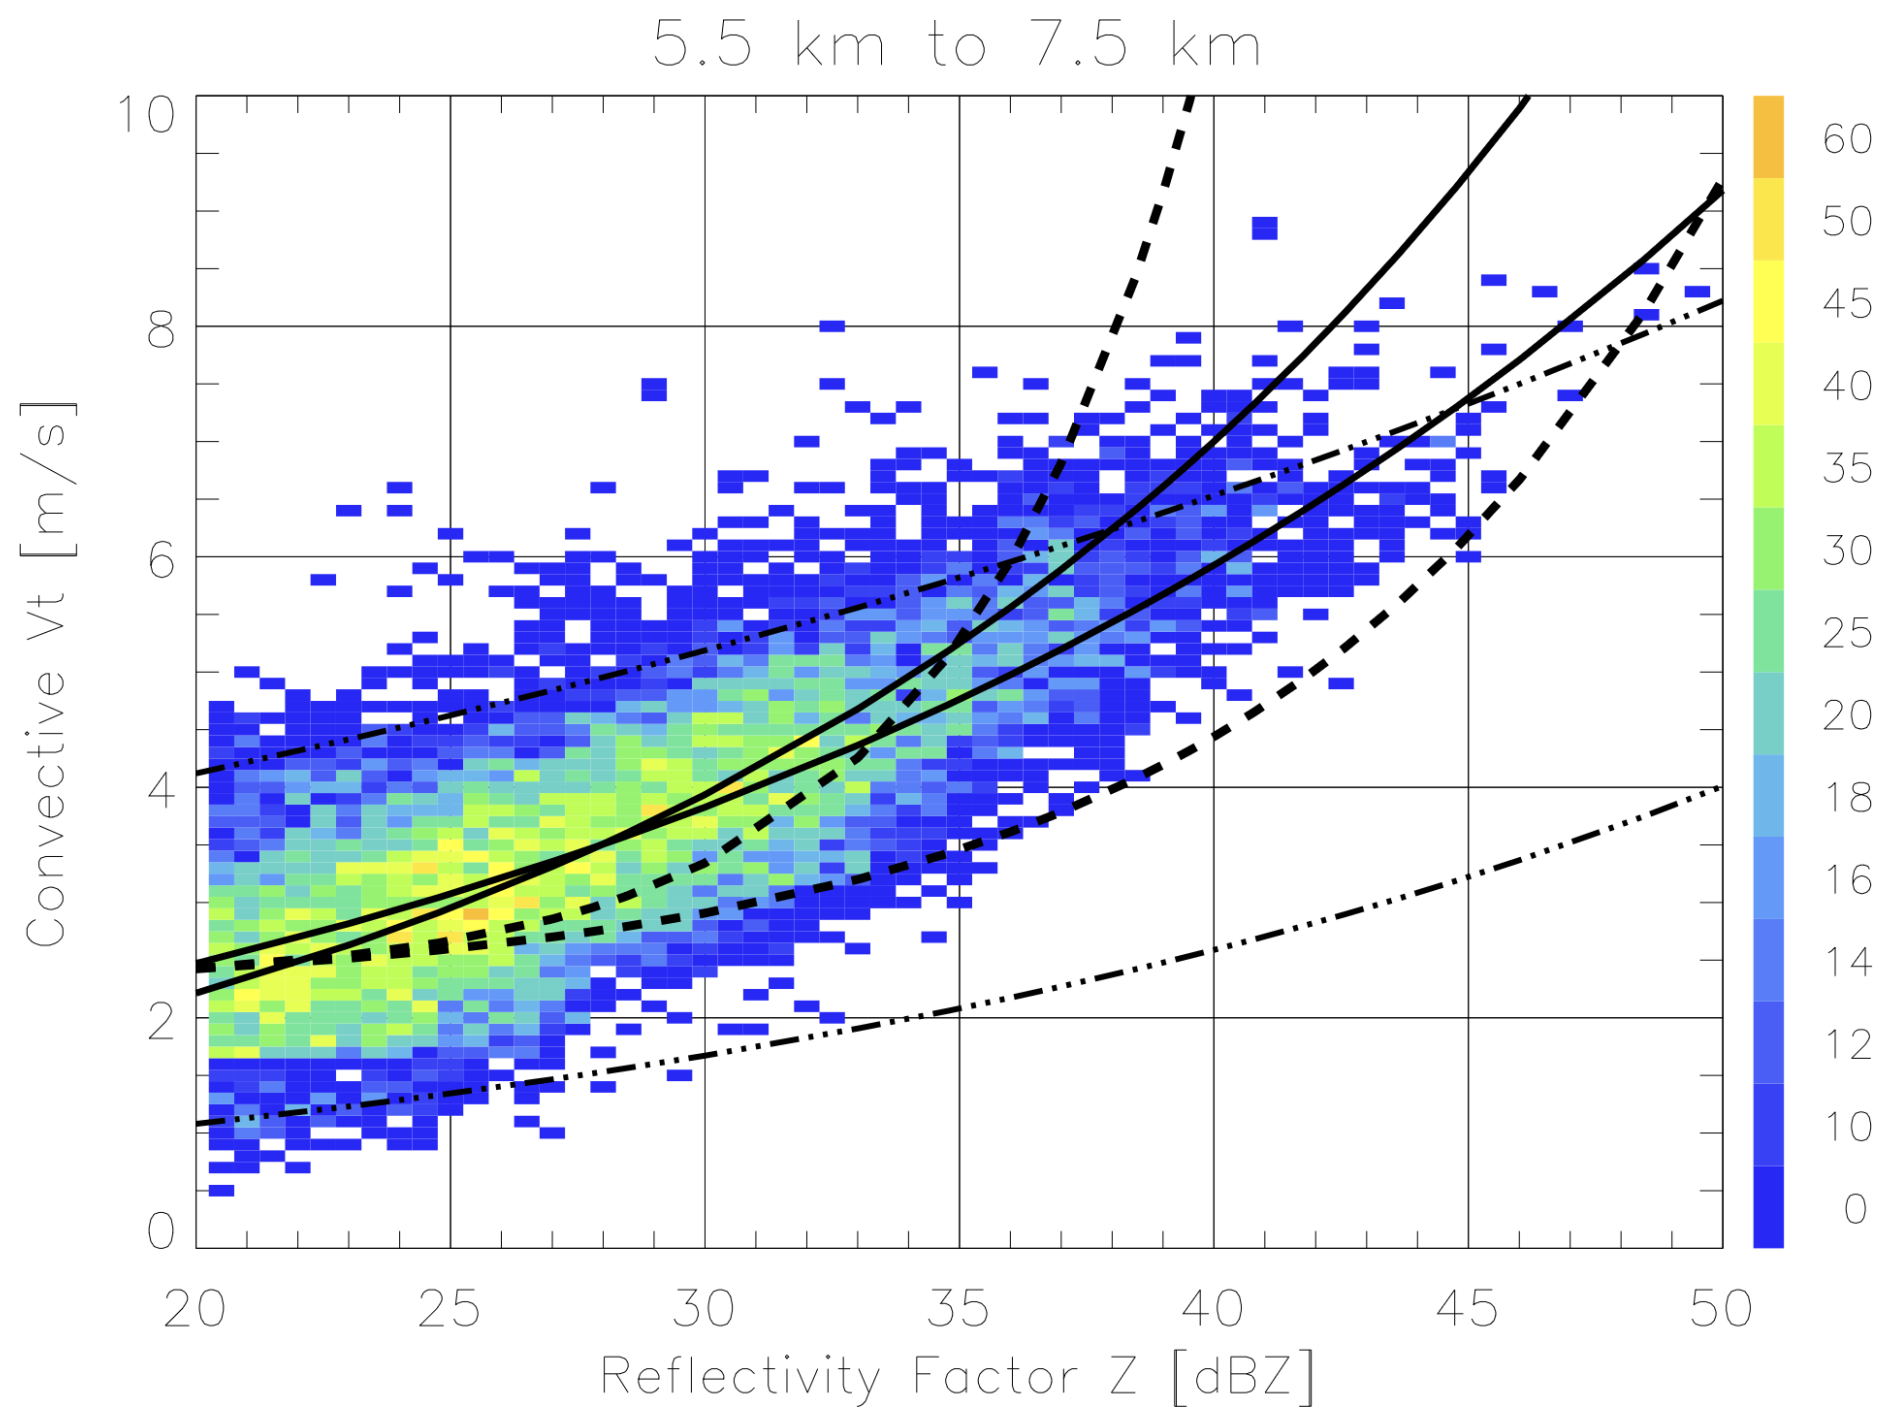
Figure 4Cumulative histograms for profiler fall speed Vt (adjusted to sea level) versus radar reflectivity factor Z for “convective” media for heights between 5.5 km and 7.5 km a.g.l. Solid lines are the matched profiler behaviors for fits having a coefficients = [1.0, 0.71] and b coefficients = [0.19, 0.25]. Dashed lines are “graupel” fall speed curves from Giangrande et al. (2013, 2016a). Dashed-dotted lines follow previous fall speed relationships for rain and snow.
The profiler media characteristics aloft are associated with slower-falling bulk Vt than rain DSDs having a similar Z; this implies lower-density ice media within these volumes. There is an absence of Vt observations for media having fall speeds faster (slower) than our previous rain (snow) relationships. Recall, as bulk radar-weighted fall speed estimates, concentrations of “rain/liquid” or “snow/ice” may also be present within these volumes. The matched graupel fits are consistent with previous studies that suggest fall speeds roughly 1–2 m s−1 slower than those expected for rain having a similar Z. These Darwin fits however suggest faster Vt in DCCs when compared to those previous studies, specifically within the observations associated with dBZ. We find the most consistency with the tropical-continental Amazon relationship used by Giangrande et al. (2016a). Note, Amazon studies were adjusted by those authors towards faster-falling behaviors based on author knowledge of Darwin datasets, but their focus was on Z>35 dBZ core regions. Overall, our observations fit within “piece-wise” designs previously implemented by others, where graupel relations are employed between intersection points with snow (Z≅20–25 dBZ) and rain (Z≅40–45 dBZ) relationships. The rain intersection of our Darwin profiler graupel curves occurs halfway between levels suggested by previous Amazon (tropical, Z≅35 dBZ) and Oklahoma (midlatitude, Z≅47 dBZ) continental studies.
As one physical interpretation, Giangrande et al. (2016a) suggested the Oklahoma (model-based) treatments may be appropriate for warm season Oklahoma storms that favored strong updrafts, drier midlevels, and the presence of larger and/or lower density graupel than expected for tropical/humid Amazon storms (higher density graupel, more frozen drops). Or, Oklahoma relations are those that argue for larger bulk Z associated with a similar Vt, or equivalently, a slower-falling bulk Vt for the same Z. At the larger values for Z>35 dBZ, Darwin profiler Vt observations land between these previous studies (note, Amazon studies assumed Vt of rain for Z>35 dBZ), yet closer to the prior Amazon for Z<35 dBZ. We may suggest a simple physical argument as did Giangrande et al. (2016a) that as one samples more tropical, humid core conditions, the same relative Z value may be associated with higher concentrations of frozen drops, higher density graupel and/or more melting of graupel. These changes in the media shift Vt to faster-falling values approaching those of rain (in this case, as compared to Oklahoma conditions). Interestingly, Darwin and prior observations seem to favor faster-falling Vt behaviors at the lower end of the Z range (). These include periphery or subsiding shell regions where profiling observations have come under additional focus (e.g., Mulhern et al., 2025). The next section expands on how larger-scale thermodynamic controls may shift DCC intensity towards changing storm intensity and/or media properties, including at core peripheries.
4.2 Breakdown According to Darwin Monsoonal Regime
Media density or fall speed should be sensitive to storm environments, as these conditions control updraft intensity and vertical variation, thus influence the likelihood and/or density of graupel, and propensity for media to loft, mix, detrain or recirculate within convective cores aloft. These variations in bulk media density and/or propensity towards liquid on ice upon melting also influence Vt and Z. A modeling effort by Vagasky et al. (2025) suggested that warmer, more tropical conditions may promote slower-falling hail in convection as owing to a higher propensity for melting, which would lead to a decrease in hailstone mass. As before, previous profiler studies have suggested that lower-density, slower-falling graupel were associated with drier midlevel Oklahoma conditions having also stronger updrafts, colder temperatures and higher evaporative cooling. This suggestion based on the model/microphysics used by Giangrande et al. (2013) may be incompatible with the observations from tropical, more humid and/or weaker updraft Darwin events. A shift into tropical and/or moister Darwin environments may offer one explanation for the differences we observed in the previous section, implying mixed-phase media in Darwin cells may more readily melt and/or reduce in size; This implies faster-falling or more rain-like fall speeds within cores. Observed spread may also be attributed to size sorting and other complexities of convective environments that observations sample (e.g., Ryzhkov et al., 2005; Kumjian and Ryzhkov, 2008) that are not currently captured by models.
In Fig. 5, we plot histograms as in Fig. 4, but separated according to the subsets of Active (11 events) versus Break (23 events) monsoon events. The same altitude range is considered (5.5 to 7.5 km, i.e., above the 500 mb level). These altitudes reflect where the regime-dependent discrepancies in the humidity profiles between composite Active and Break conditions are most evident (see also, composite radiosonde behaviors from Pope et al., 2009). The profilers collected over 8200 1-min samples in these height intervals from Active monsoon convective cells, and 14 800 1-min samples during Break monsoon convective cells. Note, there were 5 events classified as “Shallow Westerly” or suppressed monsoon days (e.g., May et al., 2008) that are associated with drier midlevels than the Active regime and higher mean CAPE values than the Break regime; For these events, profiler observations were similar to those from Break events (not shown).
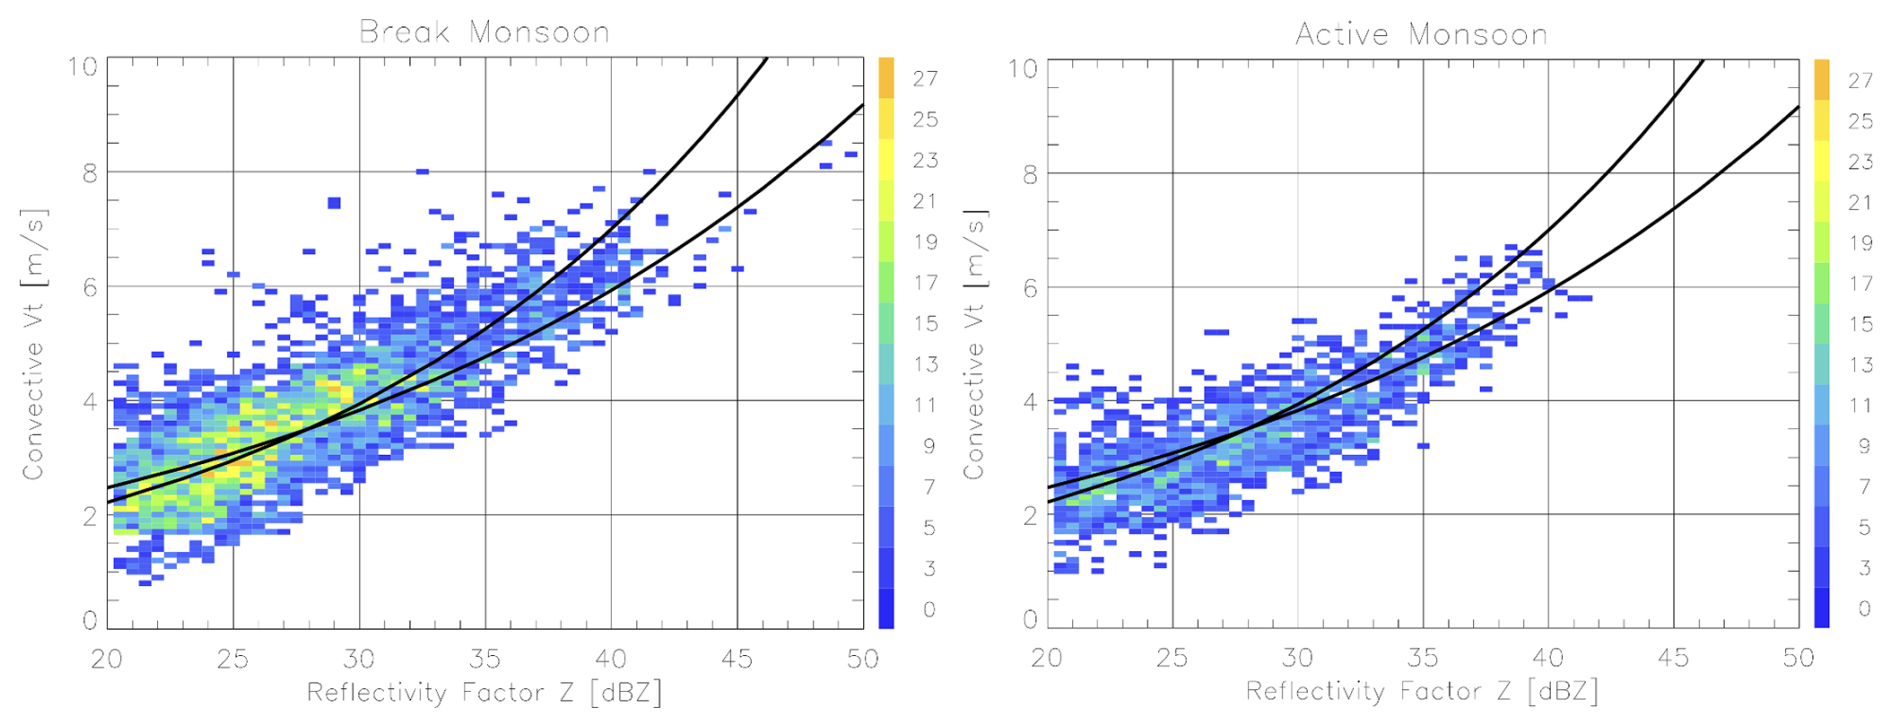
Figure 5As in Fig. 4, but for (left) Break monsoon and (right) Active monsoon regime date breakdowns. Solid line is matched to profiler behaviors for the fit having coefficients [a, b] = [1.0, 0.19]. Dashed line is for coefficients = [0.72, 0.25].
One shift between the regimes is that we observe more variability in Darwin Vt-Z pairs under Break conditions than Active, with the propensity that the profilers observe more frequent and faster-falling Vt-Z samples (e.g., those residing above the reference fits) for Break events. The most pronounced differences are suggested for Z<35 dBZ where the most observations were also collected. We also sample more frequent Vt-Z pairs to the larger ends of the histograms (i.e., higher rainfall rates, Z) for Break events, as expected if Break storms are typically more intense. Some variability was also anticipated for Break events given an assumed additional propensity to observe outlier Vt-Z estimates as associated with small hail, melting graupel or “big drops”, and other NBF or possible gradient influences discussed prior.
A physical argument to explain these differences is that the weaker (stronger) tropical convective updraft conditions may have relatively less (more) graupel production and/or riming, but also less (more) overall lofting of liquid above the melting level to these altitudes. In Fig. 5, we observe Vt-Z pairs for Break conditions that include pairs 1–2 m s−1 faster than our baseline Vt-Z best-fits for lower Z<35 dBZ regions. This observation appears consistent with the argument that stronger updrafts support the more likely presence of faster-falling and/or mixtures of graupel/rimed media with additional lofted liquid. Select Break Vt-Z pairs appear to even fall outside (faster than) the range of those associated with rain DSDs (i.e., >6 m s−1 for Z<35 dBZ). These outliers – as potentially associated with melting hail, melting aggregates, or other NBF-type issues – are uncommon, and may not be as frequent for tropical DCCs as for continental/midlatitudes. Break events did not favor large and faster-falling media at altitudes above 5.5 km a.g.l. associated with small hail, with the profilers rarely observing Z>45 dBZ at these altitudes, or Z>50 dBZ in lower-level rain (as in Fig. 2). However, this was not an attempt to isolate the strongest Break afternoon continental storms, higher-quality overpasses, or identify cells having matched lifecycle stages; Our displays likely will not represent the most pronounced separations between these regimes, and such conditional sampling considerations may be suitable to future studies as longer-term Darwin profiler records become available.
As a second finding, observations in Fig. 5 suggest that any regime-based Vt differences we observe are most pronounced at Z associated with the peripheries of tropical cores, not that either regime initially suggests faster Vt within the stronger core Z regions. These periphery regions are also those locations where we may expect additional factors contributing to faster Vt estimates relative to Z owing to sampling considerations. One possible takeaway from this is that there may not be intrinsically large differences between bulk graupel or mixed media Vt behaviors in higher Z cores for tropical convection contingent over a modest range of thermodynamic conditions and/or updraft intensity. This finding could be useful to convective parameterization if “graupel” fall speeds may be handled as relatively fixed, rather than requiring additional complexity to track different graupel densities or fall speeds. Further efforts to isolate the strongest Break examples from a longer Darwin record may be beneficial. As these observations are also unique to tropical settings, we cannot answer whether that prior Oklahoma core relation is reasonable to continental thermodynamic controls given the known differences between storms in these locations (i.e., stronger updrafts supporting large hail). If substituting Darwin Vt-Z behaviors over previous Oklahoma curves for retrieval purposes, this would otherwise result in potentially a 1–5 m s−1 increase at altitude in estimated updraft intensity in the strongest cores (additional increases also as related to hail fall speed underestimates).
In this study, observations from a dual-frequency profiler dataset are used to retrieve bulk Vt in tropical convective precipitation conditions, with analyses that focus on rain and behaviors for media above the melting level in deep convection. To instil confidence in these methods, we demonstrate retrieval viability within rain and widespread aggregate snow conditions having established expectations for Vt. Retrievals are communicated in the form of joint functions of the reflectivity factor Z, as consistent with disdrometer and other literature focused on radar-based or profiling retrievals. For rain examples, the approach differentiates key DSD shifts between convective and stratiform rain processes, consistent with previous disdrometer studies. In snow, this study expands on Vt-Z insights from prior Darwin efforts to include moderately precipitating stratiform conditions closer to the melting level/layer, showing good physical agreement between observed Vt-Z relationships and those adopted by the community.
A unique application for these profiler studies is attempted for the retrieval of joint Vt-Z characteristics within deep convective cells above the melting level. Convective observations aloft were well-constrained in Vt-Z depictions by rain and snow expectations, and specific Darwin mixed-phase Vt-Z observations showed modest agreement to Giangrande et al. (2013, 2016a) retrieval relationships for “core” regions. This study proposed best-fit Vt-Z relations for tropical convective use, and these carry similarities to relations suggested by previous tropical Amazon and midlatitude Oklahoma studies. Darwin observations more closely align with Amazon treatments for fall speeds at the lower relative Z (those that favor faster-falling graupel or mixed-phase behaviors overall), but Darwin best-fit relationships reside between Amazon and Oklahoma prior treatments with curves that gradually transitioned to rain Vt behaviors at a relative Z≅40 dBZ.
One key takeaway from these observations is that prior Vt-Z treatments may consistently underestimate fall speeds compared to Darwin observations for samples having lower Z. For the heights considered by our study, the samples are most often collected from the locations associated with the peripheries of cores. In these regions, prior Vt-Z relationships may underestimate the fall speeds by 1–2 m s−1. Moving into core regions having larger Z, relative interpretation becomes contingent on whether we compare with prior Oklahoma or Amazon-style relationships. Here, we find potentially important differences when comparing observations at Z>35 dBZ, as Darwin observations suggest a behavior between prior Oklahoma (continental, midlatitude) and Amazon (continental, tropical) references. For example, this is potentially important if prior Amazon studies may have too rapidly transitioned into “rain” fits, thus “overestimating” Vt in portions of these cores. Nevertheless, we find most offsets from Darwin are within previously stated retrieval errors reported by those studies.
For additional physical interpretation of our results, we consider the sensitivity of convective fall speed behaviors aloft to changes tied to DCC events initiated under different larger-scale thermodynamic regimes. These initial tests were accomplished by separating events according to Active and Break monsoon conditions. Break events are suggested as having DCCs initiate in environments associated with drier midlevels and more unstable atmospheric conditions; this would lead to more intense daytime storms having stronger updrafts to promote additional graupel production, riming, and/or more diverse convective media including higher concentrations of lofted liquid. We find both regimes exhibited graupel Vt-Z relationships that favored faster-falling media than Vt-Z curves from prior studies at lower Z. Active events were those that aligned better with prior studies, whereas Break events favored additional presence of faster-falling convective media aloft (wider diversity of Vt-Z behaviors). Moreover, the largest discrepancies between the Active and Break observations were found for media having dBZ, the peripheries of convective cores for the altitudes considered. We attribute Break findings to the additional presence of (melting) graupel, frozen drops, and lofted liquid in stronger updrafts size-sorted to those peripheries (wherein sorting/gradients may also contribute to select sampling discrepancies). When considering Vt-Z discussions initiated by Giangrande et al. (2013, 2016a), our more intense tropical Break conditions versus Active events did not appear consistent with prior arguments that stronger updrafts promote exclusively larger and lower density graupel media to the extent suggested for Oklahoma. This may partially be attributed to the limitations of a single monsoon season profiling dataset and its ability to isolate higher-quality daytime storms and environments that may promote the widest separations. However, Active and Break observations provide evidence for an overall “slower-falling” graupel fit into Z>35 dBZ regions, consistent with arguments that updraft regions at midlevels in Darwin promote some amount of lower-density graupel. For future consideration, the Darwin graupel fall speed Vt-Z relations in larger Z “cores” appear relatively invariant to broader thermodynamic shifts over the site. This may imply similar Vt-Z relations could be applied more generically to other sites across the tropics.
Our application was focused on informing Vt-Z behaviors useful to radar-based retrieval studies, however these ideas and datasets may also be of benefit to the wider community aiming to improve tropical deep convective cloud simulations. Fall speeds in convection are connected to surface rainfall rate, as in, if less (more) falls out, more (less) is available for detrainment and subsequent high cloud production that has implications for cloud feedbacks (Sherwood et al., 2020). Elsaesser et al. (2025) recently showed the differential impact that convective versus stratiform condensate fall speed may have on Earth system model outputs, with convective fall speeds controlling shortwave radiation, convective precipitation, while stratiform media fall speeds control outgoing longwave radiation and global scale thermodynamics simulations. Several convective parameterizations have microphysics rooted in fixed fall speed assumptions (typically, power-law functions of diameter) for graupel, ice/snow, liquid, and transitions between those media contingent on thresholds for the temperature, humidity and/or coupling of those with the vertical air motion (e.g., Elsaesser et al., 2017; Lin et al., 2021). Our results potentially argue that graupel, mixed-phase or other fall speed assumptions in tropical settings may be handled with simpler treatments. With further advancement in forward radar operators, it may also be possible to challenge graupel and/or rimed ice assumptions when coupled to other common assumptions for media distributions in tropical deep convection. Cloud-resolving modeling may attempt similar regime composites to explore controls on simulated graupel characteristics to help clarify whether modelled fall speeds, sizes and/or density for graupel are genuinely fixed to more continental/midlatitude Oklahoma conditions, or if the observed shift is predominantly a consequence of size-sorting/sampling in stronger updraft environments.
ARM data including the “VDISQUANTS” value-added product used by this study can be downloaded at https://www.arm.gov/ (last access: 21 October 2025). These data and VAP code requests may be accessed through the ARM Data Center “Data Discovery” portal found at:https://adc.arm.gov/discovery/ (last access: 14 July 2025). The Darwin dual-frequency profiler datasets (processed, calibrated for the 2005–2006 monsoon season) and the multi-year monsoon regime classification results (as also based on ARM/Darwin radiosonde raw launch datasets) are available through the BOM archive.
AP, CW contributed to preparing initial Darwin profiler datasets, velocity products, regime breakdown records, as well as troubleshooting therein. SG planned the experiments and additional product need, codes and comparisons. All authors contributed to the scientific discussion and to the writing of this paper.
The contact author has declared that none of the authors has any competing interests.
Publisher's note: Copernicus Publications remains neutral with regard to jurisdictional claims made in the text, published maps, institutional affiliations, or any other geographical representation in this paper. The authors bear the ultimate responsibility for providing appropriate place names. Views expressed in the text are those of the authors and do not necessarily reflect the views of the publisher.
This paper has been authored by employees of Brookhaven Science Associates, LLC, under contract DE-SC0012704 with the U.S. DOE. The publisher by accepting the paper for publication acknowledges that the United States Government retains a nonexclusive, paid-up, irrevocable, worldwide license to publish or reproduce the published form of this paper, or allow others to do so, for United States Government purposes. We acknowledge support from the Atmospheric Radiation Measurement (ARM) program, a user facility of the U.S. DOE, Office of Science, sponsored by the Office of Biological and Environmental Research. Additional support was from the Atmospheric Systems Research (ASR) program of that office. ARM data sets used for this study can be downloaded at http://www.arm.gov (last access: 14 July 2025) and associated with several VAPs as previously noted in the “Data Availability” section. The authors would also like to thank Greg Elsaesser, Virendra Ghate, and Israel Silber for their review of this manuscript, as well as helpful discussion and suggestions.
This research has been supported by the Biological and Environmental Research (grant no. DE-SC0012704).
This paper was edited by Pavlos Kollias and reviewed by two anonymous referees.
Anber, U. M., Giangrande, S. E., Donner, L. J., and Jensen, M. P.: Updraft Constraints on Entrainment: Insights from Amazonian Deep Convection, J. Atmos. Sci., 76, 2429–2442, https://doi.org/10.1175/JAS-D-18-0234.1, 2019.
Atlas, D., Srivastava, R. C., and Sekhon, R. S.: Doppler radar characteristics of precipitation at vertical incidence, Rev. Geophys., 11, 1–35, https://doi.org/10.1029/RG011i001p00001, 1973.
Balsley, B. B. and Gage, K. S.: On the use of radars for operational wind profiling, Bull. Am. Meteorol. Soc., 63, 1009–1018, 1982.
Bringi, V. N., Williams, C. R., Thurai, M., and May, P. T.: Using dual-polarized radar and dual-frequency profiler for DSD characterization: A case study from Darwin, Australia, J. Atmos. Ocean. Tech., 26, 2107–2122, https://doi.org/10.1175/2009JTECHA1258.1, 2009.
Byers, H. R. and Braham, R. R.: The Thunderstorm – Report of the Thunderstorm Project, U.S. Weather Bureau, Washington, D.C., 287 pp., 1949.
Caya, A.: Assimilation of radar observations into a cloud-resolving model, Ph.D. thesis, McGill University, Montreal, Quebec, Canada, 2001.
Chase, R. J., McGovern, A., Homeyer, C. R., Marinescu, P. J., and Potvin, C. K.: Machine Learning Estimation of Maximum Vertical Velocity from Radar, Artif. Intell. Earth Syst., 3, 230095, https://doi.org/10.1175/AIES-D-23-0095.1, 2024.
Del Genio, A. D.: Representing the sensitivity of convective cloud systems to tropospheric humidity in general circulation models, Surv. Geophys., 33, 637–656, https://doi.org/10.1007/s10712-011-9148-9, 2012.
Del Genio, A. D., Wu, J., and Chen, Y.: Characteristics of mesoscale organization in WRF simulations of convection during TWP-ICE, J. Climate, 25, 5666–5688, https://doi.org/10.1175/JCLI-D-11-00422.1, 2012.
Detwiler, A., Scannell, J., Kliche, D., and Williams, S.: Creating the Long-Term T-28 Instrumented Research Aircraft Data Archive, Bull. Am. Meteorol. Soc., 93, 1817–1820, https://doi.org/10.1175/BAMS-D-11-00066.1, 2012.
Donner, L. J.: A cumulus parameterization including mass fluxes, vertical momentum dynamics, and mesoscale effects, J. Atmos. Sci., 50, 889–906, https://doi.org/10.1175/1520-0469(1993)050<0889:ACPIMF>2.0.CO;2, 1993.
Donner, L. J., Seman, C. J., Hemler, R. S., and Fan, S.: A cumulus parameterization including mass fluxes, convective vertical velocities, and mesoscale effects: Thermodynamic and hydrological aspects in a general circulation model, J. Climate, 14, 3444–3463, https://doi.org/10.1175/1520-0442(2001)014<3444:ACPIMF>2.0.CO;2, 2001.
Donner, L. J., O'Brien, T. A., Rieger, D., Vogel, B., and Cooke, W. F.: Are atmospheric updrafts a key to unlocking climate forcing and sensitivity?, Atmos. Chem. Phys., 16, 12983–12992, https://doi.org/10.5194/acp-16-12983-2016, 2016.
Elsaesser, G. S., Del Genio, A. D., Jiang, J. H., and van Lier-Walqui, M.: An Improved Convective Ice Parameterization for the NASA GISS Global Climate Model and Impacts on Cloud Ice Simulation, J. Climate, 30, 317–336, https://doi.org/10.1175/JCLI-D-16-0346.1, 2017.
Elsaesser, G. S., van Lier-Walqui, M., Yang, Q., Kelley, M., Ackerman, A. S., Fridlind, A. M., Cesana, G. V., Schmidt, G. A., Wu, J., Behrangi, A., Camargo, S. J., De, B., Inoue, K., Leitmann-Niimi, N. M., and Strong, J. D. O.: Using machine learning to generate a GISS ModelE calibrated physics ensemble (CPE), J. Adv. Model. Earth Syst., 17, e2024MS004713, https://doi.org/10.1029/2024MS004713, 2025.
Fabry, F. and Zawadzki, I.: Long-Term Radar Observations of the Melting Layer of Precipitation and Their Interpretation, J. Atmos. Sci., 52, 838–851, https://doi.org/10.1175/1520-0469(1995)052<0838:LTROOT>2.0.CO;2, 1995.
Fan, J., Han, B., Varble, A., Morrison, H., North, K., Kollias, P., Chen, B., Dong, X., Giangrande, S. E., Khain, A., Lin, Y., Mansell, E., Milbrandt, J. A., Stenz, R., Thompson, G., and Wang, Y.: Cloud-resolving model intercomparison of an MC3E squall line case: Part I – Convective updrafts, J. Geophys. Res.-Atmos., 122, 9351–9378, https://doi.org/10.1002/2017JD026622, 2017.
Fan, J., Rosenfeld, D., Zhang, Y., Giangrande, S. E., Li, Z., Machado, L. A. T., Martin, S. T., Yang, Y., Wang, J., Artaxo, P., Barbosa, H. M. J., Braga, R. C., Comstock, J. M., Feng, Z., Gao, W., Gomes, H. B., Mei, F., Pöhlker, C., Pöhlker, M. L., Pöschl, U., and de Souza, R. A. F.: Substantial convection and precipitation enhancements by ultrafine aerosol particles, Science, 359, 411–418, https://doi.org/10.1126/science.aan8461, 2018.
Feng, Z., Leung, L. R., Liu, N., Wang, J., Houze, R. A., Li, J., Hardin, J. C., Chen, D., and Guo, J.: A global high-resolution mesoscale convective system database using satellite-derived cloud tops, surface precipitation, and tracking, J. Geophys. Res. Atmos., 126, e2020JD034202, https://doi.org/10.1029/2020JD034202, 2021.
Field, P. R., Heymsfield, A. J., Detwiler, A. G., and Wilkinson, J. M.: Normalized Hail Particle Size Distributions from the T-28 Storm-Penetrating Aircraft, J. Appl. Meteorol. Climatol., 58, 231–245, https://doi.org/10.1175/JAMC-D-18-0118.1, 2019.
Fiolleau, T. and Roca, R.: A database of deep convective systems derived from the intercalibrated meteorological geostationary satellite fleet and the TOOCAN algorithm (2012–2020), Earth Syst. Sci. Data, 16, 4021–4050, https://doi.org/10.5194/essd-16-4021-2024, 2024.
Foote, G. B. and du Toit, P. S.: Terminal velocity of raindrops aloft, J. Appl. Meteorol., 8, 249–253, 1969.
Galfione, A., Battaglia, A., Puigdomènech Treserras, B., and Kollias, P.: First insights into deep convection by the Doppler velocity measurements of the EarthCARE's Cloud Profiling Radar, EGUsphere [preprint], https://doi.org/10.5194/egusphere-2025-1914, 2025.
Gatlin, P. N., Petersen, W. A., Knupp, K. R., and Carey, L. D.: Observed Response of the Raindrop Size Distribution to Changes in the Melting Layer, Atmosphere, 9, 319, https://doi.org/10.3390/atmos9080319, 2018.
Giangrande, S. E., Krause, J. M., and Ryzhkov, A. V.: Automatic designation of the melting layer with a polarimetric prototype of the WSR-88D radar, J. Appl. Meteor. Climatol., 47, 1354–1364, https://doi.org/10.1175/2007jamc1634.1, 2008.
Giangrande, S. E., Luke, E. P., and Kollias, P.: Automated Retrievals of Precipitation Parameters Using Non-Rayleigh Scattering at 95 GHz, J. Atmos. Ocean. Tech., 27, 1490–1503, https://doi.org/10.1175/2010JTECHA1343.1, 2010.
Giangrande, S. E., Luke, E. P., and Kollias, P.: Characterization of Vertical Velocity and Drop Size Distribution Parameters in Widespread Precipitation at ARM Facilities, J. Appl. Meteorol. Climatol., 51, 380–391, https://doi.org/10.1175/JAMC-D-10-05000.1, 2012.
Giangrande, S. E., Collis, S., Straka, J., Protat, A., Williams, C., and Krueger, S.: A summary of convective-core vertical velocity properties using ARM UHF wind profilers in Oklahoma, J. Appl. Meteor. Climatol., 52, 2278–2295, https://doi.org/10.1175/JAMC-D-12-0185.1?utm_source=chatgpt.com, 2013.
Giangrande, S. E., Bartholomew, M. J., Pope, M., Collis, S., and Jensen, M. P.: A Summary of Precipitation Characteristics from the 2006–11 Northern Australian Wet Seasons as Revealed by ARM Disdrometer Research Facilities (Darwin, Australia), J. Appl. Meteorol. Climatol., 53, 1213–1231, https://doi.org/10.1175/JAMC-D-13-0222.1, 2014.
Giangrande, S. E., Toto, T., Jensen, M. P., Bartholomew, M. J., Feng, Z., Protat, A., Williams, C. R., Schumacher, C., and Machado, L.: Convective cloud vertical velocity and mass-flux characteristics from radar wind profiler observations during GoAmazon2014/5, J. Geophys. Res.-Atmos., 121, 12891–12913, https://doi.org/10.1002/2016JD025303, 2016a.
Giangrande, S. E., Toto, T., Bansemer, A., Kumjian, M. R., Mishra, S., and Ryzhkov, A. V.: Insights into riming and aggregation processes as revealed by aircraft, radar, and disdrometer observations for a 27 April 2011 widespread precipitation event, J. Geophys. Res.-Atmos., 121, 5846–5863, https://doi.org/10.1002/2015JD024537, 2016b.
Giangrande, S. E., Biscaro, T. S., and Peters, J. M.: Seasonal controls on isolated convective storm drafts, precipitation intensity, and life cycle as observed during GoAmazon2014/5, Atmos. Chem. Phys., 23, 5297–5316, https://doi.org/10.5194/acp-23-5297-2023, 2023.
Gunn, R. and Kinzer, G. D.: The terminal velocity of fall for water droplets in stagnant air, J. Atmos. Sci., 6, 243–248, 1949.
Hernandez-Deckers, D., Matsui, T., and Fridlind, A. M.: Updraft dynamics and microphysics: on the added value of the cumulus thermal reference frame in simulations of aerosol–deep convection interactions, Atmos. Chem. Phys., 22, 711–724, https://doi.org/10.5194/acp-22-711-2022, 2022.
Heymsfield, G. M., Tian, L., Heymsfield, A. J., Li, L., and Guimond, S.: Characteristics of deep tropical and subtropical convection from nadir-viewing high-altitude airborne Doppler radar, J. Atmos. Sci., 67, 285–308, https://doi.org/10.1175/2009JAS3132.1, 2010.
Heymsfield, A. J., Cecchini, M. A., Detwiler, A., Honeyager, R., and Field, P.: Exploring the Composited T-28 Hailstorm Penetration Dataset to Characterize Hail Properties within the Updraft and Downdraft Regions, J. Appl. Meteorol. Climatol., 62, 1803–1826, https://doi.org/10.1175/JAMC-D-23-0030.1, 2023.
Hong, G.: Radar backscattering properties of nonspherical ice crystals at 94 GHz, J. Geophys. Res., 112, D22203, https://doi.org/10.1029/2007JD008839, 2007.
Houze Jr., R. A.: Mesoscale Convective Systems, Rev. Geophys., 42, 1–43, https://doi.org/10.1029/2004RG000150, 2004.
Jackson, R., Collis, S., Louf, V., Protat, A., Wang, D., Giangrande, S., Thompson, E. J., Dolan, B., and Powell, S. W.: The development of rainfall retrievals from radar at Darwin, Atmos. Meas. Tech., 14, 53–69, https://doi.org/10.5194/amt-14-53-2021, 2021.
Jeyaratnam, J., Luo, Z. J., Giangrande, S. E., Wang, D., and Masunaga, H.: A satellite-based estimate of convective vertical velocity and convective mass flux: Global survey and comparison with radar wind profiler observations, Geophys. Res. Lett., 48, e2020GL090675, https://doi.org/10.1029/2020GL090675, 2021.
Kollias, P., Albrecht, B. A., and Marks, F.: Why Mie?, Bull. Am. Meteorol. Soc., 83, 1471–1484, https://doi.org/10.1175/BAMS-83-10-1471, 2002.
Kumar, V., Protat, A., May, P. T., Jakob, C., Penide, G., Kumar, S., and Davis, L.: On the effects of large-scale environment and surface types on convective cloud characteristics over Darwin, Australia, Mon. Weather Rev., 141, 1358–1374, https://doi.org/10.1175/MWR-D-12-00160.1, 2013.
Kumar, V. V., Jakob, C., Protat, A., Williams, C. R., and May, P. T.: Mass-flux characteristics of tropical cumulus clouds from wind profiler observations at Darwin, Australia, J. Atmos. Sci., 72, 1837–1855, https://doi.org/10.1175/JAS-D-14-0259.1, 2015.
Kumar, V. V., Protat, A., Jakob, C., Williams, C. R., Stephens, G. L., and May, P. T.: The estimation of convective mass flux from radar reflectivities, J. Appl. Meteorol. Climatol., 55, 1239–1257, https://doi.org/10.1175/JAMC-D-15-0193.1, 2016.
Kumjian, M. R. and Ryzhkov, A. V.: Polarimetric signatures in supercell thunderstorms, J. Appl. Meteorol. Climatol., 47, 1940–1961, 2008.
Laroche, S. and Zawadzki, I.: Retrievals of horizontal winds from single-Doppler clear-air data by methods of cross-correlation and variational analysis, J. Atmos. Ocean. Tech., 12, 721–738, 1995.
LeMone, M. A. and Zipser, E. J.: Cumulonimbus vertical velocity events in GATE. Part I: Diameter, intensity and mass flux, J. Atmos. Sci., 37, 2444–2457, https://doi.org/10.1175/1520-0469(1980)037<2444:CVVEIG>2.0.CO;2, 1980.
Lhermitte, R.: Observations of rain at vertical incidence with a 94 GHz Doppler radar: An insight of Mie scattering, Geophys. Res. Lett., 15, 1125–1128, 1988.
Lin, L., Fu, Q., Liu, X., Shan, Y., Giangrande, S. E., Elsaesser, G. S., Yang, K., and Wang, D.: Improved convective ice microphysics parameterization in the NCAR CAM model, J. Geophys. Res.-Atmos., 126, e2020JD034157, https://doi.org/10.1029/2020JD034157, 2021.
Lin, Y., Kumjian, M. R., Soderholm, J., and Giammanco, I.: Modeling Nonspherical Hailstones, J. Atmos. Sci., 81, 1849–1881, https://doi.org/10.1175/JAS-D-23-0231.1, 2024.
Matrosov, S. Y.: Frozen Hydrometeor Terminal Fall Velocity Dependence on Particle Habit and Riming as Observed by Vertically Pointing Radars, J. Appl. Meteor. Climatol., 62, 1023–1038, https://doi.org/10.1175/JAMC-D-23-0002.1, 2023.
May, P. T., Mather, J. H., Vaughan, G., Jakob, C., McFarquhar, G. M., Bower, K. N., and Mace, G. G.: The tropical warm pool international cloud experiment, Bull. Am. Meteorol. Soc., 89, 629–645, https://doi.org/10.1175/bams-89-5-629, 2008.
May, P. T., Long, C., and Protat, A.: The diurnal cycle of the boundary layer, convection, clouds, and surface radiation in a coastal monsoon environment (Darwin, Australia), J. Climate, 25, 5309–5326, 2012.
Mather, J. H. and Voyles, J. W.: The ARM Climate Research Facility: A Review of Structure and Capabilities, Bull. Am. Meteorol. Soc., 94, 377–392, https://doi.org/10.1175/BAMS-D-11-00218.1, 2013.
Matsui, T., Hernandez-Deckers, D., Giangrande, S. E., Biscaro, T. S., Fridlind, A., and Braun, S.: A thermal-driven graupel generation process to explain dry-season convective vigor over the Amazon, Atmos. Chem. Phys., 24, 10793–10814, https://doi.org/10.5194/acp-24-10793-2024, 2024.
Milbrandt, J. A. and Yau, M. K.: A multimoment bulk microphysics parameterization. Part I: Analysis of the role of the spectral shape parameter, J. Atmos. Sci., 62, 3051–3064, 2005.
Milbrandt, J. A., Morrison, H., Dawson II, D. T., and Paukert, M.: A Triple-Moment Representation of Ice in the Predicted Particle Properties (P3) Microphysics Scheme, J. Atmos. Sci., 78, 439–458, https://doi.org/10.1175/JAS-D-20-0084.1, 2021.
Morrison, H., Peters, J. M., Varble, A. C., Hannah, W. M., and Giangrande, S. E.: Thermal Chains and Entrainment in Cumulus Updrafts. Part I: Theoretical Description, J. Atmos. Sci., 77, 3637–3660, https://doi.org/10.1175/JAS-D-19-0243.1, 2020.
Mulhern, Q. R., Peters, J. M., and Mulholland, J. P.: Driving Mechanisms for Subsiding Shells in Simulations of Deep Moist Convection, EGUsphere [preprint], https://doi.org/10.5194/egusphere-2025-4495, 2025.
North, K. W., Oue, M., Kollias, P., Giangrande, S. E., Collis, S. M., and Potvin, C. K.: Vertical air motion retrievals in deep convective clouds using the ARM scanning radar network in Oklahoma during MC3E, Atmos. Meas. Tech., 10, 2785–2806, https://doi.org/10.5194/amt-10-2785-2017, 2017.
Öktem, R., Romps, D. M., and Varble, A. C.: No warm-phase invigoration of convection detected during GoAmazon, J. Atmos. Sci., 80, 2345–2364, https://doi.org/10.1175/JAS-D-22-0241.1, 2023.
Oue, M., Kollias, P., Shapiro, A., Tatarevic, A., and Matsui, T.: Investigation of observational error sources in multi-Doppler-radar three-dimensional variational vertical air motion retrievals, Atmos. Meas. Tech., 12, 1999–2018, https://doi.org/10.5194/amt-12-1999-2019, 2019.
Ovchinnikov, M., Giangrande, S., Larson, V. E., Protat, A., and Williams, C. R.: Dependence of vertical alignment of cloud and precipitation properties on their effective fall speeds, J. Geophys. Res.-Atmos., 124, 2079–2093, https://doi.org/10.1029/2018JD029346, 2019.
Peters, J. M., Morrison, H., Varble, A. C., Hannah, W. M., and Giangrande, S. E.: Thermal Chains and Entrainment in Cumulus Updrafts. Part II: Analysis of Idealized Simulations, J. Atmos. Sci., 77, 3661–3681, https://doi.org/10.1175/JAS-D-19-0244.1, 2020.
Peters, J. M., Morrison, H., Zhang, G. J., and Powell, S. W.: Improving the physical basis for updraft dynamics in deep convection parameterizations, J. Adv. Model. Earth Syst., 13, e2020MS002282, https://doi.org/10.1029/2020MS002282, 2021.
Pope, M., Jakob, C., and Reeder, M. J.: Regimes of the north Australian wet season, J. Climate, 22, 6699–6715, https://doi.org/10.1175/2009JCLI3057.1, 2009.
Prein, A. F., Ge, M., Valle, A. R., Wang, D., and Giangrande, S. E.: Towards a unified setup to simulate mid-latitude and tropical mesoscale convective systems at kilometer-scales, Earth Space Sci., 9, e2022EA002295, https://doi.org/10.1029/2022EA002295, 2022.
Protat, A. and Williams, C. R.: The accuracy of radar estimates of ice terminal fall speed from vertically pointing Doppler radar measurements, J. Appl. Meteorol. Climatol., 50, 2120–2138, https://doi.org/10.1175/jamc-d-10-05031.1, 2011.
Protat, A., Louf, V., and Brook, J.: SWIRL: The first Australian operational radar-based 3D wind analysis system, J. Atmos. Ocean. Tech., 41, 725–746, 2024.
Ramos-Valle, A. N., Prein, A. F., Ge, M., Wang, D., and Giangrande, S. E.: Grid spacing sensitivities of simulated mid-latitude and tropical mesoscale convective systems in the convective gray zone, J. Geophys. Res.-Atmos., 128, e2022JD037043, https://doi.org/10.1029/2022JD037043, 2023.
Ryzhkov, A. V., Giangrande, S. E., and Schuur, T. J.: Rainfall Estimation with a Polarimetric Prototype of WSR-88D, J. Appl. Meteorol. Climatol., 44, 502–515, https://doi.org/10.1175/JAM2213.1, 2005.
Sanderson, B. M., Piani, C., Ingram, W. J., Stone, D. A., and Allen, M. R.: Towards constraining climate sensitivity by linear analysis of feedback patterns in thousands of perturbed-physics GCM simulations, Climate Dyn., 30, 175–190, 2008.
Schumacher, C., Stevenson, S. N., and Williams, C. R.: Vertical motions of the tropical convective cloud spectrum over Darwin, Australia, Q. J. Roy. Meteor. Soc., 141, 2277–2288, https://doi.org/10.1002/qj.2520, 2015.
Sherwood, S. C., Webb, M. J., Annan, J. D., Armour, K. C., Forster, P. M., Hargreaves, J. C., Hegerl, G., Klein, S. A., Marvel, K. D., Rohling, E. J., Watanabe, M., Andrews, T., Braconnot, P., Bretherton, C. S., Foster, G. L., Hausfather, Z., von der Heydt, A. S., Knutti, R., Mauritsen, T., Norris, J. R., Proistosescu, C., Rugenstein, M., Schmidt, G. A., Tokarska, K. B., and Zelinka, M. D.: An assessment of Earth's climate sensitivity using multiple lines of evidence, Rev. Geophys., 58, e2019RG000678, https://doi.org/10.1029/2019RG000678, 2020.
Steiner, M.: A new relationship between mean Doppler velocity and differential reflectivity, J. Atmos. Ocean. Tech., 8, 430–443, 1991.
Steiner, M., Houze, R. A., and Yuter, S. E.: Climatological Characterization of Three-Dimensional Storm Structure from Operational Radar and Rain Gauge Data, J. Appl. Meteorol. Climatol., 34, 1978–2007, https://doi.org/10.1175/1520-0450(1995)034<1978:CCOTDS>2.0.CO;2, 1995.
Straka, J. M. and Mansell, E. R.: A bulk microphysics parameterization with multiple ice precipitation categories, J. Appl. Meteorol., 44, 445–466, 2005.
Tao, W., Takayabu, Y. N., Lang, S., Shige, S., Olson, W., Hou, A., Skofronick-Jackson, G., Jiang, X., Zhang, C., Lau, W., Krishnamurti, T., Waliser, D., Grecu, M., Ciesielski, P. E., Johnson, R. H., Houze, R., Kakar, R., Nakamura, K., Braun, S., Hagos, S., Oki, R., and Bhardwaj, A.: TRMM Latent Heating Retrieval: Applications and Comparisons with Field Campaigns and Large-Scale Analyses, Meteorol. Monogr., 56, 2.1–2.34, https://doi.org/10.1175/AMSMONOGRAPHS-D-15-0013.1, 2016.
Tokay, A. and Short, D. A.: Evidence from tropical raindrop spectra of the origin of rain from stratiform versus convective clouds, J. Appl. Meteorol., 35, 355–371, https://doi.org/10.1175/1520-0450(1996)035<0355:EFTRSO>2.0.CO;2, 1996.
Vagasky, H. C., Adams-Selin, R. D., Bang, S. D., Heymsfield, A. J., and Bansemer, A.: The Sensitivity of Falling Hail to Different Melting and Terminal Velocity Parameterizations and Environmental Conditions, Mon. Weather Rev., 153, 2535–2554, https://doi.org/10.1175/MWR-D-24-0180.1, 2025.
Varble, A., Zipser, E. J., Fridlind, A. M., Zhu, P., Ackerman, A. S., Chaboureau, J.-P., Collis, S., Fan, J., Hill, A., and Shipway, B.: Evaluation of cloud-resolving and limited area model intercomparison simulations using TWP-ICE observations: 1. Deep convective updraft properties, J. Geophys. Res.-Atmos., 119, 13891–13918, https://doi.org/10.1002/2013JD021371, 2014.
Wang, D., Giangrande, S. E., Schiro, K., Jensen, M. P., and Houze, R. A.: The characteristics of tropical and midlatitude mesoscale convective systems as revealed by radar wind profilers, J. Geophys. Res.-Atmos., 124, 4601–4619, https://doi.org/10.1029/2018JD030087, 2019.
Wang, D., Giangrande, S. E., Feng, Z., Hardin, J. C., and Prein, A. F.: Updraft and Downdraft Core Size and Intensity as Revealed by Radar Wind Profilers: MCS Observations and Idealized Model Comparisons, J. Geophys. Res.-Atmos., 125, e2019JD031774, https://doi.org/10.1029/2019JD031774, 2020.
Wakasugi, K., Mizutani, A., Matsuo, M., Fukao, S., and Kato, S.: A Direct Method for Deriving Drop-Size Distribution and Vertical Air Velocities from VHF Doppler Radar Spectra, J. Atmos. Ocean. Tech., 3, 623–629, https://doi.org/10.1175/1520-0426(1986)003<0623:ADMFDD>2.0.CO;2, 1986.
Williams, C. R.: Vertical air motion retrieved from dual-frequency profiler observations, J. Atmos. Ocean. Tech., 29, 1471–1480, https://doi.org/10.1175/JTECH-D-11-00176.1, 2012.
Williams, C. R., Barrio, J., Johnston, P. E., Muradyan, P., and Giangrande, S. E.: Calibrating radar wind profiler reflectivity factor using surface disdrometer observations, Atmos. Meas. Tech., 16, 2381–2398, https://doi.org/10.5194/amt-16-2381-2023, 2023.
Zawadzki, I., Szyrmer, W., Bell, C., and Fabry, F.: Modeling of the Melting Layer. Part III: The Density Effect, J. Atmos. Sci., 62, 3705–3723, https://doi.org/10.1175/JAS3563.1, 2005.
Zipser, E. J. and LeMone, M. A.: Cumulonimbus vertical velocity events in GATE. Part II: Synthesis and model core structure, J. Atmos. Sci., 37, 2458–2469, 1980.
- Abstract
- Introduction
- Dataset and Methodology
- Proof of Concept: Fall Speed Estimates Under Rain and Snow Conditions
- Results from Profiler Retrievals in Deeper Convective Cores Aloft
- Summary
- Code and data availability
- Author contributions
- Competing interests
- Disclaimer
- Acknowledgements
- Financial support
- Review statement
- References
- Abstract
- Introduction
- Dataset and Methodology
- Proof of Concept: Fall Speed Estimates Under Rain and Snow Conditions
- Results from Profiler Retrievals in Deeper Convective Cores Aloft
- Summary
- Code and data availability
- Author contributions
- Competing interests
- Disclaimer
- Acknowledgements
- Financial support
- Review statement
- References