
the Creative Commons Attribution 4.0 License.
the Creative Commons Attribution 4.0 License.
 | 14 Oct 2026
Spectral signatures of zenith sky radiance from surface-based sky radiometers: implications for clear- and cloudy-sky detection

Hitoshi Irie
Hiroshi Kobayashi
Isamu Morino
Yoshitaka Jin
Tadahiro Hayasaka
Hironobu Iwabuchi
Tamio Takamura
Yoshiki Takayama
Accurate identification of clear- and cloudy-sky conditions is essential for reliable aerosol and cloud retrievals from ground-based remote sensing observations. This study investigates the spectral characteristics of zenith sky radiance measured by SKYNET sky radiometers and evaluates their potential for distinguishing clear- and cloudy-sky conditions. For a given wavelength pair, the spectral slope derived from the measured signals (mobs) was separated into atmospheric (matm) and wavelength-dependent instrumental (minst) contributions. Radiative transfer simulations demonstrated that matm is strongly negative under cloud-free conditions and systematically shifts toward less negative values under cloudy conditions, providing a physical basis for matm-based sky-state discrimination. Based on these theoretical analyses, together with observational analyses of spectral zenith radiances and the dependence of matm on solar geometry, aerosol properties, and cloud properties for obervation data at multiple sites representing diverse atmospheric environments, including urban, maritime, tropical continental, and polar regions, practical criteria using matm were developed to classify observations into clear, cloudy, and undetermined categories. All four wavelength pairs examined (0.400–0.675, 0.400–0.870, 0.500–0.675, and 0.500–0.870 µm) provided robust discrimination, with the 0.500–0.675 µm pair showing the best and most consistent overall performance across the observation sites. Independent validation using collocated direct normal irradiance measurements confirmed the physical consistency of the matm-based classification. Further comparison with an existing cloud-screening procedure showed good agreement in clear-sky aerosol data extracted using the newly developed method across diverse atmospheric environments. Overall, these results demonstrate that spectral zenith sky radiance can provide a simple and physically interpretable basis for clear- and cloudy-sky detection, provided that the wavelength-dependent instrumental contribution is appropriately characterized. Incorporating such spectral diagnostics into ground-based radiometric networks can improve cloud screening and enhance the reliability of long-term aerosol and cloud climatological analyses.
- Article
(5334 KB) - Full-text XML
- BibTeX
- EndNote


Aerosols and clouds play fundamental roles in the Earth's radiation budget and environmental systems by regulating the balance between incoming solar radiation and outgoing terrestrial radiation, while simultaneously influencing atmospheric thermodynamic structure and hydrological processes (IPCC, 2023). Through scattering and absorption of solar and terrestrial radiation, aerosols modify atmospheric heating rates and surface energy availability, whereas clouds exert strong radiative forcing by reflecting shortwave radiation and trapping longwave radiation. These processes directly affect atmospheric circulation, precipitation formation, and climate feedback mechanisms. Consequently, accurate characterization of aerosols and clouds is essential for understanding the Earth system and reducing uncertainties in climate projections.
Advances in remote sensing technologies over the past decades have substantially improved the capability to observe atmospheric constituents from both satellite platforms and ground-based systems. Satellite observations provide extensive spatial coverage and enable global monitoring of aerosol and cloud distributions, while ground-based measurements offer high temporal resolution that are often difficult to obtain from spaceborne sensors. Within such observational frameworks, ground-based remote sensing instruments such as the SKYNET sky radiometer network (Nakajima et al., 2020) have proven particularly valuable. SKYNET sky radiometers provide high-quality spectral direct solar irradiance and diffuse sky radiance measurements that enable retrievals of key aerosol properties including aerosol optical thickness, single scattering albedo, and particle size distributions (Hashimoto et al., 2012; Kudo et al., 2021; Nakajima et al., 1996, 2020). In addition to aerosol observations, recent methodological developments have demonstrated that these instruments can also be used to retrieve cloud optical properties such as cloud optical depth and cloud particle effective radius from spectral zenith radiance measurements (Khatri et al., 2018, 2019, 2022). Because the measurements are obtained continuously with high temporal resolution, sky radiometers provide valuable long-term datasets that complement satellite retrievals and serve as high-quality reference observations for validation and climatological analyses.
Such datasets have been widely used in studies aimed at improving the understanding of aerosol–cloud interactions, evaluating satellite products, and examining regional and long-term atmospheric variability (e.g., Bi et al., 2014; Damiani et al., 2019; Irie et al., 2019; Khatri et al., 2010, 2014a, 2018, 2022; Ningombam et al., 2024; Wang et al., 2014). In addition, under clear-sky conditions, i.e., sky conditions in which the observations are unaffected by clouds, the sky radiometers can provide information on atmospheric gases such as water vapor (Campanelli et al., 2014) and ozone (Khatri et al., 2014b) along with aerosol properties. These capabilities demonstrate that sky radiometer observations constitute a versatile dataset for investigating multiple atmospheric components within a unified observational framework.
Given these diverse applications, reliable discrimination between clear-sky and cloudy-sky conditions is a fundamental prerequisite for maximizing the utility of sky radiometer observations. Many aerosol retrieval algorithms assume cloud-free conditions because clouds strongly perturb the radiative field and can introduce substantial biases in aerosol optical property retrievals. Similarly, atmospheric absorbing gases retrieval methods relying on spectral absorption features require uncontaminated clear-sky measurements to ensure accuracy. The sky-condition classification is therefore essential for maintaining data quality, improving retrieval reliability, and strengthening the credibility of satellite validation and model evaluation studies that rely on ground-based reference observations.
Despite its importance, a discrimination between clear and cloudy skies remains challenging in practical observations. Thin cirrus clouds, subvisual cloud layers, and rapidly evolving cloud fields can produce radiative signatures that resemble clear-sky conditions when evaluated using traditional screening approaches. In addition, atmospheric conditions characterized by high aerosol loading – such as mineral dust outbreaks, biomass-burning plumes, or pollution events – can significantly increase atmospheric turbidity. Under such conditions, irradiance variability or other statistical indicators used for cloud screening may incorrectly classify aerosol-rich but cloud-free skies as cloudy. These factors introduce uncertainties in sky-condition classification and can degrade the quality of derived atmospheric products.
Several cloud detection approaches have been proposed to address this problem.For example, the method developed by Khatri and Takamura (2009), uses the temporal variability of global irradiance, wavelength dependency behaviour of aerosols, and statistical approach to identify cloud contamination, while Song et al. (2014) and Choi et al. (2020) use somewhat different approaches. Although these approaches have proven useful in many applications, they may exhibit limitations under conditions characterized by complex aerosol loading or rapidly evolving cloud fields. Consequently, there remains a need for a simple physically interpretable method for discriminating between clear and cloudy sky conditions using readily available observational parameters.
To address these issues, it is necessary to investigate observational quantities that exhibit direct sensitivity to cloud scattering processes. Among them, spectral zenith radiance measured by sky radiometers provide particularly valuable information for sky-condition discrimination. Zenith sky radiances are directly influenced by scattering from cloud particles within the instrument's instantaneous field of view, making them sensitive indicators of cloud presence even when cloud optical thickness is relatively small (Khatri et al., 2018, 2019, 2022). Despite this strong physical sensitivity to cloud scattering, zenith radiance observations have not yet been fully exploited in operational cloud-screening procedures for sky radiometer datasets. This gap suggests that additional investigation into the potential of zenith radiances could lead to improved methods for sky-condition classification.
The present study aims to systematically evaluate the capability of spectral zenith radiance measurements for discriminating between clear and cloudy sky conditions. Rather than retrieving aerosol or cloud properties, the proposed method provides an efficient preprocessing or postprocessing screening procedure to support subsequent aerosol and cloud retrievals. In this framework, sky-state detection is performed based on the spectral dependence of zenith-sky radiance after removing the wavelength-dependent instrumental contribution, thereby eliminating the need for preliminary aerosol retrievals, temporal variability analyses, or ancillary observations. Based on theoretical analyses, together with observational analyses at multiple sites representing diverse atmospheric environments, including urban, maritime, tropical continental, and polar regions, the study establishes simple criteria for sky-state classification. The proposed method is intended to complement existing cloud-screening techniques for aerosol studies while remaining independent of the subsequent retrieval methodology. Furthermore, the method has direct relevance to cloud retrieval approaches based on zenith-sky radiance measurements, such as that demonstrated by Khatri et al. (2019), because cloud presence can be identified from the same measurements used for cloud retrieval. Thus, the method can provide an initial screening step prior to cloud retrieval. Because the proposed method relies on the physical characteristics of spectral zenith radiance rather than network-specific processing procedures, it also has the potential to be extended to other observational networks, such as AERONET (Holben et al., 1998), that acquire comparable measurements.
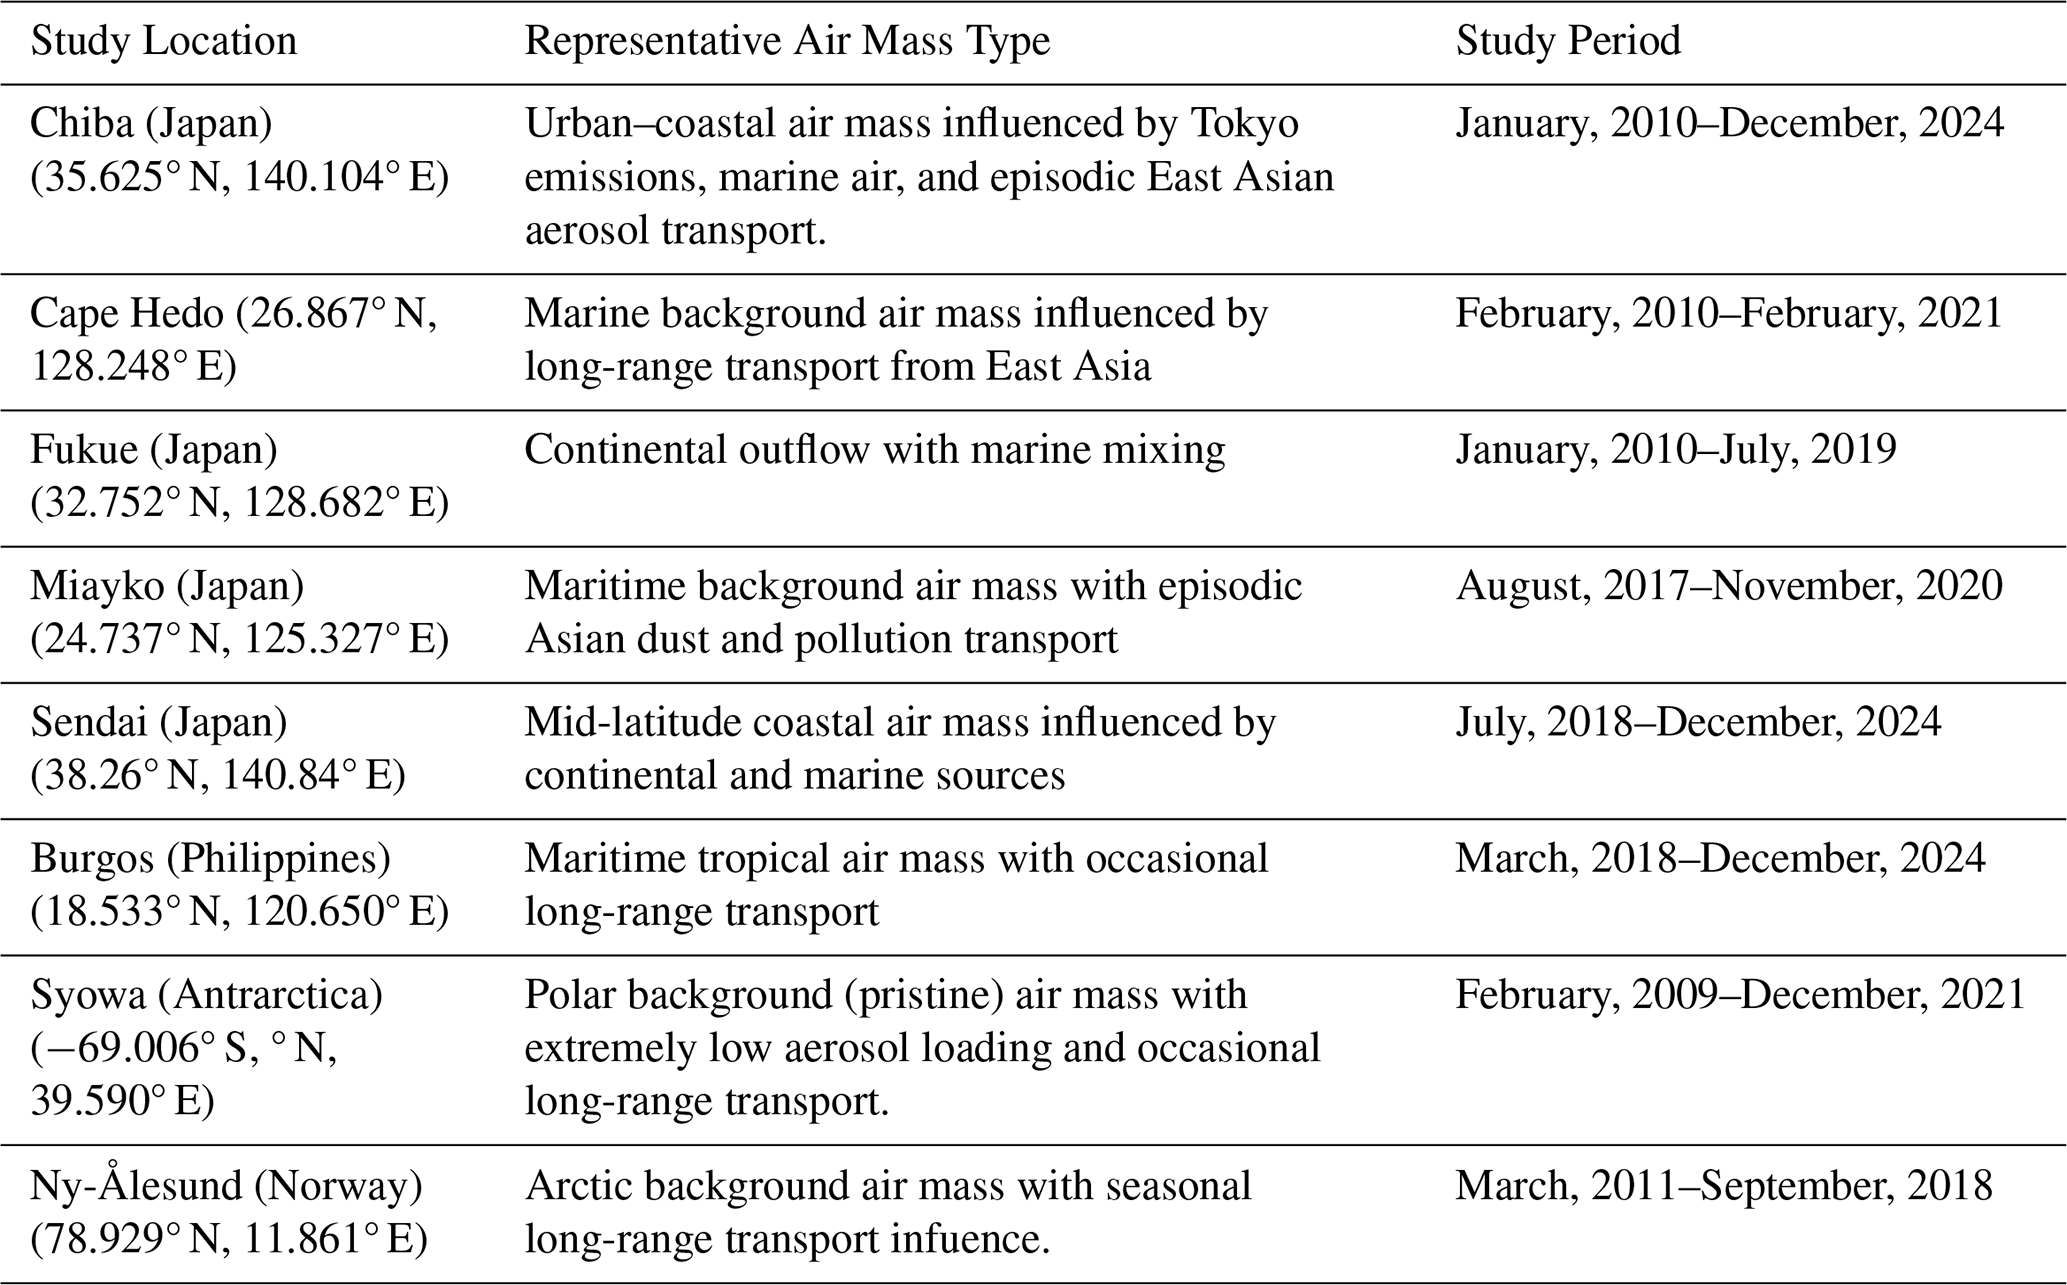
This study analyses observation data from eight SKYNET sites, including Chiba, Cape Hedo, Fukue, Miyako, Sendai, Burgos, Syowa, and Ny-Ålesund, which collectively cover a wide range of atmospheric conditions across mid-latitude, tropical, and polar environments (Table 1). As summarized in Table 1, Chiba represents an urban–coastal polluted environment influenced by anthropogenic emissions from Tokyo metropolitan emissions and marine air from the Pacific, with episodic long-range transport of continental aerosols from East Asia (Xue et al., 2021). Cape Hedo is located on Okinawa Island and is often considered a marine background site in the western Pacific, although it is periodically affected by long-range transport of Asian dust and anthropogenic aerosols (Khatri et al., 2010). Fukue Island, situated in the East China Sea region, represents a continental outflow receptor site that receives transported aerosols from East Asia mixed with marine air masses (Khatri et al., 2014a). Similar to Hedo, Miyako represents a mid-latitude maritime environment with generally clean oceanic air masses but episodic influence from long-range transport of continental aerosols (Dim et al., 2013). Sendai is a mid-latitude coastal site influenced by regional urban emissions and seasonal continental transport from East Asia (Shiobara et al., 1991). Burgos in the northern Philippines represents a tropical maritime environment dominated by Pacific trade winds with occasional influence from transported aerosols from East and Southeast Asia (Bagtasa et al., 2018). In addition, two polar sites are included: Syowa Station in Antarctica, representing a polar pristine environment with extremely low aerosol loading and occasional long-range transport from midlatitudes and low latitudes (Hara et al., 2025); and Ny-Ålesund in the high Arctic, which represents an Arctic background environment influenced by seasonal long-range transport of pollution known as Arctic haze emitted from midlatitudes (Pasquier et al., 2022). The data analyses periods in this study vary among the sites depending on data availability, extending from January 2010 up to December 2024 (Table 1).
The study utilized observational data from multiple complementary sources, including a sky radiometer (Model: POM-02, PREDE Co., Ltd.), the Moderate Resolution Imaging Spectroradiometer (MODIS), and ground-based direct solar irradiance measurements obtained using a pyrheliometer.
The POM-02 is a multifunctional ground-based radiometer widely used in the SKYNET observation network. It performs automated measurements of direct solar irradiance, spectral sky radiance distributions (e.g., almucantar and principal-plane scans), and zenith sky radiance at multiple wavelengths, enabling the retrieval of aerosol, cloud, and atmospheric optical properties (Choi et al., 2020; Nakajima et al., 2020; Khatri et al., 2010, 2019). In the present study, different categories of measurements were employed. First, unprocessed spectral zenith radiances at wavelengths with negligible absorption by atmospheric gases – 0.380, 0.400, 0.500, 0.675, 0.870, and 1.020 µm – were used. The direct and almucantar radiances observed at these wavelengths are commonly used in SKYNET for aerosol observations. The zenith radiances observed at these wavelenghts provide valuable information about sky brightness and atmospheric scattering characteristics under both clear- and cloudy-sky conditions. Second, quality-controlled aerosol optical thickness (AOT) values at wavelengths of 0.400, 0.500, and 0.870 µm were used. These values were processed using skyrad.pack inversion software (Hashimoto et al., 2012) and cloud-screening algorithm (Khatri and Takamura, 2009) both of which are incorporated in SR-CEReS (Sky Radiometer–Center for Environmental Remote Sensing) processing package. These data analyzed using SR-CEReS data processing package are publicly available through the SKYNET data archive (https://skynet.irie-lab.jp, last access: 11 October 2026). The study further uses calibration constants values determined using Improved Langely method (Campanelli et al., 2004; Nakajima et al., 1996, 2000) at those wavelengths.
Table 1Observation locations, representative airmass types, and study periods.
Satellite-based cloud information and cloud optical properties were obtained from MODIS Level-2 cloud mask and cloud property products. Specifically, the MOD35_L2 product from the Terra satellite and the MYD35_L2 product from the Aqua satellite were used for cloud mask information, while cloud optical properties were obtained from the MOD06_L2 and MYD06_L2 products corresponding to Terra and Aqua satellites, respectively. The MODIS cloud mask products provide pixel-level cloud detection using a series of multispectral threshold tests that analyze radiances measured in visible, near-infrared, and thermal infrared channels. The cloud mask algorithm classifies each pixel into categories such as clear, probably clear, probably cloudy, and cloudy based on spectral characteristics and spatial consistency tests. The fundamental framework of this detection approach is described by Ackerman et al. (1998). The MODIS cloud optical property products provide retrieved cloud optical thickness, cloud effective radius, and related cloud microphysical parameters using multispectral reflectance measurements, primarily from visible, near-infrared, and shortwave-infrared bands. These retrievals are based on the bispectral method, in which cloud optical thickness is mainly constrained by visible-band reflectance, while cloud particle effective radius is inferred from absorbing near-infrared or shortwave-infrared channels (Platnick et al., 2017; Nakajima and King, 1990). Both cloud mask and cloud property products have a nominal spatial resolution of approximately 1 km at nadir.
In addition to the sky radiometer and satellite observations, direct normal irradiance (DNI) measurements were also utilized where available. These measurements were obtained using a pyrheliometer manufactured by Kipp & Zonen, which measures the solar irradiance received directly from the sun within a narrow field of view aligned with the solar disk. Pyrheliometers provide highly accurate measurements of DNI and are widely used in atmospheric radiation studies as well as solar energy applications. DNI observations are particularly useful for identifying clear-sky conditions and for assessing the influence of clouds and aerosols on direct solar radiation reaching the Earth's surface.
To investigate the spectral characteristics of zenith sky radiances under clear- and cloudy-sky conditions, sky radiometer–observed zenith radiance measurements were temporally collocated with MODIS overpass times by selecting observations with an absolute time difference of less than 5 min, noting that zenith sky radiances are measured at time interval of 10 min. Based on this temporal collocation, the corresponding spectral zenith radiances were categorized into two groups: confidently clear and confidently cloudy conditions as identified by the MODIS cloud mask product. The MODIS cloud mask data used in this study were quality-controlled using strict spatial and quality-assurance criteria. For each ground-based observation, the nine MODIS pixels closest to the observation site, corresponding to a 3×3 px area centered the observation site, were extracted. This criterion was adopted to ensure that the collocated satellite observations represented a uniformly cloudy scene. Only cases for which all nine closest pixels were available and the minimum distance between the observation site and the nearest MODIS pixel was less than 1 km were retained. A scene was classified as confidently clear only when all nine pixels were identified as confident clear with a MODIS quality-assurance level of 6 or higher. Similarly, a scene was classified as confidently cloudy only when all nine pixels were identified as cloudy with a MODIS quality-assurance level of 6 or higher. This strict screening criterion can substantially reduce uncertainties associated with cloud-edge contamination, geolocation mismatch, and mixed clear–cloudy scenes. However, some uncertainties may still remain, particularly under broken-cloud conditions, where the spatial distribution of clouds can change rapidly within the MODIS pixel area and during the short time interval between satellite overpass and ground-based observation. Therefore, although the applied criteria may provide a basis for separating clear and cloudy cases as rigorously as possible, possible residual mismatches between the satellite-derived cloud mask and the actual sky condition observed by the sky radiometer cannot be completely eliminated.
For the zenith sky radiance signals S(λ1) and S(λ2) observed at any two wavelengths λ1 and λ2, the slope value (mobs) can be expressed using the following equation:
The measured zenith sky radiance can be further represented as
where L(λ) is the band-averaged atmospheric zenith radiance and C(λ) is the wavelength-dependent relative instrumental response. Substituting Eq. (2) into Eq. (1), we can write
Using ,
Thus,
where,
and
Similary, the extra-terrestrial instrument signal F0 (i.,e calibration constant) at wavelength λ can be expressed as
where E0(λ) is band-averaged extra-terresital solar irradiance at wavelenght λ . For the two wavelengths λ1 and λ2,
Consequntly, from Eqs. (7) and (9),
Since , from Eqs. (5), and (10) we can write,
Here, matm represents the atmospheric contribution arising from molecular, aerosol, and cloud scattering together with atmospheric absorption, and minst represents the wavelength-dependent instrumental contribution. To calculate matm, F0 (λ) and E (λ) are also required along with instrument-observed S (λ) values. In this study, F0 (λ) values determined from the Improved Langely method and E0 (λ) values estimated by integrating the extraterrestrial solar spectrum of Gueymard (2004) over the spectral response function of each sky-radiometer channel were used.
The resulting correction should be regarded as a first-order estimate of the wavelength-dependent instrumental contribution, because a single set of median spectral calibration constants was applied to each instrument over the corresponding analysis period. Nevertheless, a key advantage of this approach is that, even with such a first-order approximation, the corrected atmospheric spectral slope, matm, retains sufficient sensitivity to distinguish between cloud-free and cloud-contaminated conditions, as demonstrated and discussed in the preceding Results and Discussion.
By analyzing the slope values derived from Eq. (11) for the grouped clear- and cloudy-sky datasets, threshold-based criterion was established to discriminate between clear and cloudy conditions. In addition, the collocated aerosol data and MODIS Level-2 cloud property data were statistically analyzed to examine the behavior of these matm values under varying atmospheric conditions while developing criteria for detecting sky condition.
The resulting classification of clear and cloudy sky conditions was evaluated using collocated direct normal irradiance (DNI) measurements, applying a temporal matching criterion of less than 2.5 min. DNI is highly sensitive to the clouds located along the direct solar beam, particularly those near the solar disk; under clear-sky conditions, DNI typically exhibits relatively high values because direct solar radiation reaches the surface without obstruction. In contrast, the presence of clouds significantly attenuates the direct solar beam, leading to substantially reduced DNI values. Therefore, DNI measurements provide an independent observational reference for assessing the reliability and robustness of the proposed classification approach. Additional validation was conducted by comparing aerosol optical thickness (AOT) at 0.5 µm and the Ångström exponent (AE) obtained for clear-sky cases identified by the proposed slope-based method with those derived using the cloud-screening algorithm of Khatri and Takamura (2009) implemented in SR-CEReS data processing package. The Ångström exponent, which characterizes the spectral dependence of aerosol optical thickness and is commonly used as an indicator of aerosol particle size, was calculated as
where AOT0.40 and AOT0.87 represent aerosol optical thickness at wavelengths of 0.400 and 0.870 µm, respectively. This comparison provides an additional consistency check by examining whether the aerosol optical properties retrieved under the clear-sky conditions identified by the proposed slope-based method are physically reasonable and consistent with those obtained using an established cloud-screening algorithm.
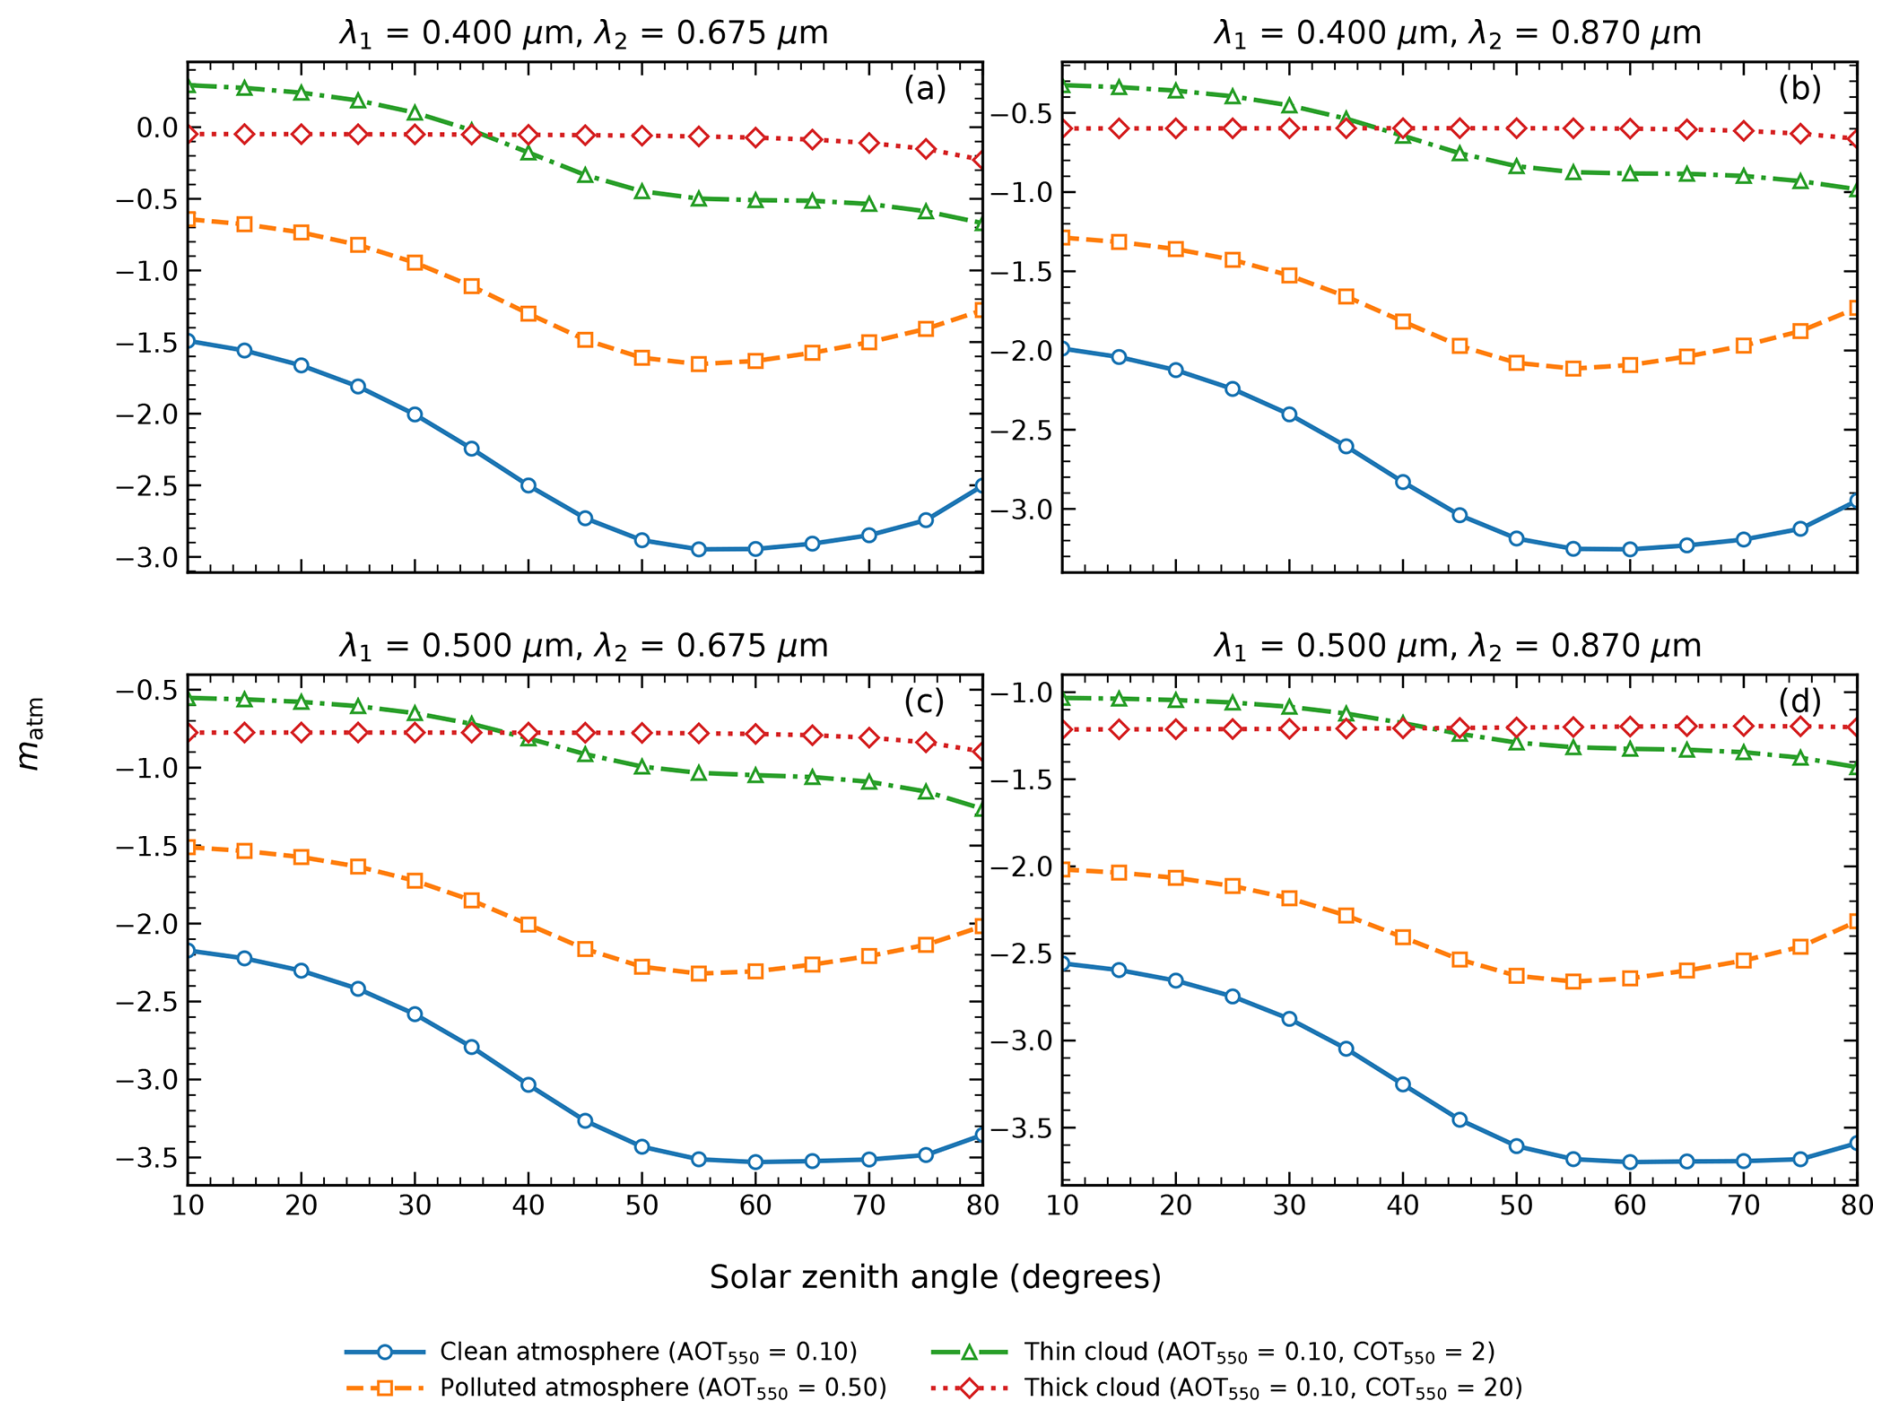
Figure 1Atmospheric spectral slope (matm) as a function of solar zenith angle (SZA) simulated for four selected wavelength pairs: (a) 0.400–0.675 µm, (b) 0.400–0.870 µm, (c) 0.500–0.675 µm, and (d) 0.500–0.870 µm. Simulations were performed with mid-latitude summer atmospheric model, precipitable water vapor of 1.0 cm, total column ozone of 0.30 cm-atm, Labertian surface albedo of 0.10, and clouds represented as plane-parallel layers.
To provide the theoretical background for the applicability of atmospheric spectral slope (matm) for detecting sky conditions, radiative transfer calculations were performed using the Santa Barbara DISORT Atmospheric Radiative Transfer (SBDART) model (Ricchiazzi et al., 1998). The calculations used the atmospheric profile specified by mid-latitude summer atmospheric model, with precipitable water vapor and total column ozone set to 1.0 cm and 0.30 cm-atm, respectively. The surface was assumed to be Lambertian with an albedo of 0.10, and clouds were represented as plane-parallel layers. Simulations were performed for solar zenith angles (SZAs) ranging from 10 to 80°. Four atmospheric conditions were considered: a clean atmosphere with AOT at 0.55 µm of 0.1, a polluted atmosphere with AOT at 0.55 µm of 0.5, a thin-cloud atmosphere with AOT at 0.55 µm of 0.1 and COT at 0.55 µm of 2, and a thick-cloud atmosphere with AOT at 0.55 µm of 0.1 and COT at 0.55 µm of 20. The simulated zenith-sky radiances were subsequently used to calculate matm for the selected wavelength pairs 0.400–0.675, 0.400–0.870, 0.500–0.675, and 0.500–0.870 µm. In the calculation, the spectral dependecy of AOT was represented by assuming AE value for 1.2. Similary, the effective radius of cloud-droplet particles was set to 10 µm
Figure 1 shows the SZA dependence of matm under these atmospheric conditions. A distinct difference in matm is evident between the cloud-free and cloudy atmospheres for all four wavelength pairs. Under cloud-free conditions, matm is strongly negative, particularly for the clean atmosphere, reflecting the stronger wavelength dependence of molecular and aerosol scattering and the resulting decrease in zenith-sky radiance toward longer wavelengths. Increasing the aerosol loading from 0.10 to 0.50 shifts matm toward less negative values, indicating a weakening of the spectral dependence of zenith-sky radiance. Nevertheless, the polluted cloud-free atmosphere remains clearly separated from the cloudy cases over the investigated SZA range. In contrast, the presence of clouds produces substantially less negative matm values. This behavior is consistent with the weaker wavelength dependence of scattering by cloud droplets over the visible and near-infrared spectral region and the enhanced role of multiple scattering within clouds. In particular, the thick-cloud case exhibits relatively weak spectral dependence, whereas the thin-cloud case shows a stronger dependence on SZA; for the 0.400–0.675 µm pair, matm is positive at smaller SZAs and becomes negative as SZA increases.
These results provide a physical basis for the applicability of matm to discriminate between clear- and cloudy-sky conditions. Although the magnitude and SZA dependence of matm vary with aerosol loading, cloud optical thickness, and wavelength pair, the transition from molecular- and aerosol-dominated scattering under cloud-free conditions to cloud-dominated multiple scattering systematically modifies matm toward less negative values. Importantly, increasing AOT alone does not reproduce the spectral behavior obtained under cloudy conditions, as demonstrated by the separation between the polluted atmosphere with AOT at 0.55 µm of 0.50 and the simulated cloudy cases. Thus, matm contains physically meaningful information on changes in the atmospheric scattering regime and provides a theoretical basis for discriminating cloud-contaminated from cloud-free zenith-sky observations.
4.1 Spectral Signatures of Zenith Radiance Under Clear and Cloudy Skies
4.1.1 General Features
Figure 2 presents the median normalized spectral zenith radiances under confidently clear and cloudy sky conditions at eight selected SKYNET sites. The measured zenith sky radiances were first converted into physical zenith-sky radiances using C (λ) values, which were determined from Eq. (8). For each observation, the radiance spectrum was normalized by its maximum value before calculating the median spectrum. Therefore, the figure emphasizes differences in spectral shape and relative spectral distribution rather than absolute radiance magnitude.
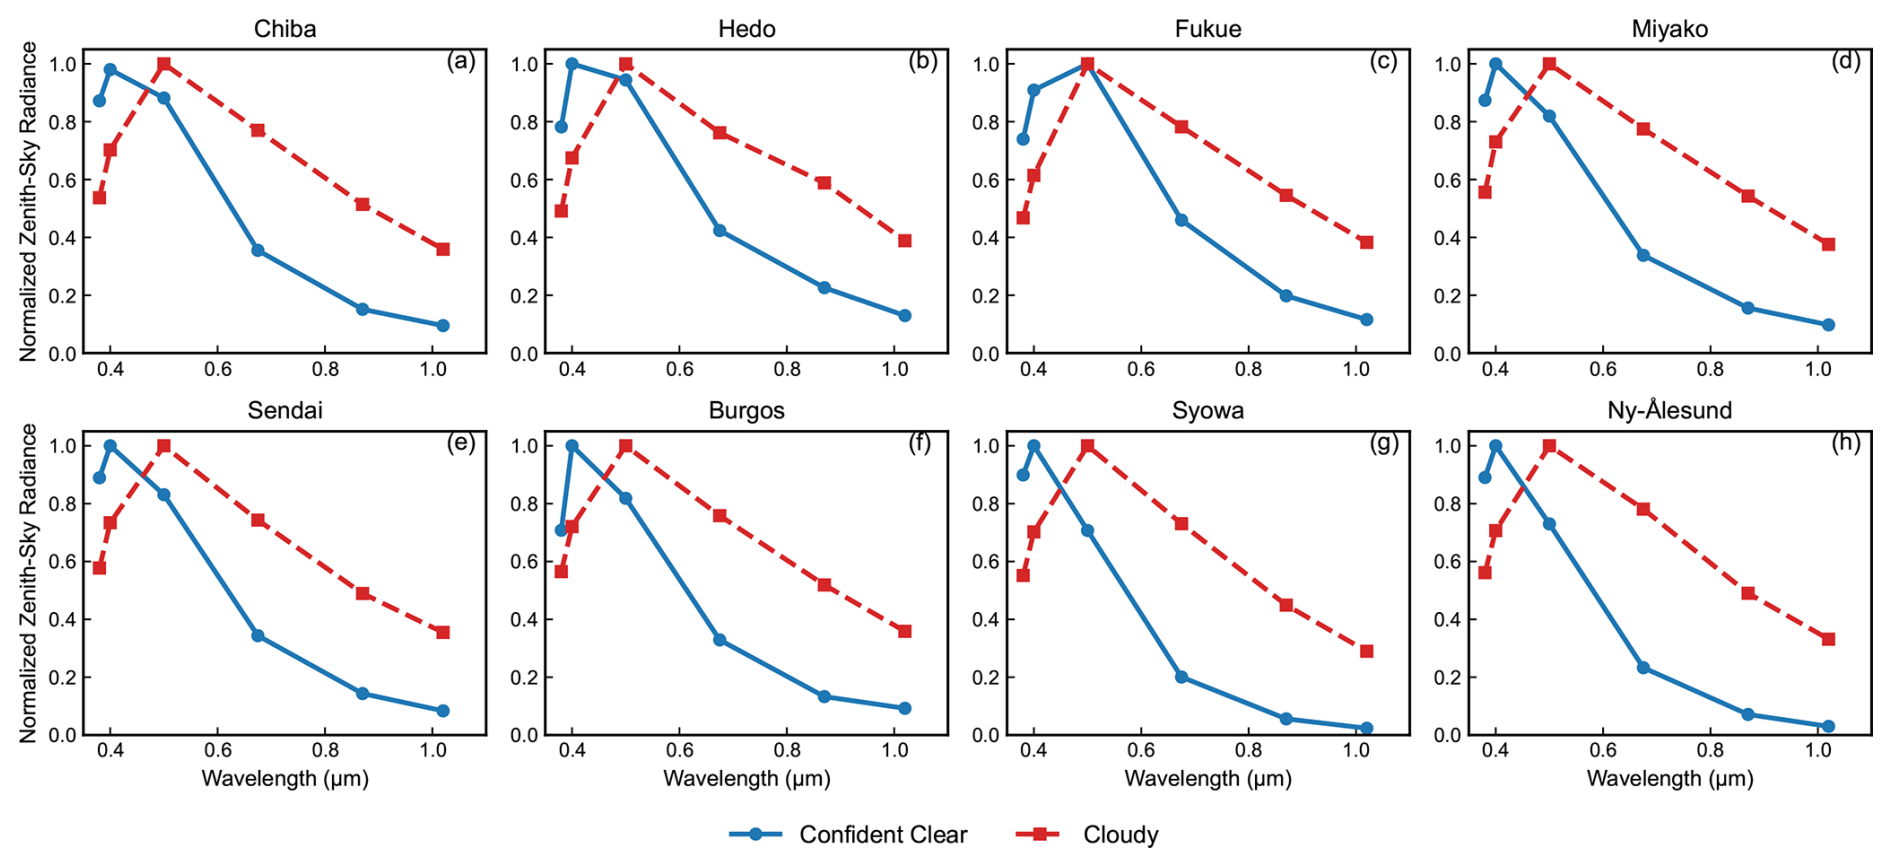
Figure 2Median normalized spectral zenith sky radiance under cloudy and confidently clear sky conditions at (a) Chiba, (b) Hedo, (c) Fukue, (d) Miyako, (e) Sendai, (f) Burgos, (g) Syowa, and (h) Ny-Ålesund. Zenith sky radiances were normalized by the maximum value within each observation and averaged separately for MODIS-identified cloudy and confidently clear cases.
Across all sites, the spectral curves under cloudy and clear conditions exhibit systematically different patterns. Under cloudy conditions, the normalized spectra appear relatively weaker spectral dependence across the visible and near-infrared wavelength range in comparson to those for clear-sky spectra. This systematic shift is consistently observed across the diverse environments represented by the eight SKYNET sites, including maritime, continental, tropical, and polar locations. The consistency of this behavior suggests that the observed spectral differences are governed primarily by fundamental atmospheric scattering processes rather than by site-specific characteristics.
The physical basis for this behavior can be explained by the dominant scattering mechanisms in clear and cloudy atmospheres. Under clear-sky conditions, zenith radiance is mainly controlled by molecular (Rayleigh) scattering and aerosol scattering. Rayleigh scattering exhibits a strong inverse dependence on wavelength (approximately proportional to λ−4), resulting in enhanced scattering at shorter wavelengths in the blue portion of the spectrum. Aerosol scattering also exhibits wavelength dependence, though typically weaker than Rayleigh scattering. In the near-ultraviolet to blue spectral region, aerosol scattering can be typically several times smaller than Rayleigh scattering under low-to-moderate aerosol loading, although its relative contribution increases under polluted or dust-influenced conditions. As a result, clear-sky zenith radiance spectra tend to show relatively higher normalized radiance at shorter visible wavelengths and a gradual decrease toward longer wavelengths. In contrast, under cloudy conditions the scattering of solar radiation is dominated by cloud droplets. The typical size of cloud droplets (on the order of several micrometers) is significantly larger than the wavelengths of visible light. Under these circumstances, scattering is primarily governed by Mie scattering, which exhibits much weaker wavelength dependence. Consequently, the scattered radiation becomes spectrally more uniform, producing relatively weaker normalized radiance spectra compared with clear-sky conditions. These characteristics are consistent with theoretical descriptions of cloud scattering behavior (Bohren and Huffman, 1998; Hansen and Travis, 1974).
Although the overall spectral behavior is consistent among the sites, minor variations in spectral shape are observed. These differences likely reflect variations in aerosol loading, aerosol type, solar geometry, and surface reflectance conditions. For example, sites influenced by maritime air masses or high aerosol concentrations may exhibit slightly modified spectral gradients due to changes in aerosol optical properties. Nevertheless, the fundamental contrast between clear- and cloudy-sky spectra remains evident across all environments.
4.1.2 Spectral Slopes
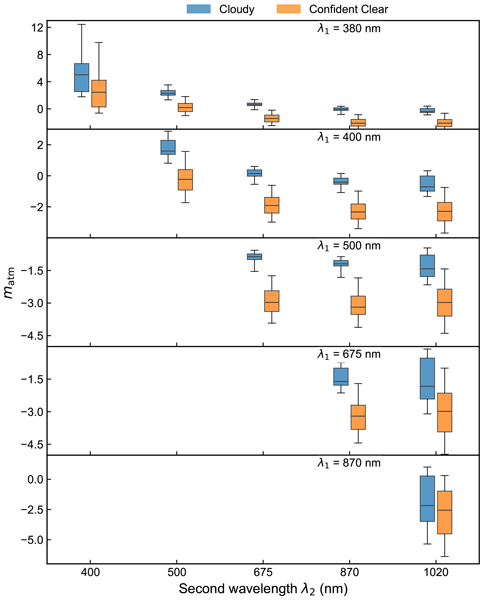
To better understand the spectral depenence of zenith sky radiances on wavelenths during clear- and cloudy-sky conditions, we analyzed the atmospheric spectral slope (matm) values for all possible wavelength pairs, as given by Eq. (11). Figure 3 presents box-and-whisker distributions of slope values calculated from zenith radiance pairs for cloudy and confidently clear sky conditions at the Chiba site. Although results from other sites are not shown here for brevity, they exhibit slope patterns similar to those observed for Chiba. For shorter first wavelength λ1 of 0.38 µm, the slope values are predominantly positive and relatively large. This behavior reflects the strong wavelength dependence of molecular (Rayleigh) scattering and aerosol scattering in the shorter spectral region. Although cloudy conditions generally exhibit larger slopes than clear skies for this first wavelength λ1 of 0.38 µm, most of the distributions partially overlap. As the first wavelength shifts toward the visible and near-infrared region, the slope magnitude decreases and, for several wavelength combinations, become negative. In particular, the wavelength pairs of 0.400 and 0.675, 0.400 and 0.870, 0.500 and 0.675, and 0.500 and 0.870 µm show clear separation between the two sky conditions, with minimal overlaps. Other wavelength pairs, such as 0.675 and 0.870 and 0.870 and 1.020 µm show smaller differences in slope values between clear- and cloudy-sky conditions. Overall, the results demonstrate that wavelength pairs connecting the visible and near-infrared spectral regions provide the greatest sensitivity to changes in atmospheric scattering associated with cloud presence. These wavelength combinations therefore represent the most suitable candidates for clear- and cloudy-sky discrimination based solely on the atmospheric spectral characteristics of zenith-sky radiance.
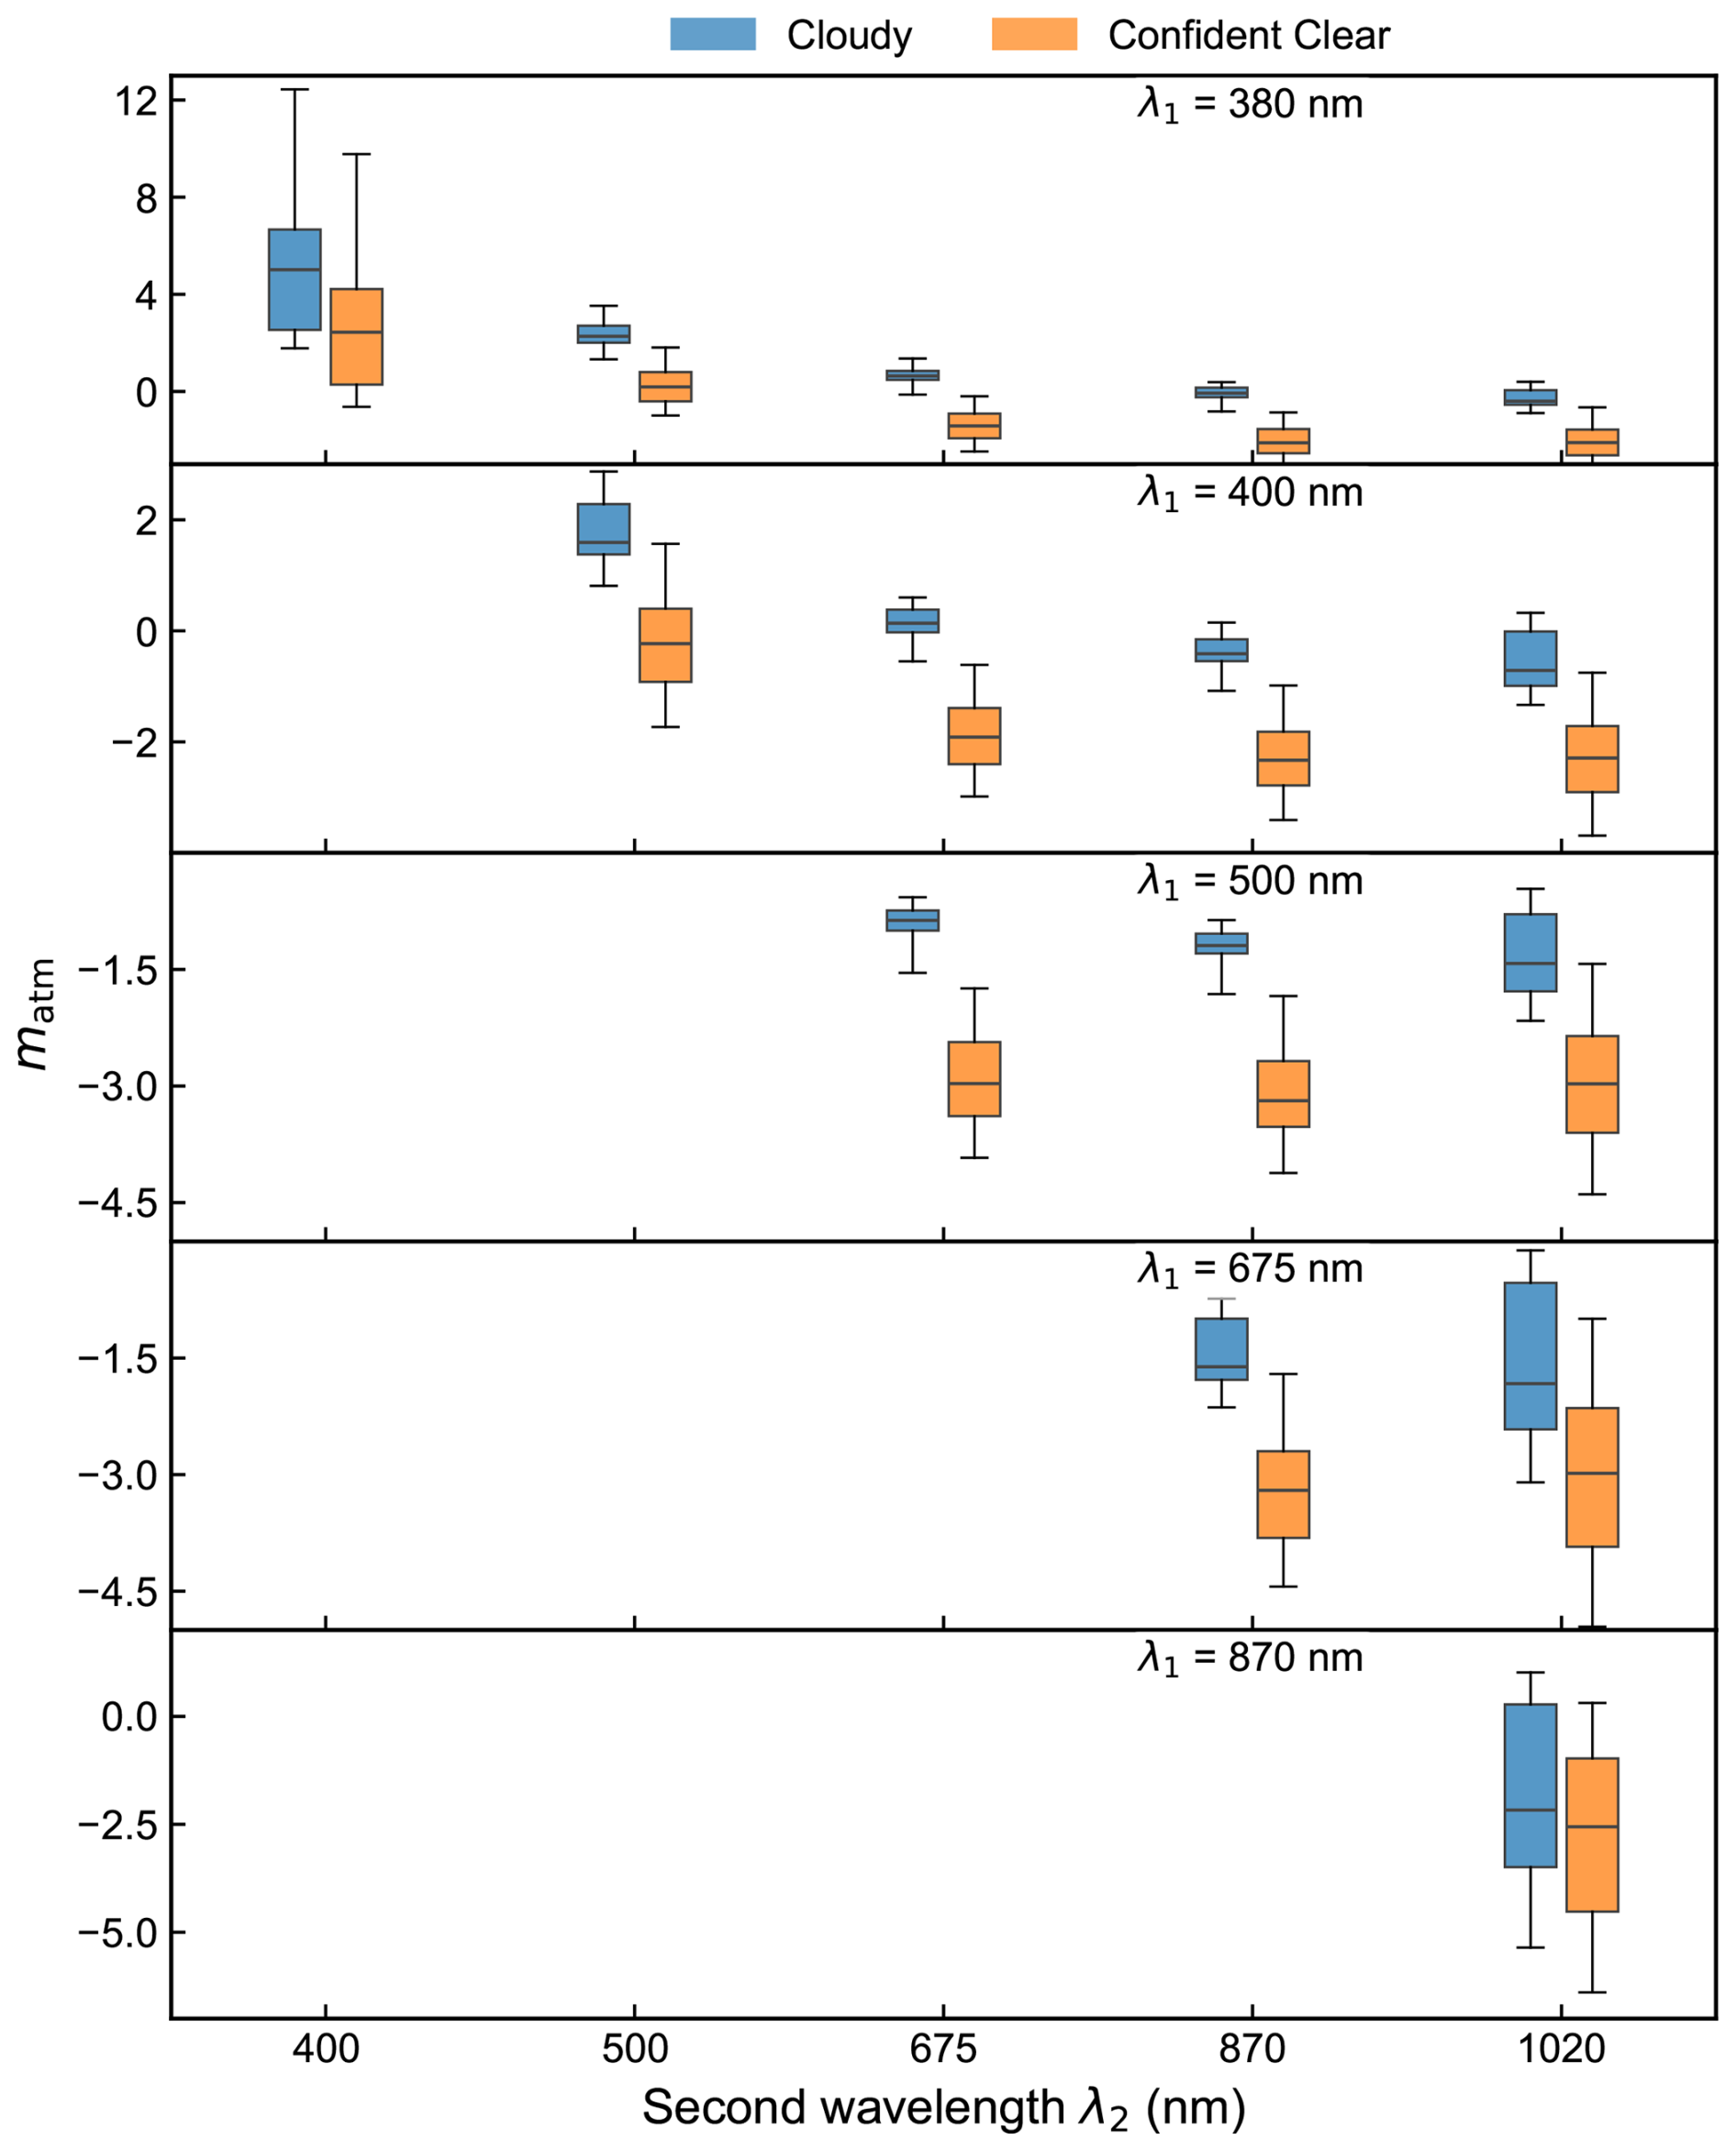
Figure 3Box-and-whisker distributions of spectral slope values of atmospheric slope (matm) for cloudy and confidently clear sky conditions for Chiba. Each row corresponds to a fixed first wavelength (λ1), while the x-axis represents the second wavelength (λ2). In the figure, the boxes represent the 25th and 75th percentiles, and the whiskers represent the 5th and 95th percentiles.
Dependence of Spectral Slope Values of Key Wavelength Pairs on Solar Geometery, Aerosol, and Cloud Conditions
As the four wavelength pairs – 0.400 and 0.675, 0.500 and 0.675, 0.400 and 0.870, and 0.500 and 0.870 µm – exhibited relatively stronger discrimination between clear- and cloudy-sky conditions, a more detailed analysis was performed to understand the dependencies of matm values corresponding to those wavelength pairs on solar position and aerosol and cloud optical properties. Specifically, we analyzed the dependence of matm on solar zenith angle (SZA), AOT, and AE under clear sky conditions identified using the reference MODIS cloud mask data. Similarly, for cloudy-sky conditions, we investigated the relationships between matm corresponding to those wavelength pairs and SZA, COT, and CER. These analyses are shown in Figs. 4 and 5. In those figures, only the mean values are presented because the objective is to illustrate the dependence of matm values on the atmospheric parameters over different atmospheric conditions together.
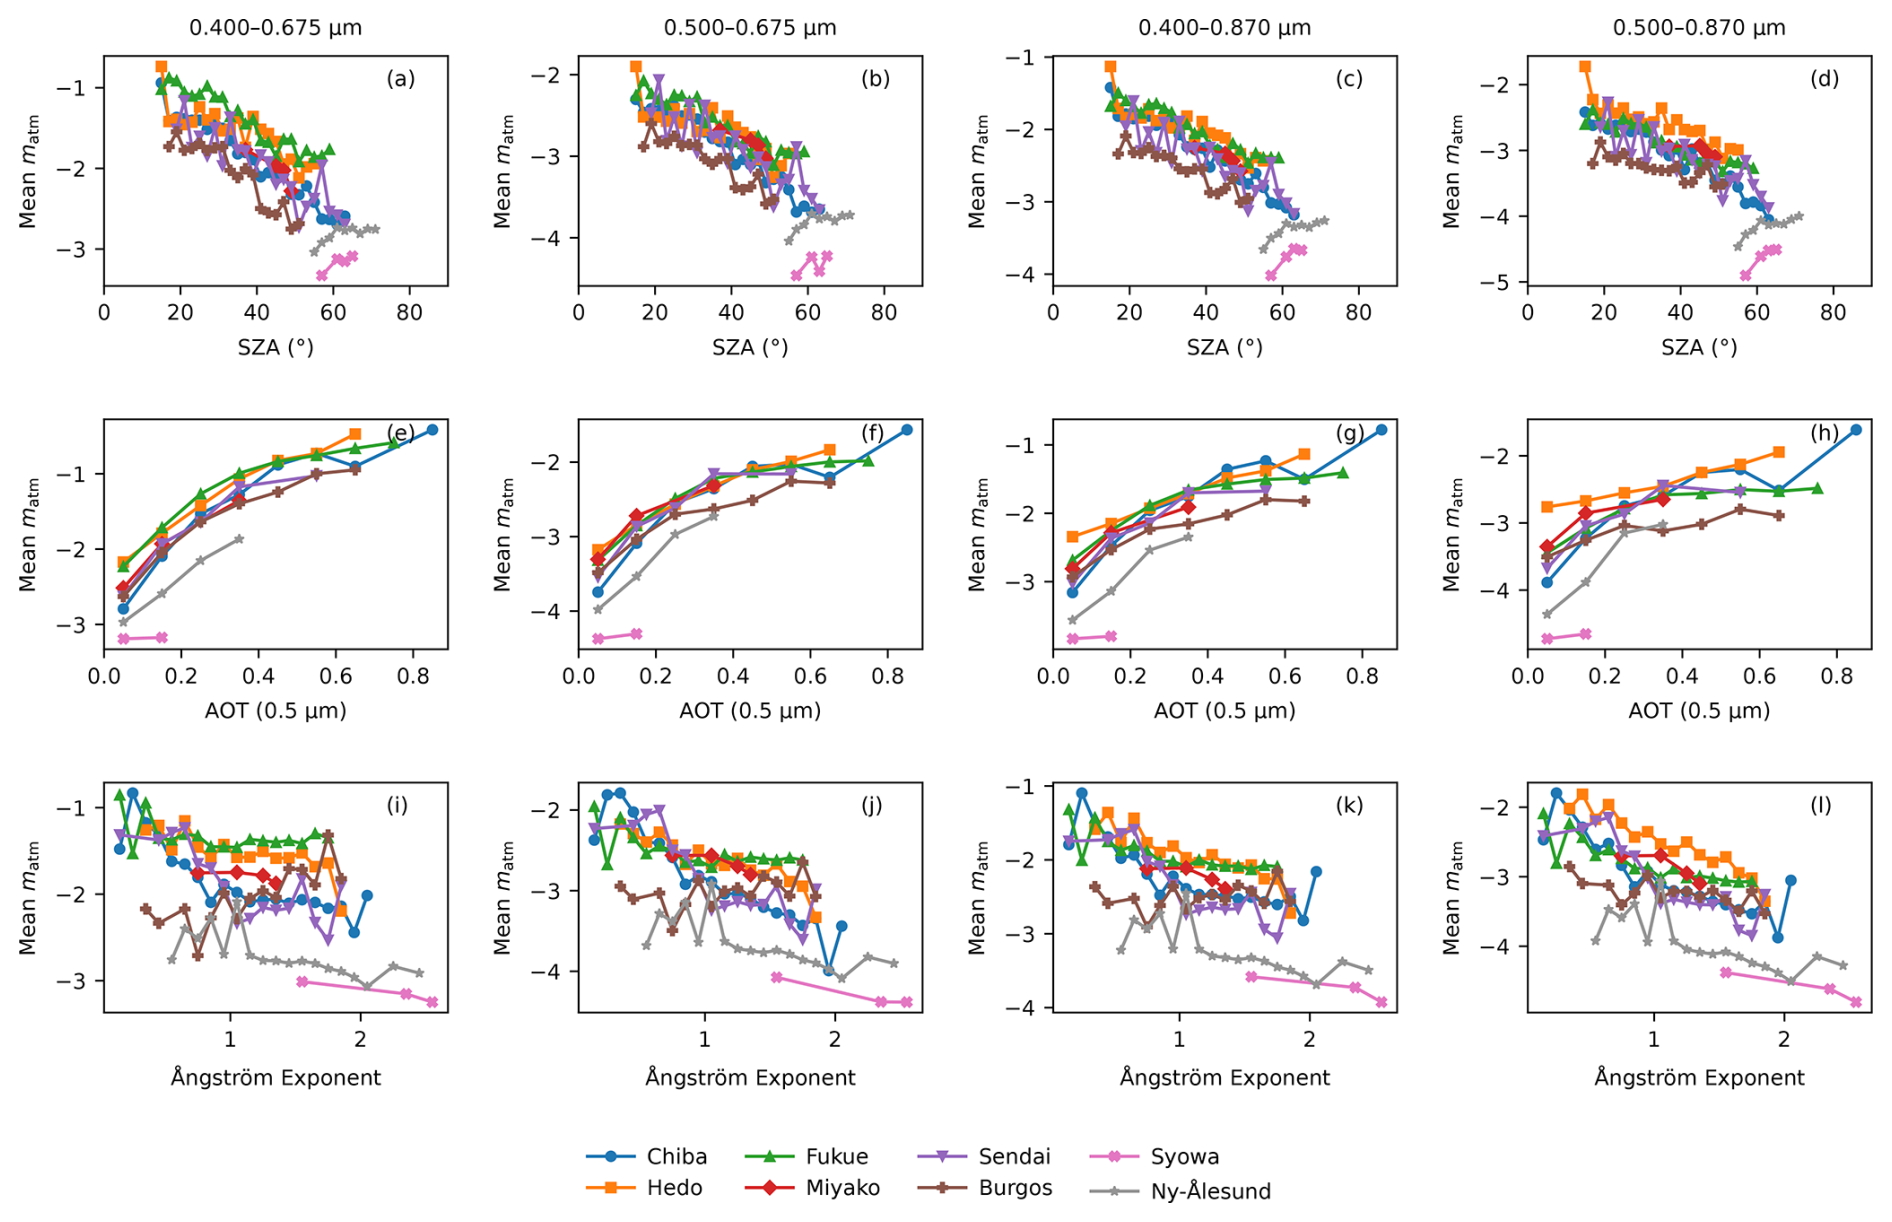
Figure 4Dependence of mean spectral atmospheric slope (matm) values on solar zenith angle (SZA), aerosol optical thickness (AOT), and Ångström exponent (AE) under clear-sky conditions identified using the reference MODIS cloud mask data. Mean values were calculated at each site using bin intervals of 2° for SZA, 0.1 for AOT, and 0.1 for the AE.
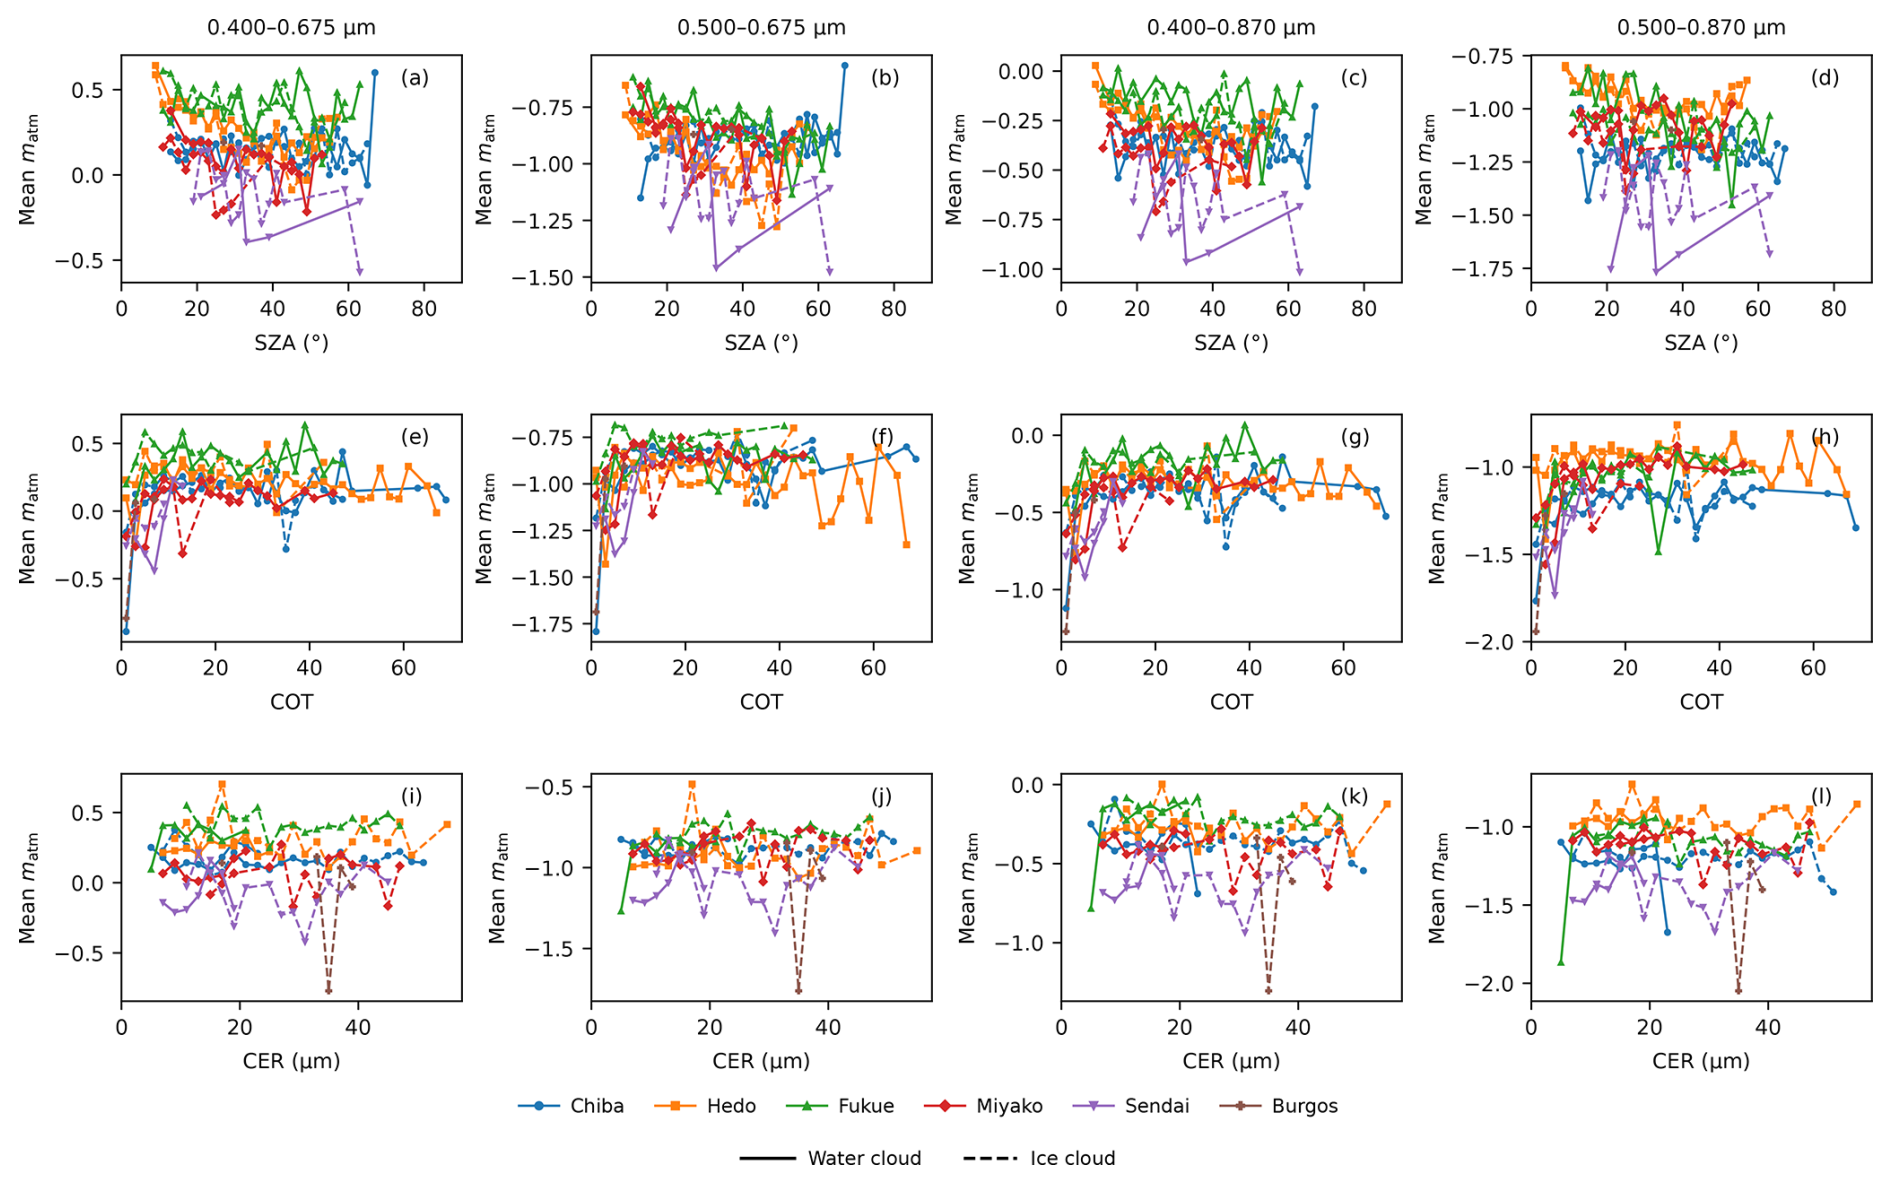
Figure 5Dependence of mean spectral atmospheric slope (matm) values on solar zenith angle (SZA), cloud optical thickness (COT), and cloud-particle effective radius (CER) under cloudy-sky conditions identified using the reference MODIS cloud mask data. Mean values were calculated at each site using bin intervals of 2° for SZA, 2 for COT, and 2 µm for CER.
Under clear-sky conditions, matm values generally decrease with increasing SZA. This behavior indicates that atmospheric spectral contrast becomes stronger as the atmospheric optical path length increases. At larger SZA, enhanced Rayleigh and aerosol scattering along the longer slant path modifies the shortwave spectral distribution, leading to more negative slope values at most sites. This tendency is especially evident at mid- and low-latitude sites, whereas polar sites show weaker or somewhat different behavior, likely due to differences in aerosol loading, surface reflectance, and illumination geometry. The dependence on AOT differs from the SZA dependence. For all wavelenght pairs, one can note the increase of matm value with the increase of AOT. Particularly, the 0.500 and 0.675 and 0.500 and 0.870 µm pairs remain predominantly negative even as AOT increases, although the value becomes less negative under enhanced aerosol loading. The relationship between matm and AE is weaker and more site-dependent than the relationship with AOT. In some cases, matm becomes slightly more negative with increasing AE, but the pattern is not consistently monotonic across sites. This suggests that aerosol amount exerts a stronger first-order control on matm magnitude than aerosol size information alone. The observed site-to-site variability may be related to differences in aerosol type, surface albedo, humidity-driven aerosol growth, and the limited sampling range of AE at some sites.
Under cloudy conditions, matm values increase substantially relative to clear-sky conditions for all examined wavelength combinations, clearly contrasting with the predominantly negative slopes observed under clear skies. Among the tested pairs, the 0.400 and 0.675 µm pair generally shows the largest matm values follwed by 0.400 and 0.870, 0.500 and and 0.870, and 0.500 and 0.675 µm. Although latter wavelenght pairs often retain negative values under clouds, they consistently shift toward larger (less negative) values under cloudy conditions compared with clear-sky conditions. This contrast is physically meaningful as cloud scattering weakens the spectral distribution of zenith radiance. The dependence of cloudy-sky slope on SZA is weaker than that observed under clear-sky conditions. Although some site-to-site variability is present, matm generally remains positive or relatively weak negative across most SZA ranges. This indicates that cloud scattering dominates the spectral behavior of zenith radiance, reducing the relative influence of solar geometry compared with clear-sky cases. The matm also varies with COT, but the relationship is generally nonlinear. At low COT, the matm may change rapidly, indicating strong sensitivity to the transition from optically thin to moderately thick clouds. As COT increases, matm tends to become more stable, suggesting that the zenith radiance spectrum approaches a saturated cloudy-sky regime. This is consistent with the expectation that, for optically thick clouds, additional increases in cloud optical thickness have a progressively smaller effect on radiance-based spectral signatures. The dependence on CER is weaker and more variable than the dependence on COT. For many sites, especially for water clouds, the mean slope remains relatively stable across the CER range. Ice cloud cases show larger variability, likely because ice cloud retrievals are more heterogeneous and are affected by particle habit, vertical structure, and possible mixed-phase contamination.
Overall, the results demonstrate that matm is governed by different dominant physical factors under clear- and cloudy-sky conditions. Under clear skies, matm is mainly influenced by solar geometry and aerosol optical loading, while under cloudy skies, it is primarily controlled by cloud scattering and COT.
Possibility of Clear- and Cloudy-Sky Discrimination
Accounting for the clear separation of matm values between clear- and cloudy-sky conditions discussed above, practical operational criteria were developed for the purpose of sky state detection using matm values. For this purpose, matm(λ1,λ2) values corresponding to each wavelength pair from all observation sites were pooled using the reference MODIS cloud mask labels, and the discrimination performance was evaluated over the full range of observed matm(λ1,λ2) values using receiver operating characteristic (ROC) analysis.
For a given decision threshold , the sensitivity (a measure of true positive rate) and specificity (a measure of true negagtive rate) were calculated as
where TP, TN, FP, and FN denote the numbers of true positives, true negatives, false positives, and false negatives, respectively. They are counts of classification outcomes, and are dimensionless. The classification performance at each decision threshold was evaluated using the Youden index,
The decision threshold corresponding to the maximum value of J(T) was selected as the optimum binary decision boundary, Ty, between clear- and cloudy-sky conditions. The ROC curve describes the relationship between sensitivity and specificity over all possible decision thresholds, while the area under the ROC curve (ROC AUC) provides an overall measure of the discrimination capability of each wavelength pair, with a larger value closer to 1 indicating better separation between clear- and cloudy-sky conditions. Further, to avoid forcing observations located close to Ty into either class, an intermediate “undetermined” category was introduced by defining a symmetric uncertianly range (±ϵ) around Ty. Hence, the final sky state detection criterion can be defined as
where λ1 and λ2 represent the two wavelengths of a wavelenth pair. Table 2 summarizes Ty, ROC AUC, specificty and sensitivity values for four selected wavelength pairs. Here, the parameter ϵ controls the degree of conservativeness of the classification. A smaller ϵ results in a narrower undetermined region and allows more observations to be classified as clear or cloudy, whereas a larger ϵ broadens the undetermined region and provides a more conservative classification. The value of ϵ may be adjusted according to the desired balance between classification coverage and confidence or to meet specific operational requirements.
Table 2Optimum binary decision thresholds (Ty) and corresponding discrimination performance of the atmospheric spectral slope (matm) for the four selected wavelength pairs.
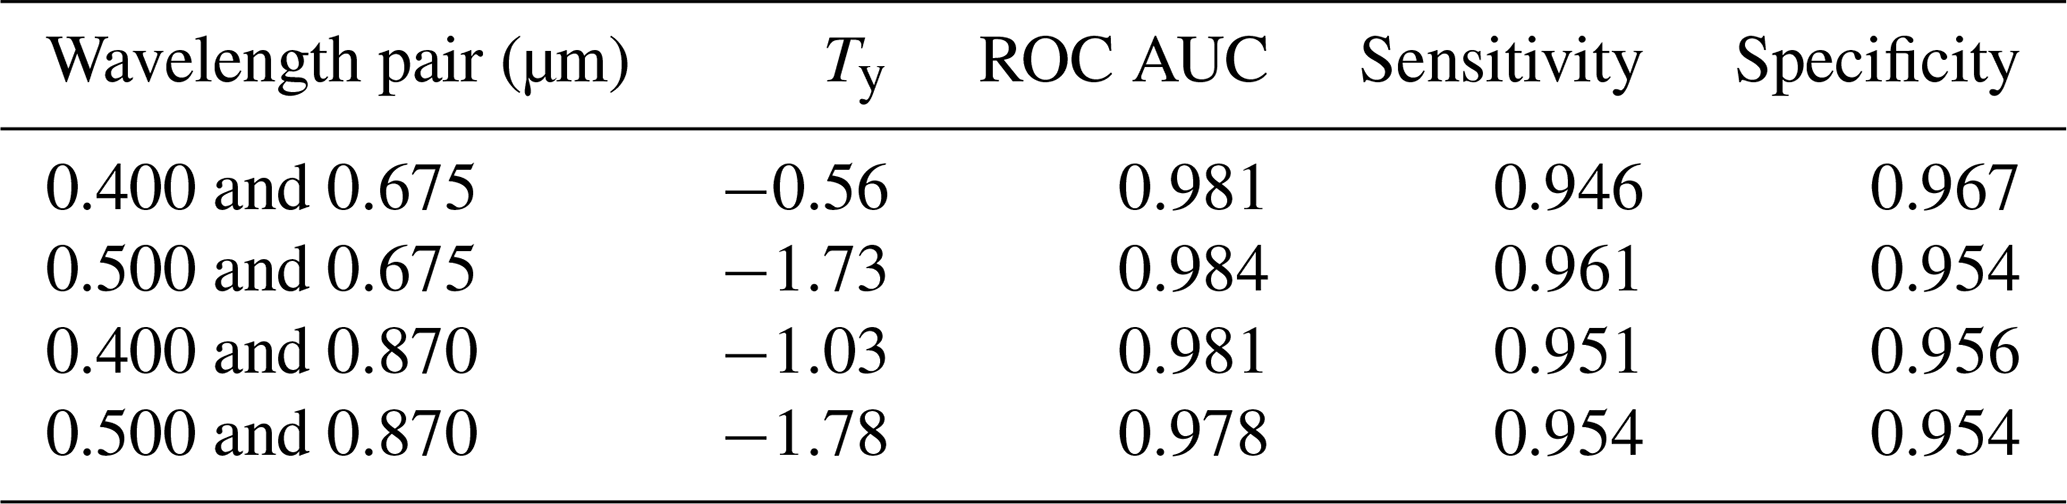
Table 2 shows that all four wavelength pairs provide strong discrimination between clear- and cloudy-sky conditions, with ROC AUC values ranging from 0.978 to 0.984. Sensitivity and specificity are also consistently high, ranging from 0.946 to 0.961 and from 0.954 to 0.967, respectively, indicating that the spectral slopes of those wavelength pairs can effectively identify both cloudy- and clear-sky conditions. Among the examined wavelength pairs, 0.500–0.675 µm shows the highest overall discrimination capability, with the largest ROC AUC (0.984) and sensitivity (0.961), while maintaining a high specificity (0.954). The 0.400–0.675 and 0.400–0.870 µm pairs show similarly strong performance. Although the 0.500–0.870 µm pair has the lowest ROC AUC (0.978), its sensitivity and specificity remain high (both 0.954), indicating that it also provides effective clear–cloud discrimination. Overall, the small differences in ROC AUC among the four wavelength pairs indicate that all four spectral combinations have substantial capability for sky-state discrimination, although the 0.500–0.675 µm pair provides the strongest individual criterion.
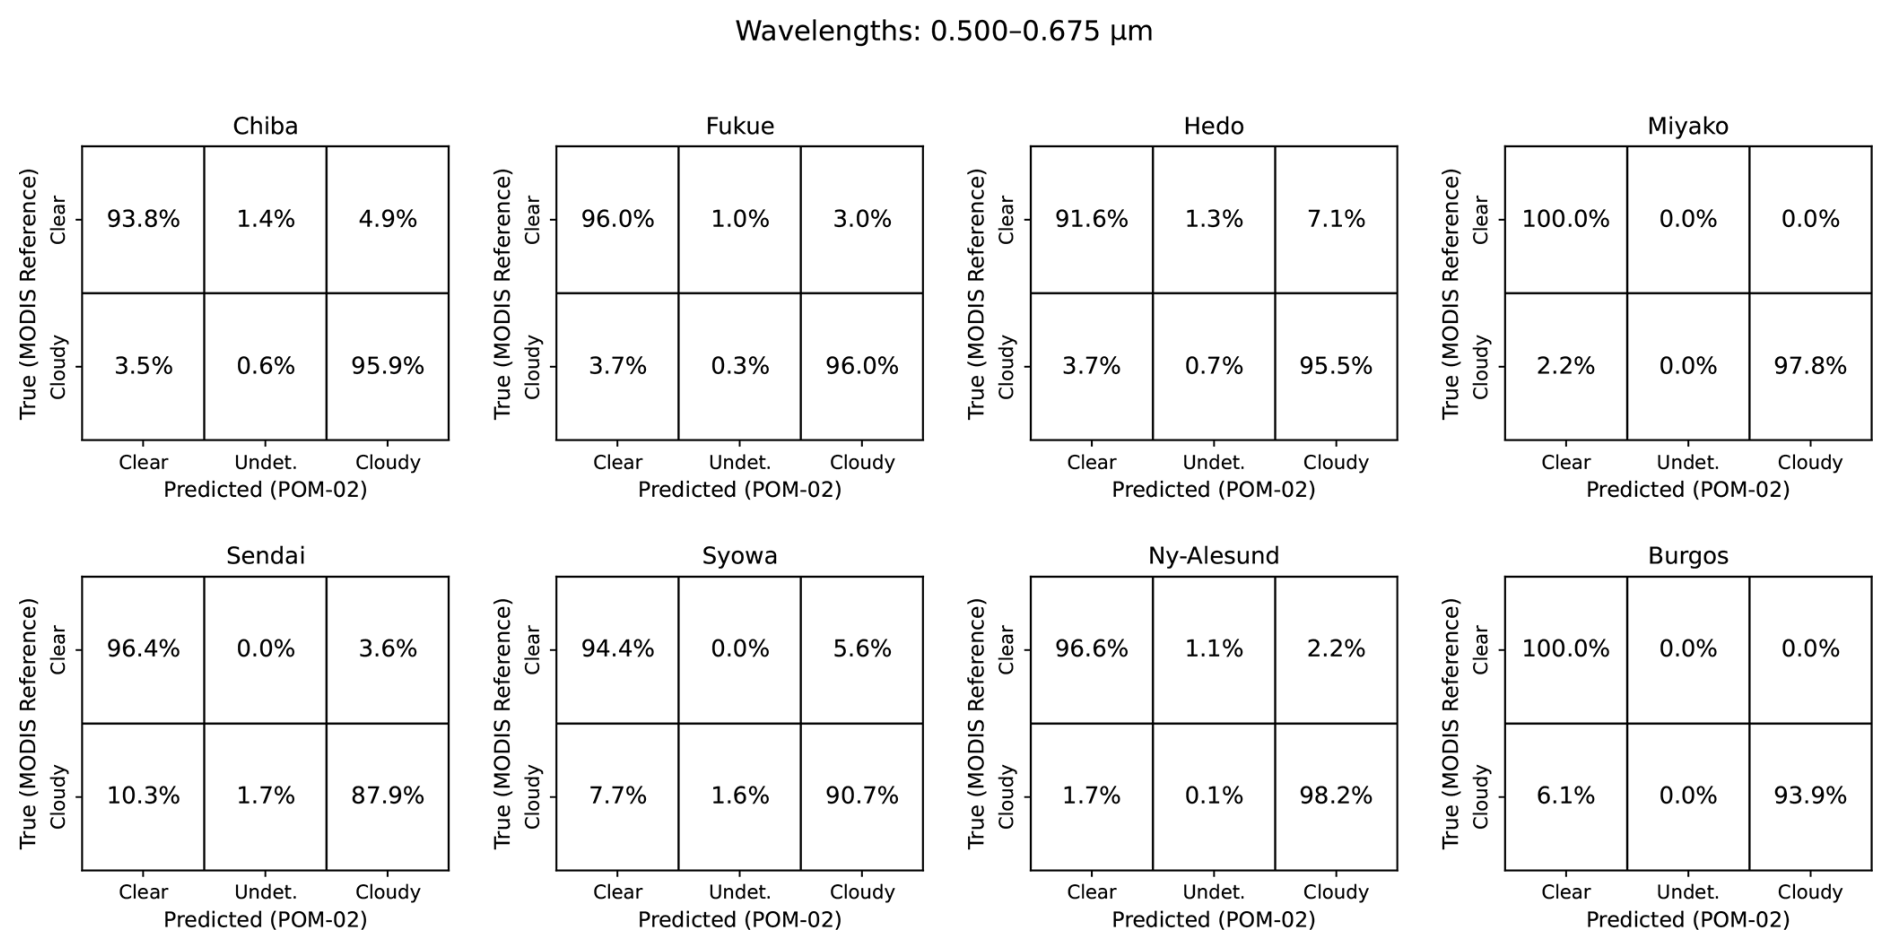
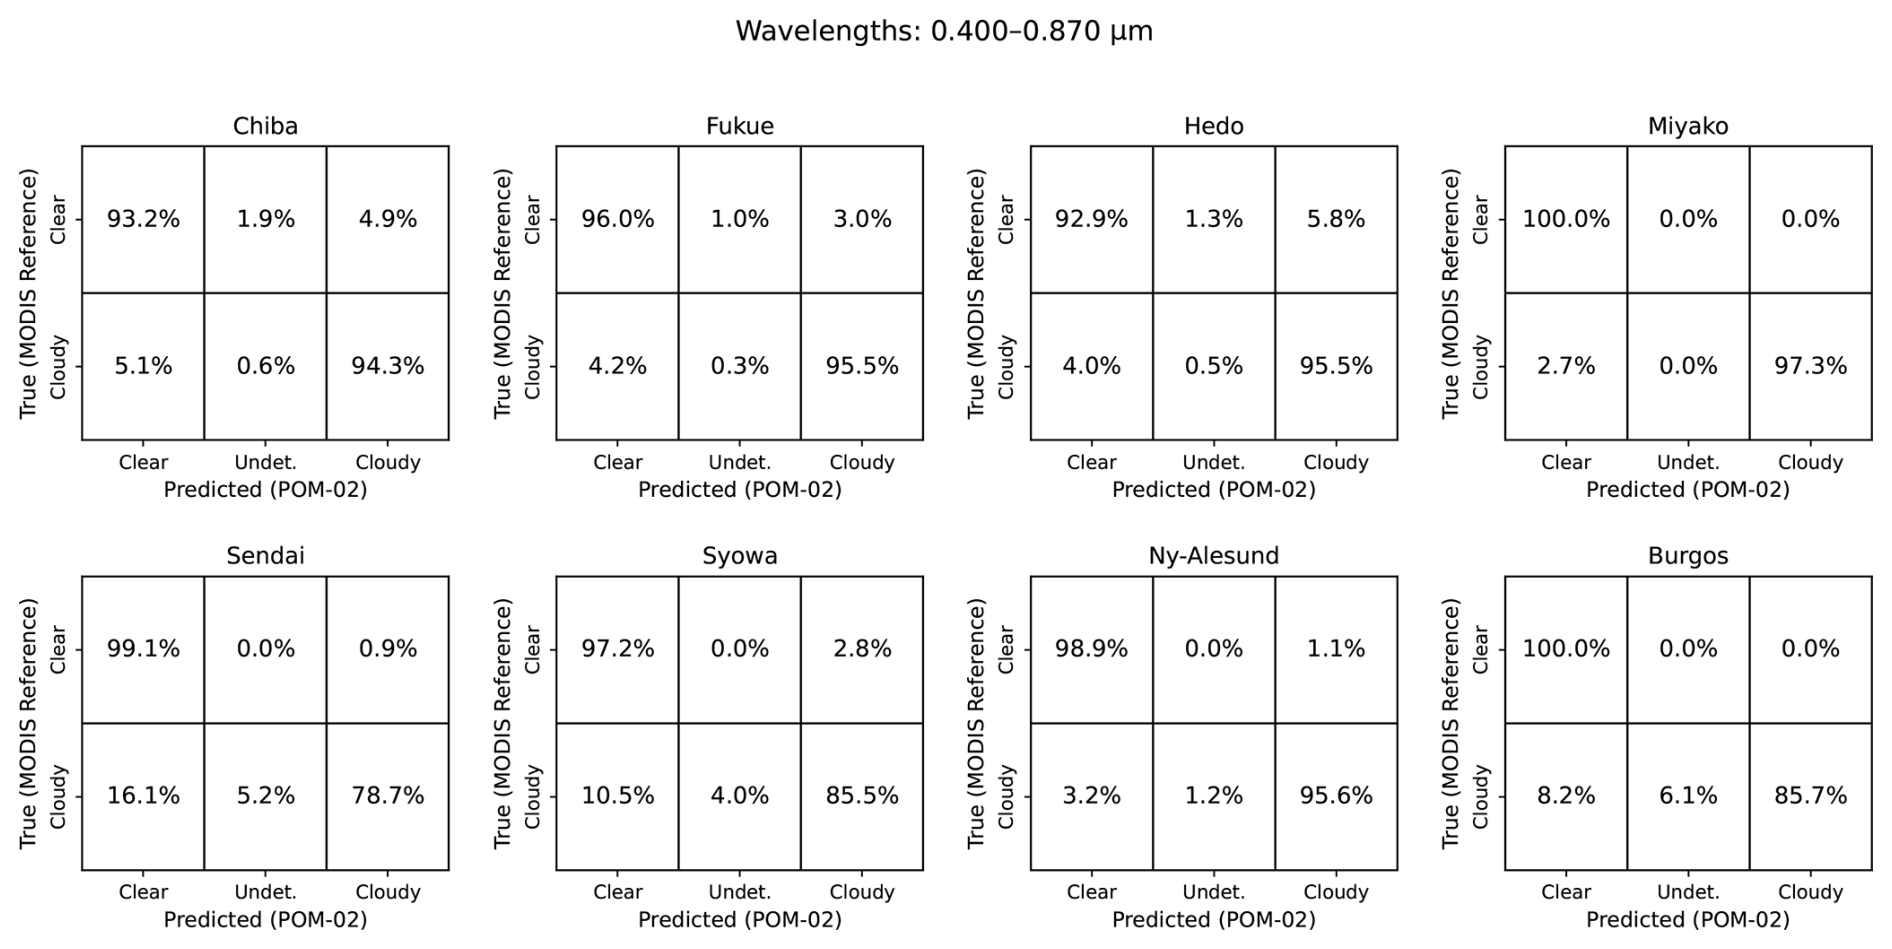
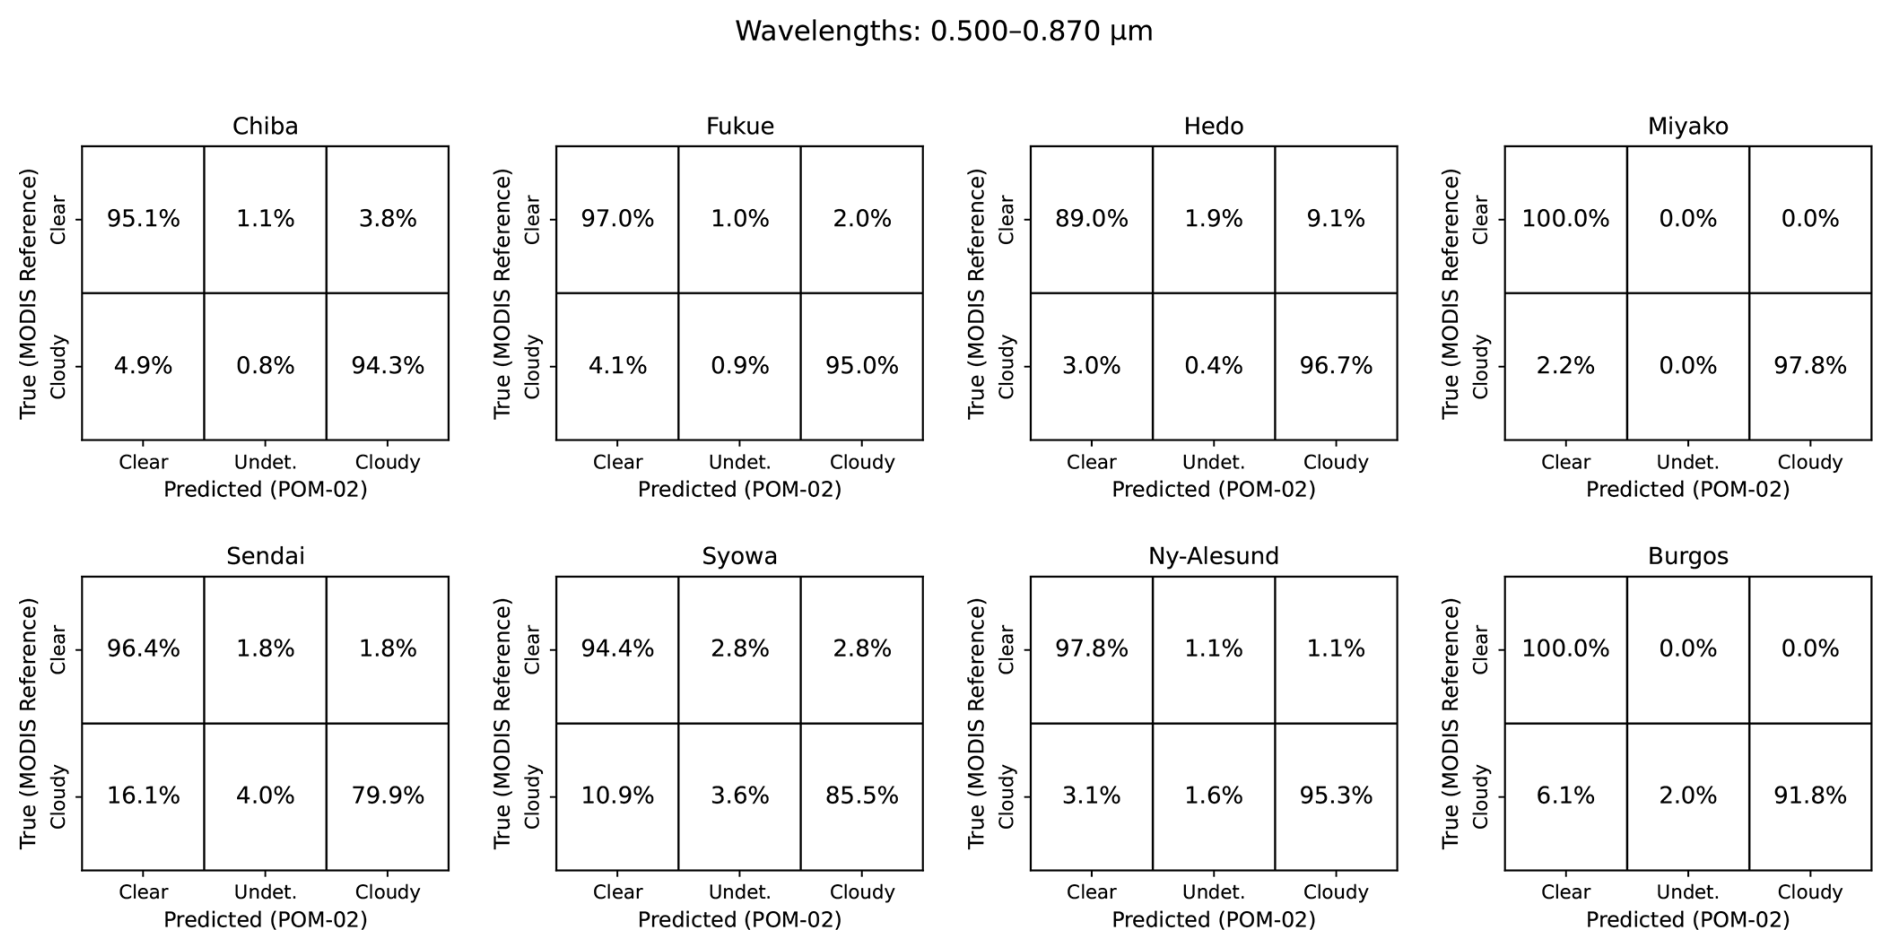
To further evaluate whether the criteria derived from the pooled observations described above are applicable across different atmospheric environments, Ty for each wavelength pair was applied independently to the eight observation sites to classify observation data into three classes (clear-sky, cloudy-sky, and undetermined) using ϵ value of 0.05. The resulting confusion matrices for classfication for each wavelength pair are shown in Figs. 6–9.
For the 0.400 and 0.675 µm wavelength pair (Fig. 6), clear-sky agreement is consistently high across all sites, ranging from 92.2 % at Hedo to 100 % at Miyako and Burgos. Cloudy-sky agreement is also high at Chiba, Fukue, Hedo, Miyako, and Ny-Ålesund, where it ranges from 94.4 % to 96.8 %. Somewhat lower cloudy-sky agreement is observed at Sendai (81.6 %), Syowa (84.0 %), and Burgos (83.7 %). For the 0.500 and 0.675 µm wavelength pair (Fig. 7), clear-sky agreement ranges from 91.6 % at Hedo to 100 % at Miyako and Burgos, while cloudy-sky agreement ranges from 87.9 % at Sendai to 98.2 % at Ny-Ålesund. Cloudy-sky agreement exceeds 95 % at Chiba, Fukue, Hedo, Miyako, and Ny-Ålesund and remains relatively high at Syowa (90.7 %) and Burgos (93.9 %. For 0.400 and 0.870 µm wavelength pair (Fig. 8), clear-sky agreement is also consistently high, ranging from 92.9 % at Hedo to 100 % at Miyako and Burgos. Cloudy-sky agreement exceeds 94 % at Chiba, Fukue, Hedo, Miyako, and Ny-Ålesund but decreases to 78.7 % at Sendai, 85.5 % at Syowa, and 85.7 % at Burgos. The 0.500–0.870 µm wavelength pair (Fig. 9) also shows that clear-sky agreement ranges from 89.0 % at Hedo to 100 % at Miyako and Burgos. Cloudy-sky agreement exceeds 94 % at Chiba, Fukue, Hedo, Miyako, and Ny-Ålesund, while lower values are found at Sendai (79.9 %) and Syowa (85.5 %). Burgos shows a cloudy-sky agreement of 91.8%. The fraction of observations classified as undetermined is generally small for ϵ value of 0.05. This indicates that the selected tolerance margin removes only a small fraction of observations from definite clear/cloudy classification while providing an explicit category for observations located close to the optimum decision boundary. Further, to quantify the relative performance of the four wavelength-pair slope indices, we calculated three classification metrics: clear recall, cloudy recall, and balanced accuracy. These are defined as follows:
where, Nclear→clear and Ncloudy→cloudy denote the numbers of observations correctly classified as clear and cloudy, respectively, while NMODIS_clear and NMODIS_cloudy denote the total numbers of reference clear- and cloudy-sky observations. The site-averaged values of these metrics are summarized in Table 3.
Table 3Performance comparison of three wavelength-pair slope indices for clear/cloudy discrimination using MODIS cloud mask as the reference.
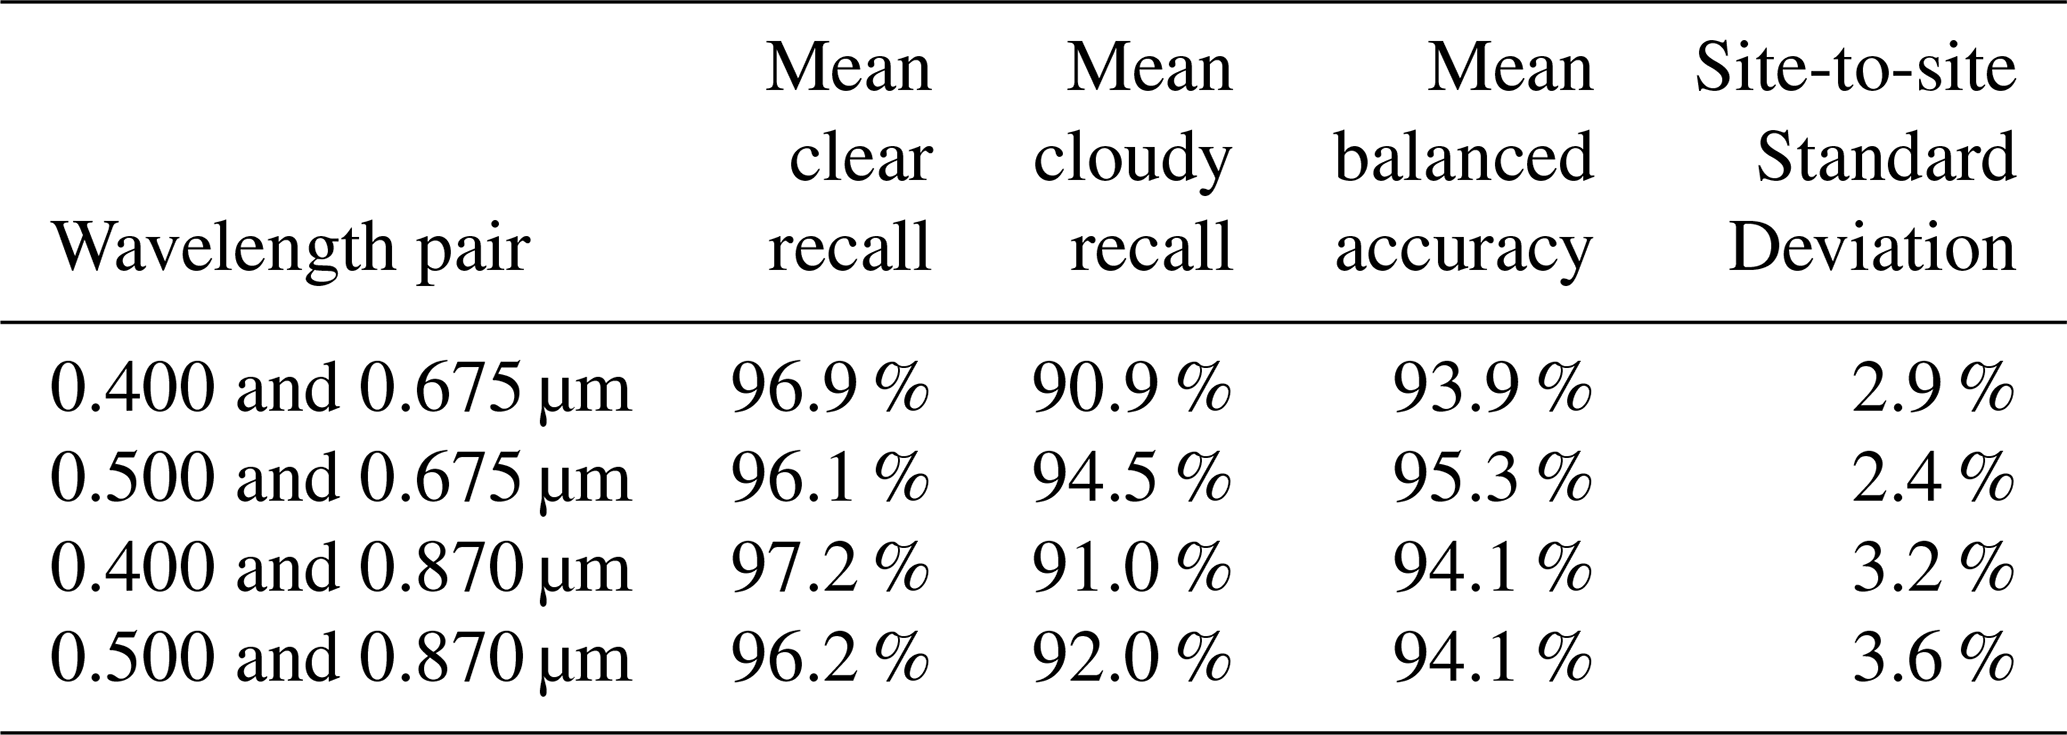
All four wavelength pairs show high site-averaged performance, with mean balanced accuracies ranging from 93.9 % to 95.3 %. The 0.500–0.675 µm pair provides the highest mean balanced accuracy (95.3 %) and the smallest site-to-site variability (2.4 %), with mean clear and cloudy recalls of 96.1 % and 94.5 %, respectively. This result is consistent with the pooled ROC analysis, in which this pair also shows the highest ROC AUC. The 0.400–0.870 µm pair provides the highest mean clear recall (97.2 %), although its lower mean cloudy recall (91.0 %) results in a balanced accuracy of 94.1 %. The 0.500–0.870 µm pair shows the same mean balanced accuracy (94.1 %), with clear and cloudy recalls of 96.2 % and 92.0 %, respectively. The 0.400–0.675 µm pair has the lowest, although still high, mean balanced accuracy (93.9 %), mainly because of its relatively lower cloudy recall (90.9 %).
Overall, the pooled ROC analysis and independent site-level evaluation provide consistent evidence that the atmospheric matm corresponding to all four wavelength pairs are useful for clear- and cloudy-sky discrimination. Among them, the 0.500–0.675 µm pair provides the strongest overall performance. The other three wavelength pairs also provide high discrimination performance and may therefore serve as complementary criteria.
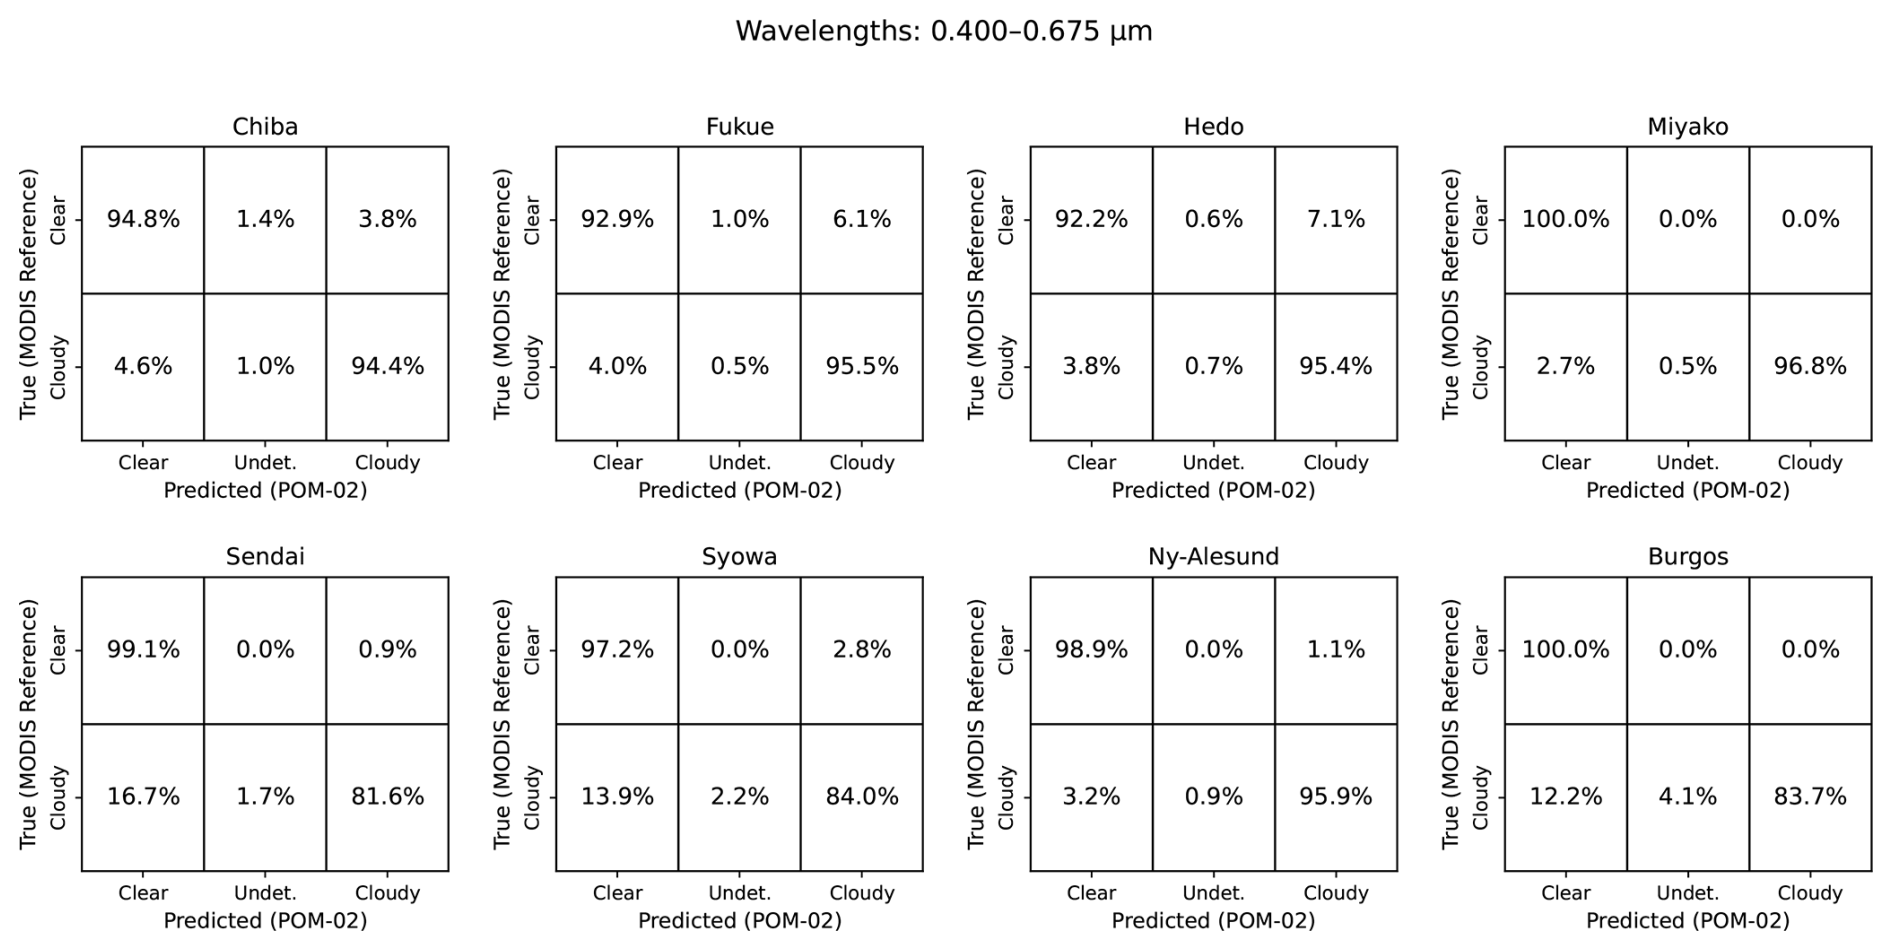
Figure 6Confusion matrices for clear, undetermined, and cloudy sky discrimination using atmospheric slope (matm) values determined using 0.400 and 0.675 µm wavelength pair. MODIS cloud-mask classifications are used as the reference, while POM-02 slope-based classifications are treated as predictions. Each matrix is normalized by the MODIS reference class, so that each row sums to 100 %.
4.2 Validation of the Spectral Slope Criterion Using Direct Normal Irradiance
To evaluate the applicability of the matm criteria for discriminating clear, cloudy, and ambiguous sky conditions, direct normal irradiance (DNI) measurements obtained from pyrheliometers were analyzed together with sky radiometer observations. DNI provides an independent physical indicator of sky condition because it represents the direct solar beam reaching the surface and is therefore highly sensitive to cloud attenuation. Under clear-sky conditions, DNI is expected to remain relatively high and to decrease smoothly with increasing solar zenith angle (SZA) mainly because of increasing atmospheric air mass. Under cloudy conditions, DNI is strongly reduced because clouds attenuate or block the direct solar beam.
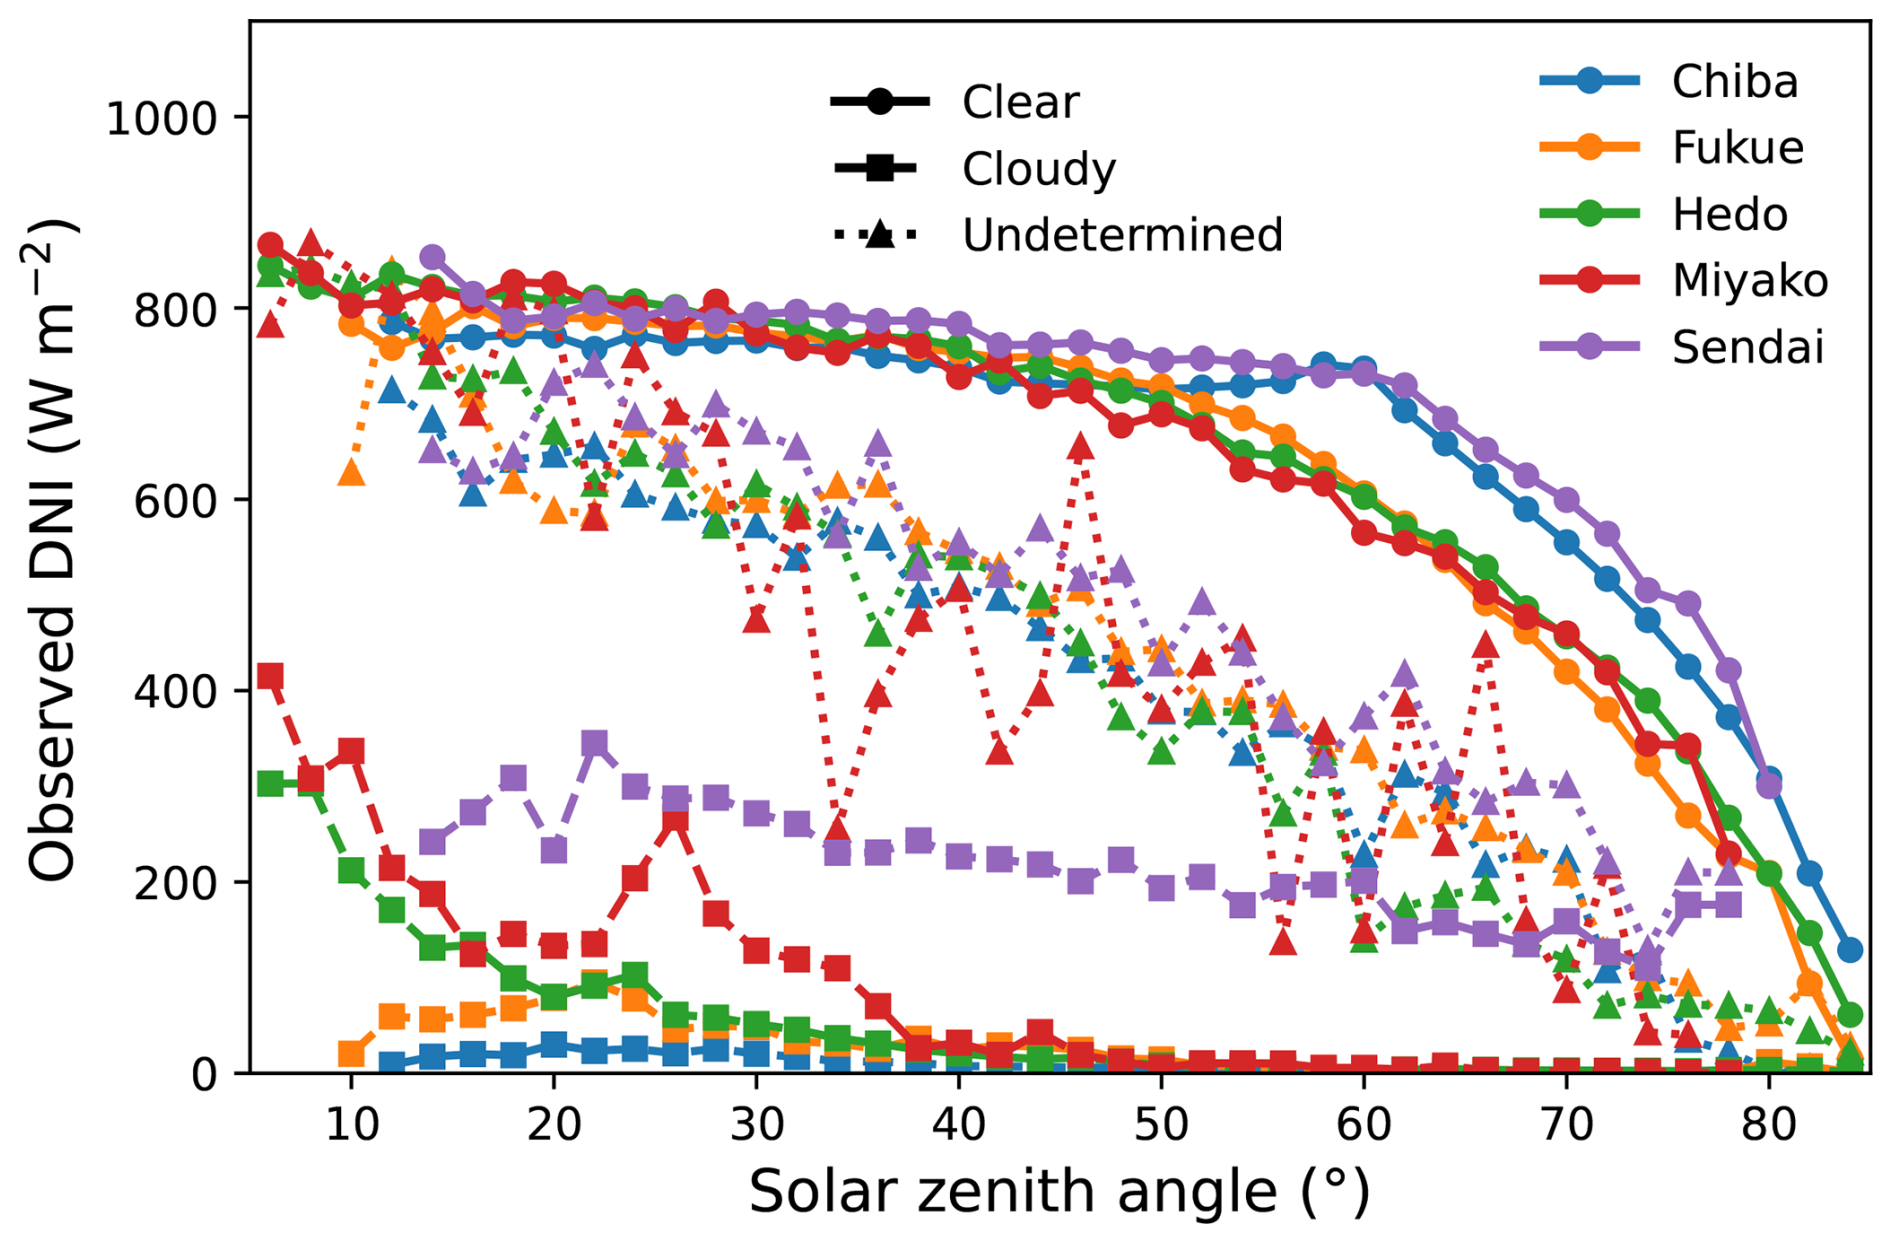
Figure 10Relationship between median values of observed direct normal irradiance (DNI) within a 2° solar zenith angle (SZA) bin and SZA for clear, cloudy, and undetermined conditions predicted using wavelength pair of 0.500 and 0.675 with ϵ=0.05 at (a) Chiba, (b) Hedo, (c) Fukue, (d) Miyako, and (e) Sendai.
Figure 10 shows the relationship between median observed DNI and SZA for five observation sites: Chiba, Fukue, Hedo, Miyako, and Sendai. The median DNI values were calculated within 2° SZA bins. Sky conditions were classified using 0.500 and 0.675 µm wavelength pair with conservative threshold of ϵ=0.05. These wavelenghts also exhibit relatively stable long-term calibration characteristics in POM-02 instruments compared with shorter-wavelength channels (Uchiyama et al., 2018).
Across all five sites, the clear-sky class exhibits high median DNI values over low to moderate SZAs, followed by a gradual decrease at larger SZAs. This behavior is physically consistent with direct-beam transmission under cloud-free conditions, where the dominant SZA dependence is controlled by geometric air-mass effects. The clear-sky curves are especially coherent among the sites, although site-to-site differences are visible because of differences in aerosol loading, water vapor, surface environment, and sampling conditions.
In contrast, the cloudy class is characterized by substantially lower median DNI values over most SZA ranges. For several sites, cloudy-sky DNI values rapidly decrease to near-zero levels, indicating strong attenuation of the direct solar beam by clouds. This confirms that the combined positive-slope criterion successfully identifies conditions in which direct solar radiation is strongly suppressed.
The undetermined class occupies an intermediate regime between the clear and cloudy classes. Its median DNI values are generally lower than those of the clear class but higher and more variable than those of the cloudy class. This behavior is physically reasonable because the undetermined category includes cases where the two slope criteria do not provide a consistent classification, such as thin clouds, broken clouds, cloud-edge conditions, aerosol-influenced cases, or transitional sky conditions. Therefore, the undetermined group should not be interpreted as classification failure, but rather as a conservative buffer zone that prevents uncertain cases from being forced into either the clear or cloudy category.
Overall, the clear, cloudy, and undetermined DNI regimes are well separated. The high and smoothly varying DNI values for the clear class, the strongly reduced DNI values for the cloudy class, and the intermediate behavior of the undetermined class demonstrate that matm criteria provides a physically consistent and conservative method for sky-condition discrimination. The results may also indicate that introducing an undetermined category is useful for improving the robustness of the method, especially under mixed or transitional atmospheric conditions.
4.3 Comparison with Results from Existing Clear- and Cloudy-Sky Detection Procedure
To evaluate the performance of the matm-based cloud screening approach over a wider range of atmospehric conditions, the relationship between AOT (0.5 µm) and AE derived by detecting clear-sky conditions using 0.500 and 0.675 nm wavelength pair was compared with results obtained using the SR-CEReS package. The SR-CEReS processing package employs a multi-step cloud-screening procedure to identify cloud-contaminated observations before aerosol retrieval. The algorithm follows the method of Khatri and Takamura (2009), but excludes the pyranometer-based global irradiance test to allow consistent processing across SKYNET sites where pyranometer observations are unavailable. The cloud-screening procedure combines (1) a spectral variability test (Kaufman et al., 2006) and (2) statistical quality-control tests based on Smirnov et al. (2000), including checks of the number of observations, diurnal stability, smoothness of aerosol optical thickness, and the three-standard-deviation criterion. Observations failing one or more of these tests are classified as cloud contaminated and excluded from the aerosol retrieval process.
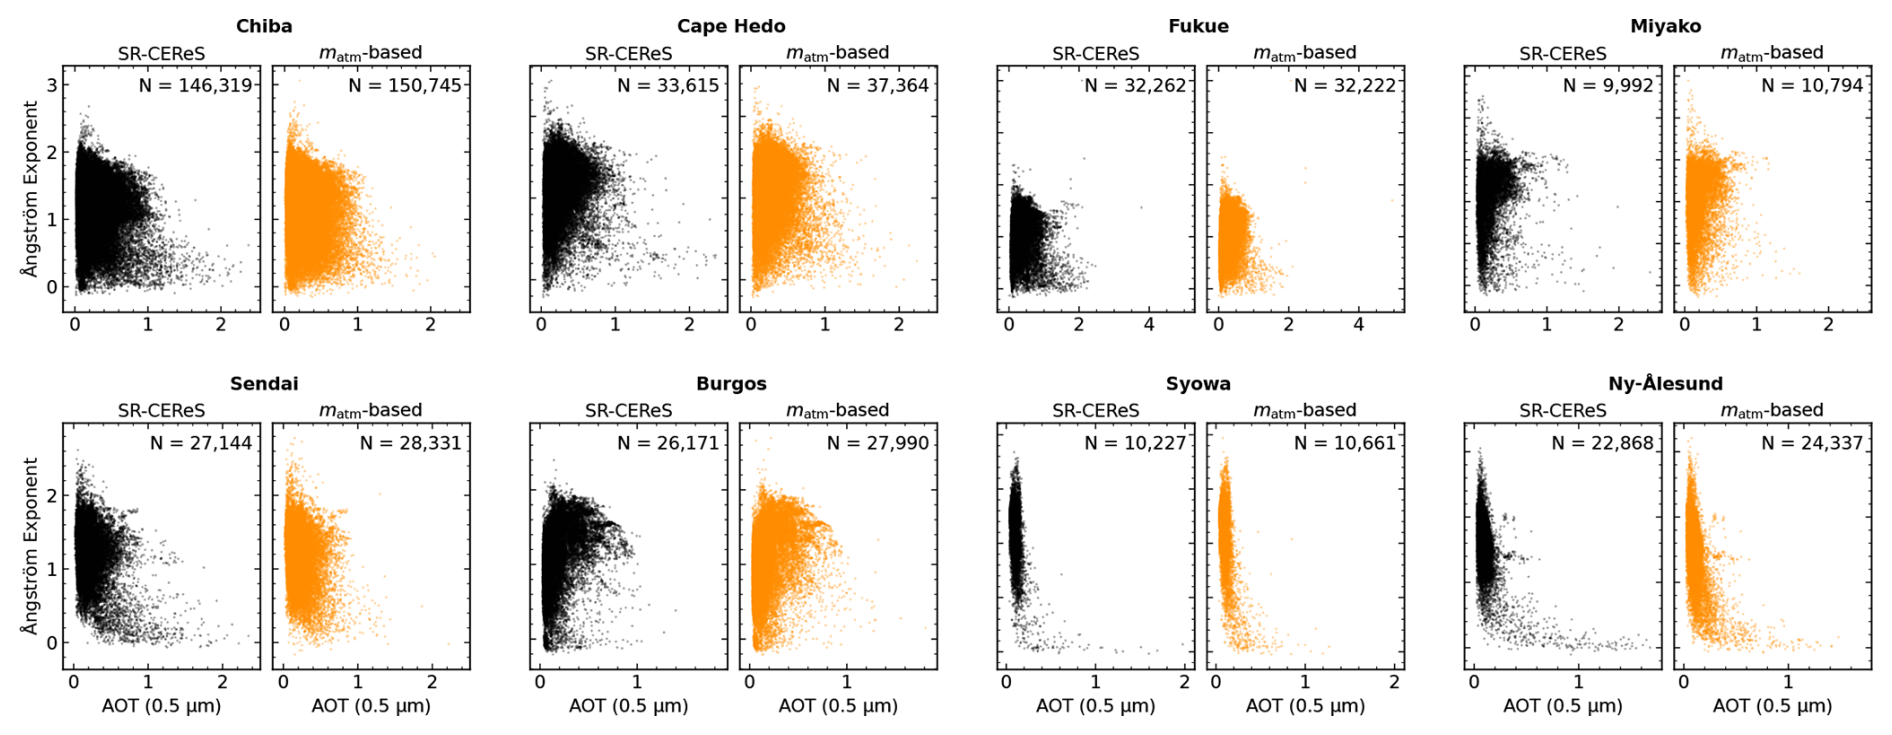
Figure 11Scatter plots of Ångström exponent (AE) versus aerosol optical thickness (AOT) at 0.5 µm for eight SKYNET sites after cloud screening using two systems: the SR-CEReS package (left panels) and the slope-based method derived from the atmospheric slope of zenith radiance between 0.500 and 0.675 µm with ϵ value of 0.05 (right panels). Numbers indicate the total observations retained by each method.
Figure 11 compares the AOT–AE relationships obtained using the two cloud-screening approaches for eight SKYNET sites covering markedly different atmospheric environments. Overall, the distributions obtained using the matm-based method closely resemble those derived using SR-CEReS. This agreement is evident in the dominant AOT and AE ranges as well as in the overall shape and spread of the joint distributions. Figures 12 and 13 provide a more direct comparison of the corresponding probability-density distributions. The probability density was calculated as,
where nj is the number of observations within bin, N is the total number of observations retained by the corresponding cloud-screening method, and Δx is the bin width. Fixed bin widths of 0.05 for AOT and 0.1 for AE were used for all sites and for both screening methods.
As shown in Fig. 12, the AOT probability density distributions obtained using the proposed method generally closely follow those obtained using SR-CEReS. The locations of the major peaks and the overall shapes of the distributions are similar at most sites, despite the large differences in aerosol loading among the sites. Particularly close agreement is observed at Chiba, Cape Hedo, Miyako, Sendai, Burgos, Syowa, and Ny-Ålesund. A somewhat more noticeable difference occurs at Fukue, where the SR-CEReS distribution exhibits a broader contribution toward relatively high AOT than the proposed method. Nevertheless, the dominant AOT range remains similar between the two methods. This overall agreement indicates that the proposed screening does not substantially modify the AOT distribution of the observations identified as clear sky.
A similar result is obtained for AE (Fig. 13). The two methods reproduce not only the locations of the major distribution peaks but also the characteristic site-to-site differences in AE. For example, the distributions at Syowa and Ny-Ålesund are shifted toward considerably larger AE than those at the midlatitude and tropical sites, and this distinctive behavior is reproduced by both screening methods. At several sites, the distribution obtained using the proposed method shows a small shift toward lower AE relative to SR-CEReS, but the overall shapes and ranges remain similar. Thus, the proposed method preserves the major characteristics of both the AOT and AE distributions across atmospheric environments ranging from very low aerosol loading at the polar sites to substantially higher aerosol loading at the midlatitude and tropical sites.
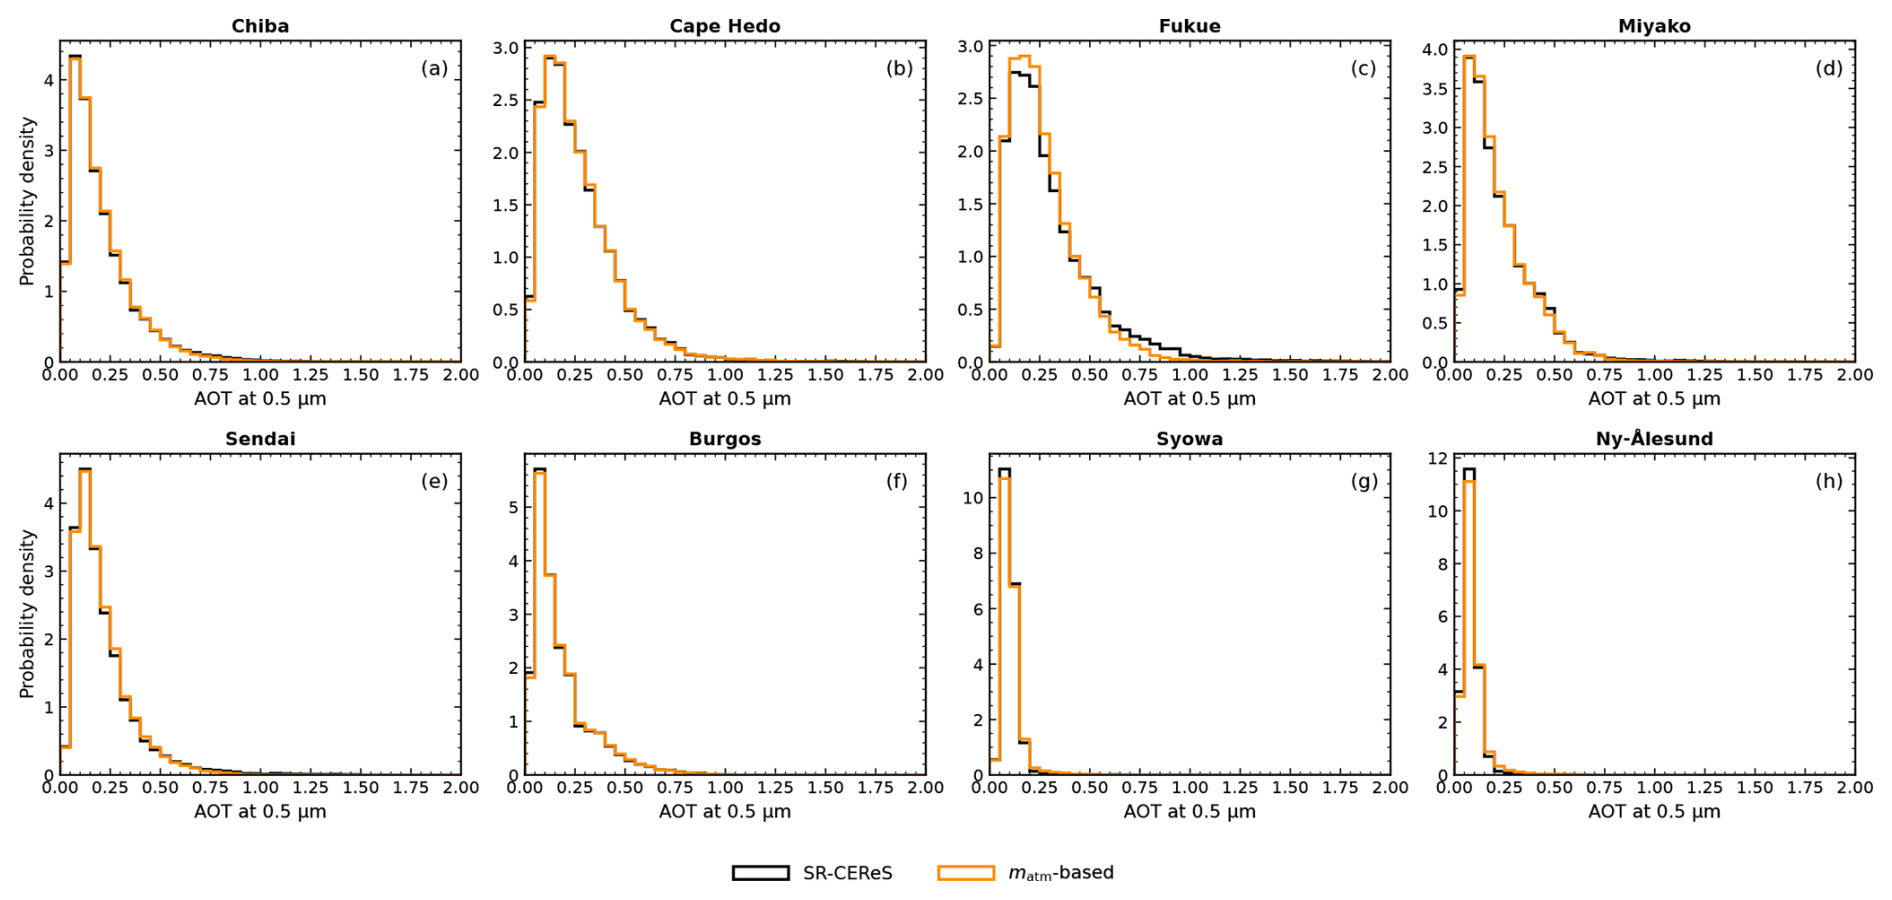
Figure 12Probability density distributions of aerosol optical thickness (AOT) at 0.5 µm obtained after clear-sky screening using the SR-CEReS procedure and the proposed atmospheric-slope-based method at the eight SKYNET sites. A fixed AOT bin width of 0.05 was used for the probability density calculation. For clarity, the displayed AOT range is limited to 0–2.0, although the probability density analysis was performed using all valid observations over the full analysis range.
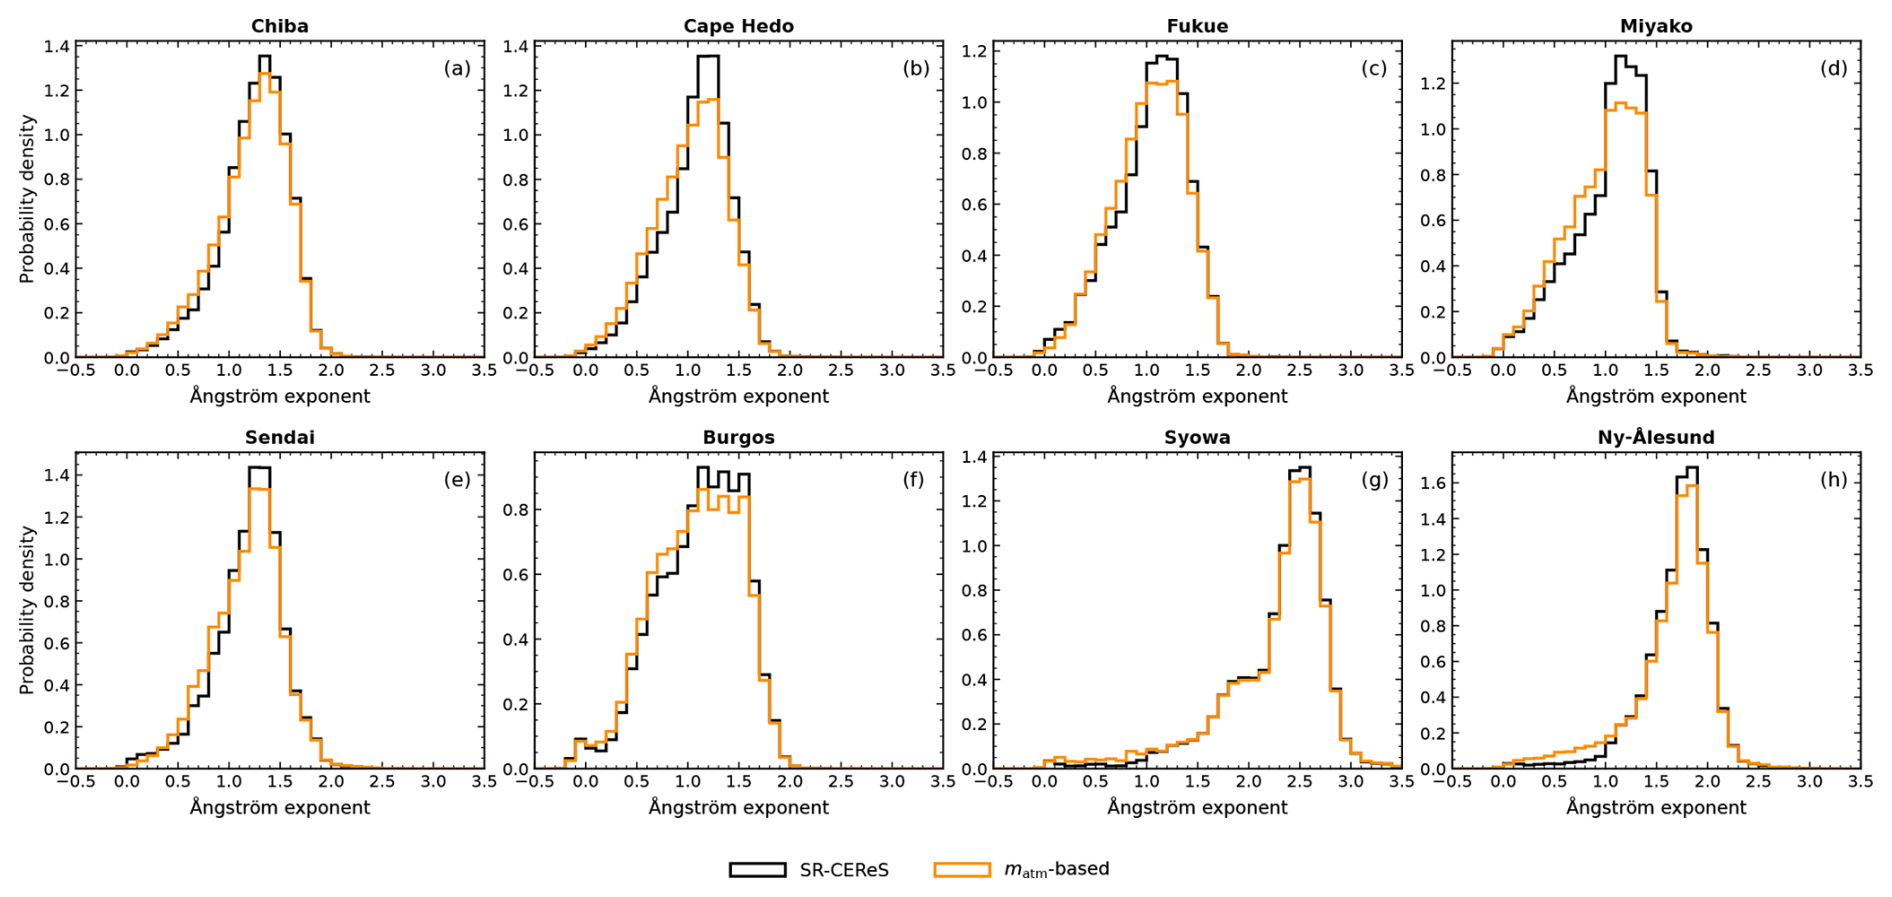
Figure 13Same as Fig. 12, but for the Ångström exponent. A fixed Ångström exponent bin width of 0.10 was used for the probability density calculation. For clarity, the displayed Ångström exponent range is limited to −0.5–3.5, although the probability density analysis was performed using all valid observations over the full analysis range.
Table 4Seasonal comparison of the number of retained observations, aerosol optical thickness (AOT) at 0.5 µm, and Ångström exponent obtained after clear-sky screening using SR-CEReS and the proposed atmospheric-slope-based method.
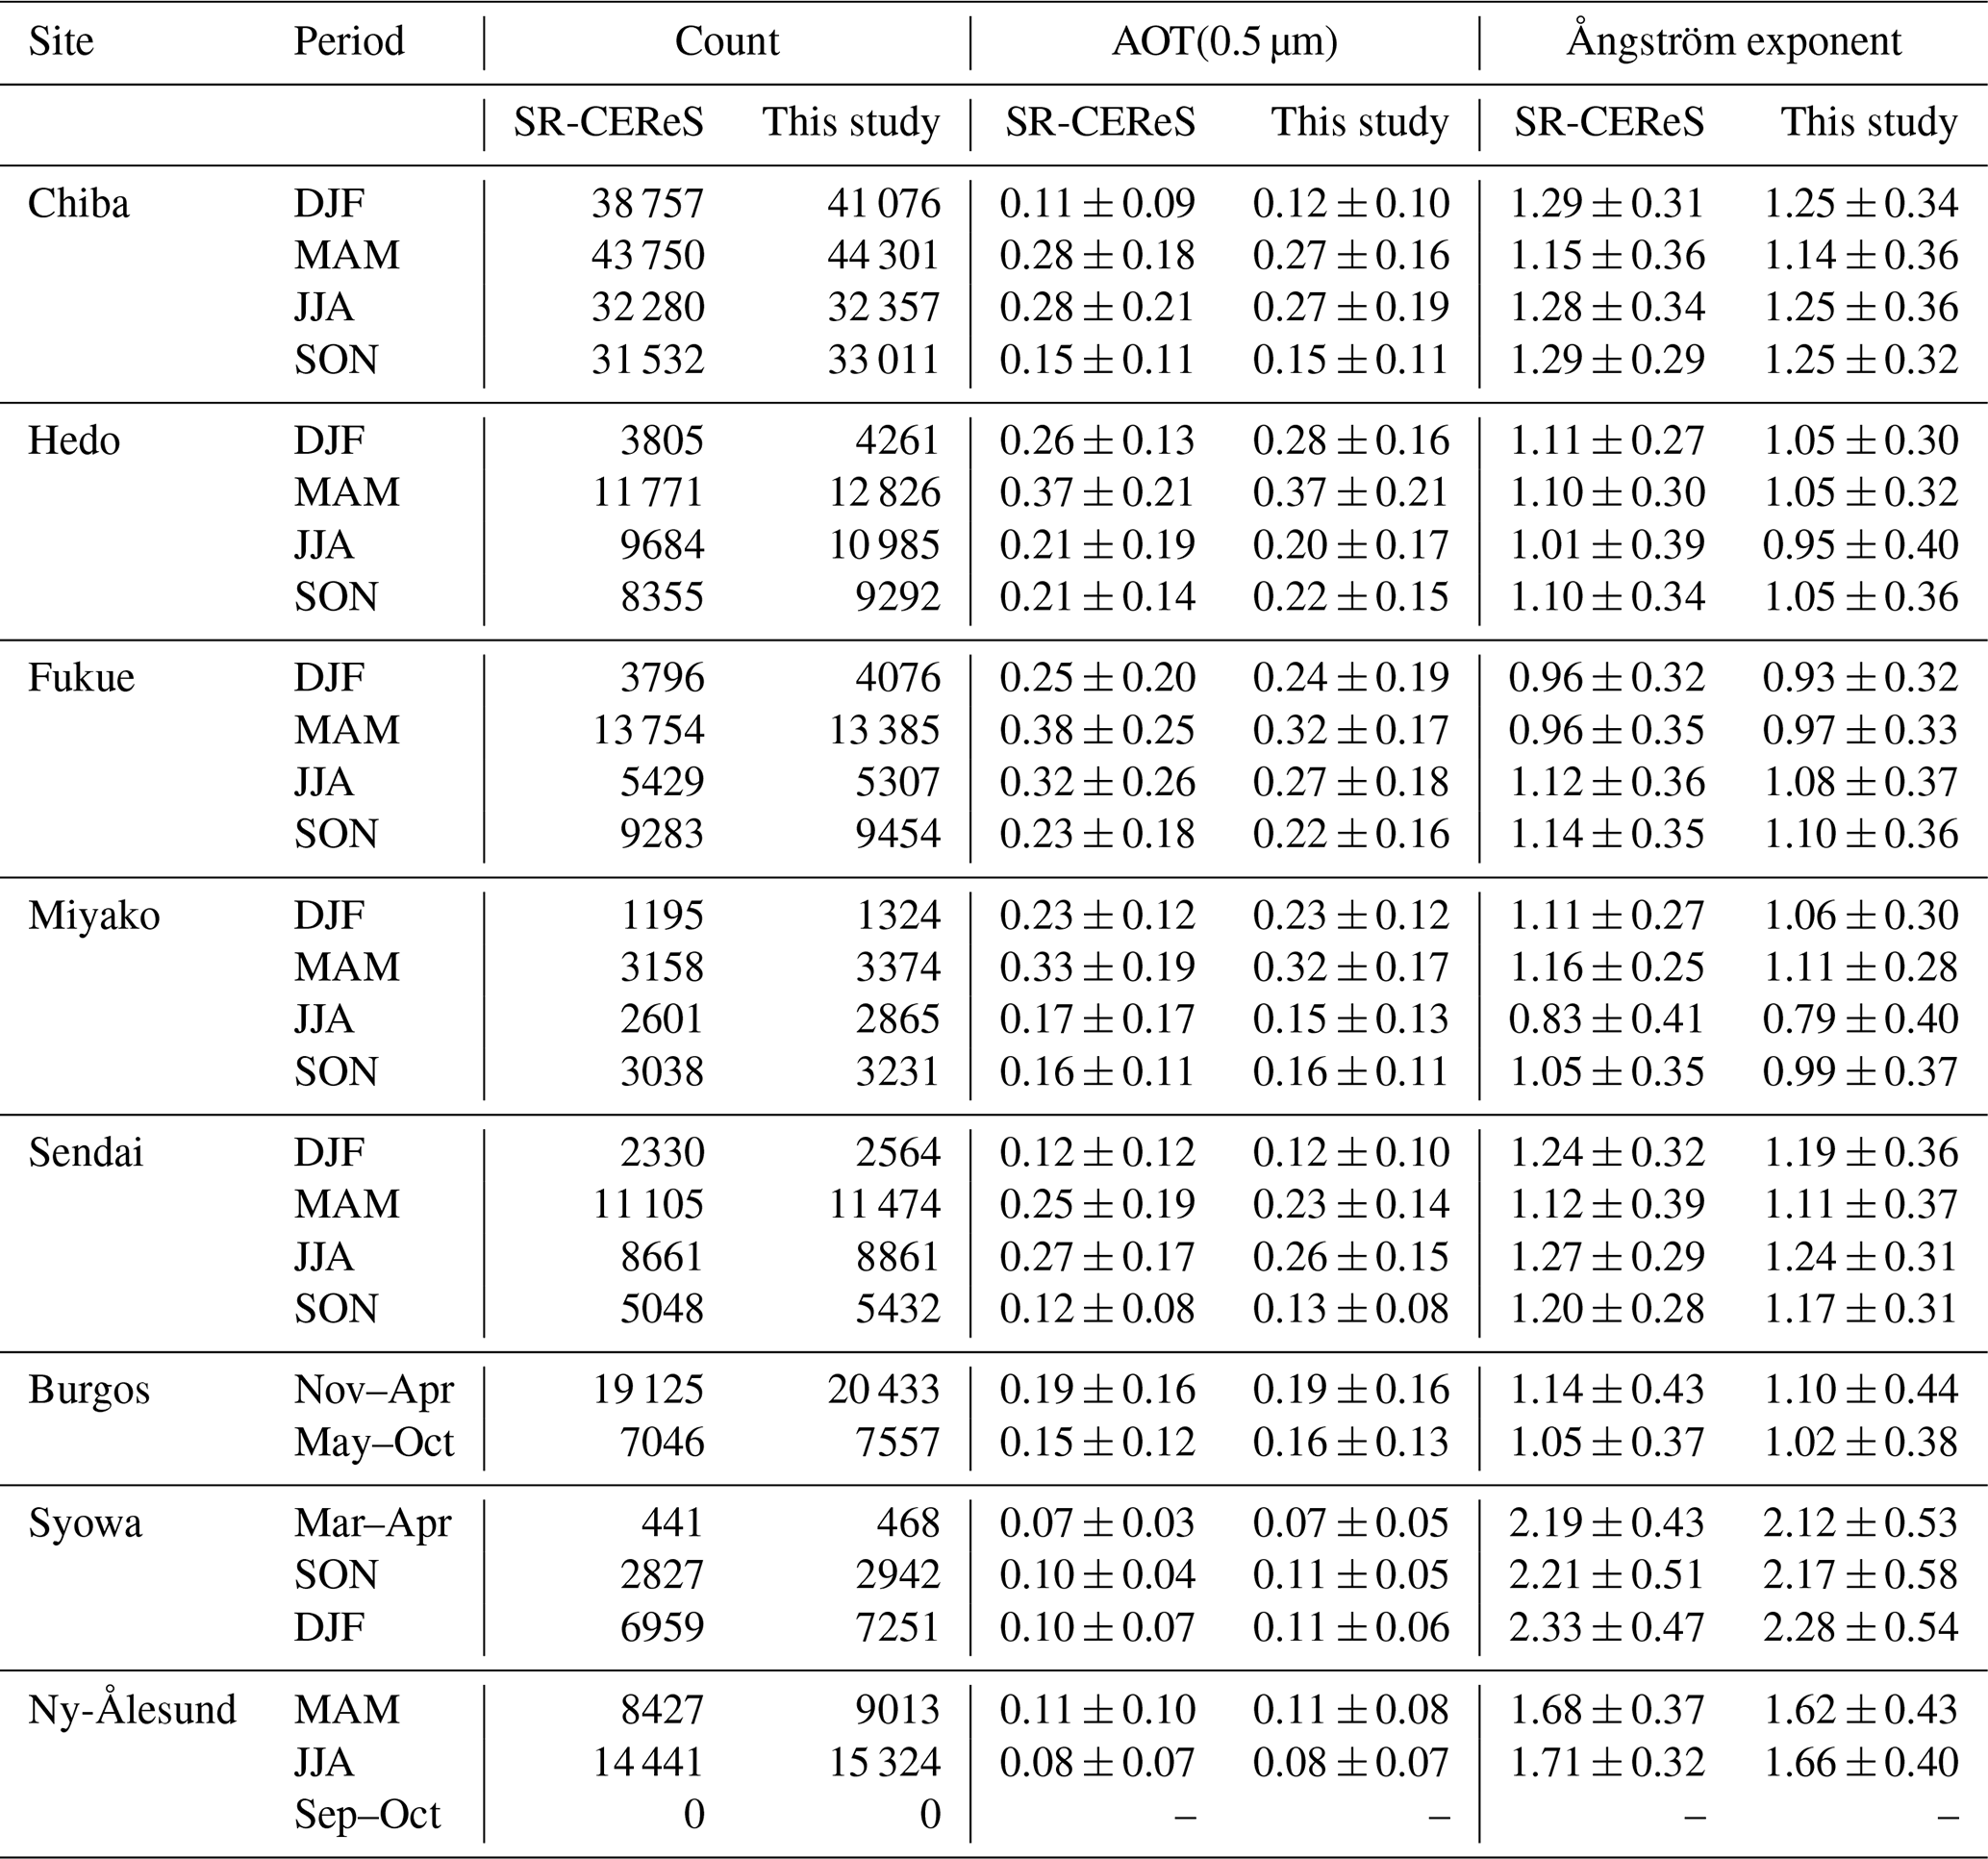
The seasonal statistics summarized in Table 4 provide a quantitative evaluation of this agreement. For the five Japanese sites, the comparison was performed separately for DJF, MAM, JJA, and SON; Burgos was divided into November–April and May–October; and seasonally appropriate periods were used for the two polar sites. For each period, Table 4 compares the number of retained observations, mean AOT ± standard deviation, and mean AE ± standard deviation obtained using SR-CEReS and the proposed method. In most cases, the seasonal mean values from the two screening approaches are very similar and remain well within the corresponding standard deviations.
At Chiba, for example, the mean AOT values obtained using SR-CEReS and the proposed method are 0.11 ± 0.09 and 0.12 ± 0.10 in DJF, 0.28 ± 0.18 and 0.27 ± 0.16 in MAM, 0.28 ± 0.21 and 0.27 ± 0.19 in JJA, and 0.15 ± 0.11 and 0.15 ± 0.11 in SON, respectively. The corresponding AE values also show close agreement, differing by only approximately 0.01–0.04 in their seasonal means. Similar behavior is observed at Cape Hedo, Miyako, and Sendai, indicating that the proposed method reproduces the seasonal aerosol characteristics identified by SR-CEReS.
Fukue shows somewhat larger differences during periods of enhanced aerosol loading. In MAM, the mean AOT decreases from 0.38 ± 0.25 using SR-CEReS to 0.32 ± 0.17 using the proposed method, while in JJA it decreases from 0.32 ± 0.26 to 0.27 ± 0.18. Despite these differences, the corresponding AE values remain similar, and the overall AOT and AE distributions retain the similar characteristic between the two methods. This suggests that the two methods differ somewhat in the treatment of observations under higher aerosol-loading conditions, while the resulting aerosol populations remain broadly consistent.
Burgos provides a contrasting tropical environment. During November–April, the mean AOT is 0.19 ± 0.16 for both methods, while the mean AE values are 1.14 ± 0.43 and 1.10 ± 0.44 for SR-CEReS and the proposed method, respectively. During May–October, the corresponding AOT values are 0.15 ± 0.12 and 0.16 ± 0.13, and the AE values are 1.05 ± 0.37 and 1.02 ± 0.38. These close seasonal statistics support the similarity of the aerosol populations retained by the two cloud-screening approaches under tropical conditions.
The polar sites provide an additional test under very low-AOT conditions. At Syowa, during DJF, the mean AOT is 0.10 ± 0.07 for SR-CEReS and 0.11 ± 0.06 for the proposed method, while the corresponding AE values are 2.33 ± 0.47 and 2.28 ± 0.54. During SON, the AOT values are 0.10 ± 0.04 and 0.11 ± 0.05, and the AE values are 2.21 ± 0.51 and 2.17 ± 0.58. At Ny-Ålesund, the MAM AOT values are 0.11 ± 0.10 and 0.11 ± 0.08, while the corresponding AE values are 1.68 ± 0.37 and 1.62 ± 0.43. The similarly close agreement during JJA further indicates that the proposed method remains effective under extremely clean atmospheric conditions.
Table 4 also shows that the number of retained observations is generally comparable between the two methods and is often slightly larger for the proposed matm-based screening. For example, at Chiba the proposed method retains 41 076 observations in DJF compared with 38 757 using SR-CEReS, while at Cape Hedo the corresponding values are 4261 and 3805. Similar increases occur at several other sites and periods. Importantly, this increase in the number of retained observations is not accompanied by a substantial shift in the mean AOT or AE values. This suggests that the proposed method can retain additional usable observations without introducing an obvious systematic bias into the retrieved aerosol optical properties.
Taken together, Figs. 11–13 and Table 4 demonstrate that the proposed matm-based screening reproduces both the distributional characteristics and the seasonal statistics of aerosol properties obtained using SR-CEReS across diverse atmospheric environments. The evaluation includes midlatitude Japanese sites, a tropical site, and two polar sites, and therefore spans a wide range of aerosol loadings, aerosol types, and seasonal conditions. These results indicate that the proposed method is robust across substantially different atmospheric regimes and does not introduce a systematic distortion of the cloud-screened aerosol climatology.
Nevertheless, the present evaluation is statistical and climatological rather than event specific. Individual desert-dust outbreaks, biomass-burning smoke episodes, and thin-cirrus cases were not independently identified using external aerosol- or cloud-type observations. Therefore, the present results should not be interpreted as a direct event-by-event validation for those specific conditions. Such evaluation would require independent identification using coincident lidar, satellite cloud products, or other ancillary observations. However, the multi-site, seasonal, and distributional comparisons presented here substantially broaden the range of atmospheric conditions under which the method is evaluated and provide quantitative evidence that its performance remains consistent across those conditions.
This study investigated the spectral characteristics of zenith sky radiance measurements from SKYNET sky radiometers under clear- and cloudy-sky conditions identified using quality-controlled MODIS cloud mask products. The study also examined the potential for discriminating between these sky conditions using spectral information.
For a given wavelength pair, the spectral slope derived from the measured signal, mobs, contains contributions from both the atmospheric spectral dependence and the wavelength-dependent instrumental response and can be expressed as mobs = matm+minst, where matm represents the atmopsheric contirbution and minst represents the wavelength-dependent instrumental contribution. Provided that the relative spectral response of an individual instrument remains sufficiently stable, minst, primarily introduces an instrument-dependent offset, while temporal variations associated with changes in atmospheric scattering conditions are retained in matm. The radiative transfer simulations demonstrated that matm is strongly negative under cloud-free conditions, particularly under relatively low aerosol loading, whereas cloud scattering systematically shifts matm toward less negative values because of the weaker wavelength dependence of cloud-droplet scattering and the enhanced contribution of multiple scattering. These results established a physical basis for using matm to distinguish between cloud-free and cloud-contaminated atmospheric conditions. The analysis of spectral zenith-sky radiances estimated from obseravation data revealed that cloudy skies exhibit relatively flatter spectral behavior in the visible to near-infrared region, whereas clear skies show relatively stronger wavelength dependence consistent with Rayleigh and aerosol scattering processes. These results are consistent with spectral behviours of aerosol- and cloud-laden atmospheres revealed from radiative transfer simulations. Among the wavelength combinations available from the instrument, matm values derived from four wavelength pairs (0.400–0.675, 0.400–0.870, 0.500–0.675, and 0.500–0.870 µm) showed consistently high capability for discriminating between clear- and cloudy-sky conditions. Based on these results, practical sky-state detection critaria were developed to discrimate observations into clear-sky, cloudy-sky, and undetermined categories. Although all these four wavelength pairs showed the capability of robust discrimination, the 0.500–0.675 µm pair provided the best performance across the different observation sites, with well-balanced capability for detecting both clear- and cloudy-sky conditions.
The robustness of the proposed criteria was further validated using collocated DNI measurements across different atmospehric regimes. The cases identified as clear-skies corresponded to high DNI values that varied smoothly with solar zenith angle, characteristic of clear-sky radiative transfer. In contrast, cases identified as cloudy skies were associated with substantially reduced DNI values, reflecting strong attenuation of the direct solar beam by clouds. Further, DNI values corresponding to undetermined cases existed between those for clear and cloudy sky conditions. This clear separation in DNI distributions across geographically and climatologically distinct sites confirms the physical consistency of the proposed slope-based classification approach for detecting clear- and cloudy-sky conditions easily and smoothly.
To further evaluate the performance of the matm-based screening approach, cloud-screend aerosol optical properties using our method were compared with those derived from the SR-CEReS package. The joint AE–AOT relationships and their probability distributions obtained from both approaches showed substantial agreement across multiple observation sites representing urban, maritime, tropical continental, and polar environments. In particular, the matm-based method successfully reproduced the characteristic aerosol regimes observed at each site without introducing noticeable biases in the retrieved aerosol optical properties. Consistent with these distributional comparisons, the seasonal mean AOT and AE values derived using the two approaches were generally similar and mostly within their corresponding variability ranges, demonstrating that the proposed method also preserves the seasonal characteristics of aerosol loading and particle-size-related behavior. Furthermore, the matm-based method generally retained a comparable or slightly larger number of observations without producing a substantial systematic shift in AOT or AE.
Overall, the results demonstrate that the spectral sky zenith radiances observed by sky radiometer provide a very powerful information to detect sky states reasonablly without substantial computational burden or auxiliary data from other sources, provided that wavelength-dependent instrumental contribution, minst, is removed from the observed zenith sky radiance signals.
The MODIS Terra and Aqua Level 2 cloud mask (MOD35_L2 and MYD35_L2) and cloud properties (MOD06_L2 and MYD06_L2) products (Collection 6.1) used in this study are available at https://doi.org/10.5067/MODIS/MOD35_L2.061 (Ackerman et al., 2015), https://doi.org/10.5067/MODIS/MYD35_L2.061 (Ackerman et al., 2017), https://doi.org/10.5067/MODIS/MOD06_L2.061 (Platnick et al., 2015a), and https://doi.org/10.5067/MODIS/MYD06_L2.061 (Platnick et al., 2015b). Aerosol optical thickness (AOT) data were downloaded from the SKYNET website (https://skynet.irie-lab.jp, last access: 11 October 2026). The spectral zenith sky radiance data used in this study are available from the respective site owners upon reasonable request. The Burgos SKYNET operation is supported in part by the GOSAT series project. Local support for Burgos is provided by the Energy Development Corporation (EDC, the Philippines). Similarly, the observation data from Showa Station in Antarctica and Ny-Ålesund in the Arctic were collected as part of the National Institute of Polar Research's monitoring observations.
Conceptualization: PK and HI; methodology: PK; software: PK; formal analysis: PK; investigation: PK; resources: HI, HK, IM, TH, HI, and TT; writing–original draft preparation: PK; writing–review and editing: PK, TH, IM, YJ, and YT; funding acquisition: PK All authors have read and agreed to the published version of the manuscript.
The contact author has declared that none of the authors has any competing interests.
Publisher's note: Copernicus Publications remains neutral with regard to jurisdictional claims made in the text, published maps, institutional affiliations, or any other geographical representation in this paper. The authors bear the ultimate responsibility for providing appropriate place names. Views expressed in the text are those of the authors and do not necessarily reflect the views of the publisher.
This article is part of the special issue “SKYNET – the international network for aerosol, clouds, and solar radiation studies and their applications (AMT/ACP inter-journal SI)”. It does not belong to a conference.
Authors would like to thank the two anonymous reviewers and the editor for their useful and insightful comments and suggestions, which greatly helped improve the manuscript.
This research has been supported by the Japan Society for the Promotion of Science (grant no. 24K07129) and collaborative research fund of Center for Environmental Remote Sensing (CEReS), Chiba University of Fiscal year 2025.
This paper was edited by Teruyuki Nakajima and reviewed by two anonymous referees.
Ackerman, S. A., Strabala, K. I., Menzel, W. P., Frey, R. A., Moeller, C. C., and Gumley, L. E.: Discriminating clear sky from clouds with MODIS, J. Geophys. Res.-Atmos., 103, 32141–32157, https://doi.org/10.1029/1998JD200032, 1998.
Ackerman, S. et al.: MODIS Atmosphere L2 Cloud Mask Product, NASA MODIS Adaptive Processing System, Goddard Space Flight Center, USA, NASA LAADS DAAC [data set], https://doi.org/10.5067/MODIS/MOD35_L2.061, 2015.
Ackerman, S. et al.: MODIS Atmosphere L2 Cloud Mask Product, NASA MODIS Adaptive Processing System, Goddard Space Flight Center, USA, NASA LAADS DAAC [data set], https://doi.org/10.5067/MODIS/MYD35_L2.061, 2017.
Bagtasa, G., Cayetano, M. G., and Yuan, C.-S.: Seasonal variation and chemical characterization of PM2.5 in northwestern Philippines, Atmos. Chem. Phys., 18, 4965–4980, https://doi.org/10.5194/acp-18-4965-2018, 2018.
Bi, J., Shi, J., Xie, Y., Liu, Y., Takamura, T., and Khatri, P.: Dust aerosol characteristics and shortwave radiative impact at a gobi desert of northwest China during the spring of 2012, J. Meteorol. Soc. JPN, 92A, 33–56, https://doi.org/10.2151/jmsj.2014-A03, 2014.
Bohren, C. F. and Huffman, D. R.: Absorption and Scattering of Light by Small Particles, Wiley, 1–530 pp., https://doi.org/10.1002/9783527618156, 1998.
Campanelli, M., Nakajima, T., and Olivieri, B.: Determination of the solar calibration constant for a sun-sky radiometer: proposal of an in-situ procedure, Appl. Opt., 43, 651–659, https://doi.org/10.1364/AO.43.000651, 2004.
Campanelli, M., Nakajima, T., Khatri, P., Takamura, T., Uchiyama, A., Estelles, V., Liberti, G. L., and Malvestuto, V.: Retrieval of characteristic parameters for water vapour transmittance in the development of ground-based sun–sky radiometric measurements of columnar water vapour, Atmos. Meas. Tech., 7, 1075–1087, https://doi.org/10.5194/amt-7-1075-2014, 2014.
Choi, Y., Ghim, Y. S., Kim, S.-W., and Yeo, H.: Development of a cloud-screening algorithm for direct and diffuse AODs from the Skyradiometer Network, Atmos. Res., 243, 104997, https://doi.org/10.1016/j.atmosres.2020.104997, 2020.
Damiani, A., Irie, H., Takamura, T., Kudo, R., Khatri, P., Iwabuchi, H., Masuda, R., and Nagao, T.: An Intensive Campaign-Based Intercomparison of Cloud Optical Depth from Ground and Satellite Instruments under Overcast Conditions, Sola, 15, 198–204, https://doi.org/10.2151/sola.2019-036, 2019.
Dim, J. R., Takamura, T., Higurashi, A., Kathri, P., Kikuchi, N., and Nakajima, T. Y.: Validation of Two MODIS aerosols algorithms with SKYNET and prospects for future climate satellites such as the GCOM-C/SGLI, Adv. Meteorol., 2013, https://doi.org/10.1155/2013/508064, 2013.
Gueymard, C. A.: The Sun's total and spectral irradiance for solar energy applications and solar radiation models, Sol. Energy, 76, 423–453, https://doi.org/10.1016/j.solener.2003.08.039, 2004.
Hansen, J. E. and Travis, L. D.: Light scattering in planetary atmospheres, Space Sci. Rev., 16, 527–610, 1974.
Hara, K., Osato, K., Yabuki, M., Osada, K., Hirasawa, N., Shiobara, M., and Yamanouchi, T.: Antarctic haze phenomena at Syowa Station, Antarctica: seasonal features and impacts on atmospheric chemistry, NPJ Clim. Atmos. Sci., 8, https://doi.org/10.1038/s41612-025-01176-9, 2025.
Hashimoto, M., Nakajima, T., Dubovik, O., Campanelli, M., Che, H., Khatri, P., Takamura, T., and Pandithurai, G.: Development of a new data-processing method for SKYNET sky radiometer observations, Atmos. Meas. Tech., 5, 2723–2737, https://doi.org/10.5194/amt-5-2723-2012, 2012.
Holben, B. N., Eck, T. F., Slutsker, I., Tanré, D., Buis, J. P., Setzer, A., Vermote, E., Reagan, J. A., Kaufman, Y. J., Nakajima, T., Lavenu, F., Jankowiak, I., and Smirnov, A.: AERONET – A Federated Instrument Network and Data Archive for Aerosol Characterization, Remote Sens. Environ., 66, 1–16, https://doi.org/10.1016/S0034-4257(98)00031-5, 1998.
IPCC: Climate Change 2021: The Physical Science Basis. Contribution of Working Group I to the Sixth Assessment Report of the Intergovernmental Panel on Climate Change, edited by: Masson-Delmotte, V., Zhai, P., Pirani, A., Connors, S. L., Péan, C., Berger, S., Caud, N., Chen, Y., Goldfarb, L., Gomis, M. I., Huang, M., Leitzell, K., Lonnoy, E., Matthews, J. B. R., Maycock, T. K., Waterfield, T., Yelekçi, O., Yu, R., and Zhou, B., Cambridge University Press, Cambridge, United Kingdom and New York, NY, USA, 2391 pp., https://doi.org/10.1017/9781009157896, 2023.
Irie, H., Hoque, H. M. S., Damiani, A., Okamoto, H., Fatmi, A. M., Khatri, P., Takamura, T., and Jarupongsakul, T.: Simultaneous observations by sky radiometer and MAX-DOAS for characterization of biomass burning plumes in central Thailand in January–April 2016, Atmos. Meas. Tech., 12, 599–606, https://doi.org/10.5194/amt-12-599-2019, 2019.
Kaufman, Y. J., Gobbi, G. P., and Koren, I.: Aerosol climatology using a tunable spectral variability cloud screening of AERONET data, Geophys. Res. Lett., 33, L07817, https://doi.org/10.1029/2005GL025478, 2006.
Khatri, P. and Takamura, T.: An algorithm to screen cloud-affected data for sky radiometer data analysis, J. Meteorol. Soc. JPN, 87, 189–204, https://doi.org/10.2151/jmsj.87.189, 2009.
Khatri, P., Takamura, T., Shimizu, A., and Sugimoto, N.: Spectral dependency of aerosol light-absorption over the East China sea region, Sci. Online Lett. Atmos., 6, 1–4, https://doi.org/10.2151/sola.2010-001, 2010.
Khatri, P., Takamura, T., Shimizu, A., and Sugimoto, N.: Observation of low single scattering albedo of aerosols in the downwind of the East Asian desert and urban areas during the inflow of dust aerosols, J. Geophys. Res., 119, 787–802, https://doi.org/10.1002/2013JD019961, 2014a.
Khatri, P., Takamura, T., Yamazaki, A., and Uchiyama, A.: Use of 315 nm channel data of the sky radiometer to estimate the columnar ozone concentration: A preliminary study, J. Meteorol. Soc. JPN, 92A, 185–194, https://doi.org/10.2151/jmsj.2014-A12, 2014b.
Khatri, P., Hayasaka, T., Iwabuchi, H., Takamura, T., Irie, H., and Nakajima, T. Y.: Validation of MODIS and AHI observed water cloud properties using surface radiation data, J. Meteorol. Soc. JPN, 96B, 151, https://doi.org/10.2151/jmsj.2018-036, 2018.
Khatri, P., Iwabuchi, H., Hayasaka, T., Irie, H., Takamura, T., Yamazaki, A., Damiani, A., Letu, H., and Kai, Q.: Retrieval of cloud properties from spectral zenith radiances observed by sky radiometers, Atmos. Meas. Tech., 12, 6037–6047, https://doi.org/10.5194/amt-12-6037-2019, 2019.
Khatri, P., Hayasaka, T., Irie, H., Letu, H., Nakajima, T. Y., Ishimoto, H., and Takamura, T.: Quality assessment of Second-generation Global Imager (SGLI)-observed cloud properties using SKYNET surface observation data, Atmos. Meas. Tech., 15, 1967–1982, https://doi.org/10.5194/amt-15-1967-2022, 2022.
Kudo, R., Diémoz, H., Estellés, V., Campanelli, M., Momoi, M., Marenco, F., Ryder, C. L., Ijima, O., Uchiyama, A., Nakashima, K., Yamazaki, A., Nagasawa, R., Ohkawara, N., and Ishida, H.: Optimal use of the Prede POM sky radiometer for aerosol, water vapor, and ozone retrievals, Atmos. Meas. Tech., 14, 3395–3426, https://doi.org/10.5194/amt-14-3395-2021, 2021.
Nakajima, T. and King, M. D.: Determination of the Optical Thickness and Effective Particle Radius of Clouds from Reflected Solar Radiation Measurements. Part I: Theory, J. Atmos. Sci., 47, 1878–1893, https://doi.org/10.1175/1520-0469(1990)047<1878:DOTOTA>2.0.CO;2, 1990.
Nakajima, T., Tonna, G., Rao, R., Boi, P., Kaufman, Y., and Holben, B.: Use of sky brightness measurements from ground for remote sensing of particulate polydispersions, Appl. Opt., 35, 2672–2686, https://doi.org/10.1364/AO.35.002672, 1996.
Nakajima, T., Campanelli, M., Che, H., Estellés, V., Irie, H., Kim, S.-W., Kim, J., Liu, D., Nishizawa, T., Pandithurai, G., Soni, V. K., Thana, B., Tugjsurn, N.-U., Aoki, K., Go, S., Hashimoto, M., Higurashi, A., Kazadzis, S., Khatri, P., Kouremeti, N., Kudo, R., Marenco, F., Momoi, M., Ningombam, S. S., Ryder, C. L., Uchiyama, A., and Yamazaki, A.: An overview of and issues with sky radiometer technology and SKYNET, Atmos. Meas. Tech., 13, 4195–4218, https://doi.org/10.5194/amt-13-4195-2020, 2020.
Ningombam, S. S., Larson, E. J. L., Indira, G., Madhavan, B. L., and Khatri, P.: Aerosol classification by application of machine learning spectral clustering algorithm, Atmos. Pollut. Res., 15, https://doi.org/10.1016/j.apr.2023.102026, 2024.
Pasquier, J. T., David, R. O., Freitas, G., Gierens, R., Gramlich, Y., Haslett, S., Li, G., Schäfer, B., Siegel, K., Wieder, J., Adachi, K., Belosi, F., Carlsen, T., Decesari, S., Ebell, K., Gilardoni, S., Gysel-Beer, M., Henneberger, J., Inoue, J., Kanji, Z. A., Koike, M., Kondo, Y., Krejci, R., Lohmann, U., Maturilli, M., Mazzolla, M., Modini, R., Mohr, C., Motos, G., Nenes, A., Nicosia, A., Ohata, S., Paglione, M., Park, S., Pileci, R. E., Ramelli, F., Rinaldi, M., Ritter, C., Sato, K., Storelvmo, T., Tobo, Y., Traversi, R., Viola, A., and Zieger, P.: The Ny-Ålesund Aerosol Cloud Experiment (NASCENT) Overview and First Results, Bull. Am. Meteorol. Soc., 103, E2533–E2558, https://doi.org/10.1175/BAMS-D-21-0034.1, 2022.
Platnick, S., Ackerman, S. A., King, M. D., Meyer, W. P., Menzel, R. E., Holz, B. A., and Yang, P.: MODIS Atmosphere L2 Cloud Product (06_L2), NASA MODIS Adaptive Processing System, Goddard Space Flight Center, USA, NASA LAADS DAAC [data set], https://doi.org/10.5067/MODIS/MOD06_L2.061, 2015a.
Platnick, S., Ackerman, S. A., King, M. D., Meyer, W. P., Menzel, R. E., Holz, B. A., and Yang, P.: MODIS Atmosphere L2 Cloud Product (06_L2), NASA MODIS Adaptive Processing System, Goddard Space Flight Center, USA, NASA LAADS DAAC [data set], https://doi.org/10.5067/MODIS/MOD06_L2.061, 2015b.
Platnick, S., Meyer, K., King, M. D., Wind, G., Amarasinge, N., Marchant, B., Arnold, G. T., Zhibo, Z., Hubanks, P. A., Holz, R. E., Yang, P., Ridgway, W. L., and Riedi, J.: The MODIS cloud optical and microphysical products: Collection 6 updates and examples from terra and aqua, IEEE T. Geosci. Remote Sens., 55, 502–525, https://doi.org/10.1109/TGRS.2016.2610522, 2017.
Ricchiazzi, P., Yang, S., Gautier, C., and Sowle, D.: SBDART: A Research and Teaching Software Tool for Plane-Parallel Radiative Transfer in the Earth's Atmosphere, B. Am. Meteorol. Soc., 79, 2101–2114, https://doi.org/10.1175/1520-0477(1998)079<2101:SARATS>2.0.CO;2, 1998.
Shiobara, M., Hayasaka, T., Nakajima, T., and Tanaka, M.: Aerosol Monitoring Using a Scanning Spectral Radiometer in Sendai, Japan, J. Meteorol. Soc. Jpn.- Ser. II, 69, 57–70, https://doi.org/10.2151/jmsj1965.69.1_57, 1991.
Smirnov, A., Holben, B. N., Eck, T. F., Dubovik, O., and Slutsker, I.: Cloud-screening and quality control algorithms for the AERONET database, Remote Sens. Environ., 73, 337–349, https://doi.org/10.1016/S0034-4257(00)00109-7, 2000.
Song, H. J., Sohn, B. J., Chun, H. W., Chun, Y., and Lee, S. S.: Improved cloud screening method for the analysis of sky radiometer measurements and application to asian dust detection, J. Meteorol. Soc. JPA, 92A, 167–183, https://doi.org/10.2151/jmsj.2014-A11, 2014.
Uchiyama, A., Matsunaga, T., and Yamazaki, A.: The instrument constant of sky radiometers (POM-02) – Part 1: Calibration constant, Atmos. Meas. Tech., 11, 5363–5388, https://doi.org/10.5194/amt-11-5363-2018, 2018.
Wang, Z., Liu, D., Wang, Z., Wang, Y., Khatri, P., Zhou, J., Takamura, T., and Shi, G.: Seasonal characteristics of aerosol optical properties at the SKYNET Hefei site (31.90° N, 117.17° E) from 2007 to 2013, J. Geophys. Res.-Atmos., 119, 6128–6139, https://doi.org/10.1002/2014jd021500, 2014.
Xue, Z., Kuze, H., and Irie, H.: Retrieval of aerosol optical thickness with custom aerosol model using SKYNET data over the Chiba area, Atmosphere (Basel), 12, https://doi.org/10.3390/atmos12091144, 2021.