
the Creative Commons Attribution 4.0 License.
the Creative Commons Attribution 4.0 License.
 | 22 Oct 2026
First year of Meteosat Third Generation Lightning Imager observations
Sven-Erik Enno

Bartolomeo Viticchié
David Navia
Jochen Grandell
The Meteosat Third Generation Lightning Imager (MTG-LI) is the first European space-based geostationary mission devoted to the monitoring and characterization of lightning activity over hemispheric scales. The present paper provides the first comprehensive summary of MTG-LI data during its first year of continuous observations. From July 2024 to June 2025, the instrument detected a total of 595 × 106 flashes within its field-of-view, encompassing Europe, Africa, and part of the Atlantic Ocean, South America, middle East and Indian Ocean. The highest observed lightning flash density of 189 flashes km−2 yr−1 was found in the east of The Democratic Republic of the Congo. The MTG-LI is capable of capturing both global and local lightning features. In addition, the instrument's high sensitivity to intra-cloud lightning activity translates into flash density values notably higher than ground-based lightning statistics. These results demonstrate that the MTG-LI is an excellent instrument for the continuous monitoring of total lightning activity across its entire field of view on both operational and climatological scales.
- Article
(12009 KB) - Full-text XML
- BibTeX
- EndNote


Lightning activity is a key feature of convective storms and often a precursor for other severe weather phenomenon. Near real-time lightning data provides an important basis for severe weather monitoring and warnings. Lightning is also listed as a Global Climate Observing System Essential Climate Variable (Aich et al., 2018). The most comprehensive long-term global lightning datasets can be built by combining data from ground-based and space-borne lightning location systems (LLSs). Ground-based LLSs date back to 1980s (e.g., Reap and MacGorman, 1989) and have gained an increasingly central role in meteorology and research in the last thirty years. Large-scale lightning observations are provided by continental and global LLSs. Continental ground-based LLSs worth mentioning are the National Lightning Detection Network (NLDN; Said et al., 2013) over continental United States, the European Cooperation for Lightning Detection (EUCLID; Schulz et al., 2016) and the United Kingdom Met Office Lightning Electromagnetic Emission Location by Arrival time difference (Leela; Marlton et al., 2024) over continental Europe. Global ground-based LLSs are the Global Lightning Detection network (GLD360; Said and Murphy, 2016), the World Wide Lightning Location Network (WWLLN; Lay et al., 2004) and the Earth Networks Total Lightning Network (ENTLN; Heckman, 2014). Global systems miss most of the intra-cloud lightning (IC) and also some weaker cloud-to-ground (CG) lightning (e.g., Enno et al., 2016). Continental systems are more sensitive, e.g., NLDN is capable of detecting more than 50 % of IC lightning in some storms in its core region (Murphy et al., 2014; Murphy and Nag, 2015). However, their sensitivity drops rapidly outside the coverage of the network. In addition, both continental and global ground-based LLSs suffer from spatial variations in sensitivity due to lack of sensors in remote areas and over the oceans.
Space-based geostationary lightning sensors are a valid alternative to ground-based LLSs for monitoring total lightning activity, i.e., the combination of IC and CG lightning, globally. They offer consistent, uniform, and continuous coverage over hemispheric scales (encompassing land, oceans and remote regions) with high detection efficiency during both day and night (e.g., Virts and Koshak, 2025; Viticchié et al., 2026). Such instruments detect lightning by imaging photons which reach cloud-tops after being emitted by lightning discharges and scattered through clouds. Early attempts of optical lightning detection from space were reported by Vorpahl et al. (1970) and Sparrow and Ney (1971). The first missions devoted to lightning monitoring from space were The Optical Transient Detector (OTD; Boccippio et al., 2002) and the Tropical Rainfall Measurement Mission Lightning Imaging Sensor (TRMM-LIS; Boccippio et al., 2000; Cecil et al., 2005, 2026). These two instruments enabled the monitoring of lightning from space, but with considerable limitations due to the limited viewing time stemming from their low-Earth orbits. Geostationary LLSs were developed for continuous monitoring of lightning over large (hemispheric) areas. The first Geostationary Lightning Mapper (GLM) was launched in November 2016, aboard the first of the GOES-R series of Geostationary Operational Environmental Satellites (now GOES-16; e.g., Goodman et al., 2013; Rudlosky et al., 2019; Rudlosky and Virts, 2021; Virts and Koshak, 2025). Currently, four different GOES-GLM instruments are flying aboard GOES-16, 17, 18 and 19 satellites, respectively. These enable the monitoring of total lightning activity from New Zealand to the western coast of Africa. In December 2016, the Chinese Lightning Mapping Imager was launched aboard the Fengyun-4A satellite (FY-4A-LMI; e.g., Xian et al., 2021; Chen et al., 2021). FY-4A-LMI's field-of-view (hereafter FOV) encompasses China, southern Indian Ocean and the Western part of Australia, i.e., it ofers fairly limited geographical coverage. In December 2025, a second LMI instrument has been launched aboard the Fengyun-4C (FY-4C-LMI). FY-4C-LMI delivers hemispheric coverage.
The Meteosat Third Generation Lightning Imager (MTG-LI) is the first space-borne geostationary LLSs ever developed and operated in Europe. The instrument is part of the Meteosat Third Generation Programme and is aboard the Imaging satellite MTG-I (Holmlund et al., 2021, 2025). The first MTG-LI was launched on 13 December 2022, and continuously monitors total lightning activity over hemispheric scales: Europe, Africa, and part of the Atlantic Ocean, South America, middle East and Indian Ocean (see Fig. 1). Since 31 October 2024 (pre-operationally since July 2024), MTG-LI has been delivering near real-time lightning data products which enable monitoring and characterization of total lightning activity within its FOV from global scale down to individual storms and flashes (e.g., Füllekrug et al., 2025). The MTG-LI Programme will be operated for about 20 years, with one MTG-LI operational instrument and at least one back-up in orbit. Table 1 provides the reader with key design and performance figures of both MTG-LI and GOES-GLM (for direct comparison). Both systems shall be regarded to be evolutions of OTD and LIS.
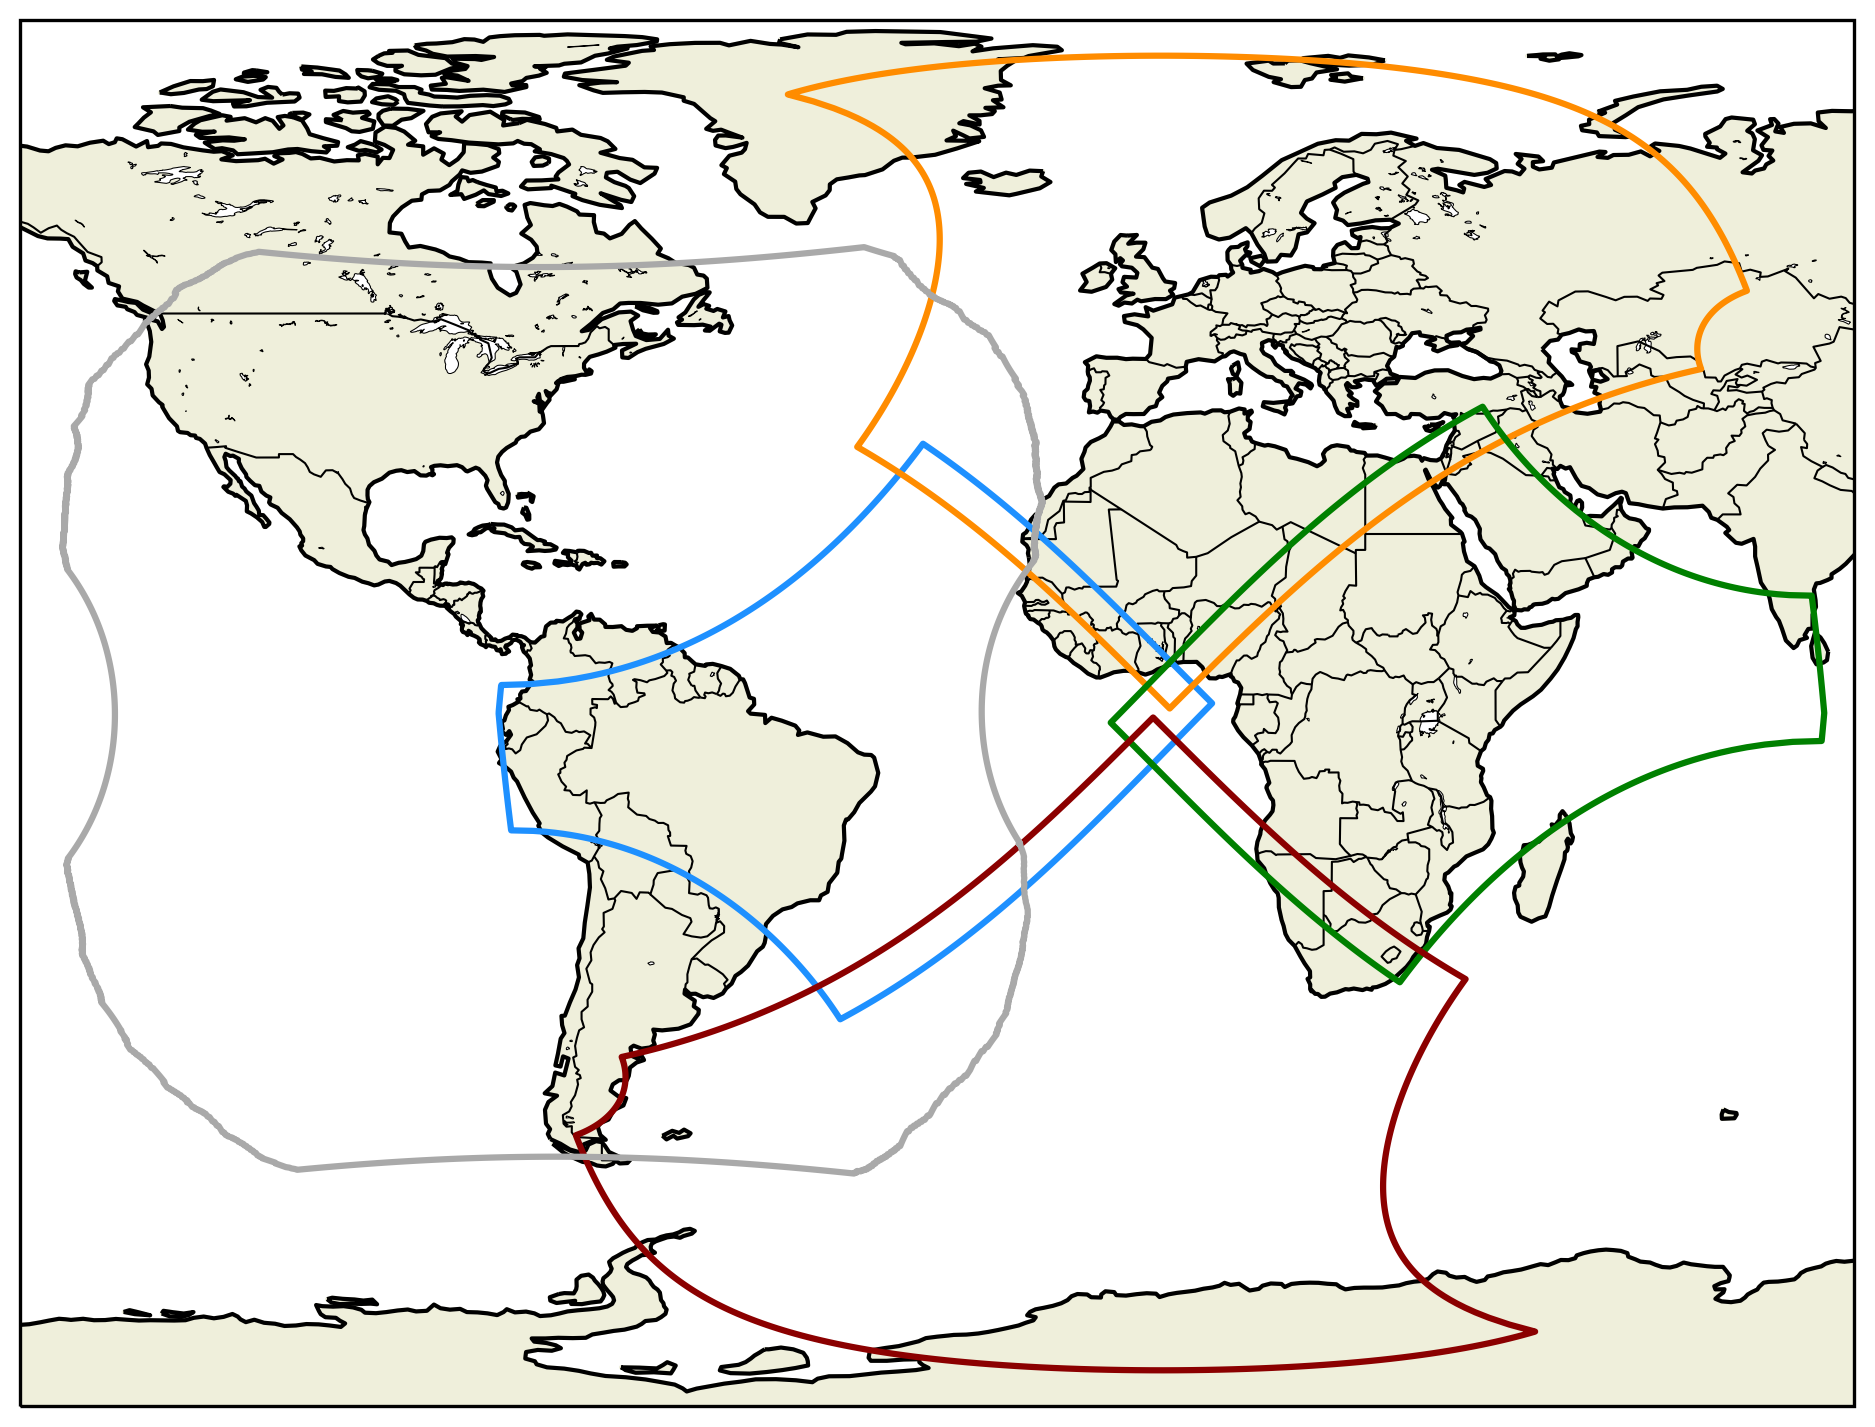
Figure 1Field of view of GLM on GOES-East (GOES-16 and GOES-19) (gray), and of the four Sectors covered by MTG-LI cameras without considering the parallax correction effects described in the text (West in blue, North in orange, East in green, and South in red, respectively).
Table 1Key system design and performance figures of MTG-LI and GOES-GLM.
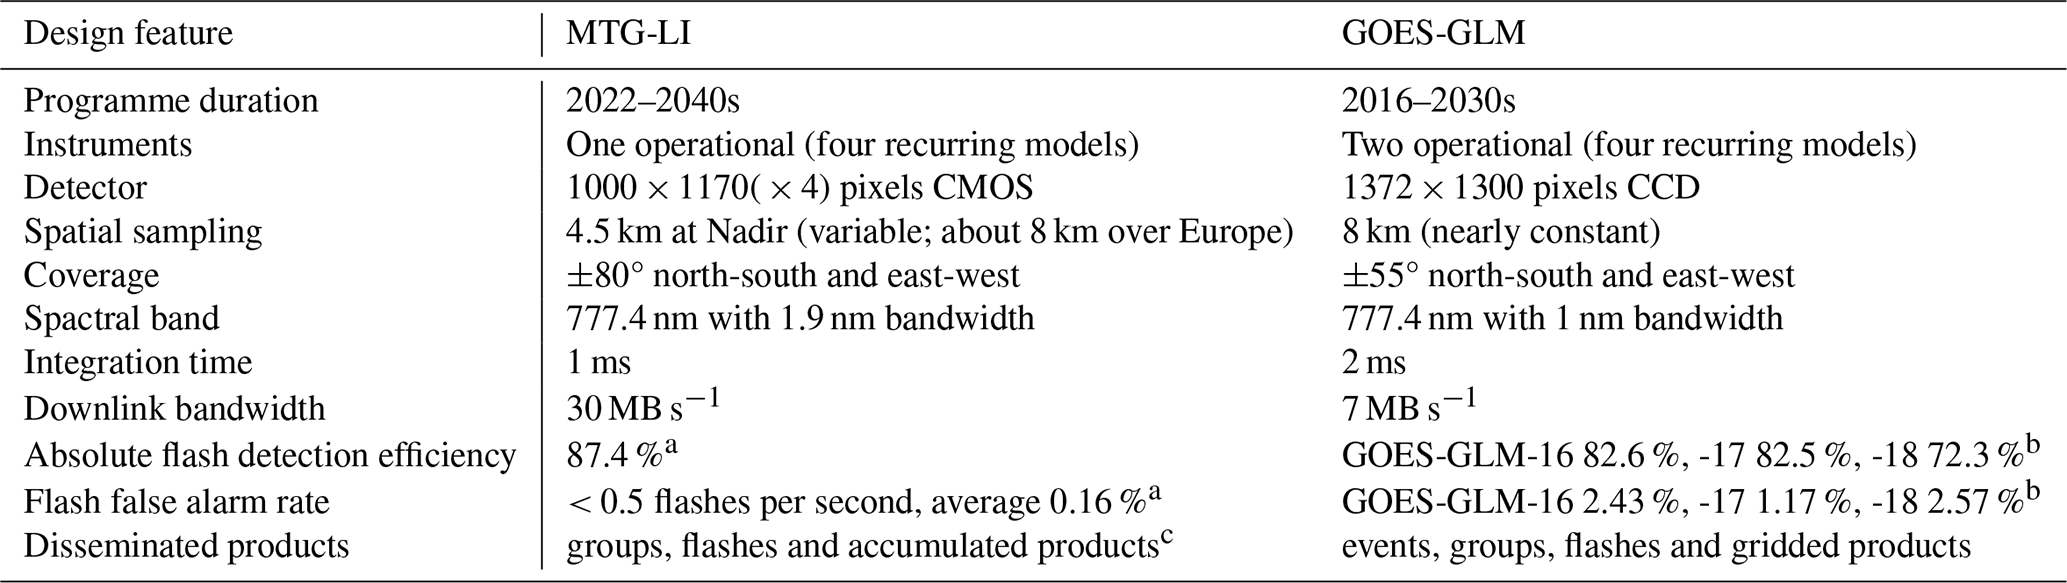
a See Viticchié et al. (2026). b See Virts and Koshak (2025). c See https://user.eumetsat.int/resources/user-guides/mtg-li-level-2-data-guide (last access: 16 October 2026).
The MTG-LI System has been introduced in detail in Viticchié et al. (2026), together with key information regarding data processing approach and performances. In the context of this paper, the following performance figures are worth highlighting: (i) average absolute flash detection efficiency of 87.4 % with values larger than 90 % over the entire continent of Africa and large part of Europe (derived using the Global Lightning Detection network GLD360 (Said and Murphy, 2016) and applying a two-system Bayesian detection efficiency approach described by Bitzer et al. (2016)) and (ii) flash false alarm rate below 0.5 flashes s−1 and average fraction of false flashes of 0.16 % of the total observed.
The present paper presents some of the key properties/features of MTG-LI observations from July 2024 to June 2025, i.e., the first year of operations. Results illustrate how MTG-LI enables monitoring spatial, seasonal and diurnal patters of lightning over hemispheric, regional/national and local scale.
2.1 Data
MTG-LI data consists of point data and accumulated data. The point data products are lightning groups (LGR) and lightning flashes (LFL), containing the times, latitudes, longitudes and properties of every lightning group and flash that was classified as true lighting by the MTG-LI processing chain (Viticchié et al., 2026). Point products can be conveniently analyzed over different spatial and temporal scales from near-real-time monitoring of local storms to long-term hemispheric-scale lightning statistics. The three accumulated data products, Accumulated Flashes (AF), Accumulated Flash Area (AFA) and Accumulated Flash Radiance (AFR) are all built by integrating MTG-LI information over 30 s and provide users with flash-related information/properties as well as a description of the spatial extension of the optical emission detected by MTG-LI. A comprehensive user guide of all the MTG-LI products is available at https://user.eumetsat.int/resources/user-guides/mtg-li-level-2-data-guide (last access: 16 October 2026).
In the present paper, the MTG-LI flash product was analyzed during the first year of continuous observations from 1 July 2024 to 30 June 2025, i.e., the study period. With 1–3.5 × 10⁶ flash observations per day, the flash product efficiently captures the data needed for monitoring lightning activity across multiple spatial and temporal scales. Furthermore, using flashes allows one to compare MTG-LI results against many earlier studies on GOES-GLM and ground-based LLSs (e.g., Cecil et al., 2014; Albrecht et al., 2016; Soula et al., 2016; Enno et al., 2020; Cecil et al., 2026).
A few gaps were present in the otherwise continuous MTG-LI dataset. These were normally short (a few minutes to a couple of hours) and caused by satellite maneuvers, upgrades of the processing software and challenging observing conditions (e.g., direct sunlight at midnight around spring and autumn equinoxes). Only two long MTG-LI outages took place during the study period: 28–30 September and 16–22 November 2024. Their overall impact on the results presented here is expected to be very small and balanced by an otherwise very good data availability of 99 %.
2.2 Method
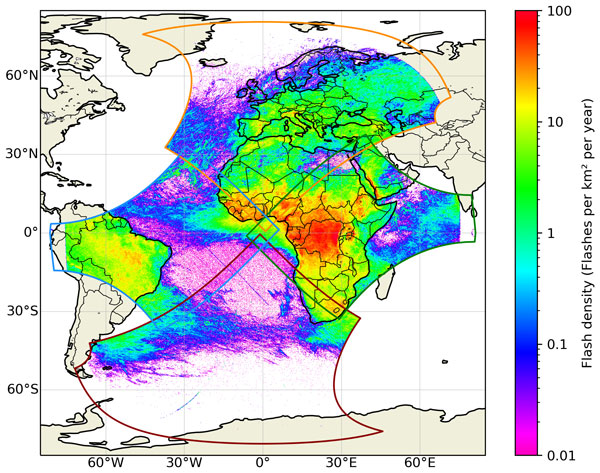
MTG-LI flash locations were first corrected for the parallax effect, and the flash times were corrected for the light travel time between cloud-tops and the instrument. The correction was applied by means of the EUMETSAT correction tool. This is publicly available at the link to the MTG-LI user guide available in Sect. 1. The tool derives the cloud-top-height (CTH) for a given flash location and time by interpolating between monthly CTH look-up tables derived from monthly mean MSG-SEVIRI (Spinning Enhanced Visible and Infrared Imager) ice-cloud top heights over the 13-year-long period (i.e., 2005–2018) on a 0.125° × 0.125° spatial grid (Bozzo et al., 2024). It should be noted that although MTG-LI can theoretically observe up to ≈ 80° from the sub-satellite point, accurate parallax correction is currently available only up to 75° from the sub-satellite point. As a result, MTG-LI useful field of view appears slightly smaller than the theoretical field of view of the four cameras (Fig. 2). The limitation impacts those geographical areas where MTG-LI observes all the way to the edge of the visible disk, i.e., Arctic Ocean, parts of Russia, western part of South America and parts of the Indian Ocean.
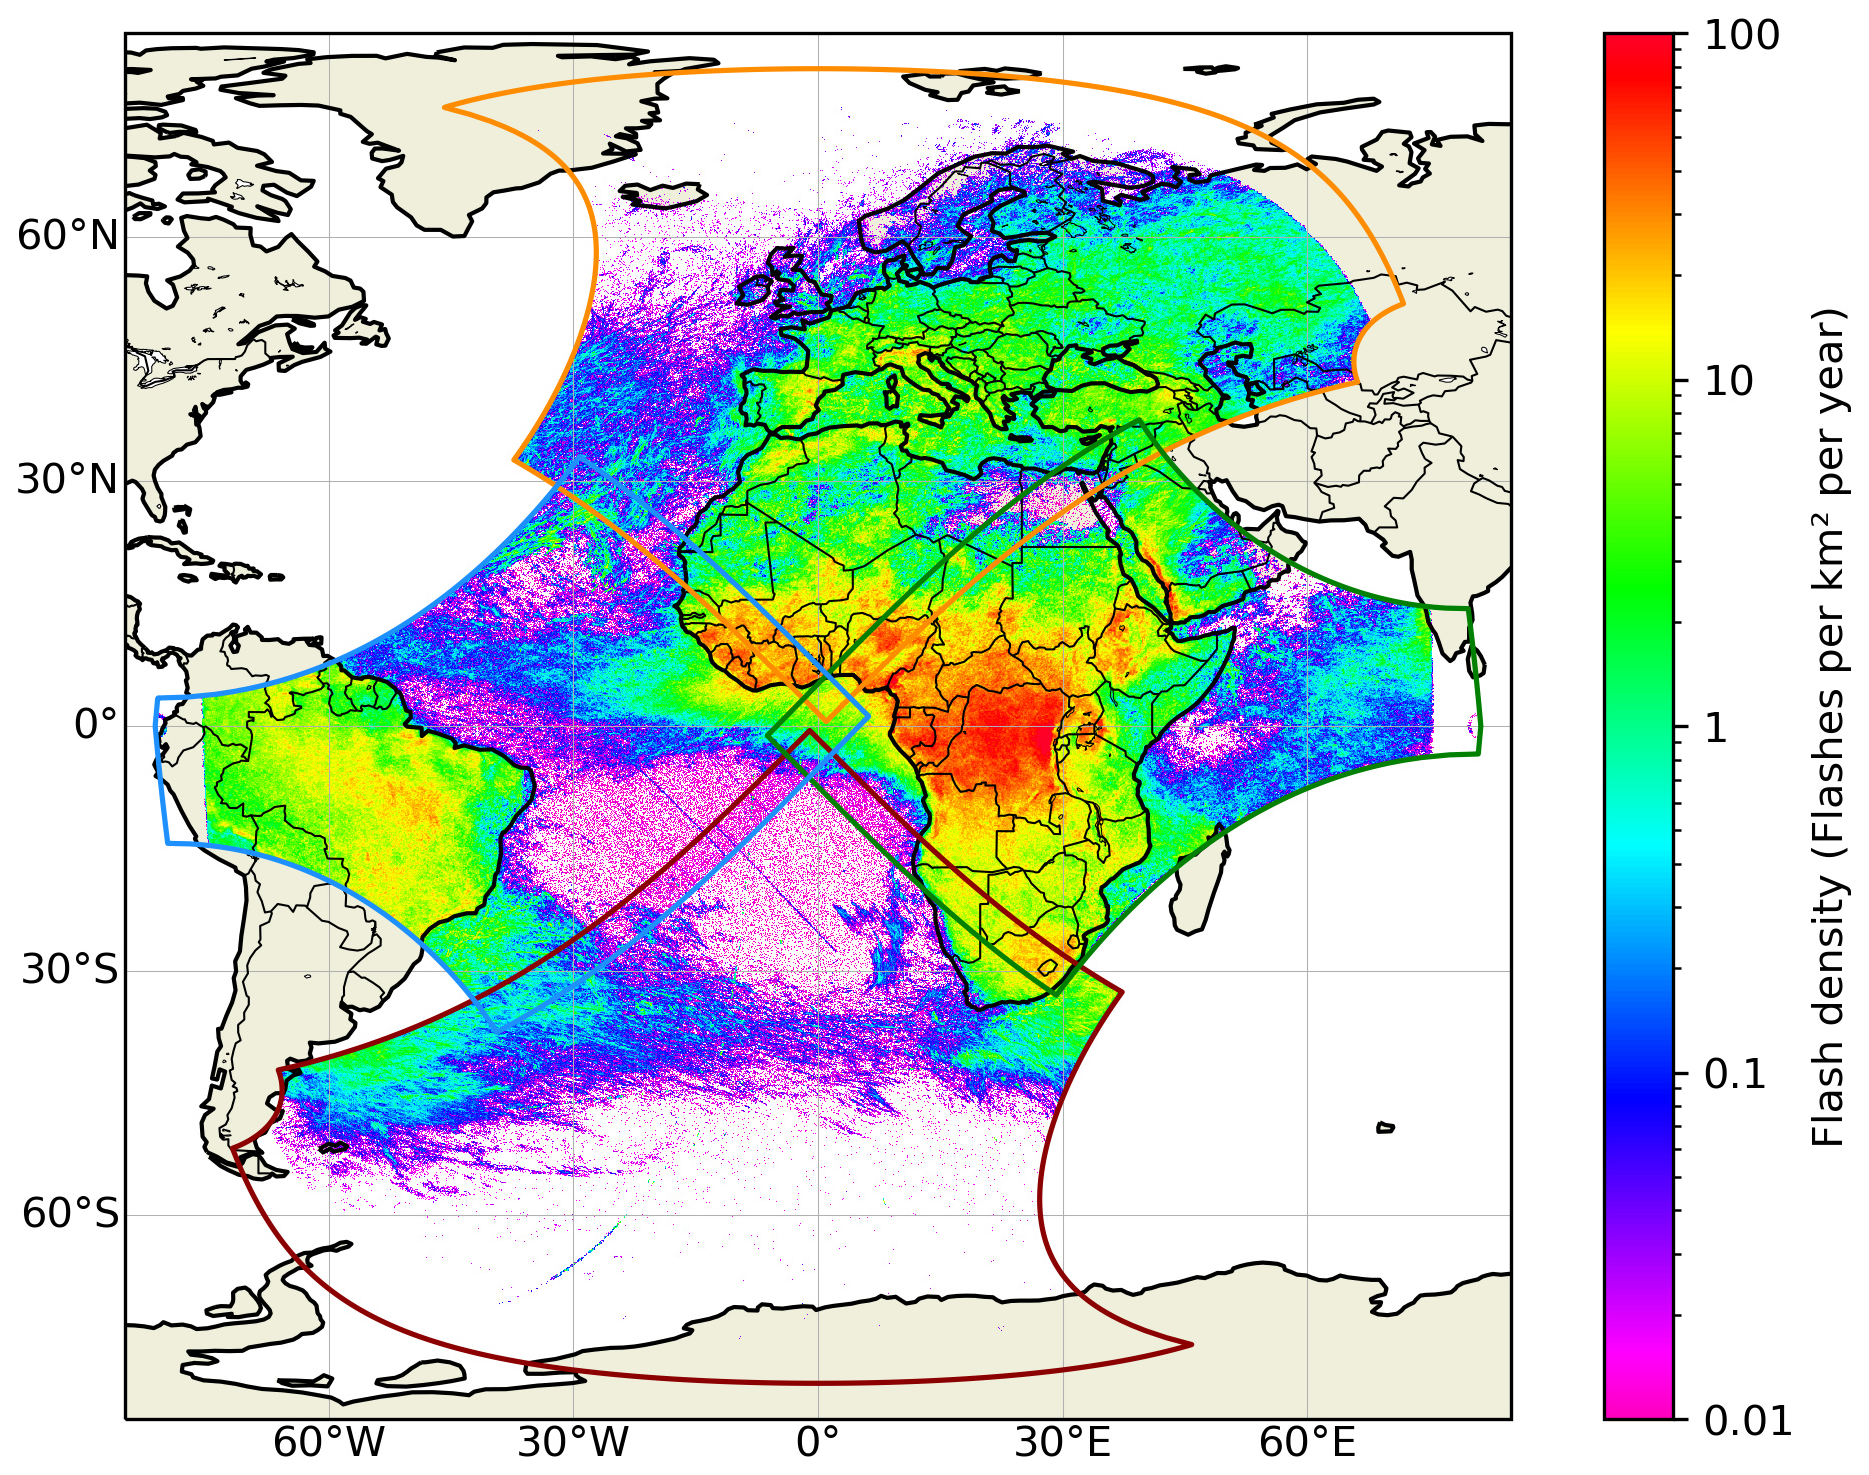
Figure 2Spatial distribution of MTG-LI flash density (flashes km−2 yr−1) over the full MTG-LI FOV from July 2024 to June 2025 on a 0.1° × 0.1° spatial grid.
The spatial distribution of lightning activity is presented through lightning flash density maps in flashes per square kilometer per year: flashes km−2 yr−1. Maps were derived by accumulating MTG-LI flashes over 0.1° × 0.1° spatial grid and dividing the result by the area of each grid cell and the observation time. This approach allows one to directly compare MTG-LI maps with earlier OTD/LIS' (e.g., Albrecht et al., 2016; Cecil et al., 2026) and GOES-GLM's (e.g., Rudlosky et al., 2019; Rudlosky and Virts, 2021) studies.
Seasonal and diurnal distributions of lightning are visualized through maps of month and hour of maximum lightning activity, respectively. For these two, a threshold of at least one hundred flashes per grid cell during the study period was applied to exclude cells with too little data. Both maps were computed using a coarser spatial grid of 0.5° × 0.5° in order to increase the number of usable grid cells that meet the one hundred flash threshold. In addition, six interesting areas were selected, for which monthly or hourly flash histograms were derived. All hourly lightning distribution maps and histograms are presented in local time (LT). This accounts for the fact that the local solar noon differs by approximately 11 h between the east-most and west-most edge of the MTG-LI field of view (Fig. 1). Thus, employing UTC times would have introduced considerable bias. The UTC to LT conversion was done using longitude-based time zones defined as 15° longitude bands, centered every 15°, e.g., at 15° W, 0° E and 15° E.
Finally, it is important to note that no attempt was made to remove MTG-LI false alarms. The number of false flashes in MTG-LI products is known to be extremely small (Viticchié et al., 2026). Therefore, we preferred presenting data as available in the end-user flash product (LI-2-LFL), so that the very small fraction of false alarms and their minimal impact on the long-term lightning statistics can be demonstrated.
3.1 General climatology of MTG-LI flashes
During its first year of continuous observations, MTG-LI detected 595 × 106 flashes over its full FOV (Fig. 2). The highest annual lightning flash density of 189 flashes km−2 yr−1 was found in the eastern part of The Democratic Republic of the Congo, just to the west of the Rwenzori Mountain range at 1.15° S and 28.35° E. This was surrounded by a larger very active lightning area situated in 0–3.5° S and 27–29° E where most of the grid cells had 100–125 flashes km−2 yr−1, while a total of thirty six cells exceeded 150 flashes km−2 yr−1. The whole region stood well above the typical flash density of 40–70 flashes km−2 yr−1 over the rest of the Congo Basin. Western and northern parts of Africa up to ≈ 15° N experienced 10–40 flashes km−2 yr−1 while southern parts of Africa were mostly characterized by of 5–20 flashes km−2 yr−1.
A narrow region of very high lightning incidence was observed along the Red Sea coast of the Arabian Peninsula, covering the western foothills of the Hijaz Mountains. A localized maximum of 97 flashes km−2 yr−1 was observed at 15.95° N and 43.25° E, while most of the region experienced 20–50 flashes km−2 yr−1 (only thirty two grid cells exceeded 65 flashes km−2 yr−1). The part of South America within the MTG-LI FOV was generally characterized by 5–20 flashes km−2 yr−1. A localized maximum of 40 flashes km−2 yr−1 was observed near the western border of the State of Tocantins in Brazil at 11.85° S and 46.75° W (twenty nine grid cells exceeded 30 flashes km−2 yr−1).
Europe experienced considerably lower overall lightning activity (Fig. 3). The continental hot-spot in the northeast of Italy had 44 flashes km−2 yr−1. The area is located on the southern slopes of the Alps, approximately 50 km to the north of Venice, centered at 45.85° N and 12.25° E. A few local maxima exceeding 30 flashes km−2 yr−1 were also found in the eastern part of Spain. Besides these outliers, MTG-LI flash density generally varied within 15–25 flashes km−2 yr−1 in all European lightning hot-spots, including the southern slopes of the Alps and the Pyrenees, as well as parts of eastern Spain. The eastern part of Iberian Peninsula, most of Italy, the eastern coast of the Adriatic Sea as well as parts of France and southern Germany experienced 5–10 flashes km−2 yr−1. The rest of central and southern Europe had 1–5 flashes km−2 yr−1 while Scandinavia and the British Isles generally had less than 0.5 flashes km−2 yr−1 and in more oceanic regions (e.g., Norway, Scotland and Ireland) even less than 0.1 flashes km−2 yr−1.
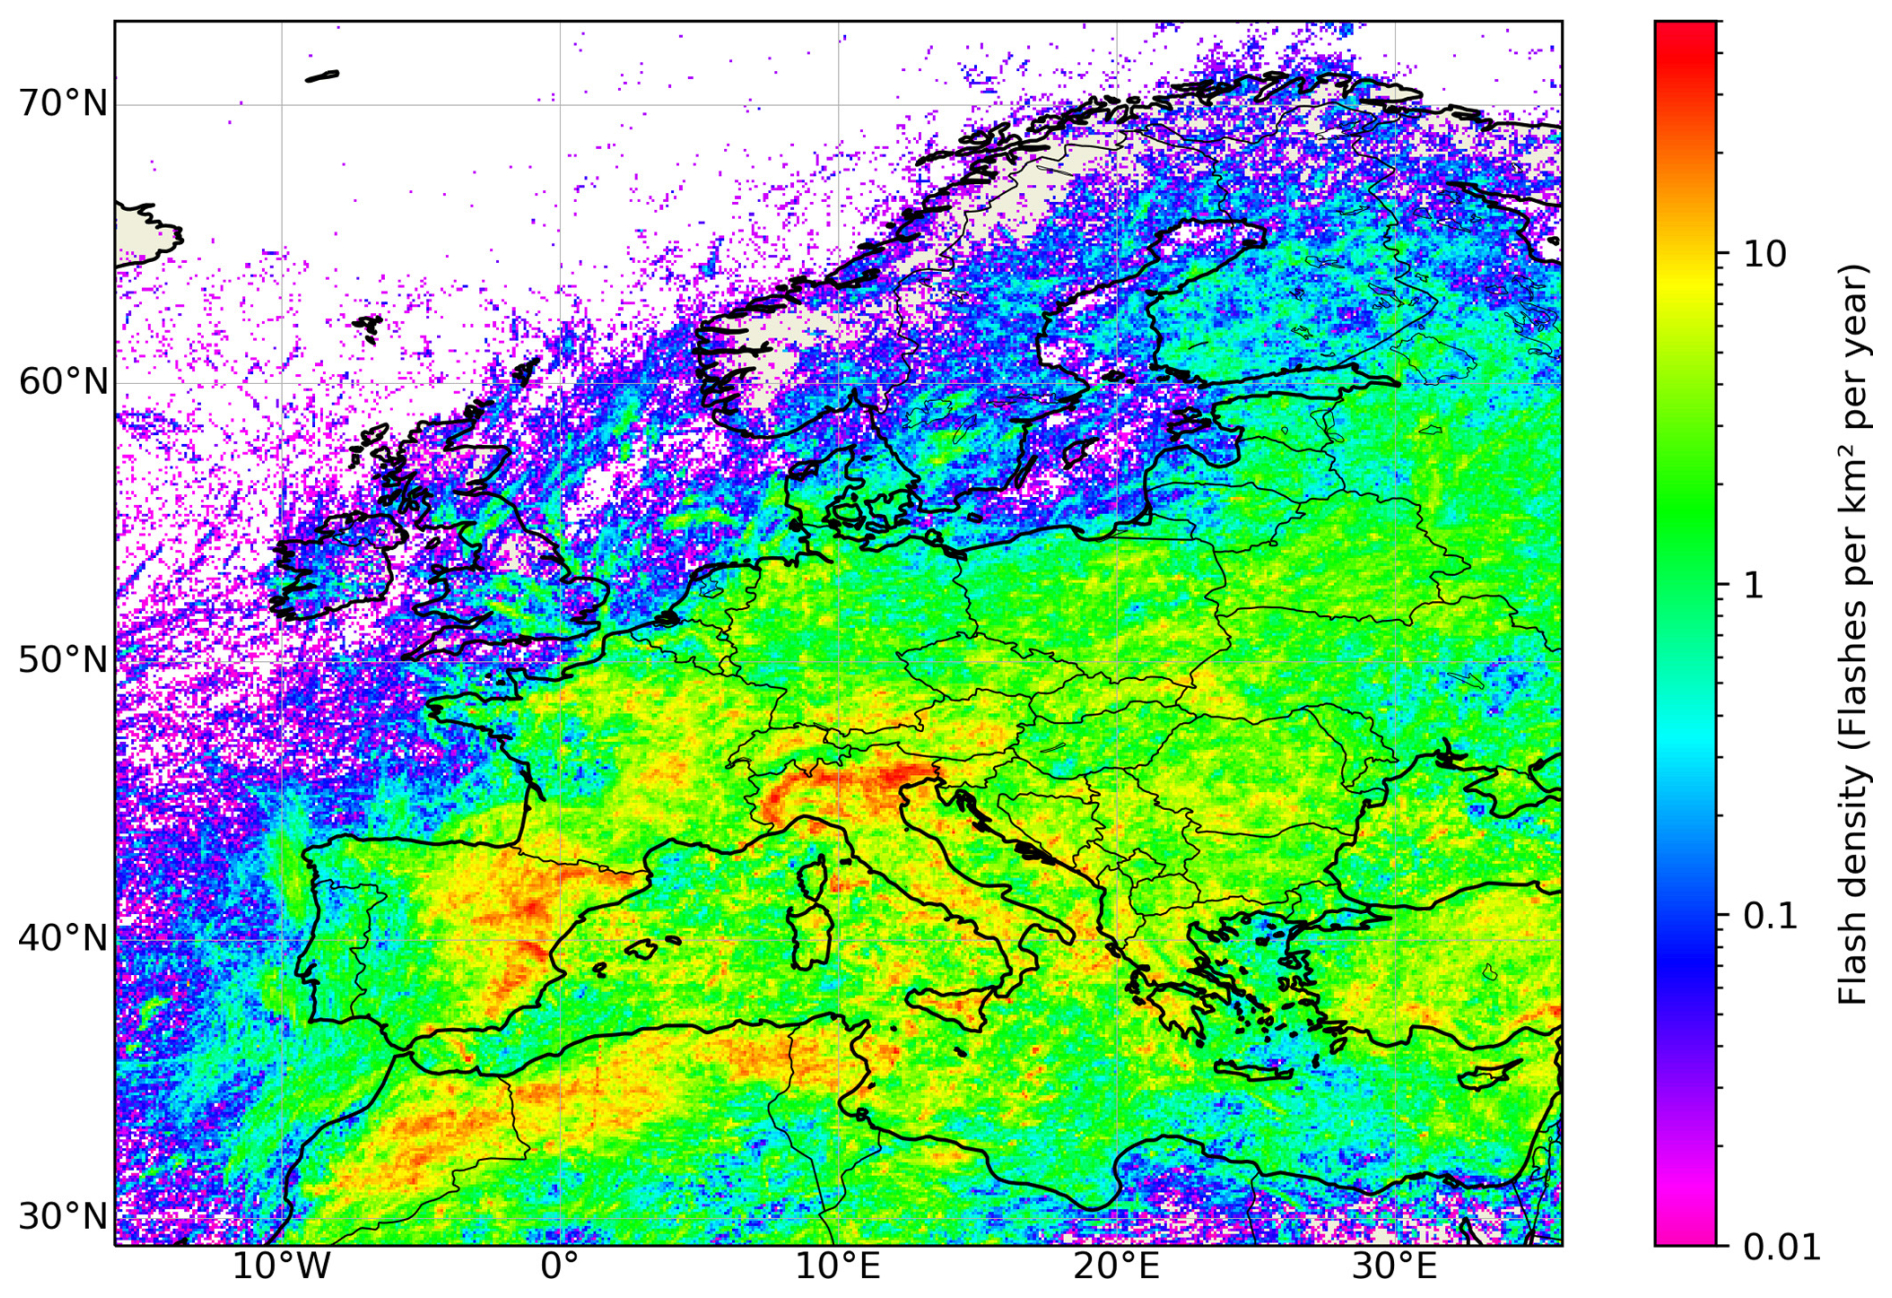
Figure 3Spatial distribution of MTG-LI flash density (flashes km−2 yr−1) over Europe from July 2024 to June 2025 on a 0.1° × 0.1° spatial grid. Note, the scaling of the colour palette is different from Fig. 2.
Very low lightning activity with typically less than 0.5 flashes km−2 yr−1 and in many regions less than 0.1 flashes km−2 yr−1 was observed over the oceans (Figs. 2 and 3). Higher activity regions with 1–5 flashes km−2 yr−1 were found in the South Atlantic Ocean to the east of South America and in the western part of the Indian Ocean just to the east of southern Africa. The highest incidence of oceanic lightning occurred in the central Atlantic Ocean near Africa. MTG-LI flash density values of 5–10 flashes km−2 yr−1 were widely observed between the equator and the southern coast of West Africa. Smaller areas in the Gulf of Guinea exceeded 20 flashes km−2 yr−1 and locally even 30 flashes km−2 yr−1, making it by far the most active lightning region over the seas and oceans.
The effect of MTG-LI false flashes is noticeable over the tropical South Atlantic Ocean where no lightning occurred (Fig. 2). It had two main components: a “halo” of scattered grid cells at the lowest end of the flash density scale and a few northwest to southeast oriented bar-like features with slightly higher flash density. An isolated curved feature of false flashes was located around 30° W between 60 and 75° S.
The month of maximum lightning activity (Fig. 4) had significant spatial variability, and all months were represented somewhere in the MTG-LI FOV. Northern hemisphere summer maximum was observed over continental Europe and most of northern Africa. Southern hemisphere summer maximum prevailed in southern Africa and South America. Monthly distribution of MTG-LI flashes showed very little or no lighting activity in all these areas during the local winter (Fig. 5). Equatorial Africa had two lightning maxima, one in spring and the other in autumn. The relative strength of the two varied locally, e.g., the Congo Basin had the strongest activity during March and April.
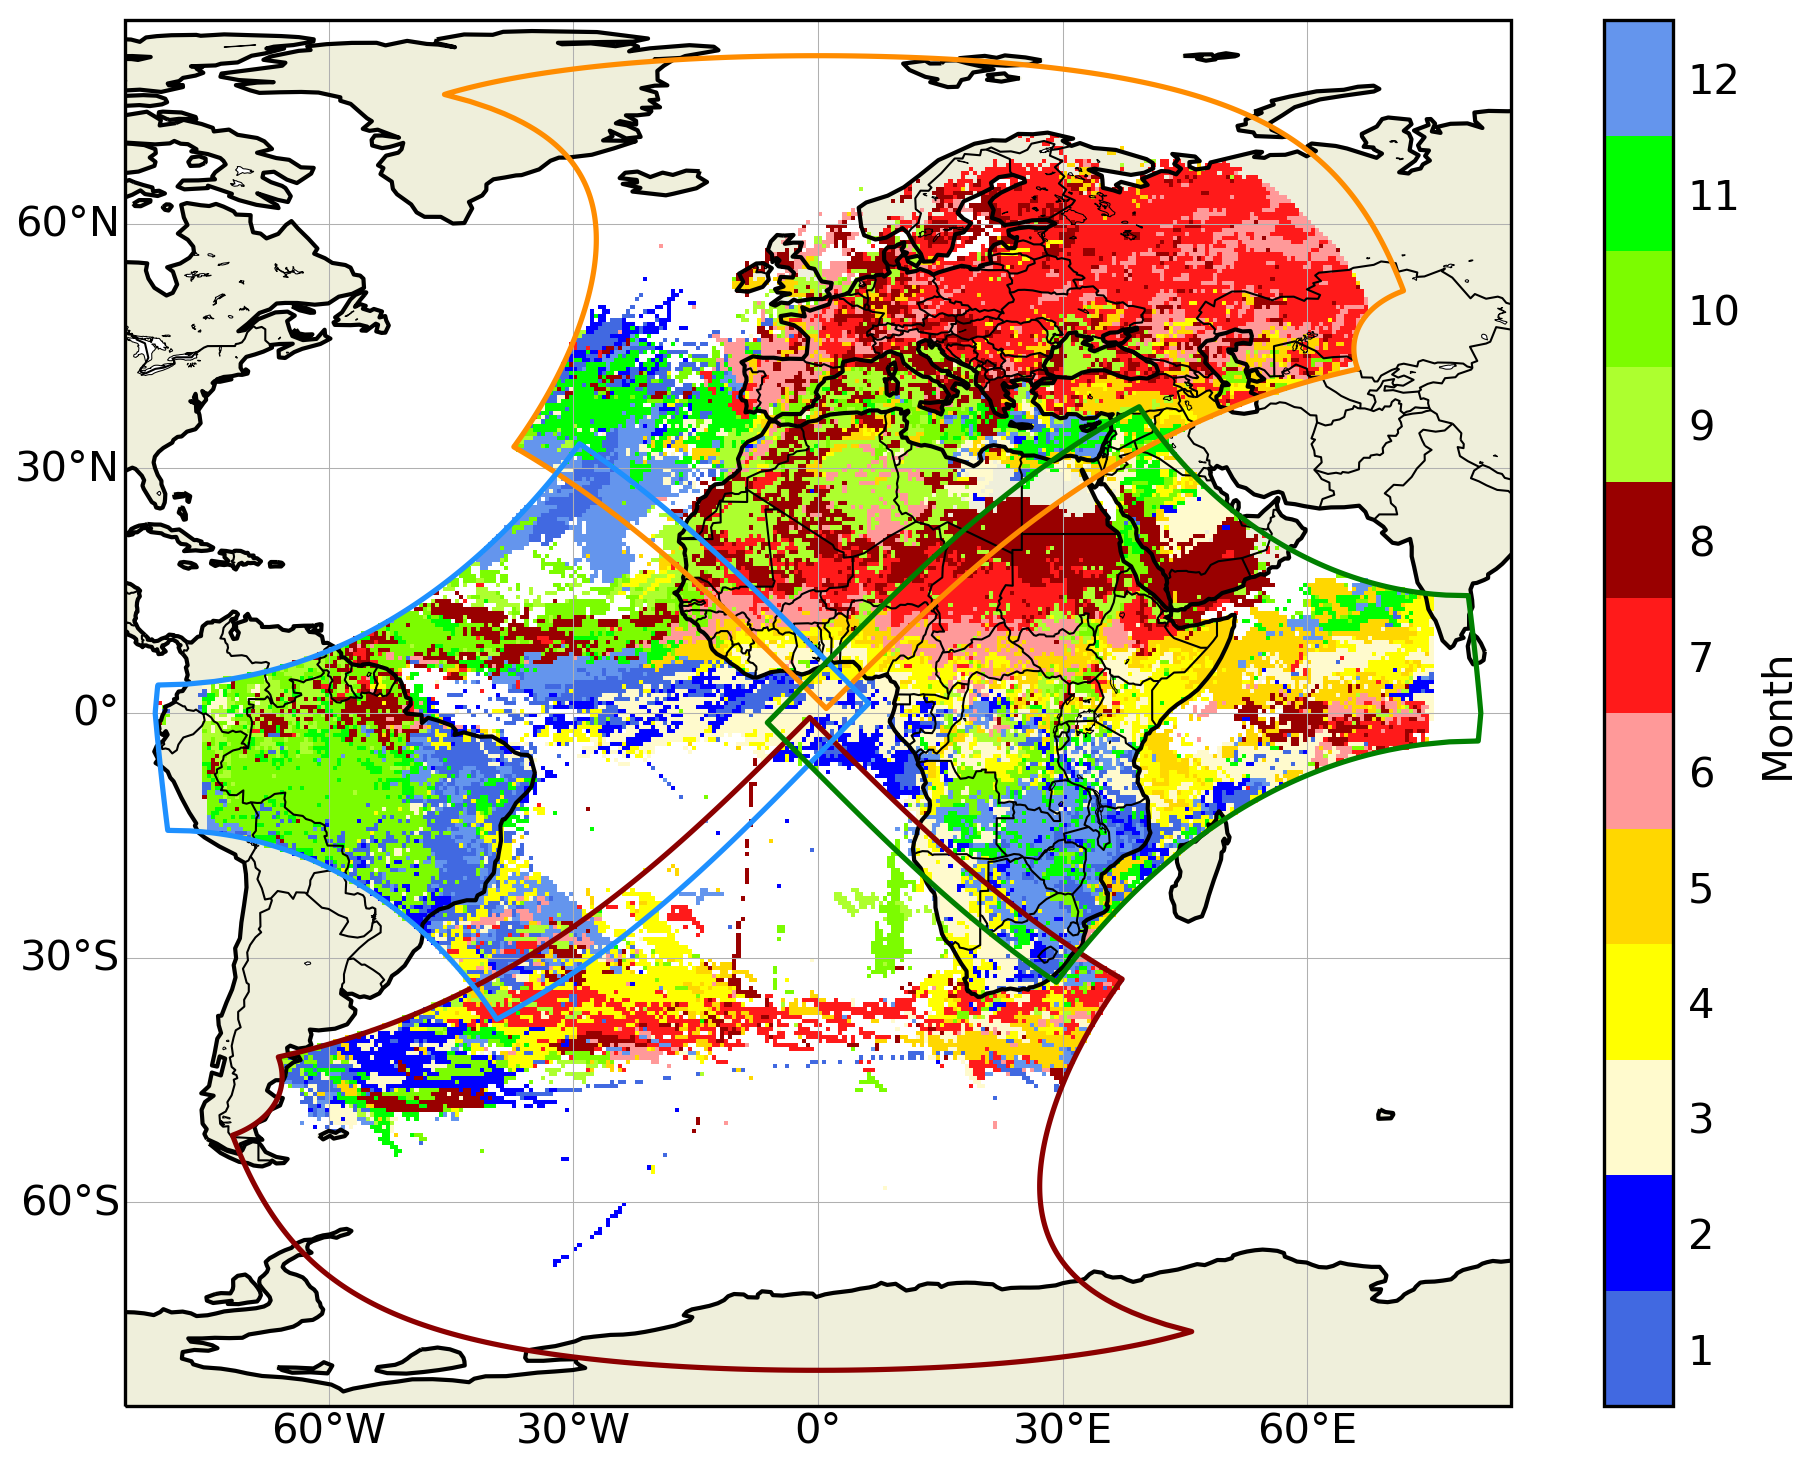
Figure 4Peak month of lightning activity based on monthly MTG-LI flash counts from July 2024 to June 2025 on a 0.5° × 0.5° spatial grid. Only grid cells with a total of at least one hundred MTG-LI flashes are shown.
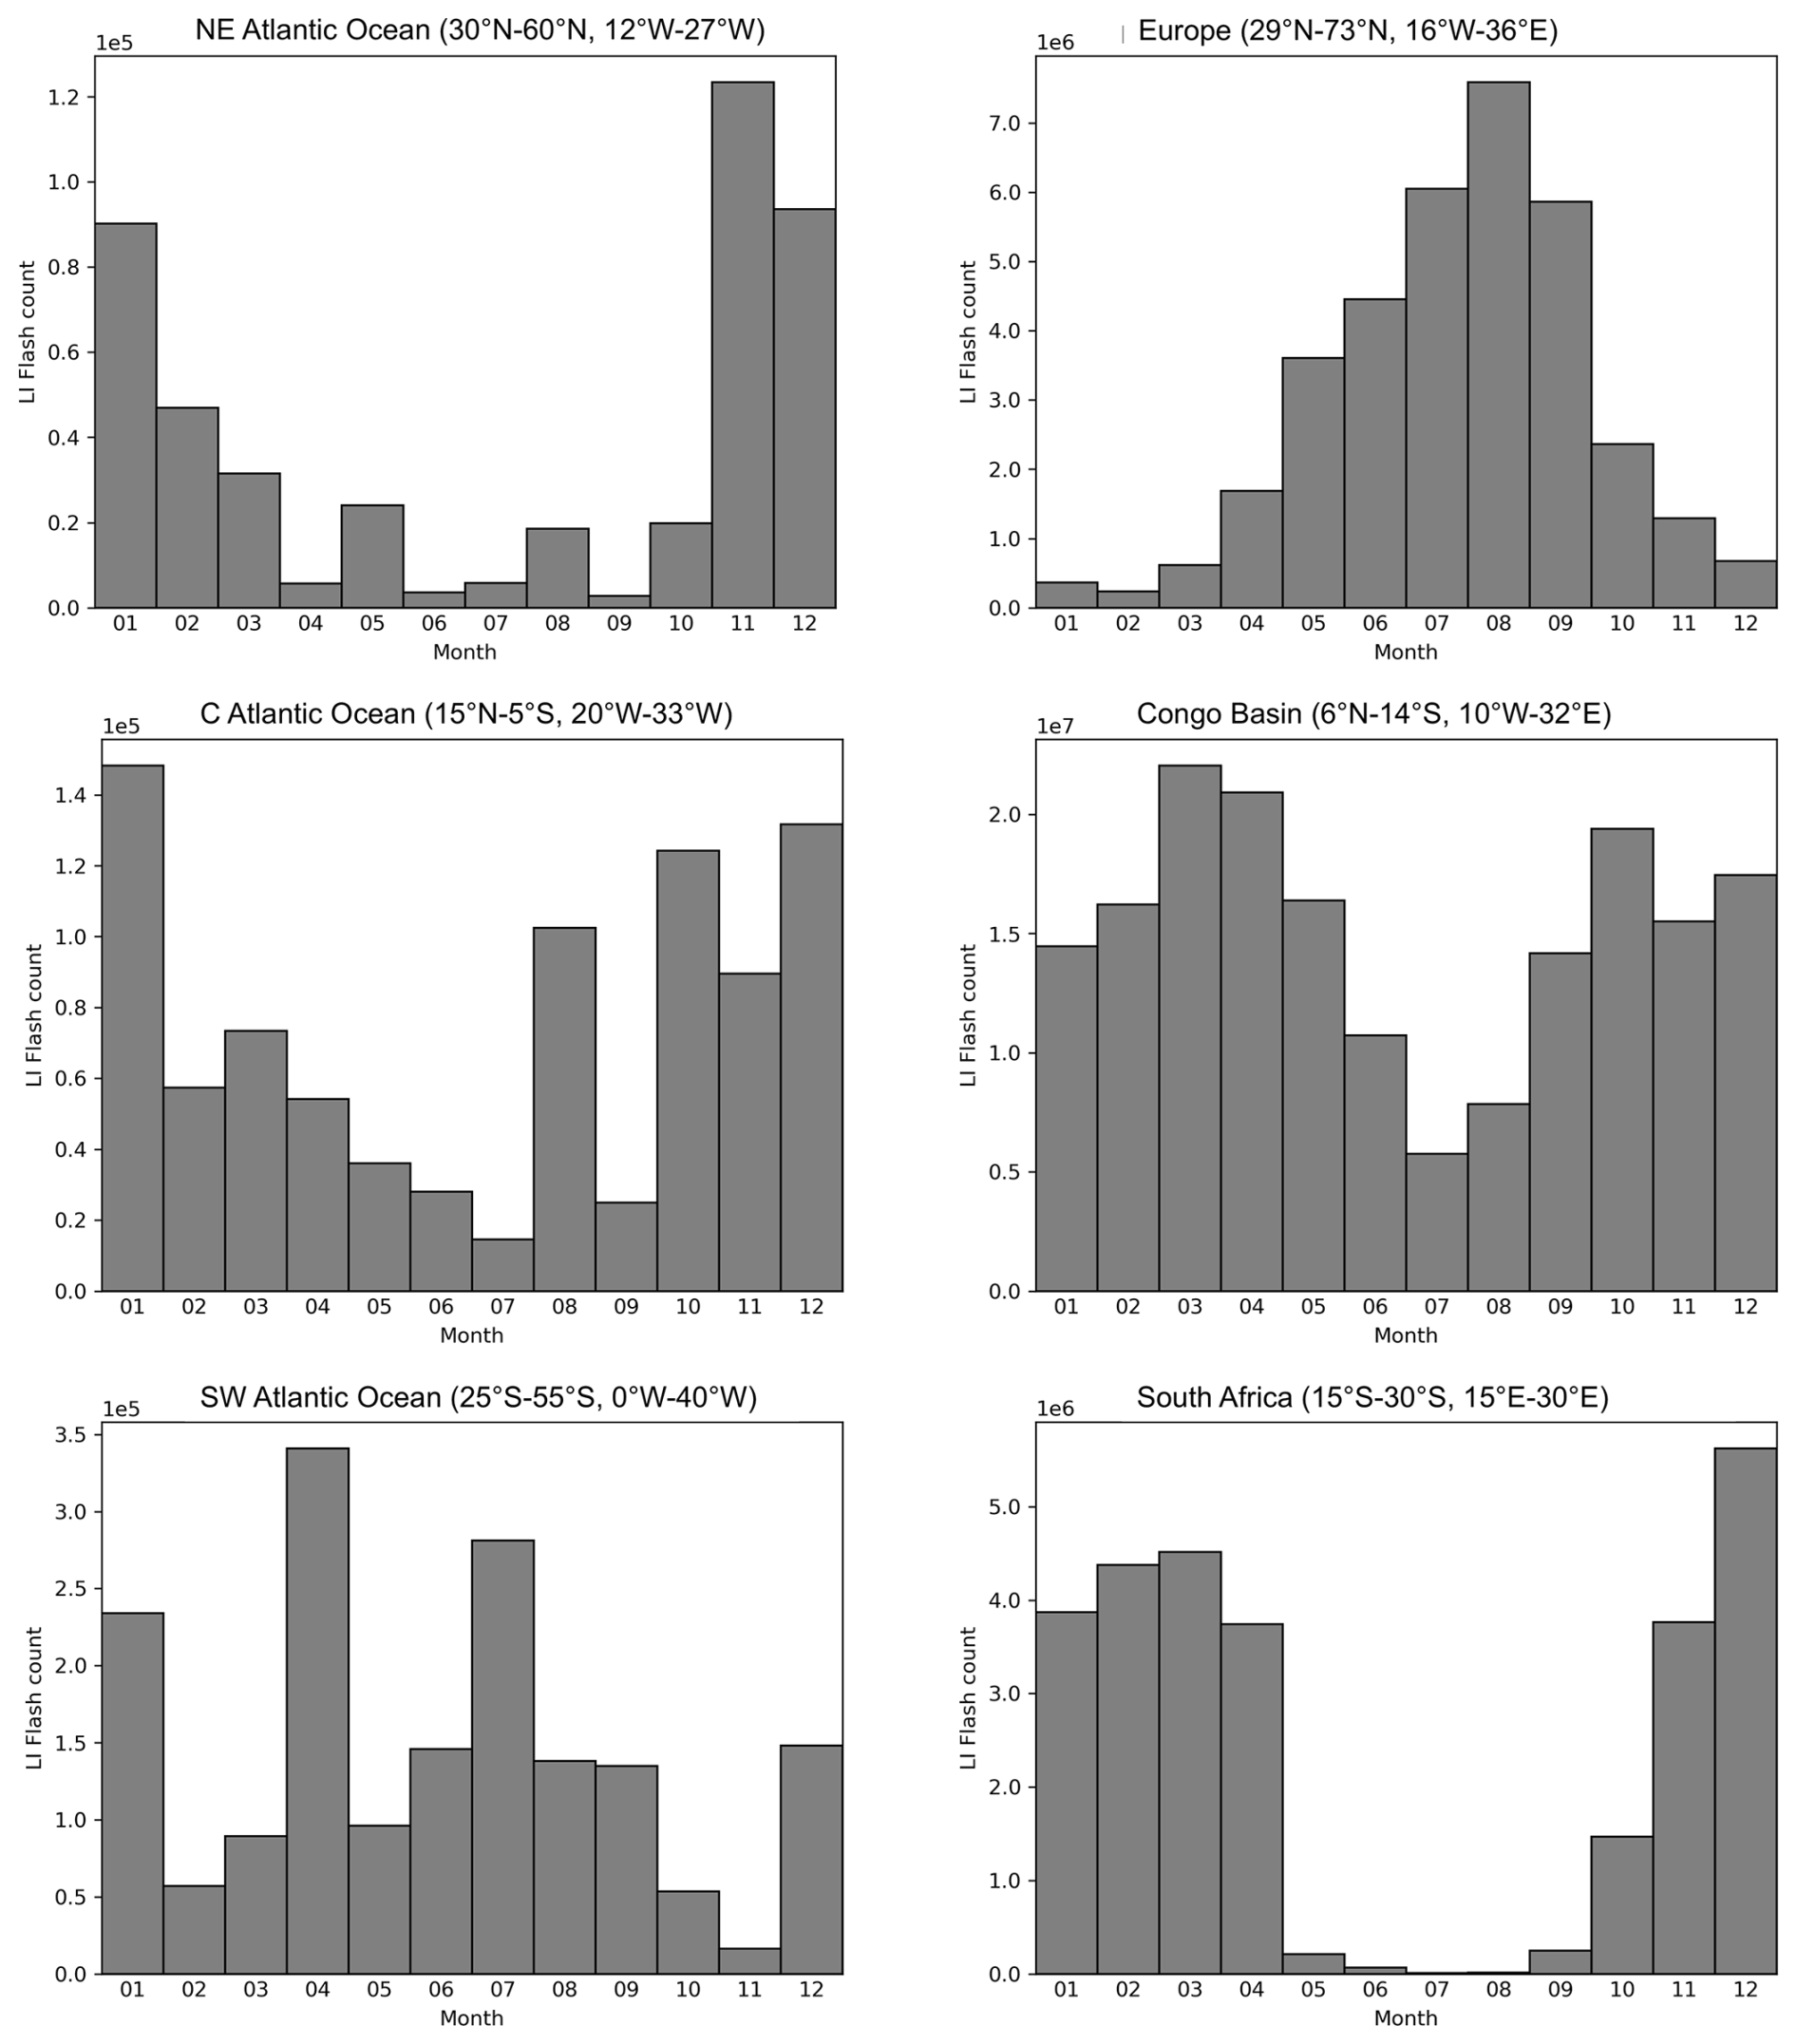
Figure 5Monthly distribution of MTG-LI flashes in three areas over the oceans (left column) and three areas over land (right column) in the northern hemisphere (top row), equatorial region (middle row) and southern hemisphere (bottom row). The latitude/longitude bounds of each area are reported in the title of each plot.
Autumn or winter lightning maximum prevailed over the seas and oceans. Smaller seas including the Caspian Sea, the Black Sea and the western part of the Mediterranean Sea were characterized by (early) autumn lightning maximum, while the mid-latitudes of the Atlantic Ocean (on both hemispheres) as well as the eastern part of the Mediterranean Sea had late autumn or even winter maximum. Some outliers (isolated months with notably higher MTG-LI flash counts) were obvious over the oceans (Fig. 5), indicating the impact of individual strong storms during the short study period.
The local solar hour of maximum lightning activity (Fig. 6) showed a sharp land-sea contrast with an afternoon peak over land and nocturnal maximum over the seas and oceans. The strongest diurnal cycle was observed over land areas like the Congo Basin and southern Africa where the afternoon peak was characterized by 15–20 times more lightning than the morning minimum (Fig. 7). Slightly weaker diurnal cycle was observed in Europe, most likely as the data domain used in Fig. 7 also included a significant proportion of the Mediterranean with nocturnal lightning maximum. Considerably weaker diurnal lightning cycle was observed over the seas and oceans. Some areas like the South Atlantic Ocean showed no remarkable diurnal lightning cycle at all while other regions like the North Atlantic Ocean were characterized by only a weak nocturnal maximum. The strongest diurnal cycle of oceanic lightning was observed along the equator. For example, over the Central Atlantic Ocean, about three times more lightning was observed during the maximum at 03:00–06:00 LT than during the minimum at 13:00–17:00 LT. Very similar diurnal lightning cycle was observed also over the equatorial Indian Ocean (not shown here).
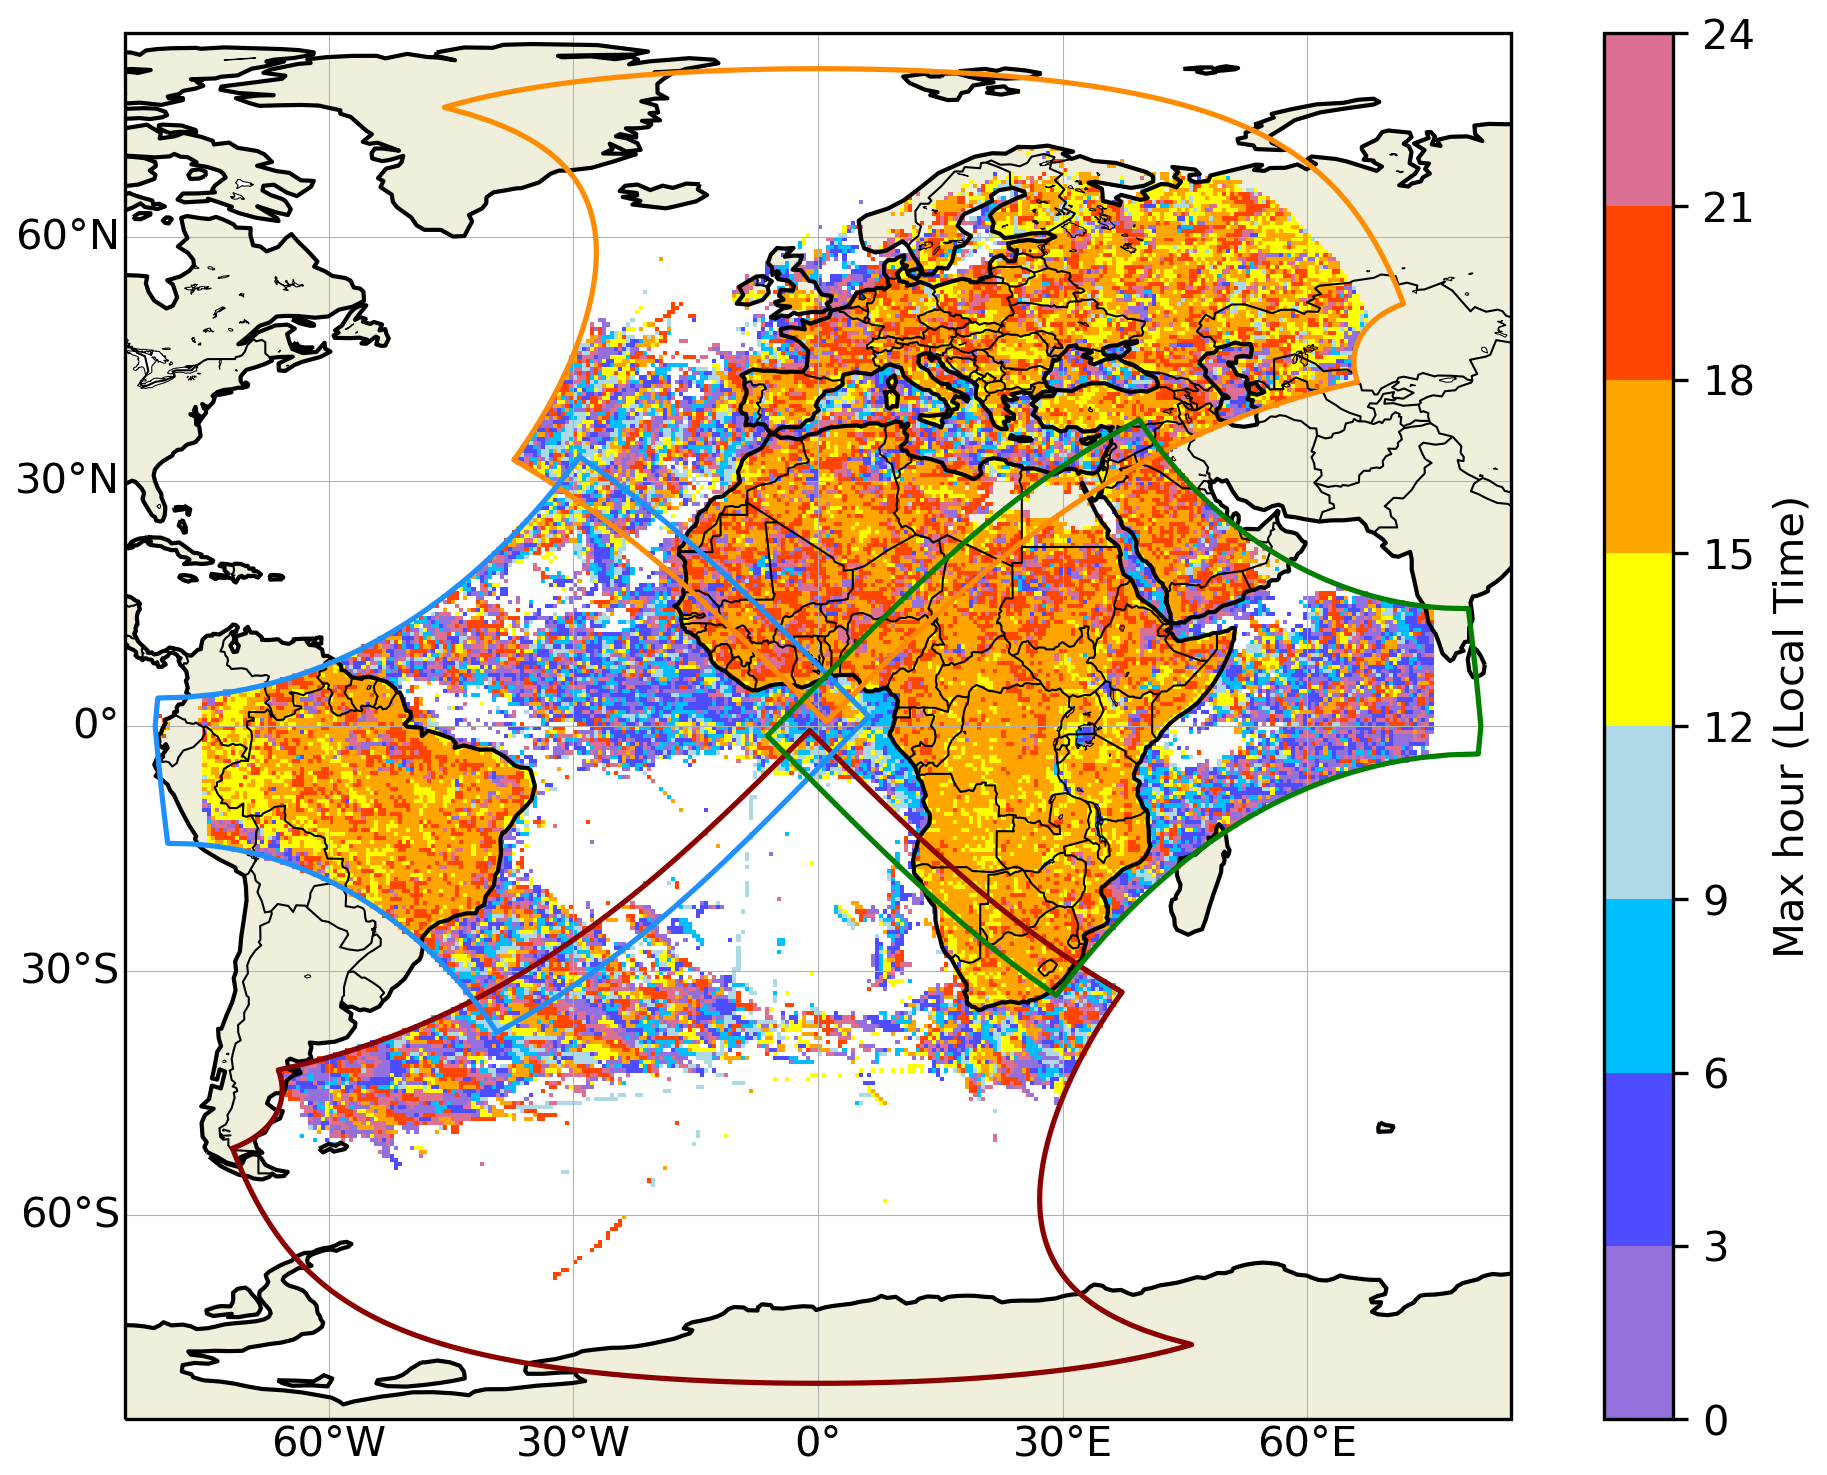
Figure 6Peak hour of lightning activity in local time (LT) based on hourly MTG-LI flash counts from July 2024 to June 2025 on a 0.5° × 0.5° spatial grid. Only grid cells with a total of at least 100 MTG-LI flashes are shown.
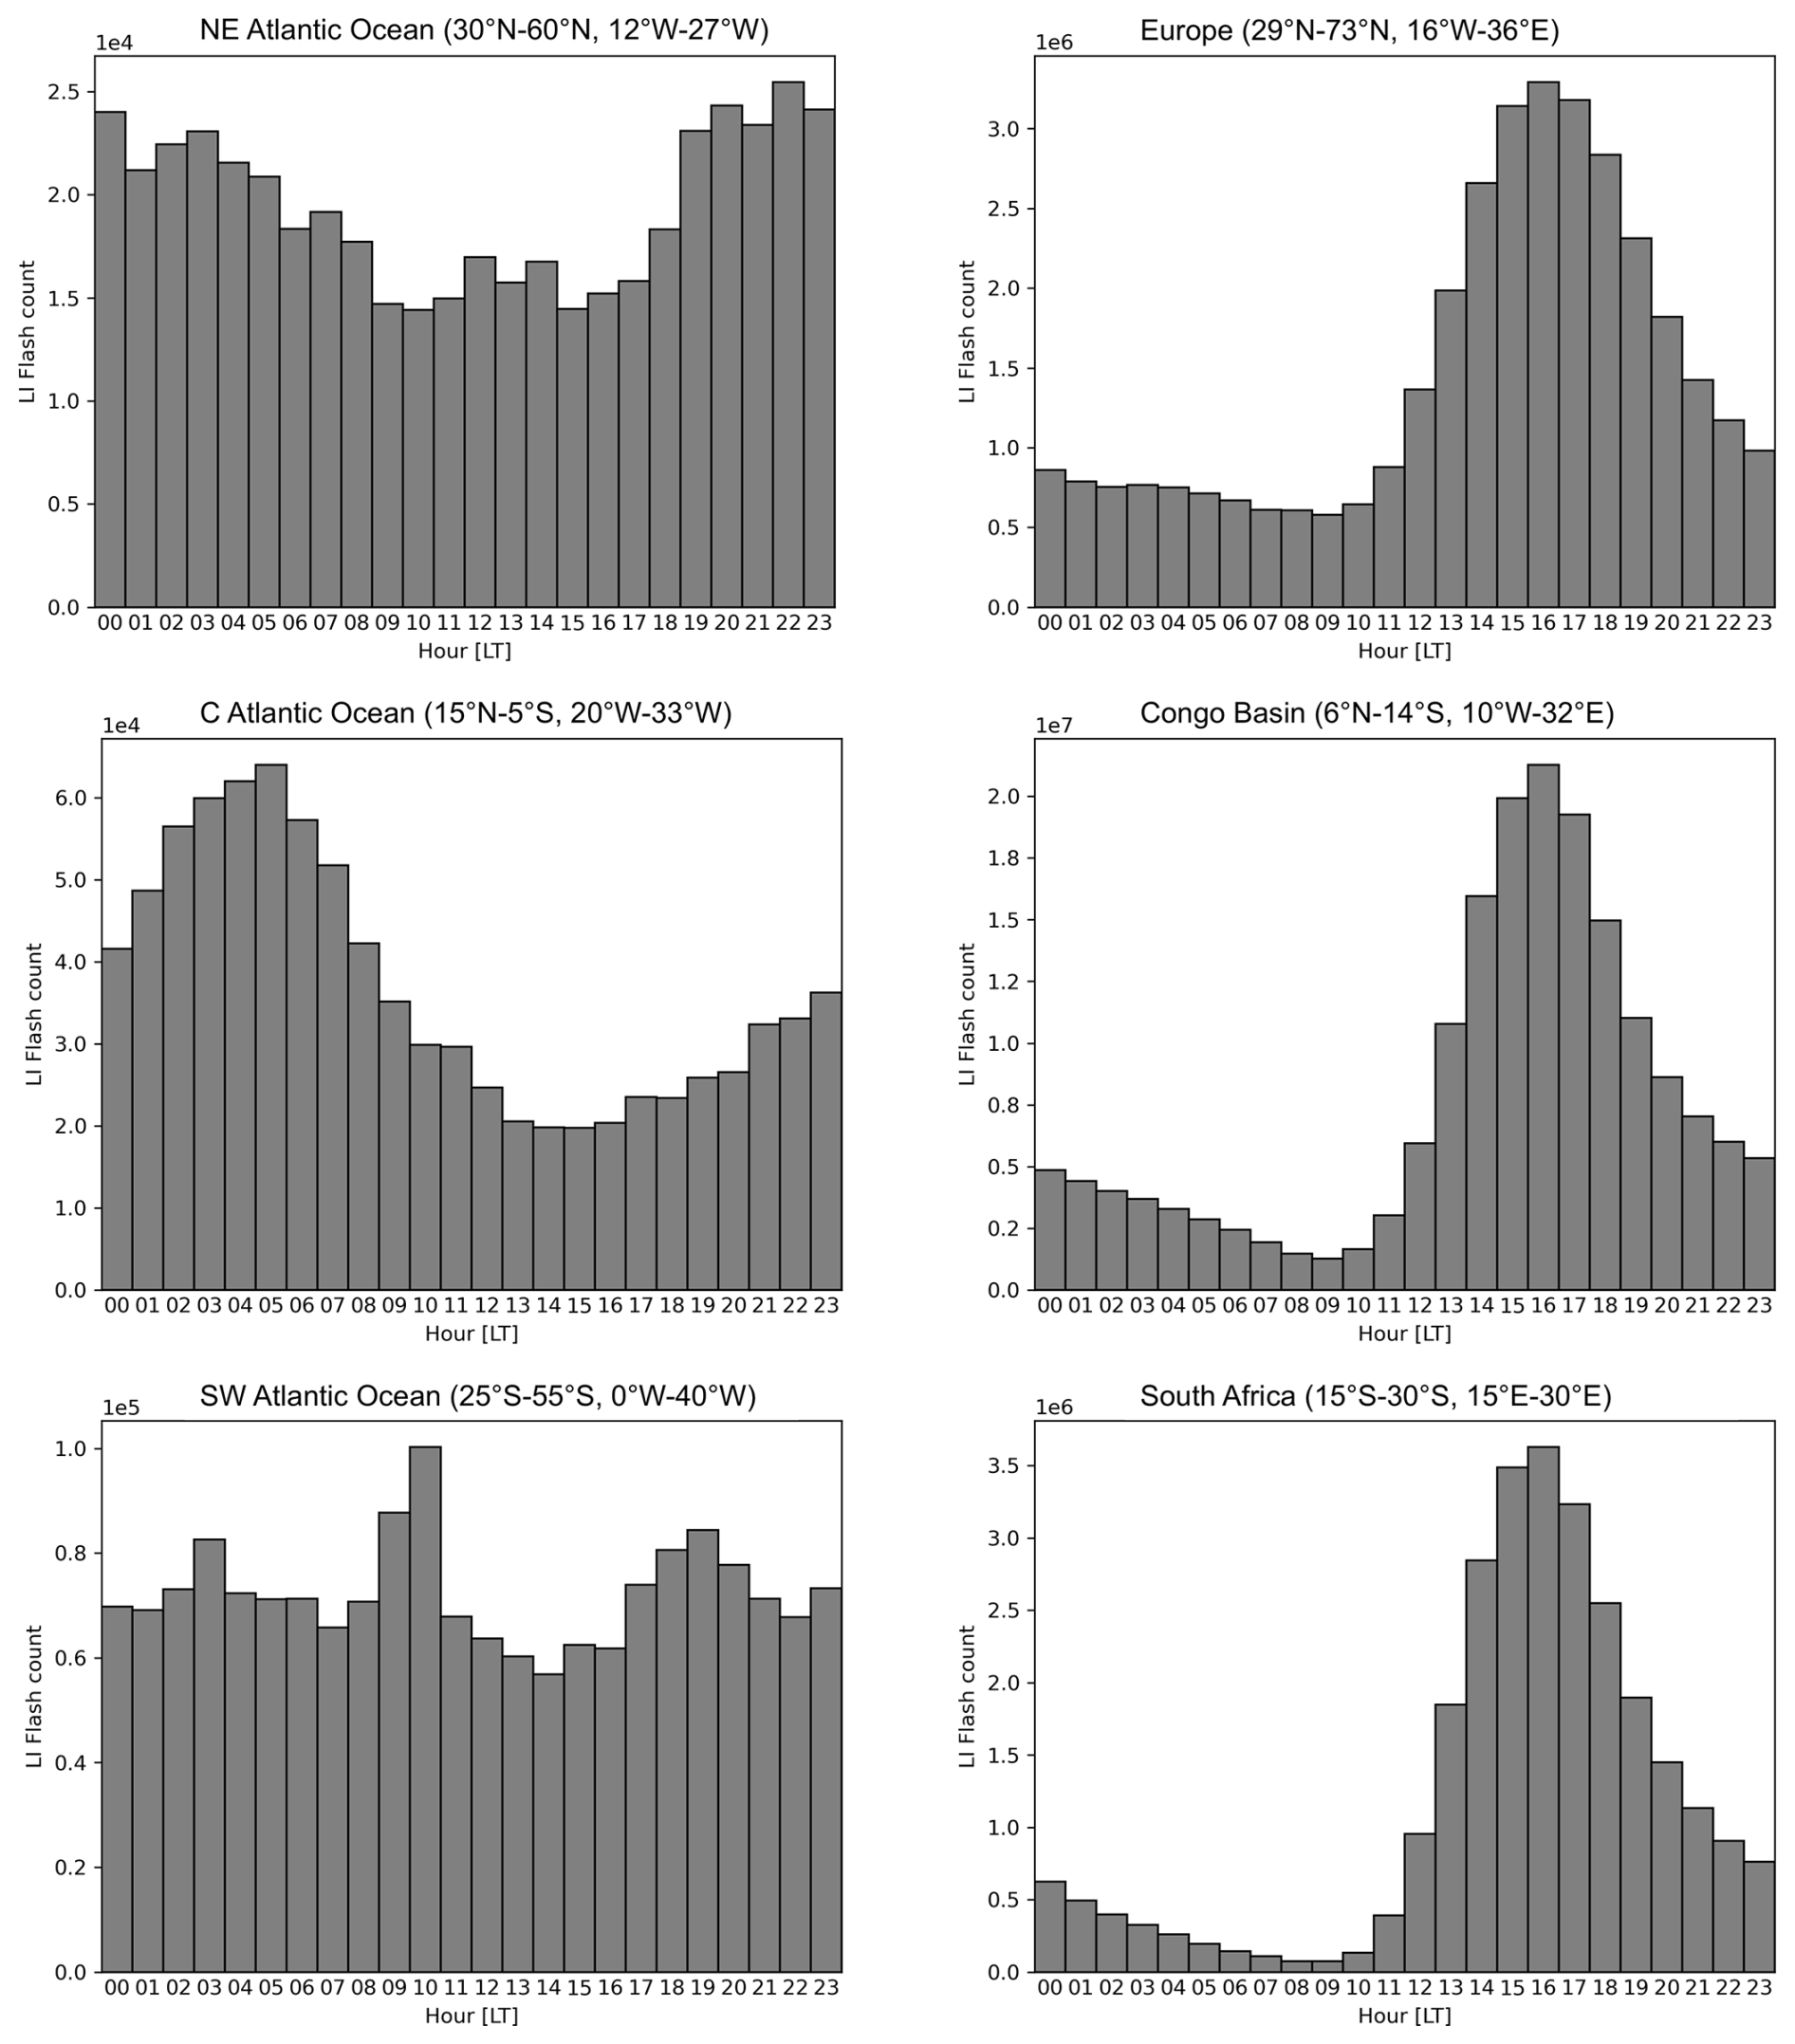
Figure 7Hourly distribution of MTG-LI flashes in three areas over the oceans (left column) and three areas over land (right column) in the northern hemisphere (top), equatorial region (middle) and southern hemisphere (bottom). All times are in local solar time (LT). The latitude/longitude bounds of each area are reported in the title of each plot.
3.2 Congo Basin
Out of the 595 × 106 flashes that MTG-LI observed during its first year of continuous operations, 181 × 106 flashes (or 30 %) were observed in the Congo Basin region within 6° N–14° S and 10° W–32° E. The high-resolution 0.02° × 0.02° MTG-LI flash density (Fig. 8) revealed some interesting local features. The hot-spot of lightning activity over the western slopes of the Rwenzori and Mitumba Mountains was characterized by very sharp drop along the higher mountains in the east. For example, a local minimum of less than 1 flashes km−2 yr−1 in the higher part of the Mitumba Mountains to the northwest of Lake Tanganyika was only 50 km away from an area with more than 100 flashes km−2 yr−1 further northwest. A southwest to northeast oriented local maximum of 40–60 flashes km−2 yr−1 was observed along the Kibara Mountains in the southeast of the Democratic Republic of the Congo.
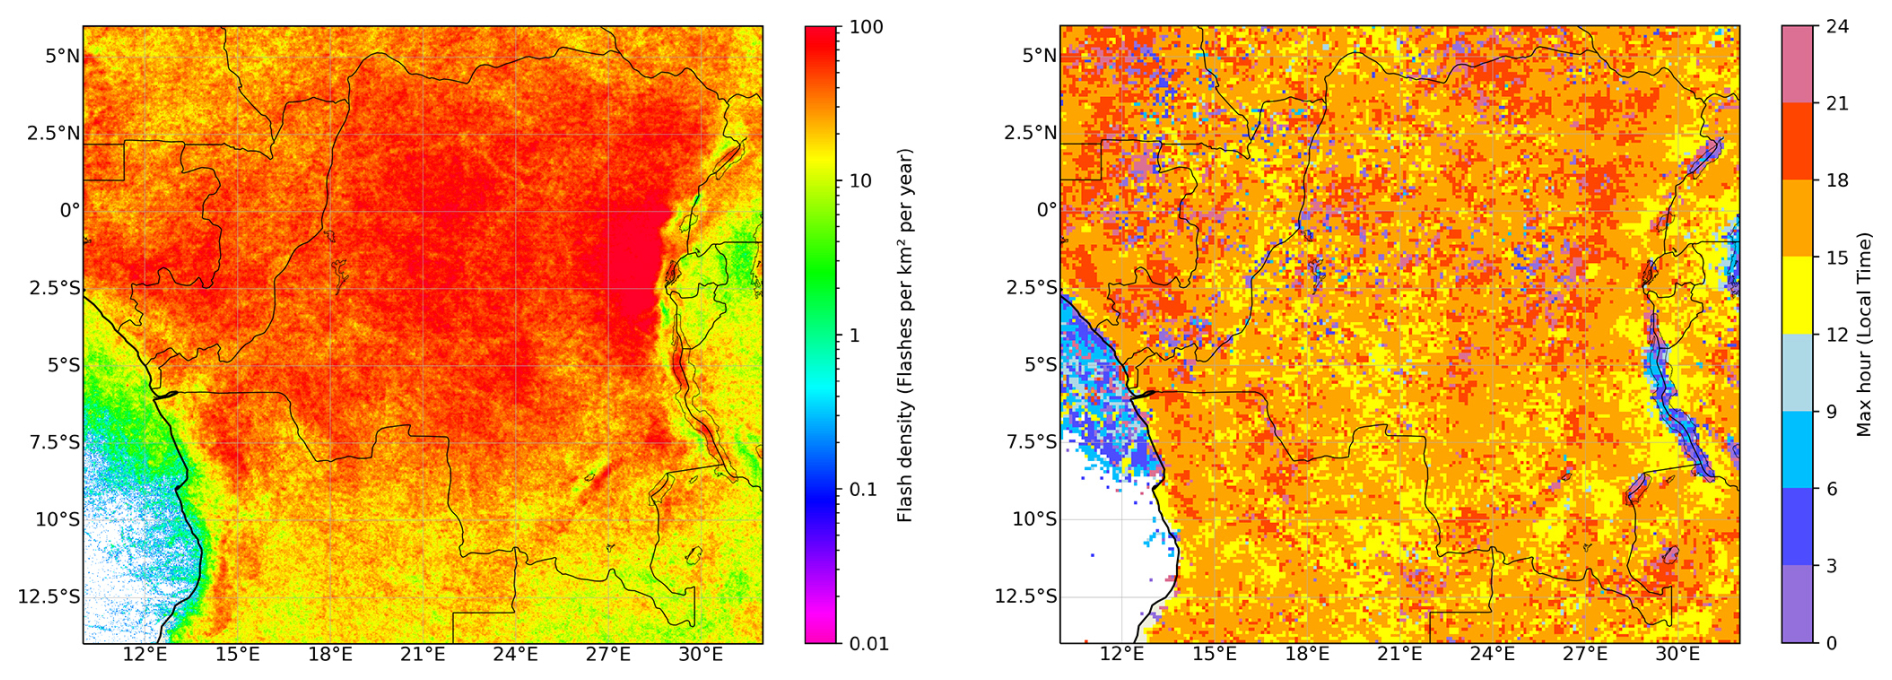
Figure 8High-resolution 0.02° × 0.02° MTG-LI flash density (flashes km−2 yr−1; left) and 0.1° × 0.1° resolution peak hour of lightning activity (right) in the Congo Basin from July 2024 to June 2025.
Lake Tanganyika, Lake Kivu and Lake Albert along the eastern border of the Democratic Republic of the Congo had local lightning maxima of up to 40–50 flashes km−2 yr−1. These clearly stood above the generally lower activity in the surrounding mountainous regions. The finest clearly visible spatial feature was the reduced lightning activity over the River Congo in the north of the Democratic Republic of the Congo. Here, 40–50 flashes km−2 yr−1 were observed along the river while values up to 60–70 flashes km−2 yr−1 were typical to the surrounding areas.
The two largest lakes, Lake Tanganyika and Lake Albert, were characterized by night/early morning lightning maximum while the surrounding land areas exhibited a typical afternoon lightning activity peak (see Fig. 8). Smaller lakes in the same region (Lake Edward, Lake Kivu, Lake Mweru) exhibited evening lightning maximum that occurred somewhat later than over the surrounding land.
3.3 The Lake Victoria
The Lake Victoria is another interesting area of lightning activity in Africa, infamous for its high number of storm-related deaths among local fishers (Kiwanuka-Tondo et al., 2019; Roberts et al., 2022). The nocturnal lightning maximum over the lake clearly stood out from the prevailing afternoon peak over the surrounding land (Fig. 9). There was also a tendency towards earlier (midnight) maximum near the east coast of the lake and a later morning maximum towards the west of the lake. The diurnal cycle of the lightning over the lake was much stronger than what was typically observed over larger water bodies like seas and oceans. In fact, it was even exceeding the diurnal lightning cycle over the land area to the south of the lake that was used for comparison. An outstanding peak was observed during the early morning at 04:00–07:00 LT, just when the lightning frequency over the adjacent land reached its diurnal minimum. Very little or almost no lightning occurred over the lake in the afternoon and early evening during 13:00–20:00 LT when the peak activity was observed over the surrounding land.
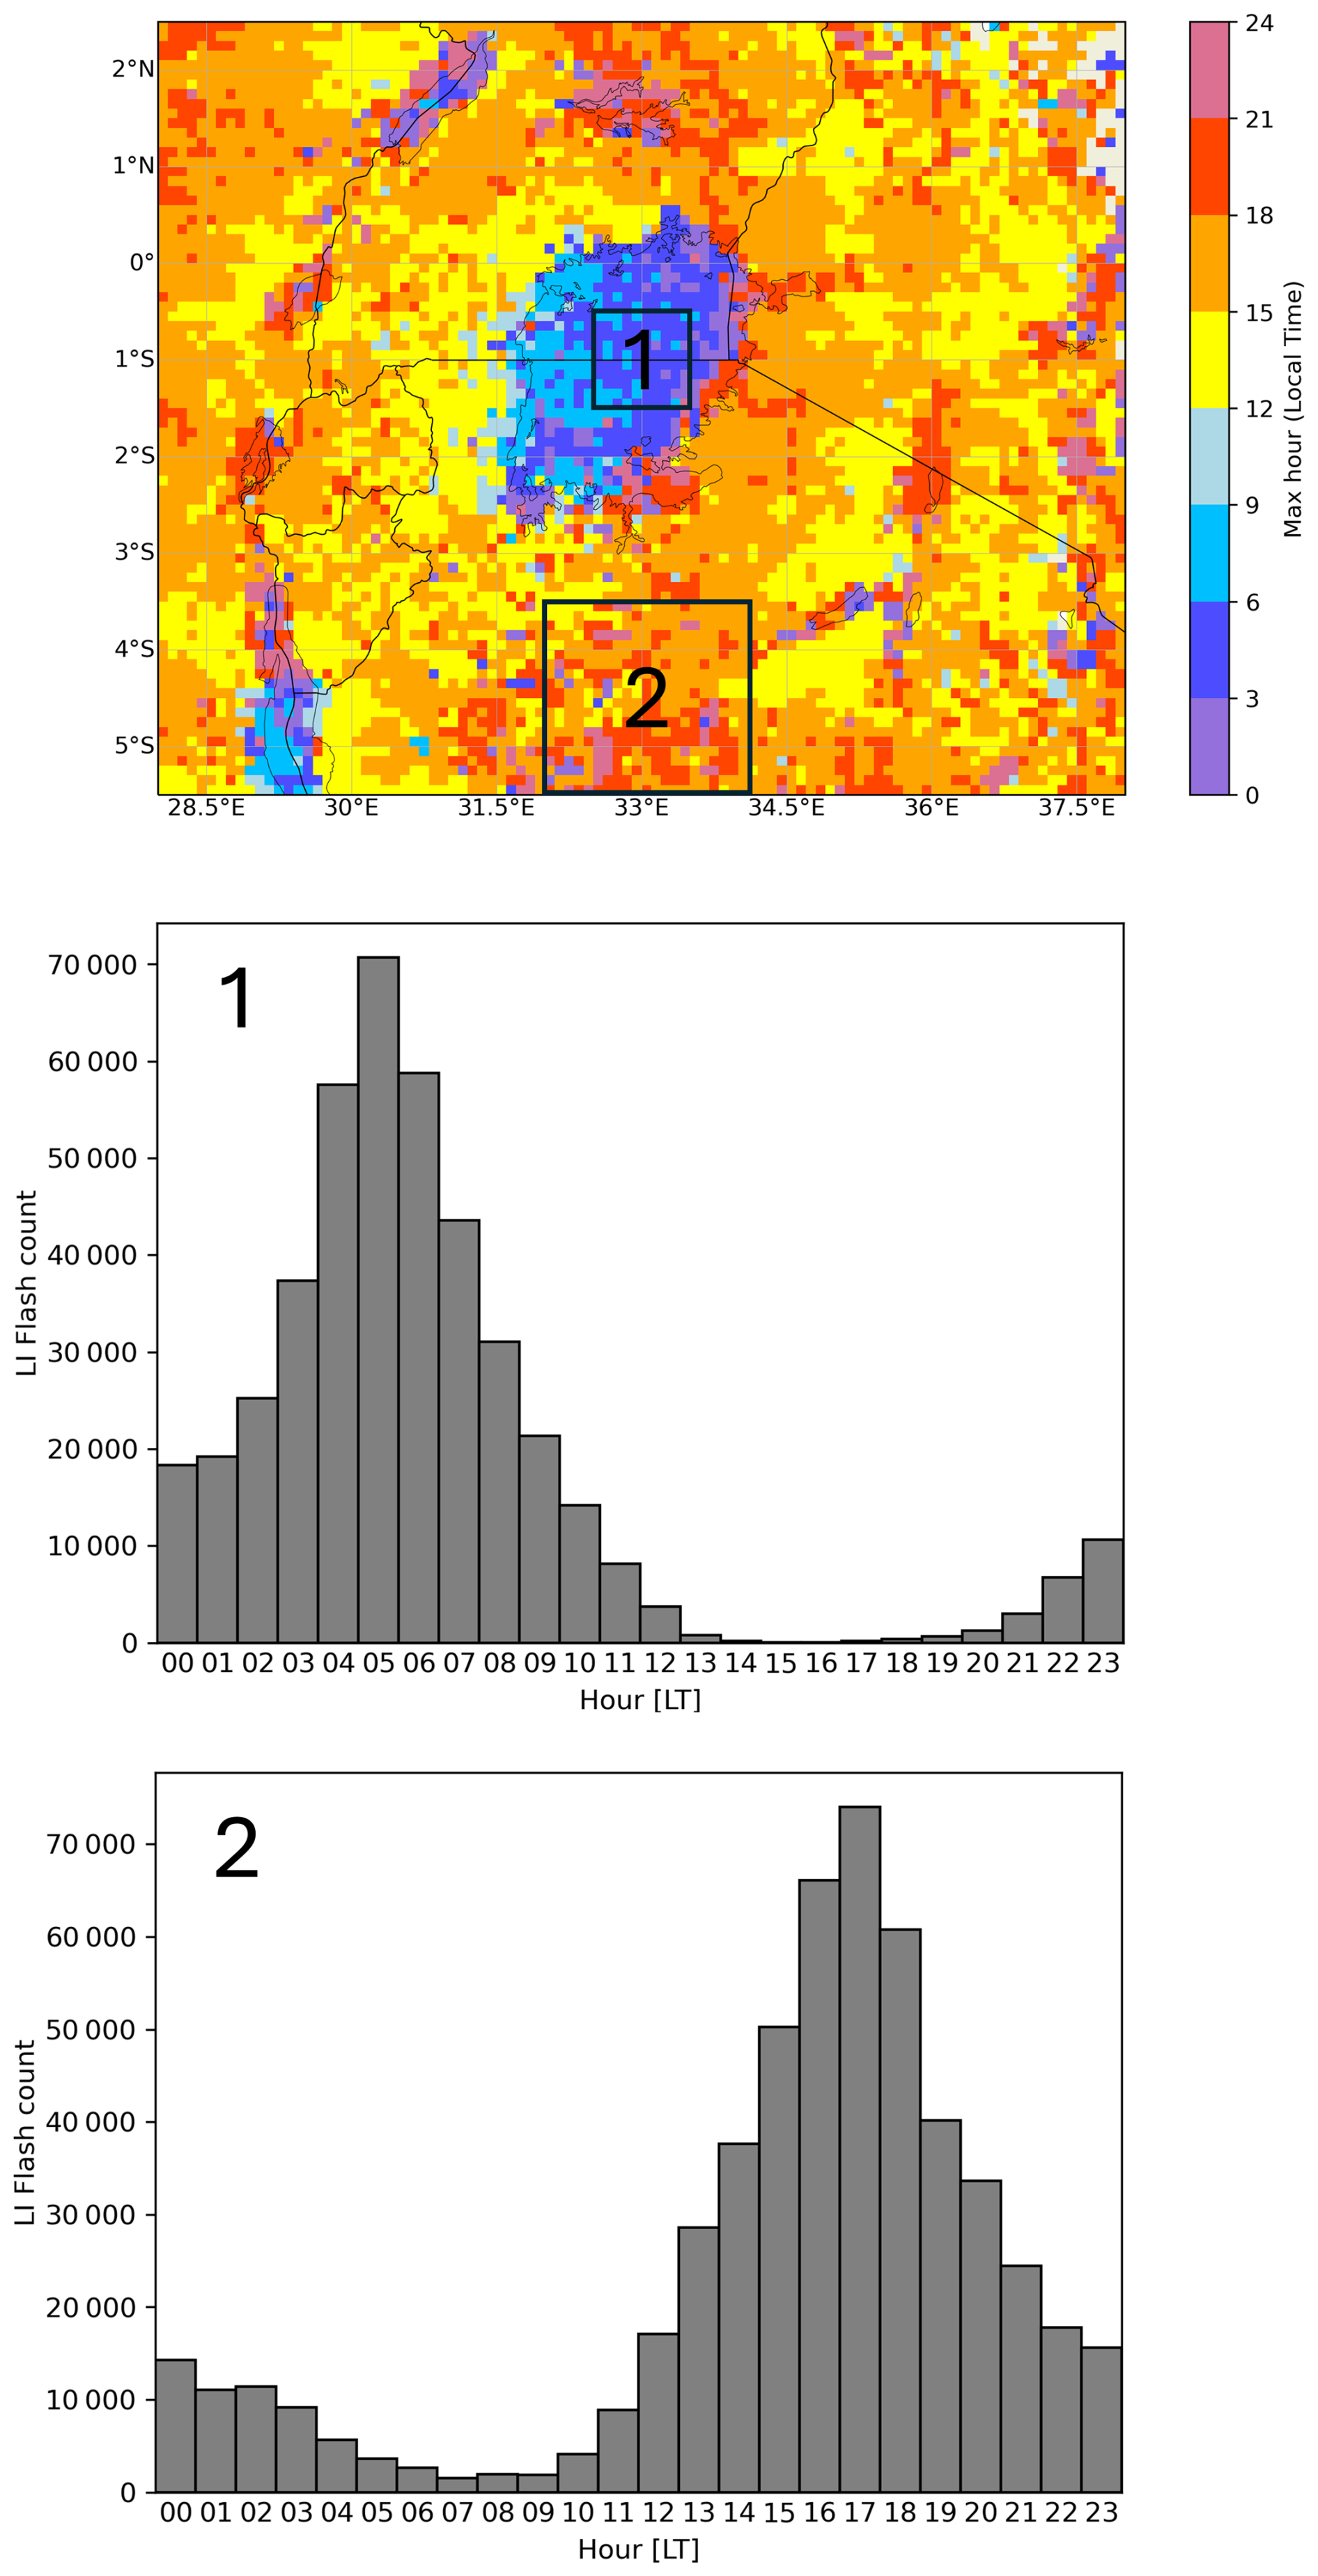
Figure 9Peak hour of lightning activity at 0.1° × 0.1° resolution in the Lake Victoria region from July 2024 to June 2025 (top). Hourly distribution of MTG-LI flashes over the lake (region 1 in the top plot; middle plot). Hourly distribution of MTG-LI flashes over land (region 2 in the top plot; bottom plot). All times are local time (LT).
3.4 Overlap area between MTG-LI and GLM on GOES-East
MTG-LI and GOES-GLM observed almost identical flash density patterns over most of the overlap area of their FOVs (Fig. 10). Notable differences appeared only to the west of 50° W where MTG-LI flash density values became systematically lower than their corresponding GOES-GLM flash density values. This trend is expected towards the edge of the visible disk where MTG-LI detection efficiency is decreasing due to the unfavorable viewing geometry (Viticchié et al., 2026). Despite the lower overall flash density, MTG-LI was still capable of detecting localized features as far as 70–75° W. For example, local lightning maxima along the eastern foothills of the Andes in the north of Peru were clearly visible in the LI data, although the MTG-LI flash density values in the region were about three times lower than GOES-GLM flash density.
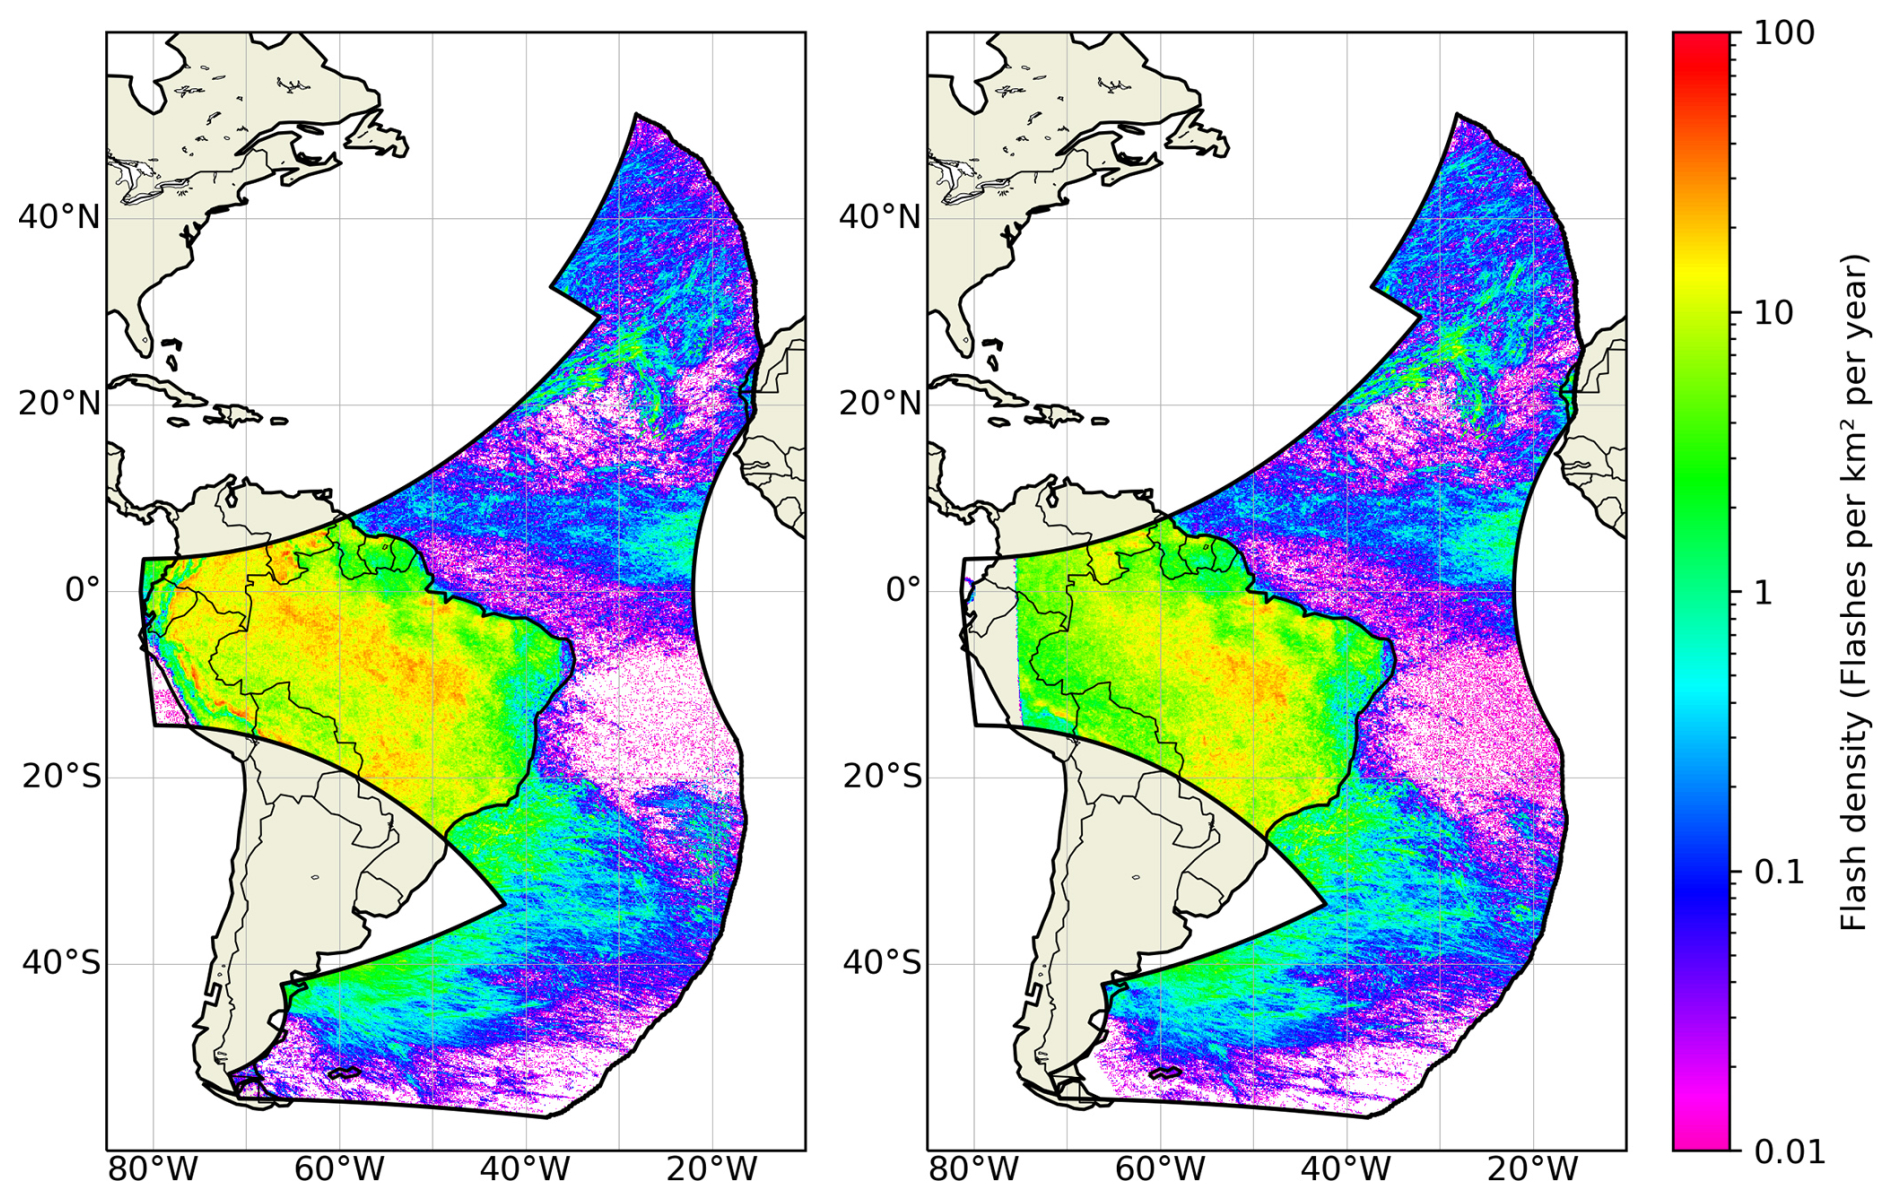
Figure 10Spatial distribution of GOES-GLM (left) and MTG-LI (right) flash density (flashes km−2 yr−1) from July 2024 to June 2025 on a 0.1° × 0.1° spatial grid. The black polygon represents the overlap between the FOV of GLM on GOES-East and FOV of MTG-LI.
Given the overall very good agreement between the MTG-LI and GOES-GLM lightning patterns, a very simple merged flash climatology was produced (Fig. 11). Each grid cell in the overlapping area of the FOVs shows the highest value of the two, MTG-LI and GOES-GLM flash density. This results in visually very natural-looking spatially continuous lightning patters without any sharp or even notable transition between the two instruments.
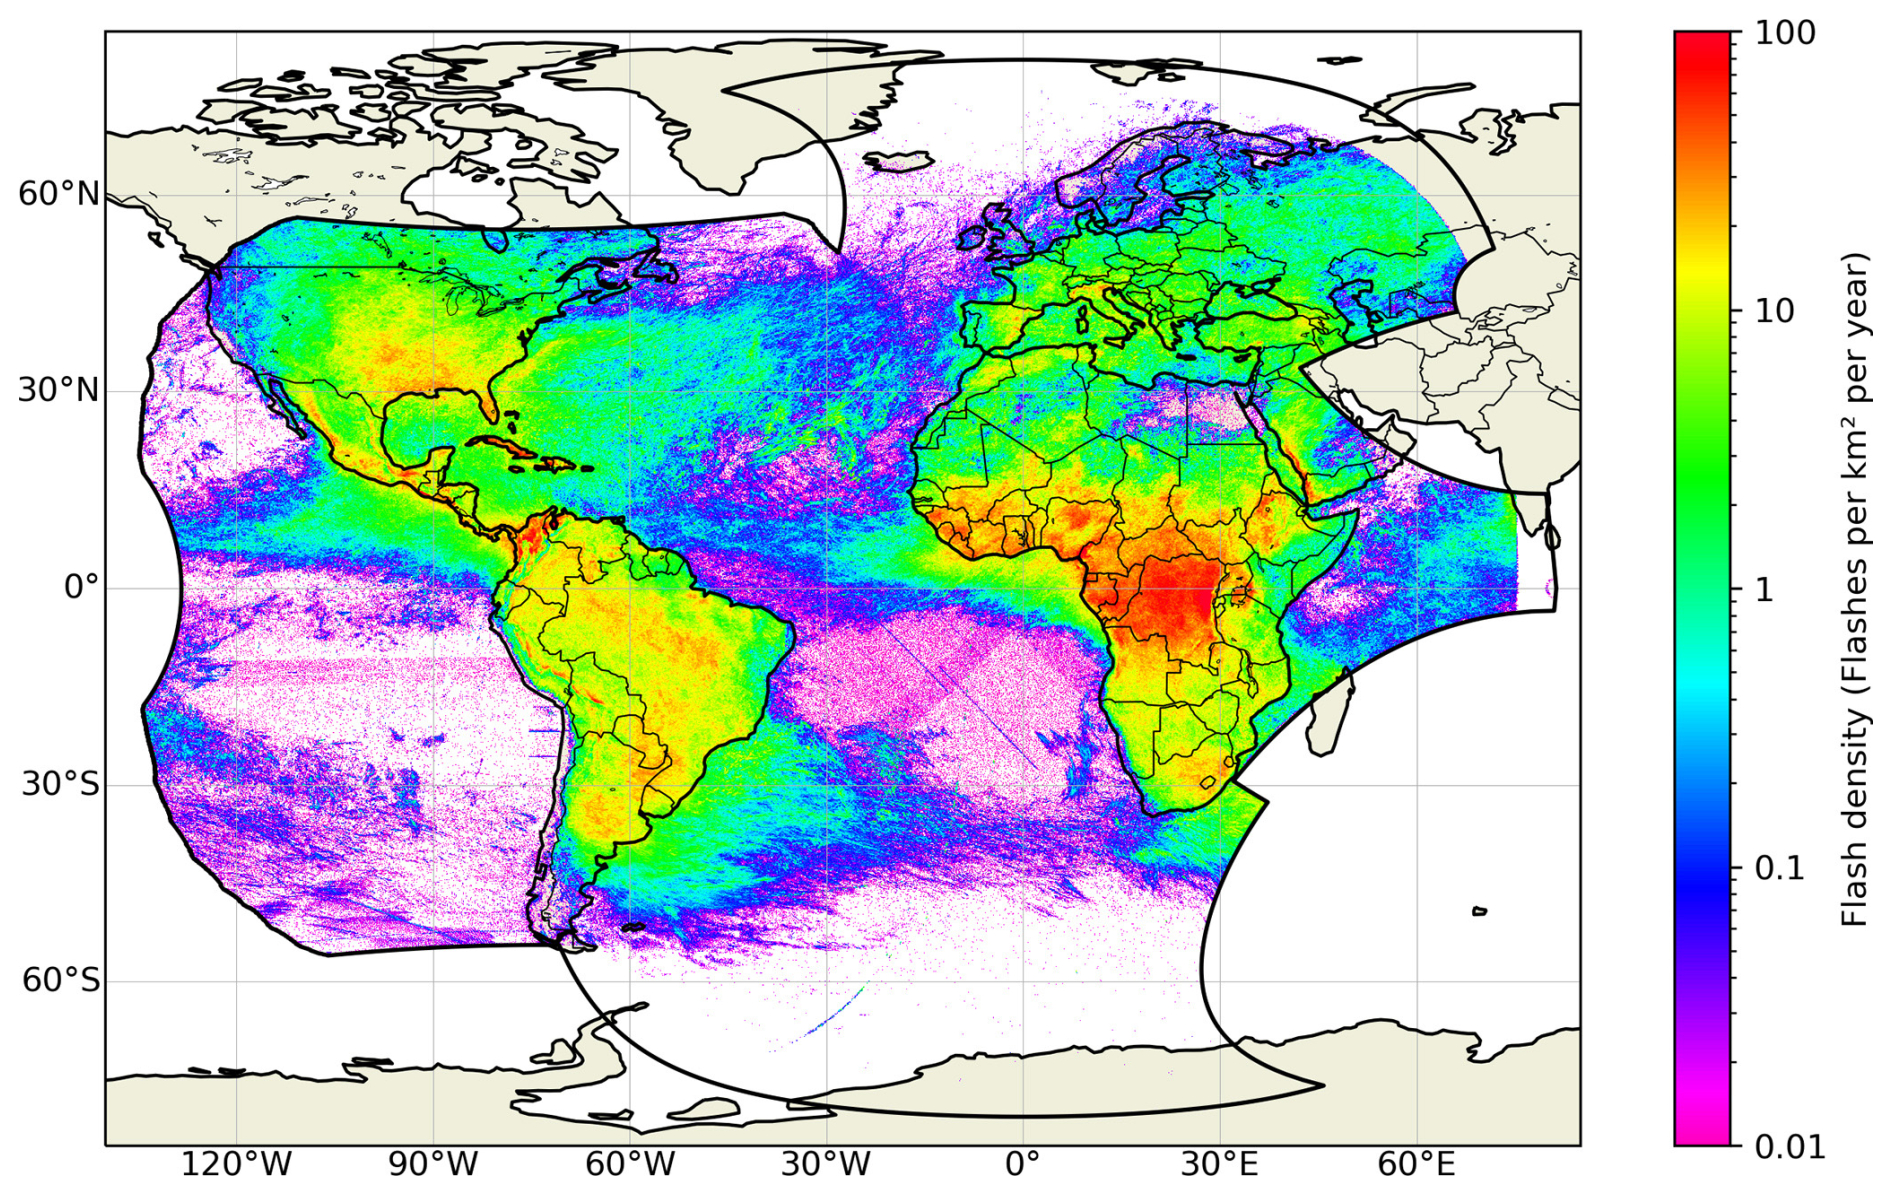
Figure 11Spatial distribution of GOES-GLM and MTG-LI merged flash density (flashes km−2 yr−1) from July 2024 to June 2025 on a 0.1° × 0.1° spatial grid. The black polygon represents the union between the FOV of GLM on GOES-East and FOV of MTG-LI.
During its first year of observations, MTG-LI captured all the major spatial lightning patterns in its field of view (Fig. 2) as described in previous studies using OTD/LIS and ground-based lightning data (e.g., Christian et al., 2003; Albrecht et al., 2016; Cecil et al., 2026). In the largest scale, the land-sea contrast and the high concentration of lightning in the tropics was observed. The absence of lightning at high latitudes and over the tropical South Atlantic Ocean is also in line with previous studies. The impact of MTG-LI false alarms can be noticed as a “halo” and a couple of north-west to south-east oriented line features over the tropical South Atlantic Ocean. Such false flashes can originate from different sources, including Read-Out-Noise (RON) of the cameras, high energy particles and space debris transiting in the MTG-LI field-of-view. For more details about MTG-LI false flashes and their origin one should refer to Viticchié et al. (2026).
The highest MTG-LI flash density of 189 flashes km−2 yr−1 was observed in the eastern part of The Democratic Republic of the Congo (Figs. 2 and 8). The location and the spatial extension of this prominent global lightning hot-spot are well in line with earlier studies using ground-based lightning location systems like WWLLN (Soula et al., 2016; Kigotsi et al., 2018) and GLD360 (Zhang et al., 2026). The MTG-LI flash density values in the region exceeded significantly ground-based observations but were well in line with view-time corrected OTD and LIS results, reporting 160–232 flashes km−2 yr−1 in the same area (Albrecht et al., 2011; Cecil et al., 2014; Albrecht et al., 2016). Over the coming years, sustained MTG-LI observations will fundamentally advance our characterization of the world's primary lightning hot-spot.
The maximum MTG-LI flash density in Europe was found to be 44 flashes km−2 yr−1 in the northeast of Italy approximately 50 km to the north of Venice (Fig. 3). This is significantly higher than ≈ 6 cloud-to-ground flashes km−2 yr−1 reported by EUCLID (Poelman et al., 2016) and 8 total lightning flashes km−2 yr−1 observed by ATDnet in the same area. Meanwhile, it is close to 50 flashes km−2 yr−1 in view-time corrected lightning climatology datasets from TRMM-LIS, ISS-LIS and OTD by Cecil et al. (2026). In other European lightning hot-spots in the north of Italy and east of Spain, MTG-LI typically observed 15–25 flashes km−2 yr−1, i.e, 3–6 times more than ATDnet and EUCLID.
The higher flash counts of the MTG-LI relative to ground-based networks stem from two inherent advantages of space-borne LLSs. First, they provide comprehensive coverage over remote and mountainous terrain where short-range networks, such as EUCLID over Europe, often suffer from limited detection efficiency. Second, they feature a heightened sensitivity to IC flashes, which are often difficult to detect with ground systems. Given the 3–6 times higher MTG-LI flash density compared to EUCLID cloud-to-ground flash density and the fact that EUCLID has been shown to detect > 95 % of cloud-to-ground flashes (Schulz et al., 2016), it can be inferred that the majority of LI observations are associated with IC flashes. However, it should be noted that MTG-LI (like other space-borne optical lightning detectors) does not provide flash type classification. Therefore, in regions with well-established ground-based lightning location systems, a combined lightning dataset integrating ground-based and space-borne observations should be considered. Such an approach would combine the reliable flash type classification provided by ground-based lightning location systems with the heightened sensitivity to IC flashes of the MTG-LI.
When interpreting the first MTG-LI flash density maps presented here, the length of the study period has to be considered especially at high latitudes and over the oceans where lightning activity is low. A longer study period would be needed to smoothen out the local-scale impact of individual intense storms and reveal the properties of the lightning climatology. For example, the small-scale stretched features of higher flash density in many places across Europe (Fig. 3) reflect paths of individual strong storms during the study period. Such storm tracks can intersect, creating small local hot-spots with notably high flash density as seen, for example, in the south of Sweden or in some locations in Germany, France and elsewhere. This effect is not seen in central Africa where the amount of lightning is high enough to produce meaningful climatological patterns even over the 1-year study period.
The spatial distribution of the month of maximum lightning activity (Fig. 4) and the complementary monthly MTG-LI flash distribution histograms (Fig. 5) demonstrate the MTG-LI ability to characterize the seasonal patterns of convection within its FOV. The summer maximum over the continental Europe and autumn maximum over the Mediterranean are well in line with the ATDnet 10-year lightning climatology (Enno et al., 2020). Over Africa, the month of maximum lightning activity reflects the seasonal migration of the Intertropical Convergence Zone (ITCZ) with June to August maximum in the north and December to February maximum in the south of the continent (e.g., Waliser and Gautier, 1993). In South America, MTG-LI observed Northern Hemisphere autumn/winter maximum which is in line with the fact that its field of view in South America is mainly in the southern hemisphere, visited by the ITCZ during this time of the year.
Mid-latitude oceans on both hemispheres were characterized by local autumn and winter lightning maximum that stems from the seasonal peak in atmospheric instability (Frierson and Davis, 2011). Frequent autumn and winter cyclones transport cooler polar air masses over relatively warmer waters, resulting in convection and sometimes lightning. The overall low flash density (Fig. 2) suggests that mid-latitude oceanic thunderstorms are normally weak and short-lived. Over the tropical oceans, the most interesting seasonal features was the late summer/autumn lightning peak observed around 10° N across the Atlantic Ocean. This probably represents mesoscale convective systems developing on African easterly waves, crossing the ocean from east to west and sometimes developing into hurricanes during this season (Price et al., 2007).
A sharp land/sea contrast was observed in the diurnal cycle of lightning activity (Figs. 6 and 7). A strong afternoon peak and a deep morning minimum was characteristic to virtually all land areas. This is well in line with previous regional (e.g., Poelman et al., 2016; Soula et al., 2016; Enno et al., 2020) and global studies (Pan et al., 2013; Blakeslee et al., 2014) and stems directly from the diurnal air temperature and convection cycle over land. Much weaker diurnal lightning cycle with a tendency towards nocturnal or (early) morning maximum was seen over the tropical Atlantic and Indian Ocean (Figs. 6 and 7). This reflects the typical early morning convection and precipitation maximum over the tropical oceans (e.g., Bowman et al., 2005).
The detection of small local features was demonstrated in the Congo Basin where the very high lightning frequency allows one to derive fine-scale climatological patterns despite of limited length of the study period (Fig. 8). MTG-LI flash density on a 0.02° × 0.02° (i.e., 2.2 km × 2.2 km) spatial grid revealed small-scale details such as the lower flash density over the Congo River in the north and the very sharp drop in lightning frequency along the mountain ranges in the eastern border of The Democratic Republic of the Congo. No significant artifacts or issues were observed despite of the fact that the used spatial resolution was well below the MTG-LI pixel size (≈ 5 km in the area). This shows that the method of computing MTG-LI flash locations as radiance weighted centroids of all contributing lightning events (Viticchié et al., 2026) might reveal some interesting sub-pixel scale local details.
High-resolution spatial lightning patterns can be combined with high-resolution diurnal lightning statistics to further explore some specific local-scale weather patterns such as nocturnal lightning maxima over larger African lakes (Fig. 8 right plot and Fig. 9). Those maxima have been reported in previous studies (e.g., Virts and Goodman, 2020; Holle and Murphy, 2017) and attributed to the convergence of nocturnal land breezes over the warm lakes that triggers convection (Nicholson, 2023). Such local factors can lead to a very pronounced nocturnal lightning maximum (Fig. 9 middle plot) as opposed to the relatively weak night time lightning maximum over the tropical oceans (Fig. 7). It is also interesting to note that similar nocturnal lightning maximum is found over Lake Catatumbo in South America (e.g., Rudlosky et al., 2019) where also the highest lightning incidence on the planet (up to 250 flashes km−2 yr−1) has been reported (Albrecht et al., 2011).
The potential of merging different geostationary lightning datasets was demonstrated by comparing the MTG-LI and GOES-GLM flash density maps (Fig. 10). Despite the differences in technology, pixel resolution and frame rate (Table 1), the two instruments produced virtually identical spatial patterns of annual flash density over most of the intersection of their FOVs. Notable differences were only observed close to the edge of the MTG-LI FOV in South America where MTG-LI flash density was up to three times lower than GOES-GLM flash density. On the contrary, there was no notable drop in GOES-GLM flash density over the Atlantic Ocean near the edges of GOES-GLM FOV. This difference can be attributed to the smaller FOV of the GOES-GLM, which is limited to approximately 55° from the sub-satellite point. Consequently, the viewing angle along the edges of the GOES-GLM FOV is comparable to that of the MTG-LI over eastern South America, where the flash densities recorded by both instruments remain closely aligned. Furthermore, because the eastern boundary of the GOES-GLM FOV lies predominantly over the Atlantic Ocean, detection at these wide viewing angles is further facilitated by the naturally higher optical intensity of oceanic lightning (e.g., Rudlosky et al., 2019).
Finally, given the very good agreement between MTG-LI and GOES-GLM flash density, a simple annual merged flash density map was produced by taking the highest flash density value per grid cell (Fig. 11). This is the most primitive, but at the same time very intuitive, way of producing a simple merged lightning distribution map. Selecting the highest value in each grid cell provides a simple filtering criterion, ensuring that the flash density measurement from the instrument with the highest detection efficiency in that cell is retained in the final merged map. This results in a smooth transition from MTG-LI data to GOES-GLM data when moving from east to west through the overlap between the FOVs of the two instruments. The resulting flash density map shows very natural lightning patterns that are well in line with earlier OTD and LIS results (Christian et al., 2003; Cecil et al., 2014, 2026). Further development is needed to upgrade this simple approach into a sophisticated merging algorithm that operates at the flash level to eliminate false alarms. However, Fig. 11 is already very encouraging and clearly shows the potential of achieving near-global total lightning monitoring by merging datasets of multiple geostationary lightning mappers in the near-future.
The MTG-LI system is the first European geostationary mission dedicated to the continuous monitoring and characterization of total lightning activity on a hemispheric scale. This paper demonstrates its capability to capture precise spatial and temporal lightning patterns across its entire FOV, which encompasses Europe, Africa, the Middle East, South America, and parts of the Atlantic and Indian Oceans.
MTG-LI detected a total of 595 × 106 flashes during its first year of continuous observations from July 2024 to June 2025. In the largest scale, lightning was mostly concentrated to the tropical land regions while high latitudes and oceans were characterized by much lower lightning incidence. The highest observed annual lightning flash density of 189 flashes km−2 yr−1 was found in the well-known lightning hot-spot in the east of The Democratic Republic of the Congo. The location of the European lightning hot-spot in the north-east of Italy is also in line with previous studies, while the observed MTG-LI lightning frequency of 44 flashes km−2 yr−1 at this location notably exceeded ground-based observations, reflecting the heightened IC lightning sensitivity of the MTG-LI. Given that MTG-LI does not provide flash type classification, a combined lightning dataset integrating the benefits of ground-based lightning location systems (e.g. flash type classification) and space-borne observations (e.g. considerably higher sensitivity to cloud lightning) should be considered in the future.
The seasonal lightning maximum over land typically occurred during local summer months while the mid-latitude oceans were characterized by autumn/winter lightning maximum. Strong diurnal cycle with maximum lightning activity during the local afternoon was observed everywhere over land while much weaker nocturnal maximum prevailed over the seas and oceans. MTG-LI was also very good at detecting local-scale features such as the strong nocturnal lightning maximum over Lake Victoria in Africa.
All observed lightning patterns align closely with previous studies utilizing ground-based networks and low-Earth-orbiting space-borne detectors, such as the OTD and LIS. Crucially, however, the flash densities recorded by the MTG-LI are systematically higher than those from ground-based systems, underscoring the added value of MTG-LI's sensitivity to IC lightning. Alongside the findings of Viticchié et al. (2026), this paper demonstrates that the MTG-LI is an exceptional tool for both real-time operational tracking and long-term climatological monitoring of total lightning activity across its entire field of view.
The underlying research data from the MTG-LI are openly available in the EUMETSAT data store at https://data.eumetsat.int/search?query= (last access: 16 October 2026). GOES-GLM data are available at https://doi.org/10.7289/V5KH0KK6 (GOES-R Algorithm Working Group and GOES-R Series Program, 2018).
SEE conducted the formal analysis, developed the visualization of results and wrote the manuscript; BV and DN reviewed the manuscript; BV and JG supervised the work.
At least one of the (co-)authors serves as editor for the special issue Unlocking the potential of MTG imager data in applications to which this paper belongs. The peer-review process was guided by an independent editor, and the authors also have no other competing interests to declare.
Publisher's note: Copernicus Publications remains neutral with regard to jurisdictional claims made in the text, published maps, institutional affiliations, or any other geographical representation in this paper. The authors bear the ultimate responsibility for providing appropriate place names. Views expressed in the text are those of the authors and do not necessarily reflect the views of the publisher.
This article is part of the special issue “Unlocking the potential of MTG imager data in applications”. It is not associated with a conference.
The Meteosat Third Generation (MTG) Programme is a cornerstone of European space cooperation, made possible through the combined expertise and dedication of key institutional and industrial partners: EUMETSAT, ESA, Thales Alenia Space (France), Leonardo (Italy) and OHB (Germany). The authors gratefully acknowledge the invaluable discussions with experts across Europe and the United States. The authors thank Martin Füllekrug (Referee#1) and the anonymous Referee#2 for the insightful feedback that strengthened the manuscript.
This paper was edited by Nataša Strelec Mahović and reviewed by Martin Fullekrug and one anonymous referee.
Aich, V., Holzworth, R., Goodman, S. J., Kuleshov, Y., Price, C., and Williams, E.: Lightning: A new essential climate variable, EOS, 99, https://doi.org/10.1029/2018EO104583, 7 September 2018. a
Albrecht, R. I., Goodman, S. J., Petersen, W. A., Buechler, D. E., Bruning, E. C., Blakeslee, R. J., and Christian, H. J.: The 13 Years of TRMM Lightning Imaging Sensor: From Individual Flash Characteristics to Decadal Tendencies, in: Proceedings of the XIV International Conference on Atmospheric Electricity, Rio de Janeiro, Brazil, 8–12 August 2011, International Commission on Atmospheric Electricity (ICAE), 2011. a, b
Albrecht, R. I., Goodman, S. J., Buechler, D. E., Blakeslee, R. J., and Christian, H. J.: Where Are the Lightning Hotspots on Earth?, B. Am. Meteorol. Soc., 97, 2051–2068, https://doi.org/10.1175/BAMS-D-14-00193.1, 2016. a, b, c, d
Bitzer, P. M., Burchfield, J. C., and Christian, H. J.: A Bayesian approach to assess the performance of lightning detection systems, J. Atmos. Ocean. Tech., 33, 563–578, 2016. a
Blakeslee, R. J., Mach, D. M., Bateman, M. G., and Bailey, J. C.: Seasonal Variations in the Lightning Diurnal Cycle and Implications for the Global Electric Circuit, Atmos. Res., 135–136, 228–243, https://doi.org/10.1016/j.atmosres.2012.09.023, 2014. a
Boccippio, D. J., Goodman, S. J., and Heckman, S.: Regional Differences in Tropical Lightning Distributions, J. Appl. Meteorol., 39, 2231–2248, https://doi.org/10.1175/1520-0450(2001)040<2231:RDITLD>2.0.CO;2, 2000. a
Boccippio, D. J., Koshak, W., Blakeslee, R., Boeck, W. L., Mach, D., Goodman, S., and Christian, H. J.: Performance assessment of the Optical Transient Detector and Lightning Imaging Sensor. Part I: Predicted diurnal variability, J. Atmos. Ocean. Tech., 19, 1318–1332, https://doi.org/10.1175/1520-0426(2002)019<1318:PAOTOT>2.0.CO;2, 2002. a
Bowman, K. P., Collier, J. C., North, G. R., Wu, Q., Ha, E., and Hardin, J.: Diurnal Cycle of Tropical Precipitation in Tropical Rainfall Measuring Mission (TRMM) Satellite and Ocean Buoy Rain Gauge Data, J. Geophys. Res.-Atmos., 110, D21105, https://doi.org/10.1029/2005JD005763, 2005. a
Bozzo, A., Doutriaux-Boucher, M., Jackson, J., Spezzi, L., Lattanzio, A., and Watts, P. D.: First Release of the Optimal Cloud Analysis Climate Data Record from the EUMETSAT SEVIRI Measurements 2004–2019, Remote Sensing, 16, https://doi.org/10.3390/rs16162989, 2024. a
Cecil, D. J., Goodman, S. J., Boccippio, D. J., Zipser, E. J., and Nesbitt, S. W.: Three Years of TRMM Precipitation Features. Part I: Radar, Radiometric, and Lightning Characteristics, Mon. Weather Rev., 133, 543–566, https://doi.org/10.1175/MWR-2876.1, 2005. a
Cecil, D. J., Buechler, D. E., and Blakeslee, R. J.: Gridded lightning climatology from TRMM-LIS and OTD: Dataset description, Atmos. Res., 135–136, 404–414, https://doi.org/10.1016/j.atmosres.2012.06.028, 2014. a, b, c
Cecil, D. J., Buechler, D. E., Lang, T. J., Virts, K. S., and Mach, D. M.: Lightning Climatology Datasets from TRMM LIS, ISS LIS, and OTD, J. Appl. Meteorol. Clim., 65, 51–72, https://doi.org/10.1175/JAMC-D-25-0110.1, 2026. a, b, c, d, e, f
Chen, Z., Qie, X., Sun, J., Xiao, X., Zhang, Y., Cao, D., and Yang, J.: Evaluation of Fengyun-4A Lightning Mapping Imager (LMI) Performance during Multiple Convective Episodes over Beijing, Remote Sensing, 13, 1746, https://doi.org/10.3390/rs13091746, 2021. a
Christian, H. J., Blakeslee, R. J., Boccippio, D. J., Boeck, W. L., Buechler, D. E., Driscoll, K. T., Goodman, S. J., Hall, J. M., Koshak, W. J., Mach, D. M., and Stewart, M. F.: Global Frequency and Distribution of Lightning as Observed from Space by the Optical Transient Detector, J. Geophys. Res.-Atmos., 108, 4005, https://doi.org/10.1029/2002JD002347, 2003. a, b
Enno, S.-E., Anderson, G., and Sugier, J.: ATDnet Detection Efficiency and Cloud Lightning Detection Characteristics from Comparison with the HyLMA during HyMeX SOP1, J. Atmos. Ocean. Tech., 33, 1899–1911, https://doi.org/10.1175/JTECH-D-15-0256.1, 2016. a
Enno, S.-E., Sugier, J., Alber, R., and Seltzer, M.: Lightning Flash Density in Europe Based on 10 Years of ATDnet Data, Atmos. Res., 235, 104769, https://doi.org/10.1016/j.atmosres.2019.104769, 2020. a, b, c
Frierson, D. M. W. and Davis, N. A.: The Seasonal Cycle of Midlatitude Static Stability over Land and Ocean in Global Reanalyses, Geophys. Res. Lett., 38, L13803, https://doi.org/10.1029/2011GL047747, 2011. a
Füllekrug, M., Williams, E., Price, C., Goodman, S., Holzworth, R., Enno, S.-E., and Viticchiè, B.: Novel lightning flash densities from space [in “State of the Climate in 2024”], B. Am. Meteorol. Soc., 106, S85–S86, https://doi.org/10.1175/2025BAMSStateoftheClimate.1, 2025. a
Goodman, S. J., Blakeslee, R. J., Koshak, W. J., Mach, D., Bailey, J., Buechler, D., Carey, L., Christian, H., Doswell, C., Fedor, J., et al.: The GOES-R Geostationary Lightning Mapper (GLM), Atmos. Res., 125, 34–49, https://doi.org/10.1016/j.atmosres.2013.01.006, 2013. a
GOES-R Algorithm Working Group and GOES-R Series Program: NOAA GOES-R Series Geostationary Lightning Mapper (GLM) Level 2 Lightning Detection: Events, Groups, and Flashes, NOAA National Centers for Environmental Information [data set], https://doi.org/10.7289/V5KH0KK6, 2018. a
Heckman, S.: ENTLN status update, in: XV international conference on atmospheric electricity, National Weather Service, Norman, Oklahoma, USA, 15–20 June 2014. a
Holle, R. L. and Murphy, M. J.: Lightning over Three Large Tropical Lakes and the Strait of Malacca: Exploratory Analyses, Mon. Weather Rev., 145, 4559–4573, https://doi.org/10.1175/MWR-D-17-0010.1, 2017. a
Holmlund, K., Counet, P., Fadrique, F. M., Schmid, A., Bojkov, B., Munro, R., Grandell, J., and Obligis, E: Meteosat Third Generation (MTG): Continuation and Innovation of Observations from Geostationary Orbit, B. Am. Meteorol. Soc., 102, E990–E1015, https://doi.org/10.1175/BAMS-D-19-0304.1, 2021. a
Holmlund, K., Counet, P., Fadrique, F. M., Schmid, A., Bojkov, B., Munro, R., Grandell, J., and Obligis, E.: The EUMETSAT satellite programmes and data services, Journal of the European Meteorological Society, 2, 100005, https://doi.org/10.1016/j.jemets.2024.100005, 2025. a
Kigotsi, J. K., Soula, S., and Georgis, J.-F.: Comparison of lightning activity in the two most active areas of the Congo Basin, Nat. Hazards Earth Syst. Sci., 18, 479–489, https://doi.org/10.5194/nhess-18-479-2018, 2018. a
Kiwanuka-Tondo, J., Semazzi, F., and Pettiway, K.: Climate Risk Communication of Navigation Safety and Climate Conditions over Lake Victoria Basin: Exploring Perceptions and Knowledge of Indigenous Communities, Cogent Social Sciences, 5, 1588 485, https://doi.org/10.1080/23311886.2019.1588485, 2019. a
Lay, E. H., Holzworth, R. H., Rodger, C. J., Thomas, J. N., Pinto Jr., O., and Dowden, R. L.: WWLL global lightning detection system: Regional validation study in Brazil, Geophys. Res. Lett., 31, https://doi.org/10.1029/2003GL018882, 2004. a
Marlton, G., Hare, B., Scholten, O., Protts, M., Stone, E., Twelves, S., and Devoto, F.: Mapping out lightning processes in both the VHF and VLF using LOFAR and the Met Office’s lightning detection system, LEELA, EGU General Assembly 2024, Vienna, Austria, 14–19 Apr 2024, EGU24-11101, https://doi.org/10.5194/egusphere-egu24-11101, 2024. a
Murphy, M. J. and Nag, A.: Cloud lightning performance and climatology of the US based on the upgraded US National Lightning Detection Network, in: Seventh Conf. on the Meteorological Applications of Lightning Data, Phoenix, Arizona, USA, 4–8 January 2015, American Meteorological Society (AMS), AMS Conference paper 262391, 2015. a
Murphy, M. J., Demetriades, N. W. S., and Nag, A.: Enhanced cloud lightning performance of the U.S. National Lightning Detection Network, in: Proceedings of the 23rd International Lightning Detection Conference (ILDC), Tucson, Arizona, USA, 18–19 March 2014, Vaisala Inc., 2014. a
Nicholson, S. E.: Lake-effect rainfall over Africa's great lakes and other lakes in the rift valleys, J. Great Lakes Res., 49, 101971, https://doi.org/10.1016/j.jglr.2021.12.004, 2023. a
Pan, L., Liu, D., Qie, X., Wang, D., and Zhu, R.: Land-sea contrast in the lightning diurnal variation as observed by the WWLLN and LIS/OTD data, Acta Meteorol. Sin., 27, 591–600, https://doi.org/10.1007/s13351-013-0408-0, 2013. a
Poelman, D. R., Schulz, W., Diendorfer, G., and Bernardi, M.: The European lightning location system EUCLID – Part 2: Observations, Nat. Hazards Earth Syst. Sci., 16, 607–616, https://doi.org/10.5194/nhess-16-607-2016, 2016. a, b
Price, C., Yair, Y., and Asfur, M.: East African Lightning as a Precursor of Atlantic Hurricane Activity, Geophys. Res. Lett., 34, L09802, https://doi.org/10.1029/2006GL028884, 2007. a
Reap, R. and MacGorman, D.: Cloud-to-Ground Lightning: Climatological Characteristics and Relationships to Model Fields, Radar Observations, and Severe Local Storms, Mon. Weather Rev., 117, https://doi.org/10.1175/1520-0493(1989)117<0518:CTGLCC>2.0.CO;2, 1989. a
Roberts, R. D., Goodman, S. J., Wilson, J. W., Watkiss, P., Powell, R. P., Petersen, R. A., Bain, C., Faragher, J., Chang'a, L. B., Kapkwomu, J. K., Oloo, P. N., Sebaziga, J. N., Hartley, A., Donovan, T., Mittermaier, M., and Lee, S.-D.: Taking the HIGHWAY to Save Lives on Lake Victoria, B. Am. Meteorol. Soc., 103, E485–E510, https://doi.org/10.1175/BAMS-D-20-0290.1, 2022. a
Rudlosky, S. D. and Virts, K. S.: Dual Geostationary Lightning Mapper Observations, Mon. Weather Rev., 149, 979–998, https://doi.org/10.1175/MWR-D-20-0242.1, 2021. a, b
Rudlosky, S. D., Goodman, S. J., Virts, K. S., and Bruning, E. C.: Initial Geostationary Lightning Mapper Observations, Geophys. Res. Lett., 46, 1097–1104, https://doi.org/10.1029/2018GL081052, 2019. a, b, c, d
Said, R. K. and Murphy, M. J.: GLD360 Upgrade: Performance Analysis and Applications, in: 24th International Lightning Detection Conference/6th International Lightning Meteorology Conference, Vaisala, San Diego, CA, 18–21 April 2016, https://www.vaisala.com/sites/default/files/documents/Ryan Said and Martin Murphy. GLD360 Upgrade Performance Analysis and Applications.pdf (last access: 16 October 2026), 2016. a, b
Said, R. K., Cohen, M. B., and Inan, U. S.: Highly intense lightning over the oceans: Estimated peak currents from global GLD360 observations, J. Geophys. Res.-Atmos., 118, 6905–6915, https://doi.org/10.1002/jgrd.50508, 2013. a
Schulz, W., Diendorfer, G., Pedeboy, S., and Poelman, D. R.: The European lightning location system EUCLID – Part 1: Performance analysis and validation, Nat. Hazards Earth Syst. Sci., 16, 595–605, https://doi.org/10.5194/nhess-16-595-2016, 2016. a, b
Soula, S., Kigotsi Kasereka, J., Georgis, J.-F., and Barthe, C.: Lightning Climatology in the Congo Basin, Atmos. Res., 178–179, 304–319, https://doi.org/10.1016/j.atmosres.2016.04.006, 2016. a, b, c
Sparrow, J. G. and Ney, E. P.: Lightning Observations by Satellite, Nature, 232, 540–541, https://doi.org/10.1038/232540a0, 1971. a
Virts, K. S. and Goodman, S. J.: Prolific Lightning and Thunderstorm Initiation over the Lake Victoria Basin in East Africa, Mon. Weather Rev., 148, 1971–1985, https://doi.org/10.1175/MWR-D-19-0260.1, 2020. a
Virts, K. S. and Koshak, W. J.: Bayesian Analysis of the Detection Performance of the Geostationary Lightning Mappers, J. Atmos. Ocean. Tech., 42, 935–947, https://doi.org/10.1175/JTECH-D-24-0130.1, 2025. a, b, c
Viticchié, B., Enno, S.-E., Navia, D., Avbelj, J., and Grandell, J.: Meteosat Third Generation Lightning Imager Detection Performances, EGUsphere [preprint], https://doi.org/10.5194/egusphere-2026-3177, 2026. a, b, c, d, e, f, g, h, i
Vorpahl, J. A., Sparrow, J. G., and Ney, E. P.: Satellite Observations of Lightning, Science, 169, 860–862, https://doi.org/10.1126/science.169.3948.860, 1970. a
Waliser, D. E. and Gautier, C.: A Satellite-Derived Climatology of the ITCZ, J. Climate, 6, 2162–2174, https://doi.org/10.1175/1520-0442(1993)006<2162:ASDCOT>2.0.CO;2, 1993. a
Xian, D., Zhang, P., Gao, L., Sun, R., Zhang, H., and Jia, X.: Fengyun Meteorological Satellite Products for Earth System Science Applications, Adv. Atmos. Sci., 38, 1267–1284, https://doi.org/10.1007/s00376-021-0425-3, 2021. a
Zhang, D., Cooper, M. A., Holle, R. L., Vagasky, C., Akantambira, B., Tumuhimbise, I., Omara, M., Lusambu, C. T. M., Kisha, J., Atwiine, G., Hunt, H. G. P., Schumann, C., and Nixon, K. J.: Empowering Africa: Advancing Lightning Safety and Research Initiatives, B. Am. Meteorol. Soc., 107, https://doi.org/10.1175/BAMS-D-24-0310.1, 2026. a