
the Creative Commons Attribution 4.0 License.
the Creative Commons Attribution 4.0 License.
 | 29 Oct 2026
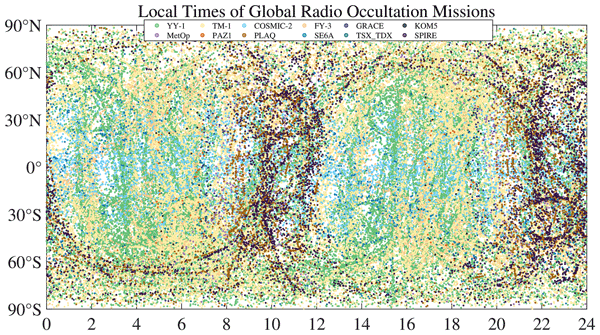
Global sampling characteristics and coverage complementarity of 12 GNSS radio occultation constellations
Wenqiang Lu
Ran Chen
Na Xu

Xiangguang Meng
Lei Xue
Mi Liao
Yan Liu
Peng Guo
Guanglin Yang
Xiuqing Hu
Xiangang Zhao
Yueqiang Sun
This study analyzes observations from COSMIC-2, FY-3, GRACE-C/D, KOMPSAT-5, MetOp-B/C, PAZ, PlanetiQ, Sentinel-6A, Spire, TerraSAR-X/TanDEM-X, TM-1, and YY-1 collected during 1–7 January 2026 to compare their spatial distributions, grid-cell occupancy, area-weighted surface coverage, and local-time sampling; quantify the sampling gains achieved through multi-mission integration; and assess changes in sampling when COSMIC-2 is excluded. The results show that orbital configuration determines latitudinal and local-time sampling, whereas event abundance and constellation size primarily control grid coverage. Large constellations such as YY-1 and TM-1 provide the strongest global continuity, while missions with different orbital inclinations offer complementary sampling across latitude bands. Combining all missions substantially reduces spatial gaps and provides area-weighted global surface coverage of 99.71 % and 99.99 % at 1.0 and 2.0° resolutions,respectively. Within 6 h windows, the mean area-weighted joint coverage reaches 76.79 % at 2.0° resolution. Multi-mission integration also broadens local-time cycle. Excluding COSMIC-2 reduces the number of RO events within 5° S–5° N by 21.75 %, although the remaining 11 missions retain most of the mid- and high-latitude sampling. These results characterize the sampling complementarity and resilience of the multi-mission observing system.
- Article
(17044 KB) - Full-text XML
- BibTeX
- EndNote


Global navigation satellite system (GNSS) radio occultation (RO) is a space-based sounding technique that uses the refraction, bending, and propagation delay experienced by GNSS signals as they traverse the Earth's atmosphere and ionosphere. These measurements are inverted to obtain vertical profiles of atmospheric refractivity and, subsequently, key physical parameters such as temperature, pressure, water vapor, and ionospheric electron density (Kursinski et al., 1997). GNSS-RO measurements rely on precise timing and phase observations and are only weakly affected by clouds and precipitation. The technique therefore provides all-weather global coverage, high vertical resolution, and strong long-term stability, making it valuable for numerical weather prediction, climate monitoring, and space-weather research (Ho et al., 2012).
GNSS-RO originated with the GPS/MET demonstration mission in the late twentieth century. During its operation, GPS/MET acquired extensive observations and successfully retrieved neutral-atmosphere profiles from 0 to 60 km, demonstrating the feasibility of GNSS-RO atmospheric sounding (Rocken et al., 1997). Subsequent single-satellite missions, including CHAMP (Wickert et al., 2001) and GRACE (Beyerle et al., 2005), advanced RO data processing, retrieval algorithms, and applications. The six-satellite COSMIC-1 constellation, launched in 2006, enabled the first large-scale operational use of GNSS-RO observations and substantially increased the number of global RO profiles, marking an important transition from technology demonstration to operational application (Anthes et al., 2008). Later missions, including the MetOp series (Bonnedal et al., 2010), the FY-3 series (Bai et al., 2014), COSMIC-2 (Schreiner et al., 2020), and Sentinel-6/Jason-CS (Donlon et al., 2021), have provided stable observations and broadened the use of GNSS-RO in numerical weather prediction, climate monitoring, and space-weather research. More recently, low-Earth-orbit small-satellite constellations and commercial missions such as GeoOptics/CICERO, Spire, PlanetiQ, TM-1, and YY-1 have further increased the number and spatial sampling event-count of RO events, creating a multi-source observing system that combines demonstration missions, operational meteorological satellites, and commercial constellations.
Advances in low-Earth-orbit platforms, spaceborne GNSS receivers, and RO retrieval techniques have transformed GNSS-RO from a small number of demonstration missions into a global system of concurrent missions and constellations. Differences in orbital altitude, inclination, local-time configuration, constellation size, and received signal systems produce distinct global distributions, latitudinal coverage patterns, local-time sampling, and observation densities. Low-inclination missions generally enhance sampling at low and middle latitudes, high-inclination or near-polar missions improve middle- and high-latitude coverage, and large or commercial constellations improve global coverage continuity through higher observation frequencies.
For global atmospheric monitoring and data assimilation, the value of RO data depends not only on the retrieval accuracy of individual profiles but also on the spatiotemporal distribution of the observations. Insufficient sampling within particular latitude bands, local-time intervals, or spatial grids can reduce the representativeness of a mission for weather systems, climate background states, and regional atmospheric structures. Compared with a single mission, joint multi-mission observations exploit complementary orbital configurations to reduce spatial gaps, improve uneven local-time sampling, and increase the continuity and stability of global RO observations. A systematic assessment of individual and combined missions in terms of spatial coverage, grid density, and local-time distribution is therefore important.
The relevance of RO sampling depends on the intended application. For numerical weather prediction (NWP), observations distributed across the globe within relatively short assimilation windows can constrain spatially varying analysis errors and evolving weather systems. However, forecast impact does not necessarily increase linearly with observation number because it also depends on observation quality, error characteristics, bias treatment, redundancy, and the configuration of the data-assimilation system. Application-specific assimilation experiments, such as those coordinated within the Radio Occultation Modeling Experiment (ROMEX), are therefore required to quantify the actual forecast impact of increased RO sampling (Anthes et al., 2024).
For climate applications, stable sampling across latitude and local time is important because incomplete sampling of atmospheric variability, including the diurnal and semidiurnal cycles, can introduce sampling errors into gridded climate records. Changes in the composition and orbital configuration of the RO observing system may also introduce time-dependent sampling differences if they are not properly accounted for (Gleisner et al., 2020). For ionospheric and space-weather applications, electron density and ionospheric irregularities exhibit pronounced dependence on geomagnetic latitude and local time, particularly in the equatorial ionosphere after sunset (Hocke et al., 2002). Multi-mission integration is therefore valuable because complementary orbital configurations reduce spatial and local-time gaps. Nevertheless, the coverage metrics analyzed here describe observational availability and sampling representativeness rather than direct changes in forecast skill, climate-record uncertainty, or space-weather prediction performance. This study examines major global GNSS-RO missions, including COSMIC-2, FY-3, GRACE-C/D, KOMPSAT-5, MetOp-B/C, PAZ, PlanetiQ, Sentinel-6A, Spire, TerraSAR-X/TanDEM-X, TM-1, and YY-1. Using RO observations during 1–7 January 2026, we analyze their global spatial distributions, grid-based coverage characteristics, and local-time sampling patterns, and evaluate the improvement in global coverage obtained through multi-mission combinations.
2.1 GNSS-RO missions
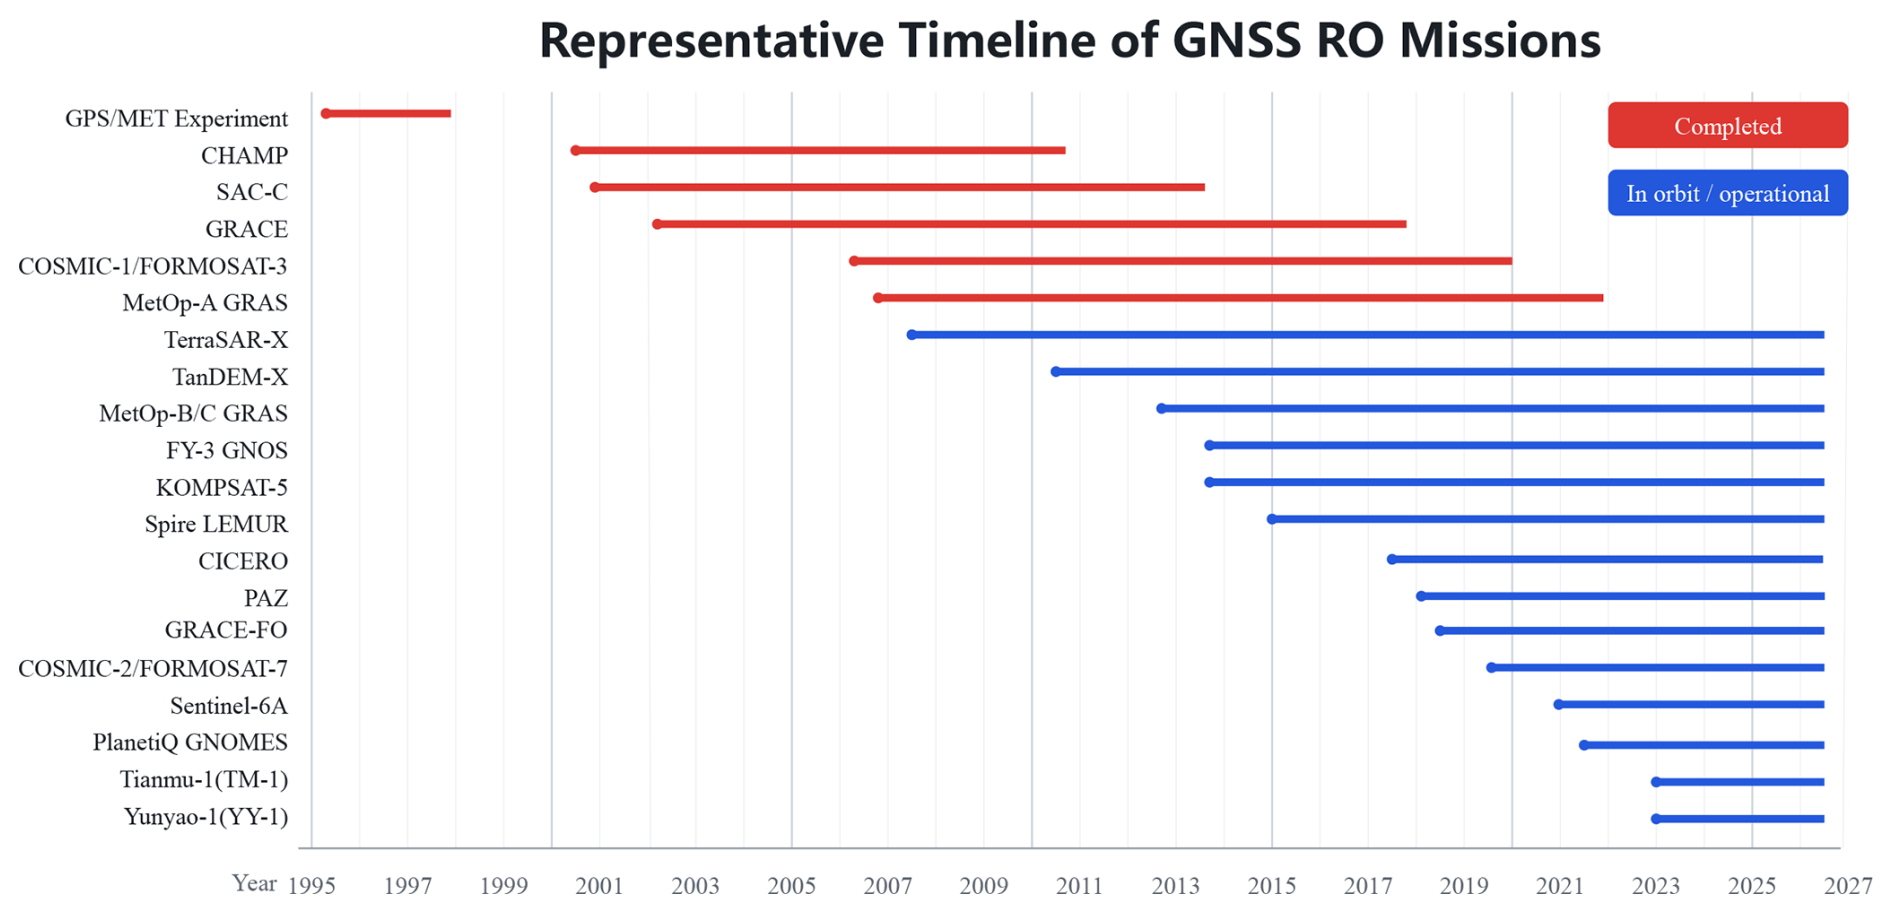
To place the missions within the global observing system, Fig. 1 summarizes the development of GNSS-RO from GPS/MET technology demonstration, through single-satellite and operational constellation missions, to the expansion of commercial constellations. Overall, GNSS-RO has evolved from technology demonstration to operational application and from a small number of individual satellites to coordinated multi-constellation observations.
COSMIC-2 (Constellation Observing System for Meteorology, Ionosphere and Climate-2) is a next-generation operational GNSS-RO constellation jointly implemented by the United States National Oceanic and Atmospheric Administration and Taiwan. It comprises six low-Earth-orbit satellites launched in June 2019. COSMIC-2 operates in low-inclination, near-circular, non-sun-synchronous orbits at approximately 520–550 km and an inclination of approximately 24°, primarily covering equatorial and low-latitude regions (Schreiner et al., 2020). Its receivers support multi-frequency GNSS RO observations (L1, L2, and L5), and the six-satellite constellation can provide up to approximately 5000 RO profiles per day
Fengyun-3 (FY-3) is China's operational polar-orbiting meteorological satellite series and has carried the GNSS Occultation Sounder (GNOS) since FY-3C (Bai et al., 2014). FY-3D (Du et al., 2019), FY-3E (Zhang et al., 2022), FY-3F (Miao et al., 2025), and FY-3G (Zhang et al., 2023) occupy different local-time orbits: FY-3E is in a dawn-dusk orbit, FY-3F in a morning orbit, FY-3D in an afternoon orbit, and FY-3G in a low-inclination precipitation-monitoring orbit. Most FY-3 satellites have inclinations near 98°, whereas FY-3G has an inclination near 50°. Their coordinated operation forms the core of China's operational RO observing system.
The twin-satellite GRACE mission was launched in 2002 primarily to observe the Earth's gravity field and also carried GNSS receivers for RO observations. The satellites operated in near-polar orbits at approximately 500 km and an inclination of approximately 89°. GRACE RO data contributed to early studies of atmospheric structure and retrieval algorithms (Beyerle et al., 2005). The GRACE Follow-On (GRACE-FO; GRACE-C/D) twin-satellite mission continues the gravity-mapping mission of the original GRACE satellites (Kornfeld et al., 2019). Rising RO observations from GF1 and setting RO observations from GF2 have been continuously available since March 2020 and September 2021, respectively (Schmidt et al., 2020; Schmidt et al., 2022). The two-satellite system provides approximately 400 atmospheric profiles per day for climate applications and assimilation into numerical weather prediction models (Schmidt et al., 2022).
KOMPSAT-5 is a Korean multipurpose satellite launched in 2013. Although its primary payload is synthetic aperture radar (SAR), it also supports GNSS-RO and precise orbit determination. It operates in a near-polar, sun-synchronous orbit at an altitude of approximately 550 km (Roh and Hwang, 2020).
MetOp-02 (MetOp-A), MetOp-01 (MetOp-B), and MetOp-03 (MetOp-C) were the three first-generation satellites of the EUMETSAT Polar System (EPS). They were launched on 19 October 2006, 17 September 2012, and 7 November 2018, respectively. All three satellites were placed in near-circular, sun-synchronous polar orbits at an altitude of approximately 817 km and an inclination of approximately 98.7°. Their nominal mid-morning orbit configuration had descending-node and ascending-node local times of approximately 09:30 and 21:30 LT, respectively. Each satellite was equipped with the GNSS Receiver for Atmospheric Sounding (GRAS), which receives dual-frequency GPS L1/L2 signals and retrieves vertical profiles of atmospheric refractivity, temperature, humidity, and ionospheric electron density (Righetti et al., 2020). MetOp-A was retired in November 2021; therefore, only MetOp-B and MetOp-C were operational during the study period in January 2026.
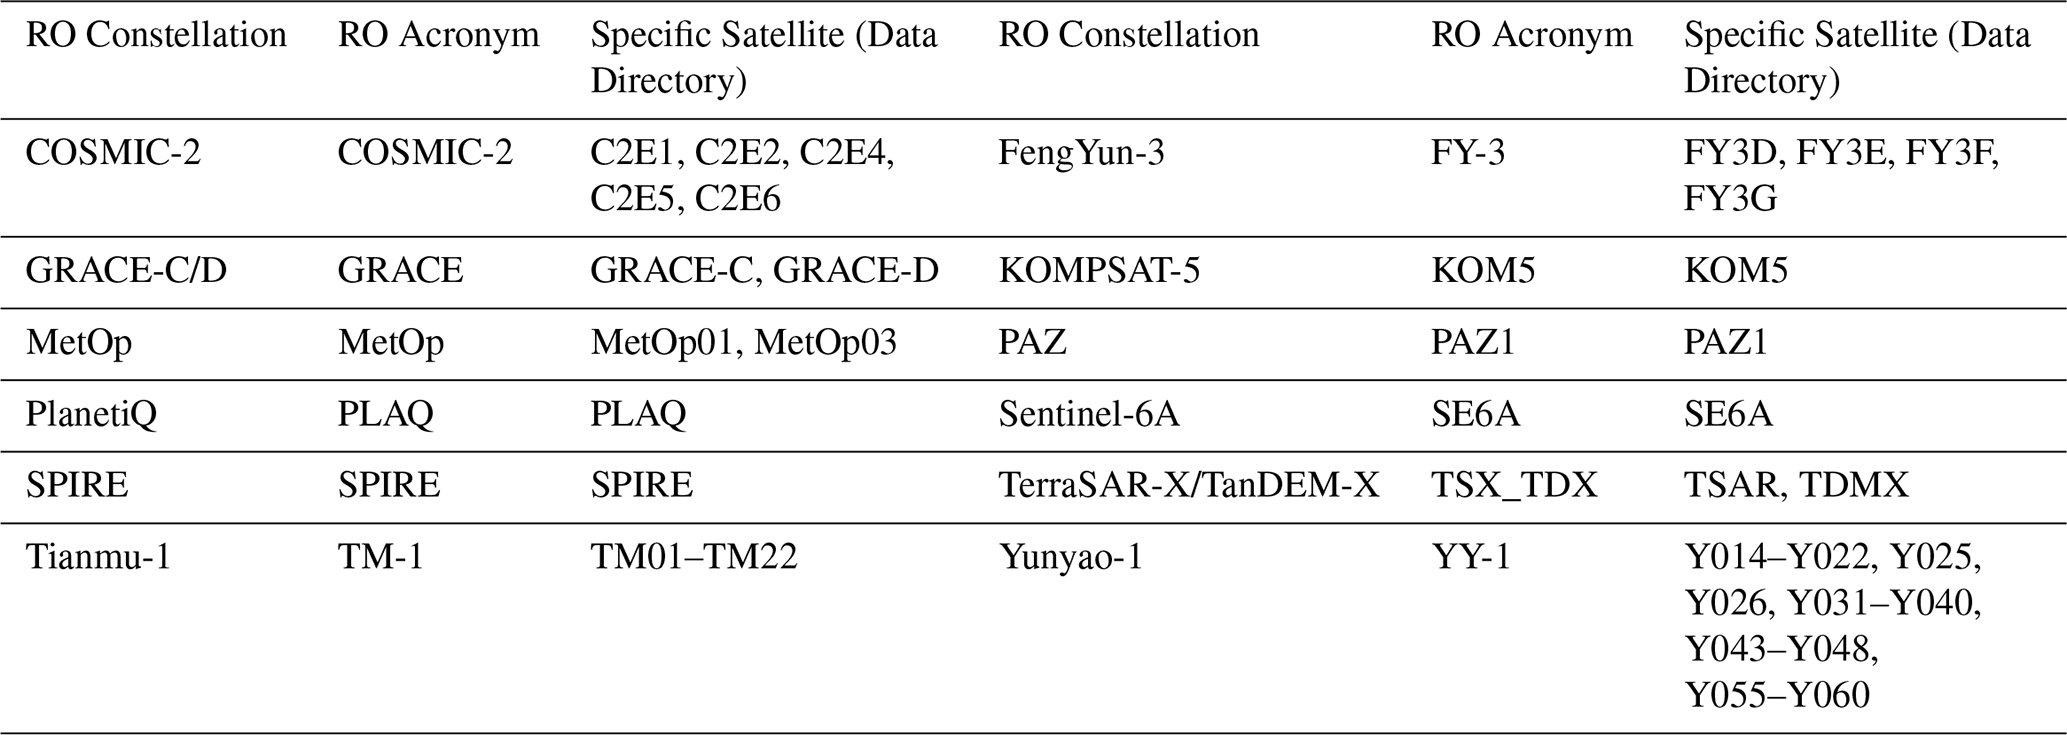
Table 1Names and abbreviations of the 12 GNSS-RO mission systems included in the quantitative analysis.
PAZ (SEOSAR/Paz) is an X-band SAR Earth-observation satellite operated by the Spanish company Hisdesat. It was launched from Vandenberg Air Force Base on a SpaceX Falcon 9 rocket on 22 February 2018. PAZ operates in a sun-synchronous low-Earth orbit at approximately 514 km, with an inclination of approximately 97.44° and an approximately 11 d repeat cycle. It flies in coordination with TerraSAR-X and TanDEM-X to enhance revisit capability. Its ascending-node equator-crossing local time is approximately 18:00 LT ± 0.25 h (Padullés et al., 2024).
GeoOptics operates the Community Initiative for Cellular Earth Remote Observation (CICERO) constellation of low-Earth-orbiting CubeSats, whose deployment began in 2017, to provide commercial GNSS-RO observations. Chang et al. (2022) evaluated the spatial coverage and measurement performance of GeoOptics RO data relative to the COSMIC missions. However, GeoOptics observations for 1–7 January 2026 were not available through either the GTS or the CMA-authorized data channels used in this study. GeoOptics/CICERO is therefore included in the mission overview but excluded from the quantitative comparison.
PlanetiQ is a US commercial remote-sensing company. Its GNSS-RO satellites are typically deployed in sun-synchronous orbits at approximately 620–645 km, with inclinations near 97.8° and orbital periods near 97 min. The typical equator-crossing local times are approximately 06:00/18:00 LT, providing stable solar illumination geometry (Zhran et al., 2024).
Sentinel-6A is a joint European-US operational altimetry satellite launched in 2020 and equipped with a GNSS-RO receiver. Its non-sun-synchronous orbit has an inclination of approximately 66° and provides complementary observations at low and middle latitudes (Paolella et al., 2025).
Spire Global operates a commercial constellation that collects GNSS-RO and GNSS reflectometry data using numerous LEMUR nanosatellites. More than one hundred satellites have been launched, forming one of the world's largest commercial GNSS-RO constellations. The satellites occupy multiple low-Earth-orbit planes, including several sun-synchronous planes, at altitudes of approximately 385–650 km. Orbital inclination and local solar time vary among launch batches (Masters et al., 2020).
TerraSAR-X and TanDEM-X are German twin SAR missions that also support GNSS-RO and precise orbit determination. They operate in near-polar, sun-synchronous orbits with an inclination of approximately 97.44° and a designed descending-node local time of 06:00 LT (Faller et al., 2007).
Tianmu-1 (TM-1) is China's first commercial GNSS-RO meteorological constellation. It comprises multiple networked small satellites in low-Earth orbit at approximately 520 km and an inclination near 97°. The receivers support GPS, BDS, Galileo, and GLONASS signals, substantially increasing global RO observation density (Li et al., 2025).
Yunyao-1 (YY-1) is an important component of China's new generation of commercial GNSS-RO constellations. The planned system comprises 90 satellites equipped with GNSS-RO instruments by the end of 2026 (Fu and Li, 2021). Its design combines 12 high-inclination orbital planes with six satellites per plane and six low-inclination planes with three satellites per plane. The constellation includes quasi-sun-synchronous orbits near 97° and low-inclination orbits near 50° at an altitude of approximately 500 km. This combination of orbital configurations further enhances coverage (Xu et al., 2025).
To keep figure legends concise and clear, standardized abbreviations are used for several missions. Table 1 lists the full mission names and abbreviations used in this study.
2.2 Data sources
This study used GNSS radio occultation (GNSS-RO) observations from 12 global systems during 1–7 January 2026. The data were obtained from the National Meteorological Information Centre (NMIC) in BUFR format and included observations disseminated through the Global Telecommunication System (GTS) and operational products authorized by the China Meteorological Administration from Tianmu and Yunyao companies. The dataset comprised observations from COSMIC-2, FY-3, GRACE-C/D, KOMPSAT-5, MetOp-B/C, PAZ, PlanetiQ, Sentinel-6A, Spire, TerraSAR-X/TanDEM-X, TM-1, and YY-1. It should be noted that the occultation data analyzed in this study represent only the observations accessible through the two aforementioned data channels. The BUFR records include bending angle, impact parameter, occultation tangent-point location, observation time, refractivity, and geometric height. Event latitude, longitude, time, and mission identifier were extracted to analyze global spatial distributions, grid coverage, local-time sampling, and the effects of multi-mission joint observations.
3.1 Coverage metrics and statistical methods
To characterize the global spatial sampling of each mission at a prescribed angular resolution r, the study domain was divided into regular latitude–longitude cells, and the number of RO events ni(r) in cell i was counted. A cell was considered occupied when it contained at least one RO event and blank when it contained no events.
Because regular latitude–longitude cells decrease in physical area toward the poles, we distinguish between the grid-cell occupancy fraction and the area-weighted surface-coverage fraction. The grid-cell occupancy fraction is defined as
where Nr is the total number of latitude–longitude cells at resolution r, and I is the indicator function. This metric describes the fraction of grid cells containing at least one observation, but it does not account for the variation in physical cell area with latitude.
The area-weighted surface-coverage fraction is therefore defined as
where Ai is the physical area of cell i. For a regular latitude–longitude grid,
where RE is the mean Earth radius, Δλ is the longitudinal width of the cell in radians, and ϕi,N and ϕi,S are its northern and southern latitude boundaries. The corresponding area-weighted blank fraction is
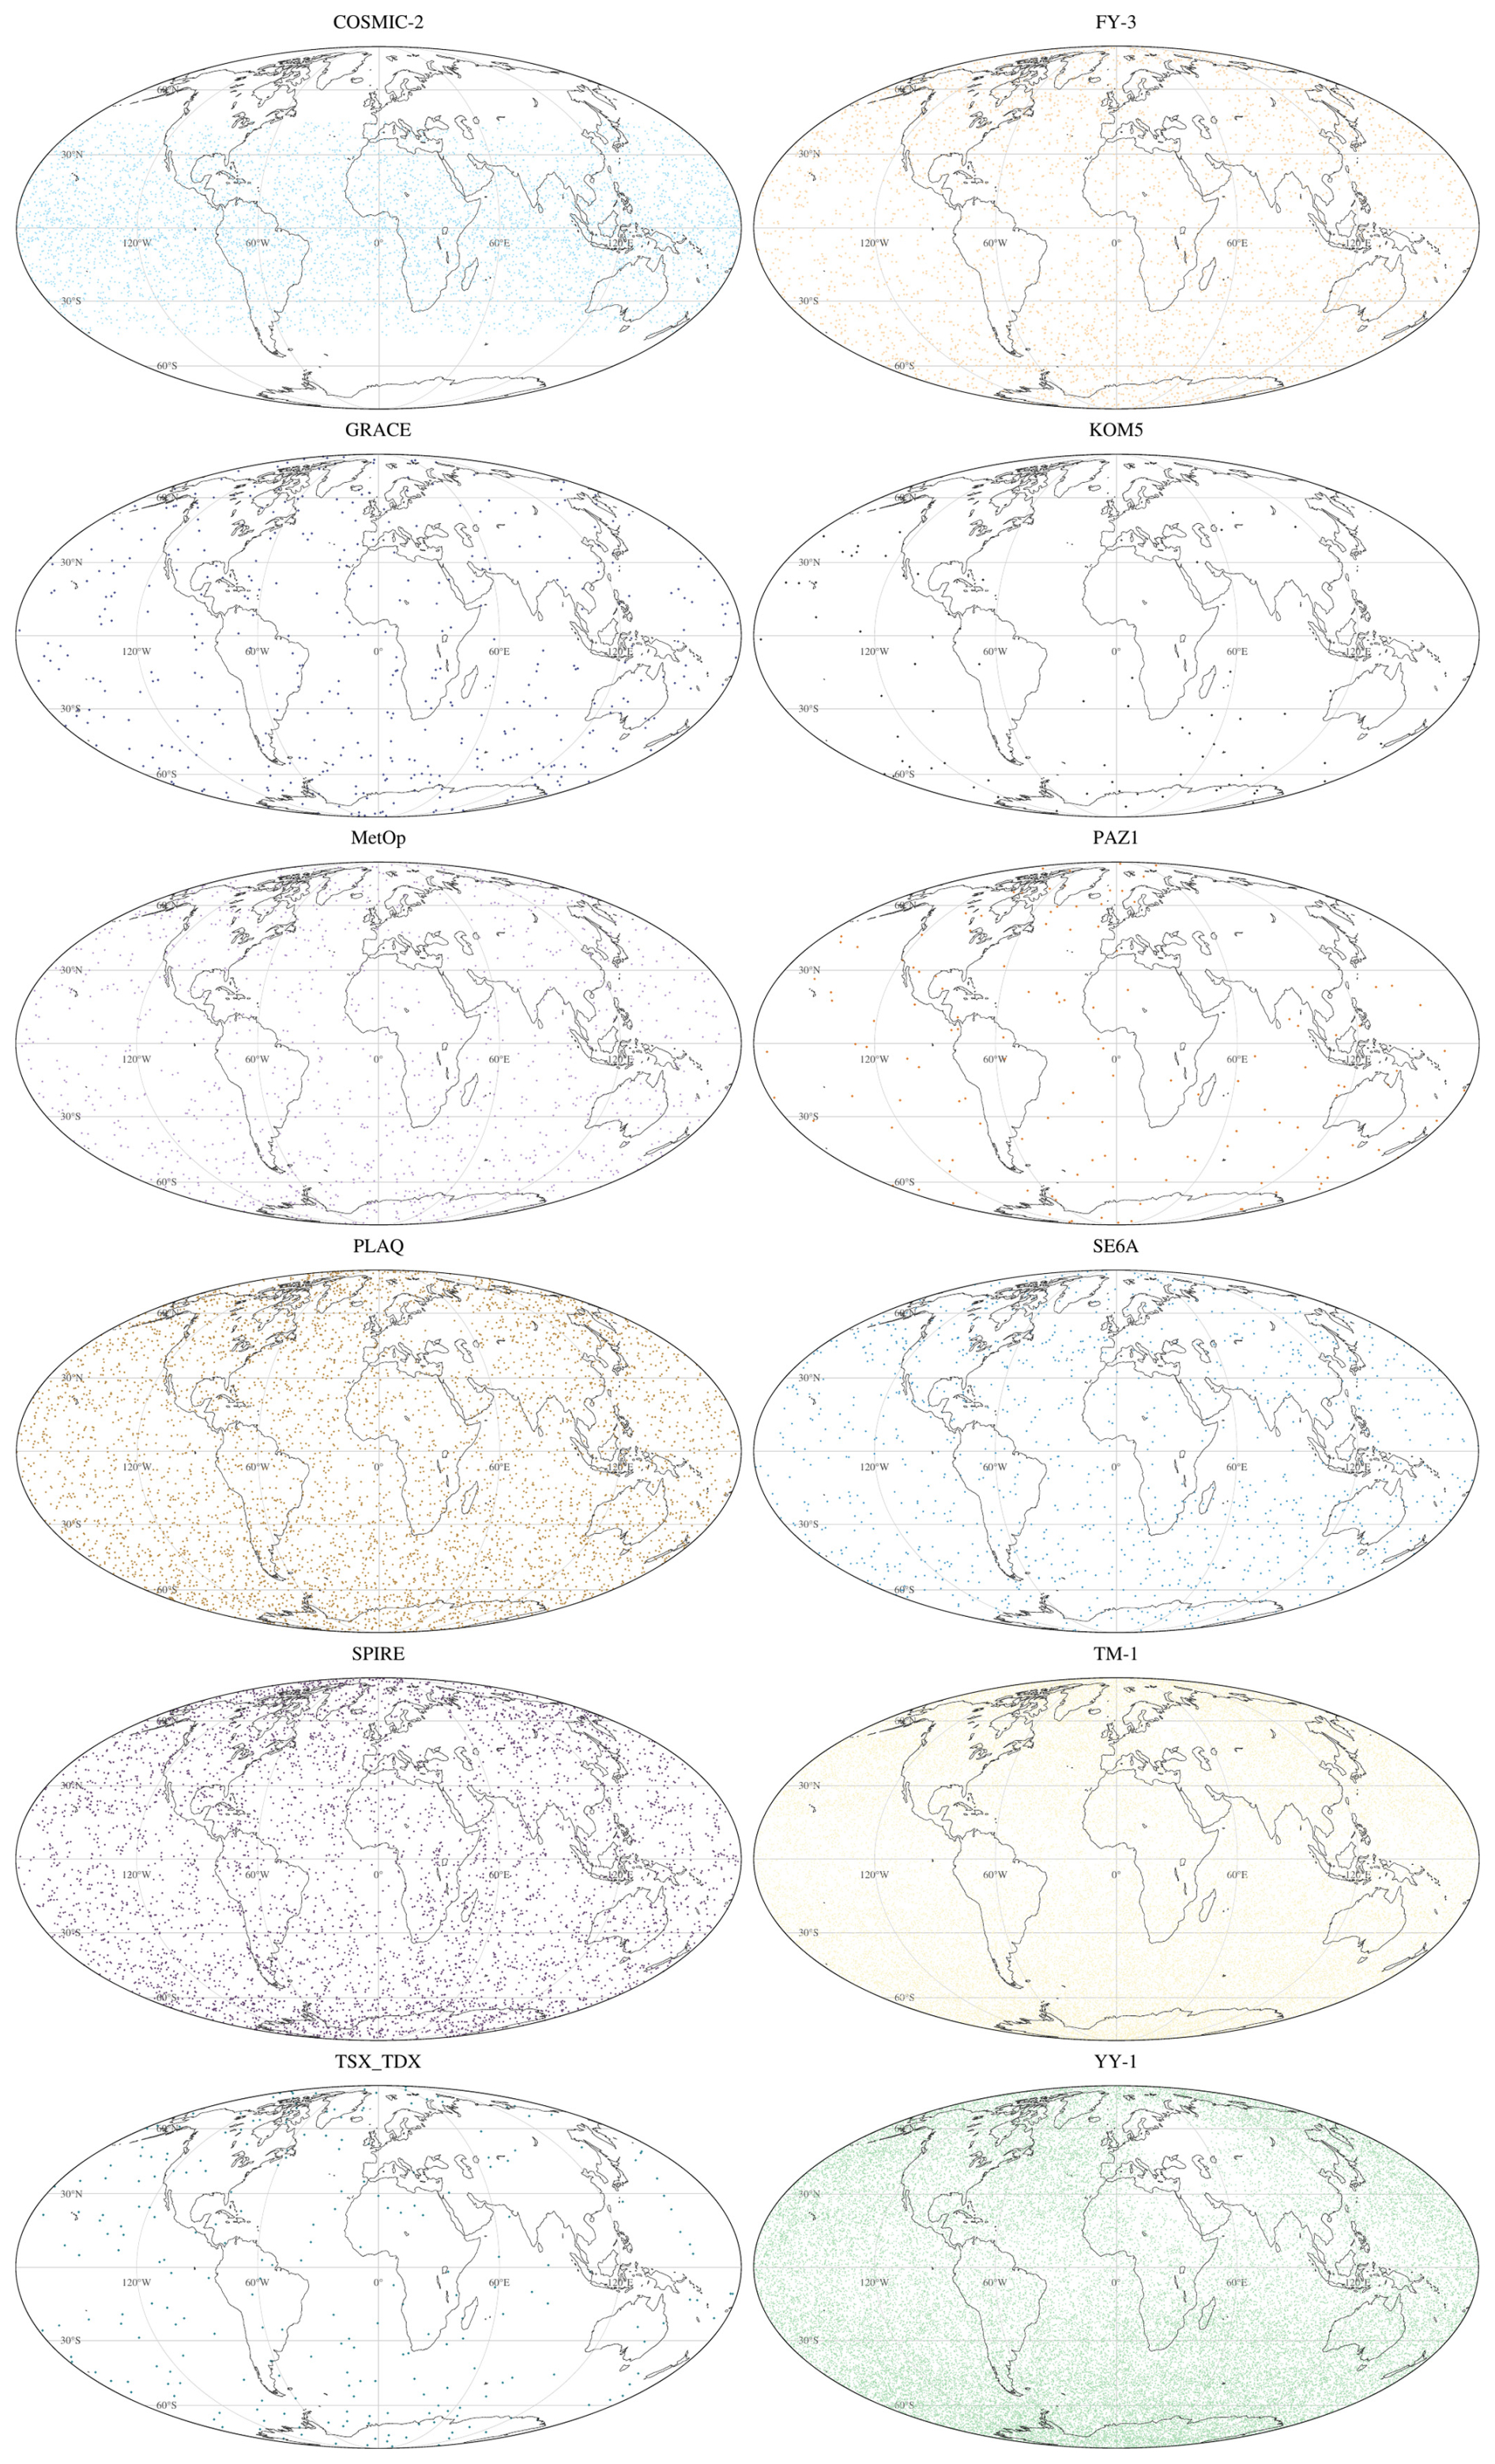
Figure 2Global distribution of radio occultation events from individual missions on 1 January 2026. The distributions are shown using a Mollweide equal-area projection.
3.2 Global spatial distributions
GNSS-RO events occur at the tangent points of signal paths between GNSS transmitters and receivers aboard low-Earth-orbit satellites. Figure 2 presents the global distributions of GNSS-RO events from COSMIC-2, FY-3, GRACE-C/D, KOMPSAT-5, MetOp-B/C, PAZ, PlanetiQ, Sentinel-6A, Spire, TerraSAR-X/TanDEM-X, TM-1, and YY-1 on 1 January 2026. During this 1 d period, YY-1 produced the largest number of events (42 391), followed by TM-1 (34 506), reflecting their comparatively large constellation sizes; the analysis included 33 YY-1 satellites and 22 TM-1 satellites. COSMIC-2 recorded the third-largest total (5613), followed by PlanetiQ (4658), Spire (4523), and FY-3 (3699). The low-inclination FY-3G satellite and YY-1 satellites 18–20 provided valuable supplementary observations at low latitudes, with FY-3G contributing 471 events and YY-1 satellites 18–20 contributing 1826 events within 30° S–30° N. Owing to its near-circular low-inclination orbit configuration, COSMIC-2 provided dense and nearly symmetric tropical coverage, with 2295 and 2270 events occurring within 30° S–0° and 0°–30° N, respectively. PlanetiQ and Spire produced broad latitudinal coverage, with moderately enhanced sampling in the middle-latitude bands. MetOp-B/C and Sentinel-6A produced 1153 and 1007 events, respectively, whereas GRACE-C/D, TerraSAR-X/TanDEM-X, and PAZ produced 401, 238, and 140 events, resulting in less distinct spatial patterns. KOMPSAT-5 produced the fewest events (73), resulting in a distribution too sparse to support the identification of a robust spatial pattern. Localized data gaps apparent in some mission distributions, particularly over the Russia-Ukraine region, may partly reflect regional GNSS interference. Using normalized RO signal-to-noise ratios at deeply occulted heights (HSL < −140 km), Wu (2024) identified enhanced jamming signatures over the Mediterranean, Eastern Europe, and the Middle East, with the enhancement extending toward Russia in 2022 and interpreted as likely related to the Russo–Ukrainian War. However, Wu detected jamming signatures rather than directly demonstrating a reduction in the number of retrieved atmospheric RO profiles. The gaps identified here may also result from quality-control screening, data transmission, or data-access limitations; therefore, their cause cannot be determined from the present dataset alone.
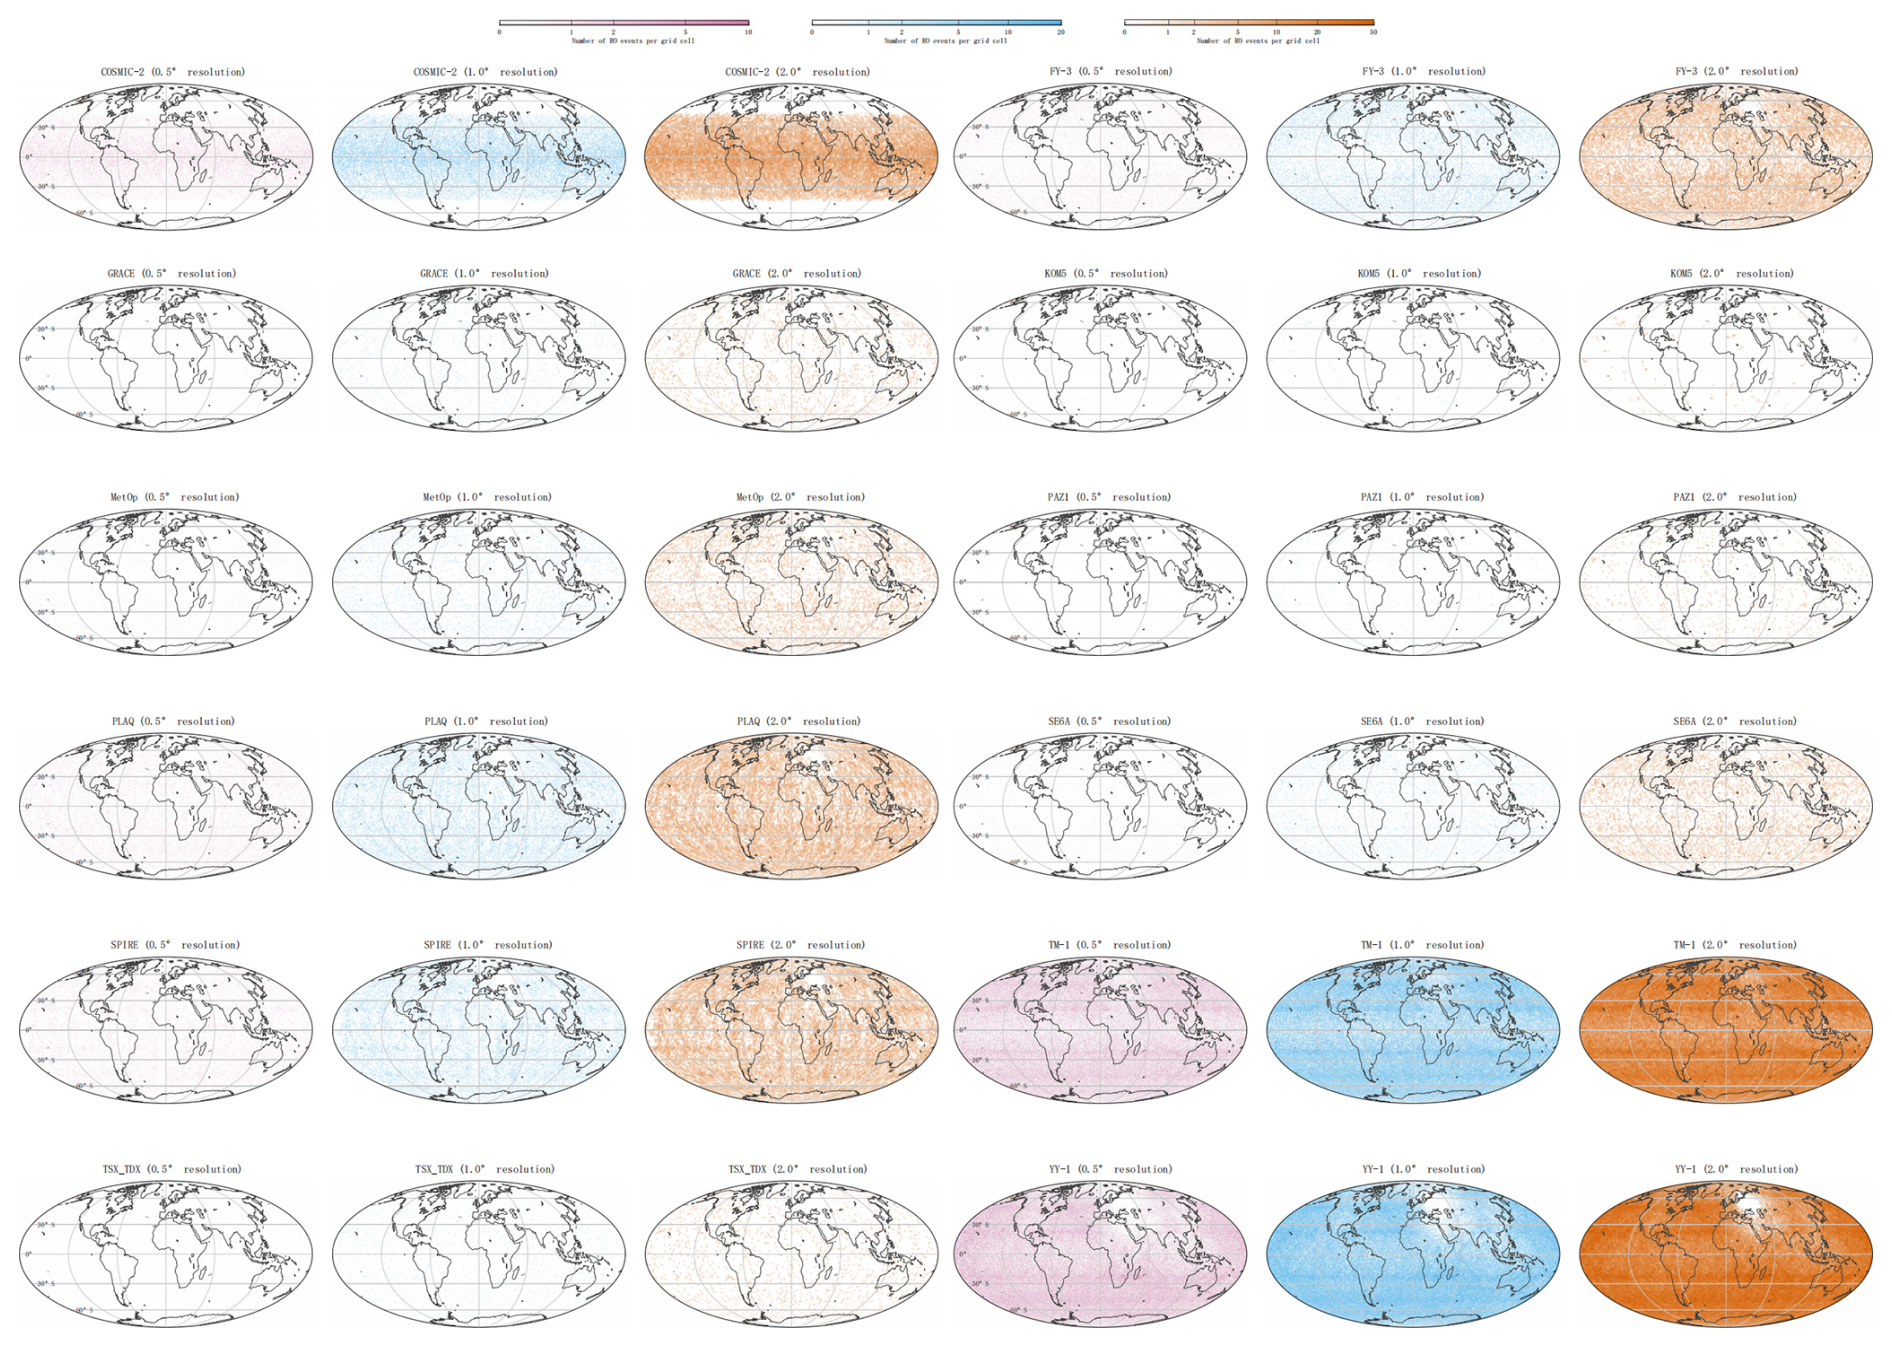
Figure 3Gridded spatial distributions of radio occultation events from individual missions during 1–7 January 2026. Colors represent the raw number of events within each latitude–longitude cell and are not normalized by physical cell area.
3.3 Grid-based spatial distributions
Figure 3 presents the gridded counts of GNSS-RO events during 1–7 January 2026 at spatial resolutions of 0.5, 1.0, and 2.0°. For all missions, the fraction of zero-event grids decreases as grid size increases, and the 7 d accumulation substantially improves spatial continuity relative to the daily distribution. At 0.5° resolution, TM-1 and YY-1 occupy substantially larger fractions of the latitude–longitude grid than the other missions, with blank-cell fractions of 41.60 % and 39.28 %, respectively, whereas all other missions retain blank-cell fractions above 88 %. At 1.0° resolution, TM-1 and YY-1 approach near-global continuity, with blank-grid fractions decreasing to 6.25 % and 9.38 %, respectively. At 2.0° resolution, TM-1 provides the most spatially continuous coverage, with only 0.69 % blank-cells and 16 089 nonzero grids, while YY-1 follows closely with 2.55 % blank-cells and 15 787 nonzero grids. YY-1, however, exhibits the largest local event count per grid cell, with a maximum of 64 events in a single 2.0° grid and 2002 grids containing at least 30 events; the corresponding values for TM-1 are 42 events and 294 grids. The selected heatmap limits of 15, 40, and 70 events for the 0.5, 1.0, and 2.0° maps, respectively, remain above the observed maxima for all missions, so the color scaling preserves the full event-count range without saturation. Based on blank-grid fractions, nonzero-grid continuity, and maximum grid-level event count per grid cell, the 12 systems can be broadly classified into three tiers. The broad-coverage tier comprises TM-1 and YY-1, which provide the most extensive and continuous global sampling across all three resolutions. The intermediate tier includes PlanetiQ, Spire, FY-3, COSMIC-2, MetOp-B/C, and Sentinel-6A. Within this tier, PlanetiQ, Spire, and FY-3 show relatively strong 2.0° coverage, with blank-grid fractions of 19.53 %, 20.81 %, and 26.44 %, respectively. COSMIC-2 shows a different pattern: its 2.0° blank-grid fraction is higher at 52.34 %, but its sampling is concentrated within low latitudes, where the maximum number of events in a single 2.0° grid reaches 19. MetOp-B/C and Sentinel-6A remain less continuous, with 2.0° blank-grid fractions of 62.30 % and 65.13 %, respectively. The sparse tier comprises GRACE-C/D, TerraSAR-X/TanDEM-X, PAZ, and KOMPSAT-5. Their 2.0° blank-grid fractions remain high, at 84.11 %, 87.72 %, 92.51 %, and 98.16 %, respectively, indicating that their observations are still spatially discontinuous even after 7 d accumulation. Overall, the 7 d results show that TM-1 and YY-1 dominate the globalgridded event-count distribution, PlanetiQ, Spire, FY-3, and COSMIC-2 provide useful supplementary coverage with mission-specific spatial patterns, and the remaining smaller missions contribute more localized and sparse observations.
3.4 Local-time distributions
To analyze within-day temporal sampling, the UTC time of each event was converted to local time at the tangent point. Local time depends on both UTC and tangent-point longitude. Because the Earth rotates by approximately 15° per hour, local time was calculated as follows:
In Eq. (5), LT is the local time of an RO event, UTC is the event time in coordinated universal time, and longitude is positive eastward and negative westward.
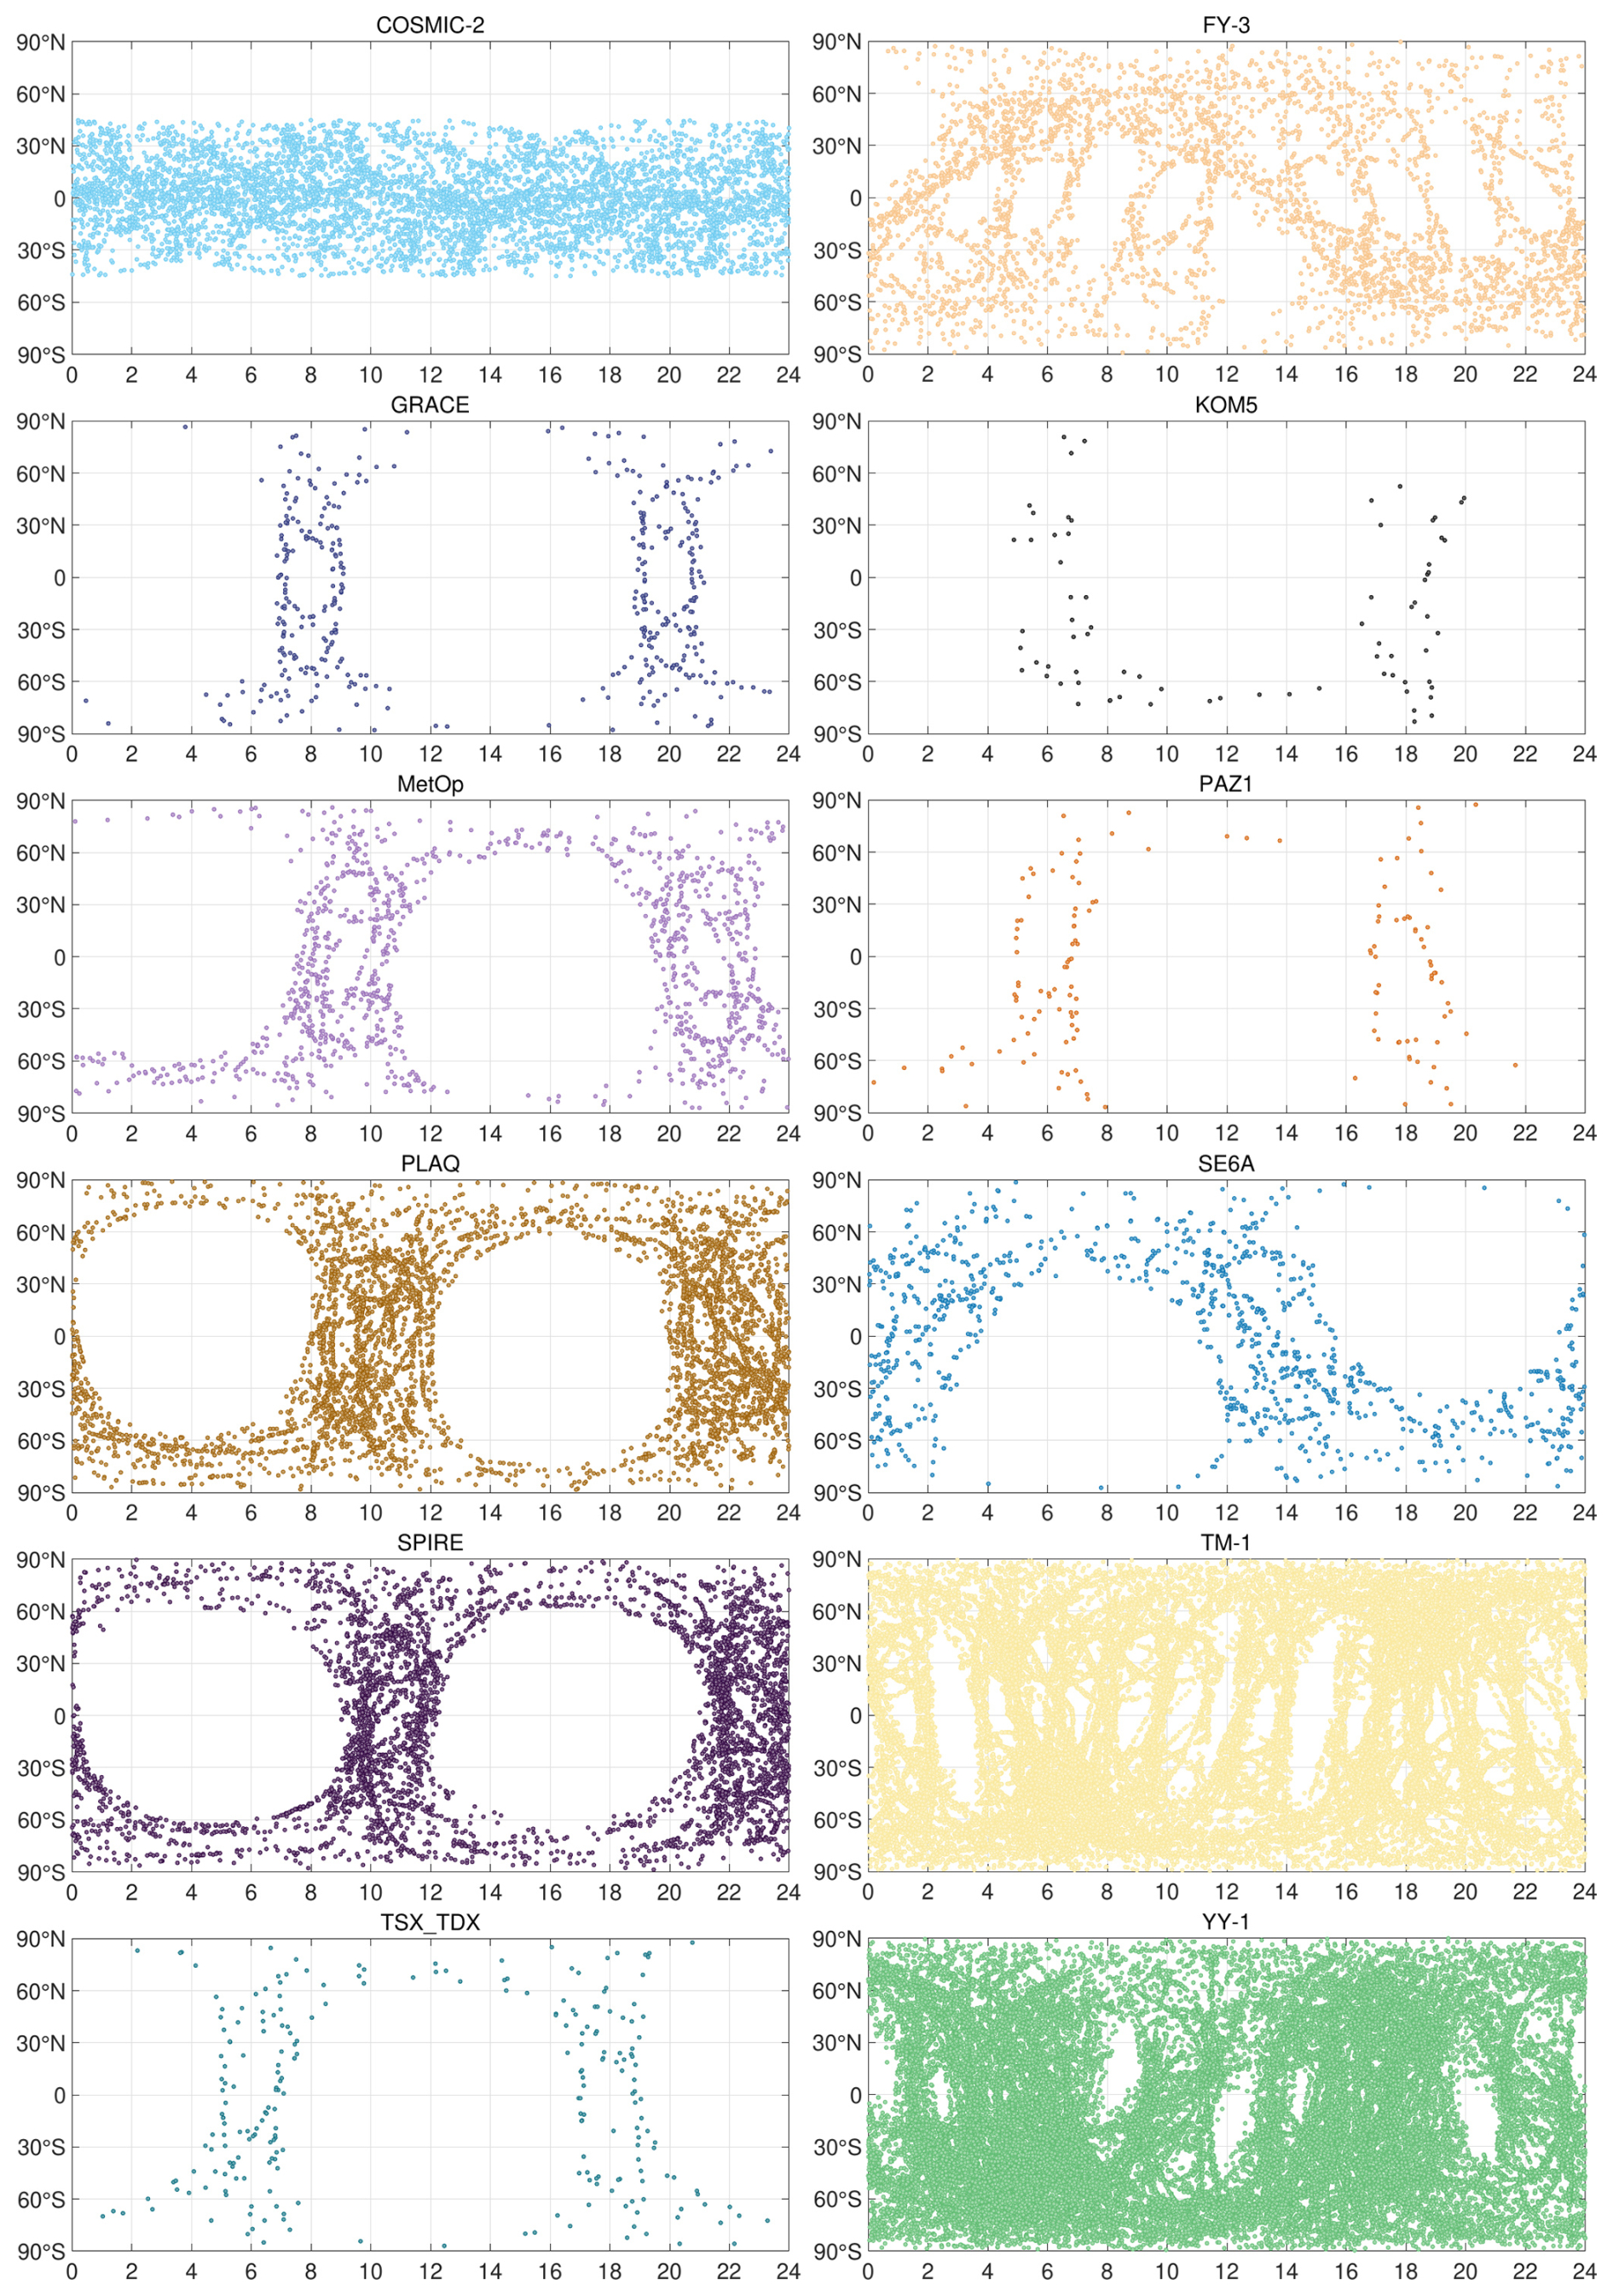
Figure 4Local-time distributions of radio occultation events from individual missions on 1 January 2026.
Figure 4 shows the local-time distributions of the global RO systems. The low-inclination COSMIC-2 configuration provides broad local-time sampling at low and middle latitudes. The local-time distributions of FY-3D, FY-3E, and FY-3F correspond to their descending-node local times, while low-inclination FY-3G produces curved bands that supplement low-latitude sampling. Sentinel-6A exhibits a similar curved-band pattern. The near-polar GRACE-C/D configuration produces nearly meridional distributions near 01:30, 11:30, 13:30, and 23:30 LT. Too few KOMPSAT-5 events are available to identify a clear pattern. MetOp-B/C events cluster near 08:00–10:00 and 20:00–22:00 LT, while TerraSAR-X/TanDEM-X and PAZ events cluster near 05:00–07:00 and 17:00–19:00 LT, consistent with their approximately 06:00 LT descending-node local times. Spire events primarily occur near 10:00–12:00 and 22:00–24:00 LT. PlanetiQ has many events concentrated near 08:00–12:00 and 20:00–24:00 LT, although the cause of this pattern requires further investigation. TM-1 includes sun-synchronous satellites with different descending-node local times, providing observations throughout the day but retaining gaps associated with LEO-GNSS geometry. Many YY-1 sun-synchronous satellites have descending-node local times between 02:00 and 08:00 LT, producing concentrated sampling, while YY-1 satellites 18–20 supplement low-latitude gaps. Overall, mission-specific orbital objectives and local-time configurations produce pronounced sampling biases, particularly because many near-sun-synchronous satellites are concentrated near 08:00–12:00 LT.
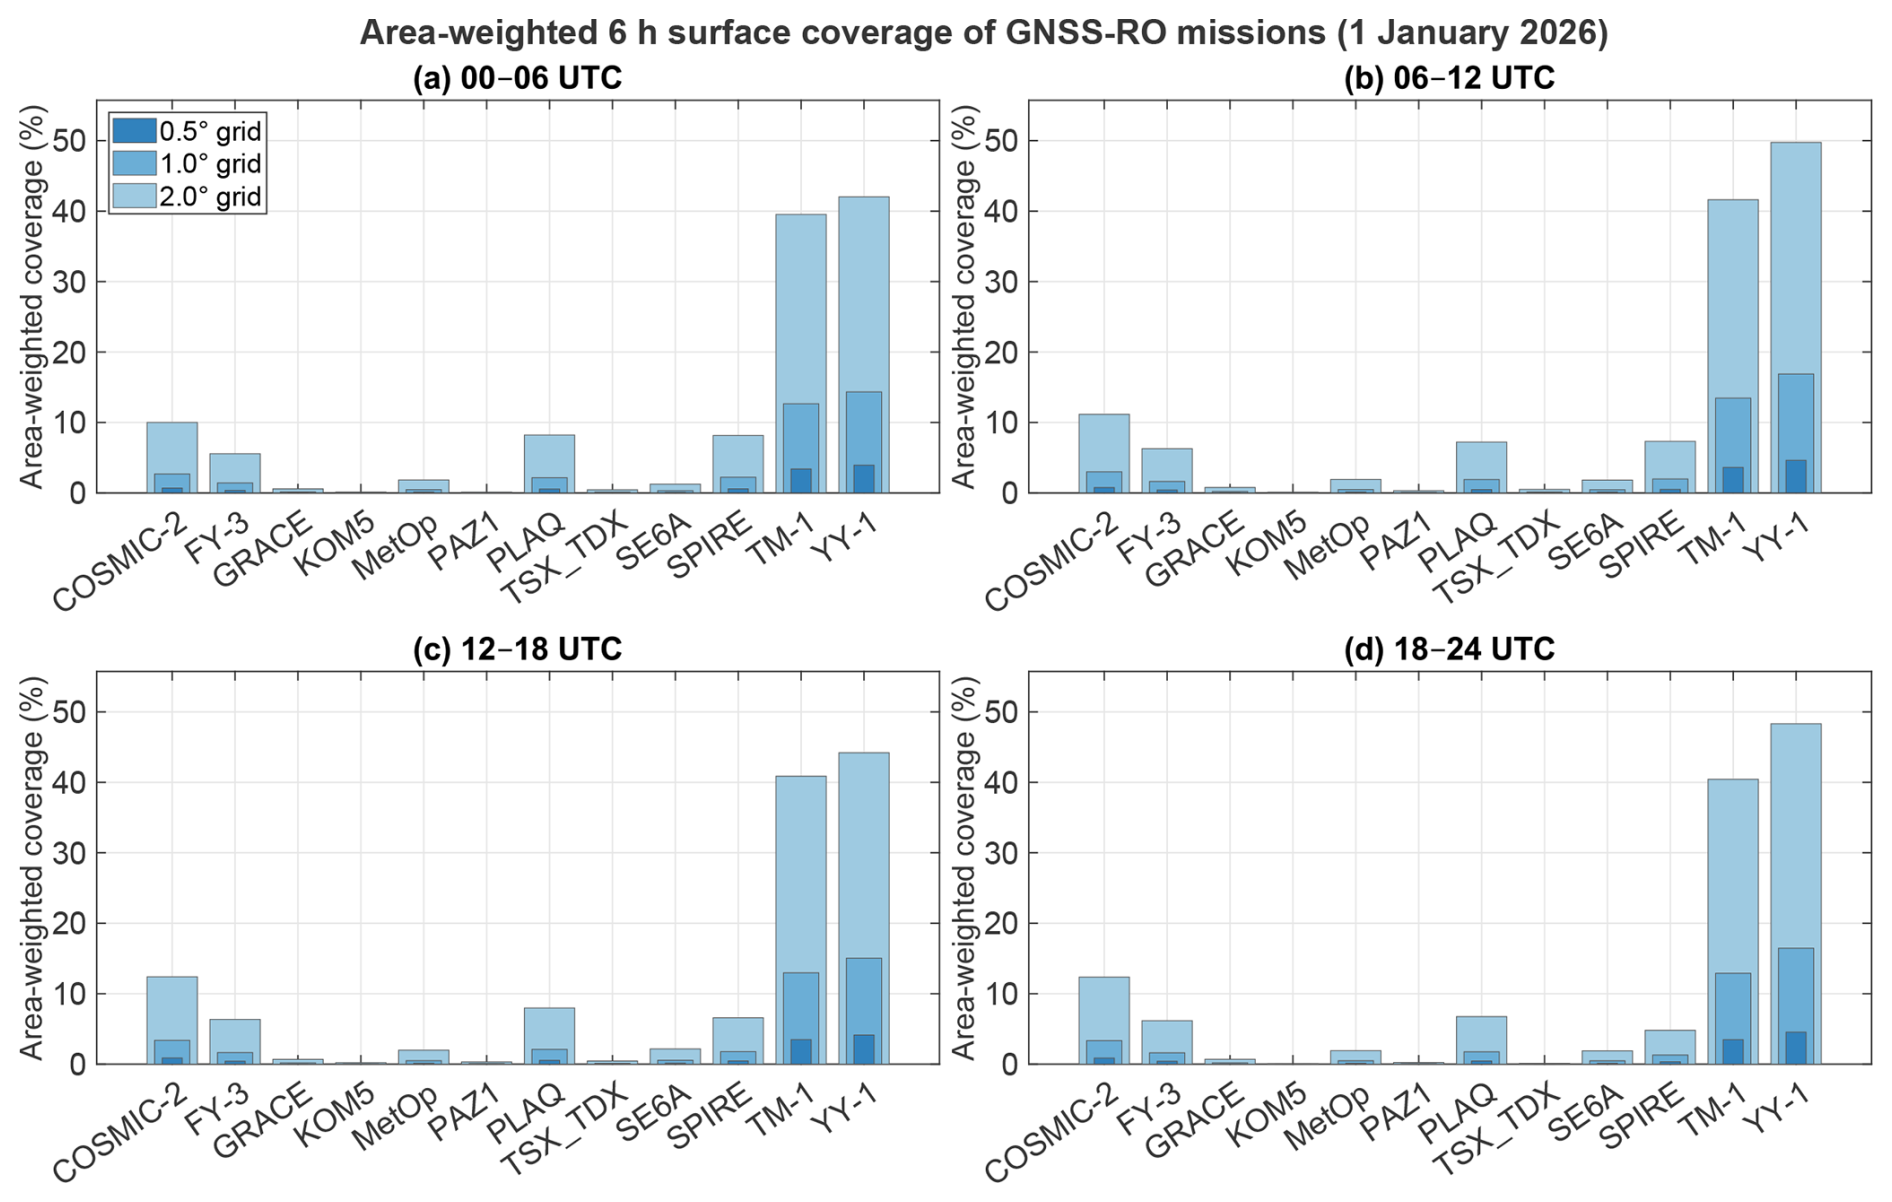
Figure 5Area-weighted surface coverage of individual GNSS-RO missions within 6 h time windows on 1 January 2026.
3.5 Coverage within 6 h time windows
To assess coverage on the time scale commonly used for numerical weather prediction data assimilation, RO events on 1 January 2026 were divided into four 6 h UTC windows: 00:00–06:00, 06:00–12:00, 12:00–18:00, and 18:00–24:00. Global area-weighted surface coverage was calculated for each window at spatial resolutions of 0.5, 1.0, and 2.0°. Compared with daily statistics, the 6 h area-weighted coverage more directly characterizes short-term spatial continuity within a typical assimilation window. The results are shown in Fig. 5. For this 1 d sample, mission-averaged coverage was broadly similar among the four UTC windows, although the temporal variability differed among missions. At 2.0° resolution, the mean coverage across all missions was 9.82 %, 10.73 %, 10.35 %, and 10.31 % in the four successive windows, with corresponding total event counts of 23 462, 25 911, 24 442, and 24 587. YY-1 and TM-1 retained the strongest global coverage at the 6 h scale. The mean YY-1 coverage fractions at 0.5, 1.0, and 2.0° were 4.31 %, 15.68 %, and 46.08 %, respectively, compared with 3.49 %, 12.99 %, and 40.62 % for TM-1. YY-1 reached the highest 2.0° coverage in the 06:00–12:00 UTC window (49.77 %), whereas TM-1 remained more temporally stable, with 2.0° coverage ranging only from 39.53 % to 41.63 %. Thus, even within 6 h windows, large constellations maintained high global area-weighted surface coverage and were the principal contributors to short-term global observational continuity. COSMIC-2, PlanetiQ, Spire, and FY-3 provided moderate 6 h coverage. Their mean coverage fractions at 0.5, 1.0, and 2.0° were 0.79 %, 3.10 %, and 11.48 % for COSMIC-2; 0.50 %, 1.98 %, and 7.54 % for PlanetiQ; 0.47 %, 1.82 %, and 6.71 % for Spire; and 0.40 %, 1.57 %, and 6.09 % for FY-3. COSMIC-2 coverage increased from 10.00 % in the first window to more than 12.3 % in the last two windows at 2.0° resolution, whereas FY-3 was comparatively stable, with 2.0° coverage ranging from 5.56 % to 6.34 %. Spire showed stronger window dependence, with 2.0° coverage decreasing from 8.15 % in the first window to 4.80 % in the final window. Although these missions provided less coverage than YY-1 and TM-1, they still supplied important complementary observations within 6 h assimilation windows. Single-satellite and small-constellation missions generally provided low coverage within 6 h windows. At 2.0° resolution, the mean coverage fractions for GRACE-C/D, KOMPSAT-5, PAZ, and TerraSAR-X/TanDEM-X were 0.68 %, 0.12 %, 0.24 %, and 0.38 %, respectively. MetOp-B/C and Sentinel-6A achieved slightly higher mean coverage, but only 1.91 % and 1.78 %, respectively. These missions may provide useful spatial samples on a daily scale, but they still leave pronounced global gaps when used alone within a 6 h data-assimilation window. Overall, the results indicate that 6 h coverage was governed primarily by event abundance and constellation size, while orbital configuration affected how efficiently those events translated into spatial coverage. Across the analyzed windows and resolutions, the Pearson correlation between mission event count and coverage ranged from 0.994 to 0.999. Large constellations therefore had a clear advantage at the 6 h scale, whereas individual satellites and small constellations provided limited stand-alone coverage. Because the analysis was based on only four windows from a single day, these findings should be interpreted as descriptive evidence for 1 January 2026 rather than as proof of general independence from the UTC window. Multi-mission observations remain essential for improving global continuity and reducing spatial gaps in short-window applications such as numerical weather prediction data assimilation.
Observations from all missions analyzed in Sect. 3 were combined to evaluate the overall effects of multi-mission joint observations.
In Eq. (6), is the total number of RO events in the ith grid after combining missions at spatial resolution r, ni,m(r) is the number of events from mission m in the ith grid, and M is the number of missions included in the joint analysis.
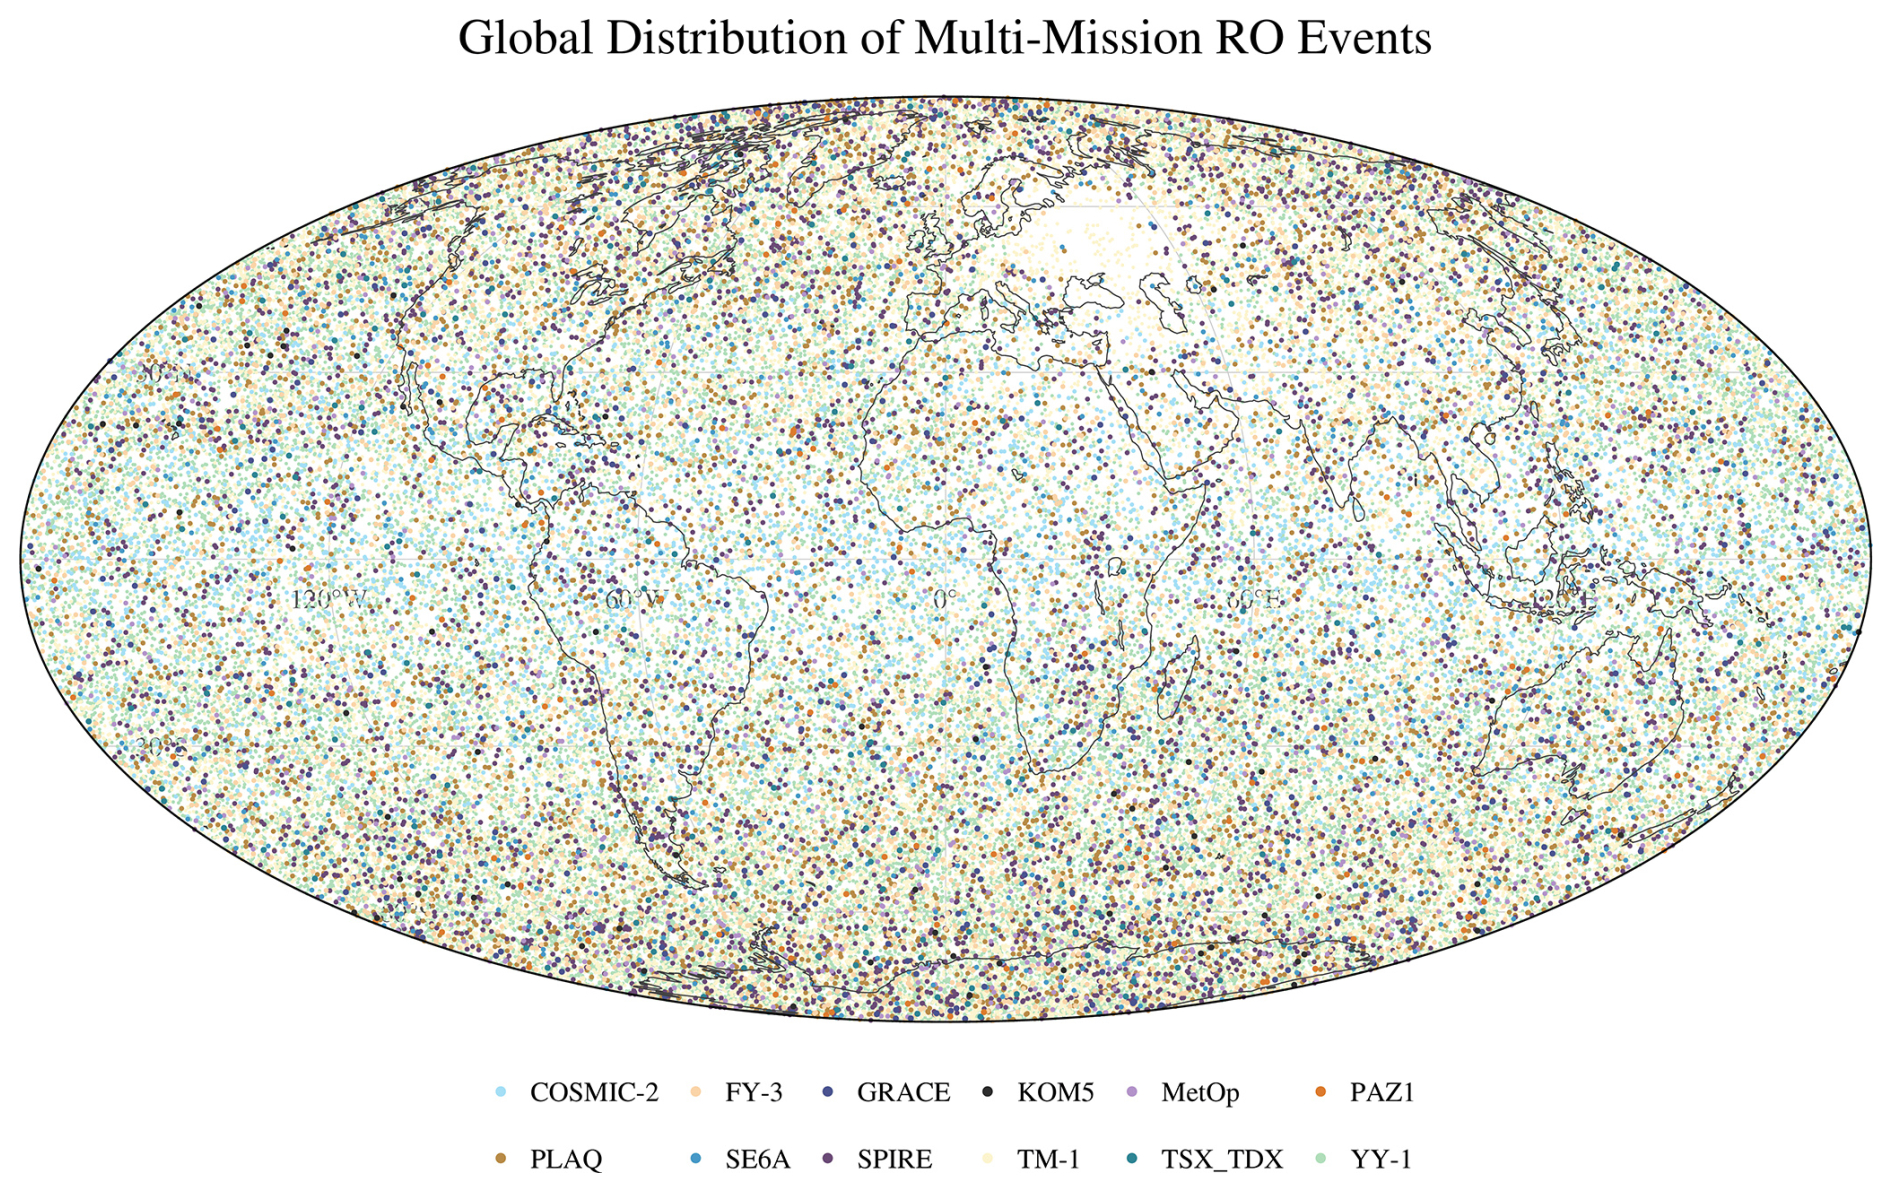
Figure 6Global distribution of the combined radio occultation dataset on 1 January 2026.
4.1 Joint global spatial distribution
Figure 6 shows the enhanced spatial completeness achieved by combining observations from all missions on 1 January 2026. The joint dataset contains 98 402 GNSS-RO events and provides substantially broader global sampling than any individual mission. The complementarity is particularly evident at low latitudes and in polar regions. At low latitudes, observations from the low-inclination FY-3G satellite and YY-1 satellites 18–20 complement the dense tropical sampling of COSMIC-2. Within 10° of the Equator, the combined dataset contains 10 979 events, accounting for 11.16 % of the joint sample. Within 30° S–30° N, COSMIC-2 contributes 4565 events, while FY-3G and YY-1 satellites 18–20 contribute 471 and 1826 events, respectively, thereby strengthening the low-latitude observing capability. Polar sampling is also enhanced through the complementarity of high-inclination and near-polar missions. A total of 21 762 events occur poleward of 60°, accounting for 22.12 % of the joint sample, with YY-1, TM-1, PlanetiQ, Spire, FY-3, and other high-inclination missions jointly contributing to high-latitude coverage. Overall, the combined dataset demonstrates clear latitudinal complementarity among missions: COSMIC-2 and selected low-inclination satellites strengthen tropical coverage, whereas high-inclination and near-polar missions improve sampling in polar regions. Localized data gaps near the Russia–Ukraine region are still visible in some distributions and may be related to regional signal interference, quality-control screening, or data-reception limitations.
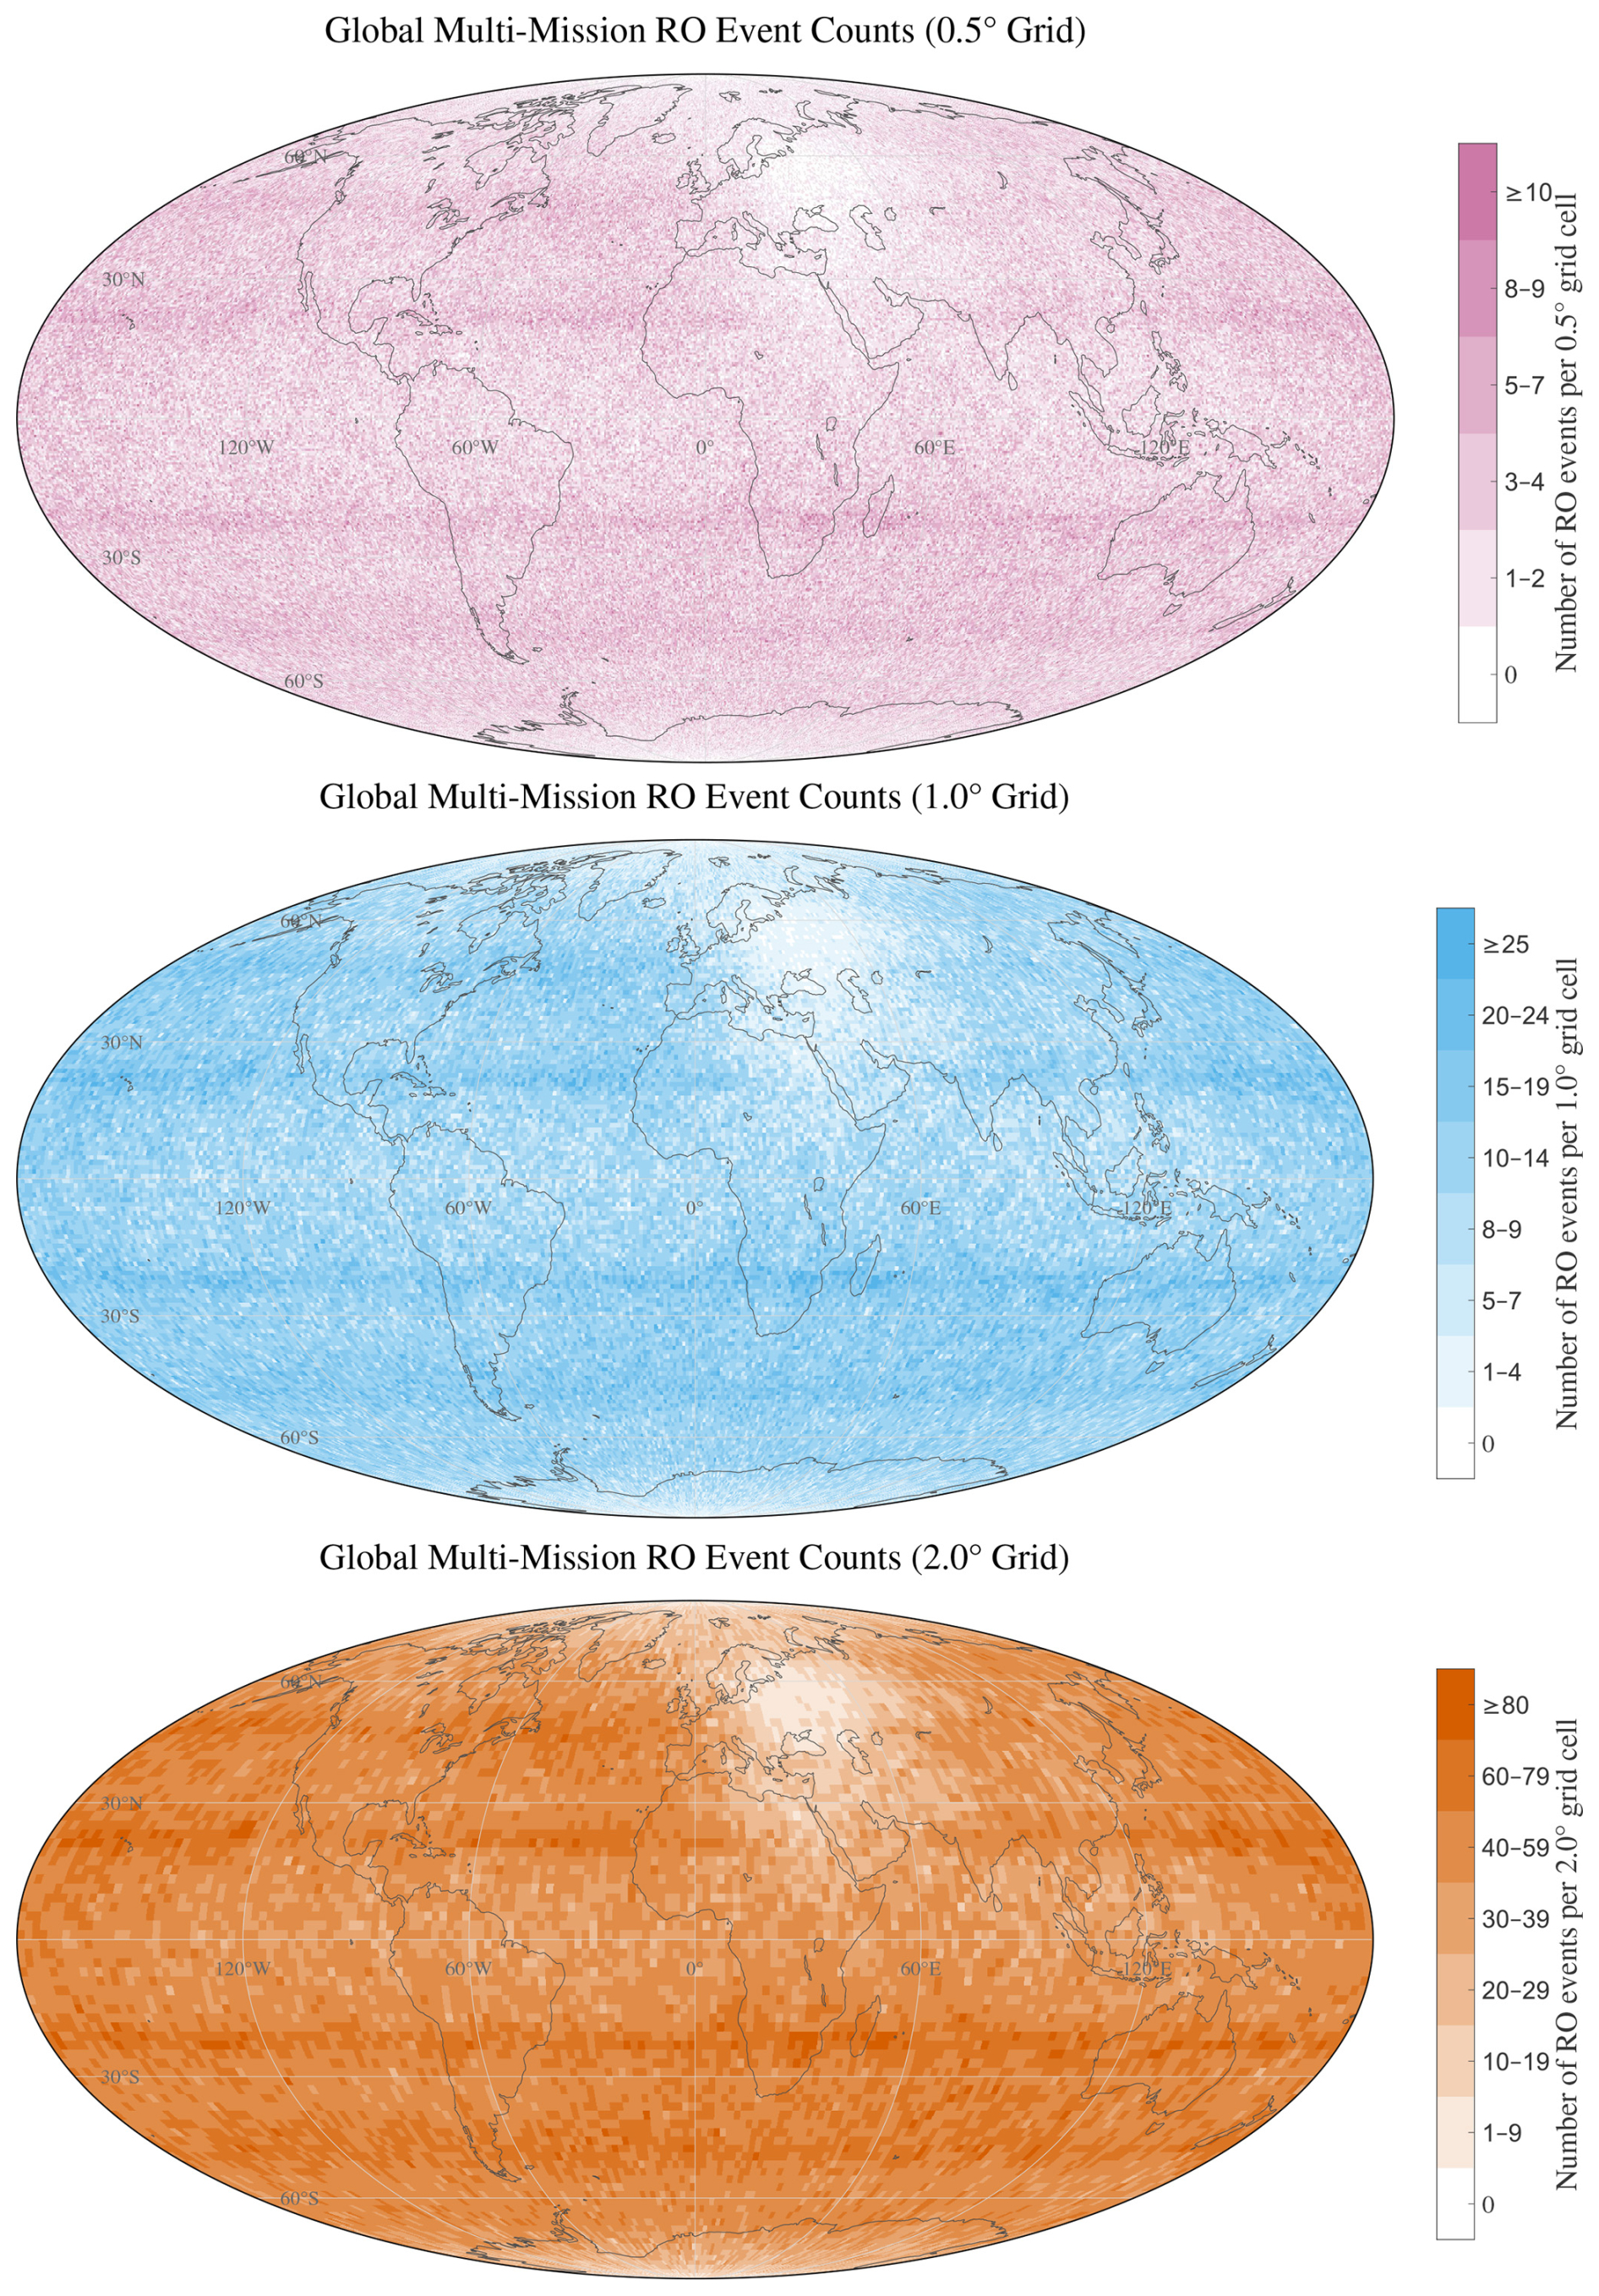
Figure 7Gridded spatial distribution of the combined radio occultation dataset during 1–7 January 2026.
4.2 Joint global gridded distribution
Figure 7 further illustrates the event count per grid cell and spatial continuity achieved by combining 679 854 RO events from all missions during 1–7 January 2026. At 0.5° resolution, 225 142 of the 259 200 global grids are occupied, corresponding to a grid-cell occupancy fraction of 86.86 % and a blank-grid fraction of 13.14 %; the maximum event count in a grid cell reaches 15 events per grid; the corresponding area-weighted surface coverage is 92.08 %, with an area-weighted blank fraction of 7.92 %. Most occupied grids remain low to moderate in event-count, with 102 993 grids containing one to two events and 79 607 grids containing three to four events, whereas only 681 grids contain ten or more events. At 1.0° resolution, the blank-grid fraction decreases to 1.87 %, corresponding to a grid-cell occupancy fraction of 98.13 % and an area-weighted surface coverage of 99.71 % and the maximum event count in a grid cell increases to 38 events per grid. The largest event-count class is 10–14 events, comprising 22 559 grids, while 34 grids contain 30 or more events. At 2.0° resolution, the combined dataset provides nearly continuous global coverage, with 16 170 of 16 200 grids occupied, a blank-grid fraction of only 0.19 %, and an area-weighted surface coverage of 99.995 % and a maximum event count in a grid cell of 113 events per grid. The dominant event-count class is 40–59 events, accounting for 7205 grids, followed by 60–79 events in 2294 grids; only three grids contain 100 or more events. The heat-map distribution also exhibits clear zonal high-event-count bands. Pronounced dense regions appear near approximately 20° S and 20° N, while another relatively evident concentration occurs around 45° latitude in both hemispheres. These banded structures indicate that, although multi-mission combination greatly improves global spatial continuity, the final event-count pattern still reflects the combined influence of orbital inclination, constellation geometry, and latitude-dependent sampling frequency.
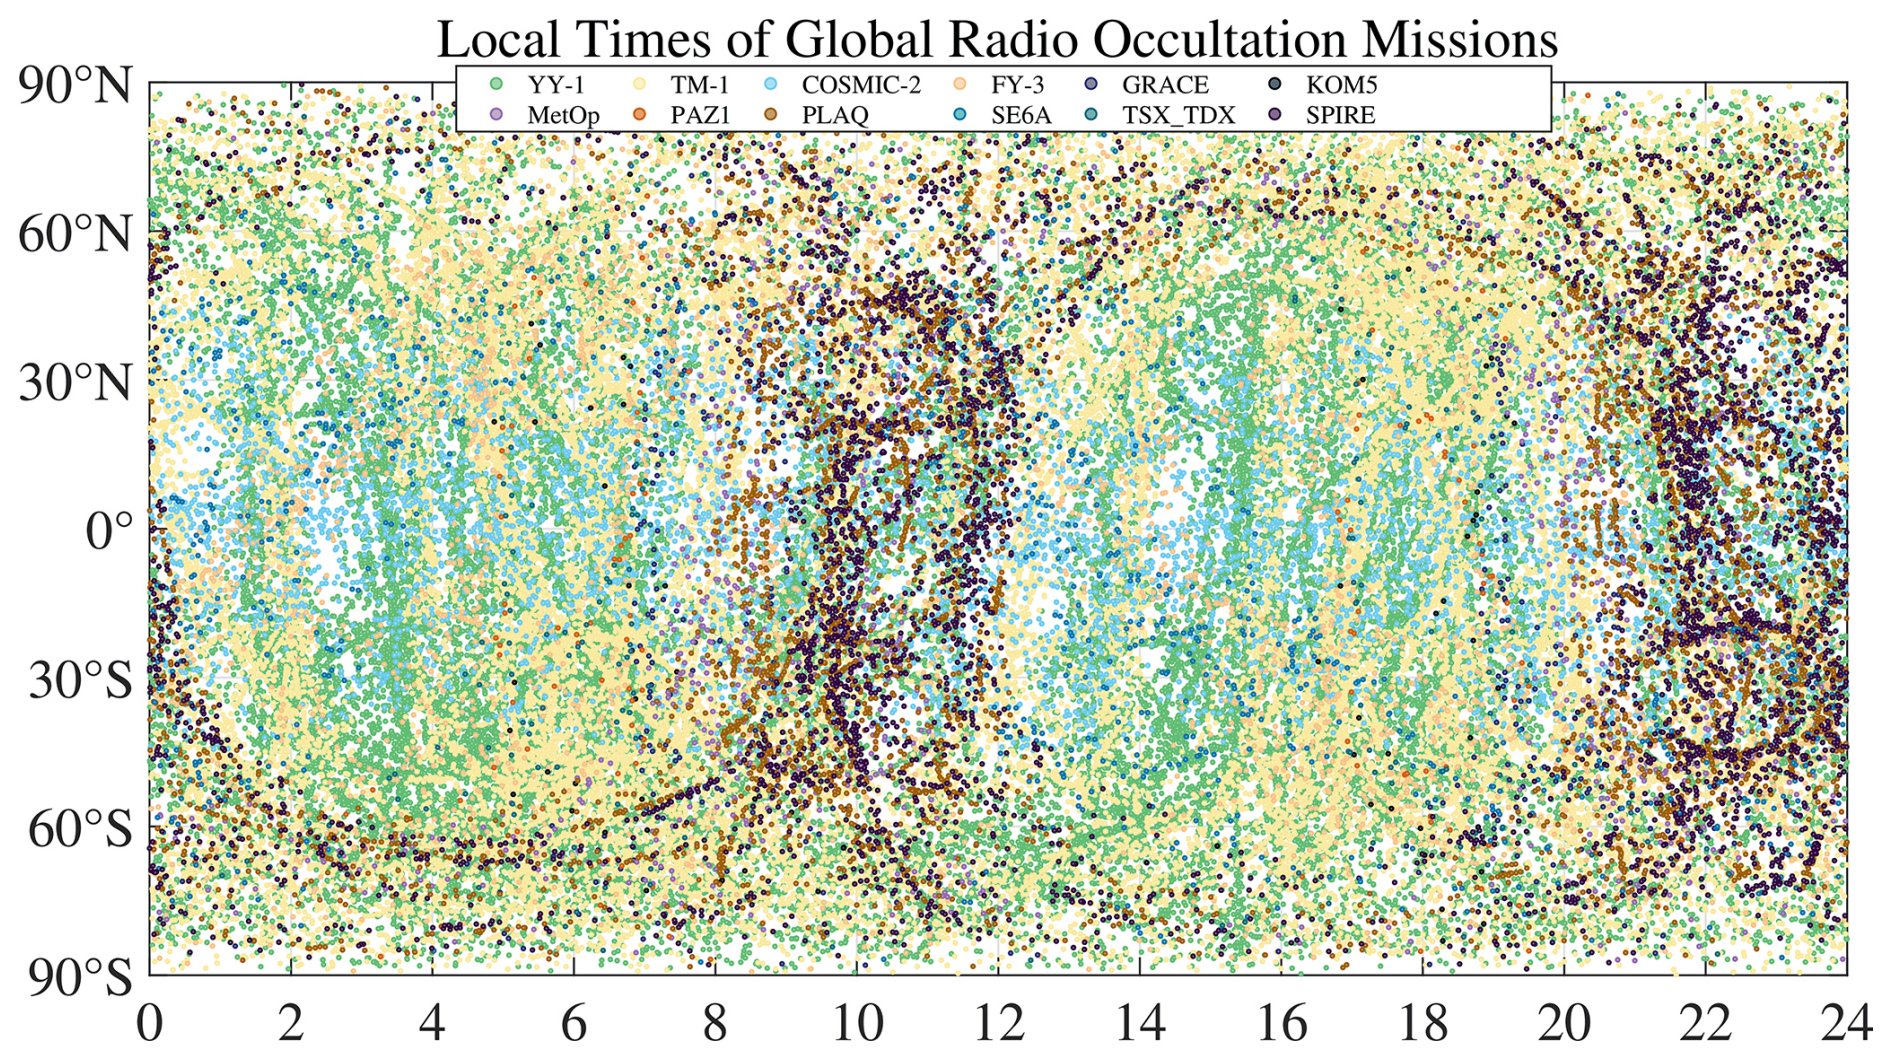
Figure 8Local-time distribution of the combined radio occultation dataset on 1 January 2026.
4.3 Joint global local-time distribution
Broad local-time coverage should not be interpreted as a requirement that every location be observed during every hour of a single day. Rather, it reduces dependence on mission-specific observation times and improves the representation of phenomena with diurnal variability. For NWP, observations distributed across successive local times provide sampling of an evolving atmospheric state within consecutive assimilation cycles. For climate applications, more stable local-time sampling reduces the risk that changes in the sampled portion of the diurnal cycle are aliased into long-term climate variations. For ionospheric and space-weather studies, local-time diversity is particularly important because electron density structures and equatorial irregularities can differ substantially between daytime, nighttime, and post-sunset conditions. Figure 8 shows that combining observations from multiple missions broadens and densifies the latitude–local-time distribution and reduces mission-specific sampling gaps on 1 January 2026. The joint dataset contains 98 402 RO events, of which YY-1 and TM-1 jointly contribute 76 897 events, accounting for 78.15 % of the total. Owing to their large constellation sizes and relatively distributed local-time sampling geometry, YY-1 and TM-1 provide the main observational backbone for the combined dataset and substantially enhance global latitude–local-time continuity. FY-3 also contributes to a more balanced local-time distribution: the differing local-time designs of FY-3D, FY-3E, and FY-3F help spread observations across multiple time sectors, while the low-inclination FY-3G satellite provides additional sampling at low latitudes. COSMIC-2 and YY-1 satellites 18–20 further strengthen the low-latitude component of the combined distribution. Other missions exhibit more distinct mission-dependent local-time preferences. For example, near-polar or sun-synchronous missions such as PlanetiQ, Spire, MetOp, GRACE-C/D, KOMPSAT-5, PAZ, and TerraSAR-X/TanDEM-X tend to form localized or banded structures in specific morning, evening, or nighttime local-time sectors, rather than providing uniformly distributed sampling on their own. Overall, the multi-mission combination produces a more continuous local-time distribution than any single constellation or mission alone. Nevertheless, the sampling remains nonuniform, with event count per grid cell varying among latitude bands and local-time sectors, reflecting the combined effects of constellation size, orbital configuration, and mission-specific sampling geometry.
4.4 Joint coverage within 6 h time windows
To assess joint coverage on the time scale commonly used for numerical weather prediction data assimilation, the multi-mission analysis employed the same four 6 h UTC windows used in the individual-mission analysis. This consistent temporal framework enables direct comparison between individual and combined RO observations within operationally relevant assimilation windows.
To quantify the improvement in 6 h coverage achieved through multi-mission integration, the combined dataset was compared with the individual RO missions. Coverage was calculated separately for each spatial resolution and 6 h window on 1 January 2026 and then averaged across the four windows.
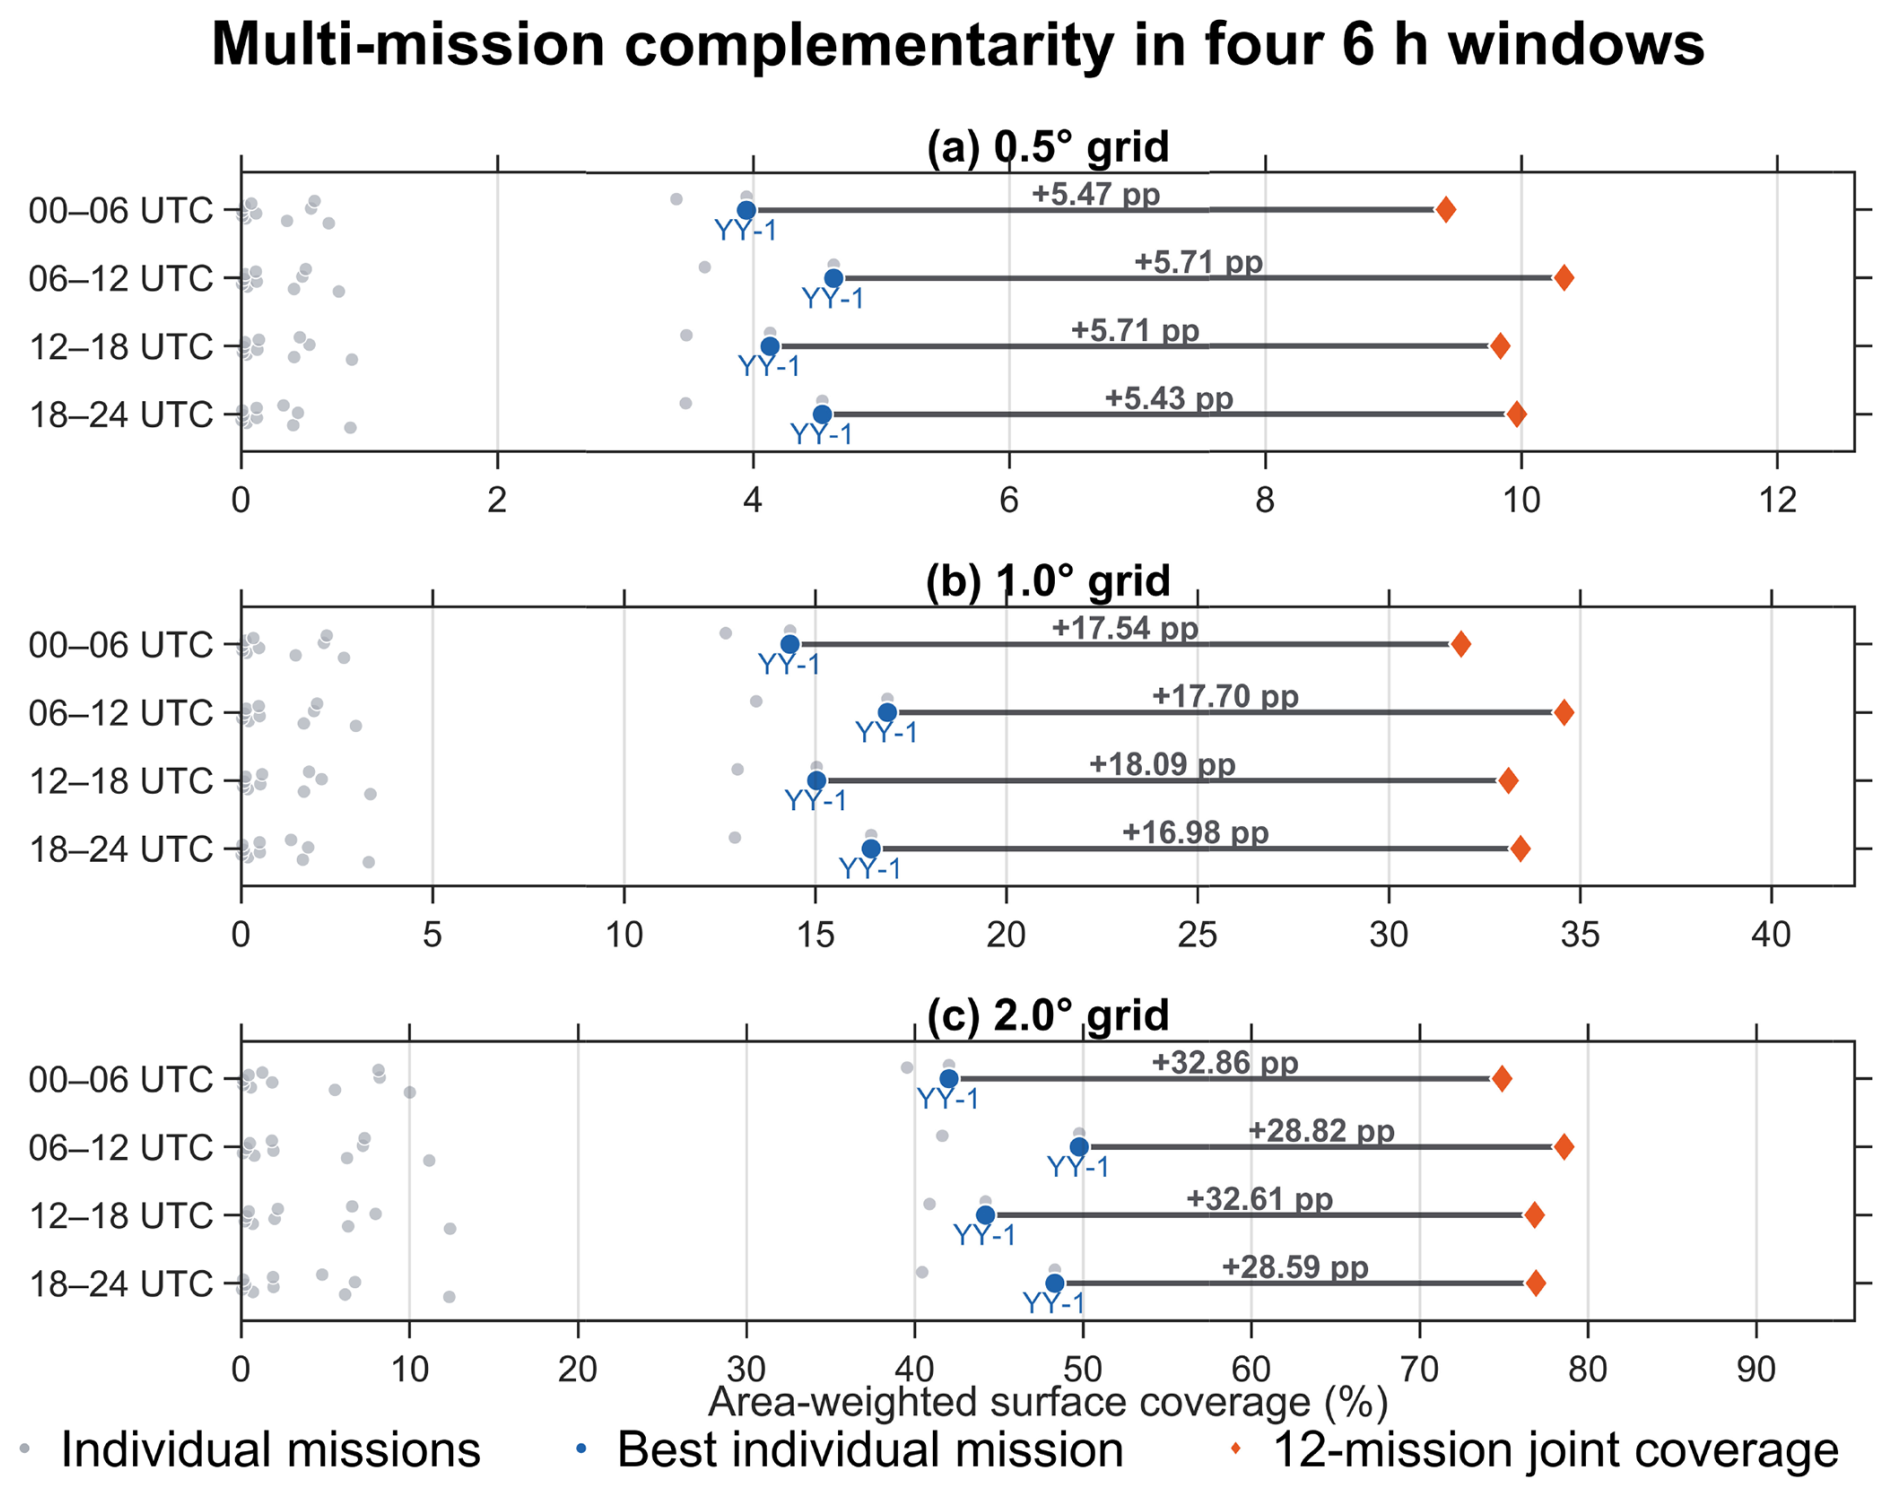
Figure 9 presents the results for individual windows, whereas Table 2 reports their four-window means. Averaged over the four windows, area-weighted joint coverage reaches 9.89 %, 33.26 %, and 76.79 % at 0.5, 1.0, and 2.0°, respectively. YY-1 remains the best-performing individual mission, with corresponding mean coverage fractions of 4.31 %, 15.68 %, and 46.08 %. Joint observations therefore provide absolute gains of 5.58, 17.58, and 30.72 percentage points relative to YY-1, equivalent to relative increases of 129.4 %, 112.1 %, and 66.7 %. Although the proportional improvement decreases as grid size increases, the absolute coverage gain becomes larger. These results demonstrate that complementary sampling among missions effectively fills additional spatial gaps and improves global observational continuity within 6 h data-assimilation windows.
Table 2Mean 6 h area-weighted global surface coverage (%) of individual RO missions and the combined dataset at three spatial resolutions.
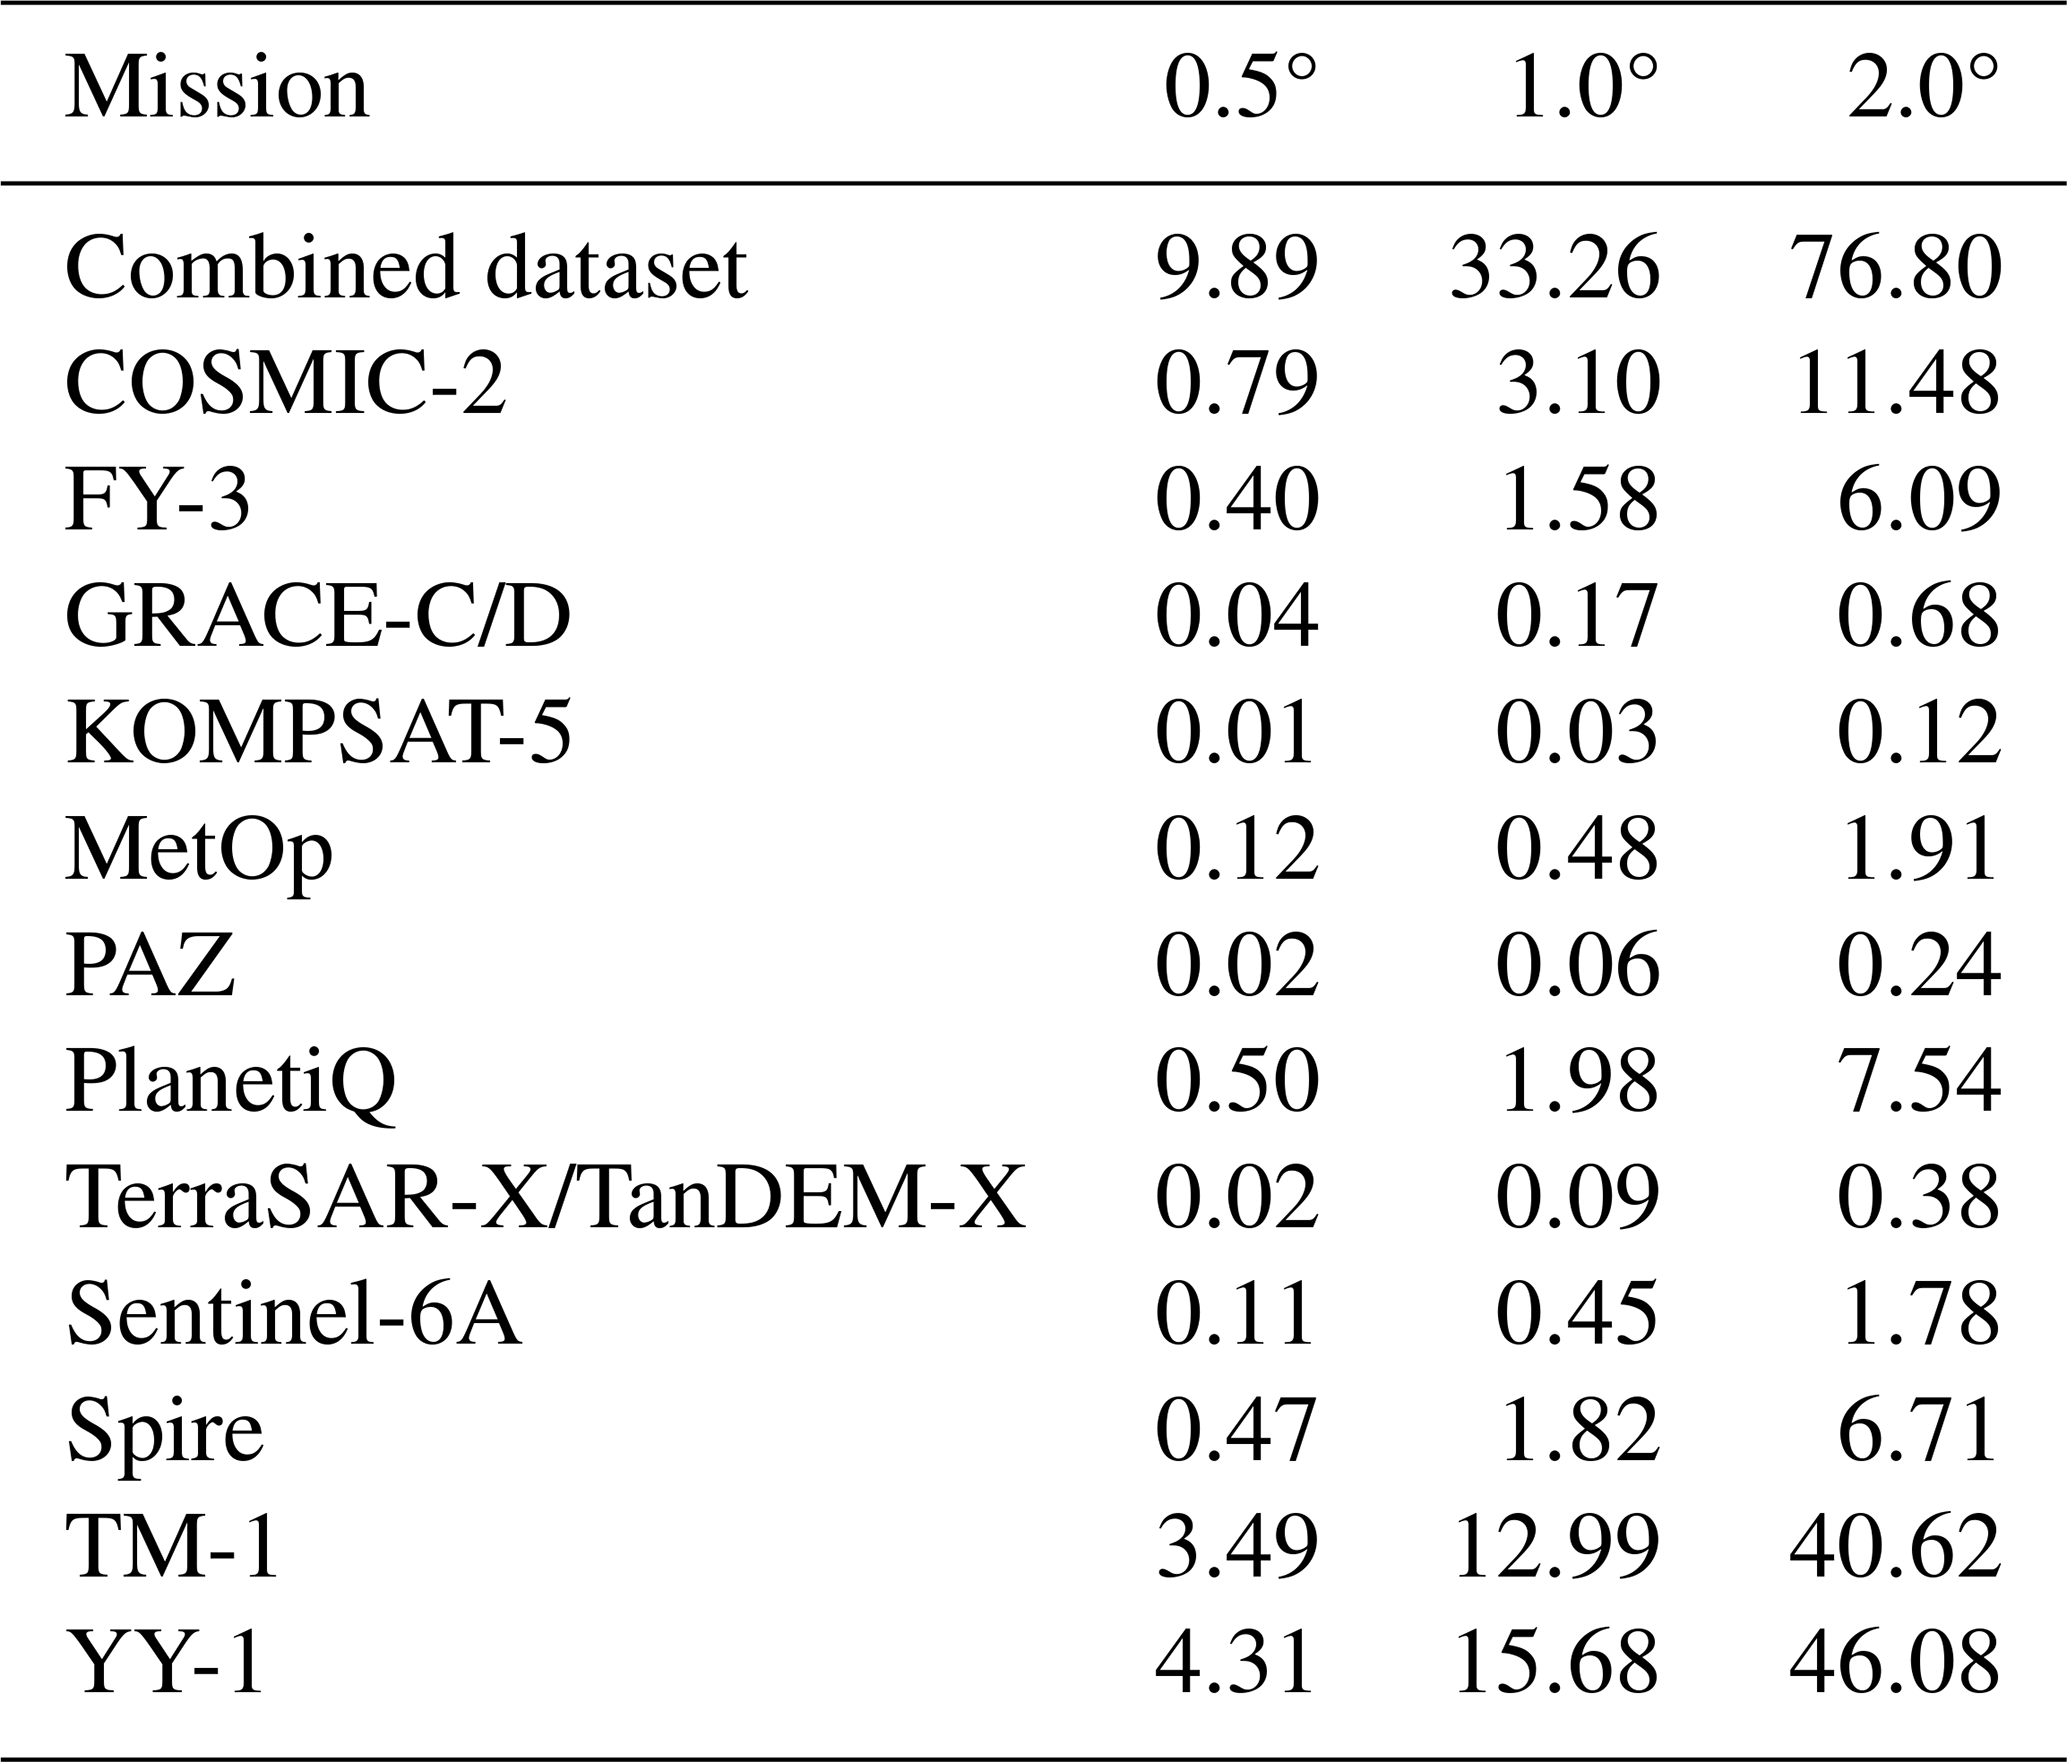
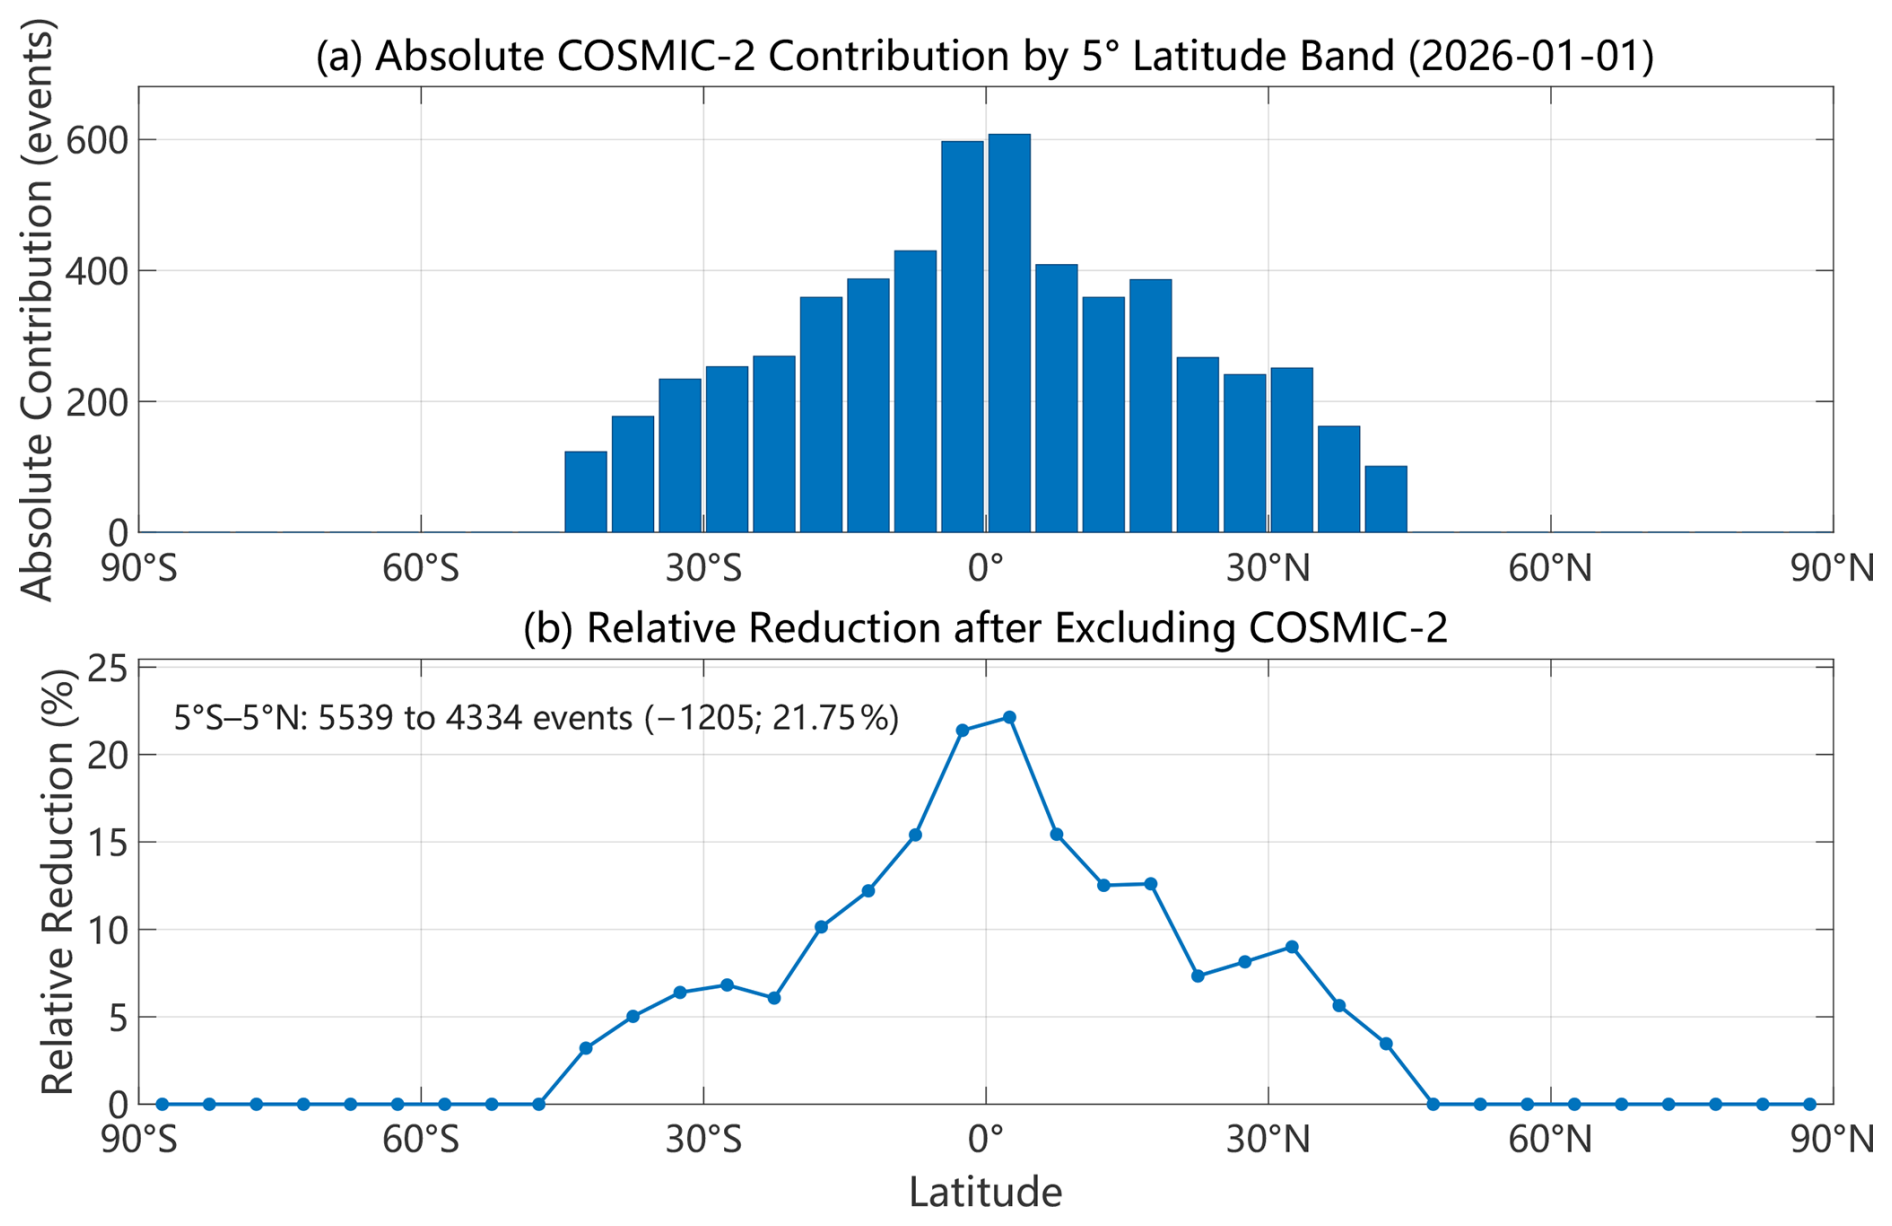
Figure 10Sampling contribution of COSMIC-2 by 5° latitude band on 1 January 2026: (a) the absolute number of events removed when COSMIC-2 is excluded, ; and (b) the corresponding percentage reduction, .
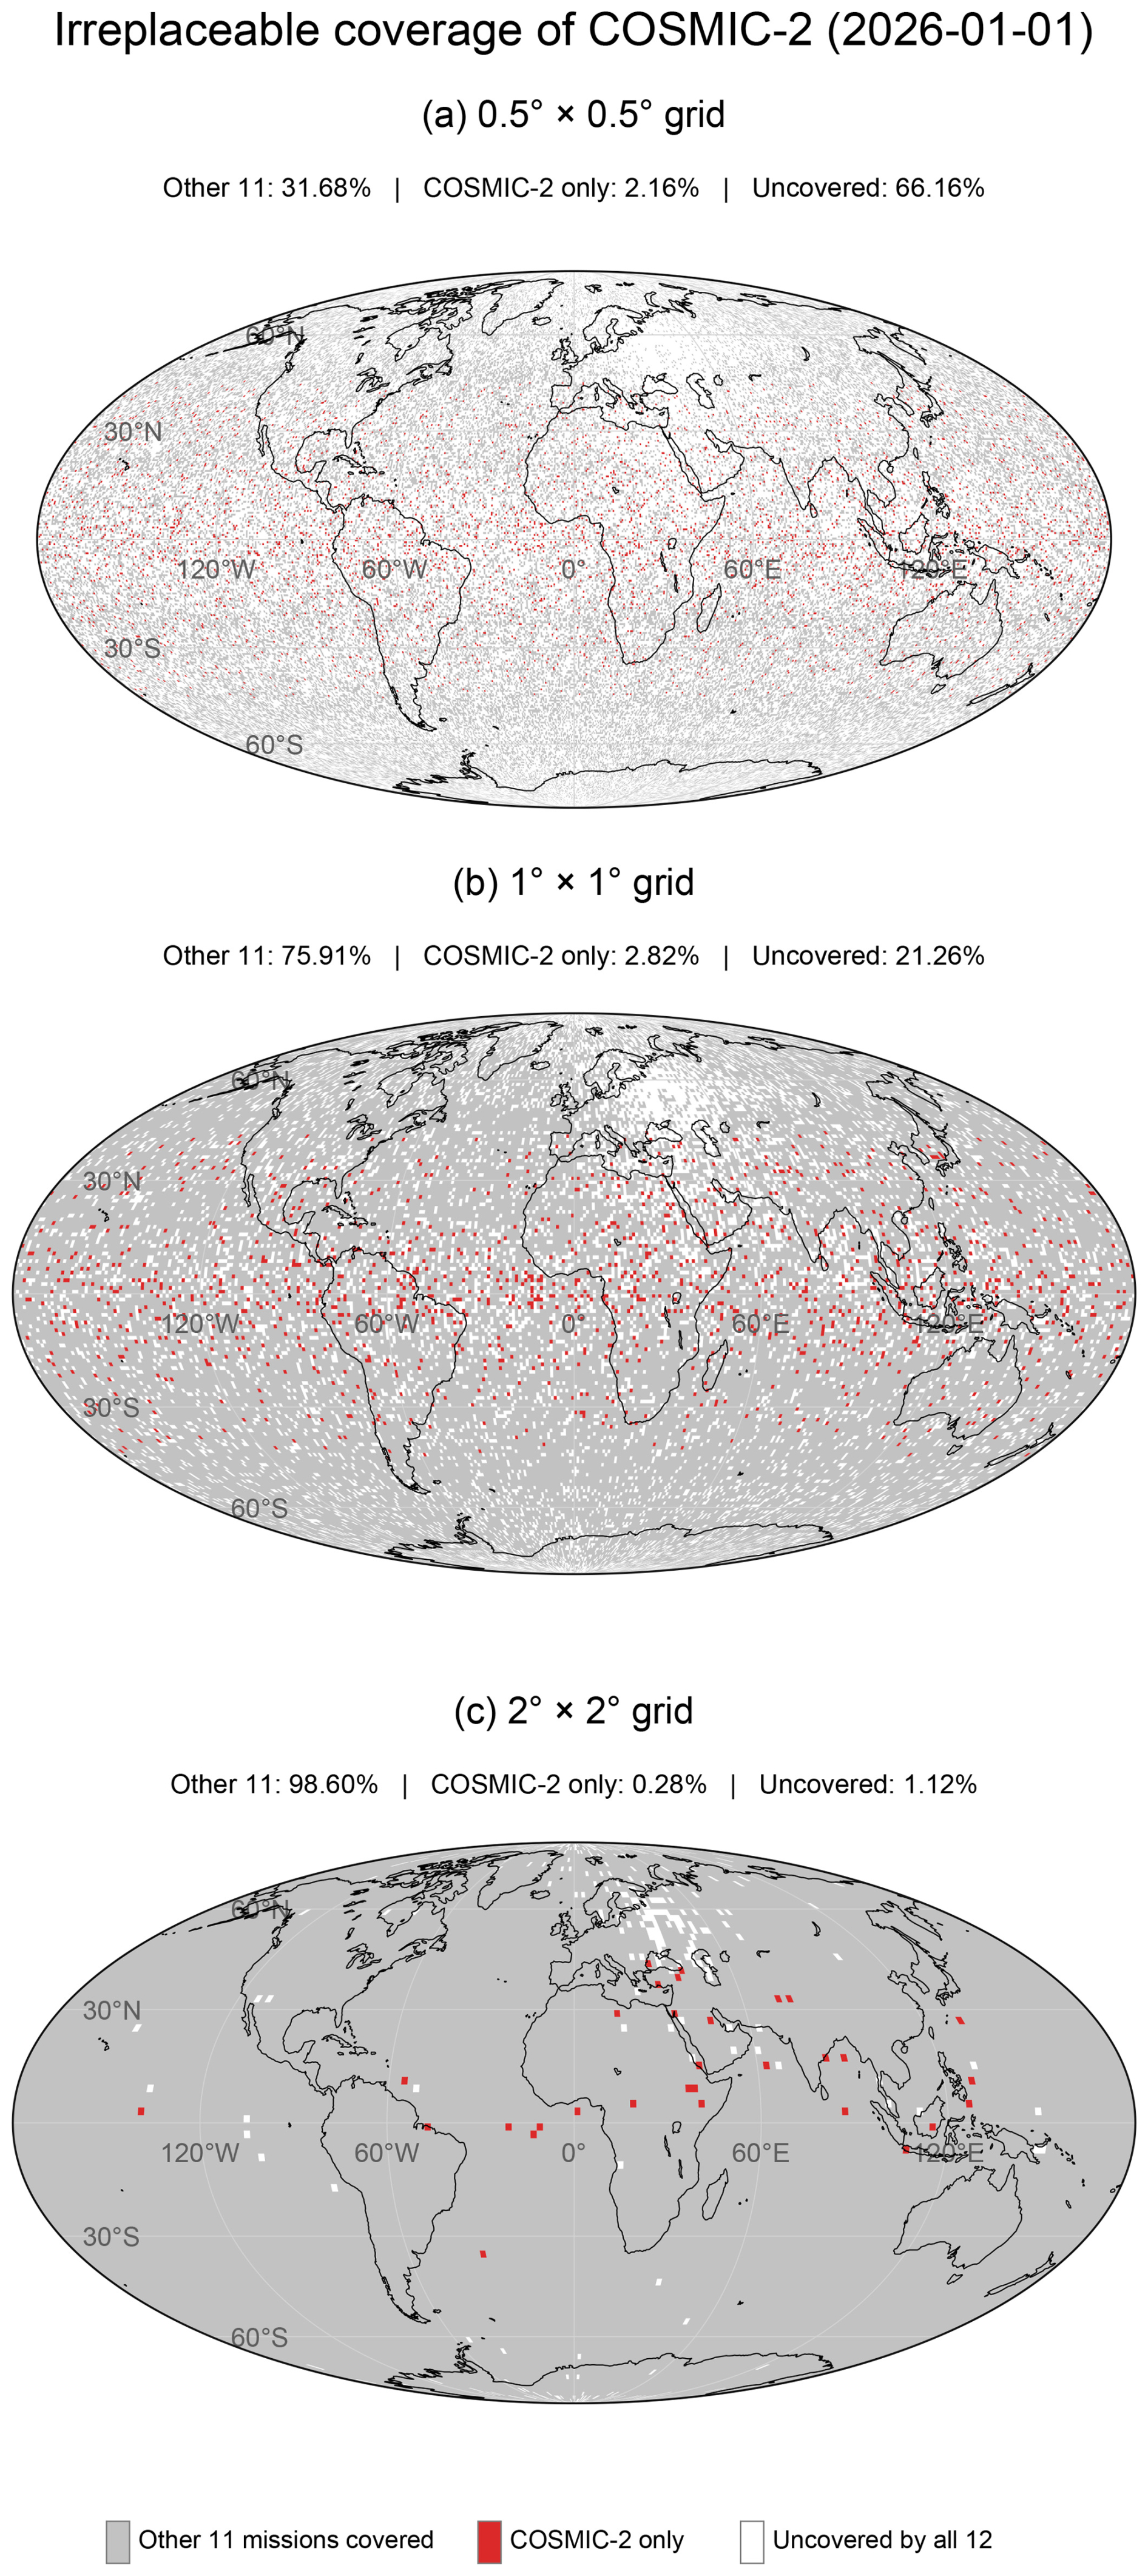
Figure 11Spatially irreplaceable coverage contribution of COSMIC-2 at 0.5, 1, and 2° grid resolutions on 1 January 2026.
4.5 Sampling contribution of COSMIC-2 to the multi-mission observing system
To quantify the sampling contribution of COSMIC-2 within the current multi-mission observing system, we conducted a diagnostic exclusion analysis by removing COSMIC-2 while retaining the other 11 mission systems. This analysis characterizes the sampling supplied by COSMIC-2 but does not constitute a forecast-impact or retirement-scenario experiment. Figure 10 shows the absolute and relative reductions in event counts by 5° latitude band after COSMIC-2 is excluded. The removal of COSMIC-2 has a distinctly latitude-dependent effect. Because COSMIC-2 is a low-inclination constellation, its contribution is concentrated in the tropical and subtropical regions, whereas the remaining missions largely preserve the mid- and high-latitude sampling structure. Within 5° S–5° N, the number of RO events decreases from 5539 for the 12-mission dataset to 4334 after removal of COSMIC-2, corresponding to a reduction of 1205 events (21.75 %). Thus, although the remaining 11 missions still provide extensive global sampling, the retirement of COSMIC-2 would noticeably weaken the latitudinal sampling event-count near the Equator.
Figure 11 further illustrates the spatially irreplaceable contribution of COSMIC-2 at three grid resolutions: (a) 0.5° × 0.5°, (b) 1° × 1°, and (c) 2° × 2°. Gray grids are covered by the other 11 missions, red grids are covered only by COSMIC-2, and white grids are not covered by any of the 12 missions. At the finest 0.5° resolution, 3797 grids, corresponding to an area-weighted 2.16 % of the global area, are covered exclusively by COSMIC-2. These COSMIC-2-only grids are concentrated in the low- and middle-latitude belt, with a pronounced tropical contribution, confirming that the constellation provides coverage that cannot be fully replaced by the other missions at high spatial resolution. At 1° resolution, the COSMIC-2-only area-weighted surface-coverage fraction is 2.82 % (1233 grids), whereas at 2° resolution it decreases to an area-weighted surface-coverage fraction of 0.28 % (31 grids) because the coarser grid aggregation merges many COSMIC-2 observations with coverage from the other missions. Overall, the multi-mission system remains highly resilient after excluding COSMIC-2, especially at coarse spatial scales; however, its retirement would lead to a measurable loss of independent high-resolution coverage and a clear reduction in equatorial RO sampling.
This study compared the spatial distributions, grid coverage, local-time sampling and 6 h coverage of 12 GNSS-RO mission systems using observations collected during 1–7 January 2026. The results demonstrate that constellation size, event abundance, and orbital configuration jointly determine the observational capabilities of individual missions. Large constellations provide the strongest global spatial continuity, low-inclination missions enhance tropical and subtropical sampling, and high-inclination and near-polar missions provide complementary observations at middle and high latitudes. Consequently, no single mission can reproduce the spatial and temporal sampling characteristics of the complete multi-mission observing system.
On 1 January 2026, the combined dataset contained 98 402 RO events, of which YY-1 and TM-1 contributed 78.15 %. Their large observation volumes formed the backbone of the global distribution, while COSMIC-2, FY-3G, and the low-inclination YY-1 satellites strengthened tropical sampling. Over the full 7 d period, the combined dataset comprised 679 854 events. Its global grid-cell occupancy fraction reached 86.86 %, 98.13 %, and 99.81 % at resolutions of 0.5, 1.0, and 2.0°, respectively, while the corresponding area-weighted global surface-coverage fractions reached 92.08 %, 99.71 %, and 99.995 %. Although the integrated dataset provided nearly continuous global coverage at the two coarser resolutions, its event count per grid cell remained spatially nonuniform, with pronounced zonal structures associated with orbital inclination, constellation geometry, and latitude-dependent sampling frequency.
At the 6 h scale relevant to numerical weather prediction data assimilation, event abundance was strongly correlated with grid coverage. Multi-mission integration substantially improved short-window spatial continuity, achieving 76.79 % mean area-weighted surface coverage at 2.0° resolution compared with 46.08 % for YY-1, the best-performing individual mission. The combined observations also broadened sampling across the 24 h local-time cycle and reduced gaps among latitude bands, demonstrating the benefits of complementary orbital configurations. These improvements indicate greater observational availability and sampling representativeness for downstream applications. However, their effects on NWP forecast skill, climate-record uncertainty, and space-weather prediction were not directly evaluated in this study and require application-specific experiments.
Because the present analysis covers only seven days and the 6 h assessment is based on four windows from a single day, the results represent a short-term observational snapshot. Future work should extend the analysis to longer periods, quantify seasonal and regional variability, and evaluate optimized mission combinations in numerical weather prediction and climate applications. Future work will extend the analysis to longer periods and different seasons and regions. Subject to data availability and experimental resources, we also plan to evaluate the application-level consequences of changes in COSMIC-2 sampling through dedicated data-assimilation or data-denial experiments for NWP, longer-term sampling-error analyses for climate applications, and targeted assessments of ionospheric and space-weather products.
The radio occultation datasets used in this study were obtained from the National Meteorological Information Center of the China Meteorological Administration, comprising (1) global atmospheric profiles acquired under the WMO Global Telecommunication System (GTS) exchange agreement and subject to WMO data sharing and exchange policies, and (2) operational RO products from the commercial small-satellite constellations “Tianmu-1” and “Yunyao-1”, both of which have been admitted into the CMA integrated observation system in accordance with the Administrative Measures for the Admission and Exit of Meteorological Data Products and processed via the Tianqing meteorological big data cloud platform; these data are further governed by the CMA License Agreement for the Use of Meteorological Data, WMO GTS distribution rules, and the intellectual property clauses of the respective commercial satellite operators, meaning the authors are not authorized to redistribute them, and eligible researchers may register at https://data.cma.cn (last access: 12 October 2026), sign the required license agreement, and apply for access. The code developed in this study is archived at Zenodo repository under DOI: https://doi.org/10.5281/zenodo.21866427 (Lu and Chen, 2027). Access is currently restricted as the code forms part of an ongoing follow-up research project. The full codebase will be made publicly accessible under the same DOI upon completion of the related series of studies, estimated by 1 year. In the meantime, the code is available from the corresponding author upon reasonable request.
LWQ and CR contributed equally to the conceptualization, methodology, formal analysis, visualization, and preparation of the original draft. XN and MXG contributed to the conceptualization, supervision, and project administration. LM, XL and LY contributed to data curation and validation. GP, YGL, HXQ, ZXG, and SYQ contributed to the interpretation of the results and the review and editing of the manuscript. All authors discussed the results and approved the final manuscript.
The contact author has declared that none of the authors has any competing interests.
Publisher's note: Copernicus Publications remains neutral with regard to jurisdictional claims made in the text, published maps, institutional affiliations, or any other geographical representation in this paper. The authors bear the ultimate responsibility for providing appropriate place names. Views expressed in the text are those of the authors and do not necessarily reflect the views of the publisher.
We thank all individuals who contributed to this study. We are grateful to the European Centre for Medium-Range Weather Forecasts (ECMWF) for providing the ERA5 reanalysis data, and to the National Meteorological Information Center, China Meteorological Administration (CMA), for supplying the radio occultation data.
This research has been supported by the National Natural Science Foundation of China (grant nos. U2442216 and U2542214).
This paper was edited by Peter Alexander and reviewed by Richard Anthes and one anonymous referee.
Anthes, R. A., Bernhardt, P. A., Chen, Y., Cucurull, L., Dymond, K. F., Ector, D., Healy, S. B., Ho, S.-P., Hunt, D. C., Kuo, Y.-H., Liu, H., Manning, K., McCormick, C., Meehan, T. K., Randel, W. J., Rocken, C., Schreiner, W. S., Sokolovskiy, S. V., Syndergaard, S., Thompson, D. C., Trenberth, K. E., Wee, T.-K., Yen, N. L., and Zeng, Z.: The COSMIC/FORMOSAT-3 Mission: Early Results, B. Am. Meteorol. Soc., 89, 313–334, https://doi.org/10.1175/BAMS-89-3-313, 2008.
Anthes, R. A., Marquardt, C., Ruston, B., and Shao, H.: Radio Occultation Modeling Experiment (ROMEX): Determining the Impact of Radio Occultation Observations on Numerical Weather Prediction, B. Am. Meteorol. Soc., 105, E1552–E1568, https://doi.org/10.1175/BAMS-D-23-0326.1, 2024.
Bai, W. H., Sun, Y. Q., Du, Q. F., Yang, G. L., Yang, Z. D., Zhang, P., Bi, Y. M., Wang, X. Y., Cheng, C., and Han, Y.: An introduction to the FY3 GNOS instrument and mountain-top tests, Atmos. Meas. Tech., 7, 1817–1823, https://doi.org/10.5194/amt-7-1817-2014, 2014.
Beyerle, G., Schmidt, T., Michalak, G., Heise, S., Wickert, J., and Reigber, C.: GPS radio occultation with GRACE: Atmospheric profiling utilizing the zero difference technique, Geophys. Res. Lett., 32, https://doi.org/10.1029/2005GL023109, 2005.
Bonnedal, M., Christensen, J., Carlström, A., and Berg, A.: Metop-GRAS in-orbit instrument performance, GPS Solut., 14, 109–120, https://doi.org/10.1007/s10291-009-0142-3, 2010.
Chang, H., Lee, J., Yoon, H., Morton, Y. J., and Saltman, A.: Performance assessment of radio occultation data from GeoOptics by comparing with COSMIC data, Earth Planets Space, 74, 108, https://doi.org/10.1186/s40623-022-01667-6, 2022.
Donlon, C. J., Cullen, R., Giulicchi, L., Vuilleumier, P., Francis, C. R., Kuschnerus, M., Simpson, W., Bouridah, A., Caleno, M., Bertoni, R., Rancaño, J., Pourier, E., Hyslop, A., Mulcahy, J., Knockaert, R., Hunter, C., Webb, A., Fornari, M., Vaze, P., Brown, S., Willis, J., Desai, S., Desjonqueres, J.-D., Scharroo, R., Martin-Puig, C., Leuliette, E., Egido, A., Smith, W. H. F., Bonnefond, P., Le Gac, S., Picot, N., and Tavernier, G.: The Copernicus Sentinel-6 mission: Enhanced continuity of satellite sea level measurements from space, Remote Sens. Environ., 258, 112395, https://doi.org/10.1016/j.rse.2021.112395, 2021.
Du, Q., Liu, C., Li, W., Liu, C., Li, F., Qiao, H., Sun, Y., Bai, W., Wang, X., Wang, D., Meng, X., Cai, Y., Xia, J., and Wu, C.: The On-Orbit Performance of FY-3D GNOS, in: IGARSS 2019 – 2019 IEEE International Geoscience and Remote Sensing Symposium, 7669–7671, https://doi.org/10.1109/IGARSS.2019.8898370, 2019.
Faller, N., Weber, M., and GmbH, I.: TerraSAR-X and TanDEM-X: Revolution in spaceborne radar, in: 2007 IEEE International Geoscience and Remote Sensing Symposium, 23–28 July 2007, 4924–4928, https://doi.org/10.1109/IGARSS.2007.4423966, 2007.
Fu, N. and Li, F.: An Introduction of GNSS Reflectometer Remote Sensing Mission From Yunyao Aerospace Technology Co., Ltd, in: 2021 IEEE Specialist Meeting on Reflectometry using GNSS and other Signals of Opportunity (GNSS + R), 14–17 September 2021, 77–81, https://doi.org/10.1109/GNSSR53802.2021.9617716, 2021.
Gleisner, H., Lauritsen, K. B., Nielsen, J. K., and Syndergaard, S.: Evaluation of the 15-year ROM SAF monthly mean GPS radio occultation climate data record, Atmos. Meas. Tech., 13, 3081–3098, https://doi.org/10.5194/amt-13-3081-2020, 2020.
Ho, S., Hunt, D., Steiner, A., Mannucci, A., Kirchengast, G., Gleisner, H., Heise, S., von Engeln, A., Marquardt, C., Sokolovskiy, S., Schreiner, W., Scherllin-Pirscher, B., Ao, C., Wickert, J., Syndergaard, S., Lauritsen, K., Leroy, S., Kursinski, E., Kuo, Y., Foelsche, U., Schmidt, T., and Gorbunov, M.: Reproducibility of GPS radio occultation data for climate monitoring: Profile-to-profile inter-comparison of CHAMP climate records 2002 to 2008 from six data centers, J. Geophys. Res.-Atmos., 117, https://doi.org/10.1029/2012jd017665, 2012.
Hocke, K., Igarashi, K., and Pavelyev, A.: Irregularities of the topside ionosphere observed by GPS/MET radio occultation, Radio Sci., 37, 13-1–13-11, https://doi.org/10.1029/2001RS002599, 2002.
Kornfeld, R., Arnold, B., Gross, M., Dahya, N., Klipstein, W., Gath, P., and Bettadpur, S.: GRACE-FO: The Gravity Recovery and Climate Experiment Follow-On Mission, J. Spacecraft Rockets, 56, 931–951, https://doi.org/10.2514/1.A34326, 2019.
Kursinski, E. R., Hajj, G. A., Schofield, J. T., Linfield, R. P., and Hardy, K. R.: Observing Earth's atmosphere with radio occultation measurements using the Global Positioning System, J. Geophys. Res.-Atmos., 102, 23429–23465, https://doi.org/10.1029/97JD01569, 1997.
Li, J., Lu, C., Zheng, Y., Ban, W., and Zhang, X.: Quality Assessment and Assimilation of Tianmu-1 GNSS Radio Occultation Refractivity Observations: A Preliminary Study, IEEE T. Geosci. Remote, 63, 1–17, https://doi.org/10.1109/TGRS.2025.3615559, 2025.
Lu, W. and Chen, R.: Plotting scripts for: Global Sampling Characteristics and Coverage Complementarity of 12 GNSS Radio Occultation Constellations (Version 1.0.0), Zenodo [software], https://doi.org/10.5281/zenodo.21866427, 2027.
Masters, D., Duly, T., Esterhuizen, S., Irisov, V. G., Jales, P., Nguyen, V., Nogués-Correig, O., Tan, L., Yuasa, T., and Angling, M.: Status and accomplishments of the Spire Earth observing nanosatellite constellation, SPIE Remote Sensing, SPIE, https://doi.org/10.1117/12.2574110, 2020.
Miao, S., Sun, K., Hu, X., Chen, Y., Lv, F., Wang, J., Li, W., Wang, L., Wei, J., and Li, W.: On-Orbit Radiometric Performance Assessment of FY-3F MERSI-III: A Cross-Platform Intercomparison Approach Based on Global Pseudo-Invariant Pixels, IEEE J. Sel. Top. Appl., 18, 21514–21531, https://doi.org/10.1109/jstars.2025.3597457, 2025.
Padullés, R., Cardellach, E., Paz, A., Oliveras, S., Hunt, D. C., Sokolovskiy, S., Weiss, J.-P., Wang, K.-N., Turk, F. J., Ao, C. O., and de la Torre Juárez, M.: The PAZ polarimetric radio occultation research dataset for scientific applications , Earth Syst. Sci. Data, 16, 5643–5663, https://doi.org/10.5194/essd-16-5643-2024, 2024.
Paolella, S., Von Engeln, A., Padovan, S., Notarpietro, R., Marquardt, C., Sancho, F., Rivas Boscan, V., Morew, N., and Martin Alemany, F.: Assessment of operational non-time-critical Sentinel-6A Michael Freilich radio occultation data: insights into tropospheric GNSS signal cut-off strategies and processor improvements, Atmos. Meas. Tech., 18, 2825–2846, https://doi.org/10.5194/amt-18-2825-2025, 2025.
Righetti, P. L., de Juana Gamo, J. M., and Sancho, F.: Metop-C deployment and start of three-satellite operations, Aeronaut. J., 124, 902–916, https://doi.org/10.1017/aer.2020.10, 2020.
Rocken, C., Anthes, R., Exner, M., Hunt, D., Sokolovskiy, S., Ware, R., Gorbunov, M., Schreiner, W., Feng, D., Herman, B., Kuo, Y.-H., and Zou, X.: Analysis and validation of GPS/MET data in the neutral atmosphere, J. Geophys. Res.-Atmos., 102, 29849–29866, https://doi.org/10.1029/97JD02400, 1997.
Roh, K.-M. and Hwang, Y.: Performance Comparison of KOMPSAT-5 Precision Orbit Determination with GRACE, Int. J. Aerospace Eng., 2020, 7358286, https://doi.org/10.1155/2020/7358286, 2020.
Schmidt, D., Schreiner, P., Iijima, B., and Ao, C.: GRACE-FO radio occultation data processing – First result, https://doi.org/10.5194/gstm2020-76, 2020.
Schmidt, T., Schreiner, P., Wickert, J., Iijima, B. A., Ao, C. O., Tien, J. Y., and Meehan, T. K.: GRACE-FO Radio Occultation Data Processing, GRACE/GRACE-FO Science Team Meeting 2022, Potsdam, Germany, 18–20 October 2022, https://doi.org/10.5194/gstm2022-101, 2022.
Schreiner, W. S., Weiss, J. P., Anthes, R. A., Braun, J., Chu, V., Fong, J., Hunt, D., Kuo, Y.-H., Meehan, T., Serafino, W., Sjoberg, J., Sokolovskiy, S., Talaat, E., Wee, T. K., and Zeng, Z.: COSMIC-2 Radio Occultation Constellation: First Results, Geophys. Res. Lett., 47, e2019GL086841, https://doi.org/10.1029/2019GL086841, 2020.
Wickert, J., Reigber, C., Beyerle, G., König, R., Marquardt, C., Schmidt, T., Grunwaldt, L., Galas, R., Meehan, T. K., Melbourne, W. G., and Hocke, K.: Atmosphere sounding by GPS radio occultation: First results from CHAMP, Geophys. Res. Lett., 28, 3263–3266, https://doi.org/10.1029/2001GL013117, 2001.
Wu, D. L.: GNSS Signal Jamming as Observed From Radio Occultation, IEEE J. Sel. Top. Appl., 17, 8642–8645, https://doi.org/10.1109/JSTARS.2024.3385738, 2024.
Xu, X., Han, W., Wang, J., Gao, Z., Li, F., Cheng, Y., and Fu, N.: Quality assessment of YUNYAO radio occultation data in the neutral atmosphere, Atmos. Meas. Tech., 18, 1339–1353, https://doi.org/10.5194/amt-18-1339-2025, 2025.
Zhang, P., Hu, X., Lu, Q., Zhu, A., Lin, M., Sun, L., Chen, L., and Xu, N.: FY-3E: The First Operational Meteorological Satellite Mission in an Early Morning Orbit, Adv. Atmos. Sci., 39, 1–8, https://doi.org/10.1007/s00376-021-1304-7, 2022.
Zhang, P., Gu, S., Chen, L., Shang, J., Lin, M., Zhu, A., Yin, H., Wu, Q., Shou, Y., Sun, F., Xu, H., Yang, G., Wang, H., Li, L., Zhang, H., Chen, S., and Lu, N.: FY-3G Satellite Instruments and Precipitation Products: First Report of China's Fengyun Rainfall Mission In-Orbit, J. Remote Sens., 3, 0097, https://doi.org/10.34133/remotesensing.0097, 2023.
Zhran, M., Mousa, A., Wang, Y., Hasher, F. F. B., and Jin, S.: Assessment of Commercial GNSS Radio Occultation Performance from PlanetiQ Mission, Remote Sens., 16, 3339, https://doi.org/10.3390/rs16173339, 2024.
- Abstract
- Introduction
- Missions and data
- Global distribution characteristics of individual missions
- Joint distribution characteristics of global GNSS-RO missions
- Conclusions and outlook
- Code and data availability
- Author contributions
- Competing interests
- Disclaimer
- Acknowledgements
- Financial support
- Review statement
- References