
the Creative Commons Attribution 4.0 License.
the Creative Commons Attribution 4.0 License.
 | 11 Nov 2026
Facility-scale quantification and monitoring of ammonia (NH3) emissions using ASTER multispectral thermal infrared observations
Lidewij B. Tijhuis

Tyler Wizenberg
Enrico Dammers
Ammonia (NH3) is an important atmospheric pollutant affecting air quality, ecosystems, and climate. Hyperspectral thermal infrared sounders such as IASI and CrIS combine broad coverage with high spectral sensitivity, but their kilometer-scale footprints limit facility-scale source attribution. Here we test whether high-spatial-resolution multispectral thermal infrared imaging can detect NH3 plumes at facility scale.
We develop a physically based retrieval framework for the Advanced Spaceborne Thermal Emission and Reflection Radiometer (ASTER), combining radiative transfer calculations with lookup table (LUT) inversion. The method exploits the differential sensitivity of ASTER bands 13 and 14 to NH3 absorption in the ν2 band near 930–970 cm−1, retrieving NH3 column enhancements at 90 m spatial resolution with surface emissivity prescribed from a long-term ASTER emissivity climatology. NH3 absorption remains measurable after convolution with the ASTER spectral response functions, but retrieval performance depends strongly on thermal contrast between the surface and the NH3-bearing layer.
The retrieval is applied to three industrial NH3 point sources: Khor Al Zubair, Tolyatti, and Piesteritz. Khor Al Zubair yields repeated source-connected plumes under favorable arid conditions; Tolyatti and Piesteritz show that detection is also possible in more heterogeneous environments. Source rates derived with the Integrated Mass Enhancement method are instantaneous estimates for individual detected scenes rather than annual mean emissions, with detected-scene medians of 56.6, 27.1, and 6.0 kt yr−1 at the three sites. These agree in order of magnitude with published satellite and airborne estimates, and at Khor Al Zubair to within a few per cent of the CrIS estimate once the differing NH3 lifetime assumptions are placed on a common basis. The reported uncertainties are dominated by the assumed effective wind speed and are not a complete error budget.
Multispectral TIR imagers can therefore resolve NH3 plume structure and source location, complementing coarse-resolution sounders. Sampling is limited by revisit frequency, cloud cover and thermal contrast, so the approach suits episodic mapping of large, persistent sources and retrospective analysis of the ASTER archive.
- Article
(8546 KB) - Full-text XML
- BibTeX
- EndNote


Ammonia (NH3) is a key atmospheric pollutant with significant impacts on air quality, ecosystem health, and climate. It is primarily emitted from agriculture, including livestock farming and fertilizer application, and from industrial processes and biomass burning (Galloway et al., 2003; Erisman et al., 2008). In the atmosphere it reacts with acidic species to form secondary inorganic aerosols, contributing to fine particulate matter (PM2.5) and associated health risks (Brunekreef and Holgate, 2002; Fowler et al., 2009), while deposition of reactive nitrogen drives soil acidification and eutrophication, biodiversity loss and ecosystem degradation (Bobbink et al., 1998; De Vries et al., 2015).
NH3 nevertheless remains one of the most poorly constrained atmospheric trace gases: emission inventories carry uncertainties often exceeding 50 %, and generally fail to capture the strong temporal variability linked to agricultural practices and meteorological conditions (Skjøth and Geels, 2013; Kuenen et al., 2022). Ground-based measurements are spatially sparse and rarely capture localized emissions or short-term variability.
Satellite observations have substantially improved global monitoring of NH3 (Van Damme et al., 2014; Shephard et al., 2020). Hyperspectral thermal infrared (TIR) sounders such as the Infrared Atmospheric Sounding Interferometer (IASI) (Hilton et al., 2012) and the Cross-track Infrared Sounder (CrIS) (Han et al., 2013) provide daily global coverage and have revealed numerous previously unidentified NH3 hotspots (Van Damme et al., 2018; Dammers et al., 2019; Clarisse et al., 2023). Their coarse spatial resolution, typically 14–15 km at nadir, limits the ability to resolve individual sources: only the largest and most isolated are reliably detected, while smaller or clustered emitters remain unresolved even under long-term averaging (Van Damme et al., 2018).
High-spatial-resolution trace-gas retrievals are nevertheless possible with multispectral imagers: Sentinel-2 has detected methane (CH4) plumes at sub-hundred-meter resolution by exploiting strong absorption and high signal-to-noise despite limited spectral information (Varon et al., 2021; Gorroño et al., 2023), and Sentinel-2 and Landsat visible-band imagery has detected nitrogen dioxide (NO2) plumes from individual point sources at similar scales (Varon et al., 2024). In the thermal infrared, NH3 detection does not necessarily require full hyperspectral coverage, provided that a limited number of spectral channels sample the strongest absorption features in the ν2 band (Noppen et al., 2025), and airborne hyperspectral measurements have observed and quantified NH3 plumes from individual facilities at meter-scale resolution (Kuai et al., 2019; Noppen et al., 2023).
In this study, we assess whether NH3 plumes can be detected with a multispectral TIR satellite imager, the Advanced Spaceborne Thermal Emission and Reflection Radiometer (ASTER), which provides TIR observations at 90 m spatial resolution in five broad spectral bands. Although not designed for atmospheric trace-gas retrievals, ASTER has previously been used to retrieve volcanic SO2 plumes using TIR band ratios (Campion et al., 2010), and its band 13 overlaps the NH3 ν2 absorption region near 930–970 cm−1 (10.75–10.31 µm).
We develop a physically based retrieval combining radiative transfer modeling with a LUT-based inversion, using the differential response of bands 13 and 14 together with ASTER GED V3 emissivity, scene-level radiance correction, plume masking, and IME-based source-rate estimation. Sensitivity simulations quantify the dependence of detectability on spectral sensitivity, thermal contrast, emissivity, and radiometric noise, and the method is then applied to three industrial point sources.
Figure 1 gives an overview of the ASTER NH3 retrieval and emission quantification workflow.
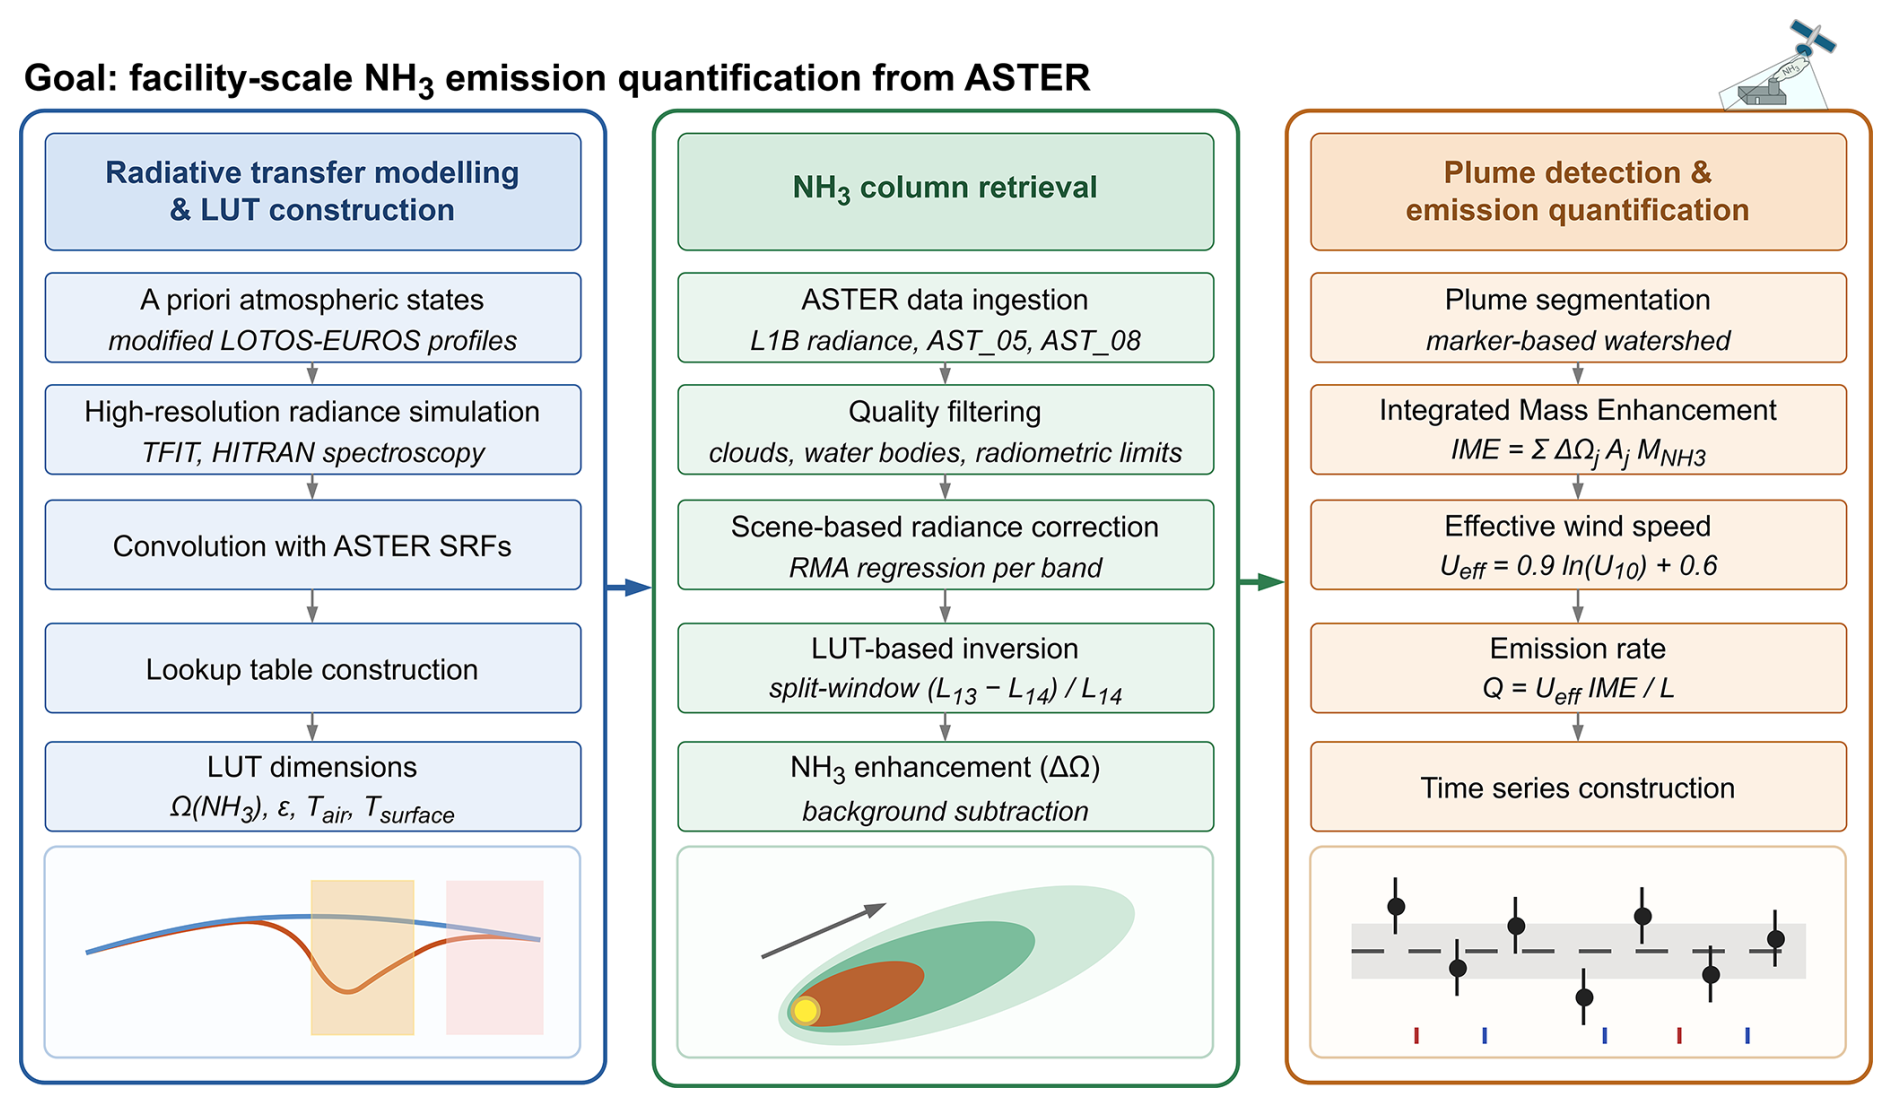
Figure 1Schematic overview of the ASTER-based NH3 retrieval and emission quantification workflow. Left: radiative transfer modeling and LUT construction (Sect. 2.2–2.3.1) using high-resolution simulations convolved with the ASTER spectral response functions. Centre: ASTER data ingestion, quality filtering, scene-based radiance correction, and NH3 column retrieval using the split-window observable and the LUT. Right: plume detection, Integrated Mass Enhancement (IME) calculation, wind-based emission estimation, and time-series construction.
2.1 ASTER instrument
ASTER, onboard NASA's Terra satellite, provides thermal infrared (TIR) observations at 90 m spatial resolution with a nominal 16 d revisit (Yamaguchi et al., 1998; Abrams et al., 2015). Scenes are acquired only when tasked, so 16 d is a revisit capability and actual scene counts at a given location can be substantially lower. The TIR subsystem operated from March 2000 until January 2026.
ASTER observations are obtained from the Level 1B radiance product (AST_L1B, Version 4), which provides calibrated TIR radiances, together with the surface emissivity (AST_05, Version 4) and surface kinetic temperature (AST_08, Version 4) products used for scene characterization and retrieval filtering (NASA/METI/AIST/Japan Spacesystems and U.S./Japan ASTER Science Team, 2025a, b, c). Surface emissivity is also taken from the multi-year mean ASTER Global Emissivity Dataset (GED) (NASA JPL, 2014).
The TIR subsystem comprises bands 10–14. The NH3 ν2 umbrella-bending band near 930–970 cm−1 falls in band 13 (913–976 cm−1); band 14 (859–913 cm−1) is a nearby reference channel with weaker NH3 sensitivity, and band 10 has negligible NH3 but strong H2O sensitivity, useful as a diagnostic against water-vapor-related variability.
Under positive thermal contrast, where the surface is warmer than the NH3-bearing air layer, NH3 absorption reduces the top-of-atmosphere (TOA) radiance in band 13 while band 14 responds weakly, and the differential response of the two forms the basis of the split-window retrieval used here. Figure 2 shows the ASTER TIR spectral response functions together with simulated optical depths for relevant atmospheric species.
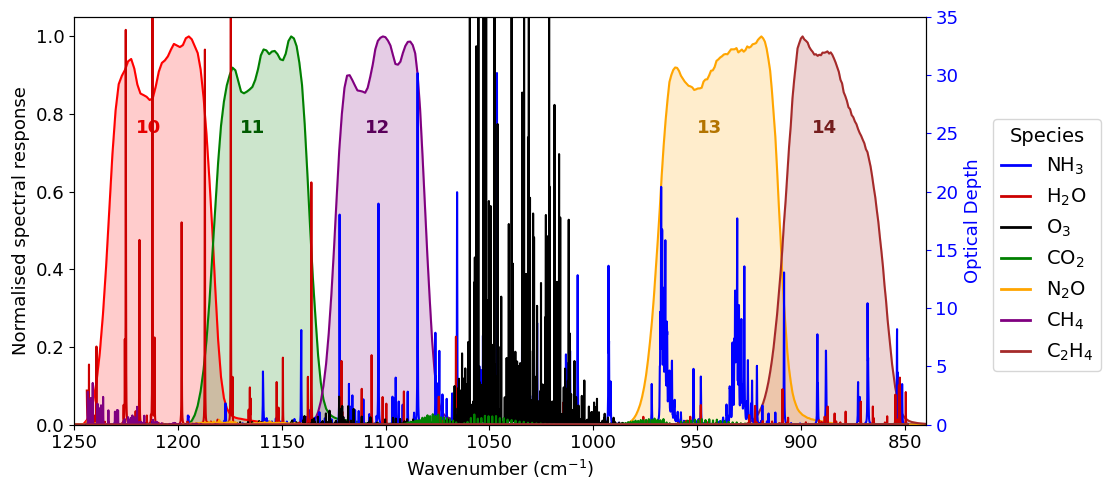
Figure 2ASTER TIR spectral response functions for bands 10–14 (shaded) overlaid with simulated optical depths for relevant atmospheric species. Band 13 covers the strongest NH3 feature near 930–970 cm−1 in a region of comparatively weak absorption by other species; band 14 covers a spectrally adjacent window with weaker NH3 absorption.
Detectability is also constrained by radiometric performance. ASTER's radiometry is stable, supported by onboard and vicarious calibration (Abrams et al., 2015); NEΔT is approximately 0.3 K at 300 K, with typical scene-based noise of about 0.1–0.2 K (Arai and Tonooka, 2005), below the NH3-induced radiance differences expected under favorable thermal contrast.
ASTER TIR observations can exhibit weak horizontal striping from detector-to-detector calibration differences (Gillespie et al., 2011), small compared with NH3 plume signals under favorable thermal contrast and further reduced by the scene-level radiance correction and the band ratio.
2.2 Radiative transfer framework
NH3 column densities are retrieved by comparing simulated ASTER band radiances with observed radiances. Simulations use TFIT, a Python-based radiative transfer model developed at TNO, with spectroscopic parameters from the HITRAN database through the HAPI interface (Kochanov et al., 2016); it represents gas absorption, surface emissivity and atmospheric temperature profiles on a flexible vertical grid. High-resolution spectral radiances are convolved with the ASTER spectral response functions (SRFs) to obtain band-integrated radiances, and are stored in a multidimensional lookup table (LUT; Sect. 2.3.1) to avoid repeated radiative transfer calculations during scene processing.
Figure 3 compares simulations with NH3 columns of 1015 and 1019 : the radiance reduction in the 930–970 cm−1 ν2 region remains measurable after convolution with the SRFs.
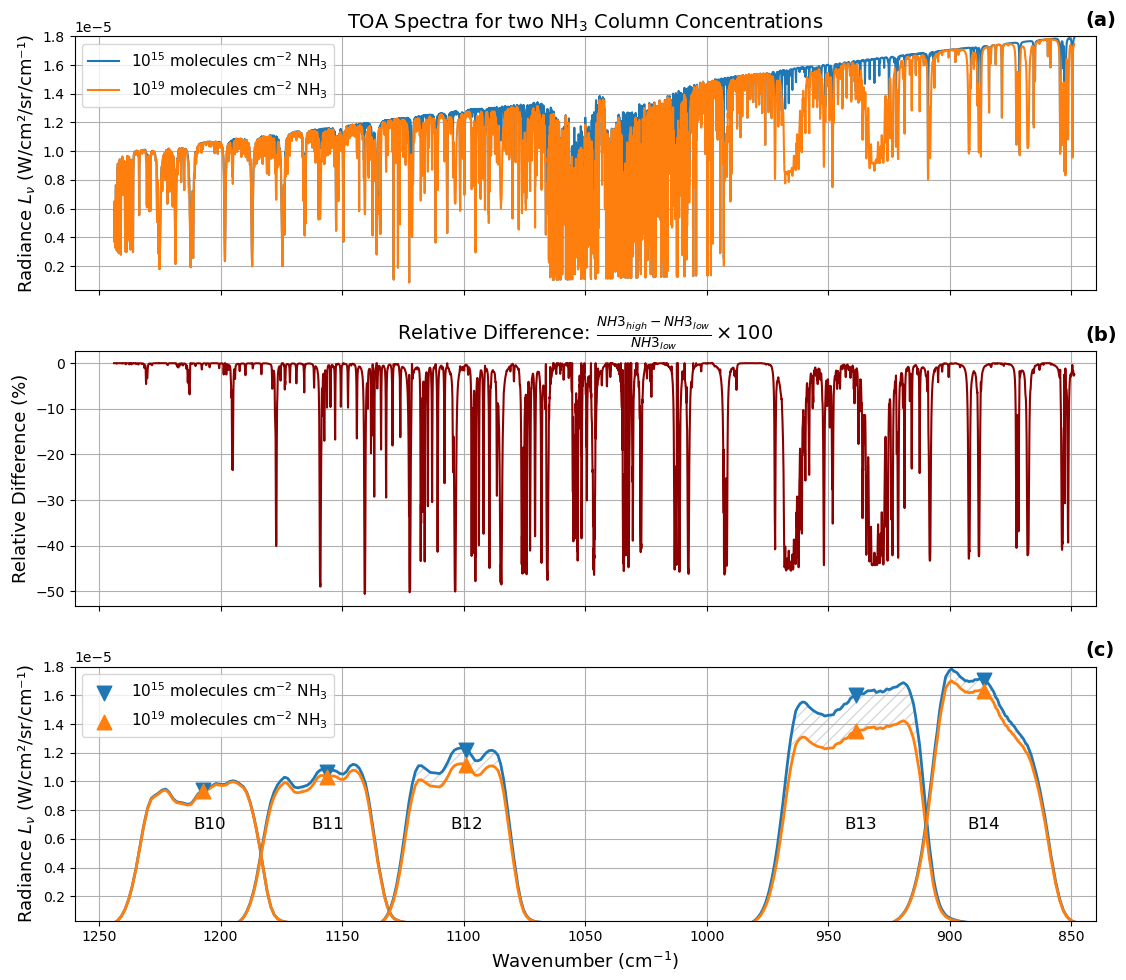
Figure 3(a) Simulated high-resolution TOA radiance spectra for two NH3 column amounts (1015 and 1019 ) across 880–1220 cm−1. (b) Relative radiance difference between the two cases. (c) ASTER spectral response functions for bands 10–14, shaded curves, overlaid with the corresponding band-integrated radiances for both cases.
2.3 Retrieval strategy
ASTER's five broad TIR bands cannot resolve individual NH3 absorption lines as hyperspectral sounders do. The retrieval instead exploits the differential sensitivity of bands 13 and 14 (Sect. 2.1) through the split-window observable
where L13 and L14 are the ASTER TOA radiances in bands 13 and 14, respectively.
The ratio enhances the differential NH3 signal while suppressing scene-wide thermal variability common to both bands. The signal remains small compared with the total TIR radiance, so the retrieval depends on accurate surface temperature, emissivity, thermal contrast and radiometric noise.
2.3.1 Lookup table construction
The LUT of TFIT-simulated radiances spans NH3 column amount, surface emissivity, near-surface air temperature and surface temperature (Table 1). For scene application the emissivity dimension is constrained by ASTER GED V3 values mapped to the TIR grid rather than the potentially plume-affected scene retrieval (Sect. 2.3.2). NH3 is prescribed in the lowest 500 m of the atmosphere, reflecting the near-surface character of most industrial plumes, and converted to layer mixing ratios using temperature-dependent air density and layer thickness.
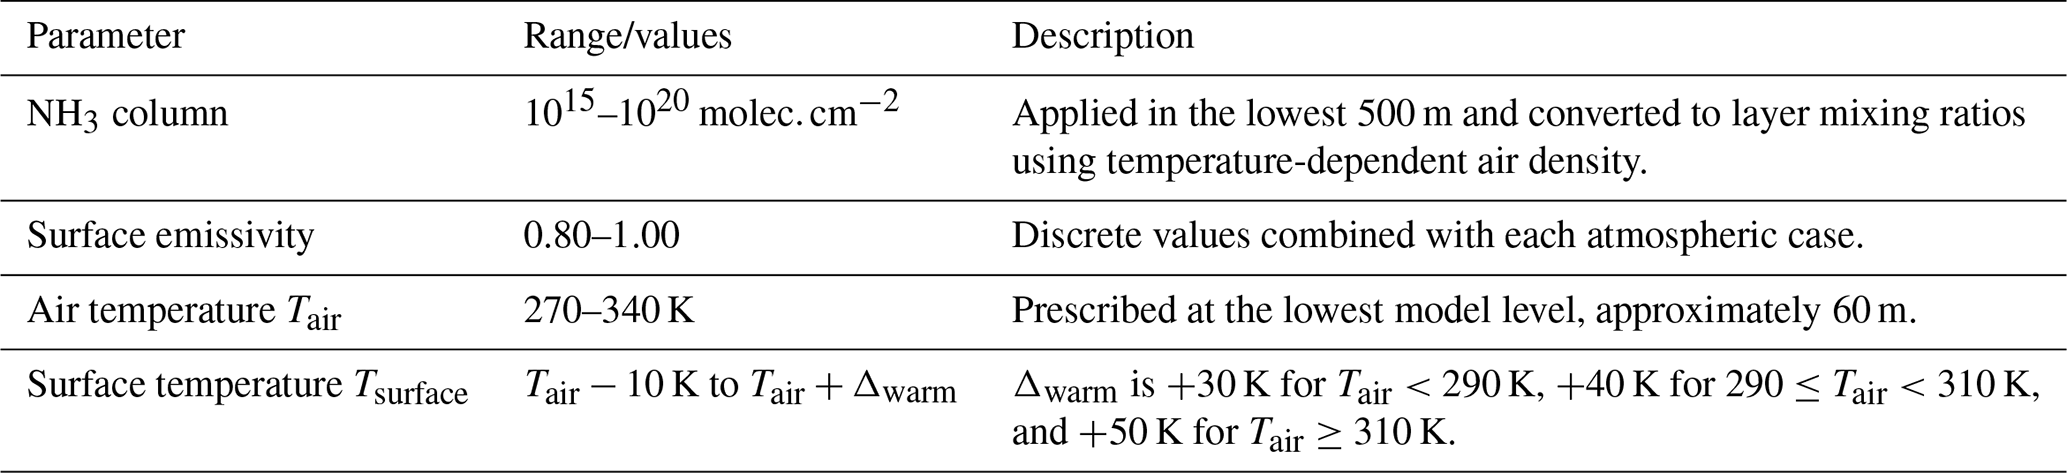
The temperature profile is not built from a fixed lapse rate. A reference LOTOS-EUROS profile supplies the vertical shape; below its uppermost levels it is replaced by a smooth quadratic fit to the same reference, rescaled linearly to match the reference at the upper anchor, essentially the tropopause, and the prescribed Tair at the lowest model level near 60 m. The gradient through the NH3 layer is therefore an outcome of that anchoring and steepens as Tair is raised, so no single lapse rate applies across the LUT.
Surface temperature is varied relative to Tair to sample a wide range of thermal contrast conditions:
Because NH3 fills the lowest 500 m, TC is a near-surface contrast rather than the layer-mean contrast experienced by the gas, a distinction that matters most near TC=0 K where retrieval sensitivity collapses and can change sign.
2.3.2 Scene-based radiance correction
A scene-based radiance correction is applied before inversion to reduce systematic offsets between the observed ASTER Level 1B and the LUT-simulated radiances, which arise from residual calibration differences, imperfect emissivity, temperature-profile uncertainty and forward-model simplifications.
Three conditions are masked before the fit: cloud-free pixels (AST_08 QA flags), water (ESRI Sentinel-2 land cover Karra et al., 2021), and a first-guess plume mask. NH3 depresses L13 but not L14, so plume pixels left in the fit would be absorbed into the correction rather than retrieved; the mask is applied to the calibration only, not the retrieval. For the same reason, band 13 emissivity is taken from the ASTER GED V3 climatology (NASA JPL, 2014) rather than the scene AST_05 retrieval, offset to the scene's own AST_05 median outside the plume mask. The scene AST_05 emissivity is kept as a diagnostic: a plume-shaped depression in ϵ13 absent in ϵ14 is an independent check consistent with NH3.
The correction is a per-band reduced major axis (RMA) regression between observed and LUT-simulated radiances, fitted over the masked valid pixels after trimming each band's most extreme percentiles; RMA is used rather than ordinary least squares because both quantities carry uncertainty. The simulated reference is evaluated at the lowest NH3 node of the LUT and is per pixel: each pixel receives its own L13 and L14, interpolated at its own air temperature, surface temperature and emissivity. The fit therefore assumes an NH3-free background, which the plume mask ensures.
For each band b, the fitted RMA relationship is applied to the observed radiance field as
where and are the observed and corrected radiances and ab and cb the scene-specific RMA slope and intercept, applied to all valid pixels, removing broad offsets while preserving local perturbations including plume-scale structure.
Because the correction is applied per band, the residual difference between the bands enters the split-window ratio directly. Its median magnitude is 1.05 times the noise-equivalent column at Khor Al Zubair, 1.61 at Piesteritz and 2.72 at Tolyatti, and it is negative in 107 of 120 scenes, so it biases against detection. A 3×3 refit on disjoint tiles gives a tile-to-tile spread of 1.10 times the noise-equivalent column, so the spatial residual is best carried as a systematic of similar size. It does not reach the source rates (, p=0.59).
The split-window observable is then calculated as
For each valid pixel, the NH3 column is retrieved as the LUT state that minimizes the squared difference between the corrected observed ratio and the LUT-simulated ratio:
Here Tair is the near-surface air temperature from the ECMWF operational IFS forecast archive, interpolated in height to the approximately 60 m bottom layer of the LUT, Tsurface the ASTER surface temperature and ϵ the emissivity. All three are prescribed, so NH3 is the only free parameter; errors in them alias directly into the retrieved column and are quantified in Sect. 4.
2.3.3 Plume detection
Retrieved columns are converted to enhancements by subtracting a scene-dependent background, estimated from quality-filtered clear-sky pixels outside the source region. Pixels enter the detection only if they satisfy the quality criteria of Sect. 2.3.2, have finite retrieval values, and lie within 30 km of the source, which defines the domain used for the IME.
A pixel enters the candidate plume mask when its enhancement above the scene background exceeds a detection threshold set per pixel,
with nσ=2. is the per-pixel noise-equivalent column of Sect. 3.1.2, which varies with the local thermal contrast and radiance; σgeo is a single scene value for the spatial variability of the background NH3 field.
The background spread σbg is not used directly: as the spread of retrieved columns it already contains the radiometric noise of the background sample, which would otherwise be counted twice. Removing the mean-square noise of that sample gives
so a pixel of average noise is tested against exactly nσσbg and noisier pixels against a stricter threshold; where the background is consistent with pure noise, σgeo vanishes and the threshold rests on the radiometric limit alone.
A strong plume can raise its own background and hence its own threshold, so the background is re-estimated once with the first-pass detection dilated out of the sample.
Candidate pixels are segmented with a marker-based watershed method following Goudar et al. (2023), so that only plume regions connected to the source are inverted, which allows irregular plume shapes. The resulting mask defines the region over which the Integrated Mass Enhancement is calculated (Frankenberg et al., 2016; Varon et al., 2018). nσ=2 is a compromise for a mass-balance application: a higher threshold truncates the diffuse plume edges that carry a substantial part of the integrated mass, a lower one admits background structure into the integral.
Each overpass falls into one of five classes. A scene is detected when the segmentation returns a source-connected plume and a source rate is derived; where the threshold mask finds an enhancement the segmentation does not connect to the source, no rate is reported. A null detection has no plume but enough sensitivity over the source region for a reference-size plume to have been detected, and is an upper limit plotted at Qmin. A scene is insensitive when no plume could have been detected regardless of the emission, and unusable when residual cloud or a retrieval failure prevents assessment. Insensitive scenes are excluded from the reported statistics; counting them as zero would bias any mean downwards by an amount set by the observing conditions rather than by the facility.
2.3.4 Integrated Mass Enhancement method
The IME is the total excess NH3 mass contained within the detected plume (Frankenberg et al., 2016; Varon et al., 2018):
where ΔΩj is the background-corrected NH3 column enhancement in pixel j, Aj is the pixel area, and converts molecules to mass.
The emission rate is calculated as
where Ueff is the effective wind speed and Aplume is the area of the masked detected plume (Sect. 2.3.3), following Varon et al. (2018).
The parameterization was derived for methane plumes (Sect. 4). Wind fields and near-surface air temperatures come from the ECMWF operational IFS forecast archive and are grid-scale: they may not capture plume-scale flow at the source, the plume height, or the exact overpass time, and their horizontal resolution increases across the record from F256 to F640 to F1280. Wind speed and direction are used as transport constraints rather than exact descriptions of the observed plume motion.
Three terms are propagated into the reported uncertainty on Q, combined as relative errors in quadrature: background subtraction, systematic and scaling with the plume area; the per-pixel radiometric noise, independent between pixels and scaling as ; and Ueff, fixed at 50 % for every scene. That is the upper end of the 15 %–50 % Varon et al. (2018) derive when U10 comes from a meteorological database rather than measurement at the source, and is appropriate to the low wind speeds of most detections here; since Q is linear in Ueff, every reported bar is close to ±50 % of Q. Wind direction, the Ueff parameterization, plume masking, surface emissivity, the vertical distribution of NH3 and absorption by co-emitted species are identified but not propagated; Appendix B lists all identified terms with their magnitudes.
Because the IME is integrated over the plume observed within the 30 km domain at a single overpass, Q is an instantaneous effective source rate for that scene. All source rates reported below, including detected-scene medians and means, are statistics over such snapshots rather than annual or facility-average emissions.
2.4 Target locations
Three sites span a range of source strengths and observing conditions: Khor Al Zubair (Iraq), Tolyatti (Russia) and Piesteritz (Germany), drawn from satellite-based hotspot studies (Dammers et al., 2019; Van Damme et al., 2018) for persistent, well-documented emissions, availability of ASTER observations, and contrasting surface and thermal conditions. All three are fertilizer complexes producing ammonia and urea, so the differences in detection performance below reflect the observing conditions rather than the type of source.
Khor Al Zubair (47.836° E, 30.187° N) is the benchmark case: a large plant in a hot arid environment with frequent positive thermal contrast and limited cloud contamination. Tolyatti (49.614° E, 53.544° N) is one of the largest known industrial NH3 point sources but lies in a more heterogeneous temperate environment. Piesteritz (12.586° E, 51.876° N) is a smaller but well-characterized European source close to the practical detection limit, for which independent airborne hyperspectral TIR observations provide an external reference (Noppen et al., 2023).
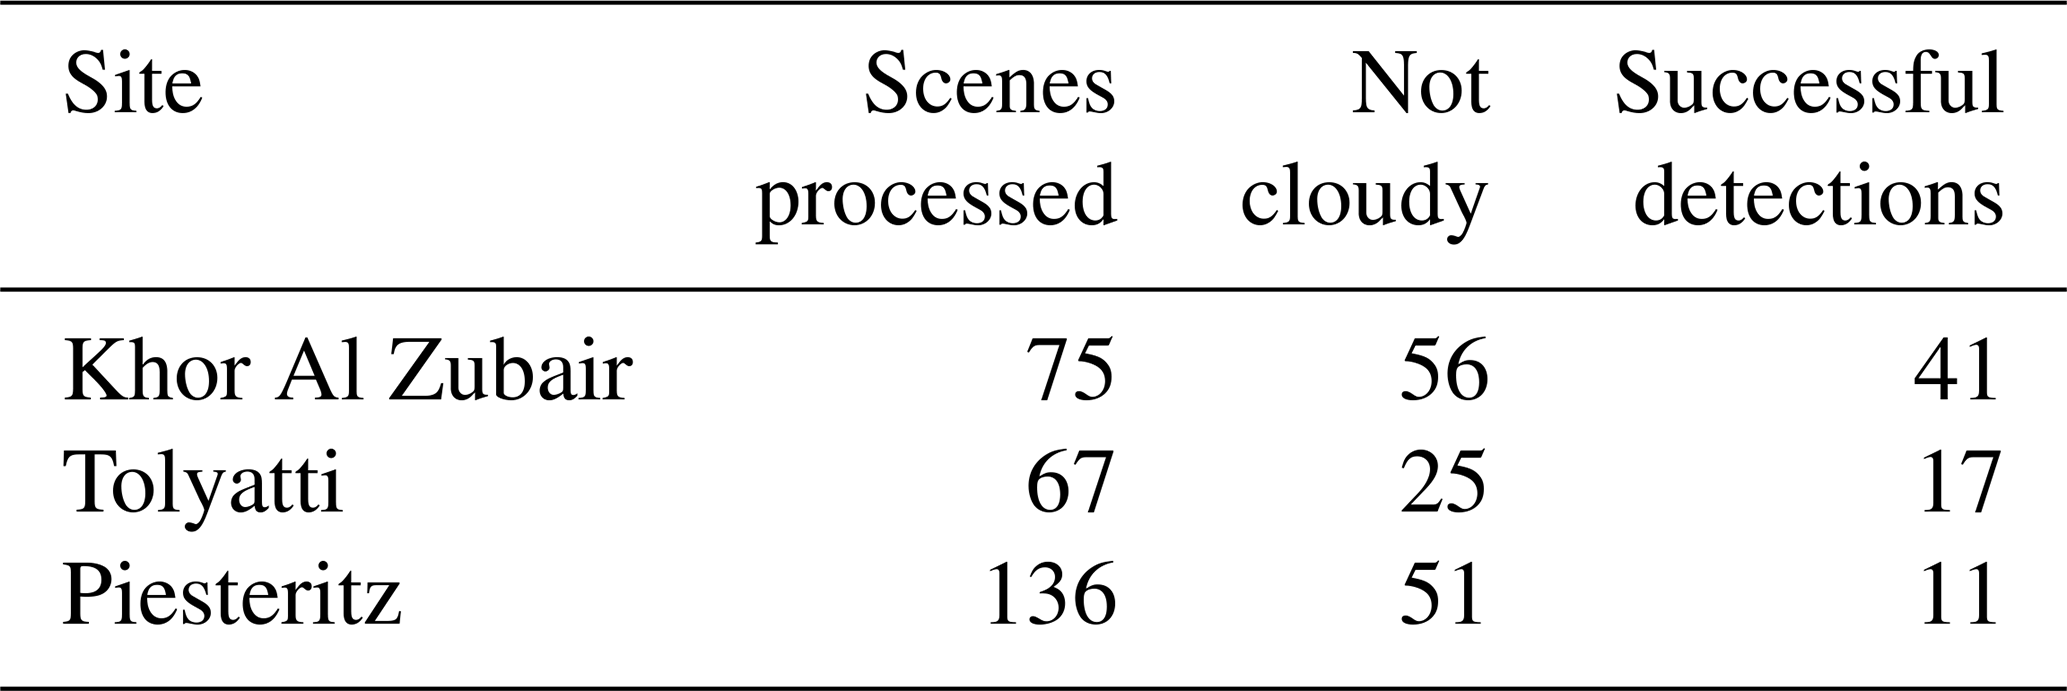
Table 2 summarizes ASTER scene availability and detection success for each site.
Table 2Summary of ASTER scene availability and retrieval success. Scenes processed is the total acquired over the site; not cloudy those remaining after cloud pre-screening, which are carried through the retrieval; successful detections those with a source-connected NH3 plume for which a source rate is reported.
3.1 Sensitivity analysis
Detectability depends on three coupled factors: the spectral sensitivity of the bands, thermal contrast between the surface and the NH3-bearing layer, and radiometric noise, quantified here from forward-modeled band-integrated radiances and the band differences and ratios of bands 13 and 14 (Campion et al., 2010).
Forward simulations of bands 10–14 (Fig. A1) confirm the band selection of Sect. 2.1: band 13 responds to NH3 already at moderate columns, band 14 only weakly. Band 12 is also NH3 sensitive at high columns but lies in a spectrally crowded region; bands 10 and 11 are retained only as diagnostics. The split-window response steepens with increasing positive TC, as expected for infrared sounding of near-surface gases (Di Gioacchino et al., 2024; Campion et al., 2010) and as Fig. A2 shows for surface temperatures from 306 to 336 K against a fixed 300 K air temperature. The collapse near TC=0 K and the sign change at negative TC fall outside that range and appear in Fig. 4; that regime is rarely exploitable and is not targeted here.
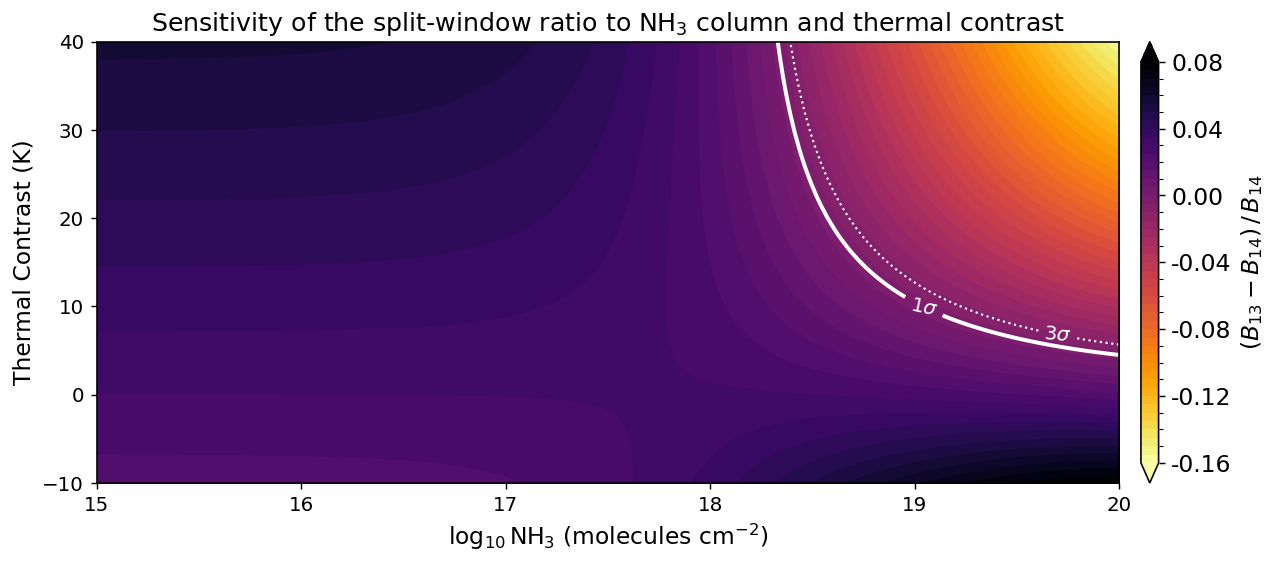
Figure 4Simulated dimensionless split-window ratio as a function of the NH3 total column and the thermal contrast , for a lower-atmospheric temperature of 300 K and a surface emissivity of 0.97. Negative thermal contrast produces a sign reversal consistent with emission-like behavior. The white curves mark the detectability limits for n=1 (solid) and n=3 (dotted), with for the noise assumption of Sect. 3.1. Regions to the right of a contour are detectable at that confidence level.
Throughout this section, detectability estimates assume a per-band radiometric noise of 0.15 K, representative of the typical scene-based noise of the ASTER TIR bands (Sect. 2.1; Arai and Tonooka, 2005) rather than the 0.3 K NEΔT specification. The propagated ratio noise σR scales linearly with this value. Appendix A gives the underlying single-parameter simulations.
3.1.1 Joint sensitivity to NH3 and thermal contrast
Figure 4 shows the split-window observable as a function of NH3 column amount and thermal contrast. Near zero thermal contrast the ratio is nearly flat across all columns; with increasing thermal contrast it becomes progressively more negative at high NH3 burden as band 13 absorption strengthens relative to band 14.
3.1.2 Radiometric noise and uncertainty propagation
Radiometric noise sets the lower limit of detectable NH3 enhancement and propagates directly into retrieval uncertainty. The ASTER NEΔT is converted to radiance noise using the Planck function and propagated through the LUT-derived sensitivities, following the noise-equivalent gas-column approach of Campion et al. (2010) adapted to NH3 and the band 13–14 split-window ratio.
For a single band, the noise-equivalent NH3 column is
where σL is the radiance noise and is evaluated from the LUT.
For the split-window ratio, the radiance noise from bands 13 and 14 is propagated as
where
The corresponding NH3 uncertainty is obtained by dividing the ratio uncertainty by the local LUT sensitivity:
Forming the ratio costs radiometric precision on both sides of this expression: combining two bands raises σR by about for equal per-band noise and L13≈L14, and because band 14 is not entirely insensitive to NH3, part of the band 13 response cancels in the difference. The second effect is the larger, and together they place the noise-equivalent column of the ratio about an order of magnitude above that of band 13 alone, the price of the scene-level robustness for which the ratio is used (Sect. 2.3). It constrains single-pixel precision rather than the coherent plume structures on which detection depends.
Figure 5 shows the resulting noise-equivalent column: it rises sharply where the LUT sensitivity is weakest and falls to order 1017–1018 for stronger thermal contrast. The maximum lies near TC=2 K rather than 0 K, because TC is built from the air temperature at a single level near 60 m whereas the radiative signal is set by the NH3 layer as a whole (Sect. 2.3.1), and because a surface emissivity below unity means the response passes through zero while the layer is still marginally cooler than the surface.
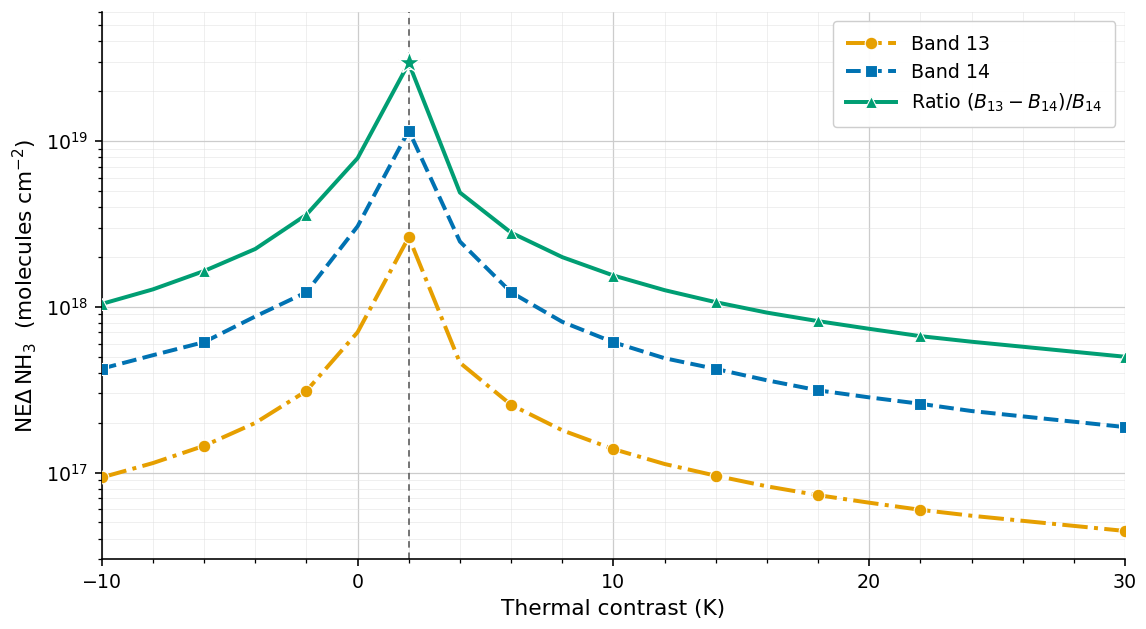
Figure 5Noise-equivalent NH3 column as a function of thermal contrast for ASTER bands 13 and 14 and the split-window ratio , from LUT-based TOA radiance sensitivities at a fixed surface temperature of 300 K. The dashed line marks the loss of sensitivity, near TC=2 K rather than 0 K for the reasons given in the text.
These are theoretical single-pixel limits and lower bounds rather than detection thresholds: in real scenes the retrieval also depends on spatial coherence, surface heterogeneity, background subtraction, plume masking, residual radiance artifacts, and possible spectral interference.
3.2 Demonstration of the retrieval workflow
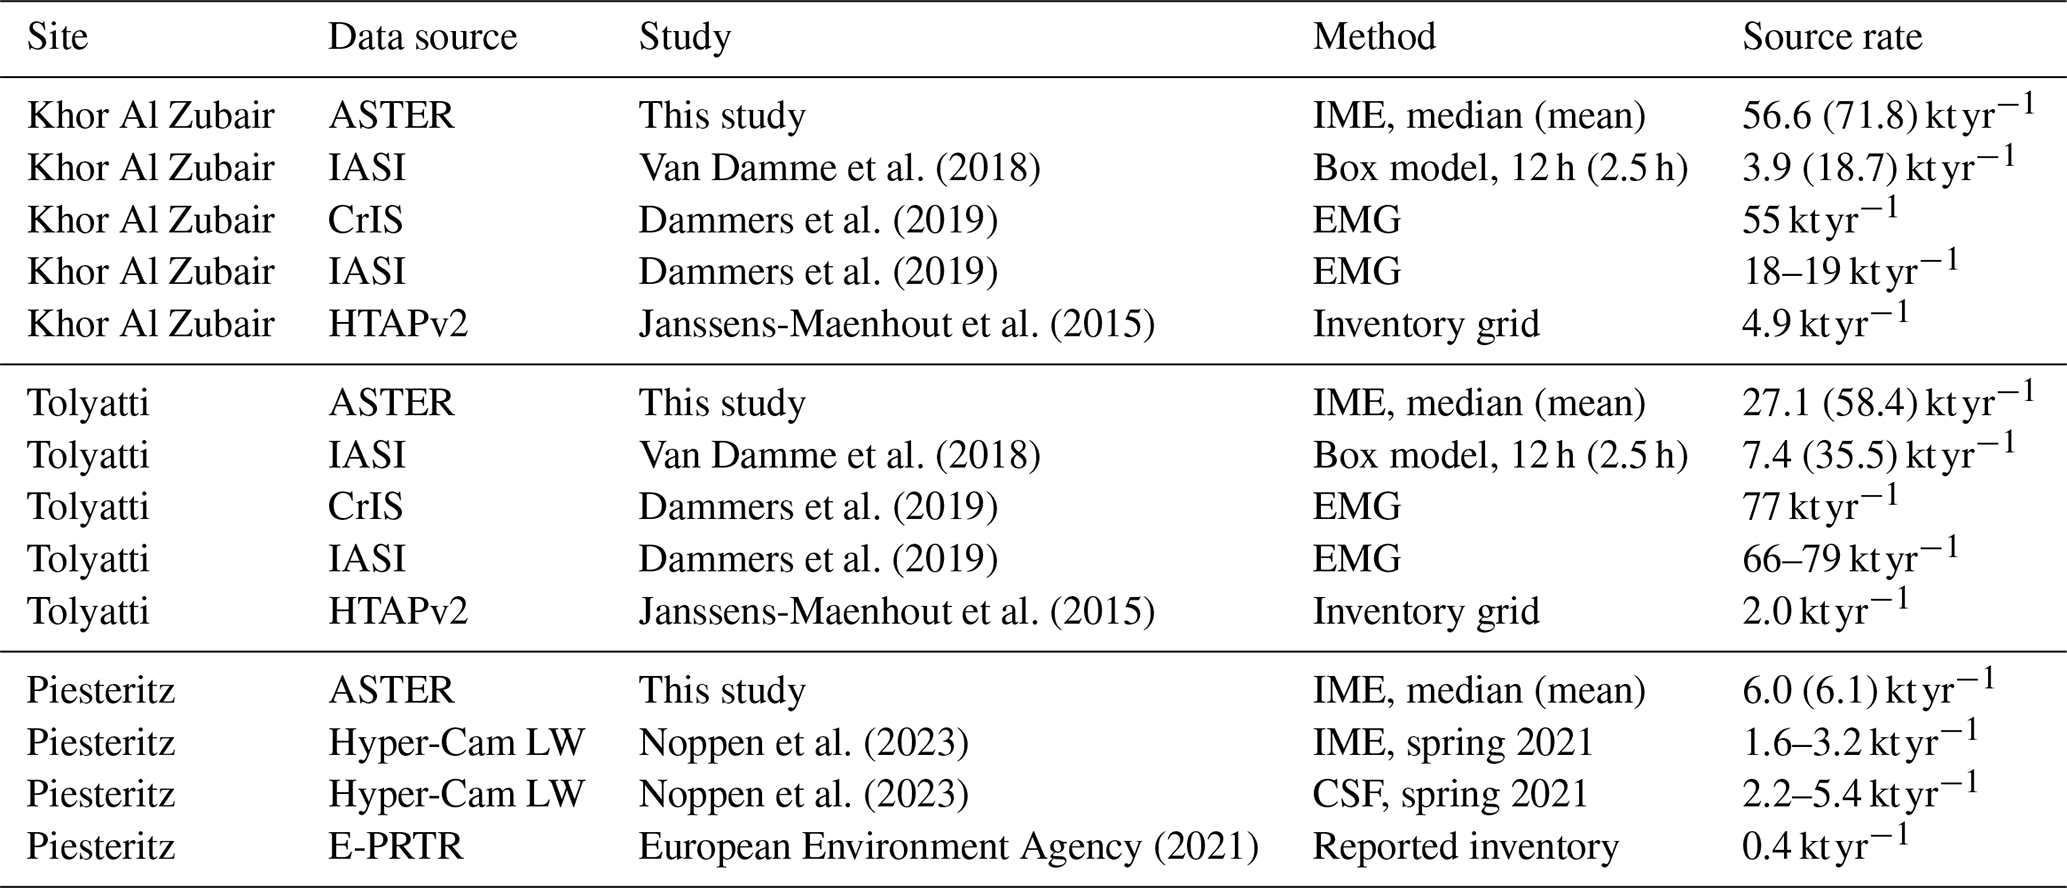
The processing chain is that of Sect. 2.3. Table 3 summarizes the detected-scene source-rate statistics with published NH3 estimates for the three sites. The retrieved distributions are right-skewed, so the median is quoted as the central value with the arithmetic mean in parentheses and the interquartile range as the spread. The listed studies differ in spatial resolution, sampling, lifetime assumptions and wind treatment, so the comparison is method-dependent context rather than validation.
Van Damme et al. (2018)Dammers et al. (2019)Dammers et al. (2019)Janssens-Maenhout et al. (2015)Van Damme et al. (2018)Dammers et al. (2019)Dammers et al. (2019)Janssens-Maenhout et al. (2015)Noppen et al. (2023)Noppen et al. (2023)European Environment Agency (2021)Table 3ASTER detected-scene source-rate statistics with published NH3 estimates and inventory values. Parenthesised values follow the Method column: for ASTER rows the arithmetic mean of the detected scenes; for the Van Damme et al. (2018) rows the published value rescaled from 12 to the 2.5 h lifetime used by Dammers et al. (2019), the box-model rate scaling as . Dammers et al. (2019) values are 9-year IASI oversampled averages; Dammers et al. (2019) values wind-rotation EMG estimates with τ=2.5 h and σ=15 km; HTAPv2 from the 1.0°×1.0° gridded inventory; Noppen et al. airborne Hyper-Cam LW estimates under different plume-rise assumptions; E-PRTR a reported facility-level value (European Environment Agency, 2021).
3.2.1 Khor Al Zubair
Khor Al Zubair is the most favorable case: frequent positive thermal contrast and limited cloud. The arid background is not radiometrically uniform, and variability in mineral emissivity, surface temperature or suspended dust can introduce structured noise and plume-like artifacts away from the source.
Figure 6 shows a retrieval on 4 April 2000, with a narrow, coherent enhancement connected to the source. Plume-like features from nearby oil and gas activity are visible in the VNIR imagery and radiances but are not retrieved as NH3. The plume axis does not coincide exactly with the ECMWF wind direction (Sect. 2.3.4).
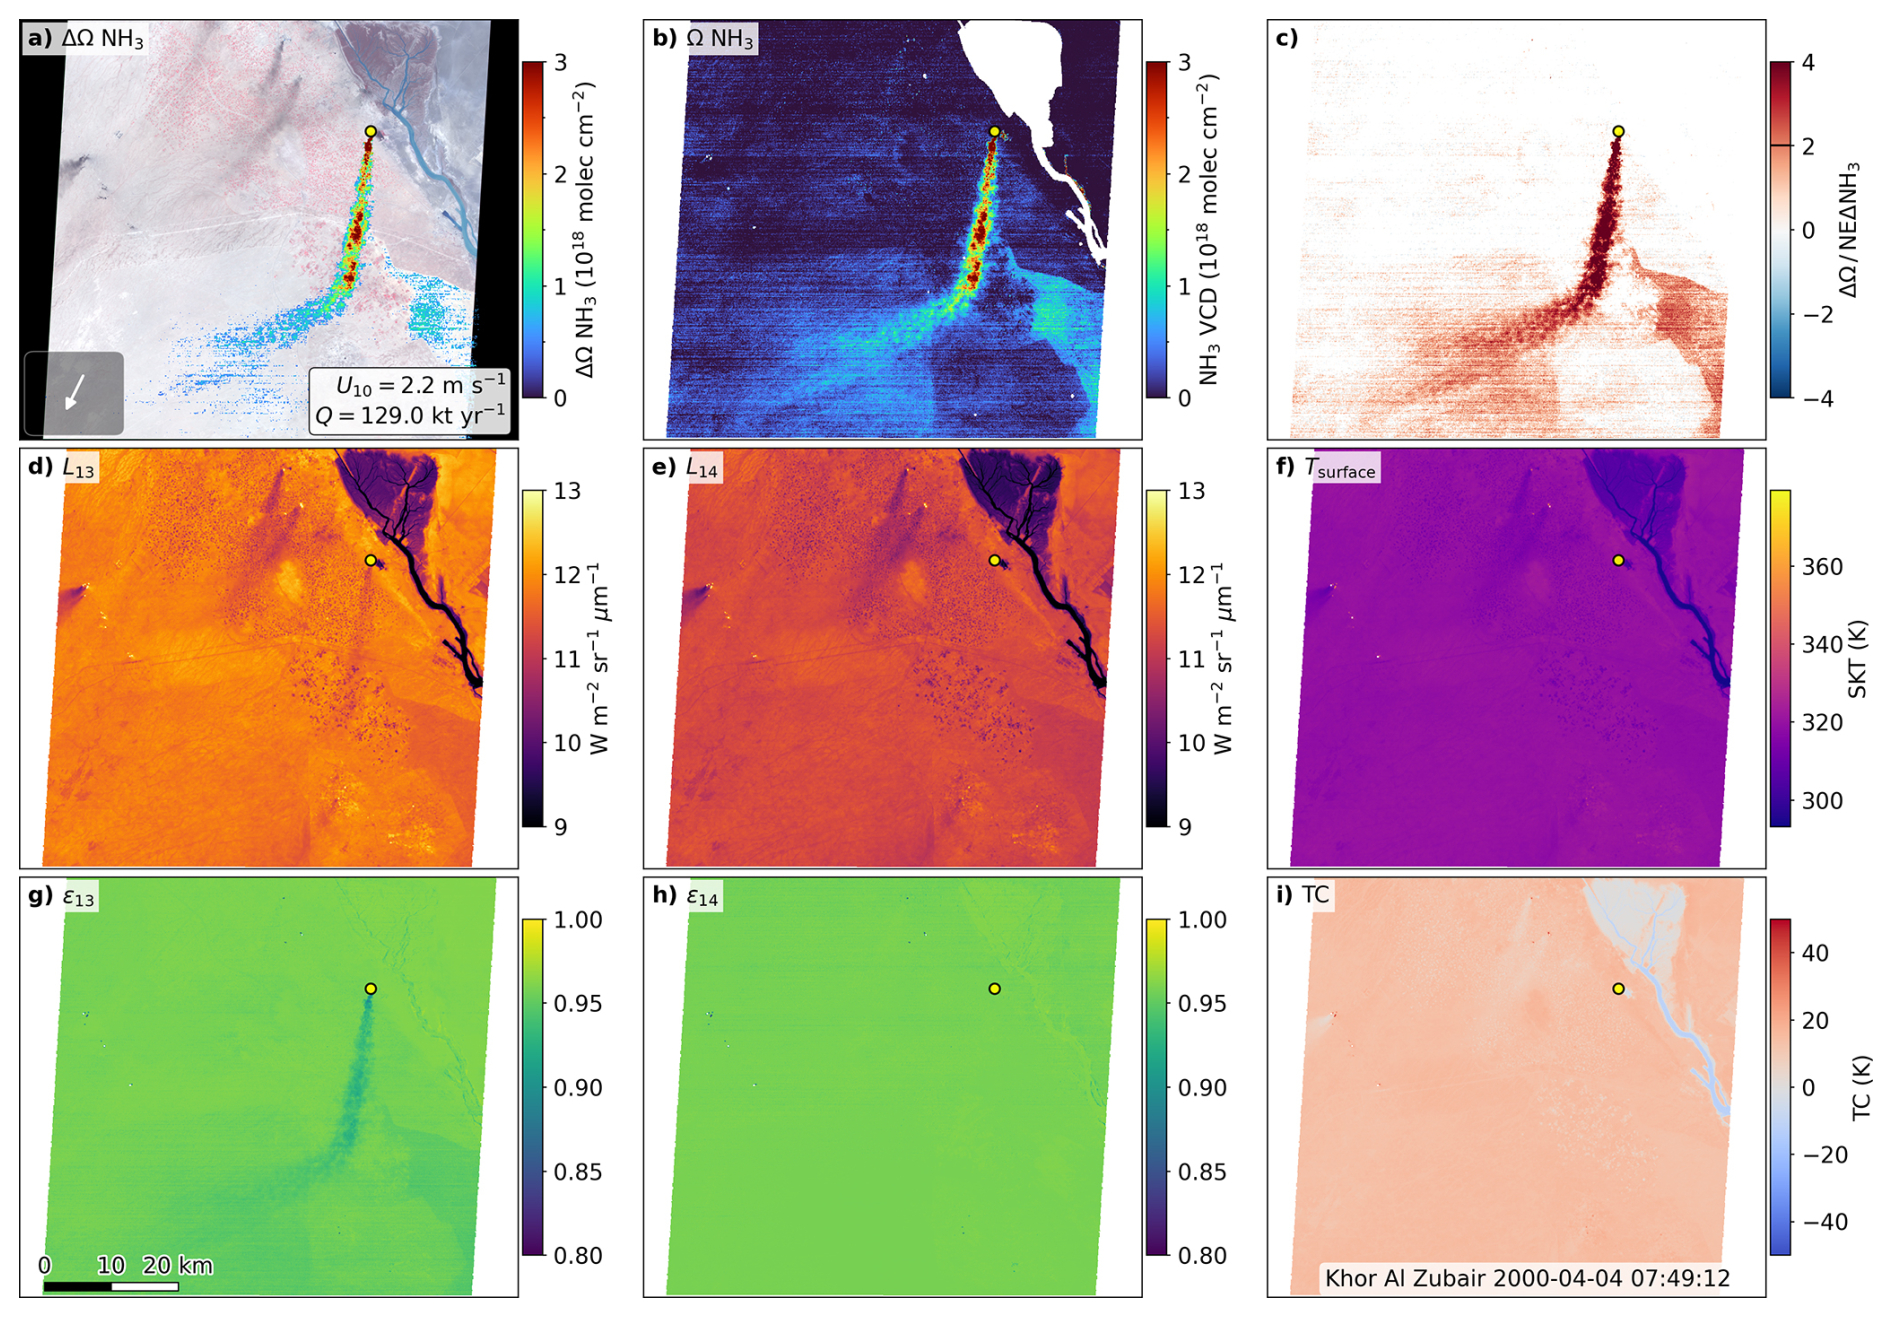
Figure 6ASTER retrieval of the NH3 plume at Khor Al Zubair, 4 April 2000, 07:49 UTC. All panels share the 90 m TIR grid; the scale bar in panel (g) applies throughout, north is up, the yellow marker is the facility location, and white denotes no valid retrieval. (a) VNIR false-color composite overlaid with the enhancement for pixels above the 2σ threshold of Eq. (6); this display mask omits the distance, coherence and emissivity-contrast gates, so the colored pixels are a superset of those integrated for Q. The inset arrow gives the ECMWF 10 m wind direction (fixed length); the label gives the wind speed and the source rate, 129.0 kt yr−1. (b) Retrieved column Ω, unmasked, on the color scale of panel (a); horizontal striping is the residual detector calibration pattern of Sect. 2.1. (c) Enhancement divided by the per-pixel threshold denominator of Eq. (6); σgeo vanishes for this scene, so the denominator reduces to NEΔNH3, and the tick marks the 2σ threshold. (d, e) Calibrated radiances in bands 13 and 14 on a common scale spanning the 1st–99th percentiles of both. (f) ASTER surface kinetic temperature. (g, h) AST_05 scene-retrieved emissivity in bands 13 and 14, a diagnostic only: the depression in ϵ13 absent in ϵ14 is consistent with NH3. (i) Thermal contrast, .
Of the 75 ASTER scenes acquired over Khor Al Zubair between 2000 and 2025, nineteen were pre-screened as cloud-affected and the remaining 56 processed. Of these, 41 yield a source-connected plume, five an enhancement that the segmentation does not connect to the source, nine no usable sensitivity, and one a retrieval failure (Table 2). The spread between successful overpasses may reflect real emission variability, but also differences in wind speed and direction, plume geometry and height, and the retrieval terms of Sect. 2.3.4.
The detected-scene median of 56.6 kt yr−1 (mean 71.8 kt yr−1, interquartile range 27.2–98.7 kt yr−1, n=41) is close to the CrIS EMG estimate of 55 kt yr−1 and above the IASI EMG estimates of 18–19 kt yr−1 of Dammers et al. (2019) (Table 3). It is an order of magnitude above the IASI box-model value of 3.9 kt yr−1 of Van Damme et al. (2018), but the box-model rate scales as : rescaling from 12 h to the 2.5 h used by Dammers et al. (2019) raises it to 18.7 kt yr−1, in line with the IASI EMG value. On a common lifetime the two IASI estimates agree, and the remaining separation is between IASI on one side and ASTER and CrIS on the other.
Surface emissivity and co-absorber effects should be smaller here than at the other sites because of the arid background, although dust, mineral emissivity variability and surface temperature structure may still contribute to scene-to-scene variability.
3.2.2 Tolyatti
Tolyatti lies in a temperate, spatially heterogeneous environment where favorable thermal contrast occurs less frequently than at Khor Al Zubair, and where emissivity variability associated with land cover, infrastructure and soil moisture increases the background variability in the retrieved NH3 field.
Figure 8 shows a favorable overpass on 14 July 2004, with a coherent enhancement extending downwind from the source and peaks exceeding 1018 . Background variability in both the retrieved column and the detection ratio is stronger than at Khor Al Zubair, consistent with heterogeneous emissivity, land-surface properties and varying thermal contrast.
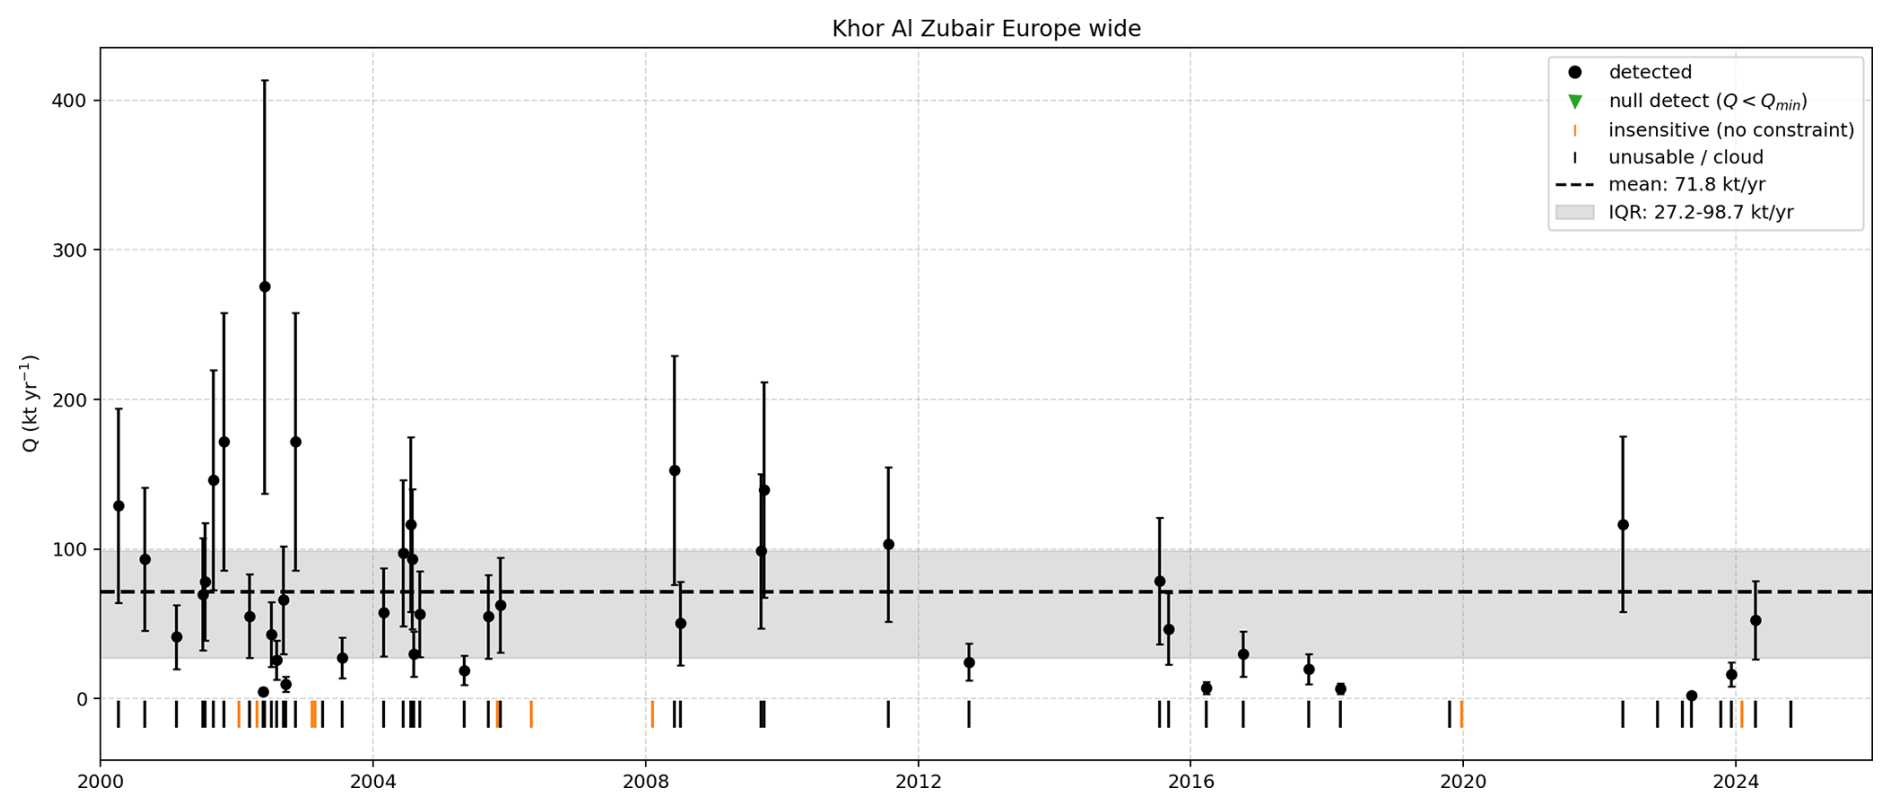
Figure 7Time series of ASTER-derived NH3 source rates at Khor Al Zubair, 2000–2025. Black circles are scenes with a source-connected plume, with their 1σ uncertainty; the dashed line marks the detected-scene mean of 71.8 kt yr−1 (median 56.6 kt yr−1) and the gray band the interquartile range, 27.2–98.7 kt yr−1. Ticks along the bottom mark the remaining scenes as insensitive (orange) or unusable (black), which are excluded from the statistics (Sect. 2.3.3); no null detections occur at this site.
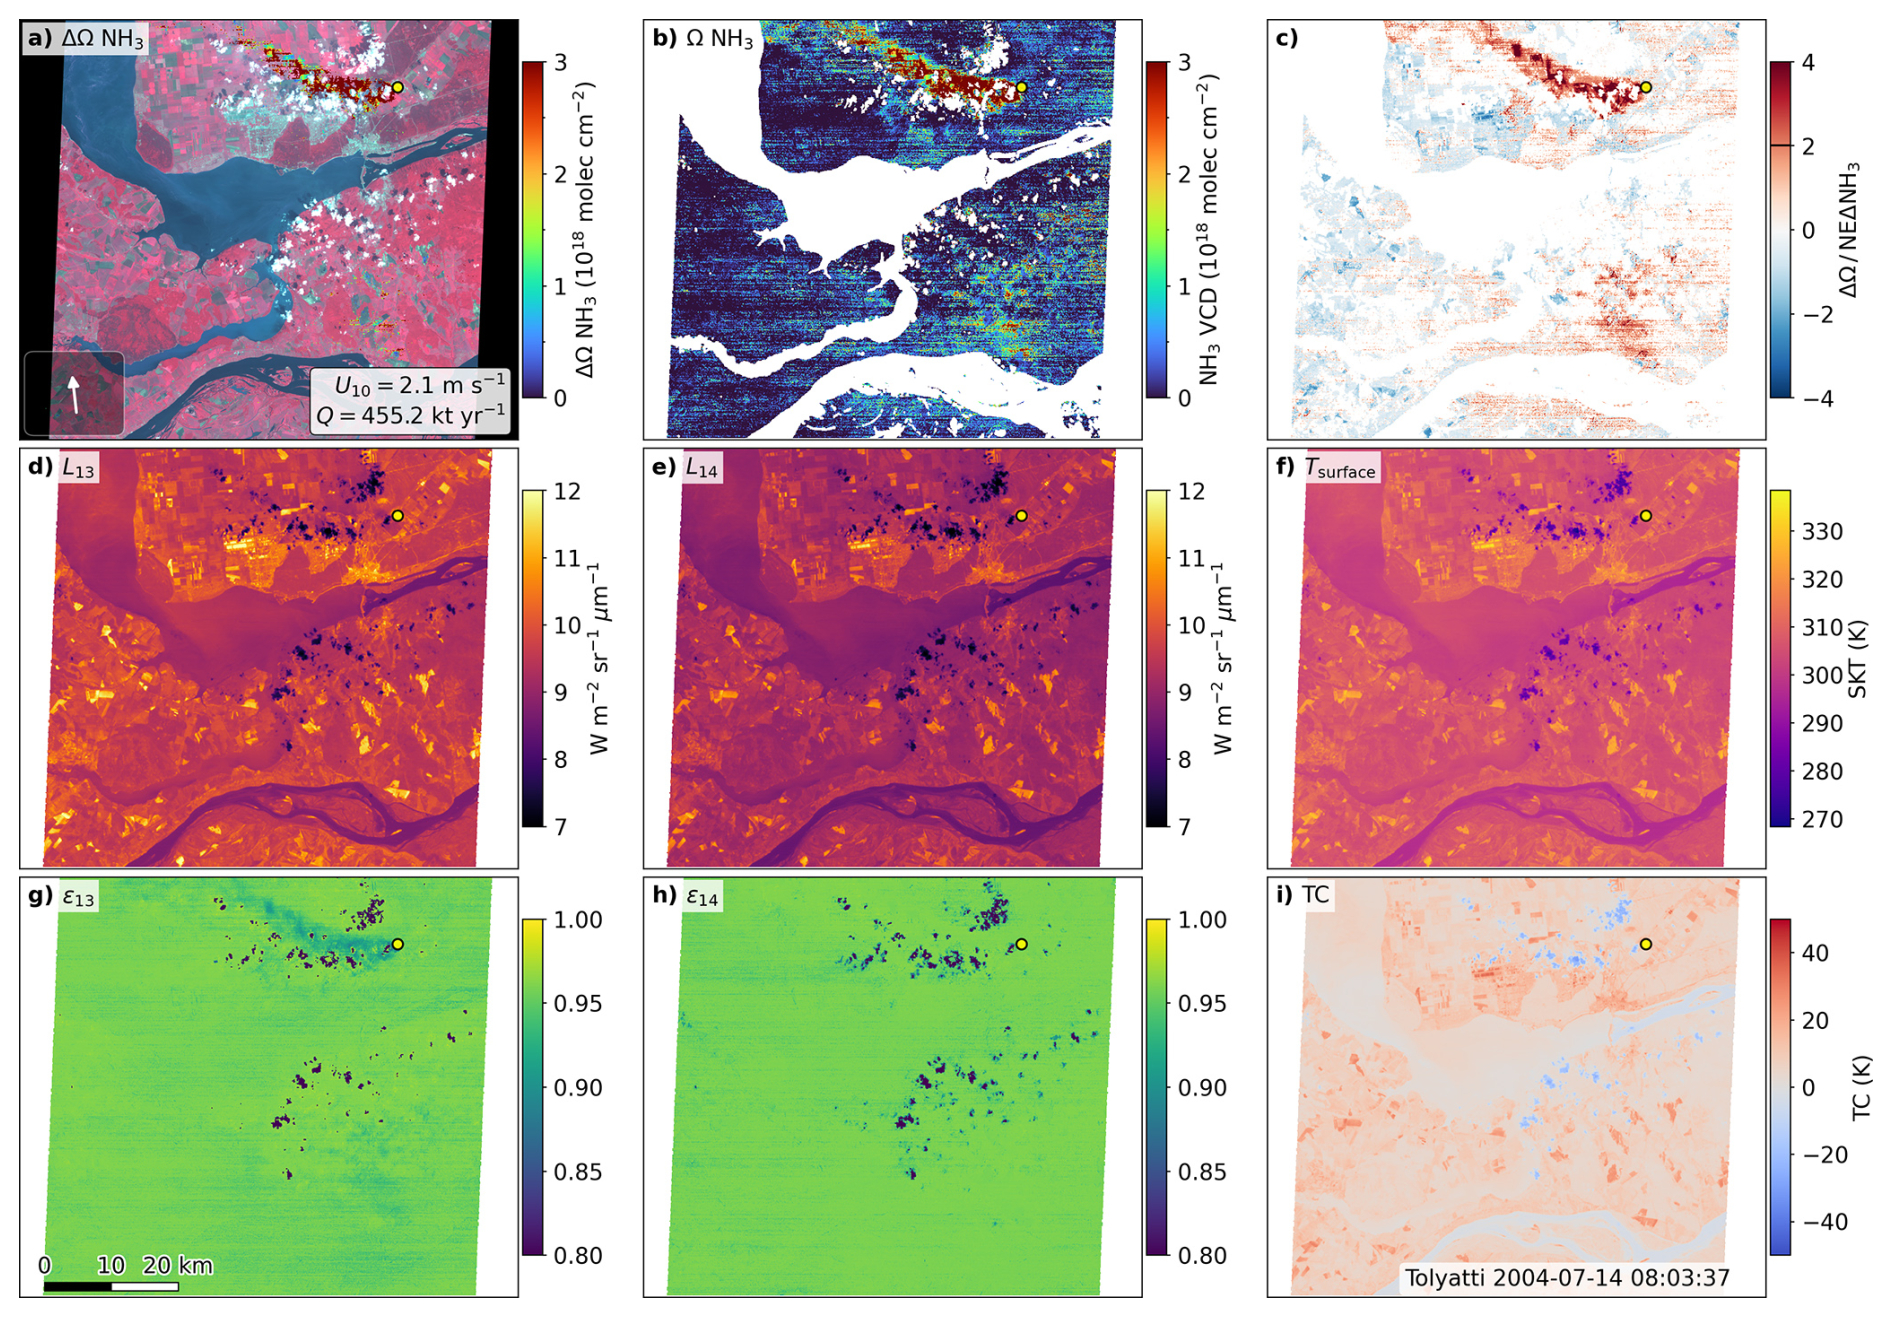
Figure 8ASTER retrieval of the NH3 plume at Tolyatti, 14 July 2004, 08:03 UTC. Panels, color scales and conventions are as in Fig. 6. The extensive white area in panels (b) and (c) is the Kuybyshev reservoir, removed by the water mask; the plume core exceeds the 2σ threshold in panel (c). The source rate for this overpass, 455.2 kt yr−1, is the largest in the record and far above the detected-scene median of 27.1 kt yr−1. The 10 m wind speed of 2.1 m s−1 places the scene in the low-wind regime where the Ueff term dominates the uncertainty on Q.
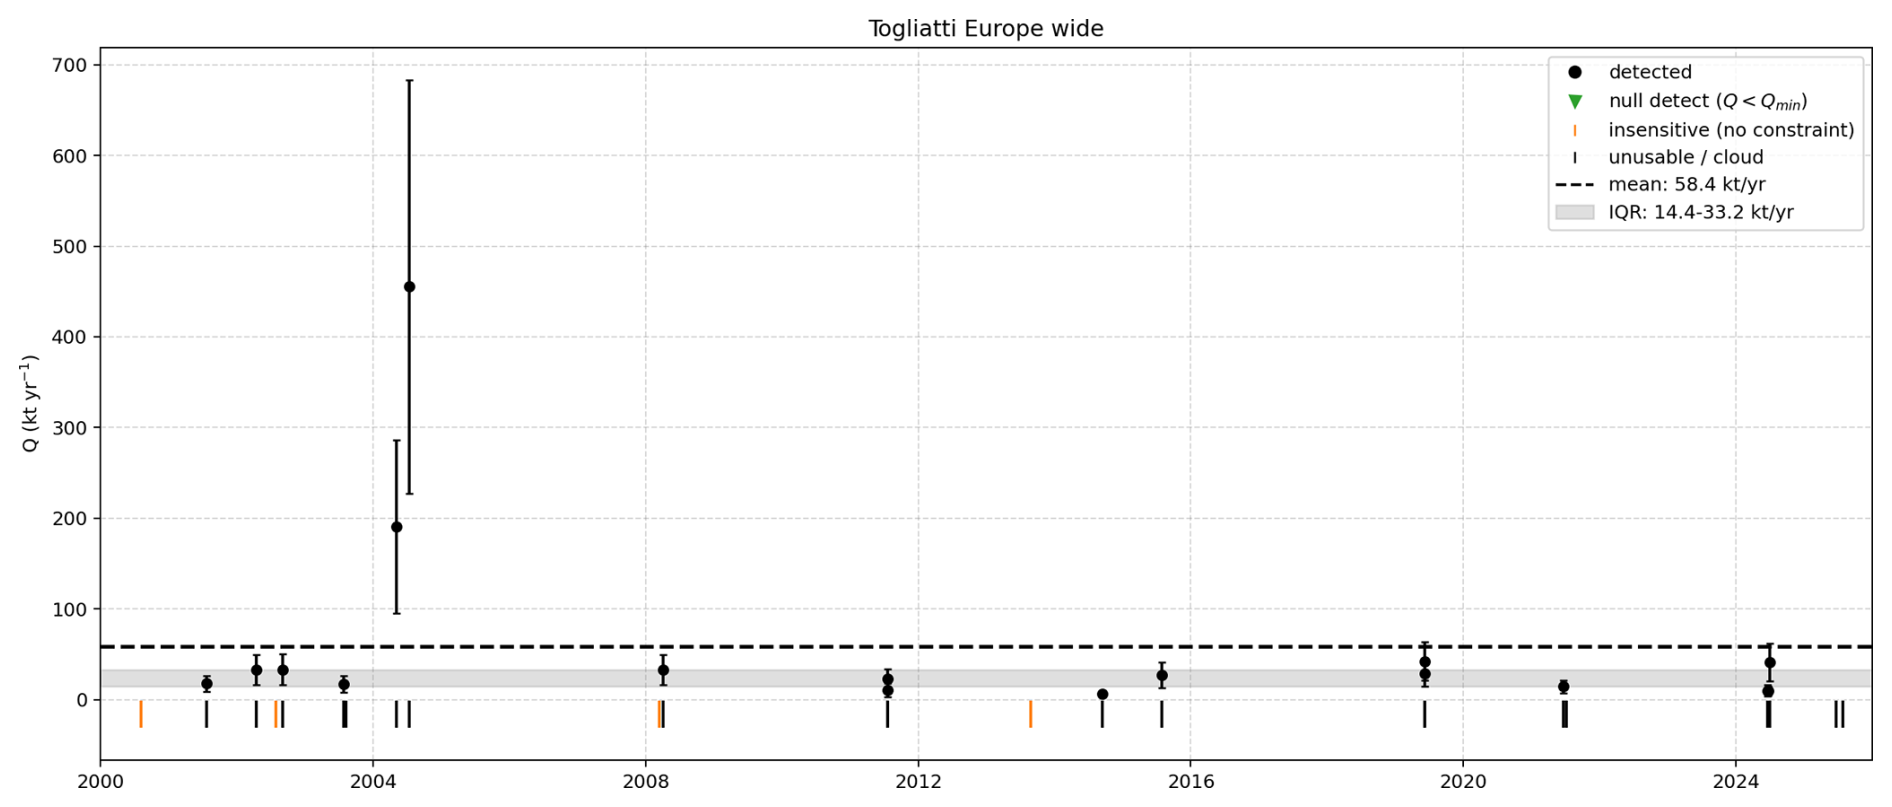
Figure 9Time series of ASTER-derived NH3 source rates at Tolyatti, 2000–2025. Symbols are as in Fig. 7. The dashed line marks the detected-scene mean of 58.4 kt yr−1 and the gray band the interquartile range, 14.4–33.2 kt yr−1. Two overpasses in 2004 return 191 and 455 kt yr−1 while the remaining fifteen fall below 45 kt yr−1, so the mean exceeds the upper quartile; the dashed line is retained only for comparability with the other sites.
Of 67 acquired scenes, 42 were pre-screened as cloud-affected and 25 analyzed, yielding 17 detections (Table 2). The pre-screening fraction is 63 % against 25 % at Khor Al Zubair.
The detected-scene median of 27.1 kt yr−1 (n=17, interquartile range 14.4–33.2 kt yr−1) lies well below the EMG estimates of Dammers et al. (2019), 77 kt yr−1 from CrIS and 66–79 kt yr−1 from IASI, and well above the IASI box-model value of 7.4 kt yr−1 of Van Damme et al. (2018) as published. Rescaled from the assumed 12 h lifetime to 2.5 h as in Sect. 3.2.1 the box-model value becomes 35.5 kt yr−1, just above the ASTER median rather than a factor of four below it, so on a common lifetime the record is bracketed within roughly a factor of three by the two IASI approaches. The distribution is the most strongly skewed of the three sites: two overpasses in 2004 return 191 and 455 kt yr−1 and alone raise the arithmetic mean to 58.4 kt yr−1, above the upper quartile, while removing the largest lowers it to 33.6 kt yr−1. The rank correlation between source rate and near-source thermal contrast is not significant at any site (p=0.27, 0.87, and 0.99 for Khor Al Zubair, Piesteritz and Tolyatti respectively), so the two scenes are not a thermal-contrast artifact.
That the lifetime assumption accounts for so much of the divergence above is a structural advantage of high-spatial-resolution imagers: no chemical lifetime enters the ASTER calculation, because the IME integrates mass directly within a plume resolved within a few kilometers of the stack. The independence is not complete: for the scene of Fig. 6 the mask spans km, about 0.6 h of transport at the observed 2.2 m s−1, so a lifetime of a few hours implies some loss before the plume leaves the domain and the reported Q is a lower bound.
3.2.3 Piesteritz
Piesteritz tests ASTER close to the lower end of the practical detection range.
Figure 10 shows a retrieval on 1 June 2008. The enhancement is far weaker than at the other two sites and confined to a compact cluster immediately downwind of the source, with the rest of the scene dominated by speckle. Its source rate, 6.0 kt yr−1, coincides with the detected-scene median.
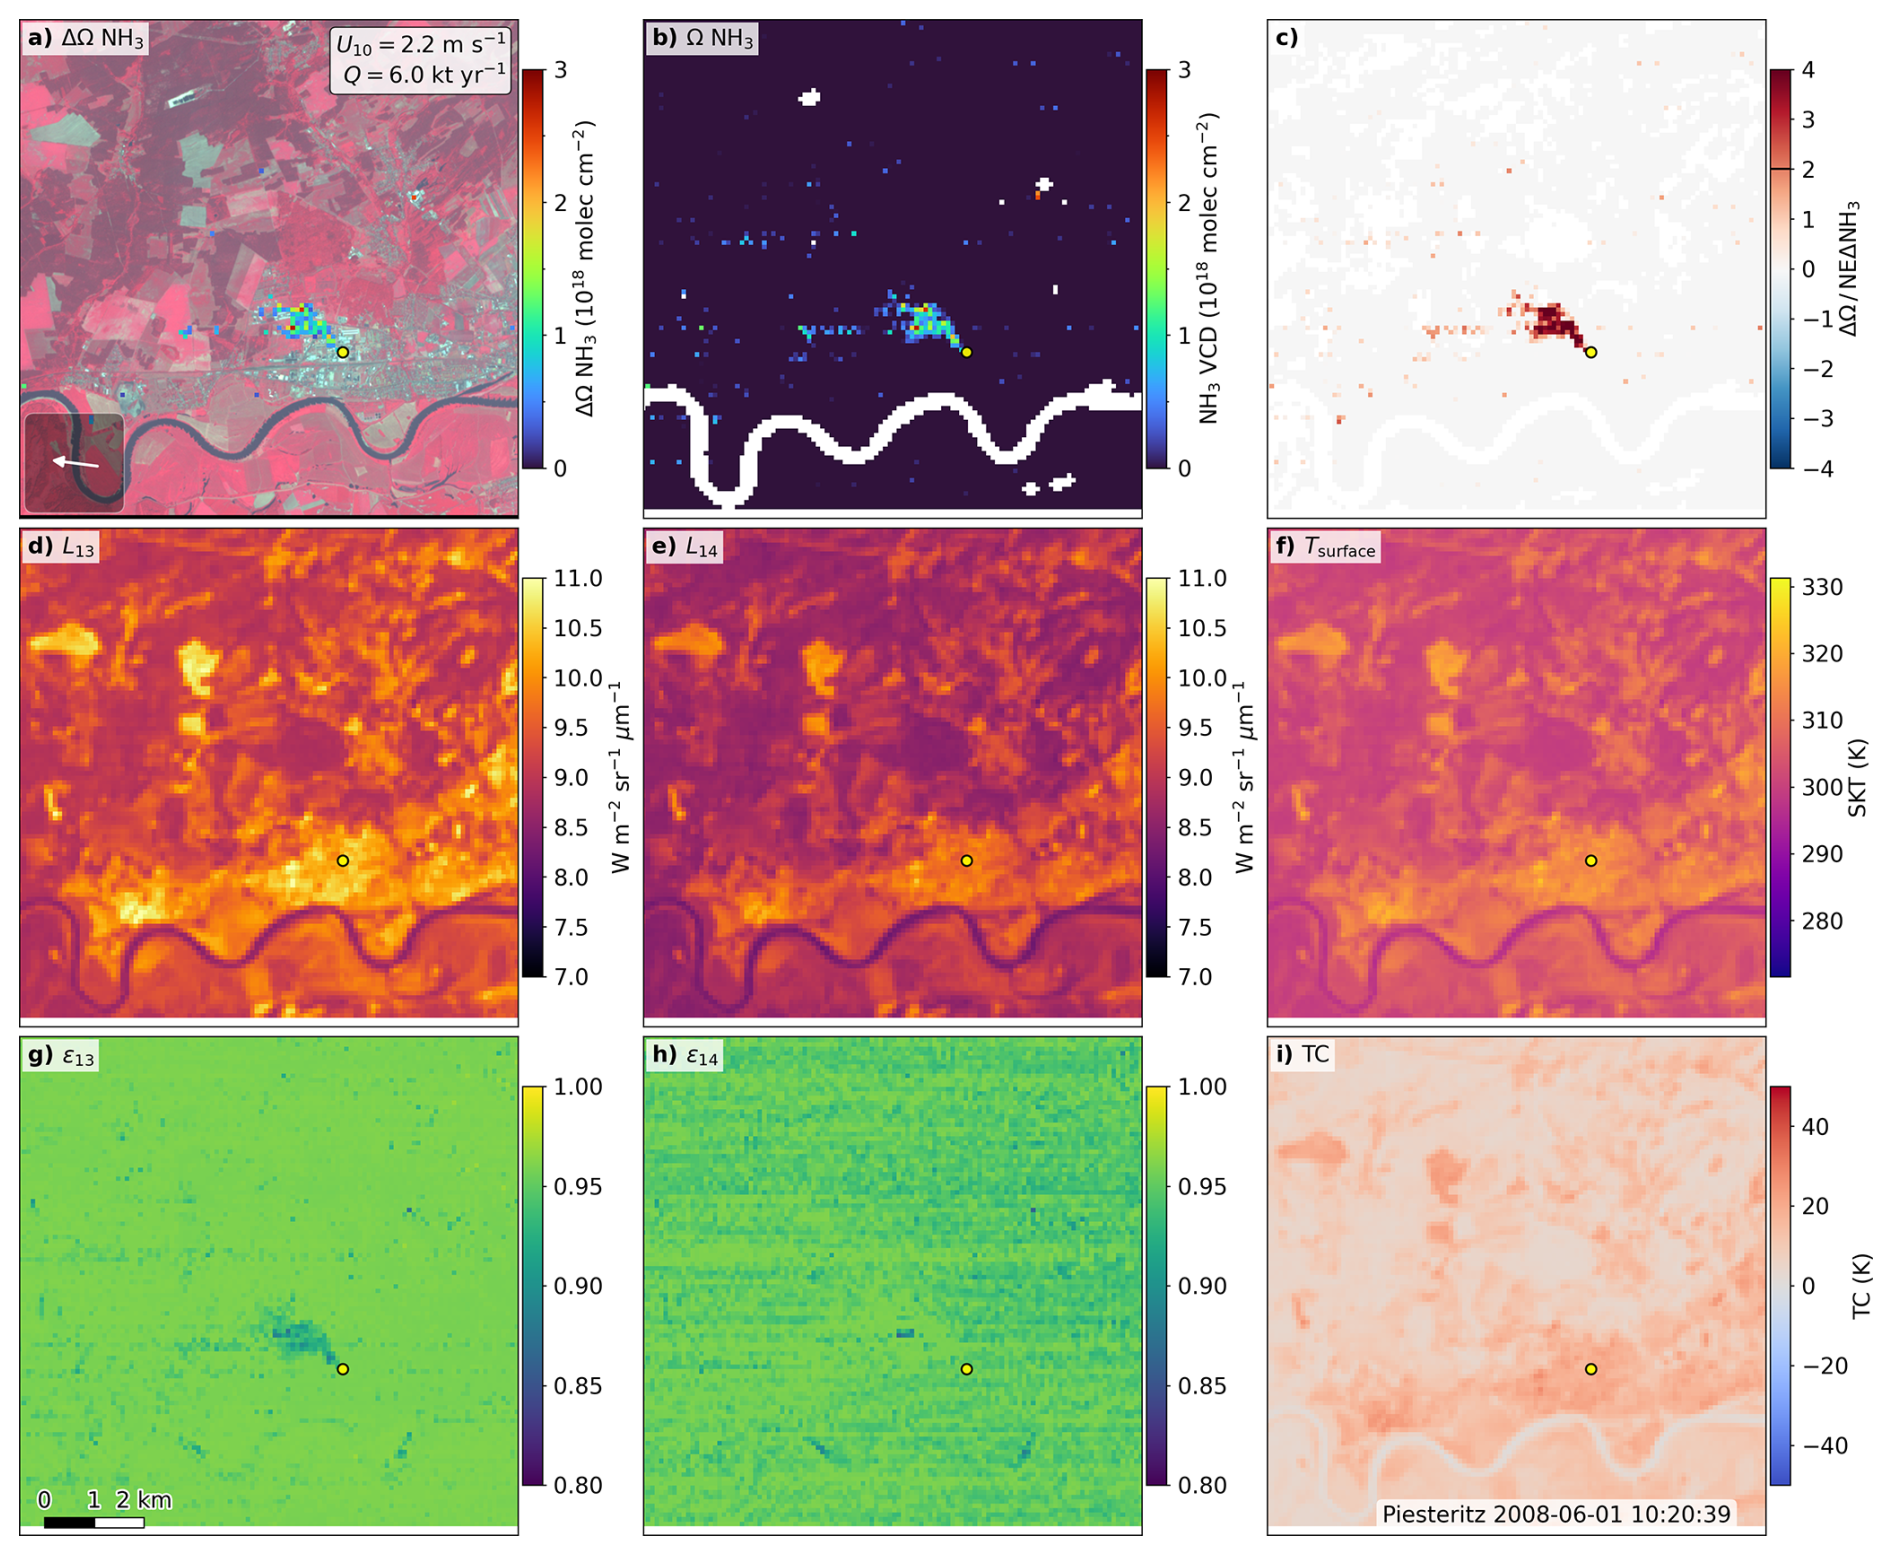
Figure 10ASTER retrieval over Piesteritz, 1 June 2008, 10:20 UTC. Panels, color scales and conventions are as in Fig. 6; note the much smaller scale bar in panel (g), as this scene is shown on a 10 km window centered on the facility. The white band across the lower part of the scene is the Elbe, removed by the water mask, and only the compact near-source cluster in panel (a) exceeds the 2σ threshold in panel (c). A compact depression is resolved in ϵ13 (g) at the source with no counterpart in ϵ14 (h), the band-selective signature expected of unmodeled NH3 absorption; the banding in panel (h) is the residual detector calibration pattern of Sect. 2.1. The source rate of 6.0 kt yr−1 rests on few pixels.
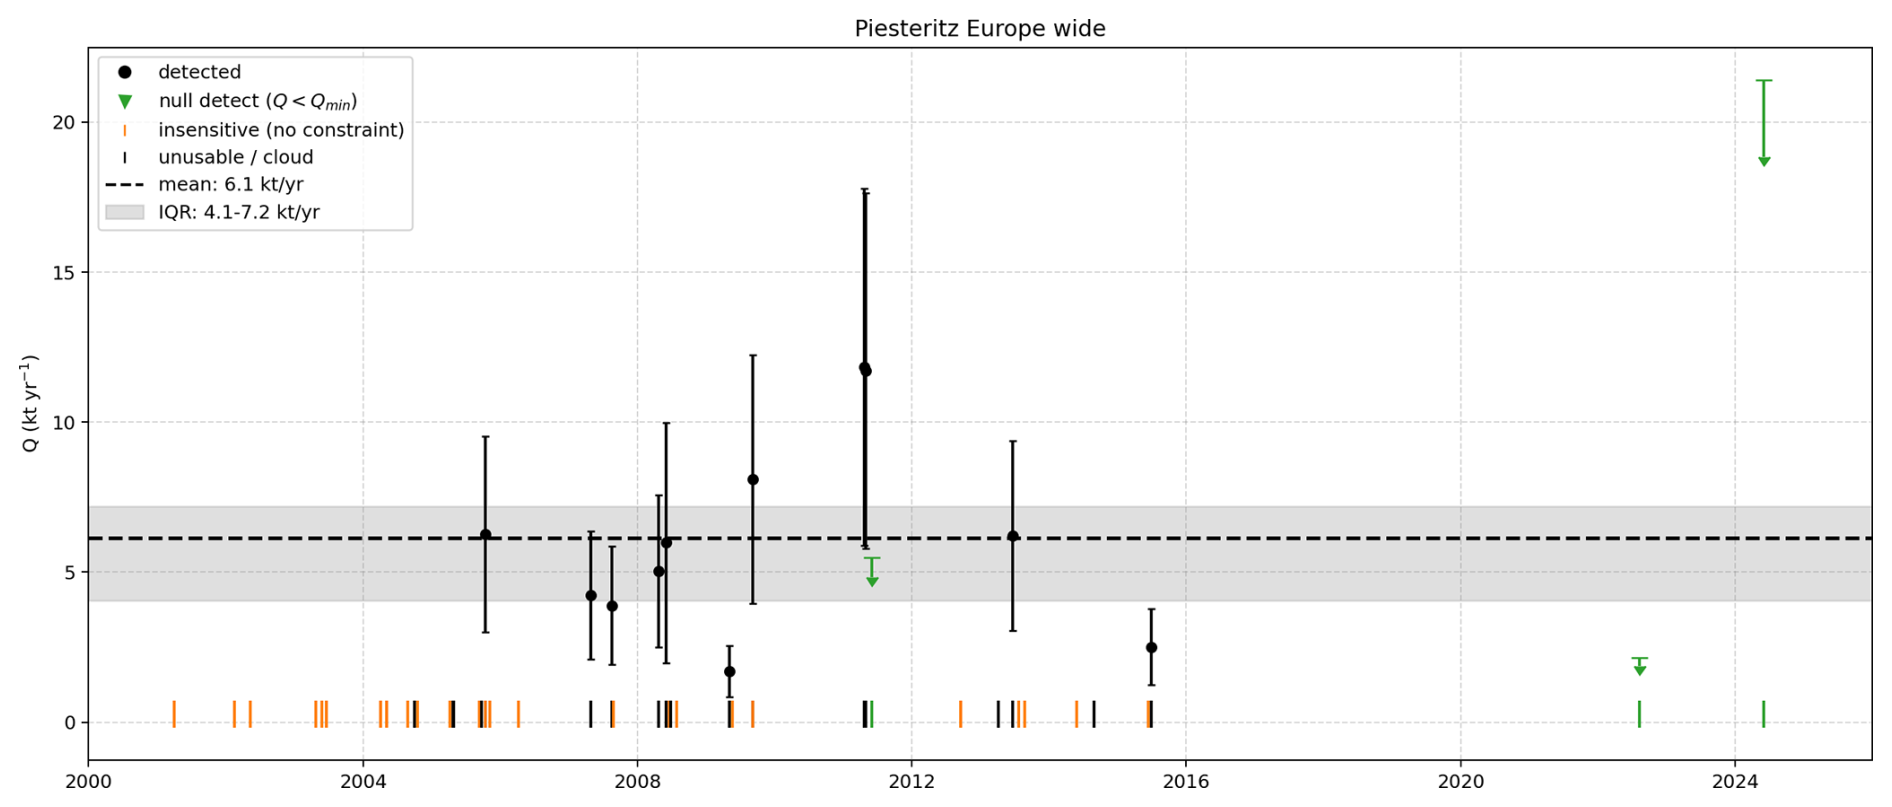
Figure 11Time series of ASTER-derived NH3 source rates at Piesteritz, 2000–2025. Symbols are as in Fig. 7, with green downward triangles marking null detections. These are upper limits, not zero emissions: the retrieval was sensitive enough over the source region for a reference plume of 100 pixels to have been detected, so the marker sits at the corresponding Qmin. Triangle height is a property of the observing conditions of that scene, chiefly its thermal contrast, not of the facility. The dashed line marks the detected-scene mean of 6.1 kt yr−1 (median 6.0 kt yr−1) and the gray band the interquartile range, 4.1–7.2 kt yr−1. Orange ticks mark the 29 of 51 analyzed scenes classified as insensitive, which cannot be converted into upper limits. The 2024 null detection sits at 21.4 kt yr−1, above every detected value in the record.
The ASTER retrievals over Piesteritz yield a detected-scene median source rate of 6.0 kt yr−1 (n=11, interquartile range 4.1–7.2 kt yr−1; Table 3). Of 51 analyzed scenes, 29 are insensitive (Table 2), the highest fraction of the three sites, and many remaining retrievals lie close to the detection limit given the weaker thermal contrast, heterogeneous land cover and higher background variability. Piesteritz is the only site with null detections (Sect. 2.3.3): three scenes are reported as upper limits.
Noppen et al. (2023) observed the same facility with the airborne Telops Hyper-Cam LW at 4 m resolution and estimated fluxes with IME and cross-sectional flux (CSF) methods for non-rising and buoyant plume scenarios, obtaining 1.6–3.2 kt yr−1 (IME) and 2.2–5.4 kt yr−1 (CSF) in spring 2021. The ASTER median lies above both, by roughly a factor of two relative to the airborne IME estimate and marginally above the upper end of the CSF range. The ASTER statistic samples eleven overpasses over two decades against a single spring campaign, and the methods differ, Hyper-Cam LW being able to fit interfering species and surface temperature explicitly where ASTER relies on broadband radiances and a LUT-based split-window observable. Noppen et al. (2023) also showed that plume altitude and thermal contrast strongly affect retrieved NH3 columns, a plausible direction for the residual discrepancy given the simplified near-surface profile used here.
The results above establish that a multispectral TIR imager with only five broad bands can detect NH3 plumes at facility scale, and that detection is governed primarily by thermal contrast.
Practical plume detection is more restrictive than the idealized noise-equivalent limit of Sect. 3.1.2: it requires spatially coherent enhancements, favorable thermal contrast, sufficient radiometric precision, and limited surface-related structure in the band ratio, which sets the ranking of the three sites. A desert background is not automatically low-noise, since mineral emissivity variability, surface temperature structure, suspended dust and dust storms all affect the TIR radiances (Ginoux et al., 2012; Someya et al., 2020; Clarisse et al., 2019).
Flux estimation is more uncertain than detection. Q scales with the effective wind speed, so wind-field uncertainty propagates directly, alongside uncertainties in plume mass, mask and background. The Ueff parameterization was developed for methane and is not necessarily optimal for NH3, where deposition, chemistry, plume rise and near-source mixing may influence the observed plume mass. Noppen et al. (2023) found flux estimates to depend strongly on the vertical plume distribution, with the sensitivity to plume height decreasing as thermal contrast improves.
That sensitivity can be quantified. Inverting a plume of true depth 1000 m on the 500 m curve used by the retrieval overestimates the column by 9 % at a thermal contrast of 40 K and by 26 % at 20 K, while a true depth of 200 m underestimates it by 4 %–11 % over the same range; a deeper layer sits in colder air and absorbs more strongly per molecule, which sets the sign. Both biases grow at lower thermal contrast, where the retrieval is already flagged as insensitive, so the two failure modes share a cause rather than compounding independently. The prescribed air temperature acts through the same channel, at 4 %–10 % per kelvin across the contrast range in which detections are reported: a plume carried above the 60 m level sits in cooler air than prescribed, biasing the retrieved column high in the same direction as the depth term. A plume much warmer than ambient does not inflate the retrieved column. Forward simulations with a heated NH3 layer show the split-window response weakening, passing through zero while the layer is still about 3 K cooler than the surface, then reversing to emission; no NH3 amount reproduces a positive ratio, so the failure mode is a missed detection rather than an overestimate. Absorption is observed in every detected scene, so the detected plumes are close to ambient temperature at the 90 m pixel scale. Coupling the retrieval to a Lagrangian dispersion model such as HYSPLIT to test plausible plume heights and transport pathways per overpass would reduce this uncertainty (Stein et al., 2015).
Surface emissivity remains a major systematic uncertainty. Prescribing ASTER GED V3 avoids absorbing plume-induced band 13 radiance reductions into scene-specific emissivity retrievals, but cannot represent day-to-day or sub-pixel variations in land-surface properties. Future retrievals should quantify this by perturbing the prescribed emissivity, for example by 0.005–0.01, and by testing band-dependent emissivity constraints.
The LUT treats NH3 as the only variable absorber, which can bias retrievals where other gases, aerosols, dust, smoke or surface features affect the same bands. Water vapour is the clearest case: with no H2O dimension and a fixed humidity profile, any departure of the true water column appears as a radiance offset. Scaling the profile by ±30 % changes the retrieved column by 3.8 % in the median and 7.4 % at worst, and moves the plume-free baseline by 0.25–0.39 σR, less than the per-pixel noise. Band 14 carries more water continuum than band 13, so more water vapour reads as less NH3. That test bounds the sensitivity rather than the operational error, since a single profile applied across arid, continental and temperate sites is plausibly wrong by a factor of two, which extrapolates to roughly 13 %. Adding an H2O dimension to the LUT, using humidity fields already available from the same meteorological archive, is the natural next step.
Several diagnostics support the NH3 interpretation of the retrieved structures: the enhancements are strongest in band 13 relative to band 14, are spatially connected to known industrial NH3 sources, show coherent plume-like morphology, occur where the LUT predicts measurable sensitivity, and recur at Khor Al Zubair. They cannot fully exclude interference from other absorbers or surface effects.
All three targets are industrial point sources; livestock operations were not searched. Dairy housing emits about 13.8±3.2 kg NH3 per animal place per year (Schep et al., 2022), so at a floor of 1.5 kt yr−1, slightly below the lowest rate detected anywhere in this record, a herd would need of order 105 animal places. Only the very largest feedlots approach that, and agricultural NH3 at this spatial scale is better approached with methods that do not assume a point source.
Finally, ASTER is not an operational NH3 monitoring instrument; its revisit frequency, cloud sensitivity and thermal-contrast dependence limit temporal sampling, and its value lies in retrospective analysis of favorable archival scenes over large, persistent sources. The framework is transferable to other multispectral TIR imagers with suitable spectral coverage, such as ECOSTRESS and the Landsat Thermal Infrared Sensor (Reuter et al., 2015; Fisher et al., 2020). A more targeted concept, with bands placed around the ν2 feature and nearby reference windows, could substantially improve point-source sensitivity, supporting an observing strategy in which wide-area mappers are complemented by high-resolution point-source imagers, as in CH4 remote sensing.
We developed and tested a physically based retrieval for NH3 plumes in ASTER multispectral TIR observations, combining TFIT radiative transfer simulations, a LUT-based inversion, scene-level radiance correction, plume segmentation and IME-based source-rate estimation, with NH3 retrieved from the differential response of bands 13 and 14.
Sensitivity simulations show that ASTER preserves measurable NH3 radiance signals after convolution with the broad TIR spectral response functions. Detectability depends strongly on thermal contrast: near zero contrast retrievals are noise dominated, while for stronger contrast theoretical single-pixel noise-equivalent columns reach 1017–1018 .
Application to industrial point sources shows that ASTER can resolve NH3 plume structure at 90 m spatial resolution: repeated detections at Khor Al Zubair under favorable desert conditions, episodic detections at Tolyatti in a more heterogeneous non-desert environment, and detections at Piesteritz close to the practical sensitivity limit of the method. The strongest result is plume detection and source attribution. IME source rates are instantaneous estimates for individual scenes and remain sensitive to the wind terms, plume masking, background subtraction, vertical plume distribution, emissivity assumptions and possible spectral interference; only a subset is propagated into the reported 1σ bars, which are close to ±50 % of Q for every scene and are not a complete error budget. The detected-scene statistics should not be interpreted as annual mean emissions.
Comparison with published IASI, CrIS and airborne Hyper-Cam LW estimates places the ASTER statistics within the range spanned by previous work, though the agreement is site-dependent and part of the spread reflects differing lifetime assumptions rather than the measurements. At Khor Al Zubair, placing the IASI box-model estimate on the same 2.5 h lifetime as the EMG retrievals brings the two IASI results into agreement, and the ASTER median then agrees with the CrIS EMG value to within a few per cent. At Tolyatti and Piesteritz the agreement is looser, with differences of up to about a factor of three in either direction.
High-resolution multispectral TIR imagers can therefore complement hyperspectral NH3 sounders by resolving facility-scale plume structure: ASTER cannot provide routine monitoring for most NH3 sources, but its archive enables retrospective analysis of favorable scenes over large emitters. Future work should focus on emissivity sensitivity tests, multi-species LUTs, NH3-specific transport parameterizations, improved characterization of plume-scale winds and of the radiance correction, and application to further TIR imaging instruments.
This Appendix shows the forward simulations underlying the summary given in Sect. 3.1: the response of the individual ASTER TIR bands to NH3 column at fixed thermal contrast (Fig. A1), and the dependence of the band 13 radiance and the split-window ratio on surface temperature (Fig. A2).
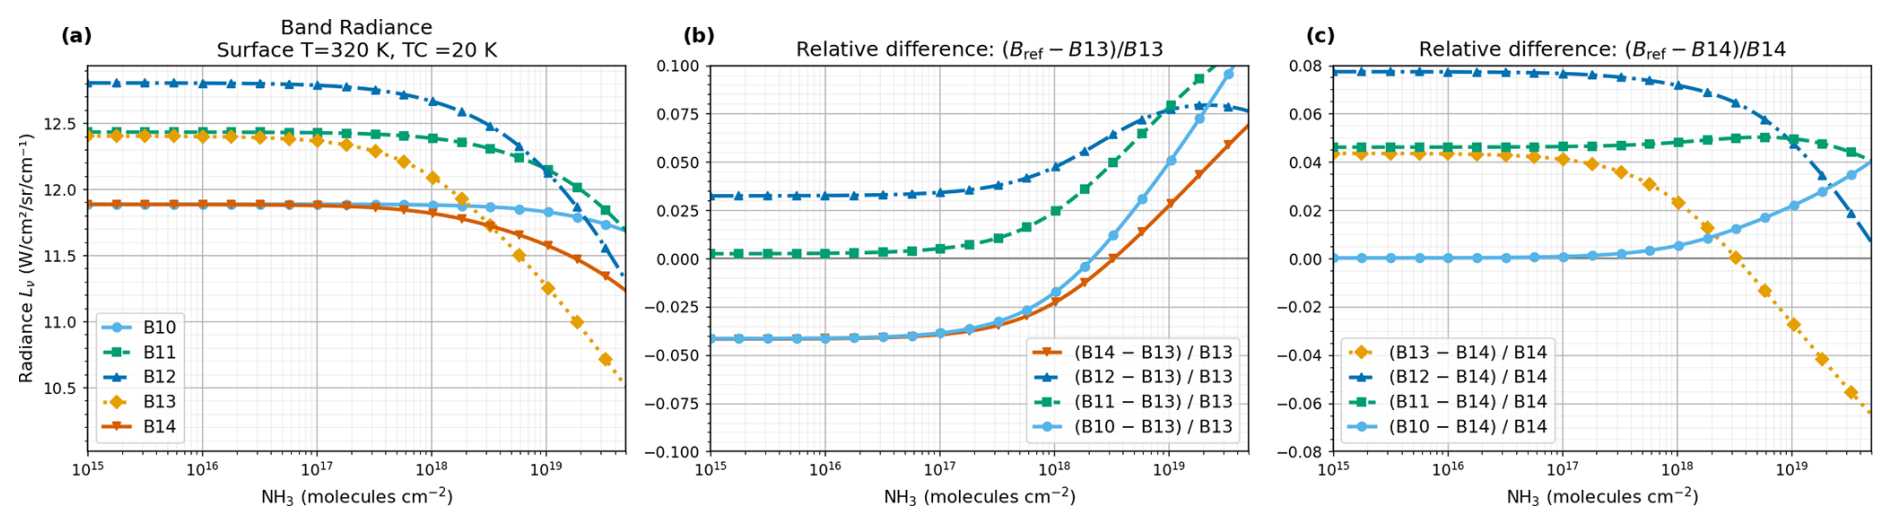
Figure A1Sensitivity of ASTER TIR bands to NH3 for a surface temperature of 320 K and a thermal contrast of 20 K. (a) Absolute radiances for bands 10–14 as a function of NH3 column amount. (b) Relative differences . (c) Relative differences , where provides the primary NH3-sensitive split-window observable used in the retrieval. All relative differences are dimensionless.
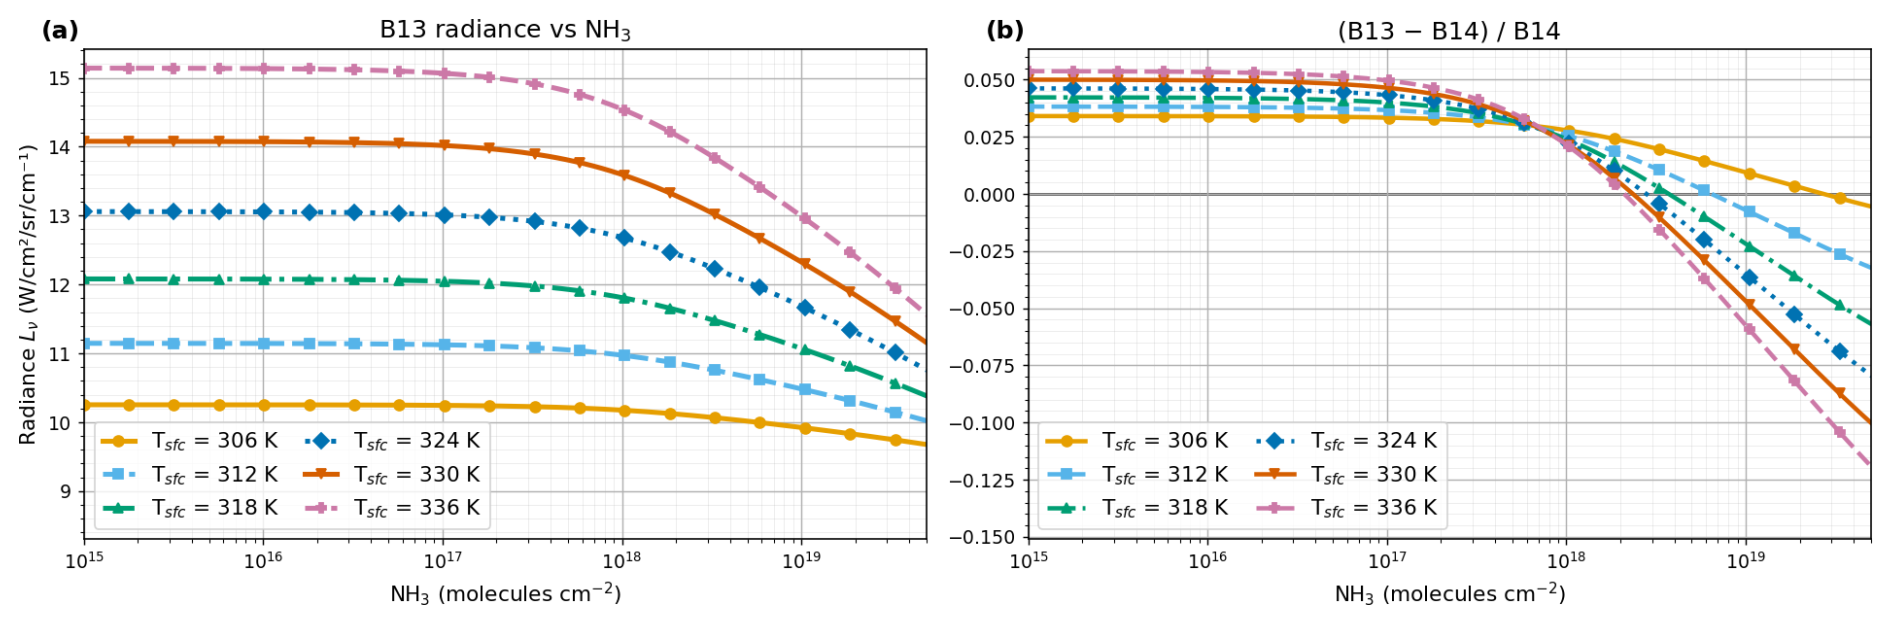
Figure A2Dependence of the ASTER NH3 signal on surface temperature and thermal contrast. (a) Band 13 radiance as a function of NH3 column amount for surface temperatures between 306–336 K, with the near-surface air temperature fixed at 300 K. (b) Corresponding dimensionless split-window ratio . Increasing positive thermal contrast strengthens the NH3 absorption signal in band 13 and steepens the ratio response.
Table B1 lists the identified uncertainty terms in the ASTER NH3 source rate and whether each enters the reported 1σ bars: the propagated terms first, the identified but unpropagated terms second, and the unquantified terms last.
Varon et al. (2018)Varon et al. (2018)Varon et al. (2018)Table B1Uncertainty terms in the ASTER NH3 source rate. Magnitudes are for Khor Al Zubair at a median thermal contrast of about 12.8 K and columns of 5×10¹⁷–2×1019 cm−2; most are conditional on thermal contrast and are not transferable outside that range. The 50 % assigned to Ueff is the upper end of the 15 %–50 % Varon et al. (2018) derive for the IME method when U10 is taken from a meteorological database rather than measured at the source, and applies at the low end of their 2–7 m s−1 range, where the scenes reported here sit; their estimate is from GEOS-FP over the US, so it transfers to the ECMWF fields only approximately. Literature terms are taken from work on CH4 in the shortwave infrared, and their transfer to NH3 in the thermal infrared is itself an assumption. No combined total is given: several terms are unquantified, and the temperature and column errors are correlated through the retrieved surface temperature.
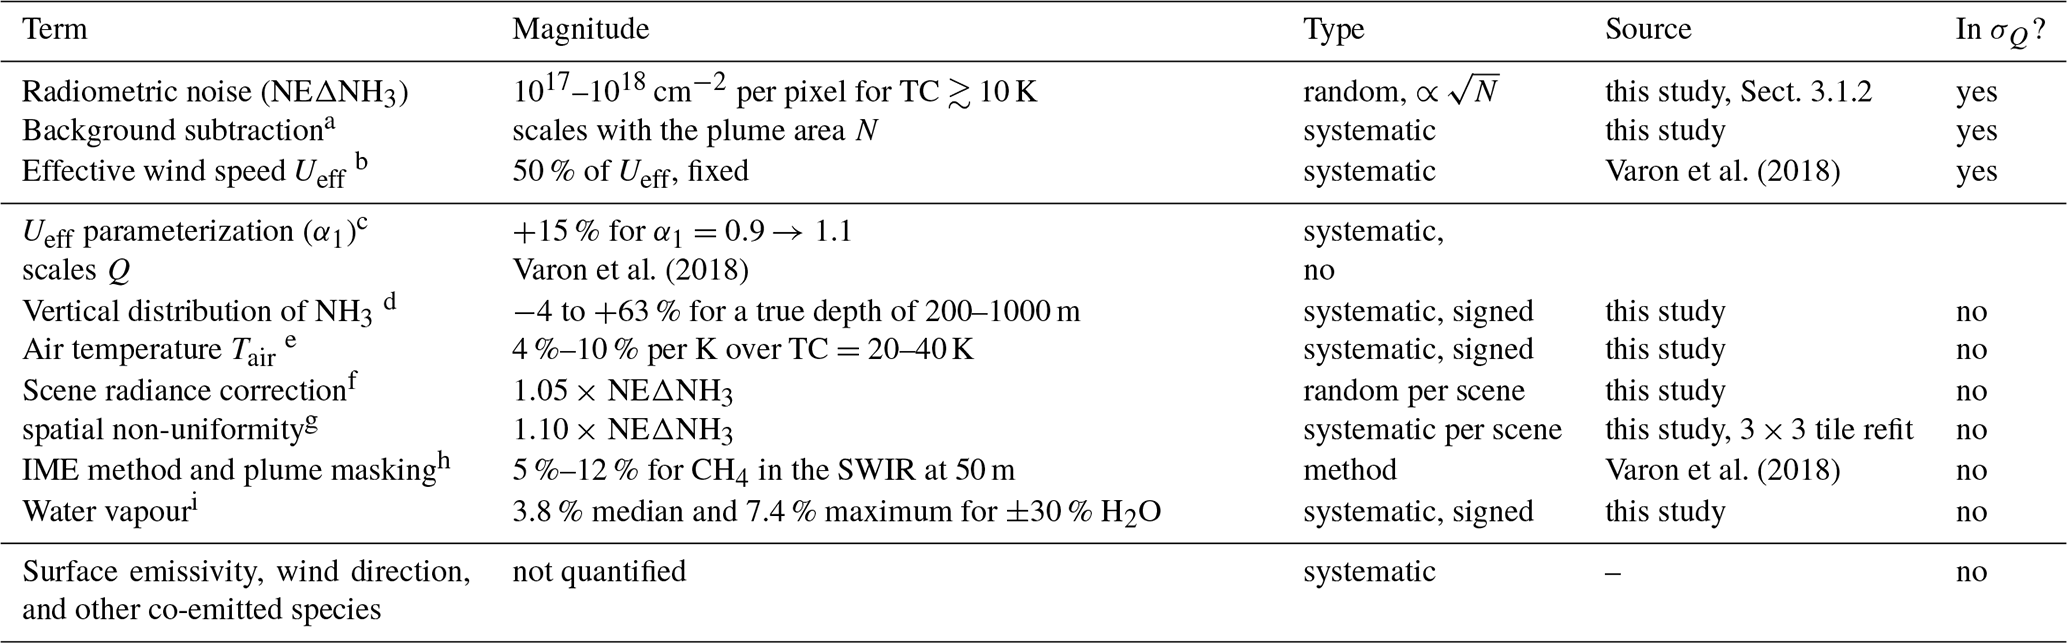
a the background is not subtracted from Q, so this acts as a positive bias.
b 98.8 % of the error bar in the median scene.
c moves Q itself, not only its uncertainty; α1=0.9 is the low-noise end of the published range.
d assumes 500 m; largest at low thermal contrast.
e a plume above the 60 m level sits in cooler air than prescribed, biasing the column high in the same sense as the vertical-distribution term.
f no correlation with Q (, p=0.59); see Sect. 2.3.2.
g comparable to the scene-wide term itself.
h excludes the vertical term, which is negligible in the SWIR but not here.
i more H2O mimics less NH3; largest at low thermal contrast. The ±30 % test brackets a moderate perturbation, not the arid-to-temperate range.
The TFIT radiative transfer code used in this study is not publicly archived, but is available from the corresponding author upon reasonable request. TFIT uses spectroscopic parameters from the HITRAN database accessed through the HITRAN Application Programming Interface (HAPI) (Kochanov et al., 2016).
ASTER Level 1B radiance (AST_L1B, Version 4), surface emissivity (AST_05, Version 4) surface kinetic temperature (AST_08, Version 4) and Global Emissivity Database Version 3 (ASTER GED V3) products are publicly available from the NASA Land Processes Distributed Active Archive Center (LP DAAC) through the Earthdata platform (https://earthdata.nasa.gov/, last access: 28 June 2025), and can be accessed programmatically via the Earthaccess Python interface (https://github.com/nsidc/earthaccess, last access: 28 June 2025; https://doi.org/10.5281/zenodo.8365009, Barrett et al., 2026). Meteorological fields used for scene characterization and wind information are obtained from the ECMWF operational IFS forecast archive.
LBT implemented and applied the retrieval framework, performed the formal data analysis, and prepared the manuscript. LBT, TW, and ED contributed to the conceptual design of the study and jointly developed the TFIT radiative transfer model and retrieval methods. ED contributed satellite context and, with TW, the interpretation of the results and of the source-rate estimates. All authors reviewed the final manuscript.
The contact author has declared that none of the authors has any competing interests.
Publisher's note: Copernicus Publications remains neutral with regard to jurisdictional claims made in the text, published maps, institutional affiliations, or any other geographical representation in this paper. The authors bear the ultimate responsibility for providing appropriate place names. Views expressed in the text are those of the authors and do not necessarily reflect the views of the publisher.
The authors acknowledge the NASA Land Processes Distributed Active Archive Center for providing the ASTER data products used in this study. The authors also acknowledge ECMWF for the meteorological data used in the retrieval workflow. Generative AI tools were used to assist with language refinement and editorial clarity; all scientific analysis, interpretation, and conclusions are the authors' own work.
This paper was edited by Daniel Varon and reviewed by three anonymous referees.
Abrams, M., Tsu, H., Hulley, G., Iwao, K., Pieri, D., Cudahy, T., and Kargel, J.: The advanced spaceborne thermal emission and reflection radiometer (ASTER) after fifteen years: review of global products, Int. J. Appl. Earth Obs., 38, 292–301, 2015. a, b
Arai, K. and Tonooka, H.: Radiometric performance evaluation of ASTER VNIR, SWIR, and TIR, IEEE T. Geosci. Remote, 43, 2725–2732, 2005. a, b
Barrett, A., Battisto, C., Bourbeau, J., Carroll, I., Daniels, C., Fisher, M., Kaufman, D., Kennedy, J. H., Lopez, L., Lowndes, J., Scheick, J., Steiker, A., and Varghese, S.: earthaccess, Zenodo [data set], https://doi.org/10.5281/zenodo.8365009, 2026. a
Bobbink, R., Hornung, M., and Roelofs, J. G. M.: The effects of air borne nitrogen pollutants on species diversity in natural and semi natural European vegetation, Journal of Ecology, 86, 717–738, 1998. a
Brunekreef, B. and Holgate, S. T.: Air pollution and health, Lancet, 360, 1233–1242, 2002. a
Campion, R., Salerno, G. G., Coheur, P.-F., Hurtmans, D., Clarisse, L., Kazahaya, K., Burton, M., Caltabiano, T., Clerbaux, C., and Bernard, A.: Measuring volcanic degassing of SO2 in the lower troposphere with ASTER band ratios, J. Volcanol. Geoth. Res., 194, 42–54, 2010. a, b, c, d
Clarisse, L., Clerbaux, C., Franco, B., Hadji-Lazaro, J., Whitburn, S., Kopp, A., Hurtmans, D., and Coheur, P.-F.: A decadal data set of global atmospheric dust retrieved from IASI satellite measurements, J. Geophys. Res.-Atmos., 124, 1618–1647, 2019. a
Clarisse, L., Franco, B., Van Damme, M., Di Gioacchino, T., Hadji-Lazaro, J., Whitburn, S., Noppen, L., Hurtmans, D., Clerbaux, C., and Coheur, P.: The IASI NH3 version 4 product: averaging kernels and improved consistency, Atmos. Meas. Tech., 16, 5009–5028, https://doi.org/10.5194/amt-16-5009-2023, 2023. a
Dammers, E., McLinden, C. A., Griffin, D., Shephard, M. W., Van Der Graaf, S., Lutsch, E., Schaap, M., Gainairu-Matz, Y., Fioletov, V., Van Damme, M., Whitburn, S., Clarisse, L., Cady-Pereira, K., Clerbaux, C., Coheur, P. F., and Erisman, J. W.: NH3 emissions from large point sources derived from CrIS and IASI satellite observations, Atmos. Chem. Phys., 19, 12261–12293, https://doi.org/10.5194/acp-19-12261-2019, 2019. a, b, c, d, e, f, g, h, i, j, k, l
De Vries, W., Hettelingh, J.-P., and Posch, M.: Critical loads and dynamic risk assessments: Nitrogen, acidity and metals in terrestrial and aquatic ecosystems, Vol. 25, Springer, https://doi.org/10.1007/978-94-017-9508-1, 2015. a
Di Gioacchino, T., Clarisse, L., Noppen, L., Van Damme, M., Bauduin, S., and Coheur, P.: Spatial and temporal variations of thermal contrast in the planetary boundary layer, Journal of Remote Sensing, 4, 0142, https://doi.org/10.34133/remotesensing.0142 2024. a
Erisman, J. W., Sutton, M. A., Galloway, J., Klimont, Z., and Winiwarter, W.: How a century of ammonia synthesis changed the world, Nat. Geosci., 1, 636–639, 2008. a
European Environment Agency: Industrial reporting under the Industrial Emissions Directive 2010/75/EU and European Pollutant Release and Transfer Register Regulation (EC) No 166/2006, https://doi.org/10.2909/3bbf28cb-70e8-4073-8fe9-8c1d9c513f52, 2021. a, b
Fisher, J. B., Lee, B., Purdy, A. J., et al.: ECOSTRESS: NASA's next generation mission to measure evapotranspiration from the international space station, Water Resour. Res., 56, e2019WR026058, https://doi.org/10.1029/2019WR026058, 2020. a
Fowler, D., Pilegaard, K., Sutton, M. A., Ambus, P., Raivonen, M., Duyzer, J., Simpson, D., Fagerli, H., Fuzzi, S., and Schjoerring, J. K.: Atmospheric composition change: ecosystems–atmosphere interactions, Atmos. Environ., 43, 5193–5267, 2009. a
Frankenberg, C., Thorpe, A. K., Thompson, D. R., Hulley, G., Kort, E. A., Vance, N., Borchardt, J., Krings, T., Gerilowski, K., Sweeney, C., Conley, S., Bue, B. D., Aubrey, A. D., Hook, S., and Green, R. O.: Airborne methane remote measurements reveal heavy-tail flux distribution in Four Corners region, P. Natl. Acad. Sci. USA, 113, 9734–9739, 2016. a, b
Galloway, J. N., Aber, J. D., Erisman, J. W., Seitzinger, S. P., Howarth, R. W., Cowling, E. B., and Cosby, B. J.: The nitrogen cascade, Bioscience, 53, 341–356, 2003. a
Gillespie, A. R., Abbott, E. A., Gilson, L., Hulley, G., Jiménez-Muñoz, J.-C., and Sobrino, J. A.: Residual errors in ASTER temperature and emissivity standard products AST08 and AST05, Remote Sens. Environ., 115, 3681–3694, 2011. a
Ginoux, P., Prospero, J. M., Gill, T. E., Hsu, N. C., and Zhao, M.: Global-scale attribution of anthropogenic and natural dust sources and their emission rates based on MODIS Deep Blue aerosol products, Rev. Geophys., 50, https://doi.org/10.1029/2012RG000388, 2012. a
Gorroño, J., Varon, D. J., Irakulis-Loitxate, I., and Guanter, L.: Understanding the potential of Sentinel-2 for monitoring methane point emissions, Atmos. Meas. Tech., 16, 89–107, https://doi.org/10.5194/amt-16-89-2023, 2023. a
Goudar, M., Anema, J. C. S., Kumar, R., Borsdorff, T., and Landgraf, J.: Plume detection and emission estimate for biomass burning plumes from TROPOMI carbon monoxide observations using APE v1.1, Geosci. Model Dev., 16, 4835–4852, https://doi.org/10.5194/gmd-16-4835-2023, 2023. a
Han, Y., Revercomb, H., Cromp, M., Gu, D., Johnson, D., Mooney, D., Scott, D., Strow, L., Bingham, G., Borg, L., Chen, Y., DeSlover, D., Esplin, M., Hagan, D., Jin, X., Knuteson, R., Motteler, H., Predina, J., Suwinski, L., Taylor, J., Tobin, D., Tremblay, D., Wang, C., Wang, L., Wang, L., and Zavyalov, V.: Suomi NPP CrIS measurements, sensor data record algorithm, calibration and validation activities, and record data quality, J. Geophys. Res.-Atmos., 118, 12–734, 2013. a
Hilton, F., Armante, R., August, T., et al.: Hyperspectral Earth observation from IASI: five years of accomplishments, B. Am. Meteorol. Soc., 93, 347–370, 2012. a
Janssens-Maenhout, G., Crippa, M., Guizzardi, D., Dentener, F., Muntean, M., Pouliot, G., Keating, T., Zhang, Q., Kurokawa, J., Wankmüller, R., Denier van der Gon, H., Kuenen, J. J. P., Klimont, Z., Frost, G., Darras, S., Koffi, B., and Li, M.: HTAP_v2.2: a mosaic of regional and global emission grid maps for 2008 and 2010 to study hemispheric transport of air pollution, Atmos. Chem. Phys., 15, 11411–11432, https://doi.org/10.5194/acp-15-11411-2015, 2015. a, b
Karra, K., Kontgis, C., Statman-Weil, Z., Mazzariello, J. C., Mathis, M., and Brumby, S. P.: Global Land Use/Land Cover with Sentinel-2 and Deep Learning, in: IGARSS 2021–2021 IEEE International Geoscience and Remote Sensing Symposium, IEEE, https://doi.org/10.1109/IGARSS47720.2021.9553499, 4704–4707, 2021. a
Kochanov, R., Gordon, I., Rothman, L., Wcisło, P., Hill, C., and Wilzewski, J.: HITRAN Application Programming Interface (HAPI): a comprehensive approach to working with spectroscopic data, J. Quant. Spectrosc. Ra., 177, 15–30, https://doi.org/10.1016/j.jqsrt.2016.03.005, 2016. a, b
Kuai, L., Kalashnikova, O. V., Hopkins, F. M., Hulley, G. C., Lee, H., Garay, M. J., Duren, R. M., Worden, J. R., and Hook, S. J.: Quantification of ammonia emissions with high spatial resolution thermal infrared observations from the hyperspectral thermal emission spectrometer (HyTES) airborne instrument, IEEE J. Sel. Top. Appl., 12, 4798–4812, 2019. a
Kuenen, J., Dellaert, S., Visschedijk, A., Jalkanen, J.-P., Super, I., and Denier van der Gon, H.: CAMS-REG-v4: a state-of-the-art high-resolution European emission inventory for air quality modelling, Earth Syst. Sci. Data, 14, 491–515, https://doi.org/10.5194/essd-14-491-2022, 2022. a
NASA JPL: ASTER Global Emissivity Dataset, 100-meter, HDF5, NASA Land Processes Distributed Active Archive Center [data set], https://doi.org/10.5067/COMMUNITY/ ASTER_GED/AG100.003, 2014. a, b
NASA/METI/AIST/Japan Spacesystems and U.S./Japan ASTER Science Team: ASTER L2 Surface Emissivity V004, NASA Land Processes Distributed Active Archive Center [data set], https://doi.org/10.5067/ASTER/AST_05.004, 2025a. a
NASA/METI/AIST/Japan Spacesystems and U.S./Japan ASTER Science Team: ASTER L2 Surface Kinetic Temperature V004, NASA Land Processes Distributed Active Archive Center [data set], https://doi.org/10.5067/ASTER/AST_08.004, 2025b. a
NASA/METI/AIST/Japan Spacesystems and U.S./Japan ASTER Science Team: ASTER L1B Registered Radiance at the Sensor V004, NASA Land Processes Distributed Active Archive Center [data set], https://doi.org/10.5067/ASTER/AST_L1B.004, 2025c. a
Noppen, L., Clarisse, L., Tack, F., Ruhtz, T., Merlaud, A., Van Damme, M., Van Roozendael, M., Schuettemeyer, D., and Coheur, P.: Constraining industrial ammonia emissions using hyperspectral infrared imaging, Remote Sens. Environ., 291, 113559, https://doi.org/10.1016/j.rse.2023.113559, 2023. a, b, c, d, e, f, g
Noppen, L., Clarisse, L., Tack, F., Ruhtz, T., Van Damme, M., Van Roozendael, M., Schuettemeyer, D., and Coheur, P.: Towards a low-resolution infrared sounder for monitoring atmospheric ammonia (NH3) at high spatial resolution, Atmos. Meas. Tech., 18, 4183–4205, https://doi.org/10.5194/amt-18-4183-2025, 2025. a
Reuter, D. C., Richardson, C. M., Pellerano, F. A., Irons, J. R., Allen, R. G., Anderson, M., Jhabvala, M. D., Lunsford, A. W., Montanaro, M., Smith, R. L., Tesfaye, Z., and Thome, K. J.: The Thermal Infrared Sensor (TIRS) on Landsat 8: design overview and pre-launch characterization, Remote Sens.-Basel, 7, 1135–1153, 2015. a
Schep, C., Van Dooren, H., Mosquera, J., Van Well, E., Keuskamp, J., and Ogink, N.: Monitoring van methaan-, ammoniak-en lachgasemissies uit melkveestallen: Praktijkmetingen in de periode oktober 2018-oktober 2020, https://doi.org/10.18174/576706, 2022. a
Shephard, M. W., Dammers, E., Cady-Pereira, K. E., Kharol, S. K., Thompson, J., Gainariu-Matz, Y., Zhang, J., McLinden, C. A., Kovachik, A., Moran, M., Bittman, S., Sioris, C. E., Griffin, D., Alvarado, M. J., Lonsdale, C., Savic-Jovcic, V., and Zheng, Q.: Ammonia measurements from space with the Cross-track Infrared Sounder: characteristics and applications, Atmos. Chem. Phys., 20, 2277–2302, https://doi.org/10.5194/acp-20-2277-2020, 2020. a
Skjøth, C. A. and Geels, C.: The effect of climate and climate change on ammonia emissions in Europe, Atmos. Chem. Phys., 13, 117–128, https://doi.org/10.5194/acp-13-117-2013, 2013. a
Someya, Y., Imasu, R., Shiomi, K., and Saitoh, N.: Atmospheric ammonia retrieval from the TANSO-FTS/GOSAT thermal infrared sounder, Atmos. Meas. Tech., 13, 309–321, https://doi.org/10.5194/amt-13-309-2020, 2020. a
Stein, A. F., Draxler, R. R., Rolph, G. D., Stunder, B. J., Cohen, M. D., and Ngan, F.: NOAA's HYSPLIT atmospheric transport and dispersion modeling system, B. Am. Meteorol. Soc., 96, 2059–2077, 2015. a
Van Damme, M., Clarisse, L., Heald, C. L., Hurtmans, D., Ngadi, Y., Clerbaux, C., Dolman, A. J., Erisman, J. W., and Coheur, P. F.: Global distributions, time series and error characterization of atmospheric ammonia (NH3) from IASI satellite observations, Atmos. Chem. Phys., 14, 2905–2922, https://doi.org/10.5194/acp-14-2905-2014, 2014. a
Van Damme, M., Clarisse, L., Whitburn, S., Hadji-Lazaro, J., Hurtmans, D., Clerbaux, C., and Coheur, P.-F.: Industrial and agricultural ammonia point sources exposed, Nature, 564, 99–103, 2018. a, b, c, d, e, f, g, h
Varon, D. J., Jacob, D. J., McKeever, J., Jervis, D., Durak, B. O. A., Xia, Y., and Huang, Y.: Quantifying methane point sources from fine-scale satellite observations of atmospheric methane plumes, Atmos. Meas. Tech., 11, 5673–5686, https://doi.org/10.5194/amt-11-5673-2018, 2018. a, b, c, d, e, f, g, h
Varon, D. J., Jervis, D., McKeever, J., Spence, I., Gains, D., and Jacob, D. J.: High-frequency monitoring of anomalous methane point sources with multispectral Sentinel-2 satellite observations, Atmos. Meas. Tech., 14, 2771–2785, https://doi.org/10.5194/amt-14-2771-2021, 2021. a
Varon, D. J., Jervis, D., Pandey, S., Gallardo, S. L., Balasus, N., Yang, L. H., and Jacob, D. J.: Quantifying NOx point sources with Landsat and Sentinel-2 satellite observations of NO2 plumes, P. Natl. Acad. Sci. USA, 121, e2317077121, https://doi.org/10.1073/pnas.2317077121 2024. a
Yamaguchi, Y., Kahle, A. B., Tsu, H., Kawakami, T., and Pniel, M.: Overview of Advanced Spaceborne Thermal Emission and Reflection Radiometer (ASTER), IEEE T. Geosci. Remote, 36, 1062–1071, 1998. a