
the Creative Commons Attribution 4.0 License.
the Creative Commons Attribution 4.0 License.
 | 12 Nov 2026
A new method to estimate the characteristic raindrop size from space-borne Doppler radars: validation with the Monte Carlo model
Takahisa Kobayashi

Kazuhiko Masuda
Hiroshi Yamauchi
Ahoro Adachi
This paper describes a physically-based algorithm for estimating the mass-weighted raindrop diameter (Dm) and the corresponding Doppler velocities (VD) which are the radar reflectivity-weighted terminal velocities of the raindrops. The algorithm exploits the attenuation-corrected radar reflectivity (Ze) and the specific attenuation (k) observed by Ku- and W-band space-borne Doppler radars and estimate Dm assuming a specified drop size distribution DSD. The estimated Dm were examined using a Monte Carlo model which evolves DSDs by coalescence and breakup in a convective rain as well as measured data with a disdrometer. A detailed error analysis is also presented in the retrieved Dm arising from the measurement errors. While discrepancies between the assumed DSDs (DSDLUT) and actual DSDs introduce errors in the estimated values, the errors were generally small for small Dm values. The uncertainties related to the variability of DSD were reduced by selecting an appropriate DSDLUT using the dependence of Z–R relationship (R: rain rate) on Dm. Since k is the DSD-dependent value in the W-band, the influence of the DSD can be partially mitigated but is limited. Utilizing parameters representing the shape of DSD by k, Ze and VD offer the potential to reduce the DSD-related errors furthermore.
- Article
(2619 KB) - Full-text XML
- BibTeX
- EndNote


Temporal and vertical variations of raindrop size distribution (DSD) are closely related to the process of precipitation system. Studies on the evolution of DSD is therefore crucial to improve our understanding of the microphysics of rain. Ground-based measurements of DSD have been made with a disdrometer, and a wind profiler (e.g. Kobayashi and Adachi, 2001, 2005). Many simulation studies on the evolution of DSD have been also carried out (e.g. Khain et al., 2000). These studies suggest that significant temporal and vertical variations appear in a convective rain. In addition to these variations, onset of rain, large raindrops are often observed at the ground because breakup process hardly occurs in lower altitudes. Whereas, frequent breakup events result in many small drops and intense rain as a chain reaction in mature stage of rain (Langmuir, 1948). The dual-polarized radar is a useful tool for measurements of DSD. Although it cannot derive the full shape of DSD, it can estimate the median volume diameter (D0) (Bringi et al., 2006). The scatter plot of the relationships of measured D0 and rain rate shows that D0 tends to reaches an equilibrium value at high rain rate in a convective rain (Bringi et al., 2003). However, there are considerable variations of D0 for low rain rate and little correlations between D0 and rain rate. These may be due to the variations of initial cloud properties and large rain drops evolved in the initial stage of rain as mentioned above. Another characteristic size, the mass-weighted mean diameter (Dm) is the ratio of the fourth to third DSD moment and is also estimated from the dual-frequency radar equipped on the Global Precipitation Measurement (GPM) and is applied to study the precipitation system on a Global scale (Yamaji et al., 2021). The characteristic sizes are also expected to specify the life stages of rain.
The space-borne radar onboard the Precipitation Measuring Mission (PMM) satellite (Iki et al., 2025), which is currently being planned, will equip a single-frequency Doppler radar at Ku-band (KuDPR). The Earth Cloud Aerosol and Radiation Explorer (EarthCARE) satellite (Wehr et al., 2023) also equips a W-band cloud profiling Doppler radar (CPR). Since the radars onboard the PMM and EarthCARE are single-frequency Doppler radars, the method to derive Dm used in the Dual-frequency Precipitation radar (DPR) cannot be applied. Because the fall velocities of raindrops are related to their size, the mass-weighted mean diameter may be estimated from the Doppler velocity (Vp) measured with the nadir pointing space-borne Doppler radars. However, the measured Doppler velocity is the sum of the raindrop fall velocity and the vertical velocity of the atmosphere (Vair). Thus, the measured Vp cannot be directly applied to estimate Dm in the presence of air motion. To reduce the effects of air motion from Vp, methods by using the differential Doppler velocity (DDV), which is a difference of Vp between two Doppler radars operated at different frequencies, has been studied (Williams et al., 2016; Matrosov, 2017; Mroz et al., 2020). This technique is useful but cannot be applied to the PMM and the EarthCARE. Estimation of Vair from the vertical profiles of the equivalent reflectivity factor (Ze) and Vp has been also developed for the EarthCARE (Sato et al., 2009; Kollias et al., 2023). Even if the effects of air motion are removed, it is necessary to assume DSD to derive Dm because the measured Doppler velocity observed is a reflectivity-weighted value.
In this paper, we propose a method to estimate Dm from the measured values of Vp, Ze. and attenuation from the space-borne Doppler radar at Ku and W-band. Space-borne radars measure the path integrated attenuation (PIA) which is attenuation of cloud and precipitation from the surface to the satellite and is used for the attenuation correction. Thus, vertical profiles of rain attenuation can be estimated to some degree (Meneghini and Nakamura, 1990; Iguchi et al., 2000; Seto et al., 2021; Kobayashi et al., 2022). In our method, the specific attenuation (k) is used to determine the effects of air motion and DSD on Vp. The method is a physically-based algorithm and is different from the statistical approaches to derive Dm used in the EarthCARE product by Mroz et al. (2023).
To verify the method, we need realistic temporal and vertical variations of Vp, Dm, Ze and the attenuation. Observation data are preferred for the validation, but are rare because the DSD varies significantly associated with the life cycle of precipitation, in particular for convective rain. Unfortunately, such data is very limited. We have therefore decided to use a numerical model to evolve DSD and calculate Vp, Dm, Ze and the specific attenuation from the DSD to simulate realistic temporal and vertical variations of DSD for validation instead. Extensive studies have been made on DSD evolution with the stochastic coalescence equation (SCE). However, SCE may not be suitable to simulate significant and realistic variations of DSD (Pruppacher and Klett, 1997; Bayewitz et al., 1974). In this paper, we intend to simulate realistic evolution of DSD to validate the retrieval method in detail, therefore, we applied the Direct Monte Carlo method for the simulations which assumes less conditions and can evolve temporal and vertical variations of DSD for any rainfall intensity. The Monte Carlo model is a time-consuming process and is difficult to apply for models that incorporate both dynamical and microphysical processes. However, this is not serious in this study because we do not intend to link the DSD evolution model to such dynamic model but to just simulate the vertical variations of DSD evolved by coalescence and breakup processes.
In the next section, the modified Monte Caro model is described. In Sect. 3, characteristics of the simulated temporal and vertical variations of DSD in convective rain will be shown. The detailed studies of DSD variations associated with the life cycle of rain are useful for error analysis of the retrieval method. In Sects. 4–7, a method to estimate Dm from the space-borne Doppler radar at the Ku-band will be proposed and examined using the results of the Monte Carlo simulations. The method is also applied for the W-band cloud profiling Doppler radar (CPR) which is currently used in the Earth Cloud Aerosol and Radiation Explorer (EarthCARE) satellite (Wehr et al., 2023). This CPR primarily targets clouds but can also measure weak rain. It is useful for understanding of the aerosol-cloud-rain interaction if the Dm of rain can be estimated from the CPR. There are some problems in applying the retrieval method to the W-band radar, such as significant attenuation, difficulties in determining the specific attenuation and correcting the Doppler folding error. In the retrieval from the CPR measurements, there are further more issues to be solved such as the multiple scattering, non-uniform beam filling, the satellite motion etc. These issues are beyond the work of the paper which propose a technique to derive Dm. In this paper, we do not address these issues but describe the theoretical base and the potential of the method.
The processes of precipitation formation are (1) nucleation, (2) condensation, (3) evaporation, and (4) coalescence and breakup. In this paper, we consider only the process (4) and make numerical simulations of the evolution of DSD. There are two models for this purpose: the continuous growth model and the stochastic growth model (Pruppacher and Klett, 1997). The former model is simple, but growth is generally slow and unrealistic (Houze, 1993). The latter is represented by an equation called the coagulation equation or stochastic coalescence equation (SCE) (Gillespie, 1975). Since the SCE cannot be solved for a realistic kernel analytically but can be solved only for a simple kernel, it is often solved numerically. Various methods have been developed (Berry and Reinhardt, 1974; Khain et al., 2000). One of methods is the direct Monte Carlo approach which is more flexible. The Monte Carlo approaches by Gillespie (1975) is a method with less assumptions comparing with the other methods, and is used to validate other methods as a benchmark model. Our approach is basically the same as the algorithm of Seeßelberg et al. (1996) which is a modified version of the method by Gillespie (1975) (Appendix A) but we have further modified their method to calculate the temporal and vertical evolution of DSD, i.e., our model is a time dependent one-dimensional shaft model. The vertical profiles of cloud/rain drop size distributions and the air vertical velocity are given as initial values. The model allows time dependent vertical atmospheric velocity. The cloud and rain are given at any layers and at an arbitrary time, and the evolution of DSD by coalescence and breakup is calculated during drops ascent and descent. Evaporation is not considered in this paper because it has no significant effect on the drop size distribution (List and McFarquhar, 1990).
This model allows detailed analysis of the mechanisms of the cloud and precipitation dynamics but here is used to calculate temporal and vertical evolutions of DSD from cloud evolved by coalescence and breakup for the validation of the method to estimate Dm from space-borne Doppler radars. The simulations aim to reproduce rain with falling velocity that is detectable by the Doppler radars. Therefore, DSD of small Dm like drizzle is not considered. More realistic variations of DSD, in particular for DSD at larger particles, are needed but are generally difficult. The proposed Monte Carlo model is suitable for the validation of the method to estimate Dm. We will briefly describe the modified algorithm.
A one-dimensional rain shaft Monte Carlo model was developed to calculate temporal and vertical evolutions of DSD (MonDrop) based on the algorithm of Gillespie (1975) and Seeßelberg et al. (1996), which is a one-layer box model and does not consider vertical profiles (Appendix A). In the modified model, atmosphere is divided into layers in vertical. Raindrops moves from layer to layer associated with the air motion and the fall velocity. The cloud and rain are given at any layers and at an arbitrary time, and the evolution of DSD by coalescence and breakup is calculated. Cases of bounce are not taken into account. Spherical rain droplet and cloud particles are assumed. The algorithm of the model is as follows.
-
Define the initial time (T=0), the end of the simulation (Tmax), and time step Δt during which the evolution of DSD by coalescence and breakup is simulated in all layers but raindrops remain in each layer. Define the highest altitude (Zmax). The atmosphere is divided by ΔZ in vertical. Set the minimum (rmin) and maximum (rmax) raindrop size. The raindrop size distribution is described by logarithmically spaced bins in radius. The initial volume V, initial DSD of cloud or/and rain, atmospheric conditions, the kernel and the coalescence efficiency are specified.
-
Calculate the time interval τ that the collision occurs and specify colliding two raindrops by random numbers. Modify DSD by removing the colliding two drops and adding new created drops at all layers and recalculate the probability of collision.
-
Advance time by τ. If time does not exceed step Δt, return to step 2.
-
Move drops associated with the fall velocity of drops and the air motion. Update the volume V, and the probability of collision.
-
It is possible to add cloud or/and rain and modify the atmospheric conditions.
-
Return to the step 2 until the time exceed Tmax.
To consider statistical fluctuations, several runs (realizations) with the same initial values and different random numbers are carried out.
The probability of collision increases with the number concentration of drops. Therefore, the number of drops should be sufficiently large for accurate simulations. The number of particles in each bin is determined from the DSD in the simulation volume V. Larger volume, is therefore needed, but requires more CPU time. When beginning calculation of developing process from cloud to rain, large number concentrations of cloud drops exist. As the cloud drops grow, the number of drops decreases. The optimum volume, therefore is difficult to determine. In model, the volume is determined so that the collisions occur in certain times (tref). The collection kernel is 10−6–10−7 cm3 s−1 for a particle size of 10 µm (Pruppacher and Keltt, 1997; Long, 1974), and the particle number concentration is about 109 (m−3) for liquid water content LWC =1 gm−3. When the particle size distribution is assumed to be the Marshall-Palmer distribution (Marshall and Palmer, 1948), the average collision rate is about 10−4 s at 10 dBZ and 10−3 s at 30 dBZ (Rogers, 1989). Considering above issues, the volume (initial V=1 cm3) increases by assuming –10−3 s. Note the volume increases with time significantly. This technique was justified by confirming similar results of a single run to their average of several runs (Seeßelberg et al., 1996).
To calculate the vertical profiles of DSD, atmosphere is divided into NL layers with the vertical resolution Δz. The model simulates the evolution of DSD in each layer in Δt. Then, the drops ascend or descend associated with the fall velocity and the air motion. Some drops remain in the same layer and others move into other layers. In the model, a fraction of a drop distributed to any layers is calculated as follows. Consider a drop with a velocity Vt (falling velocity of drops-atmospheric velocity) in layer Li. The length of the moving distance of a drop from the upper boundary of the layer Ltopi is written as and from the lower boundary Lboti is . Take minimum values of ΔLtopi and Ltopj and maximum values of ΔLboti and Lbotj for all layers (j=1, … NL). The fraction of a drop in layer Li that is distributed to layer Lj (j=1…NL), Rp (i,j) is determined as
where min(a,b) and max(a,b) denote minimum and maximum values of a and b respectively. For Rp(i,j) ≤0, the fraction in layer j is 0. This process is performed for all particles and layers. Small vertical grid spacing allows detailed vertical variations of DSD, however larger number of grids needs more CPU time. Whereas large grid spacing results in erroneous results. A vertical resolution of Δz of 10 to 40 m may be appropriate associated with a maximum fall velocity of 10 m s−1 (Barthes and Mallet, 2013; Hu and Srivastava, 1995). In the present calculation, Δz=20 m was applied.
In this paper, the collision efficiency which is the ratio of collision cross section to the geometric cross section, is set to be unity considering the fact that the raindrop size is larger than 0.1 mm. The coalescence efficiency (Ecoal) was calculated by Low and List (1982a). The effect of turbulence is not considered. For breakup, the probabilities of the occurrence of the filament, sheet, and disk types were considered. The DSD of each type of breakup was determined by Low and List (1982b). The method was verified by comparing with the simulations by Seeßelberg et al. (1996) and Low and List (1982b). Note, the rate of breakup was assumed to be (1−Ecoal) and for DL<0.2 mm, Ecoal=1.
In this section, we will present the temporal and vertical variations of DSD in a convective rain by using the MonDrop model. Simple convective rain models were considered in which cloud drops in lower altitudes ascend within updrafts and grow to raindrops, then descend. When raindrops descend, they further grow by coalescence and breakup. In the developing stage of rain, the mean raindrop size generally tends to increase with rain rate (R) and reaches the equilibrium size for intense rain. In the dissipating stage, the opposite is true. The mean drop size, therefore expected to be positively correlated to rain rate. However, measured relationships between D0 and rain rate in a convective rain show less correlations. Considerable scatter appears between D0 and rain rate in particular for small drops (Bringi et al., 2003). This suggests significant variations of DSD in the life cycle of rain. The object of the simulations is not to make detailed analysis of rain formation process but to reproduce such variations for the validation of the retrieval method. Although the Monte Carlo model does not account for the effects of turbulence and evaporation in the present calculations, frequent events of coalescence and breakup possibility result in the significant variations of DSD. Such variations are appropriate to validate the method to estimate Dm from the space-borne Doppler radars presented in the next section. In addition to this, studies on the variation of DSD and the relationships of Dm-rain rate, and Dm−Ze are useful to improve our understanding of the microphysical properties of rain. Here, we will focus on the variations of Dm−Ze relationships in the life cycle of rain. Note Ze represents the Rayleigh reflectivity factor in this section.
Cloud particles and raindrops were assumed to be spherical, and ice particles were not considered. The simulations were made from the ground to 5 km in altitude with the vertical resolution of ΔZ=20 m. Figure 1 shows a schematic figure of the convective rain model. Initial clouds at an altitude from 2 to 3.5 km ascend within updraft air. Clouds were also added at time 200 and 400 s. The upward air velocity (W0) was given from the ground to 4.5 km in altitude from time =0 to 400 s after which no updrafts were assumed. Constant air speed was assumed for all layers which may not be so realistic but results in similar DSD variations for decreasing air speed with altitude linearly which are used for validations shown in Sect. 5. The size distribution of the initial cloud was assumed to be the three-parameter gamma function as
where N0, μ (shape), and Λ (slope parameter) are parameters that determine the number of particles and the characteristic size. Here, the shape parameter μ was fixed as 6 and the liquid water content was 2 gm−3 for DSD of initial cloud. The median volume diameters D0 were 0.1 and 0.2 mm. Drop diameters were divided into 400 logarithmically spaced bins from 0.1 µm to 8 mm. The raindrop fall velocity was calculated using the formula by Best (1950). Atmospheric conditions such as temperature, and density were given as the mid-latitude summer model tabulated by McClatchey et al. (1971) and were used to determine the fall velocities of drops and the refractive index used in the next section. A hydrodynamic kernel was used as the collision kernel, and breakup was calculated according to Low and List (1982b) as described above. Numerical simulations were made with the time step of Δt=1 s and s. The characteristic size Dm, rain rate and Ze were calculated from the simulated DSD.
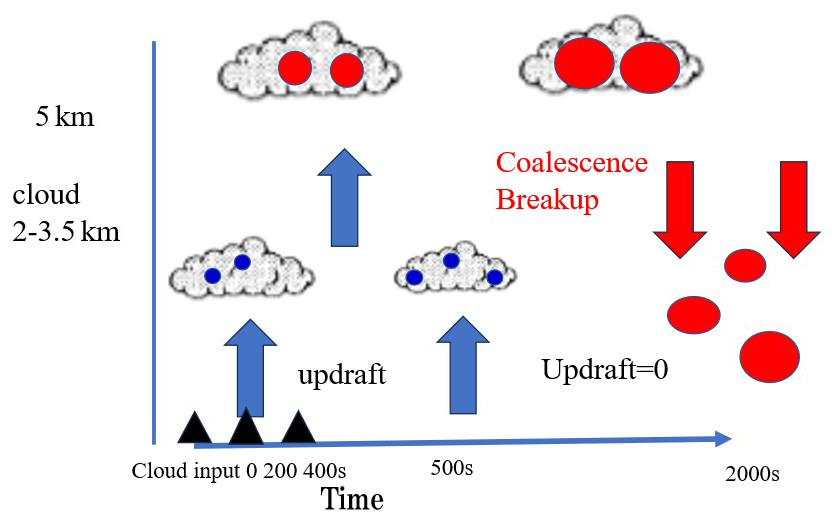
Figure 2 shows a scatter plot of Dm and rain rate calculated for all altitudes, time from 0 to 2000 s and for various initial clouds of D0 and W0. Red circles are for W0=5 m s−1, D0 of initial cloud as 0.2 mm, black dots are (D0=0.2 mm) for W0=10 m s−1. As rainfall rate increases, Dm tends to be constant about 2–2.5 mm for W0=10 m s−1, which is considered to be an equilibrium state (Ma et al., 2019). Note the equilibrium DSD is independent of the initial characteristics of cloud. The equilibrium state cannot be reached for W0=5 m s−1. For Dm smaller than the equilibrium size, the envelope of data (Dm) is positively correlated with rainfall rate, whereas negatively correlated for Dm larger than the equilibrium size. This relationship is similar to the relationship between D0 of rain and rainfall rate for one convective rain measured with the polarimetric radar S-band and a disdrometer (Bringi et al., 2003), which suggests that the Monte Carlo model succeeded in producing similar variations of DSD to the actual rain. Data in the positive correlations, i.e., area of Dm smaller than the equilibrium size may be in developing stage or dissipating stage. Whereas data in the negative correlations, i.e., area of Dm larger than the equilibrium size may indicate few large raindrops in the onset of rain. Large raindrops in upper layer fall rapidly due to sedimentation without suffering breakup.
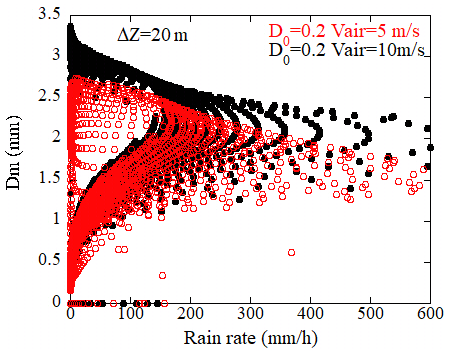
Figure 2Scatter plot of rain rate and the mass-weighted mean diameter simulated for convective rain. Data for various initial conditions and vertical air motions are plotted.
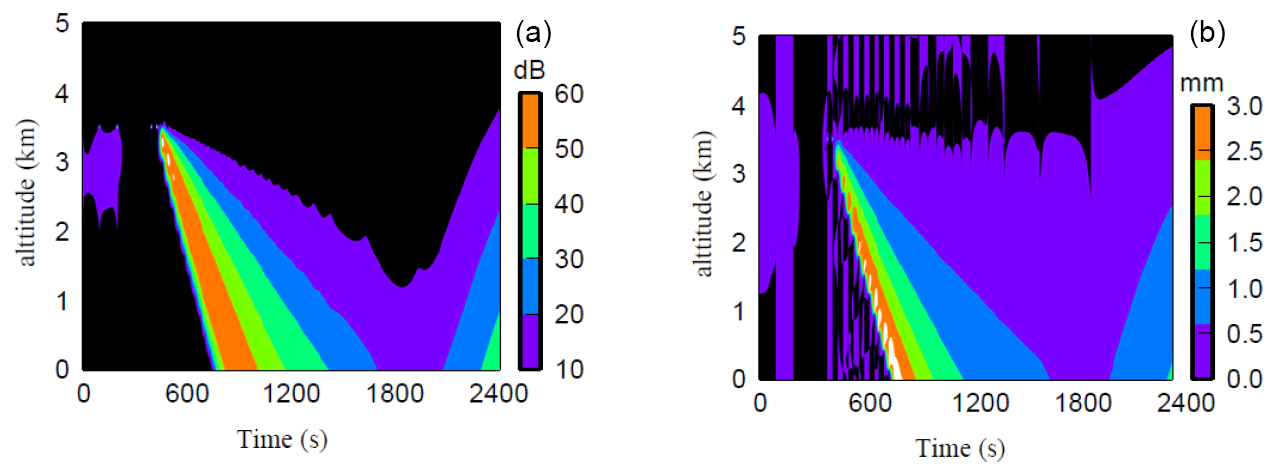
Figure 3Time-height cross sections of simulated the Rayleigh reflectivity factor Ze (a) and Dm (b) for convective rain.
Figure 3 shows time-height cross section of Ze (a) and Dm (b). A precipitation core (here assumed to be an area of Ze larger than 30 dBZ) descends from 3.5 km to the ground. The peaks of Ze appear at time of a little later than the time that the core was firstly observed at each altitude. Tendency of Dm is similar to Ze but the peaks appear at the beginning of core i.e., before Ze reaches its maximum. This suggests that larger and fewer raindrops descend more rapidly than smaller raindrops without breakup which results in large Dm and small Ze at the beginning of rain. Similar tendencies have been reported from
the ground-based radar measurements. The time-height cross section of Ze and the differential reflectivity Zdr in the precipitation core of convective rain observed by the dual-polarimetric radar shows that the time of the peak of Zdr appears earlier than the peak of Ze (Shusse et al., 2015). The differential reflectivity is a measure of the characteristic size of DSD (Bringi et al., 2009), and therefore the tendency is consistent with the present calculations. The simulated results are well representative of the characteristics of the actual rain.
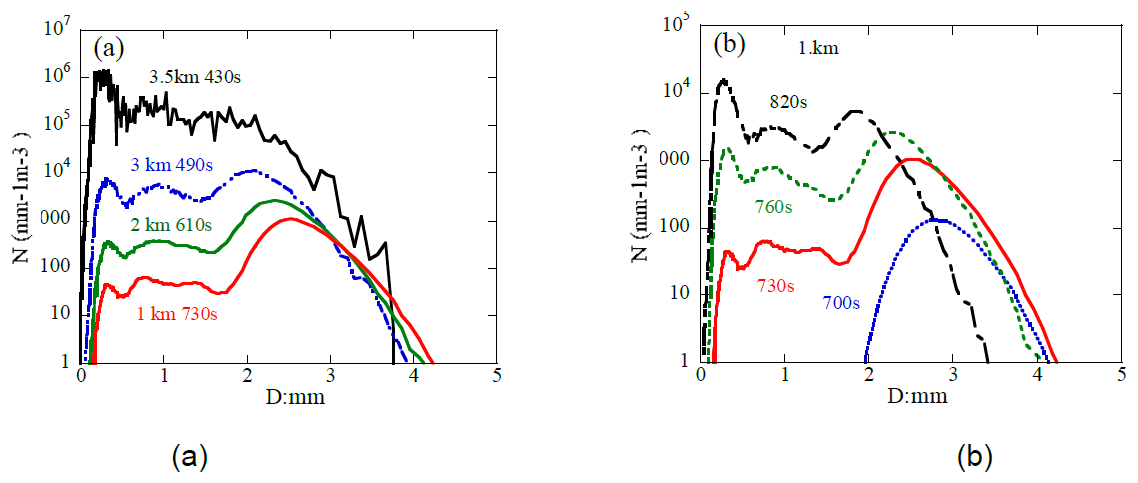
Figure 4Vertical variation of DSD in the core region (a) and temporal variation of DSD at altitude of 1 km (b).
Figure 4 shows the vertical variation of DSD in the early stage of region (a) shows that higher concentrations of larger raindrops appear in lower altitudes. The temporal variations of DSD at altitude of 1 km (b) shows large drops appear in the early stage of rain and smaller raindrops increase with time at altitude of 1 km.
Figure 5 shows the temporal variations of Ze, and Dm at an altitude of 0.5 km. This figure clearly shows the difference in the time that the peak of Ze and Dm appear as shown in Fig. 3. The largest Dm appears at time 720 s whereas the maximum Ze appears at 810 s. Before 810 s, Dm begins decreasing but Ze still increases (negative correlation between Dm and Ze) and after 810 s both Dm and Ze decrease (positive correlation). Opposite correlations appear between Ze and Dm. The simulated DSDs show many larger raindrops and few small drops in lower altitudes at the beginning of rain whereas the different shape of DSD appears later. Figure 6a shows the scatter plots of Dm versus Ze at the time before the core center (time of the maximum Ze) (red circles), at the core center (black squares) and after the core center (blue triangles) for a vertical velocity of W0=10 m s−1 and an initial cloud of D0=0.2 mm. The correlation between Ze and Dm is positive for Dm<2.5 mm, but negative for Dm>2.5 mm as shown in Fig. 5. At Dm=2.5, values of Ze converge to high values of about 55 dBZ suggesting the equilibrium state. A similar tendency is obtained in the relationship between Ze and rainfall rate. For weak updraft of W0=5 m s−1, no clear positive or negative correlation is obtained. This is due to the insufficient development of raindrops in the upper altitudes.
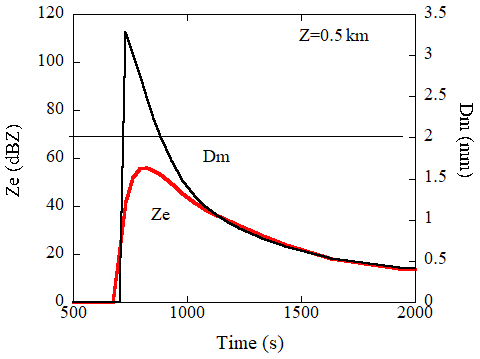
Figure 5Temporal variations of the Rayleigh reflectivity factor Ze, and Dm at altitude of 0.5 km.
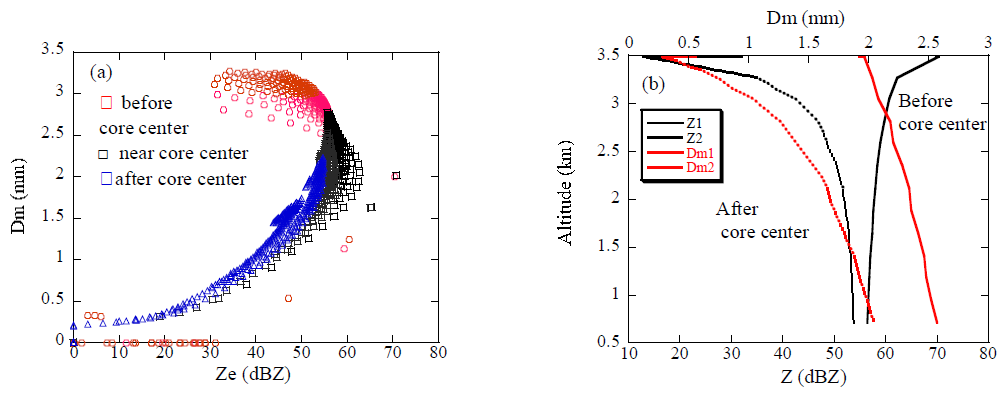
Figure 6Scatter plots of Dm versus the Rayleigh reflectivity factor Ze. Data at the core center (black), before (red), and after (blue) the time of core center are plotted (a). Vertical profiles of Ze and Dm before (Z1, Dm1) and after (Z2, Dm2) the time of core center (b).
Figure 6b shows the vertical profiles of Ze and Dm at time before and after core center. At time before core center, Dm increases toward the ground whereas Ze tends to decrease indicating large raindrops evolved in upper layer fall due to sedimentation without collision. Decrease tendency in Ze indicates fewer drop concentration in the lower altitude. Hereafter the raindrop size distribution in this period, referred as “DSDonset”. After the time of core center both Dm and Ze increase toward the ground due to coalescence and breakup. Since the relationships of Dm−Ze and Ze−R change associated with the variations of DSD in life cycle of rain, the relationships can be used to identify the precipitation stage. This is important for accurate rainfall rate estimate, in particular for initiate of rain when estimating rainfall intensity from Ze. The GPM-core satellite, equipped with dual-frequency radars, measures vertical profiles of Ze and Dm. As mentioned, vertical variations of Dm are negatively related to Ze at the beginning of rain in convective rain and Dm is positively correlated to Ze in mature and dissipating stages. While it is possible to determine the life stage of rain based on the trend of the correlations between Ze and Dm in altitude, further verification is needed. In addition, realistic temporal and vertical variations of simulated DSD in a convective rain throughout the life cycle are useful to examine a method to estimate Dm from space-borne Doppler radars.
The values of Dm are currently derived from the differential frequency ratio (DFR) measured with the Dual-frequency radar onboard the GPM core satellite. In the PMM, a single-frequency Doppler radar operated at Ku-band is currently planned. The EarthCARE satellite also equips a cloud profiling Doppler radar which operates at a single frequency of W-band. For these radars, the characteristic size of raindrops may be expected to estimate from the measured Doppler velocities instead of the DFR technique. The fall velocity of rain drops depends on the size, therefore Dm can be basically derived from the Doppler radars. There are, however, some problems to be solved in the retrieval of Dm. Here, we describe a method to estimate Dm from the space-borne Doppler radars.
The measured mean Doppler velocity (Vp) depends on DSD, the wavelength of radar (λ) and the air motion, and is given by
where σb is the backscattering cross section, Vf is the fall velocity of raindrops and Vair, is the atmospheric vertical velocity. Given DSD, Vp and Dm correspond one-to-one. In addition, the measured Doppler velocity is affected by the air motion. Thus, in the estimate Dm from Vp, following issues should be considered:
-
The observed Doppler velocity is the sum of the reflectivity-weighted fall velocity of raindrops (VD) and the atmospheric vertical velocity Vair, it is, therefore necessary to reduce Vair from Vp.
-
Since the measured Doppler velocity is a reflectivity-weighted value, some information on the DSD or assuming DSD are needed.
The effect of (1) is more significant than (2) because the dependence of Dm on Vp is generally larger than the dependence of the DSD. In a convective rain, a strong updraft air motion will be found in the initial stage of rain and downdraft air motion will be found when raindrops are falling. The turbulence also leads to up or down draft. Even small atmospheric velocities (e.g., 0.25 m s−1) can cause large errors in the Dm estimated from Vp in particular for large size of raindrops (Mroz et al., 2020). To reduce the effects of air motion, methods have been developed by using ground-based multi-frequency Doppler radars (Williams et al., 2016; Mroz et al., 2020; Matrosov, 2017). Another approach is to use statistical relationship between the amplitude of Ze and VD (e.g., Kollias et al., 2023). A method to estimate Vair from the vertical profiles of Ze and Vp has been also developed for the EarthCARE (Sato et al., 2009). Statistically, increases in the amplitude of Ze are associated with VD, i.e. Dm (e.g., Chen et al., 2022). For stratiform rain or cloud of small variability in the DSD, the effect of (2) may be less significant. However, as mentioned in the previous section, significant variations of the DSD are found in the convective rain, therefore the effect of (2) cannot be ignored.
To address these issues, another approach was applied in the method. Because three parameters of Vair and the DSD (concentration and shape of the DSD) are unknown, another parameter except for Ze, Vp is needed to estimate Dm. Space-borne radars measure the path-integrated attenuation (PIA) which is the attenuation of radio wave from the surface to the satellite in the presence of precipitation. In the rainfall algorithm of the space-borne radar, the measured PIA is converted to the specific attenuation (k) at each altitude (Meneghini and Nakamura, 1990; Seto et al., 2021) and is used for the attenuation correction. In the method, the specific attenuation is used to specify and reduce Vair and to consider the effects of the DSD. The detailed algorithm will be shown later. Note that the attenuation-corrected reflectivity factors and the specific attenuation are assumed to be given.
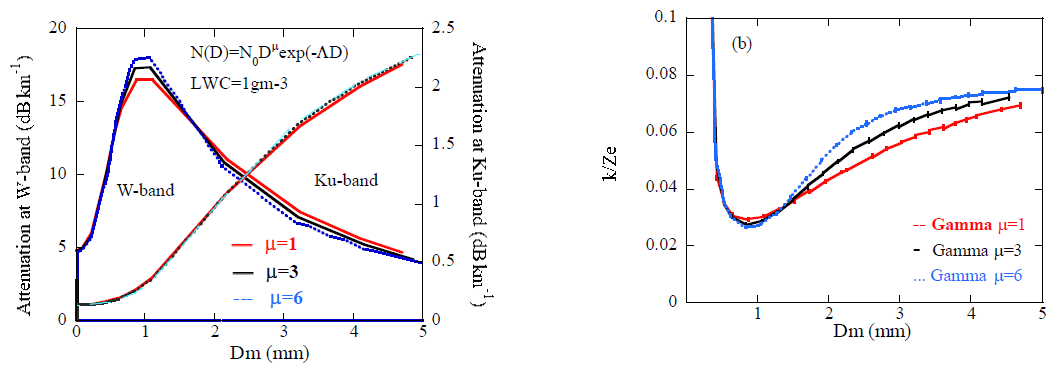
Figure 7Specific attenuation vs Dm for the DSDs of the Gamma function (a). Various values of the shape parameter μ (1, 3, 6) are plotted for the W and Ku-band. The ratios vs Dm are plotted for various values of μ at the W-band (b).
For the Rayleigh regime, the specific attenuation does not depend on the shape of DSD significantly but is almost determined by the LWC, whereas, k depends on the DSD to some degree as well as LWC for the Mie regime. These features are shown in the relationships between k and Dm (Fig. 7a) for the gamma size distribution of μ=1, 3, and 6 at W and Ku-band, suggesting that k can be used to specify the effects of DSD in the retrieval of Dm from Vp for W-band. For Ku-band, k is not so sensitive to the DSD and is not so effective to identify DSD but is useful to determine the effects of Vair as well as for W-band. Because significant variations of the DSD at large raindrops appear in a real rain, k is useful to identify DSD to some degree even at Ku-band. The values of k are related to Ze and Dm and can be used to specify the effects of Vair on the retrieval. Figure 7b shows the ratio of k/Ze which is itself the DSD indicator, and suggests that k is useful to identify the shape (μ) of DSD to some degree except for Dm smaller than 0.5mm.
For the Mie regime, the sensitivity of k to the DSD leads to difficulties in the estimation. The amplitude of k increases monotonically with Dm in the Ku-band, whereas the amplitude of k increases with Dm, reaching a maximum at approximately Dm=1 mm, and then decreases in the W-band. It is, therefore, difficult to determine the exact values of Dm from k. Furthermore, the Ku-band radar on the GPM can measure rain of a high reflectivity as 50 dBZ, whereas signals measured with the W-band attenuates quickly and drops below sensitivity at higher rain rates, so reliable retrievals are not expected above roughly 5–10 mm h−1, not that the instrument is blind to heavier rain. The KuDPR (Ku-band) is a radar to measure precipitation, whereas the CPR operated at W-band is a radar to primarily measure cloud. Considering these differences, the method to estimate Dm at the Ku-band radar will be firstly described. Next, the modified method for W and Ka-band radar s will be presented to examine the potential of the CPR in the measurements of rain. In estimating Dm, attenuation-corrected reflectivity factors are assumed. The validation of the method will be made by using the realistic DSD variation simulated in convective rain as mentioned in the previous section.
4.1 A method for the Ku-band radar
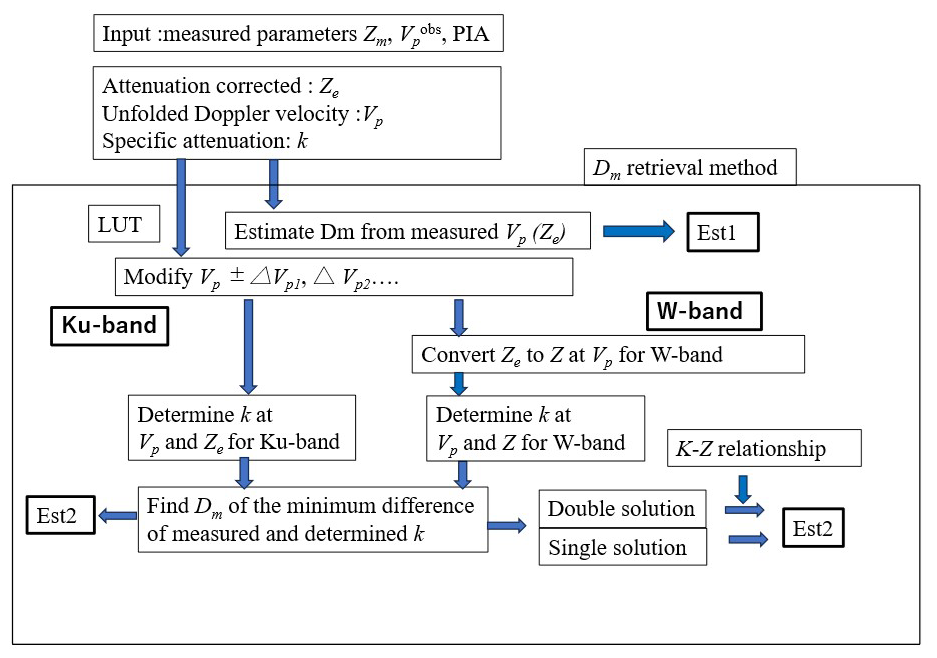
To assess the sensitivity of Dm to the Doppler velocity and k, we performed calculations for various DSDs by Mie theory. Figure 8 shows the representative calculations of the relationships between the measured reflectivity factor (attenuation corrected values Ze and the Doppler velocity VD (=Vp in the absence of atmospheric motion) for various values of Dm and k at Ku-band. Data calculated for DSD of the three-parameter Gamma function of μ=3 (Eq. 2) are plotted. The horizontal lines represent Ze and VD that result for specified values of k and the vertical lines represent the values for specified values of Dm. The circle symbols shown in the figure represent the simulated values of Ze and Vp in the convective rain (for LWC <0.1 gm−3) as mentioned in the previous section. This figure clearly illustrates a method for the simultaneous determination of Dm and k from the measured values of Ze and Vp. However, as mentioned earlier, in the presence of air motion, the estimated values of Dm and k will be incorrect. Our object is to estimate Dm, therefore, the value of k obtained from the PIA is used as a parameter to constrain the effects instead of a parameter to be estimated. The values of Dm and VD can be directly estimated from the measured (attenuation-corrected) Ze and k, given the DSD. In the actual estimation, first determine Dm and k from the measured Ze and Vp. In the presence of air motion, incorrect values of Dm and k are obtained. Then, change Vp and determine Dm and k again. Repeat this process until the estimated k matches the observed value and determine the correct value of Dm. Although Dm and VD can be directly obtained from Ze and k, given the DSD, this process was applied because the similar process was used for the W-band (4.2), which may be useful for determining whether there is strong air motion.
The Gamma function is often assumed for the DSD in the radar observations and the values of μ=3 is used in the rain-rate estimate algorithm (Seto et al., 2021; Adachi et al., 2015). However, such DSD is not true in a real rain as shown in Fig. 4, In addition, the relationship between Dm and Vp depends on the parameter μ as well (Battaglia et al., 2019). The actual raindrop size distribution is not accurately represented by the gamma function. Accurate estimation results can be expected by selecting a parameter μ in the gamma function whose Vp−Dm relationship is similar to the observed one. In this section, the the look up table (LUT) assuming the values of μ=3 is used to retrieve Dm which is often used in the radar measurements of rain (e.g., Iguchi et al., 2000). The fixed value results in bias errors depending on the DSD in measurements at Ku-band. The LUT with more appropriate μ may be needed which will be discussed in Sect. 4.3. The steps for the retrieval are as follows:
-
Estimate Dm from the measured Vp using the LUT (Fig. 8) (Est1).
-
Estimate k from the measured Vp and the attenuated corrected Ze using Fig. 8.
-
If estimated k differs from the measured value, estimate Dm and k again by changing Vp as Vp±ΔVp. The value of ΔVp was initially set, e.g., to be 0.1 m s−1.
-
Estimate k for various values of ΔVp and select ΔVp that gives the minimum difference between estimated k and the measured k.
-
The optimum Dm is determined (Est2).
If the actual DSD is close to the DSD applied in Fig. 8 and in the absence of air motion, selected Vp coincides with VD, i.e., uncorrected Dm (Est1) coincides with the corrected value (Est2).
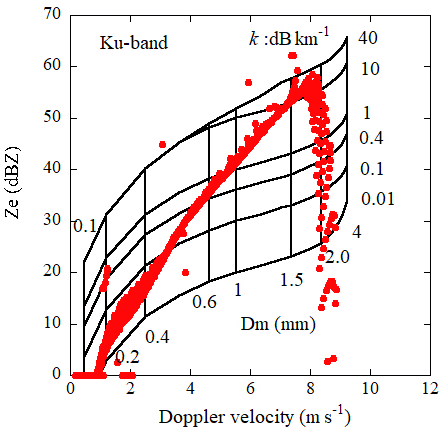
Figure 8Theoretical relationships between Ze and the Doppler velocities for various values of Dm and k for the Gamma DSD at the Ku-band. Simulated data in a convective rain are also plotted (red circles).
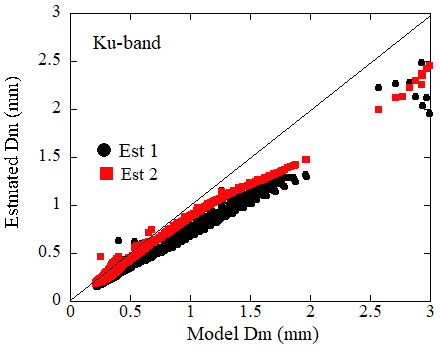
Figure 9Comparisons of the estimated Dm with the model values at the Ku-band for convective rain (W0=10 m s−1). Estimated Dm without correction (black circles: ) and with correction (red squares: ) are plotted.
Validation of the retrieval was made using the DSDs at various altitudes and times evolved by the Monte Carlo model. The Doppler velocities, reflectivity factors, specific attenuations and Dms were calculated from the DSDs and were used for the validation. In Fig. 9, the retrieved Dm values are plotted against calculated (model) values of Dm from the DSDs for W0=10 m s−1. The vertical velocities of the atmosphere are zero for most data. The black circles represent the uncorrected values of Dm (), i.e., estimated from the calculated (observed) Vp. The red square symbols represent values of Dm () estimated from Ze, k and the modified Vp using the LUT. Data of Ze<50 dBZ are plotted. The uncorrected values are underestimated in particular for large values of Dm. Whereas, are closer to the model values. These data are thought to be in still air, so that the reason of the discrepancies is the differences of the measured (simulated) DSD from the DSD applied in the LUT. One of measures to identify DSD is a relationship between the Doppler velocities and Dm which depends on the shape of DSD. Figure 10 shows relationships of Vp and Dm (black square: W0=3 m s−1, red: 10 m s−1) calculated from the simulated DSDs. The relationships for various Gamma DSDs of μ=1 (blue line), 3 (red) and 12 (green) are also plotted. The simulated values of Vp are smaller than the those of the Gamma DSD. When the relationships of the simulated data of Vp and Dm are fitted by the Gamma function, the fitted values of μ may be larger than 3. For DSD of the Gamma function, VD tends to increases with decreases in the parameter μ at specified values of Dm for the Rayleigh regime (Williams et al., 2016; Mroz et al., 2020). This indicates that the uncorrected will be underestimated if the fitted parameter μ of the DSD in the measurement is larger than that of the LUT and vice-versa. The errors in the corrected values of are significantly reduced but are still underestimated. This is because the correction using the attenuation is not so effective to identify DSD for the Rayleigh scattering as mentioned earlier. Figure 11 is the same as Fig. 9 but for simulated DSD for initial upward air velocity W0=3 m s−1. In this case, relationship of Vp and Dm is closer to that of the LUT (μ=3) for small values of Dm but larger for Dm>0.5 mm. The corrected values , are therefore less underestimated and overestimated at Dm=0.5 mm. Errors increase with Dm. Note the points at Dm larger than 2.5 mm in Fig. 9 are for the DSDonset where significant different DSDs appear. Estimated values of Dm from the look-up table of μtable=1, 3 and 6 are compared (Fig. 12). Symbols of black circles are , green squares are using the LUT of μtable=1, red circles are estimated from μtable=3, and blue triangles are estimated from μtable=6. Corrected values from μtable=6 are still underestimated but are shown to be improved. The reason of this is that the shapes of the simulated DSDs are similar to the Gamma function of larger values of μ than that of μtable=3. This figure suggests that selection of appropriate LUT is critical for accurate estimation. This issue will be discussed in Sect. 4.3.
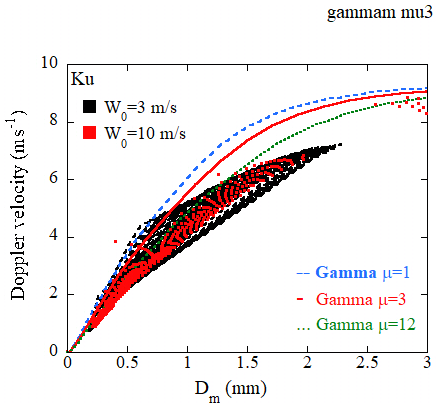
Figure 10Relationships of Dm and the Doppler velocities of simulated DSDs (black square: W0=3 m s−1, red: 10 m s−1) and of the Gamma function (blue: μ=1, red: μ=3, green: μ=12).
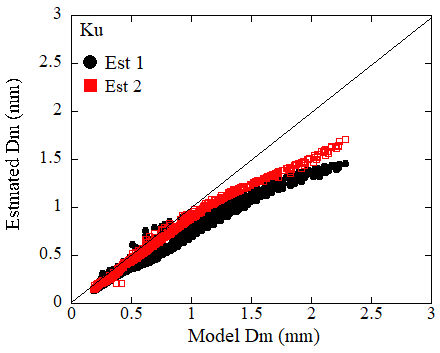
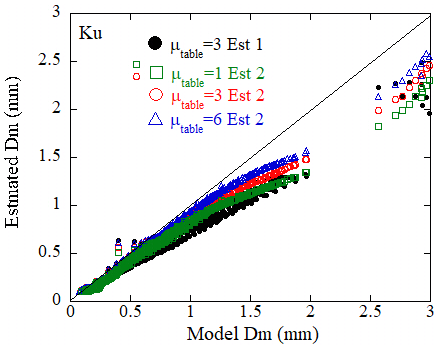
Figure 12As in Fig. 9 but the retrieved Dm using the look-up table of μtable=1, 3 and 6 are compared.
4.2 A method for the W-band radar
In the previous section, the method to estimate Dm for the Ku-band Doppler radar was described. The specific attenuation monotonically increases with Dm at this frequency. Whereas, the amplitude of k increases with Dm, reaching maximum at about Dm=1 mm, and then decreases for W-band (Fig. 7). This is because that received signals from the CPR operated at the W-band are almost in the Mie regime while those for Ku-band are almost in the Rayleigh regime. This feature requires the modification of the method for W-band. In this section, we will show the modified algorithm to derive Dm and examine the potential of the method in the measurements of rain with the CPR.
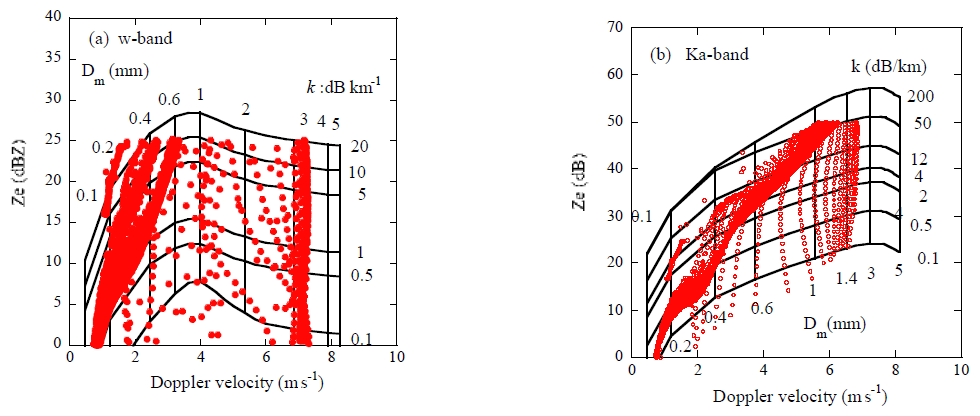
Figure 13 is the same as Fig. 8 but for the W-band (a) and Ka-band (b). The space-borne Ka-band Doppler radar is not currently planned but is added to examine the method for more frequencies. The DSD is assumed to be the gamma function of μ=3 as in Fig. 8. The horizontal lines represent Ze and VD that result for specified values of k and the vertical lines represent the values for specified values of Dm. For W-band, the horizontal lines increase with Vp below about 4 m s−1 and then slowly decrease because of the Mie effects. Unfavourable features of Fig. 13a are that two possible solutions can arise for the estimated Dm when determining the optimum value of Dm by varying Vp. Furthermore, the slight change of k with Vp above about 4 m s−1 need considerable high accurate observations of k. Similar features are also shown for Ka-band (b). To avoid such difficulties, the radar reflectivity factor (Z: Ze for Rayleigh regime) instead of Ze for W and Ka-band is used. The reflectivity factor Z is determined from the measured Ze and Vp ±ΔVp using the LUT. This may lead to additional errors in the estimation. We, however, decided to this method to avoid uncertainties in the use of Ze mentioned above. For Dm<1 mm, Ze can be directly used, but Z is used for whole Dm in this study. Generally, Z is linearly related to Ze for near the Rayleigh regime. For W-band, however, the relationship of Z and Ze is not simple. The reflectivity factor Z is linearly related to Ze for Ze<30 dBZ depending on DSD but is considerably larger than Ze for larger Dm. This may not be serious because the reflectivity measured with the W-band radar caps around 20–25 dBZ (Z: 20–50 dBZ depending on Dm) as mentioned earlier but is serious for some cases such as DSD of small number concentrations with large rain drops.
To convert the measured reflectivity (attenuated corrected values) to Z, the lookup-tables were prepared for Z, Ze and Vp for DSD of the gamma function of μ (e.g., 3). The reflectivity factor Z corresponding to the measured Ze is calculated from the measured Ze and Vp using the table for various values of Dm. Note that unknown values of Dm are not used for the conversion.
In the presence of strong updraft or downdraft, larger values of ΔVp is needed to correct the effects of air motion. The values of Z converted from the measured Ze and Vp ±ΔVp will also fluctuate significantly. The Z corresponding to the observed Ze cannot be considered constant and will also vary considerably which sometimes results in multiple solutions. To select the appropriate solution, a k–Z relationship will be used. This issue will be described in Sect. 6 in detail.
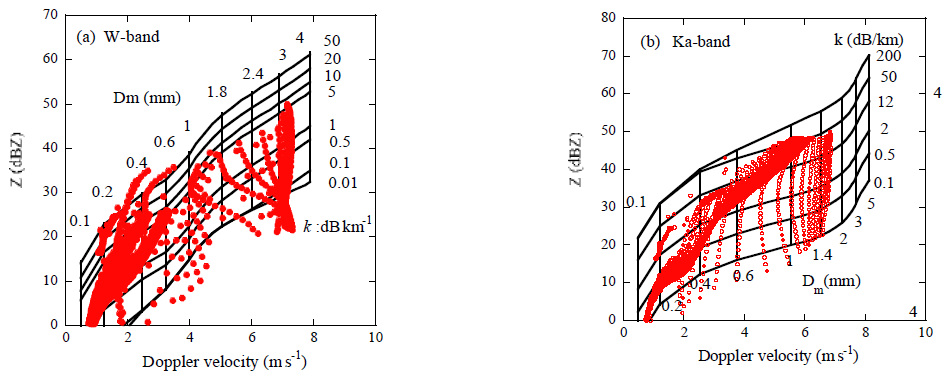
Figure 14As in Fig. 13 but the Rayleigh scattering equivalent reflectivity factor Z is used instead of Ze.
Figure 14 is the same as Fig. 13 but for Z. The horizontal lines increase monotonically even for W-band. The circle symbols shown in the figure indicate the simulated values of Z and Vp in the convective rain (for LWC >0.1 gm−3). The DSD's that evolved from the weak initial upward velocities as W0=3 and 5 m s−1 are plotted instead of 10 m s−1 for Ku-band. Smaller reflectivity factor than 25 dBZ which are usually observed with the space-borne W-band radars and 40 dBZ for Ka-band, are shown. From these figures, Dm can be determined from the measured Ze, k and Z similar to the process for Ku-band. Changing the measured Doppler velocity and find the optimum value of Vp at which the estimated k matches the observed value. Figure 15 shows the flow of the retrieval algorithm.
The Ku-band Doppler radar can detect heavy convective rain up to Ze=40–50 dBZ. Simulated data for the initial updraft velocity of 10 m s−1 are appropriate and were used for the validation. Whereas, retrievals of Dm for W-band radar are limited to light rain of Ze about 20 dBZ and near top of intense rain layer. Validation was therefore performed using the simulated data of the initial upward velocities of 3 and 5 m s−1for which DSDs of many weak rain events appear. Figure 16a is a similar relationship to Fig. 2 but shows the scatter plots of the measured Doppler velocities (Vp) and the reflectivity factors (Zm) from the CPR. Most Zm are less than 20 dBZ even for higher values of Vp. Note that values without attenuation correction and unfolding correction are plotted. Therefore, the Doppler velocities are limited to the Nyquist velocity of 5–6 m s−1. When applying the method to the W-band radar measurements, Vp needs to be unfolded before retrieval of Dm. Figure 16b is the same as Fig. 16a but shows the scatterplots of Vp and Ze calculated from the simulated DSDs. The data of Ze less than 25dBZ are plotted. For these weaker W0, the DSDs similar to the CPR measurements except for higher values of Vp are obtained. These data were used for the validation of the retrieval for W-band in which primarily measures weak rain. Simulated data for W0=10 m s−1 were also used but were limited number for Ze<25 dbZ.
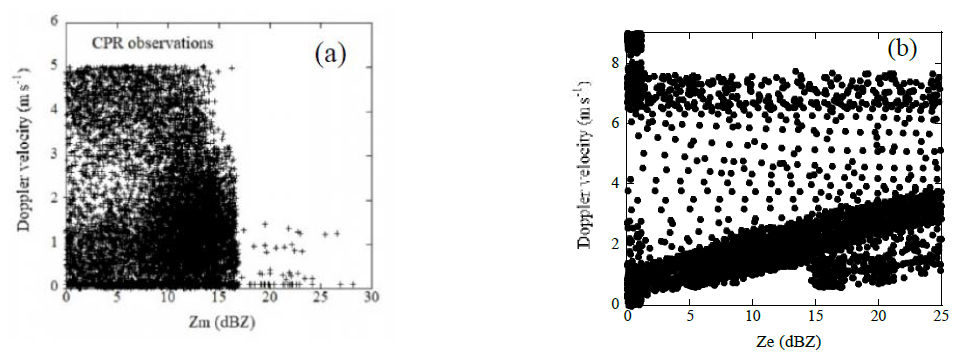
Figure 16Scatter plot of the Doppler velocities and the reflectivity factor measured with the CPR (a) and simulated (b).
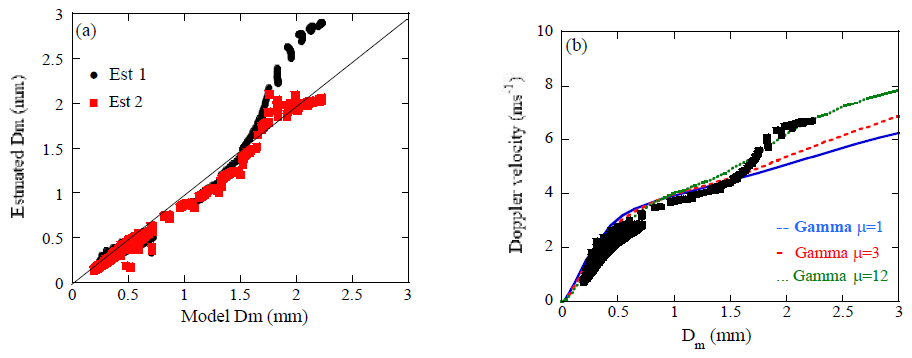
Figure 17Comparisons of the estimated Dm and the model values at the W-band (a). Estimated Dm without correction (black circles: ) and with correction (red squares: ) are plotted. The Relationships of Dm and the Doppler velocities of the simulated DSDs, and of the Gamma function (μ=1: blue, 3: red, 12: green) are plotted (b).
Figure 17 shows the retrieved and calculated (model) values of Dm for W-band (a). The vertical velocities of the atmosphere are zero for most data. The simulated data with W0=3 m s−1 are applied. Black circles represent uncorrected values of Dm (), while red square symbols represent the corrected Dm () estimated using the measured values of Zm, k and Vp. For small values of Dm less than 1.5 mm, both values of and agree well with the model values. However, for large Dm, differs significantly from the model Dm. For Dm larger than 1.5 mm, values of are overestimated, which is the opposite of the results in Ku-band (Fig. 9). Since these data are considered to be in still air, these discrepancies likely arise from the differences between the measured DSD and the DSD used in the LUT in Figs. 13 and 14. Figure 17b shows the relationships of Vp and Dm obtained from the simulated DSD (black square) which is a measure to identify DSD. The relationships for the Gamma function of μ=1 (blue), 3 (red) and 12 (green) are also plotted. This figure shows that the model values of Vp are significantly larger than the those of the LUT used in the estimation (μ=3) for Dm>1.5 mm, overestimating which is opposite to the Rayleigh regime. Despite these deviations, the corrected values of significantly reduce errors and agree well with the model values. This is because the method can compensate the effect of DSD on the retrieved Dm to some degree as well as the air motion. The data of large Dm are primarily associated with the DSDonset in which large values of Dm appear in the initial stage of rain and account for less than 5 % of all data.
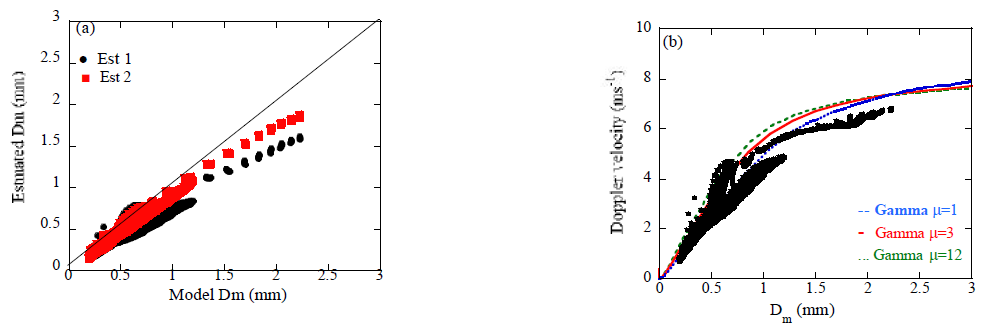
Figure 18 is the same as Fig. 17 but for the Ka-band. Data of W0=3 m s−1 are plotted. For Dm<1 mm, both estimated values of and agree well with the model values. However, for Dm>1.5 mm, retrieved tends to underestimate which is opposite of the result for W-band but is similar to the result for Ku-band (Fig. 9). In this frequency, the reflectivity both in the Rayleigh regime and the Mie regime coexist depending on the size of raindrops. The errors in the estimated Dm may be small compared with the cases for Ku and W-band. Figure 18b is the same as Fig. 17b but for Ka-band. This figure is similar to the relationship for Ku-band. Smaller values of Vp result in underestimation of .
4.3 Selection of more appropriate LUT for the Ku-band radar
In the retrieval algorithm, the Mie calculations are performed for the Gamma DSDs of various values of μ to prepare the look-up tables (LUT). In each LUT, values of Ze, Vp, k, rain rate (R), and for various values of LWC and Dm are stored. Selecting an LUT and estimate Dm. In radar algorithms to estimate rain properties, the Gamma DSD with a value of μ fixed at 3 is often used. This paper also employed such an LUT. This LUT yields generally good estimation results for DSDs of Dm less than 0.5–1.5 mm which are common in many rain events. There are, however, some DSDs of larger Dm than 1.5 mm which result in bias errors in the estimation results. Thus, the accuracy of the retrieved Dm depends on the DSD applied in the LUT. In this section, we will describe a technique to select a more appropriate DSD applied in the LUT to achieve more accurate estimation in the Ku-band radars.
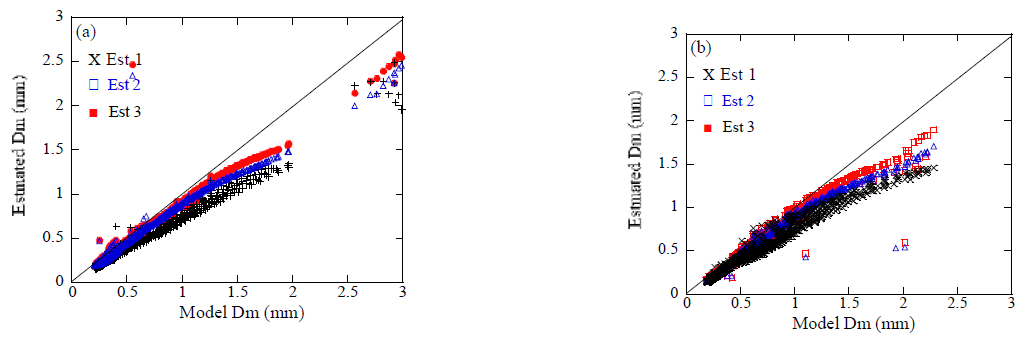
Figure 19Comparisons of the estimated Dm and model values at the Ku-band for DSDs with W0=10 m s−1 (a) and W0=3 m s−1 (b). Estimated Dm without correction (black circles: ) and with correction (blue squares: , red: ) are plotted.
As shown in Fig. 10, the relationship between Vp and Dm is a measure of DSD and allows estimation of μ close to the actual DSD but cannot be used here. As another measure of DSD, we utilize the dependence of the relationship between Ze and rain rate on Dm instead. The rain rate will be derived from the measured reflectivity factors and PIA without Vp as in the single frequency algorithm in GPM. In this paper, rain rate was calculated from the simulated DSD. First, estimate and using the LUT of the initial value of μ (=μ0). Next, select the ratio of Ze to rain rate ()LUT for from the LUT. The ratio of the measured reflectivity factor and rain rate, ()meas is compared with the ratio ()LUT. If the measured ratio ()meas is larger than the ratio ()LUT of the initial LUT(μ=μ0), the LUT of larger value of μ (=μmod) than μ0 is selected as a new LUT and vice versa. A new Dm (Est3, ) is re-estimated using the new LUT which is closer to the measured DSD. This process is repeated. Figure 19 shows such estimated using a new LUT as well as and DEst2 for DSD of W0=10 m s−1 (a) and W0=3 m s−1 (b). The value of μ0=3, and μmod=1, 6 or 9 are used depending on the ratio. Less underestimated values appear associated with using more appropriate LUT of larger μ than μ0. In the estimation, the rain rate calculated from the simulated DSD is applied as mentioned earlier. Note that the rain rate estimate algorithm usually use the measured reflectivity factor and PIA, and is not completely independent of the retrieval algorithm of Dm. The accuracy of this technique depends on the rain rate algorithm and may be needed more validation.
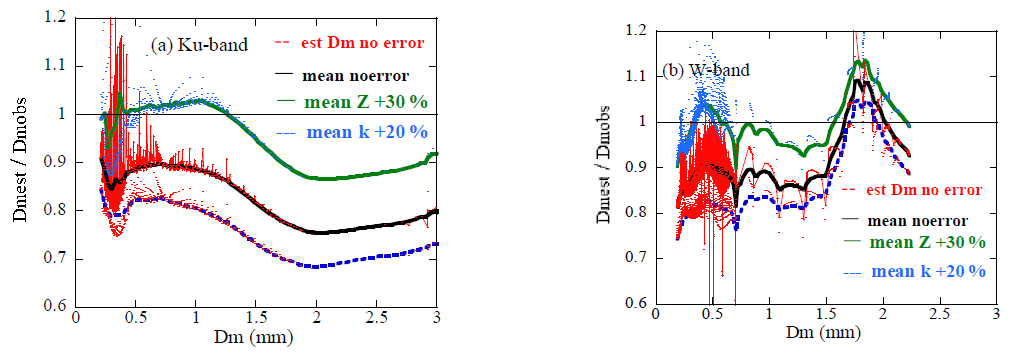
Figure 20The uncertainties in the estimated with and without measurement errors of 30 % in Zm and 20 % in k at Ku (a) and W-band (b).
Having determined Dm, it is important to examine the uncertainties in Dm arising from errors in the measured values and the retrieval process. First, we examine the uncertainties in Dm arising from measurement errors in the reflectivity factors, Vp and k for single solution cases. Even if correct Vp is given, errors in Zm and/or k result in uncertainties in Dm. Figure 20 shows the uncertainties in the estimated with and without measurement errors. The ratios of the estimated Dm to the model values are plotted for Ku (a) and W-band (b). The ratios without measurement errors (black lines) are lower than unity and decrease with Dm for Ku-band. For W-band, the ratios increase sharply at about Dm=1.5 mm. These characteristics are associated with the discrepancies of DSDs in the measurements and LUT in particular for DSDonset. Positive errors in Zm lead to increases in the ratio and vice-versa for k. The discrepancies between lines with and without measurement errors indicate effects of the measurement errors on the estimation. When there is a 30 % error (linear scale) in Zm (green line), the ratios increase by 12 % i.e. 12 % errors in the retrieval Dm arising from about 1 dBZ error in Zm for Ku-band. The effects of the measurement errors of 20 % in k (blue) are smaller as 6 %. For the W-band, there appear smaller effects in particular for larger Dm where larger changes in Z with Dm.
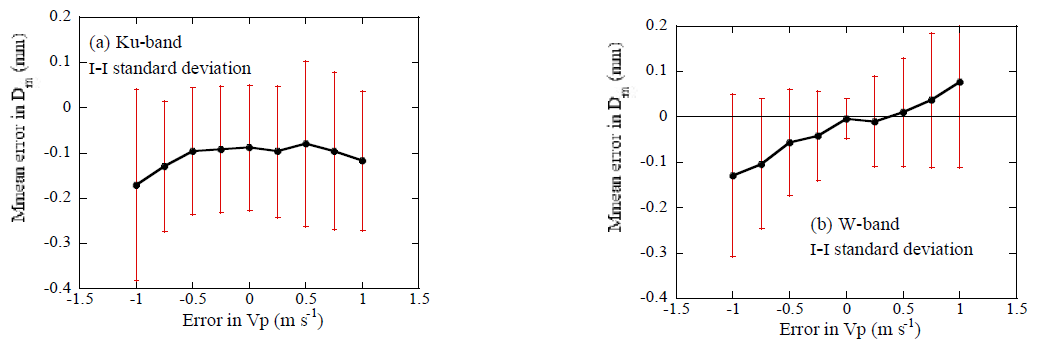
Figure 21Mean errors in the estimated arising from Vp errors for Ku (a) and W-band (b). Uniform random errors in Zm ranging from −30 % to +30 % and k ranging from −20 % to +20 % are applied.
The errors in Vp are corrected in the retrieval algorithm and do not affect the uncertainties in the retrieved Dm, but may affect the uncertainties when there exist errors in Zm and k. To assess the uncertainties arising from Vp errors (or air motion), we examined the retrieval errors when uniform random errors in Zm ranging from −30 % to +30 % and k ranging from −20 % to +20 %. The Conversion of k from PIA may be difficult at W-band. The errors in k depend on range (altitude) and may larger than 20 % in particular at near ground. However, the retrieval of Dm is limited to near top of rain at W-band and therefore less errors are expected. Figure 21 shows the mean errors and standard deviations for various Vp errors. Uncertainties are nearly independent of the Vp errors at the Ku-band (Fig. 21a). At the W-band (Fig. 21b), uncertainties increase with Vp errors due to errors in Z calculating from Ze. The overall uncertainties are small for Vp errors less than ±0.5 m s−1.
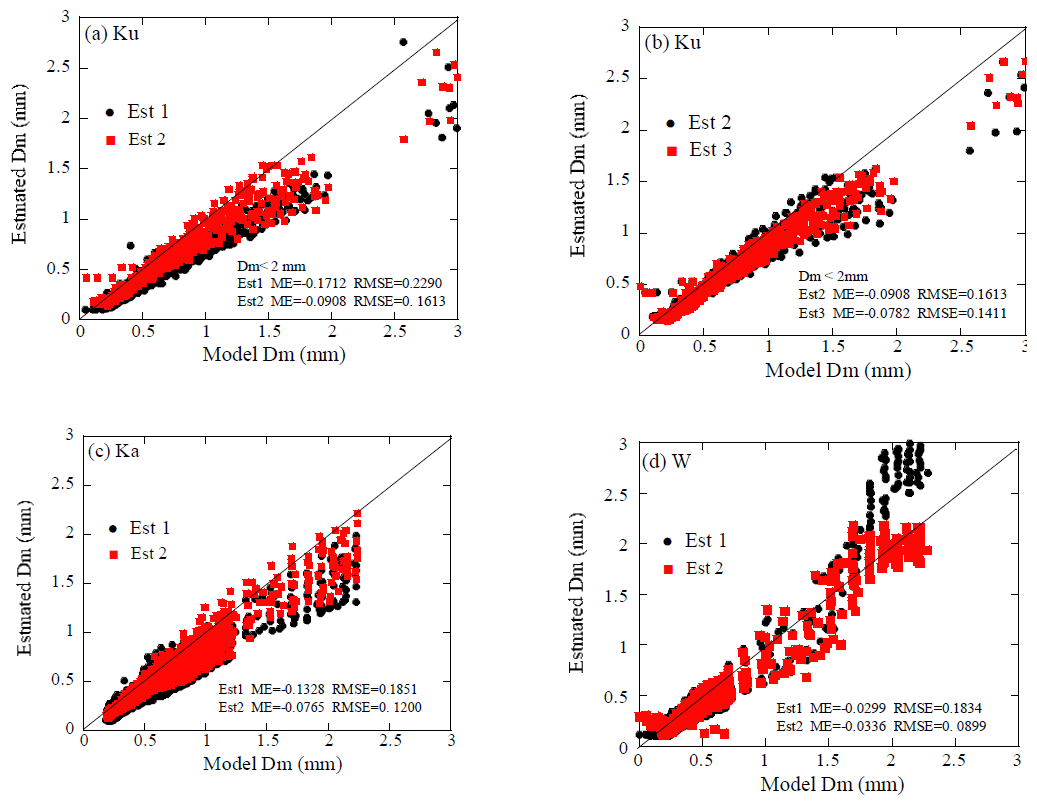
Figure 22Results of the estimation for random errors in Vp ranging from −0.5 to +0.5 m s−1, Ze from −30 % to +30 % (about 1 dBZ) and k from −20 % to +20 % uniformly at Ku (a), Ku (b), Ka (c) and W-band (d).
To examine the potential of the method for the practical use, we furthermore estimated Dm when there are random errors in the measured Ze, k, and Vp. Figure 22 shows comparisons of the estimated and model values of Dm for Ku (a, b), Ka (c) and W-band (d). Results arising from random errors in Vp ranging from −0.5 to +0.5 m s−1, Ze from −30 % to +30 % (about 1 dBZ) and k from −20 % to +20 % uniformly are plotted. The black circles represent uncorrected values of Dm (), i.e., estimated from the observed Vp and are not affected the errors in Ze and k for Ku-band. The red squares represent the corrected for panels (a, c, d) and for (b). There appears large scatter in the estimated Dm associated with the random errors. Following are the mean error (ME) and the root mean square error (RMSE) of the difference between estimated and model Dms for Est1, Est2 and Est3.
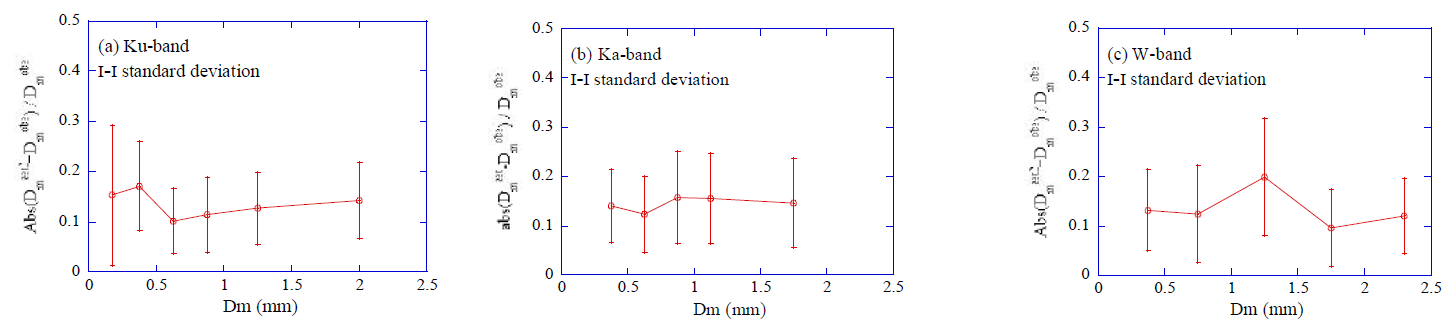
Figure 23Percentage errors in the retrieved Dm with random errors in Ze, k, and Vp as in Fig. 22 at Ku (a), Ka (b) and W-band (c). The ratio of the absolute differences between retrieved and model Dm to the model Dm are plotted.
Ku-band:
Ka-band:
W-band:
The mean errors and RMSE in the estimated are improved. Uncertainties over the whole range of Dm were relatively small, as shown above. The retrieval errors in Dm, however, vary with Dm because the differences between the measured DSDs and those used in the LUT vary with Dm. Figure 23 shows the percentage errors of the absolute difference between retrieved Dms and the model values with random errors as in Fig. 22. Mean percentage errors and the standard deviations are plotted for Ku (a), Ka (b) and W-band (c). The mean percentage errors are about 0.15 mm and the standard deviation are less than 0.1 mm. For convective rain, larger vertical velocities often occur than 0.5 m s−1. Effects of such larger air motion on the retrieved Dm will be discussed in next section.
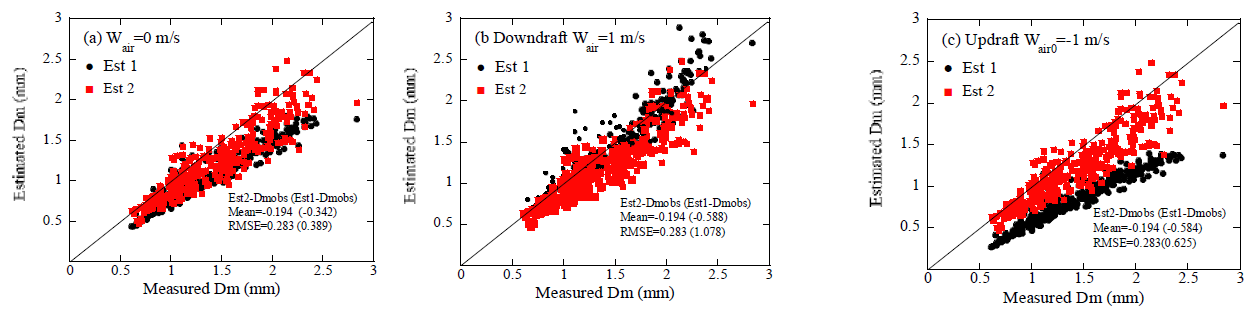
Figure 24Results of estimating Dm for disdrometer-measured DSDs at the Ku-band with the vertical velocities (Wair) of 0 m s−1 (a), 1 m s−1 (b), and −1 m s−1 (c).
We examined the method for estimating Dm using the DSD evolved from the MonDrop model. Since these DSDs vary significantly both vertically and temporally depending on the stage of precipitation, they are well-suited for validating the method. To estimate Dm, the LUT is prepared in which the DSD is assumed to be a gamma function. The accuracy of the estimated Dm is related to the differences between the observed DSDs and the DSD used in the LUT. Therefore, the validations using actual DSDs allow for more robust assessments of the method's potential and practical use. Here, we examine the retrieval method using disdrometer-measured DSDs at Maebashi, Japan, in July and September 2022. Vertical air motions are added to validate the method. As in Fig. 22, Dms are estimated by applying random errors that varied uniformly over the ranges of −0.5 to 0.5 m s−1 for Vp, −30 % to 30 % for Ze, and −20 % to 20 % for k as measurement errors.
Figure 24 shows the results of estimated Dm in the Ku-band with the vertical velocities (Wair) of 0 m s−1 (a), 1 m s−1 (b), and −1 m s−1 (c). Note that negative velocity indicates upward motion. Even in the absence of air motion, the estimated Dms (Est1) are underestimated, similar to the results shown in Fig. 9. This is likely because the measured DSDs differs from the DSD employed in the LUT. The estimated Dms (Est2) are closer to the true value. In the case of a downward air motion of 1 m s−1 (b), both Est1 and Est2 are close to the true values due to the effects of the difference between the actual DSD and the DSDLUT. Conversely, for an upward air velocity of 1 m s−1 (c), the estimated Dms (Est1) show significantly underestimation due to the reduced values of Vp caused by the updraft air motion, whereas Est2 is not affected by air motion and yields good results.
For the W-band, the measured reflectivity (Ze) is firstly converted to the Rayleigh reflectivity factor (Z). The Doppler velocities are modified as Vp±ΔVp so that the calculated specific attenuation using the LUT matches the observed value as mentioned earlier. When the vertical velocities are low (e.g., turbulence), the range over which Vp needs to be varied (ΔVp) is small, therefore, the fluctuations in Z are small associated with ΔVp. As shown in Fig. 14, Z increases monotonically with Vp at a specified k, and a single value of Dm can be determined when Z is nearly constant. Since larger values of ΔVp is needed in the presence of large air motion, the values of Z converted from the measured Ze and Vp ±ΔVp will also fluctuate significantly. When the observed Vp differs significantly from the true value (fall velocity of rain drops) due to air motion, the Z corresponding to the observed Ze cannot be considered constant and will also vary considerably, resulting in complicated variations of k with ΔVp. The calculated values of k sometimes do not increase/decrease monotonically with ΔVp and the multiple solution problem arises. There are two or more values of Vps which give the minimum difference between the calculated k and the observed value.
To select the appropriate solution from the multiple solutions as ΔVp1 and ΔVp2, the reflectivity factors of Z1 and Z2 at ΔVp1 and ΔVp2 respectively are used. Generally, Ze is well collected to k. Similar relationship between Z and k is used to determine Z corresponding to the measured Ze and k. The appropriate solution is selected from the multiple solutions so that the Zs calculated from the k-Z relationship (Z=akb) are closest to the Zs at the multiple solutions. Note that the accurate Z from the k–Z relationship may not be necessary because the reflectivity factors at ΔVp1 and ΔVp2 are generally significantly different, given the large difference between ΔVp1 and ΔVp2. For the coefficient of the k–Z relationship, the values of a=23.9 and b=0.174 are used for the coefficient of the k-Z relationship which are determined from the empirical formula in the disdrometer data in July. Note that this relationship exhibits larger scatter at smaller Z, so the measured Z is taken to be Ze for Z less than 20 dBZ.
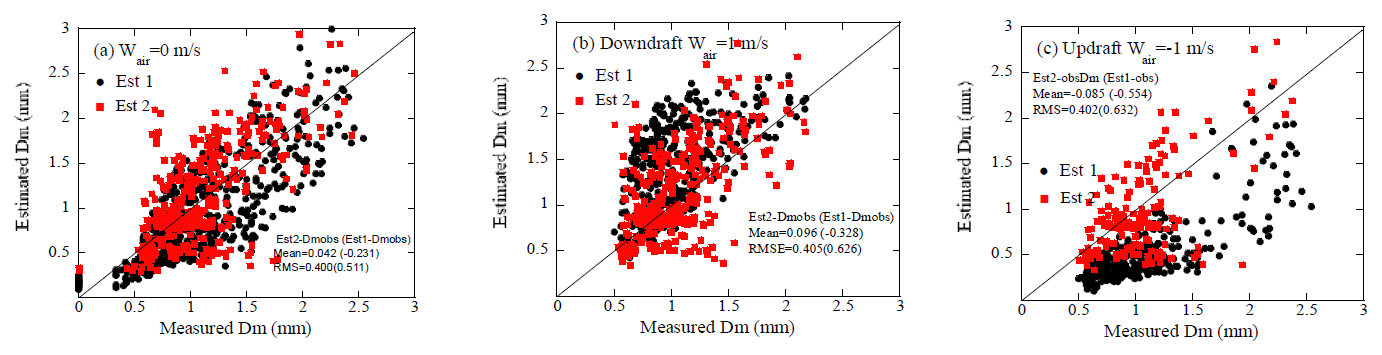
Figure 25 is as in Fig. 24 but for the W-band. For still air (a), the estimated Dms of Est1 and Est2 seem to be similar results but the mean error is −0.23 for Est1 and −0.042 for Est2. In the presence of downdrafts (b), the estimated Dms (Est1) overestimate, while they significantly underestimate in the presence of updrafts (c). Conversely, Est2 yields values close to the observed Dm in the both cases. Note Est2 is affected by air motion in this band because Z converted from Ze is affected by the Doppler velocity.
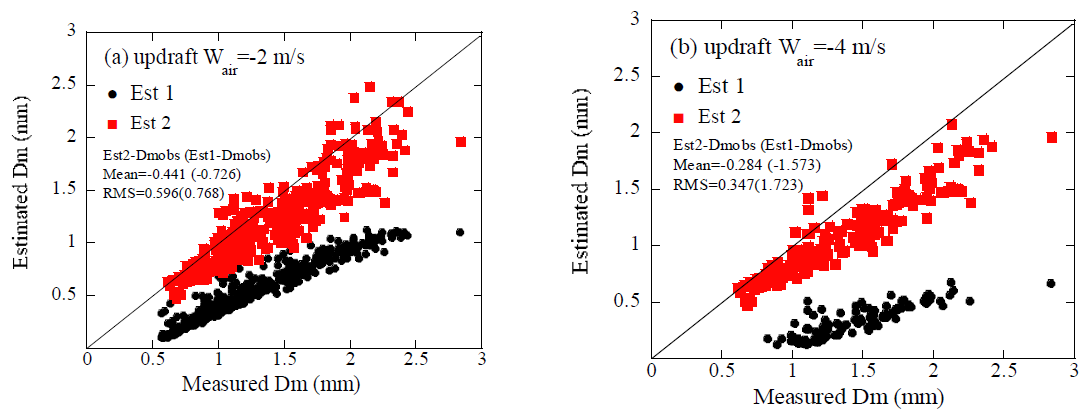
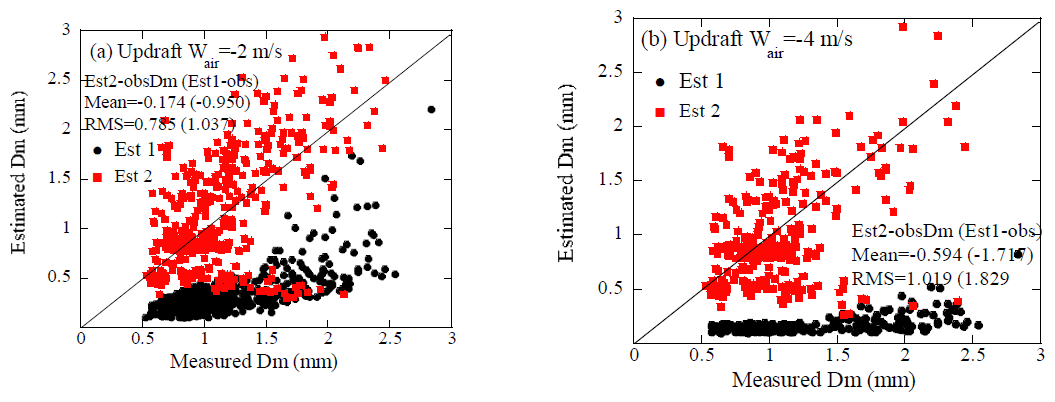
Strong updrafts are often observed in convective rains. We have also estimated Dm for such conditions to examine whether Dm estimations are feasible during convective precipitation with strong updrafts. Figure 26 shows the results for (a) and −4 m s−1 (b) at the Ku-band. Due to the reduced raindrop fall velocity, Dms are significantly underestimated for Est1 in particular for m s−1. Figure 27 is as in Fig. 26 but for the W-band. While the overall tendencies are similar to those of the Ku-band, the estimated Dms (Est2) exhibit more scatter than that of the Ku-band. This is due to the more complicated retrieval process than that of Ku-band. Mean errors of Est2 are, however, considerably improved. In the presence of large air motion, multiple solutions may arise in the W-band as mentioned earlier. To select the appropriate solution, Z is calculated for each solution using the k–Z relationship. While accurate values of Z from the relationship may not be possible, they may be useful for selecting the appropriate solution. To examine this issue, Dms were retrieved for DSDs evolved by the MonDrop model using the same k-Z relationship. Figure 28 shows the results of estimating Dm for DSDs (with w0=3 m s−1) evolved by the MonDrop model in an updraft velocity of −4 m s−1. Some overestimated values of Dm (Est2) appear around Dm=0.6 mm. This is likely because the applied k-Z relationship may not be suitable for certain DSDs generated by the MonDrop model, which exhibit significant variations of DSDs exist. However, the numbers of data with large errors are very limited. Figure 28b shows the frequency histogram of the errors; most data fall within the range of ±0.4 mm, indicating that errors due to the k–Z relationship may be limited.
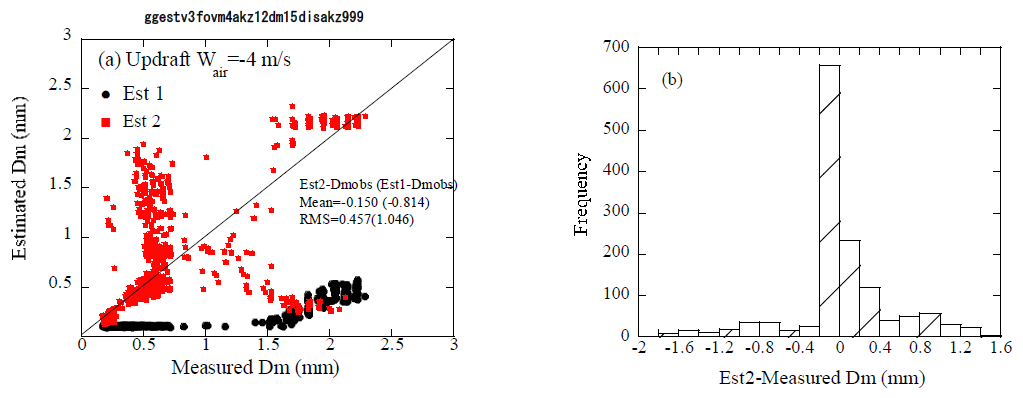
Figure 28Results of estimated Dm for DSDs evolved by the MonDrop model (W0=2, 3, 5 m s−1) at the W-band with the vertical velocities of 4 m s−1 (a). Frequency plot of error in Est2 (b).
The observed Doppler velocity (Vobs) is the sum of the air velocity (Vair) (Eq. 3) and the velocity (VD) which is a reflectivity-weighted velocity of raindrop terminal velocity. In estimating Dm, the velocity Vest corresponding to Dm is determined from the LUT (Fig. 8) using measured k and Ze. Although the difference between Vest and Vobs approximates the vertical air velocity, it is not the exact value because the DSDLUTusually differs from the actual DSD of raindrops (DSDobs), resulting in errors in the calculated air velocity and the estimated Dm. The attenuation depends on the shape of DSD but not so significantly. This section discusses whether the measured values of Ze, k and Vobs, contain the DSD information.
The estimated Doppler velocity of rain fall velocity Vest in estimating Dm, is given as
Here, ΔVDSD represents the error resulting from the difference between the DSDobs and DSDLUT. Since k depends on the DSD (Fig. 7), ΔVDSD is reduced to some extent, but not sufficiently. When the difference between DSDobs and DSDLUT is small, the air velocity Vair can be determined by subtracting VD from Vobs. However, the actual DSD does not usually match the DSDLUT. Since the exact shape of DSDobs is unknown, it is difficult to determine the exact ΔVDSD. Nevertheless, if the parameter (f) characterizing the DSD (such as μ in a Gamma distribution) is known, it is possible to estimate ΔVDSD to some degree. Using the parameter f, ΔVDSD can be expressed as:
where Δf represents the difference between the parameter fobs and fLUT which characterize DSDobs and the DSDLUT respectively.
Figure 29 shows the relationship between and the Doppler velocity for the gamma functions with various values of μ for W-band. This figure demonstrates that this ratio varies with μ, suggesting that can be used as an indicator of the shape of DSD. When δ() is used as the parameter f, Eq. (5) is expressed as:
where () represents the value of () at Vest for DSDLUT and ()obs is the measured (). Here, δ() (where Ze is a linear scale), which defined as the difference in between different DSDs, is used as the parameter f. As shown in Fig. 7b, depends on DSD, specifically on the μ of the gamma function. The DSD information provided by is limited but was selected because this parameter can be obtained directly from the Doppler radar measurements. To calculate () for various values of V, () of each DSD was approximated using a fourth-order polynomial in V. The values of VD were determined by iteratively varying the VD value to satisfy Eq. (4), instead of directly solving the fourth-order equation. The Doppler velocity VD is derived from ΔVDSD and Vest.
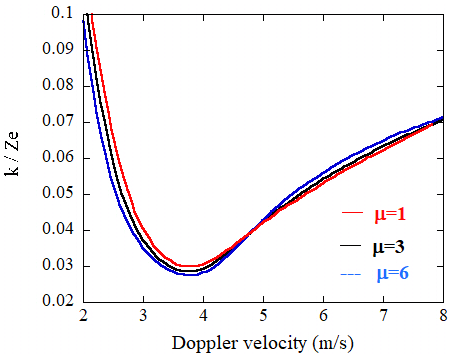
Figure 29The relationship between and the Doppler velocity for the gamma functions with various values of μ for the W-band.
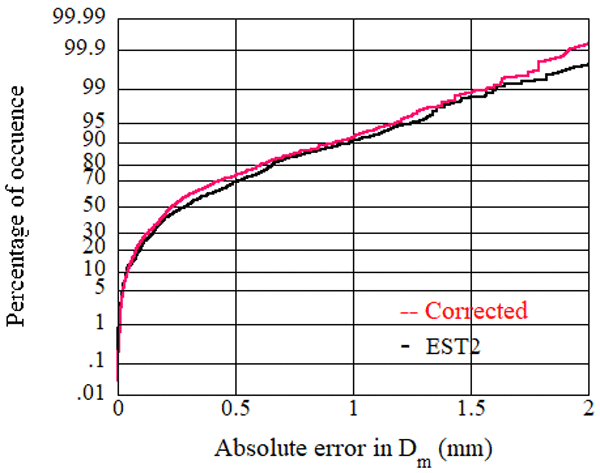
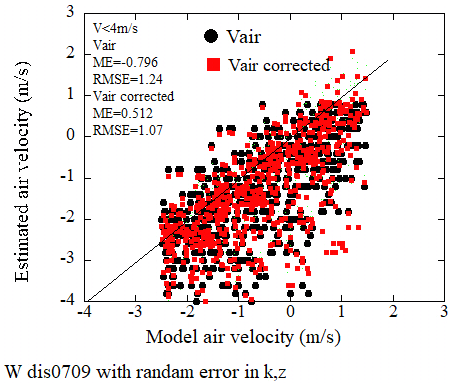
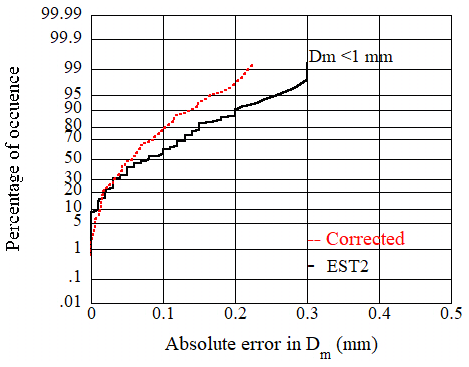
Here, we examine the technique using disdrometer-measured DSDs as shown in the previous section. Vertical air motions are added to validate the method except for the Ku-band. As in Fig. 22, the effects of DSD are evaluated by applying random errors that varied uniformly over the ranges of −0.5 to 0.5 m s−1 for Vp, −30 % to 30 % for Ze, and −20 % to 20 % for k as measurement errors. Figure 30 shows the estimated vertical air velocities plotted against the true (model) Vair. Black circles are Vair derived from Vest and red squares are Vair derived from VD, that is corrected the effects of DSD. Although there is significant scatter, both results show good correlation with the model values. The corrected values are slightly improved in the mean error (ME) and the root mean square error (RMSE) but not significantly because () contains limited information of DSD in particular for the Doppler velocity around 5 m s−1. Note that whether the term or vice-versa in Eq. (6) depends on whether the observed Vobs is larger or less than the value in LUT (Fig. 30). The derived VDs were also used to estimate Dm. Figure 31 shows cumulative percentage of the estimated errors of Est2 and Dm from VD, showing improvement. The cumulative percentage of occurrence of the absolute error less than 0.5 mm is improved by 5 %.
For Ku-band, k is primarily determined by the LWC of rain rather than the shape of DSD. Consequently, it is difficult to assess the DSD effects by using . Here, we examine whether the DSD information provided by the measured values of Ze. k and Vobs in the Ku-band. In doing so, the parameter () is used for f instead of (). This may be strange but may be possible because f is a parameter to define the effects of the difference of DSD on V. Figure 32 shows the relationship between and the Doppler velocity for DSD of the gamma functions with μ=1 and 3 for Ku-band. This figure suggests that this ratio varies with μ for VD less than 4 m s−1 and can be used as an indicator of the shape of DSD for such range. Figure 33 is the same as Fig. 31 but for Ku-band. The value of VD less than 4 m s−1 are plotted, showing slight improvement.
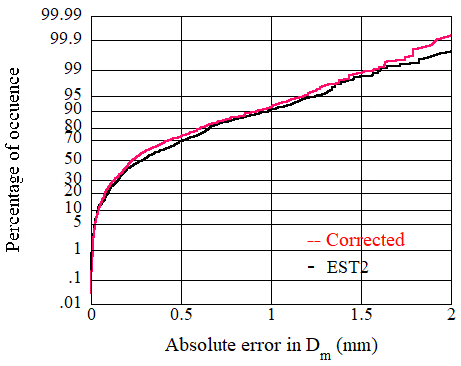
Figure 31Cumulative percentage of the occurrence of the errors in the estimated Dm (Est2) and the corrected values.
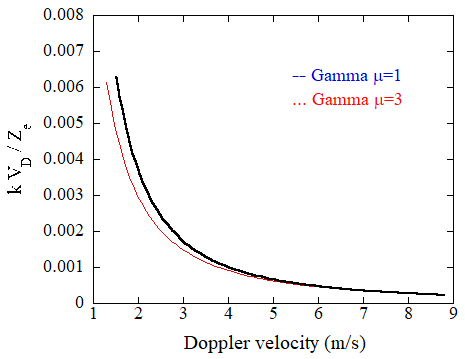
Figure 32The relationship between and the Doppler velocity for DSD of the gamma functions with μ=1 and 3 for the Ku-band.
A physically-based algorithm for estimating mass-weighted raindrop diameter (Dm) from radar reflectivity and specific attenuation is presented. In the absence of the vertical air motion, Dm can be estimated from the Doppler velocity observed by a space-borne Doppler radar, assuming a specific DSD. The estimated Dms are not correct in the presence of the air motion. A detailed error analysis is presented in estimating Dm (, ) using simulated rain drop size distributions and disdrometer-measured DSDs. A Monte Carlo model was employed to evolve the DSD through coalescence and breakup in a convective rain.
At the Ku-band, values of Dm were estimated from the attenuation-corrected Ze and the specific attenuation k, assuming DSD (). Although errors arising from the discrepancy between the assumed and actual DSDs occur, their magnitude is smaller than . The effects related to the variability of DSD were difficult to correct due to the Rayleigh scattering regime. Accurate estimation requires appropriate LUTs with the DSD similar to the measured one. A technique to determine more appropriate LUTs was presented by exploiting the dependence of the Z-R relationship on Dm for the Ku-band. The retrieved Dms were improved using this technique. Additionally, using as a measure, that is, a parameter representing the DSD shape may offers a potential way to reduce the DSD effects. At the W-band, Dms were also estimated. In the estimation, the Rayleigh reflectivity, converted from the measured Ze using the Doppler velocities was used. Since k depends on the shape of DSD, the DSD-related effects are reduced but are limited. The effects are relatively smaller for small Dm but are larger for larger Dm. The DSD-related effects may be reduced by using as a measure of the DSD shape.
The values of Ze and k both depend on the same attenuation retrieval, so their errors are correlated. Further efforts are required to measure these values accurately in particular for the W-band. Although the estimation is limited for weak rain or near top of rain layer at the W-band due to significant attenuation and the Mie scattering regime, the presented method possibly improves our understanding of the rain system with space-borne doppler radar.
Gillespie (1975) defined and calculated a probability function P(τ, i,j) called the coalescence probability density function, and proposed a method that does not ignore the correlation, instead of calculating number of particles directly. Consider the case where there are well-mixed N droplets at time t. The function P(τ, i, j) dτ(i<j) is the probability that droplets i and j will collide in the time interval t+τ and , dτ is the infinitesimal time. This probability is the product of the probability that no collision occurs in the time interval t, t+τ, the probability that a collision occurs between t+τ and and the probability that no collision of the other particle occurs between t+τ and and is expressed as follows.
where Cij dτ the probability that droplets i, j will collide in the next infinitesimal time dτ which is related to the collection kernel as K (mi, mj) per the volume of well-mixed cloud or rain. Given Cij, the probability can be obtained without approximation. The collision process is numerically calculated for an arbitrary kernel. Equation (A1) is given as
where C0 is the total rate for any collision events in the volume V. In the model by Seeßelberg et al. (1996) in which drop classes are introduced to specify DSD, and C0 is given as
where Kij is the collision kernel, the probability that particles i and j in the volume V collide. The first term on the right-hand side represents the probability that particles i≠j and the second term represents the probability that drops of i=j collide. The time interval τ is determined from Eq. (A2) using uniformly distributed random number (η) from 0 to 1 as:
The next step is to select colliding droplets (i,j). The probability of collision of droplet i and j, (Dij) is expressed as
The probability of collision of particle i with any other droplets, Di is as follows.
The colliding particle i is determined from the cumulative distribution of with respect to droplet i and a random number. The colliding droplet j with drop i is determined from the cumulative distribution of and a random number. Create a cumulative distribution for the mass (bin number) i of and determine the mass i by a random number. In this algorithm, the so-called well-known problem (Bott, 1998) arises: the bin of a newly generated particle by coalescence or breakup is determined but is not known the exact size in the bin. We apply the method by Seeßelberg et al. (1996).
The collection kernel is written as follows:
where Ecol is the collision efficiency, which is the ratio of collision cross section to the geometric cross section, and Ecoal is the coalescence efficiency, which indicates the probability of coalescence of collision particles. In this paper, the collision efficiency is set to be unity considering the fact that the raindrop size is larger than 0.1 mm. The coalescence efficiency was calculated by Low and List (1982a).
Here, DL and Ds are the diameters of larger and smaller drops, and Sc is the surface energy of the spherical equivalent of the united drop mass. Er is the sum of the collision kinetic energy and the particle surface energy loss due to coalescence. σ is the surface tension of water. Parameter a and b are constant values. The effect of turbulence is not considered. The coalescence efficiency by Low and List (1982a) may underestimate the coalescence and result in higher slope in the equilibrium raindrop size distribution (Barthes and Mallet, 2013; Hu and Srivastava, 1995). The shape of DSD significantly varies in vertical as well as in the life stage of rain. The object of the simulation is to create a database of such variations of DSD to examine the method for estimating Dm from space-borne Doppler radar observations, therefore the coalescence efficiency of Eq. (A8) which has been usually used, was applied. For breakup, the probabilities of the occurrence of the filament, sheet, and disk types were considered. The DSD of each type of breakup was determined by Low and List (1982b). Note, the rate of breakup was assumed to be (1−Ecoal) and for DL<0.2 mm, Ecoal=1.
Finally, we will mention statistical fluctuations of the results of the MonDrop. Statistically accurate results may be obtained from several runs between three to 10 (Gillespie, 1975). To determine statistically meaningful results with K runs, following values are used.
where Ni is the Monte Carlo results, such as DSD, LWC, etc. at i run. If , the result can be considered reliable.
Simulated data used in the manuscript are available upon request.
T. Kobayashi developed the retrieval algorithm. K, Masuda developed MonDROP model. H. Yamauchi and A. Adachi made validations.
The contact author has declared that none of the authors has any competing interests.
Publisher's note: Copernicus Publications remains neutral with regard to jurisdictional claims made in the text, published maps, institutional affiliations, or any other geographical representation in this paper. The authors bear the ultimate responsibility for providing appropriate place names. Views expressed in the text are those of the authors and do not necessarily reflect the views of the publisher.
This work is partially supported by Japan Aerospace Exploration Agency. The authors are grateful for the comments by two anonymous reviewers, which considerably improved the manuscript.
This paper was edited by Maximilian Maahn and reviewed by two anonymous referees.
Adachi, A., Kobayashi, T., and Yamauchi, H.: Estimation of Raindrop Size Distribution and Rainfall Rate from Polarimetric Radar Measurements at Attenuating Frequency Based on the Self-Consistency Principle, J. Meteorol. Soc. Jpn., 93, 359–388, https://doi.org/10.2151/jmsj.2015-020, 2015.
Battaglia, A., Kollias, P., Dhillon, R., Rot, R., Tanelli, S., Lamer, K., Grecu, M., Lebsock, M., Watters, D., Mroz, K., Heymsfield, G., Li, L., and Furukawa, K.: Spaceborne cloud and precipitation radars: Status, challenges, and ways forward, Rev. Geophys., https://doi.org/10.1029/2019RG000686, 2019.
Bayewitz, M. H., Yerushalmi, J., Katz, S., and Shinnar, R.: The extent of correlations in a stochastic coalescence process, J. Atmos. Sci., 31, 1604–1614, https://doi.org/10.1175/1520-0469(1974)031<1604:TEOCIA>2.0.CO;2, 1974.
Barthes, L. and Mallet, X.: Vertical evolution of raindrop size distribution: Impact on the shape of the DSD, Atmos. Res., 119, 13–22, https://doi.org/10.1016/j.atmosres.2011.07.011, 2013.
Berry, E. X. and Reinhardt, R. L.: An analysis of cloud droplet growth by collection: Part I. Double distributions, J. Atmos. Sci., 31, 1814–1824, https://doi.org/10.1175/1520-0469(1974)031<1814:AAOCDG>2.0.CO;2, 1974.
Best, A. C.: Empirical formulae for the terminal velocity of water drops falling through the atmosphere, Q. J. Roy. Meteor. Soc., 76, 302–311, https://doi.org/10.1002/qj.49707632905, 1950.
Bringi, V. N., Thurai, M., Nakagawa, K., Huang, G. J., Kobayashi, T., Adachi, A., Hanado, H., and Sekizawa, S.: Rainfall Estimation from C-Band Polarimetric Radar in Okinawa, Japan: Comparisons with 2D-Video Disdrometer and 400 MHz Wind Profiler, J. Meteorol. Soc. Jpn., 4, 705–724, https://doi.org/10.2151/jmsj.84.705, 2006.
Bringi, V. N., Chandrasekar, V., Hubbert, J., Gorgucci, E., Randeu, W. L., and Schoenhuber, M.: Raindrop size distribution in different climatic regimes from disdrometer and dual-polarized radar analysis, J. Atmos. Sci., 354–365, https://doi.org/10.1175/1520-0469(2003)060<0354:RSDIDC>2.0.CO;2, 2003.
Bringi, V. N., Williams, C. R., Thurai, M., and May, P. T.: Using Dual-polarized radar and dual-frequency profiler for DSD characterization: A case study from Darwin, Austlia, J. Atmos. Ocean. Tech., 26, 2107–2122, https://doi.org/10.1175/2009JTECHA1258.1, 2009.
Bott, A.: A flux method for the numerical solution of the stochastic collection equation, J. Atmos. Sci., 55, 2284–2293, https://doi.org/10.1175/1520-0469(1998)055<2284:AFMFTN>2.0.CO;2, 1998.
Chen, F., Zheng, X., Wen, H., and Yuan, Y. T.: Microphysics of convective and stratiform precipitation during the summer monsoon season over the Yangtze-Huaihe river valley, Cina, J. Hydrometeorol., 23, 239–252, https://doi.org/10.1175/JHM-D-21-0078.1, 2022.
Gillespie, D. L.: An Exact Method for numerically simulating the Stochastic Coalescence process in a Cloud, J. Atmos, Sci., 32, 1977–1989, https://doi.org/10.1175/1520-0469(1975)032<1977:AEMFNS>2.0.CO;2, 1975.
Houze, R. A.: Cloud dynamics, Academic Press, 406 pp., ISBN-10 0123742668,2014, 1993.
Hu, Z. L. and Srivastava, R. C.: Evolution of raindrop size distribution by coalescence, breakup and evaporation-theory and observations, J. Atmos. Sci., 52, 1761–1783, https://doi.org/10.1175/1520-0469(1995)052<1761:Eorsdb>2.0.Co;2, 1995.
Iguchi, T., Kozu, T., Meneghini, R., Awaka, J., and Okamoto, K.: Rain profiling algorithm for the TRMM precipitation radar, J. Appl. Meteorol., 39, 2038–2052, https://doi.org/10.1175/1520-0450(2001)040<2038:RPAFTT>2.0.CO;2, 2000.
Iki, K.,Takayama, S., Nio, T.,Okada, K.,and Furukawa, K.: Overview of precipitation measuring mission (PMM): the next generation rain mission, Proceedings of the SPIE, 13262, https://doi.org/10.1117/12.3039878, 2025
Khain, A. Ovtchinnikov, M. M., Pinsky, M., Pokrovsky, A., and Krugliak, H.: Notes on the state-of-the-art numerical modeling of cloud microphysics, Atmos. Res., 55, 159–224, https://doi.org/10.1016/S0169-8095(00)00064-8, 2000.
Kollias, P., Puidgomènech Treserras, B., Battaglia, A., Borque, P. C., and Tatarevic, A.: Processing reflectivity and Doppler velocity from EarthCARE's cloud-profiling radar: the C-FMR, C-CD and C-APC products, Atmos. Meas. Tech., 16, 1901–1914, https://doi.org/10.5194/amt-16-1901-2023, 2023.
Kobayashi, T. and Adachi, A.: Measurements of raindrop breakup by using UHF wind profilers, Geophys. Res. Lett., 4071–4074, https://doi.org/10.1029/2001GL013254, 2001.
Kobayashi, T. and Adachi, A.: Retrieval of Arbitrary shaped raindrop size distributions from wind profiler measurements, J. Atmos. Ocean. Tech., 22, 433–442, https://doi.org/10.1175/JTECH1705.1, 2005.
Kobayashi, T., Nomura, M., Adachi, A., Sugimoto, S., Takahashi, N., and Hirakuchi, H.: Retrieval of attenuation profiles from the GPM dual-frequency radar observations, J. Meteorol. Soc. Jpn., 99, 603–621, https://doi.org/10.2151/jmsj.2021-030, 2022.
Langmuir, I.: The production of rain by a chain reaction in cumulus clouds at temperatures above freeze, J. Meteorol., 5, 175–192, https://doi.org/10.1175/1520-0469(1948)005<0175:TPORBA>2.0.CO;2, 1948.
List, R. and McFarquhar, G. M.: The role of breakup and coalescence in the three-peak equilibrium distribution of raindrops, J. Atmos. Sci., 47, 2274–2292, https://doi.org/10.1175/1520-0469(1990)047<2274:TROBAC>2.0.CO;2, 1990.
Long, A.: Solutions to the droplet collection equation for polynomial kernels, J. Atmos. Sci., 31, 1040–1052, https://doi.org/10.1175/1520-0469(1974)031<1040:STTDCE>2.0.CO;2, 1974.
Low, T. and List, R.: Collision, Coalescence and Breakup of Raindrops. Part I: Experimentally Established Coalescence Efficiencies and Fragment Size Distributions in Breakup, J. Atmos. Sci., 39, 1591–1606, 1982a.
Low, T. and List, R.: Collision, Coalescence and Breakup of Raindrops. Part II: Experimentally Established Coalescence Efficiencies and Fragment Size Distributions in Breakup, J. Atmos. Sci., 39, 1607–1618, https://doi.org/10.1175/1520-0469(1982)039<1591:CCABOR>2.0.CO;2, 1982b.
Ma, Y., Ni, G., Chandra, C. V., Tian, F., and Chen, H.: Statistical characteristics of raindrop size distribution during rainy seasons in the Beijing urban area and implications for radar rainfall estimation, Hydrol. Earth Syst. Sci., 23, 4153–4170, https://doi.org/10.5194/hess-23-4153-2019, 2019.
Matrosov, S. Y.: Characteristic raindrop size retrieval from measurements of difference in vertical Doppler velocities at Ka and W-band radar frequencies, J. Atmos. Ocean. Tech., 34, 65–71, https://doi.org/10.1175/JTECH-D-16-0181.1, 2017.
Meneghini, R. and Nakamura, K.: Range profiling of rain rate by airborne weather radar, Remote Sense. Environ., 31, 193–209, https://doi.org/10.1016/0034-4257(90)90089-5, 1990.
Mroz, K., Battaglia, A., Kneifel, S., D'Adderio, L. P., and Neto, J. D.: Triple-frequency Doppler retrieval of characteristic raindrop size, Earth Space Sci., 1–17, https://doi.org/10.1029/2019EA000789, 2020.
Mroz, K., Treserras, B. P., Battaglia, A., Kollias, P., Tatarevic, A., and Tridon, F.: Cloud and precipitation microphysical retrievals from the EarthCARE Cloud Profiling Radar: the C-CLD product, Atmos. Meas. Tech., 16, 2865–2888, https://doi.org/10.5194/amt-16-2865-2023, 2023.
Pruppacher, H. R. and Klett, J. D.: Microphysics of Clouds and Precipitation, Kluwer Academic, 954 pp., ISBN-10 0792342119, 1997.
Rogers, R. R.: Raindrop collision rates, J. Atmos. Sci., 46, 2469–2472, https://doi.org/10.1175/1520-0469(1989)046<2469:RCR>2.0.CO;2, 1989.
Sato K., Okamoto H., Yamamoto M., K., Fukao S., Kumagai H., Ohno Y., Horie H., and Abo M.: 95-GHz Doppler rada and lidar synergy for simultaneous ice microphysics and in-cloud vertical air motion retrieval, J. Geophys. Res., 114, D03203, https://doi.org/10.1029/2008JD010222, 2009.
Seeßelberg, M., Trautmann, T., and Thorn, M.: Stochastic simulations as a bench-mark for mathematical methods solving the coalescence equation, Atmos. Res., 40, 33–48, https://doi.org/10.1016/0169-8095(95)00024-0, 1996.
Seto, S., Iguchi, T., Meneghini, R., Awaka, J., Kubota, T., Masaki, T., and Takahashi, N.: The Precipitation Rate Retrieval Algorithms for the GPM Dual-frequency Precipitation Radar, J. Meteorol. Soc. Jpn., 39–71, https://doi.org/10.2151/jmsj.2021-011, 2021.
Shusse, Y., Maki, M., Shimizu, S., Iwamami, K., Maesaka, T., Suzuki, S., Sakurai, N., and Misumi, R.: Relationship between precipitation core behavior in cumulonimbus clouds and surface rainfall intensity on 18 August 2011 in the Kanto region, Japan, J. Meteorol. Soc. Jpn., 93, 215–228, https://doi.org/10.2151/jmsj.2015-012, 2015.
Wehr, T., Kubota, T., Tzeremes, G., Wallace, K., Nakatsuka, H., Ohno, Y., Koopman, R., Rusli, S., Kikuchi, M., Eisinger, M., Tanaka, T., Taga, M., Deghaye, P., Tomita, E., and Bernaerts, D.: The EarthCARE mission – science and system overview, Atmos. Meas. Tech., 16, 3581–3608, https://doi.org/10.5194/amt-16-3581-2023, 2023.
Williams, C. R., Beauchamp, R. M., and Chandrasekar, V.: Vertical air motions and raindrop size distributions estimated using mean Doppler velocity difference from 3- and 35-GHz vertically pointing radars, IEEE T. Geosci. Remote., 54, 6048–6060, https://doi.org/10.1109/TGRS.2016.2580526, 2016.
Yamaji, M., Takahashi, H. G., Kubota, T., Oki, R., Hamada, A., and Takayabu, Y. N.: 4-year climatology of global drop size distribution and seasonal variability observed by spaceborne dual-frequency precipitation radar, J. Meteorol. Soc. Jpn., 98, 755–773, https://doi.org/10.2151/jmsj.2020-038, 2021.
- Abstract
- Introduction
- A Monte Carlo model for temporal and vertical evolution of DSD (MonDrop)
- Temporal and vertical variations of DSD
- A method to estimate Dm from space-borne Doppler radars at Ku-band
- Error analysis
- Application to disdrometer-measured DSDs
- Effects of the variability of DSD
- Summary
- Appendix A: Method by Gillespie (1975) and Seeßelberg et al. (1996)
- Data availability
- Author contributions
- Competing interests
- Disclaimer
- Acknowledgements
- Review statement
- References
- Abstract
- Introduction
- A Monte Carlo model for temporal and vertical evolution of DSD (MonDrop)
- Temporal and vertical variations of DSD
- A method to estimate Dm from space-borne Doppler radars at Ku-band
- Error analysis
- Application to disdrometer-measured DSDs
- Effects of the variability of DSD
- Summary
- Appendix A: Method by Gillespie (1975) and Seeßelberg et al. (1996)
- Data availability
- Author contributions
- Competing interests
- Disclaimer
- Acknowledgements
- Review statement
- References