the Creative Commons Attribution 4.0 License.
the Creative Commons Attribution 4.0 License.
 | 11 Sep 2018
Performance of the FMI cosine error correction method for the Brewer spectral UV measurements
Antti Arola
Julian Gröbner
Sergio Fabian León-Luis
Alberto Redondas
Stelios Kazadzis
Tomi Karppinen
Juha Matti Karhu
Luca Egli
Anu Heikkilä
Tapani Koskela
Antonio Serrano
José Manuel Vilaplana
Non-ideal angular response of a spectroradiometer is a well-known error source of spectral UV measurements and for that reason instrument specific cosine error correction is applied. In this paper, the performance of the cosine error correction method of Brewer spectral UV measurements in use at the Finnish Meteorological Institute (FMI) is studied. Ideally, the correction depends on the actual sky radiation distribution, which can change even during one spectral scan due to rapid changes in cloudiness. The FMI method has been developed to take into account the changes in the ratio of direct to diffuse sky radiation and it derives a correction coefficient for each measured wavelength. Measurements of five Brewers were corrected for the cosine error and the results were compared to the reference travelling spectroradiometer (QASUME). Measurements were performed during the RBCC-E (Regional Brewer Calibration Center – Europe) X Campaign held at El Arenosillo, Huelva (37∘ N, 7∘ W), Spain, in 2015. In addition, results of site audits of FMI's Brewers in Sodankylä (67∘ N, 27∘ E) and Jokioinen (61∘ N, 24∘ E) during 2002–2014 were studied. The results show that the spectral cosine error correction varied between 4 and 14 %. After that the correction was applied to Brewer UV spectra the relative differences between the QASUME and the Brewer diminished even by 10 %. The study confirms that the method, originally developed for measurements at high latitudes, can be used at mid-latitudes as well. The method is applicable to other Brewers as far as the required input parameters, i.e. total ozone, aerosol information, albedo, instrument specific angular response and slit function are available.
- Article
(6030 KB) - Full-text XML
- BibTeX
- EndNote


Brewer spectroradiometers (Brewer), currently manufactured by Kipp and Zonen B.V. and formerly by SCI-TEC Instruments Inc., measure total ozone, spectral UV radiation, aerosol optical depth (AOD) and sulfur dioxide (SO2) in more than 40 countries all over the globe (Bais et al., 1996; Kerr et al., 1985). This work studies the non-ideal angular response of the Brewer UV measurements: a well known and important source of uncertainty.
Irradiance measurements should be proportional to the cosine of the angle θ between the direction of the incident radiation and the normal of the radiometer's diffuser. The deviation from this ideal angular response is called the cosine error.
The cosine error of a Brewer instrument is mainly due to the teflon diffusers' non ideal angular response. The standard Brewers have, as photon entrance, a flat 35 mm-diameter Teflon diffuser which is protected by a weather-proof quartz dome. A flat diffuser is known to deviate from the ideal cosine response because of the increase in reflectance at large solar zenith angles (SZA) (Pulli et al., 2013). The angular response of teflon diffusers progressively gets worse at longer wavelengths. However, in the UV range, at wavelengths shorter than 350 nm this is not significant. A report by Lantz (2010) on the angular characterisation of seven Brewers showed spectral differences less than 1 %. So for this work the cosine error of a Brewer is assumed to be independent of wavelength and it varies between instruments being typically 5–15 % for solar UV irradiance measurements (Antón et al., 2008; Bais et al., 1998, 2005; Feister et al., 1997; Garane et al., 2006; Lakkala et al., 2008). This variability of the cosine error is mainly due to the Teflon diffuser response. Bais et al. (2005) have characterised nine Brewer instruments with the same cosine unit set up and concluded that MKII and MKIV instruments had worse (8.1–12.5 %) cosine error while MKIII instruments' cosine error was measured between 5.4 and 9.7 %. As measured radiation is passing through the Teflon diffuser only when the Brewer is measuring UV irradiances, Brewer's total ozone, AOD and (SO2) measurements are not suffering from the non-ideal cosine response.
The Brewer measures global irradiances at UV wavelengths between 290 and 325 or 290 and 365 nm, depending on the Brewer type. Several methods have been developed to correct for the error due to non-ideal cosine response of the instrument. All of them are based on partitioning global irradiance into direct and diffuse components. The methods mostly differ by the way of determining the ratio of direct to diffuse irradiance during a measurement.
Seckmeyer and Bernhard (1993) introduced a method for cosine error correction of spectral UV irradiances for clear sky and cloudy weather conditions. The direct to diffuse ratio was calculated by a model and diffuse radiation distribution was assumed to be isotropic. All radiation was assumed to be diffuse in the case of cloudy weather.
The challenge is to find the ratio of direct to diffuse radiation under changing cloudiness and when the cloud cover is thin and the contribution from the direct component is significant. One possibility is to use ancillary measurements. Landelius and Josefsson (2000) used sunshine duration or cloud cover information and interpolation between clear and overcast cases for correcting broadband UV measurements. Feister et al. (1997) used broadband UV measurements of diffuse and global radiation to determine the actual optical thickness during a spectral scan.
Bais et al. (1998) established a methodology that uses the Brewer's capability to measure both global and direct irradiances. They modified the Brewer scanning routine to include direct irradiance measurements between global irradiance scans. From these successive measurements the direct to diffuse ratio was retrieved. Antón et al. (2008) used a semi-empirical method to retrieve the effect of actual cloud conditions. The cloud transmittance was calculated using the ratio between the Brewer measurements and cloud-free estimations from an empirical algorithm. The final global cosine error correction was calculated from a lookup table (LUT) generated using a radiative transfer model.
Even if the above mentioned methods exist, the Brewer UV measurement comparison campaign held in El Arenosillo, Spain, in 2015, showed that the irradiances of most Brewers were not corrected for cosine error. The comparison results showed that only 5 out of 18 Brewers were within ±5 % of the reference, and six Brewers had difference more than 10 % (Gröbner, 2015). Most Brewers had significant diurnal variations due to uncorrected temperature dependence and cosine error. The lack of easily applicable cosine error correction algorithm was obvious. This paper studies if the cosine error correction method used at the Finnish Meteorological Institute (FMI) (Lakkala et al., 2008) could be used to respond to this need. The method was applied for five Brewers of the El Arenosillo 2015 comparison campaign. In addition, results from three Brewers during site audits in Finland were studied.
The FMI uses the method presented in Lakkala et al. (2008) in near real time and post processing of spectral UV irradiances measured by the Brewers. The method uses radiative transfer calculations to obtain the direct to diffuse ratio at each measured wavelength. The method was developed to take into account cloud variations during one scan, as the scanning time is long, typically from 4 to 7 min, depending on the measured wavelength range. The method is easily applicable for different Brewers as it does not require modifications to the instrument measuring software, ancillary measurements nor earlier measured data.
2.1 Spectroradiometers
The Brewers have a flat Teflon diffuser, which is covered by a quartz dome. The light is directed from the diffuser towards the spectrometer using prisms. In the spectrometer, gratings are rotated by stepper motors to select the wavelength. A low-noise photomultiplier detector (PMT) is used to measure the photon counts. The most important corrections, which need to be applied after raw data measurements are corrections for dark counts, dead time and stray light, temperature correction and cosine error correction (Bais, 1997; Bernhard and Seckmeyer, 1999).
Generally, the corrections for dark counts and dead time (Fountoulakis et al., 2016) are done using common practices described by the manufacturer (Kipp & Zonen, 2015), while corrections for stray light, temperature dependence and non-ideal angular response are more operator dependent. A usual way to correct for stray light is to consider that all counts which are measured at wavelengths shorter than 292 or 293 nm are stray light, and can be subtracted from the counts measured at other wavelengths (Mäkelä et al., 2016). The temperature dependence of a Brewer is assumed to be linear, and the latest studies have shown that the sensitivity of some instruments changes by up to 5 % when the internal temperature of the Brewer changes between 10 and 50 ∘C (Fountoulakis et al., 2017).
Three different type of Brewers were used in the study. The MK II and IV-type Brewers are single monochromators, while the MK III-type Brewers have a double monochromator, which improves the quality of the measurements at short wavelengths by reducing the error due to stray light (Bais et al., 1996). MK-II Brewers measures from 285 to 325 nm, whereas MK-IV and MK-III extends the range to 363 or 365 nm.
Three Brewers from FMI and four Brewers from Agencia Estatal de Meteorología, Spain (AEMET), the serial numbers and characteristics of which are shown in Table 1 were investigated. The slit functions were very similar until 0.5 nm from the central wavelength (Fig. 1) and the full widths at half maximum (FWHM) varied between 0.5 and 0.68 nm. The differences in the order of several magnitudes outside the central region were due to the difference in stray light rejection by single and double Brewers.
Table 1The Brewers used in the study and their characteristics.
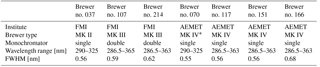
∗ The MK-IV Brewer no. 070 had a mechanical fault which did not allow extended scans.
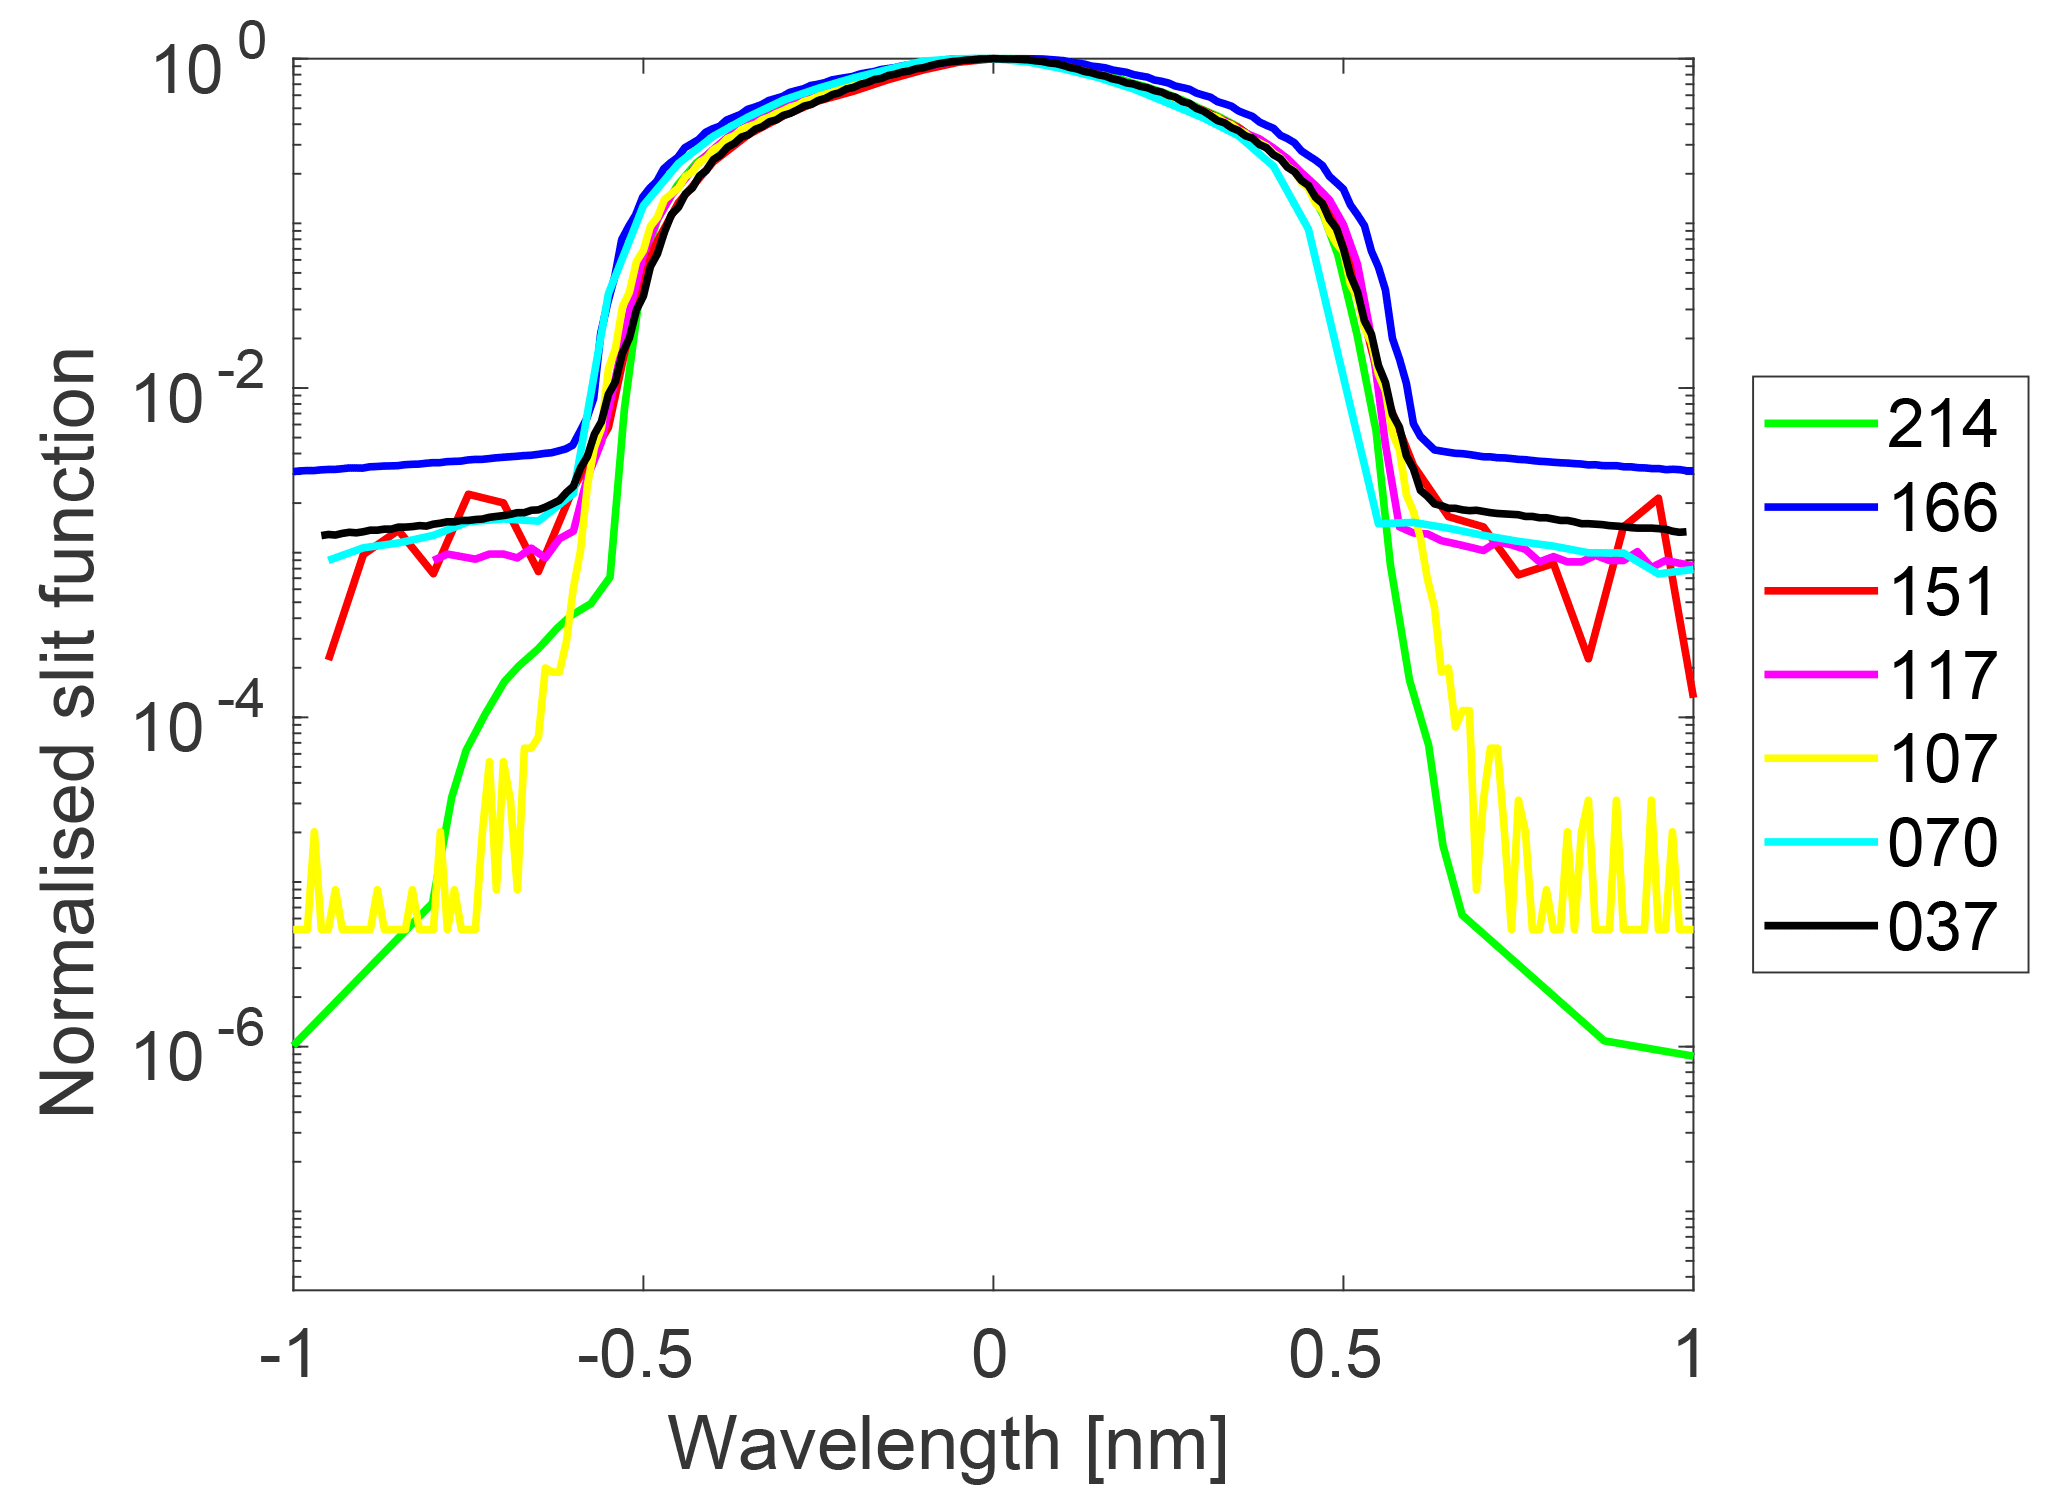
Figure 1Slit functions of Brewers no. 037, 070, 107, 117, 151, 166 and 214. The results are normalised to the maximum and the x axis is wavelength (nm) relative to the peak centre.
The reference spectroradiometer of the study was the portable reference spectroradiometer from the World Calibration Center for UV (WCC-UV) at the Physikalisch Meteorologisches Observatorium Davos, World Radiation Center (PMOD/WRC). This portable reference spectroradiometer is referred as QASUME, which comes from “Quality Assurance of Spectral UV Measurements in Europe”. It is a double monochromator spectroradiometer, the solar UV irradiance measurements of which are traceable to the primary spectral irradiance standard of the Physikalisch Technische Bundesanstalt (PTB), Germany, through transfer standard lamps (Gröbner and Sperfeld, 2005). The global entrance optic of QASUME has a shaped Teflon diffuser with an angular response very close to the desired cosine response. The global irradiance measurements of QASUME are not corrected for the remaining cosine error, resulting in an average uncertainty of 1.2 % in clear sky situations (Hülsen et al., 2016). The expanded relative uncertainty (coverage factor k=2) of solar UV irradiance measurements with QASUME for solar zenith angles smaller than 75∘ is 3.1 % (Hülsen et al., 2016). For measurements from 2002 to 2014 the expanded relative uncertainty was 4.6 % (Gröbner and Sperfeld, 2005).
2.2 Angular responses of the Brewers
For Brewer no. 214, the angular response measurements were performed in the dark room at Sodankylä (Lakkala et al., 2016b), in which the ambient temperature was kept constant at 23 ∘C. The measurements were performed in 2014 during the QASUME site audit, and the standard cosine measurement device of the PMOD-WRC was used. A 250 W halogen lamp was seated in a holder, which could be moved to different zenith angles. Four azimuth angles (north = 0∘, east = 90∘, south = 180∘, west = 270∘) were measured for zenith angles from 0∘ up to 85∘ and back to 0∘, in steps of 5 or 10∘. The angular responses obtained at 310 nm, normalised to the ideal cosine response, are shown in Fig. 2 for the four azimuth angles for Brewer no. 214. The deviation from 1 is the cosine error of the instrument.
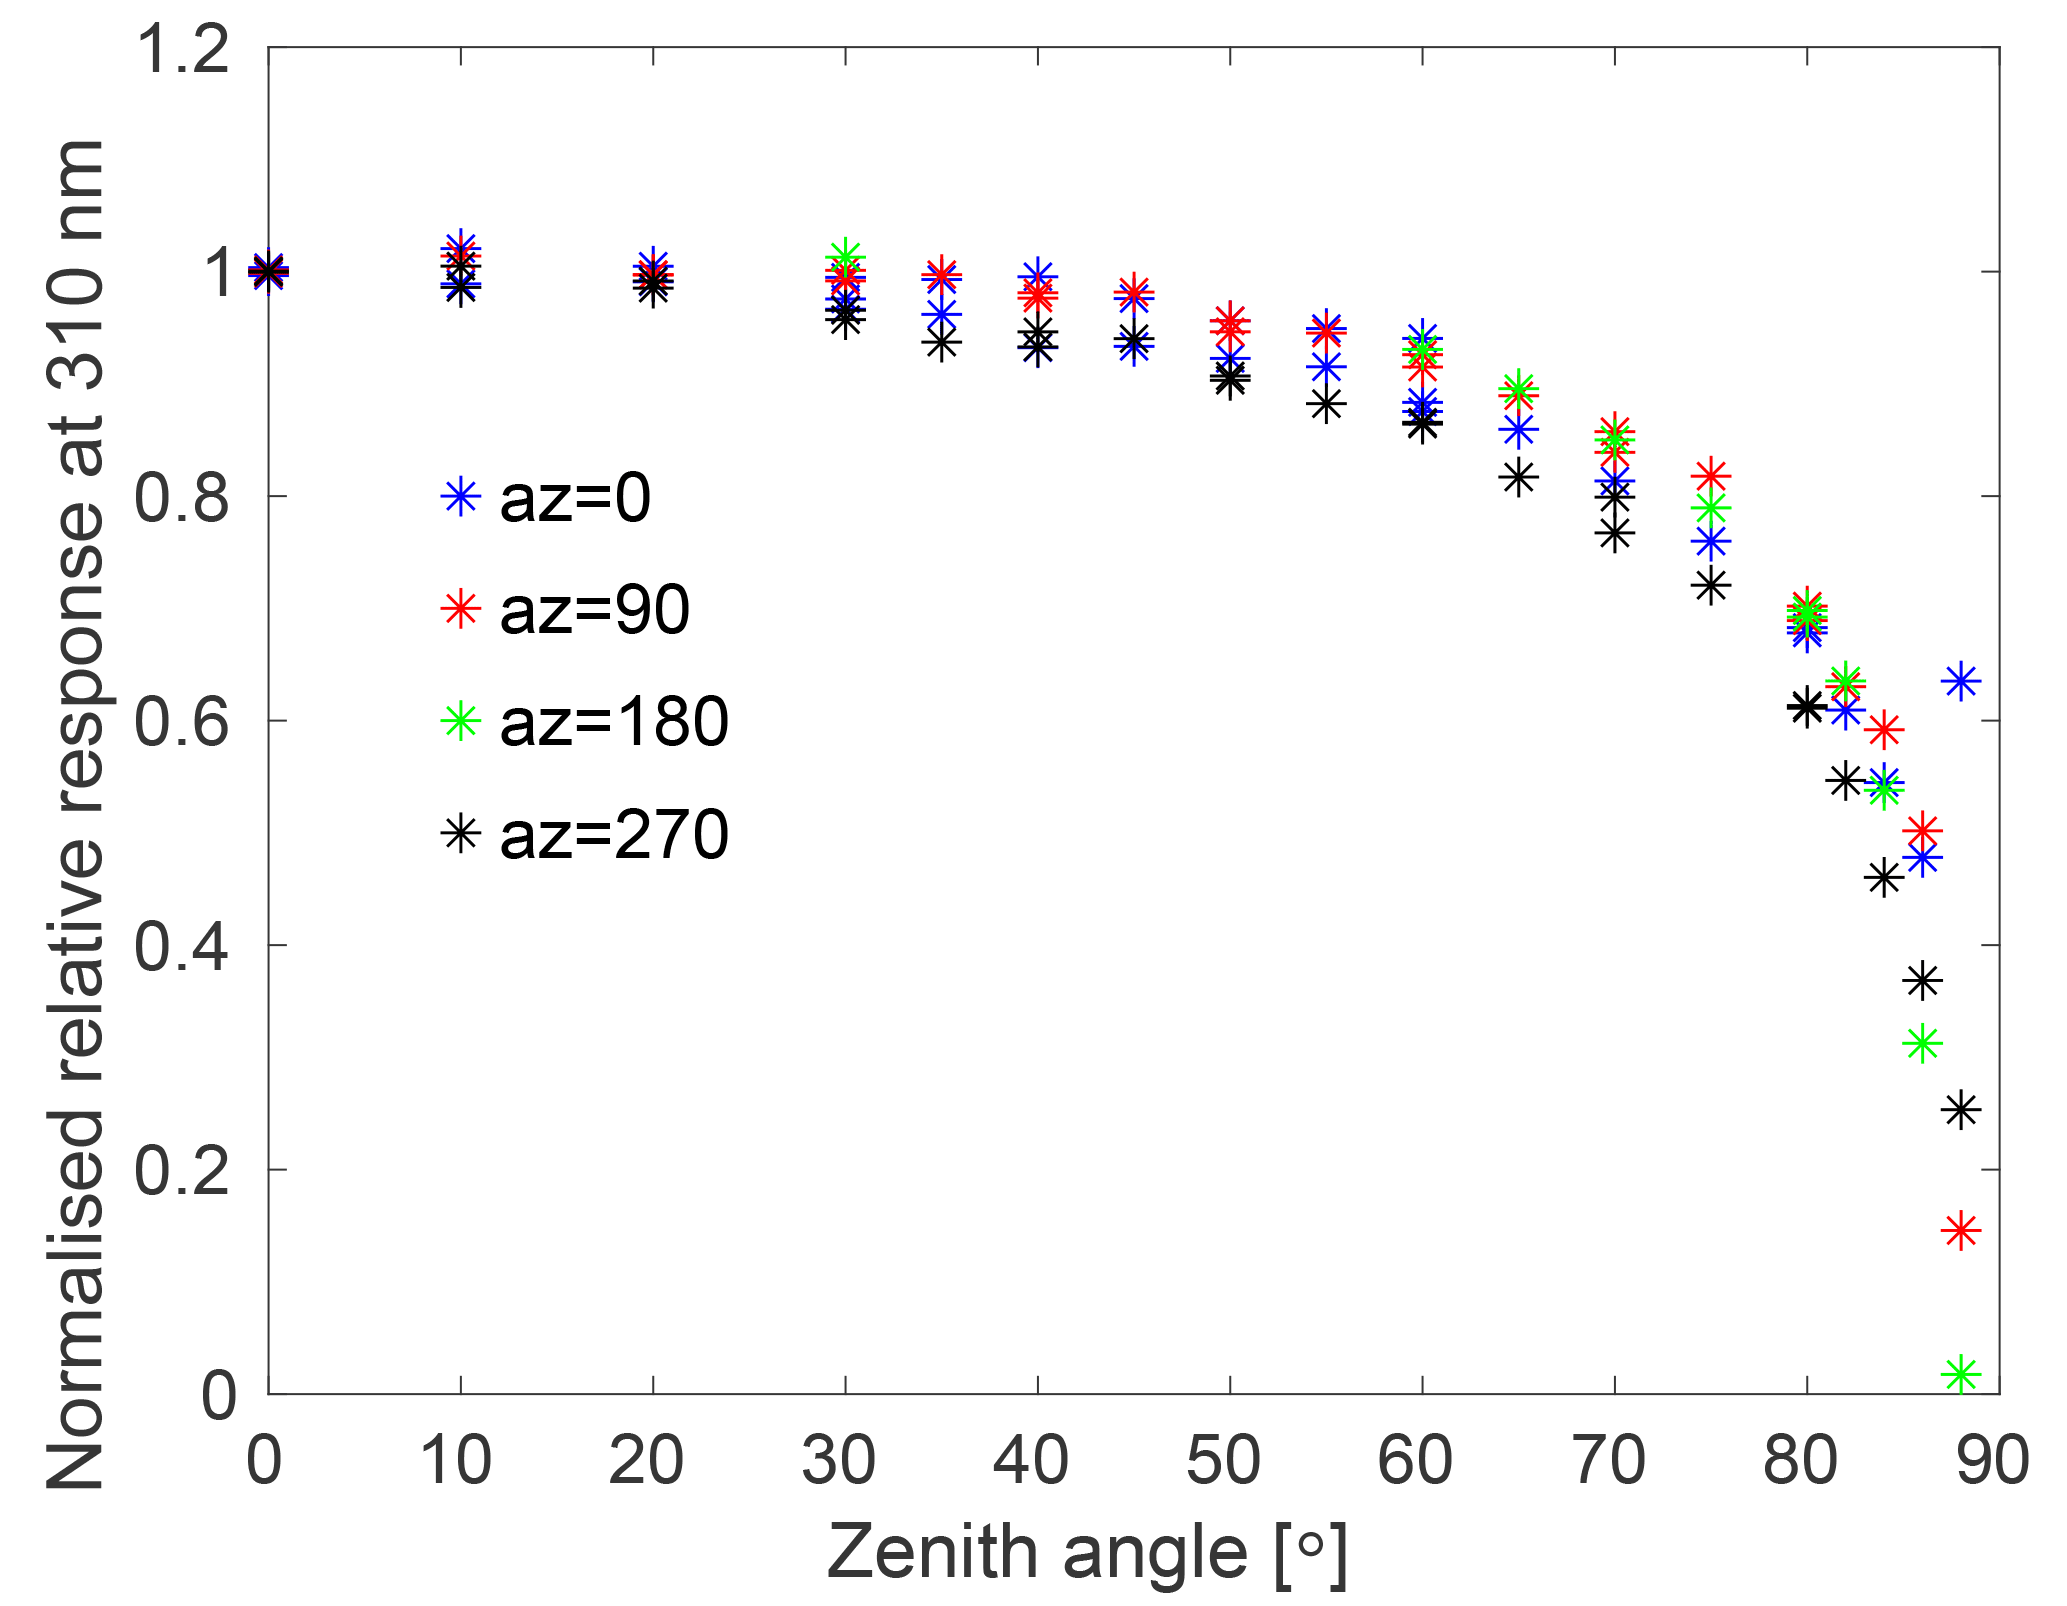
Figure 2The cosine error of Brewer no. 214, FMI, Sodankylä, measured during the QASUME site audit in 2014. Results are normalised to the ideal cosine response.
The angular response of Brewer no. 037 was measured in the old laboratory of the FMI Arctic Research Centre in Sodankylä in 2000. There were same instrumentations in the laboratory than in Lakkala et al. (2016b), but the laboratory was located in a different building. A 1 kW DXW lamp was used, and similarly to the characterisation of Brewer no. 214, the four azimuth angles were measured and the lamp holder was moved in steps of 5 or 10∘. The angular response of Brewer no. 107 was measured in the laboratory of the Swedish Meteorological Hydrological Institute in 1996 following similar measurement procedures.
The angular responses of the AEMET's Brewers were measured during the first Regional Brewer Calibration Center – Europe (RBCC-E) Campaign in Huelva in 2005 with a portable device developed within the European Commission funded project QASUME. A detailed uncertainty analysis of the laboratory measurements using the angular response measurement device is presented in Bais et al. (2005).
For the cosine error correction algorithm, the mean of the four azimuth angles at one measured wavelength was calculated and used as the angular response of the instrument (Fig. 3). From Fig. 3b it can be seen that the cosine error of most Brewers exceeded 10 % at angles higher than 60–70∘. The angular response of the Brewer no. 117 differed from the others at 85∘, which was due to relatively increased inhomogeneity among the measurements over the four planes, for such high measurement angles. However, laboratory measurements at such angles become more uncertain due to the low measurement signals (Bais et al., 2005).

Figure 3(a) Angular responses and (b) angular responses normalised to the ideal cosine response (cosine error) of Brewers no. 037, no. 070, no. 107, no. 117, no. 151, no. 166 and no. 214 at 310 nm.
2.3 Cosine error correction method
To correct the measured irradiances it is essential to know the correction factor for the angular response of a spectroradiometer for a particular global irradiance measurement (cglob). This correction factor depends on the distribution of sky radiance and is a function of solar zenith angle (θ), azimuth angle (ϕ) and wavelength (λ).
If F denotes the actual and F′ the measured irradiance
where the subscript glob corresponds to global irradiance. Both F and F′ are functions of θ, ϕ and λ; however, for the sake of clarity in the equations below, we omit the dependence on θ, ϕ and λ. As global irradiance includes direct (dir) and diffuse (diff) components, Eq. (1) can be rewritten as
By dividing the numerator and denominator of Eq. (2) with Fdiff, and rearranging the terms by including Fdir in the first addend of the denominator, Eq. (2) becomes
From Eq. (3) it can be seen that in order to calculate the cosine error correction factor three components are needed:
-
, the ratio between measured and actual direct irradiance, i.e. angular response of the spectroradiometer,
-
, the ratio between measured and actual diffuse irradiance, i.e. cosine response of the diffuse component, and
-
Fdir∕Fdiff, the ratio between actual direct and diffuse irradiance.
From the definition of the cosine error we get, that the ratio between the measured and actual direct irradiance is the ratio of the angular response of the diffuser (C(θ,λ)) and the cosine of the solar zenith angle (θ),
The ratio between the measured and actual diffuse radiation is
where the integration is performed for the upper hemisphere. As the exact distribution of sky radiance is not known during the measurements, isotropic diffuse radiation is assumed and becomes a function of wavelength L(λ). Then, Eq. (5) can be simplified to
As
the Eq. (6) becomes
Using the definition of the solid angle, dΩ=sinθdθdϕ, the Eq. (8) can be written as
As C(θ,λ) is assumed to be independent of azimuth angle, Eq. (9) is simplified to
The only unknown component in Eq. (3) is the ratio between actual direct and diffuse irradiance, Fdir∕Fdiff. It is calculated by using a radiative transfer model and lookup tables. The libRadtran package and UVspec disort version 1.4 (http://www.libradtran.org, last access: 20 August 2018) (Mayer and Kylling, 2005) was used. The steps to retrieve the Fdir∕Fdiff ratio are the following: (1) the measured spectral irradiances are corrected using the assumption that all radiation is diffuse, i.e. integrating Eq. (10) over all SZAs. (2) The corrected irradiances are used to find the corresponding cloud optical depth from a lookup table. A six-dimensional lookup table was precalculated assuming that UV irradiance can be expressed as a function of wavelength, solar zenith angle, cloud optical depth, ozone absorption, aerosols and albedo. As all other parameters are known, the cloud optical depth τcloud(λ), can be found as a function of wavelength from the table. The calculation of the lookup tables is explained in more details in Sect. 2.3.1. Once τcloud(λ) is found, (3) the radiative transfer model is used to derive the direct-to-diffuse ratio as a function of wavelength.
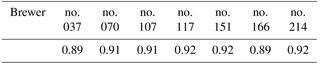
When Fdir∕Fdiff is obtained and the angular response of the diffuser, C(sza,λ) is known, Eq. (3) can be used to calculate the cosine error correction factor for each wavelength. The ratio was calculated using Eq. (10) and it is shown for the studied Brewers in Table 2.
Table 2The ratios for Brewers no. 037, no. 070, no. 107, no. 117, no. 151, no. 166 and no. 214.
2.3.1 Lookup tables
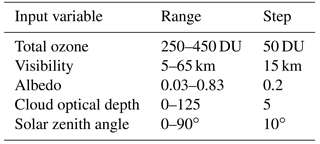
Lookup tables were generated for each wavelength using the uvspec tool of libRadtran. As first step, global irradiances were calculated using cloud optical depth, visibility, effective albedo, total ozone and SZA as inputs. The ranges and steps of the input parameters are shown in Table 3. Visibility was used to give information of aerosols, as aerosols were not directly measured at the measurement sites in the past. The instrument specific slit functions were used for Brewers no. 037, no. 107 and no. 214. For the other Brewers, the slit function of the Brewer no. 117 was used, as slit functions of Brewers are close to similar (Fig. 1, Table 1). The ATLAS3 (Woods et al., 1996) was used as extraterrestrial solar spectrum, and the radiative transfer equation was solved using the version 2.0 of the standard plane–parallel disort algorithm (Stamnes et al., 2000) with six streams. The atmospheric profile was chosen to be the U.S. Standard 1976 (Anderson et al., 1986). For the Brewers of FMI, rural types of aerosols were selected, as the lookup tables were originally generated to correspond to the conditions at home sites in Finland. For the other Brewers, the lookup tables were generated specifically for measurements in Huelva, the maritime type aerosols were used.
As a second step, the irradiance F used in the retrieval was calculated as follows:
The result was saved in a 6 dimensional lookup table of the wavelength λ, which had elements, containing the information of the corresponding cloud optical depth (26 inputs), visibility (5 inputs), albedo (5 inputs), total ozone (5 inputs) and SZA (10 inputs) (Table 3).
For retrieving the cloud optical depth corresponding to the particular global irradiance measurement, the following steps are needed: (1) the whole measured spectrum is multiplied by the first guess cosine error correction coefficient, which is the cosine error correction coefficient assuming all radiation to be diffuse, Eq. (10). (2) The irradiance at wavelength λ is smoothed like in Eq. (11). (3) The other parameters of the lookup tables (visibility, albedo, total ozone and SZA), corresponding to the measurement conditions, need to be known. (4) Lagrange interpolation is used to find the corresponding cloud optical depth from the lookup table for the known irradiance, total ozone, visibility, albedo and SZA.
2.4 Comparison campaign in Huelva
Data from the Brewer comparison campaign held in Huelva (37.10∘ N, 6.73∘ W), Spain, from 26 May to 4 June 2015, were used. Measurement were performed on the roof of El Arenosillo Atmospheric Sounding Station of the Instituto Nacional de Tecnica Aeroespacial (INTA), which altitude is 50 m above sea level. The near surroundings is characterised by pine forest. The roof was above the top of the trees. The sea side of the Atlantic Ocean was at 1 km from the station in the South. The horizon of the measurement site was free to SZA 85∘.
During the campaign, comparisons of spectral global solar irradiance measurements were done between the 21 spectrophotometers participating in the 10th Regional Brewer Calibration Center – Europe (RBCC-E) campaign and the travelling reference spectroradiometer QASUME. The UV comparison days were 2–4 June. Synchronous UV measurements were performed from sun rise to sun set every 30 min. The start of the UV scans were simultaneous and the measurement wavelength and time step were 0.5 nm and 3 s. With this set up all instruments were measuring the irradiance of the same wavelength at the same time, avoiding differences linked with rapid changes of the radiation field during one scan. During the campaign, the operators of the instruments submitted the data, which were processed using their own calibration and UV processing algorithms. These algorithms differed, for example, by how the temperature dependence or angular dependence was taken into account. For most Brewers, no temperature or cosine error correction was performed. In addition to irradiances submitted by the operators, the spectral UV irradiances were calculated using the standard UV processing (Lakkala et al., 2016a; León-Luis et al., 2016) of the COST Action 1207, EUBREWNET (Rimmer et al., 2017) and a calibration performed with a common lamp during the campaign (Gröbner, 2015).
In this work, the UV irradiances measured by five Brewers were calculated using the routine UV processing algorithm of FMI (Lakkala et al., 2008; Mäkelä et al., 2016). The cosine error correction was applied, but the temperature correction was not applied in order not to mix the effects of different corrections. The used inputs were the raw UV files, calibrations, slit functions and angular response measurements submitted by the operators. For the cosine correction, the total ozone measured by the Brewer was used, the visibility was observed by the operators and the albedo was set to 0.03. Measurements between 06:00 and 19:00 UTC, SZAs smaller than 90∘, were analysed using the matSHIC algorithm developed within the EMRP project SolarUV (http://projects.pmodwrc.ch/env03/, last access: 20 August 2018). The program is open source, based on the study performed by Slaper et al. (1995), and can be obtained on request. The wavelength scale of the solar spectra are adjusted to the high resolution solar spectrum KittPeak (Kurucz et al., 1984) and convolved to a nominal triangular slit function with a full width at half maximum of 1 nm. Thus, the process allows comparing solar spectra measured with instruments having different slit functions. The irradiance measurements of the five studied Brewers were compared with the irradiances measured by the QASUME. The mean differences from QASUME, and 5th and 95th percentiles were calculated. For each Brewer, the mean difference was calculated separately for datasets including irradiances measured when the SZAs were (1) less than 50∘ and (2) less than 90∘. The percentiles were calculated for the dataset including all spectra.
2.5 UV comparisons during site audits in Finland
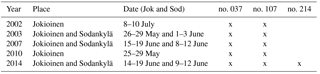
The QASUME visited the FMI's measurement sites at Jokioinen (60.82∘ N, 23.50∘ E) and Sodankylä (67.37∘ N, 26.63∘ E), five and three times, respectively (Table 4). At Sodankylä, Brewers no. 037 and no. 214 were compared, and at Jokioinen the Brewer no. 107, except in 2002 and 2010, when Brewer no. 037 travelled to Jokioinen for the comparison. During these visits, synchronous UV measurements were performed every 30 min from sun rise to sun set, with 0.5 nm wavelength steps and 3 s wavelength increment (Gröbner et al., 2005). The Brewer spectral data were submitted using the calibration from the site and compared to the QASUME instrument using the same data protocol as for the comparison campaign in Huelva. The FMI's Brewer measurements were processed using the routine UV processing of FMI and were temperature and cosine corrected (Lakkala et al., 2008; Mäkelä et al., 2016). For the cosine correction the total ozone measured by the Brewer was used, the visibility was observed by the operators and the albedo was set to 0.03.
Table 4QASUME site audits of the Brewers of FMI. Date (Jok and Sod) signifies dates at Jokioinen and Sodankylä.
At Sodankylä, the measurements were performed on the roof of the sounding station at the Arctic Research Centre at an altitude of 179 m above sea level. The neighbouring area is boreal sparse pine forest. In the east, there are large swamp areas, and in the west the small river Kitinen. In summer, during which the comparisons were performed, the sun hardly reaches the horizon at midnight and the smallest SZA is around 45∘.
At Jokioinen, the measurements were performed on the roof of the sounding station of the Jokioinen Observatory at an altitude of 107 m above sea level. The station is surrounded by fields and coniferous forests. During midsummer, the smallest SZA is around 40∘.
The cosine error corrected Brewer irradiances were compared with the irradiance measured simultaneously by the QASUME unit during the comparison campaign in Huelva in 2015 and during the UV comparisons of the site audits in Finland. The atmospheric path of radiation is different in Southern Europe (Huelva, Spain) from that in Northern Europe (Finland), which makes the radiation field differ and thus affects the relationship between direct and diffuse radiation. Total ozone values are typically different as well as cloud and aerosol conditions in both sites. In Finland there are typically higher total ozone amounts, a cleaner atmosphere and more variability in cloudiness conditions than in the south of Spain. Thus, having measurements from both middle and high latitude conditions allows the evaluation of the performance of the method under different atmospheric conditions.
3.1 Comparison in Huelva
3.1.1 Diurnal variation of the cosine error correction factor
The cosine error correction factors were calculated for each UV spectrum measured during the comparison campaign in Huelva. As there was mostly clear sky during the measurement campaign, the diurnal change of the cosine error correction factor followed the diurnal change in the ratio of the diffuse and direct radiation under clear sky. This means that at SZAs close to 90∘ the cosine error correction coefficient was calculated assuming all radiation was diffuse, and the correction factor was equal to (from Eq. 3 when Fdir=0). At SZAs smaller than about 60–65∘, the contribution of the direct component increases and the cosine correction factor becomes smaller than the diffuse correction factor. The cosine error correction factors at 308 nm are shown in Fig. 4 as a function of time for the five Brewers included in the study. The day was cloudless, the daily mean total ozone was 350 DU and the atmosphere had low aerosol concentrations with visibility higher than 30 km.
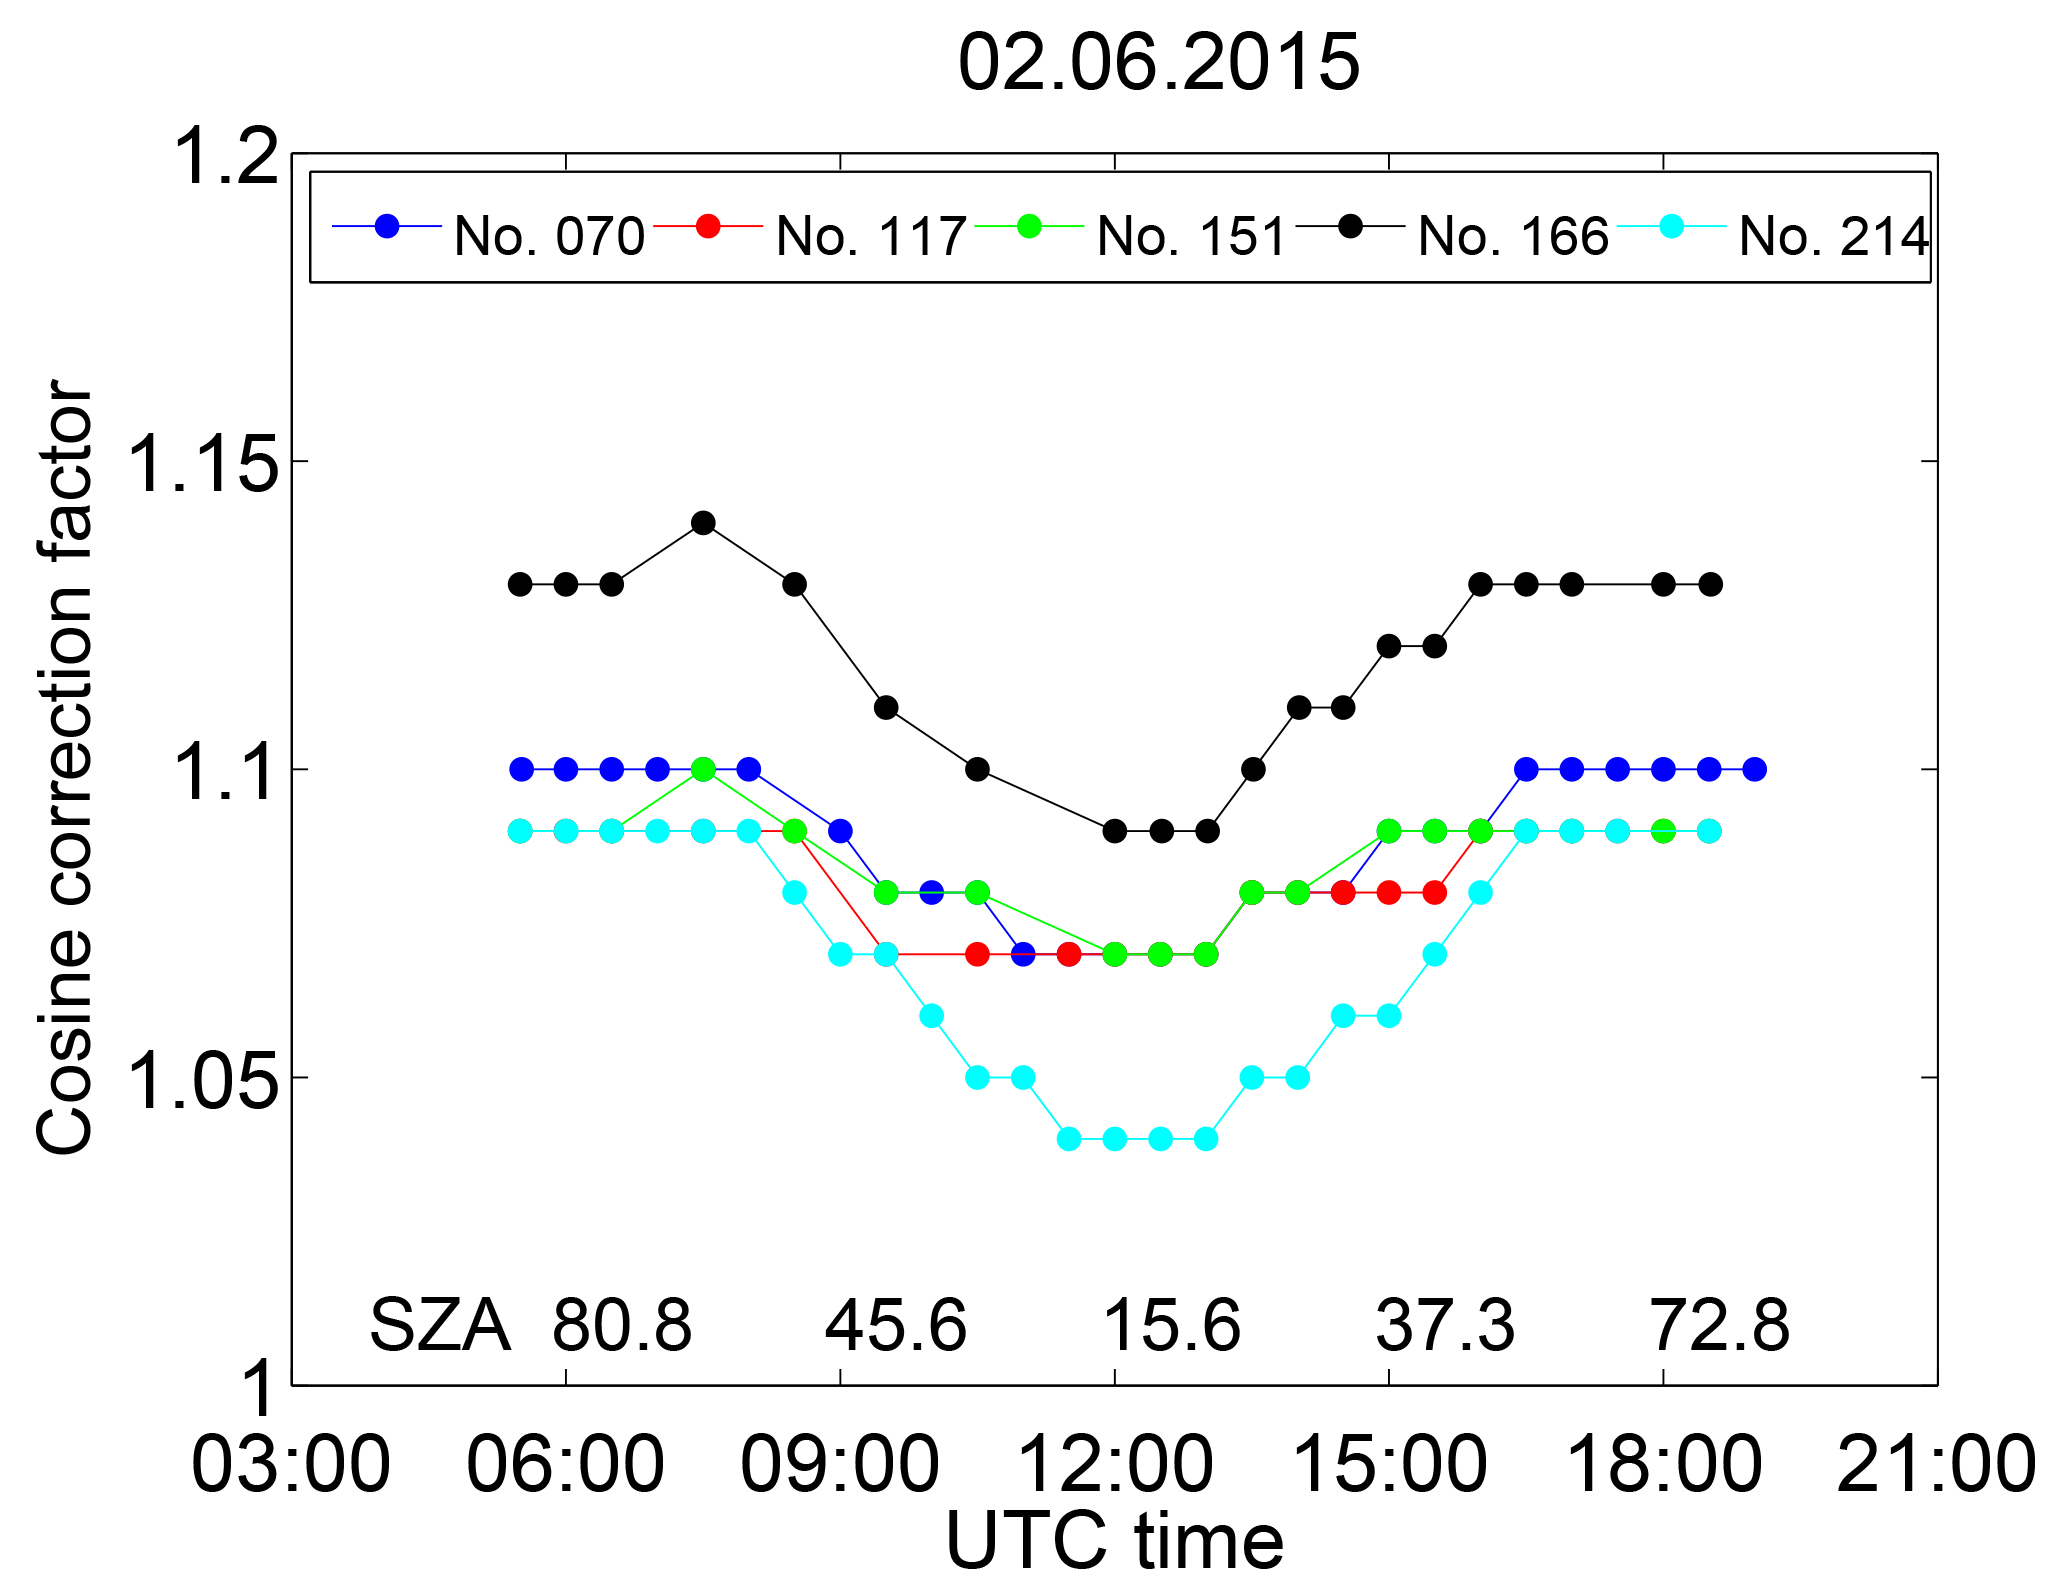
Figure 4Diurnal variation of the cosine error correction factor of Brewers no. 070, no. 117, no. 151, no. 166 and no. 214 at 308 nm on 2 June 2015. The x axis is time (UTC), but SZAs are shown for 06:00, 09:00, 12:00, 15:00 and 18:00 UTC.
The largest diurnal change of the cosine error correction factor was 5 % and found for Brewers no. 166 and no. 214. The smallest correction factors of these two Brewers were 1.09 and 1.04, respectively, at midday. For Brewer no. 166, the largest correction factor of 1.14 was at SZA 63.5∘ at 07:30 UTC. The cosine correction factor peaks at this SZA because of the large cosine error of 20 % and the relative large contribution of the direct component to the global irradiance at this SZA.
3.1.2 Spectral variation of the cosine error correction factor
The cosine error correction factor was calculated for each wavelength separately, i.e. for each wavelength the direct to diffuse ratio was calculated. It allowed the method to capture sudden changes in cloudiness during the measurement. In Huelva, the sky was free from clouds, so that there were no clear changes in the cosine error correction coefficient during a scan. As an example, the spectral cosine error correction factors of the studied Brewers are shown in Fig. 5 for 12:00 and 16:00 UTC on 2 June. The SZAs were 15.7 and 48.7 at 12:00 and 16:00 UTC, respectively. As the sky was free from clouds, the impact of the direct component was more important at midday, and for all Brewers the cosine error correction factor was then at its lowest value. The small scale wavelength to wavelength changes, which can especially be seen at midday, are due to the method in which the direct to diffuse radiation is calculated for each wavelength separately. As here there was clear sky, the cosine error correction factor should vary smoothly with wavelength. The small scale features seen in the plot, are signs that the measurements and model differed from each other so that the retrieved cloud optical depths erroneously corresponded to that of thin cloud conditions. A possible reason for this is the different spectral resolution of the measured spectrum and the extraterrestrial spectrum used in the model run together with imperfect slit functions used in the convolution. Another reason is random spectral features in the measured spectra. For example, for the Brewer no. 214, the errors of 2–3 % at around 360 nm were not due to the cosine error correction, but due to problems in wavelength setting at those wavelengths.
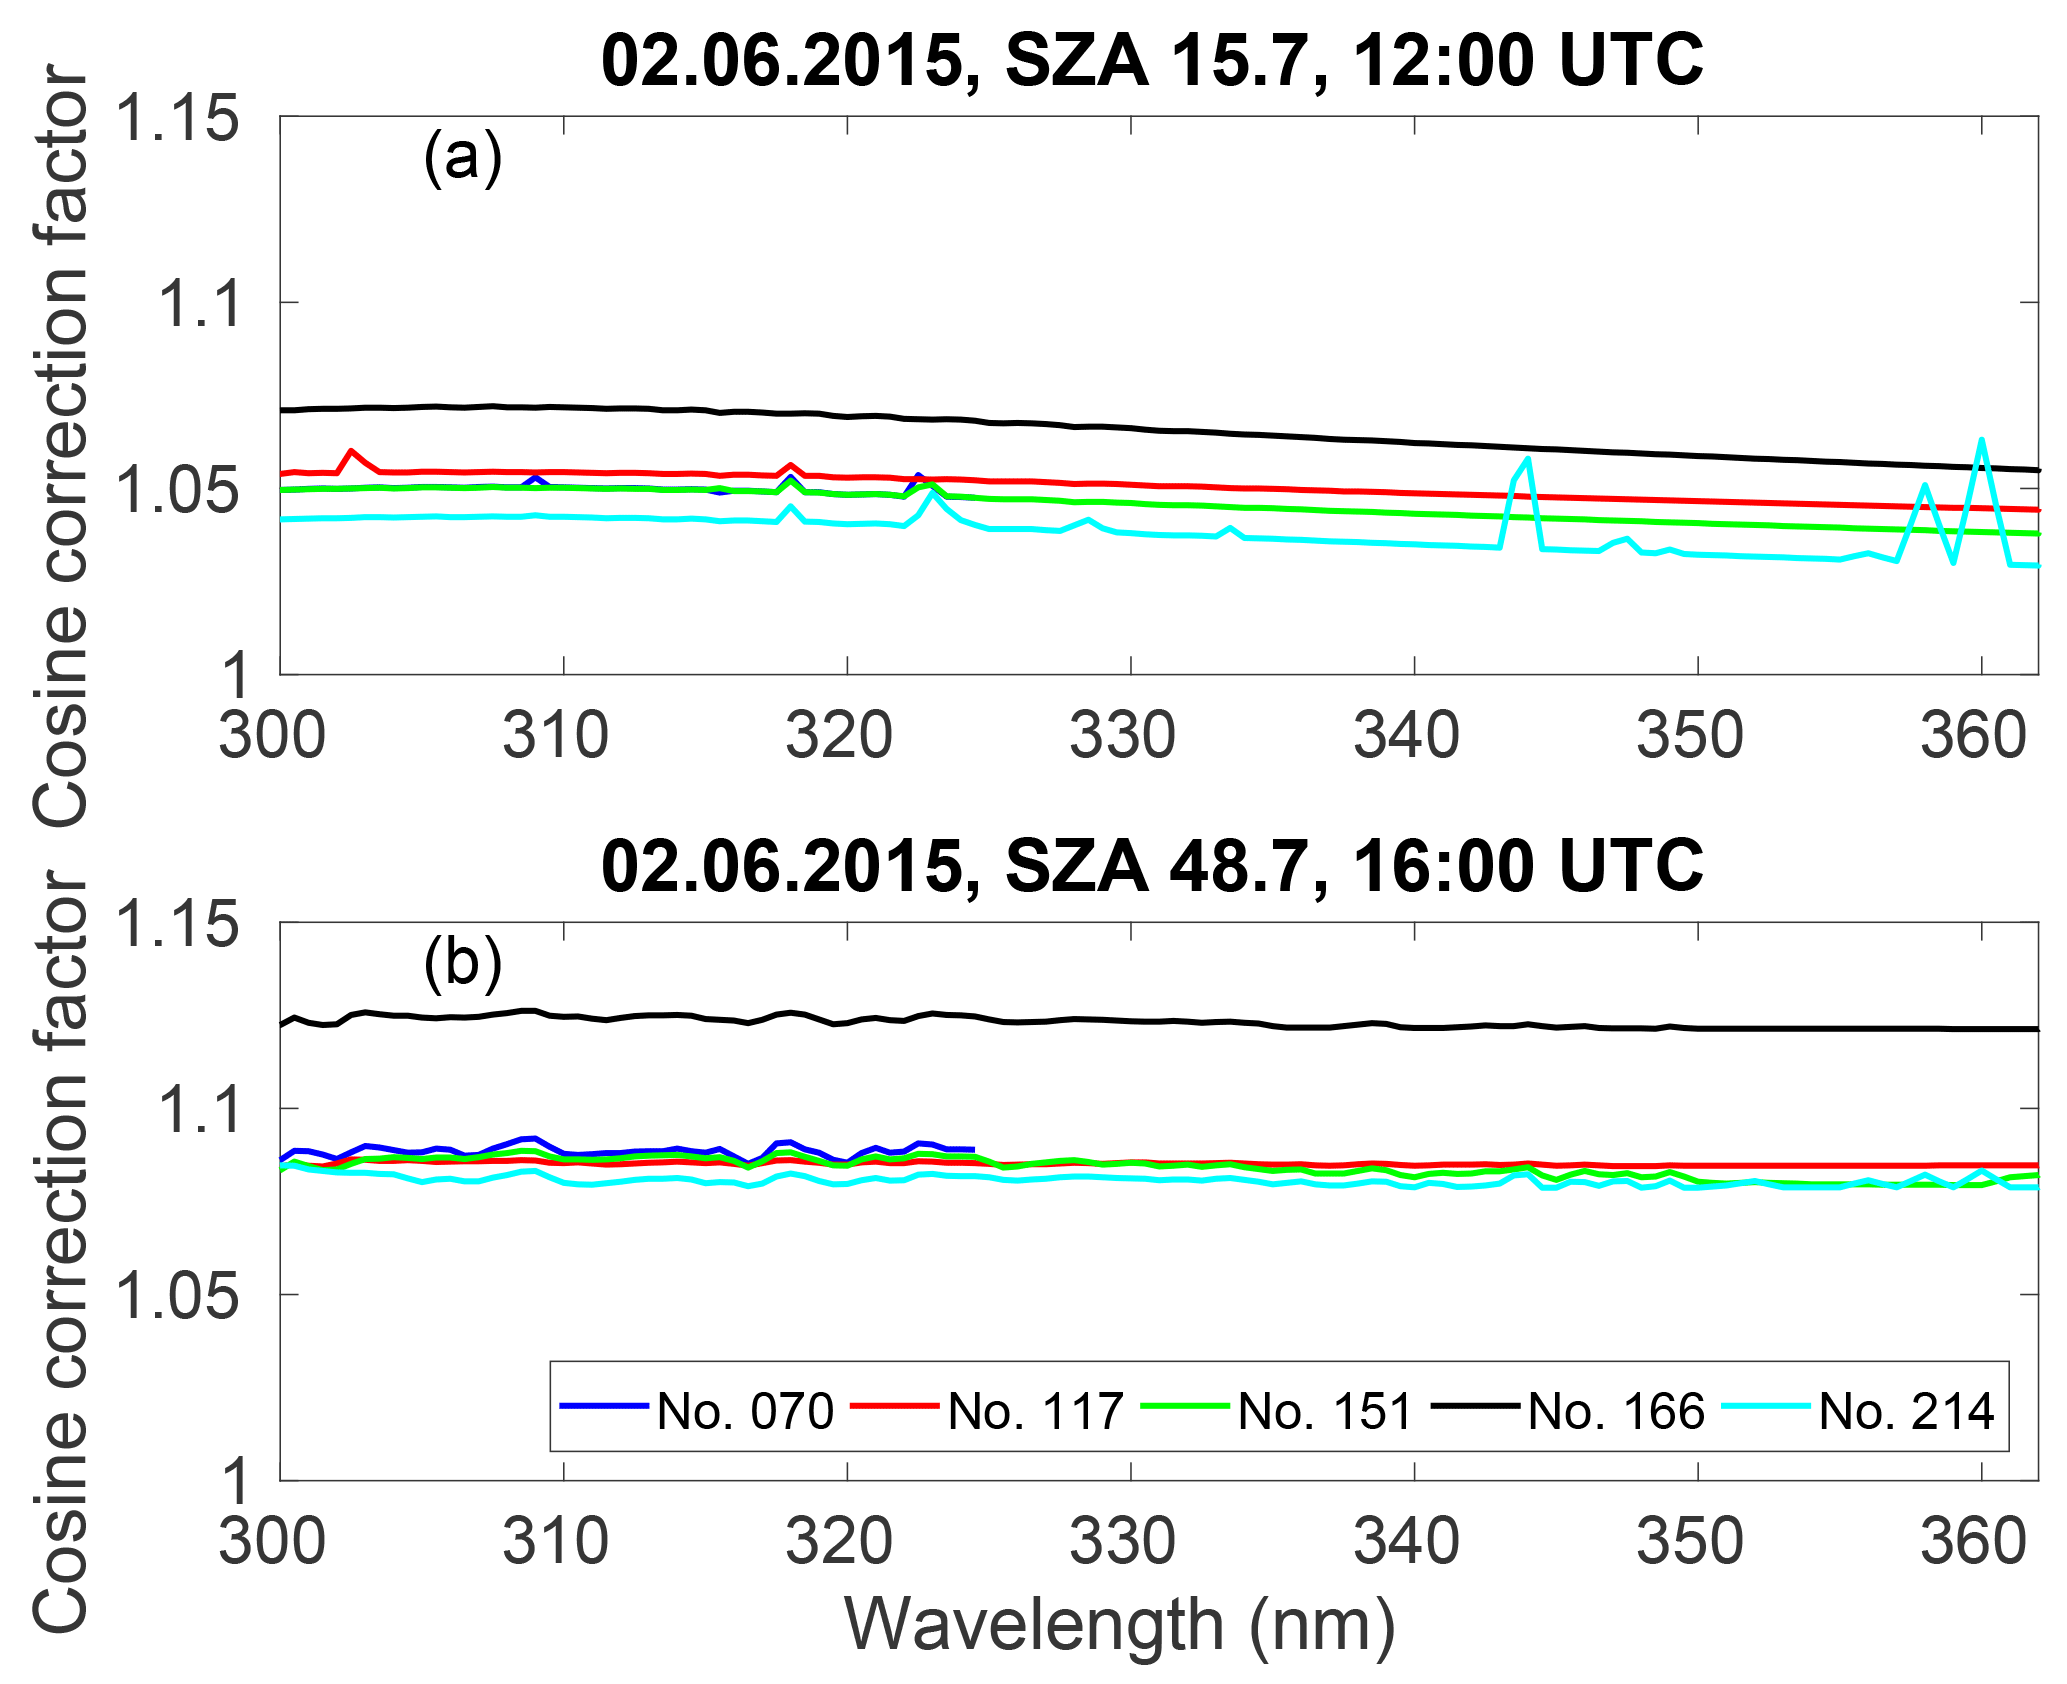
Figure 5Spectral variation of the cosine error correction factor of Brewers no. 070, no. 117, no. 151, no. 166 and no. 214 during one UV scan at (a) 12:00 UTC (SZA 16∘) and (b) 16:00 UTC (SZA 49∘) on 2 June 2015.
3.1.3 Comparison against the QASUME
During the Huelva 2015 campaign, Brewer UV irradiances were compared to the irradiances measured with the QASUME. Without cosine correction, measurements of Brewer no. 214 were on average 5–9 % lower than those of QASUME depending on the wavelength and SZA (Fig. 6a). After implementing the cosine error correction, the mean differences were ±3 % depending on the wavelength (Fig. 6b). Without cosine error correction, the other Brewers underestimated spectral irradiances by 5 to 10 % (Gröbner, 2015). Cosine error corrected data agreed to within −3–5 % with measurements by QASUME (Fig. 7a–d). In the Figs. 6a–7d, the spectral ratio at the longest wavelengths is biased low/high due to the applied convolution algorithm and thus does not represent the instrument behaviour.
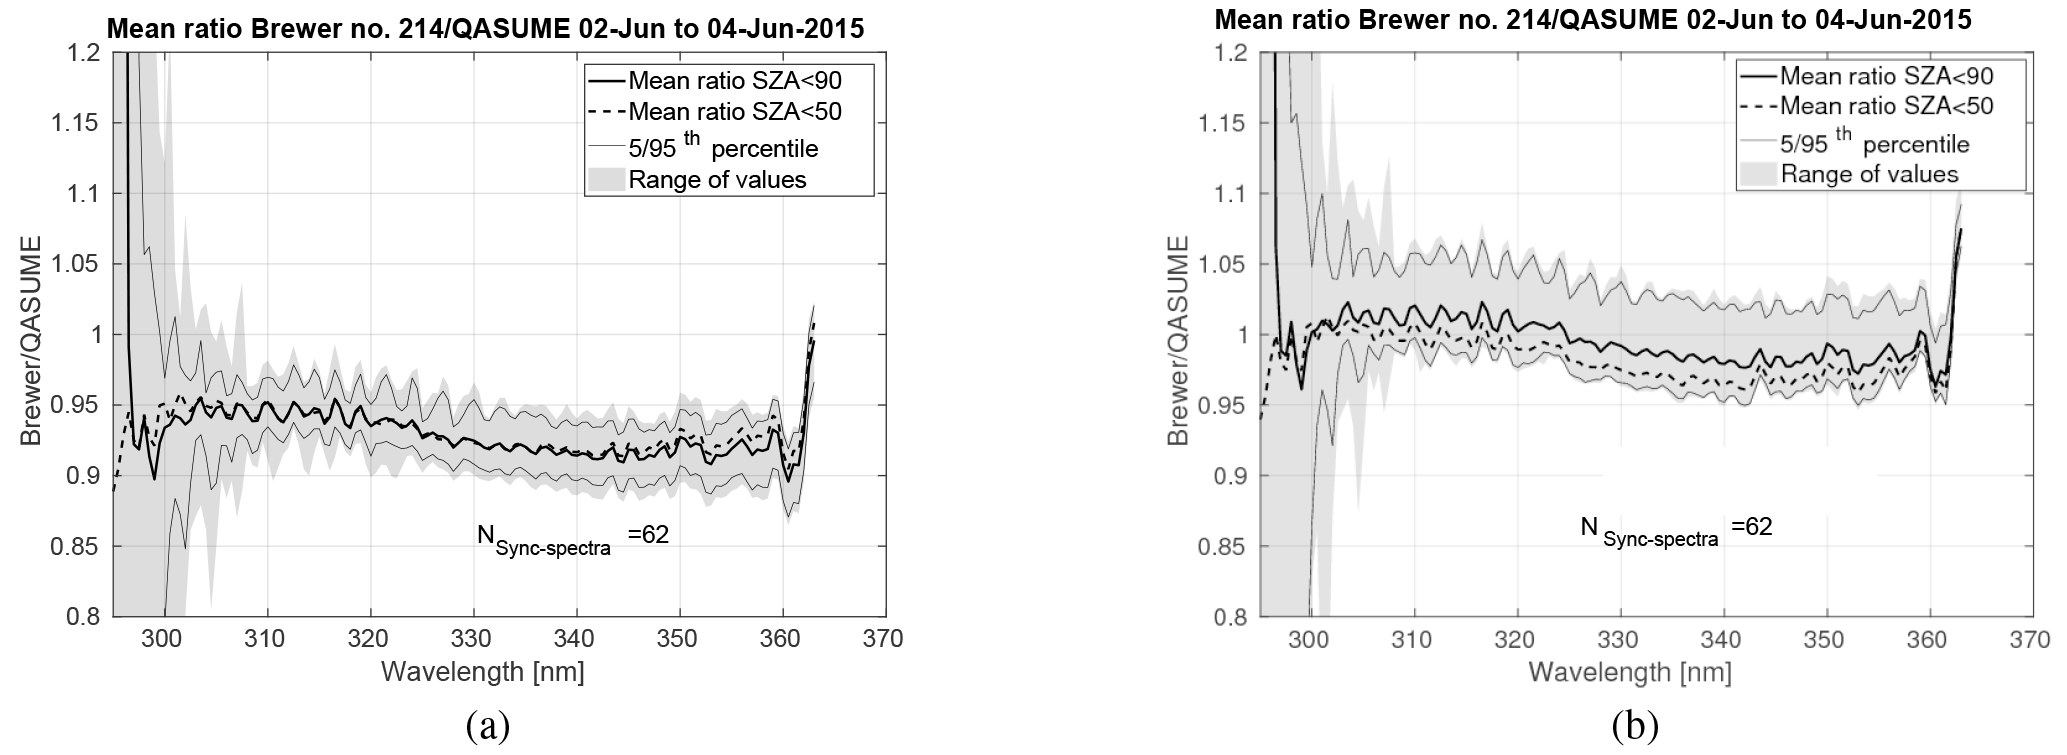
Figure 6Mean ratio and range of measurements between Brewer no. 214 and QASUME irradiances for measurements done at SZA < 90∘ and SZA < 50∘ in the comparison campaign in Huelva during 2–4 June 2015. The 5th and 95th percentile and the range of the values, and the number of QASUME synchronised spectra (N_sync_spectra) are shown. (a) No cosine error correction was applied to the data. (b) The data was cosine error corrected.
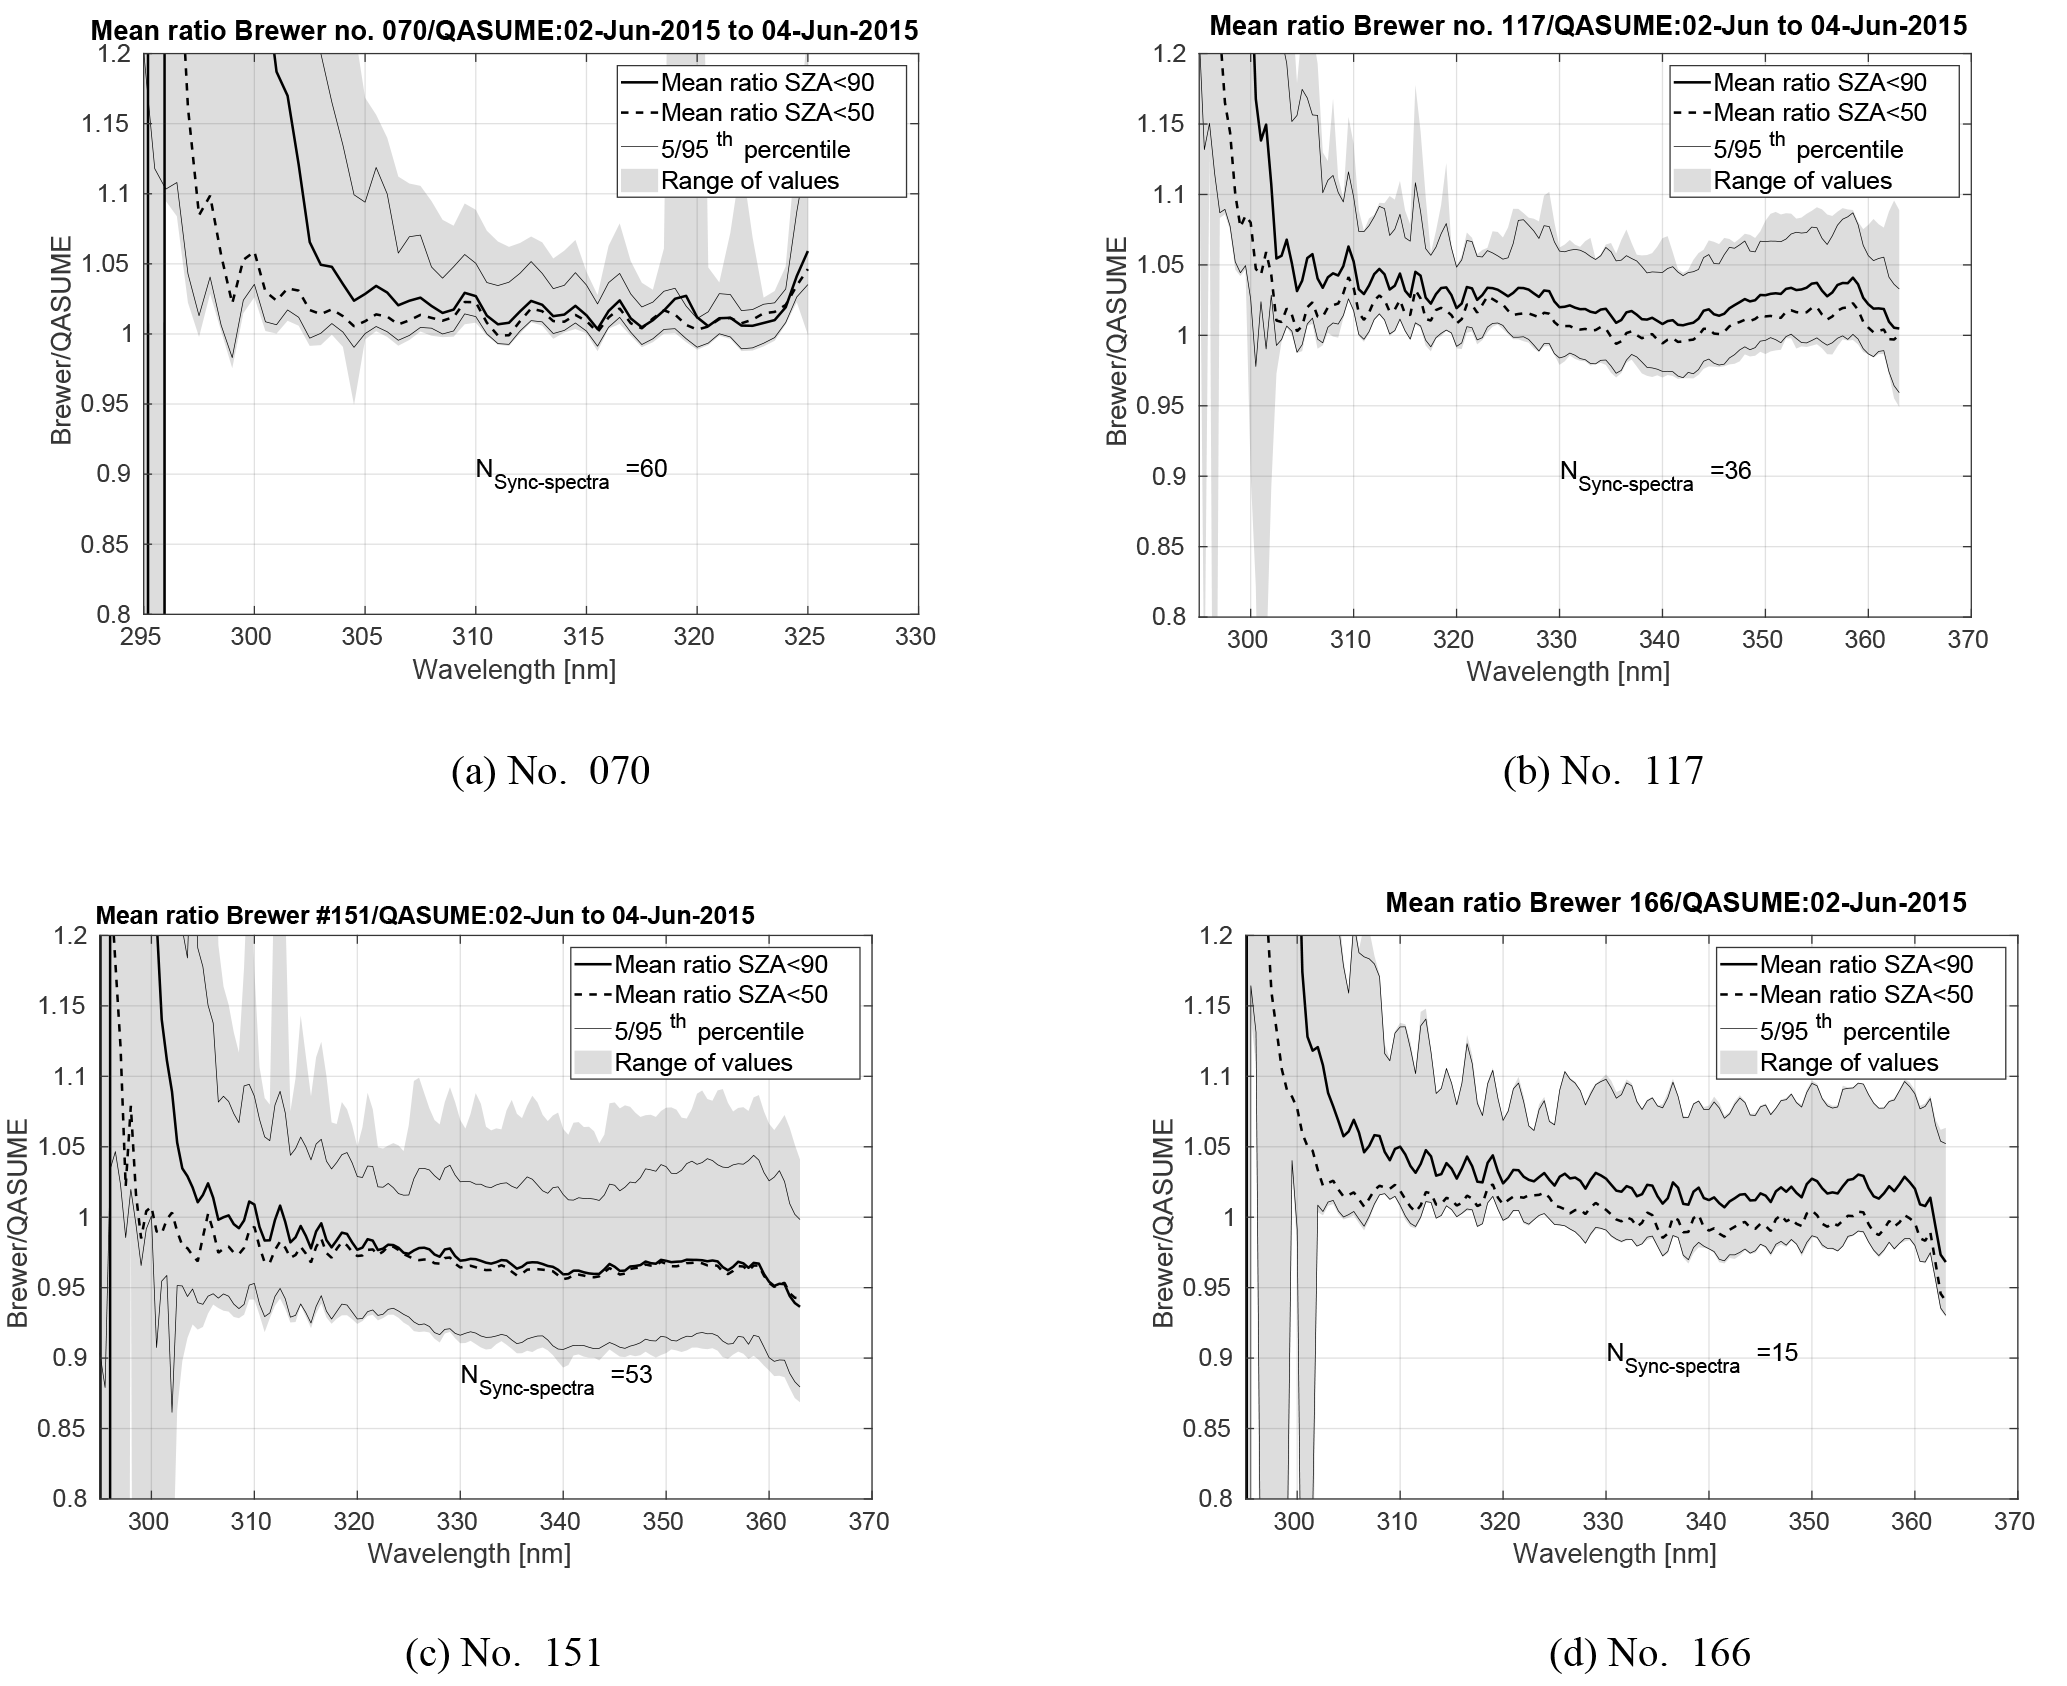
Figure 7Mean ratio and range of measurements between Brewers (a) no. 070, (b) no. 117, (c) no. 151 and (d) no. 166 and QASUME irradiances for measurements done at SZA < 90∘ and SZA < 50∘ in the comparison campaign in Huelva during 2–4 June 2015. The 5th and 95th percentile and the range of the values, and the number of QASUME synchronised spectra (N_sync_spectra) are shown. The data was cosine error corrected.
In Fig. 8a–d the results of the comparison at specific wavelengths of 305, 310, 315, 320, 330, 345 and 358 nm, are shown as function of time for MKIV Brewer no. 070 and MKIII Brewer no. 214. All 3 comparison days were cloudless. Results are shown for cosine error corrected and not cosine error corrected data. The impact of the stray light at high SZA is clearly seen at 305 nm in the results of Brewer no. 070.
The cosine error correction highly improved the results of all studied Brewers, even if some differences between the Brewers and the QASUME still remained. In addition to the effect of stray light, also diurnal dependences were seen (e.g. in Fig. 8a–d). One reason is that the Brewer UV measurements have a temperature dependence, and measurements were not corrected for it. As the campaign days were sunny days, during which the inner temperatures of the Brewers ranged between 25 ∘C in the morning and 48 ∘C in the afternoon, the effect of the temperature dependence can be up to 3–4 % depending on the wavelength and the instrument (Fountoulakis et al., 2017).
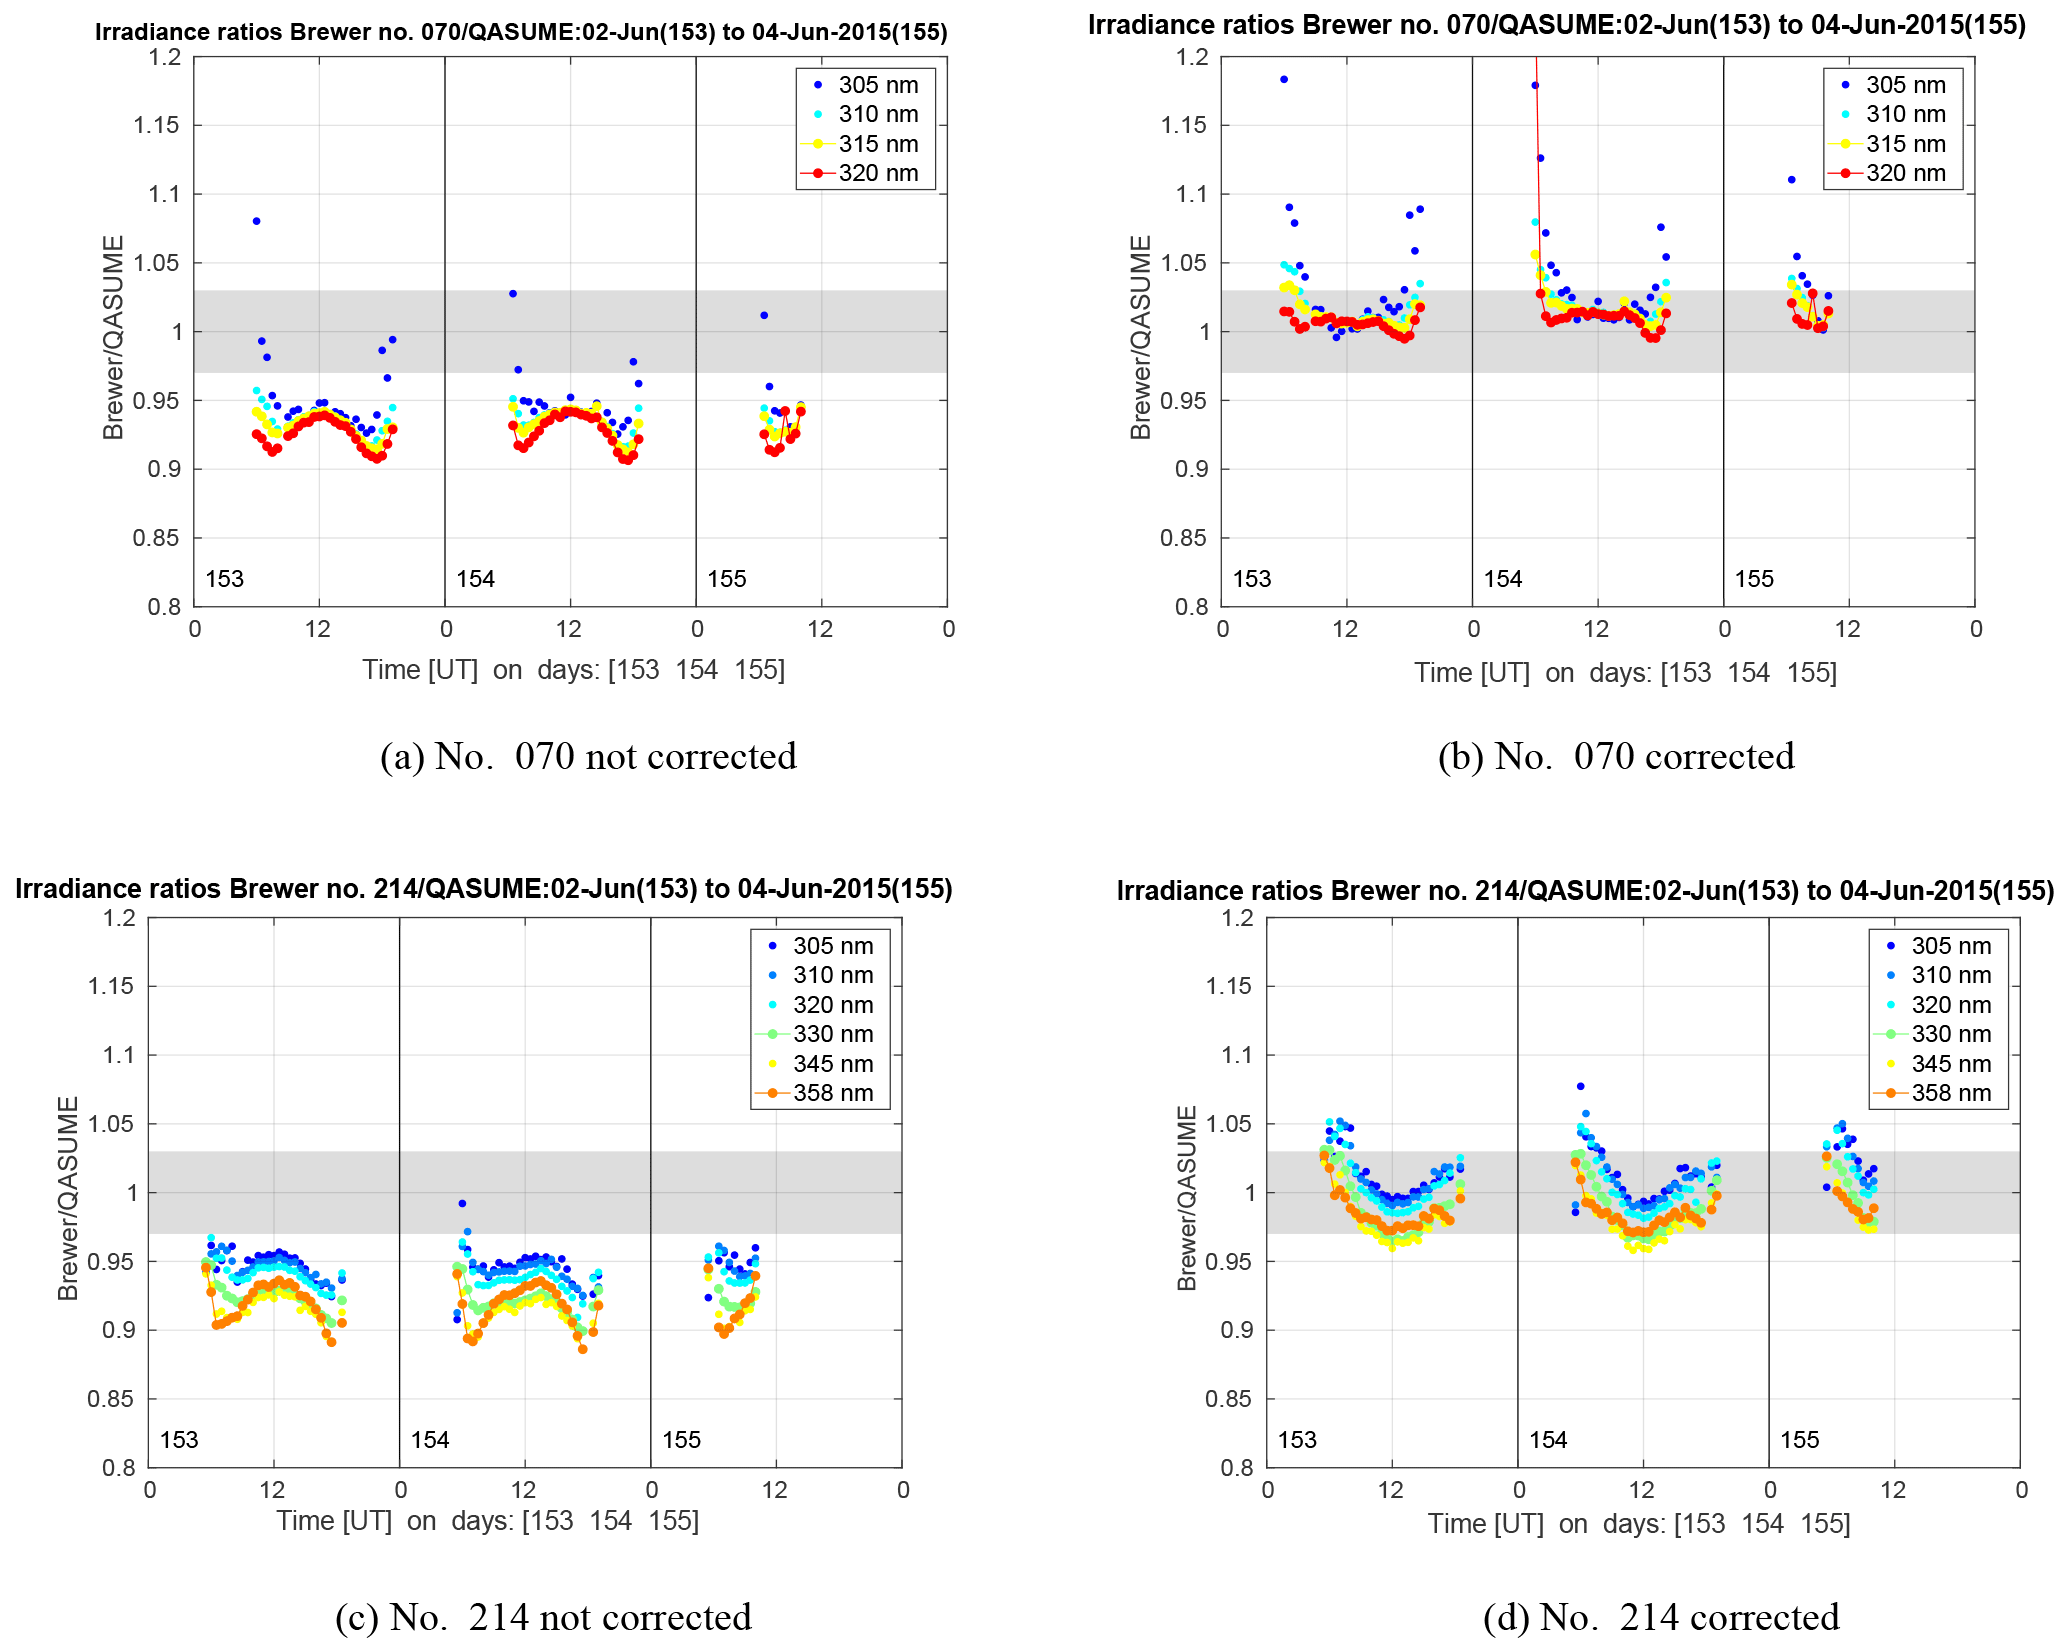
Figure 8The mean ratios between Brewers (a, b) no. 070, (c, d) no. 214 and QASUME irradiances at specific wavelengths for measurements done at SZA < 90∘ in the comparison campaign in Huelva during 2–4 June 2015. The data in plots (b) and (d) was cosine error corrected and in plots (a) and (c) was not corrected. The grey-shaded area in the figure represents the uncertainty of the QASUME spectroradiometer at 95 % confidence level.
3.2 Comparison under changing cloudiness at high latitude
During the QASUME site audits in Finland there were clear sky, changing cloudiness and overcast conditions. The Brewer irradiance measurements were cosine error corrected and the correction varied between 9–12 and 6–12 % depending on SZA, cloudiness and wavelength for Brewers no. 037 and no. 107, respectively. The results of all site audits were studied and the mean ratios of Finnish Brewers no. 037 and no. 107 cosine error corrected irradiances compared to the QASUME irradiances are shown in Fig. 9. The mean differences between the Brewers and the QASUME were less than 6 % for both Brewers, no. 037 and no. 107, depending on the wavelengths. Most of the spectra (2σ) were within ±2.5 % from the mean difference showed in Fig. 9. The results of Brewer no. 037 were strongly affected by the stray light problem of single Brewers at wavelengths shorter than 306 nm. The Finnish Brewers overestimated the irradiance compared to the QASUME during all years except the Brewer no. 107 in 2014. A possible explanation for differences between the QASUME and the Finnish Brewers was the difference in the traceability of the irradiance scale of the instruments. The irradiance scale of the QASUME was traceable to PTB, and that of FMI's Brewer was traceable via the Aalto University, Finland, to the Swedish National Testing and Research Institutes (SP), Sweden (Lakkala et al., 2008).
Another potential reason for the systematic bias is the assumption of isotropic radiation in the cosine error correction method. Kazadzis et al. (2004) has indirectly shown that for overcast conditions and UV wavelengths, this distribution can not be considered isotropic, leading to a systematic overestimation of the cosine correction applied in the Brewer instruments. For such conditions we have calculated that for the Brewers presented in this work, this overestimation was from 1.5 to 2.5 %. This may explain part of the difference between the QASUME and the cosine corrected Brewer data.
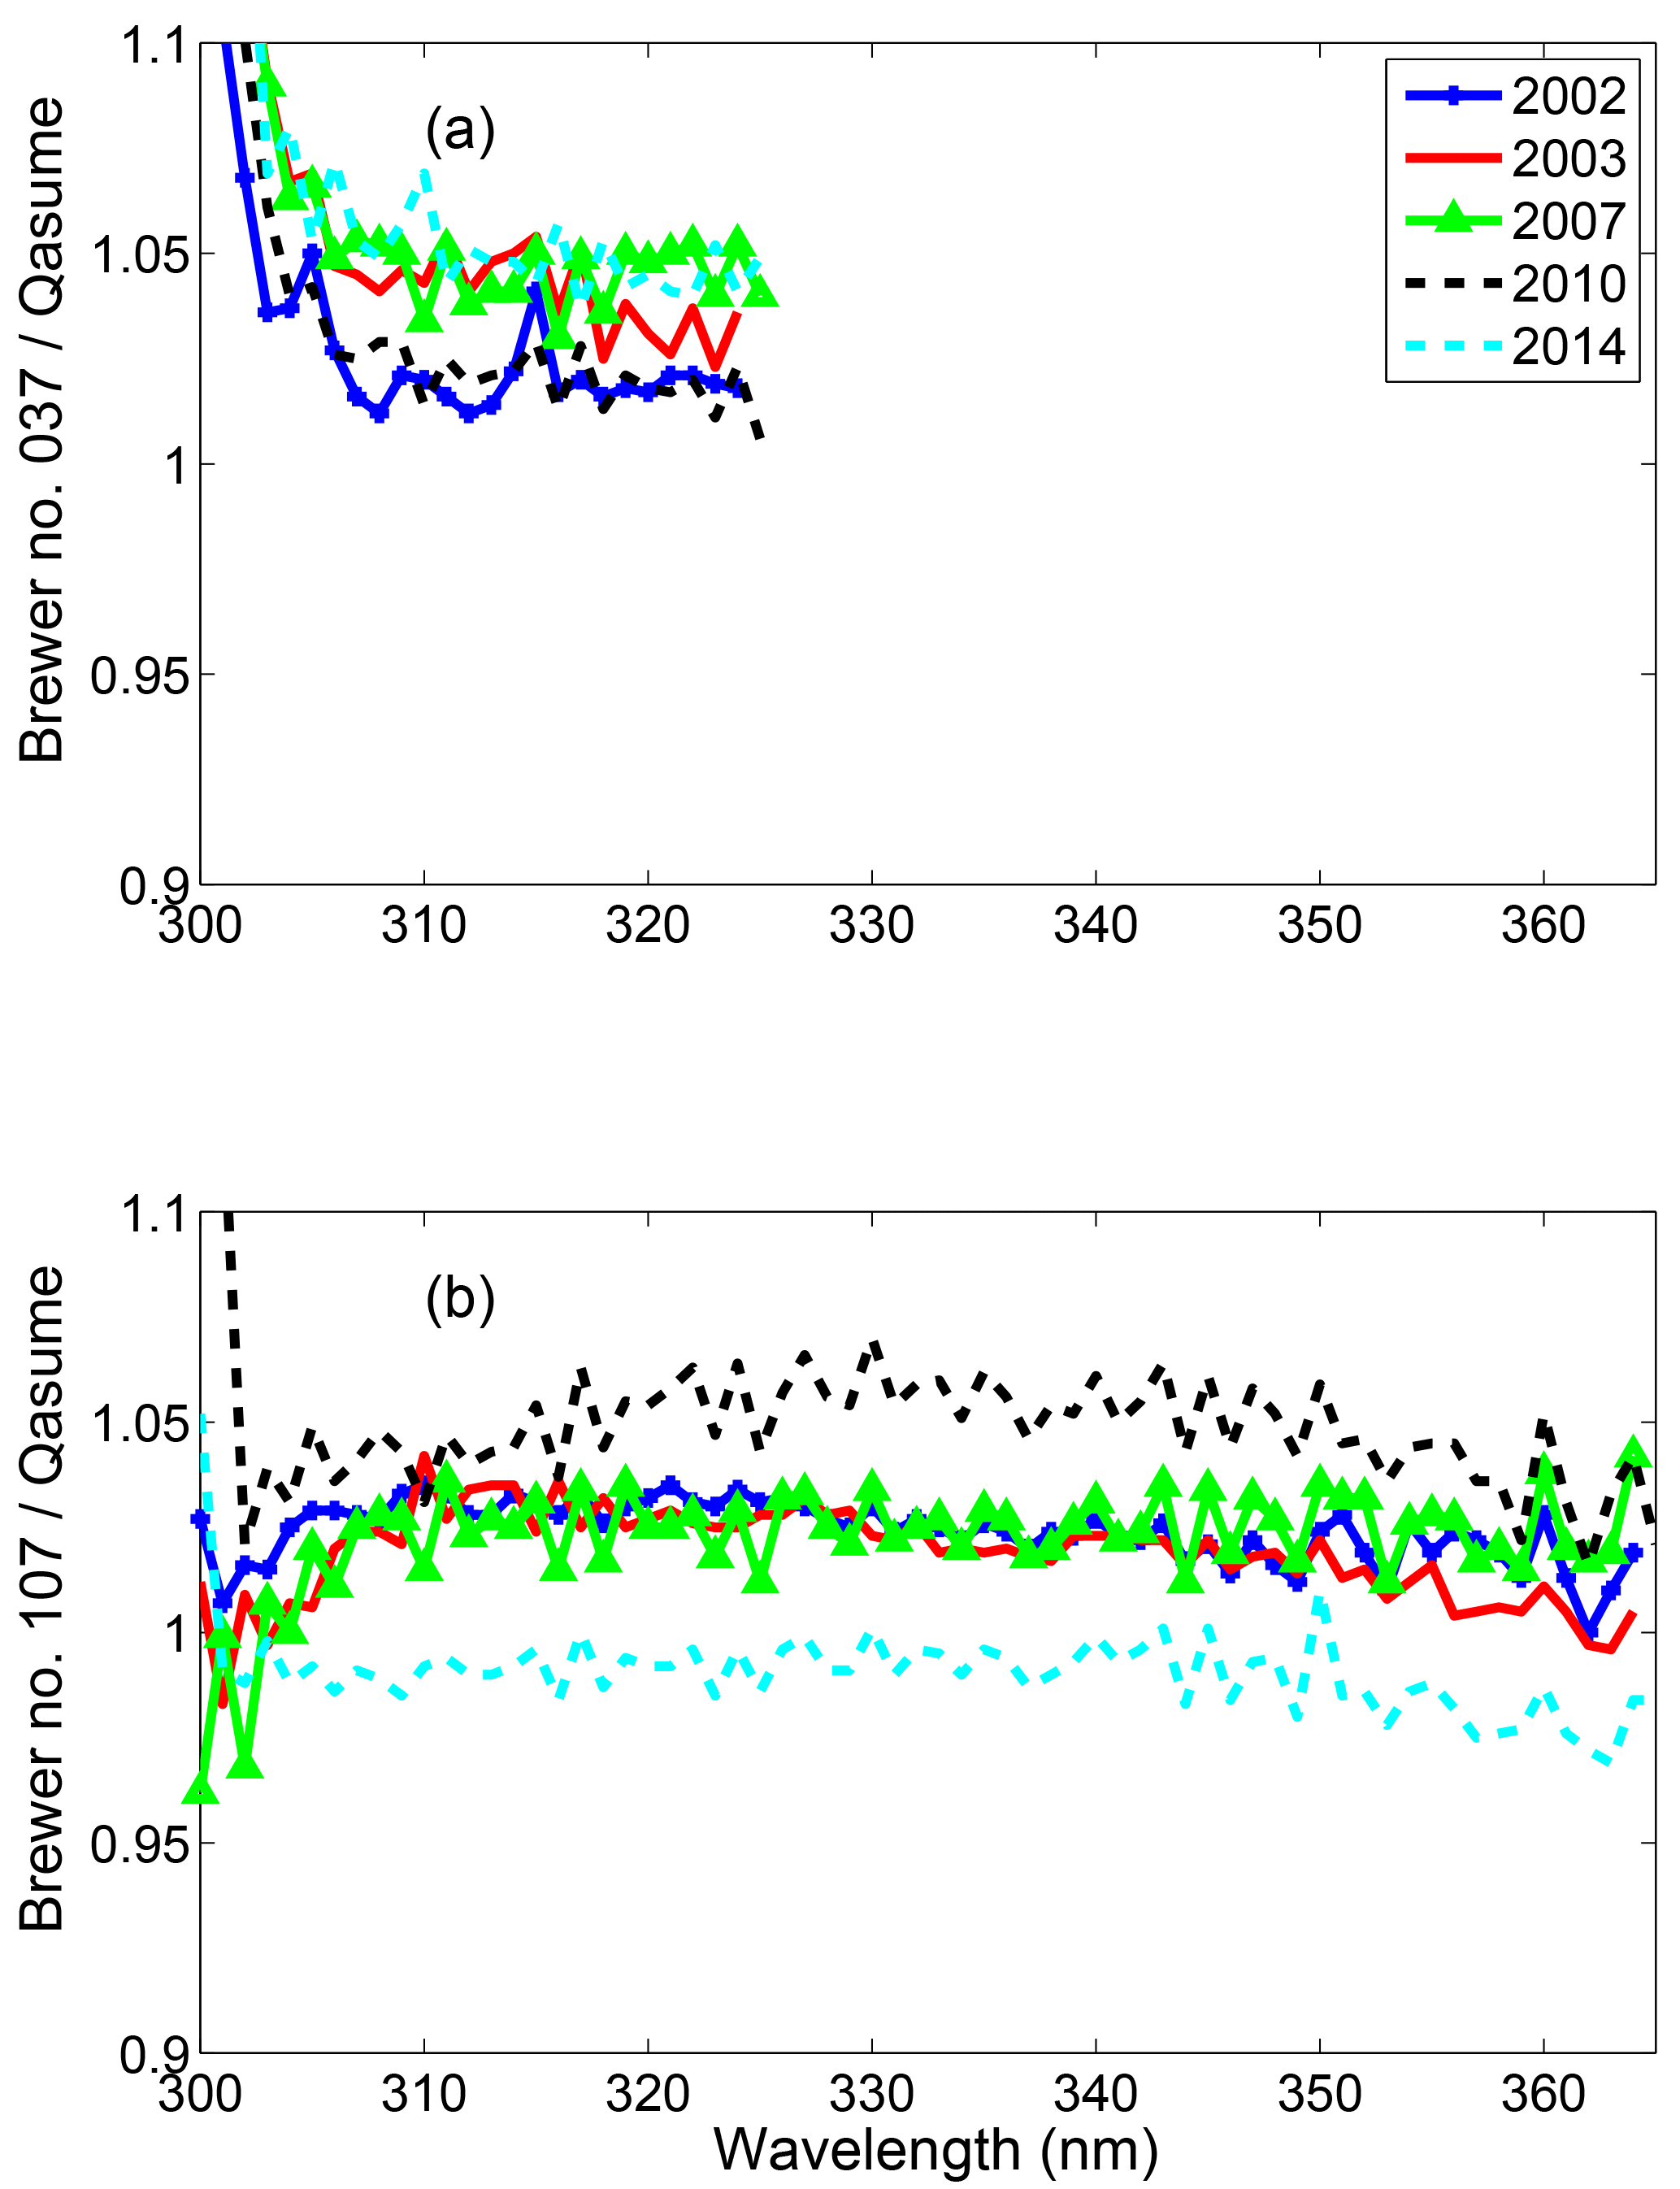
Figure 9The results of the comparisons between (a) Brewer no. 037, (b) Brewer no. 107 and the QASUME during 2002–2014. The irradiances of the Brewers were cosine error corrected.
In this work the performance of the FMI's cosine error correction method was studied by applying the method to Brewers from AEMET in addition to the FMI's Brewer during the comparison campaign in Huelva in 2015. Since clear-sky conditions persisted throughout the entire campaign period, the site audits in Finland were used to show the performance of the method during conditions of changing cloudiness.
The method uses the average of angular responses measured at four different azimuth angles to calculate the error related to both direct and diffuse component of solar radiation. This averaging introduces error in case the angular response has an azimuth dependency. Therefore, ideally the correction of the direct component should be based on the angular response measured in the direction of the quartz window of the Brewer, since it follows the sun. As the true radiation field is not isotropic, the azimuthally averaged angular response introduces an error in the cosine correction of the diffuse component as well, if large differences exist between angular responses of different azimuths.
Isotropic assumption of the diffuse component of solar radiation is often used for UV wavelengths (Gröbner et al., 1996; Landelius and Josefsson, 2000), but can generate errors in the method, as discussed in Sect. 3.2. In the case of the Brewers presented in this work, this isotropy assumption can introduce an error of ±1.5 % for cloudless and a +1.5–2.5 % for cloudy conditions.
Another source of error is the possible wavelength dependence of the angular response. In addition, the angular response might change in time, especially if there have been changes of mechanical or optical components over the years. However, for example, for the Brewer no. 107, when comparing angular characterisation of 1996, which was used in this study, and the angular characterisation performed in 2003 (Bais et al., 2005), only a 2 % difference in the cosine error correction of the diffuse component was found. The maximum difference of errors of the direct component was 3 % at angle 85∘, being less than 1.6 % for angles lower than 70∘. Bais et al. (2005) found that reproducibility of the angular response measurements was better than ±2 % for the angular response measurement device used within the QASUME project.
The lookup table is also a source of error: The atmospheric conditions assumed in the model calculations cannot correspond to the varying atmospheric conditions at which the UV measurements are performed. For instance, the lookup table of Brewer no. 214 was generated to be representative for the atmospheric conditions in Finland, while the measurements were performed in Spain where, for example, the typical ozone profile is different. For the Brewers of AEMET, the lookup tables were generated using the slit function of Brewer no. 117, even if all Brewers have instrument specific slits. However, the impact due to this assumption was estimated to be less than 1 %. The largest error was found to be caused by the bias between the model calculations and measurements. For conditions of the Huelva 2015 campaign, the model overestimated irradiances by an average of +5 %. For some Brewers this caused the method to retrieve cloud optical depth values corresponding to thin cloud cover at some wavelengths, even if there were clear sky conditions. At the Huelva 2015 campaign, the effect was the highest during midday, at SZA 15∘, when over corrections of the cosine error of up to 3 % were found for cloudless cases. The effect diminished towards higher SZA and was less than 1 % at SZA equal or larger than 50∘.
The first step of the correction procedure, in which the measured irradiance is corrected assuming all radiation as diffuse, is also a specific source of error. This assumption leads to an overestimation of the global irradiance of up to 5 % for SZA less than 20∘ and cloudless skies. This has an impact on the calculated cloud optical depth and thus also on the model retrieved direct to diffuse ratio. For cloudless conditions and for cloud optical depths >=2 the effect on the cosine correction is in the order of 0 to 1.2 % for all solar zenith angles and all Brewers. In the case of thin cirrus clouds (e.g. cloud optical depth = 1) the relative error is 0 to 1.5 %, where 1.5 % is the under correction for the Brewer with the worse cosine response for SZA 15∘ and for 320 nm. Results for the Brewers with the best cosine response presented in this study are in the order of 0–1 % for the same conditions. This under correction was compensated completely or partially by the overcorrection of the same magnitude and under the same conditions (thin clouds, low SZAs) due to the bias between model calculations and measurements, discussed above. However, the study showed that the possibility to detect thin clouds, i.e. cirrus with cloud optical depth less than 1 (Giannakaki et al., 2007) was challenging.
One possibility to improve the method could be to replace the lookup table irradiances with the modelled irradiances including the theoretical cosine error of each Brewer. Then the measured irradiances could be used directly, without the current assumption of initial cosine correction corresponding to the conditions of diffuse irradiance only, and the SZA varying conditions would be better accounted for. However, the additional challenge, which remains using this approach, is that the bias between model and measurements varies as a function of SZA and wavelength and depends on the atmospheric conditions. Another improvement would be to include a more dense increment of cloud optical depth between cloud optical depth zero and five when generating the lookup table. Currently the interpolation between cloud optical depth zero and five might result in additional uncertainties as that is the range where large changes in the direct to diffuse ratio occurs.
FMI's cosine error correction method requires that there are total ozone measurements and information of albedo and aerosols available at the measurement site. In this work, total ozone measured by the Brewers was available and the visibility measurements were used to estimate the aerosol effect. The albedo was set to represent snow free conditions. In case of snow on the ground, the albedo would be higher and increase the diffuse radiation resulting in 0–5 % higher cosine error correction factors depending on cloudiness and SZA. The method could be applicable to other type of spectroradiometers as well, if the needed inputs and instrument characteristics, slit function and angular response, are available.
In this work we applied the cosine error correction method, which is in routine use for the FMI Brewer UV measurements, to correct the cosine error of five Brewers during a comparison campaign in Huelva, Spain, in 2015. The results were compared to the reference spectroradiometer of the campaign, the portable Bentham spectroradiometer QASUME. The results showed that the spectral cosine correction varied between 4 to 14 %, and the differences between the QASUME and the Brewers diminished even by 10 % after the cosine error correction for some Brewers. The cosine error correction coefficient showed a diurnal dependency following the ratio of the direct and diffuse component of the radiation field. In the method, the direct to diffuse radiation ratio was calculated for each wavelengths using radiative transfer model calculations and a lookup table in order to catch changing cloud cover conditions.
After the correction, there was still a small diurnal dependency left in the Huelva campaign comparison data. As the measurements were not temperature corrected, and internal temperature of the Brewers changed by around 25 ∘C during the day, the remaining error might be due to the uncorrected temperature error. Also the stray light effect has an influence in the results at high SZA and short wavelengths, especially for single monochromator Brewers.
As measurements in Huelva were performed under clear sky conditions, the results of the site audits performed in Sodankylä and Jokioinen, Finland, were used to assess the performance of the method under changing cloudiness conditions. For both studied Brewers, the difference from the portable reference QASUME, was less than 6 % for the period 2002–2014, depending on the wavelength and SZA.
The results confirmed that even if the method is initially developed for atmospheric conditions in Finland, it can be used in both mid latitude and high latitude locations. It is transferable to all Brewers, as far as the slit function and angular response of the instrument are known. In addition to instrument characteristics, total ozone amount, albedo and information of aerosols or visibility are needed.
Code is available upon request from the authors.
Data from the comparison of El Arenosillo can be found in the EUBREWNET database (http://rbcce.aemet.es/eubrewnet/, Redondas, 2018), which was developed within the framework of COST Action ES1207 by RBCC-E and AEMET. Data from the Brewers of the FMI can be found in the European UV database, EUVDB, Heikkilä et al. (2016), http://uv.fmi.fi/uvdb/, last access: 20 August 2018. Data from site audits of the QASUME reference are available from the World Calibration Center – Ultraviolet Section (WCC-UV) at https://www.pmodwrc.ch/en/world-radiation-center-2/wcc-uv/qasume-site-audits/ (Hülsen, 2018).
KL: wrote most part of the paper and analysed the data; performed the cosine characterisation of the Brewer no. 037 and participated to that of Brewer no. 214. AA: developed and coded the cosine error correction method; participated in the writing of the paper. JG: analysed the Huelva campaign data and plotted the Huelva campaign figures; was responsible for the QA and data analyses of QASUME, and for the site audits in Finland; participated in the writing of the paper. SL: QA of Brewers of AEMET; data processing of Brewers of AEMET; participated in the writing of the paper. AR: responsible for the comparison campaign in Huelva 2015; responsible for the Brewers of AEMET; the author of the software for the UV data processing of the Spanish Brewers; participated in the writing of the paper. SK: studied the effect of atmospheric radiation distribution; participated in the writing of the paper. TK: QA of Brewers no. 037 and no. 214; participated in the writing of the paper. JMK: QA of Brewers no. 037 and no. 214. LE: performed the cosine characterisation of Brewer no. 214; was responsible for the site audit in Sodankylä in 2014; participated in the writing of the paper. AH: responsible of Brewer no. 107; QA of Brewer no. 107; participated in the writing of the paper. TK: performed the cosine characterisation of Brewer no. 107; was responsible of Brewer no. 107 until 2015. QA of Brewer no. 107. QC of Brewer no. 214 during the comparison campaign in Huelva 2015. AS: hosted the comparison campaign in Huelva 2015 and participated in the writing of the manuscript. JMV: co-organiser of the 2005 and 2015 RBCC-E campaigns and hosted the comparison campaign in Huelva 2015.
The authors declare that they have no conflict of interest.
This article is based upon work from the COST Action ES1207 “A
European Brewer Network (EUBREWNET)”, supported by COST (European
Cooperation in Science and Technology). This study was partially
supported by the research projects CGL2014-56255-C2-1-R and
CGL2014-56255-C2-2-R granted by the Ministerio de Economa y
Competitividad from Spain. Gregor Hülsen from PMOD-WRC and Markku Ahponen, Kimmo Rikkonen and Esa Saarinen from FMI are acknowledged for the
QA of the spectroradiometers during the site audits in Finland.
Edited by: Andreas Hofzumahaus
Reviewed by: Alkiviadis Bais and two anonymous referees
Anderson, G., Clough, S., Kneizys, F., Chetwynd, J., and Shettle, E.: AFGL atmospheric constituent profiles (0–120 km), Tech. Rep. AFGL-TR-86-0110, Air Force Geophys. Lab., Hanscom Air Force Base, Bedford, Mass., 1986. a
Antón, M., Serrano, A., Cancillo, M., M., V. J., Cachorro, V., and Gröbner, J.: Correction of Anggular Response Error in B]rewer UV Irradiance Measurements, J. Atmos. Oceanic Technol., 25, 2018–2026, https://doi.org/10.1175/2008JTECHA1040.1, 2008. a, b
Bais, A., Zerefos, C., and McElroy, C.: Solar UVB measurements with the double- and single-monochromator Brewer Ozone Spectrophotometers, Geophys. Res. Lett., 23, 833–836, 1996. a, b
Bais, A., Kazadzis, S., Balis, D., Zerefos, C., and Blumthaler, M.: Correcting global solar ultraviolet spectra recorded by a Brewer spectroradiometer for its angular response error, Appl. Optics, 37, 6339–6344, 1998. a, b
Bais, A., Kazadzis, S., Garane, K., Kouremeti, N., Gröbner, J., Blumthaler, M., Seckmeyer, G., Webb, A., Koskela, T., Görts, P., and Shreder, J.: Portable device for characterizing the angular response of UV spectroradiometers, Appl. Optics, 44, 7136–7143, 2005. a, b, c, d, e, f
Bais, A. F.: Solar Ultraviolet Radiation Modeling, Measurements and Effects, vol. 52 of NATO ASI Series I, Global Environmental Change, edited by: Zerefos, C. S. and Bais A. F., chap. Spectrometers: operational errors and uncertainties, 163–173, Springer-Verlag,Berlin, 1997. a
Bernhard, G. and Seckmeyer, G.: Uncertainty of measurements of spectral solar UV irradiance, J. Geophys. Res., 104, 14321–14345, 1999. a
Feister, U., Grewe, R., and Gericke, K.: A method for correction of cosine errors in measurements of spectral UV irradiance, Solar Energy, 60, 313–332, 1997. a, b
Fountoulakis, I., Redondas, A., Bais, A. F., Rodriguez-Franco, J. J., Fragkos, K., and Cede, A.: Dead time effect on the Brewer measurements: correction and estimated uncertainties, Atmos. Meas. Tech., 9, 1799–1816, https://doi.org/10.5194/amt-9-1799-2016, 2016. a
Fountoulakis, I., Redondas, A., Lakkala, K., Berjon , A., Bais, A. F., Doppler, L., Feister, U., Heikkila, A., Karppinen, T., Karhu, J. M., Koskela, T., Garane, K., Fragkos, K., and Savastiouk, V.: Temperature dependence of the Brewer global UV measurements, Atmos. Meas. Tech., 10, 4491–4505, https://doi.org/10.5194/amt-10-4491-2017, 2017. a, b
Garane, K., Bais, A. F., Kazadzis, S., Kazantzidis, A., and Meleti, C.: Monitoring of UV spectral irradiance at Thessaloniki (1990–2005): data re-evaluation and quality control, Ann. Geophys., 24, 3215–3228, https://doi.org/10.5194/angeo-24-3215-2006, 2006. a
Giannakaki, E., Balis, D. S., Amiridis, V., and Kazadzis, S.: Optical and geometrical characteristics of cirrus clouds over a Southern European lidar station, Atmos. Chem. Phys., 7, 5519–5530, https://doi.org/10.5194/acp-7-5519-2007, 2007. a
Gröbner, J.: Protocol of the solar UV intercomparison at INTA, El Arenosillo, Spain from May 26 to June 4, 2015 with the travelling reference spectroradiometer QASUME from PMOD/WRC, Tech. rep., Physikalisch-Meteorologisches Observatorium Davos, World Radiation Center, available at: https://www.pmodwrc.ch/wcc_uv/qasume_audit/reports/2015_05_spain_INTA_RBCCE10.pdf (last access: 20 August 2018), 2015. a, b, c
Gröbner, J. and Sperfeld, P.: Direct traceability of the portable QASUME irradiance standard of the PTB, Metrologia, 42, 134–139, 2005. a, b
Gröbner, J., Blumthaler, M., and Ambach, W.: Experimental investigation of spectral global irradiance measurement errors due to a non ideal cosine response, Geophys. Res. Lett., 23, 2493–2496, 1996. a
Gröbner, J., J., S., Kazadzis, S., Bais, A. F., Blumthaler, M., Görts, P., Tax, R., Koskela, T., Seckmeyer, G., Webb, A. R., and Rembges, D.: Traveling reference spectroradiometer for routine quality assurance of spectral solar ultraviolet irradiance measurements, Appl. Optics, 44, 5321–5331, 2005. a
Heikkilä, A., Kaurola, J., Lakkala, K., Karhu, J. M., Kyrö, E., Koskela, T., Engelsen, O., Slaper, H., and Seckmeyer, G.: European UV DataBase (EUVDB) as a repository and quality analyser for solar spectral UV irradiance monitored in Sodankylä, Geosci. Instrum. Method. Data Syst., 5, 333–345, https://doi.org/10.5194/gi-5-333-2016, 2016. a
Hülsen, G.: Qasume Site Audits, available at: https://www.pmodwrc.ch/en/world-radiation-center-2/wcc-uv/qasume-site-audits/, last access: 20 August 2018.
Hülsen, G., Gröbner, J., Nevas, S., Sperfeld, P., Egli, L., Porrovecchio, G., and Smid, M.: Traceability of solar UV measurements using the Qasume reference spectroradiometer, Appl. Opt., 55, 7265–7275, https://doi.org/10.1364/AO.55.007265, 2016. a, b
Kazadzis, S., Topaloglou, C., Bais, A. F., Blumthaler, M., Balis, D., Kazantzidis, A., and Schallhart, B.: Actinic flux and O1D photolysis frequencies retrieved from spectral measurements of irradiance at Thessaloniki, Greece, Atmos. Chem. Phys., 4, 2215–2226, https://doi.org/10.5194/acp-4-2215-2004, 2004. a
Kerr, J., McElroy, C., Wardle, D., Olafson, R., and Evans, W.: The automated Brewer spectrophotometer, in: Atmospheric Ozone, Proc. of the Quadrennial Ozone Symposium, Halkidiki, Greece, September 3–7, 1984, edited by: Zerefos, C. and Ghazi, A., 396–401, Reidel Publishing Company, Dordrecht, Holland, 1985. a
Kipp & Zonen: BREWER MKIII Spectrophotometer Operator's Manual, Revision F., 2015. a
Kurucz, R. L., Furenlid, I., Brault, J., and Testerman, L.: Solar Flux Atlas from 296 nm to 1300 nm, National Solar Observatory Atlas, Sunspot, New Mexico, 1984. a
Lakkala, K., Arola, A., Heikkilä, A., Kaurola, J., Koskela, T., Kyrö, E., Lindfors, A., Meinander, O., Tanskanen, A., Gröbner, J., and Hülsen, G.: Quality assurance of the Brewer spectral UV measurements in Finland, Atmos. Chem. Phys., 8, 3369–3383, https://doi.org/10.5194/acp-8-3369-2008, 2008. a, b, c, d, e, f
Lakkala, K., León-Luis, S., Redondas, A., Hermández, B., Karppinen, T., and Arola, A.: UV Configuration and Processing in the EUBREWNET, presentation at the Brewer Ozone Spectrophotometer/Metrology Open Workshop, Ponta Delgada, Portugal, 17–20 May, available at: http://www.eubrewnet.org/cost1207/owncloud/public.php?service=files&t=fe680609b5d42e49e0041339d0db2f1f (last access: 20 August 2018), 2016a. a
Lakkala, K., Suokanerva, H., Karhu, J. M., Aarva, A., Poikonen, A., Karppinen, T., Ahponen, M., Hannula, H.-R., Kontu, A., and Kyrö, E.: Optical laboratory facilities at the Finnish Meteorological Institute – Arctic Research Centre, Geosci. Instrum. Method. Data Syst., 5, 315–320, https://doi.org/10.5194/gi-5-315-2016, 2016b. a, b
Landelius, T. and Josefsson, W.: Methods for cosine correction of broadband UV data and their effect on the relation between UV irradiance and cloudiness, J. Geophys. Res., 105, 4795–4802, 2000. a, b
Lantz, K.: Cosine Correction Factors for Brewer Solar Irradiance – Clouds not known except overcast from R, Technical report, NOAA-EPA Brewer Network, available at: https://www.esrl.noaa.gov/gmd/grad/neubrew/docs/CosineCorrection.pdf (last access: 20 August 2018), 2010. a
León-Luis, S. F., Lakkala, K., Hernandez-Cruz, B., Lopez-Solano, J., Carreño, V., Berjón, A., Santana-Diaz, D., and Aredondas, A.: Preliminar results on the operative cosine correction in Eubrewnet, quadrennial Ozone Symposium of the International Ozone Commission 2016 – Edinburgh 4–10 September 2016, available at: http://meetingorganizer.copernicus.org/QOS2016/QOS2016-250.pdf (last access: 20 August 2018), 2016. a
Mäkelä, J. S., Lakkala, K., Koskela, T., Karppinen, T., Karhu, J. M., Savastiouk, V., Suokanerva, H., Kaurola, J., Arola, A., Lindfors, A. V., Meinander, O., de Leeuw, G., and Heikkilä, A.: Data flow of spectral UV measurements at Sodankylä and Jokioinen, Geosci. Instrum. Method. Data Syst., 5, 193–203, https://doi.org/10.5194/gi-5-193-2016, 2016. a, b, c
Mayer, B. and Kylling, A.: Technical note: The libRadtran software package for radiative transfer calculations – description and examples of use, Atmos. Chem. Phys., 5, 1855–1877, https://doi.org/10.5194/acp-5-1855-2005, 2005. a
Pulli, T., Kärhä, P., and Ikonen, E.: A method for optimizing the cosine response of solar UV diffusers, J. Geophys. Res., 118, 7897–7904, https://doi.org/10.1002/jgrd.50642, 2013. a
Redondas, A.: Eubrewnet, available at: http://rbcce.aemet.es/eubrewnet/, last access: 20 August 2018.
Rimmer, J., Redondas, A., Gröbner, J., Karppinen, T., De Bock, V., and Bais, A.: The European COST Action EUBrewNet, the 10th meeting of the Ozone Research Managers of the Parties to the Vienna Convention, Geneva 28–30 March 2017, available at: http://conf.montreal-protocol.org/meeting/orm/10orm/presentations/Observer Publications/Tu1745_Rimmer_EUBrewNET.pdf (last access: 20 August 2018), 2017. a
Seckmeyer, G. and Bernhard, G.: Cosine Error Correction of spectral UV-irradiances, Atmospheric Radiation, 2049, 140/SPIE, 1993. a
Slaper, H., Reinen, H. A. J. M., Blumthaler, M., Huber, M., and Kuik, F.: Comparing ground-level spectrally resolved solar UV measurements using various instruments: A technique resolving effects of wavelength shift and slit width, Geophys. Res. Lett., 22, 2721–2724, 1995. a
Stamnes, K., Tsay, S.-C., Wiscombe, W., and Laszlo, I.: DISORT, a General-Purpose Fortran Program for Discrete-Ordinate-Method Radiative Transfer in Scattering and Emitting Layered Media: Documentation of Methodology, Tech. rep., Dept. of Physics and Engineering Physics, Stevens Institute of Technology, Hoboken, NJ 07030, 2000. a
Woods, T. N., Prinz, D. K., Rottmann, G. J., London, J., Crane, P. C., Cebula, R. P., Hilsenrath, E., Brueckner, G. E., Andrews, M. D., White, O. R., VanHoosier, M. E., Floyd, L. E., Herring, L. C., Knapp, B. G., Pankrantz, C. K., and Reiser, P. A.: Valida- tion of the UARS solar ultraviolet irradiances: Comparison with the Atlas 1 and 2 measurements, J. Geophys. Res., 101, 9541–9569, 1996. a