the Creative Commons Attribution 4.0 License.
the Creative Commons Attribution 4.0 License.
 | 22 Feb 2019
An improved method for mobile characterisation of δ13CH4 source signatures and its application in Germany
Antje Hoheisel
Christiane Yeman
Florian Dinger
Henrik Eckhardt
Martina Schmidt
The carbon isotopic signature (δ13CH4) of several methane sources in Germany (around Heidelberg and in North Rhine-Westphalia) were characterised. Mobile measurements of the plume of CH4 sources are carried out using an analyser based on cavity ring-down spectroscopy (CRDS). To achieve precise results a CRDS analyser, which measures methane (CH4), carbon dioxide (CO2) and their 13C-to-12C ratios, was characterised especially with regard to cross sensitivities of composition differences of the gas matrix in air samples or calibration tanks. The two most important gases which affect δ13CH4 are water vapour (H2O) and ethane (C2H6). To avoid the cross sensitivity with H2O, the air is dried with a Nafion dryer during mobile measurements. C2H6 is typically abundant in natural gases and thus in methane plumes or samples originating from natural gas. A C2H6 correction and calibration are essential to obtain accurate δ13CH4 results, which can deviate by up to 3 ‰ depending on whether a C2H6 correction is applied.
The isotopic signature is determined with the Miller–Tans approach and the York fitting method. During 21 field campaigns the mean δ13CH4 signatures of three dairy farms (), a biogas plant (), a landfill (), a wastewater treatment plant (), an active deep coal mine () and two natural gas storage and gas compressor stations () were recorded.
In addition, between December 2016 and November 2018 gas samples from the Heidelberg natural gas distribution network were measured with a mean δ13CH4 value of . Contrary to previous measurements between 1991 and 1996 by Levin et al. (1999), no strong seasonal cycle is shown.
- Article
(4815 KB) - Full-text XML
-
Supplement
(425 KB) - BibTeX
- EndNote


Methane (CH4) is the second most important anthropogenic greenhouse gas. The atmospheric growth rate of CH4 has changed significantly during the last decades, stabilising at zero growth from 1999 to 2006 before beginning to increase again after 2007 (Dlugokencky et al., 2009). Several studies have focused on the recent CH4 growth caused by changes in sources and sinks (Rigby et al., 2017; Turner et al., 2017).
Recent studies by Schaefer et al. (2016), Rice et al. (2016) and Nisbet et al. (2016) have shown how the δ13CH4 measurements can help to understand the changes in global CH4 increase rates and to assign the related source types. The stable carbon isotope ratio (13C∕12C) of CH4 sources varies due to the initial source material and the fractionation during production and release to the atmosphere. The source categories can be classified as pyrogenic (e.g. biomass burning), biogenic (e.g. wetlands and livestock) or thermogenic (e.g. a subcategory of fossil fuel extraction), which show different but also overlapping isotope ratio ranges. Various studies have shown that the assignment of isotopic signatures from different CH4 sources remains uncertain due to large temporal variabilities and also regional specificities (e.g. Sherwood et al., 2017). This missing knowledge may result in large uncertainties when the CH4 budget is determined on global or regional scales using isotope-based estimates. In addition to global studies, the use of δ13CH4 was already successfully applied by Levin et al. (1999) in Heidelberg or Lowry et al. (2001) in London. The study by Levin et al. (1999) showed the CH4 emission reduction in the catchment area of Heidelberg, which was accompanied by a significant change in the δ13CH4 source mixture from −47.4 ‰ in 1992 to −52.9 ‰ in 1995∕1996. Both were explained by decreasing contributions from fossil sources, mainly coal mining.
In order to apply δ13CH4 in regional models, a better knowledge of the regional source signature of each CH4 source type is needed, taking into account the temporal variations in these sources. For instance, due to its origin the source signature of natural gas in Germany varies between −55 % and −30 % for Russia or the North Sea respectively (Levin et al., 1999). In addition to seasonal variations, changes in landfill managements like gas collector systems and the implementation of biogas plants at many farms need to be taken into account for a new study of the global and regional source signature of CH4.
Traditionally, the isotopic ratio of CH4 has been measured with isotope ratio mass spectrometry (IRMS) coupled with gas chromatography (GC) (Fisher et al., 2006) and this technique is still the most precise, as shown by Röckmann et al. (2016) by a comparison of dual isotope mass spectrometry, quantum cascade laser absorption spectroscopy (QCLAS), and cavity ring-down spectroscopy (CRDS). Instrumental development in measurement technique now allows isotope analysis of δ13CH4 by a CRDS analyser and even its use on a mobile platform (Rella et al., 2015; Lopez et al., 2017). This is a further improvement to the study of Zazzeri et al. (2015), which involved collecting air samples in bags and analysing them later in the laboratory by IRMS. The studies of Rella et al. (2015) and Assan et al. (2017) demonstrated the importance of a careful determination of cross sensitivities and a good calibration strategy for precise isotope measurements with a CRDS analyser.
In this paper, a strategy to monitor and determine the isotopic carbon source signature of major CH4 sources in Germany using mobile measurements is presented. One major aspect is a careful characterisation of the CRDS analyser to take into account the cross sensitivity between δ13CH4 and other components like water vapour and ethane (C2H6) and to improve the use of a storage tube, for later reanalysis, described by Rella et al. (2015). During 21 mobile measurement days, emission plumes from a biogas plant, three dairy farms, a landfill, a wastewater treatment plant, two natural gas facilities and a bituminous deep coal mine were measured with our set-up.
2.1 Experimental set-up
The core component of our experimental set-up is the commercially available cavity ring-down spectrometer G2201-i (Picarro, Inc., Santa Clara, CA), which routinely measures the mole fraction of 12CO2, 13CO2, 12CH4, 13CH4 and H2O in an air sample. In addition to the raw spectroscopic measurements, the analyser automatically calculates and outputs the carbon isotopic ratios δ13CH4 and δ13CO2. Furthermore, the mole fraction of C2H6 is measured as an additional feature, which had to be investigated and calibrated for our analyser. All measurements with the CRDS analyser were done in the combined CO2∕CH4 mode to measure CH4 and CO2 in parallel. In addition, the High Precision (HP) mode for CH4 is chosen to provide the most precise CH4 and δ13CH4 measurements for CH4 mole fractions up to 12 ppm. A more detailed description of this type of CRDS analyser can be found in Rella et al. (2015). Two different set-ups are used in this study: a laboratory set-up for sample bag analysis and test series and a mobile configuration in a vehicle.
2.1.1 Laboratory set-up
In the laboratory in Heidelberg the analyser continuously measures ambient air alternating with regular calibration gas and quality control gas injections (Dinger, 2014). In addition, diluted samples from different CH4 sources and gas cylinders can be measured and calibrated. The mobile measurements are also calibrated using the immediate calibration runs in the laboratory before and after a mobile campaign.
The schematic of the laboratory set-up is shown in Fig. 1a. A 16-port rotary valve (model: EMT2CSD16UWE, Valco Vici, Switzerland) can be switched automatically by the analyser to change between different measurements. Ambient air is measured at port 1. Ports 3, 7 and 15 are reserved for calibration and quality control measurements. Sample bags are measured on ports 11 or 13. The gas flow to the analyser is typically 25 to 35 mL min−1 for calibration gas, target gas and sample bag measurements. For some applications like ambient air measurements, the flow is higher with values of around 80 mL min−1 to resolve shorter temporal variabilities. The flow is measured by an electronic flowmeter (model: 5067-0223, Agilent Technologies, Inc., Santa Clara, CA) before entering the analyser.
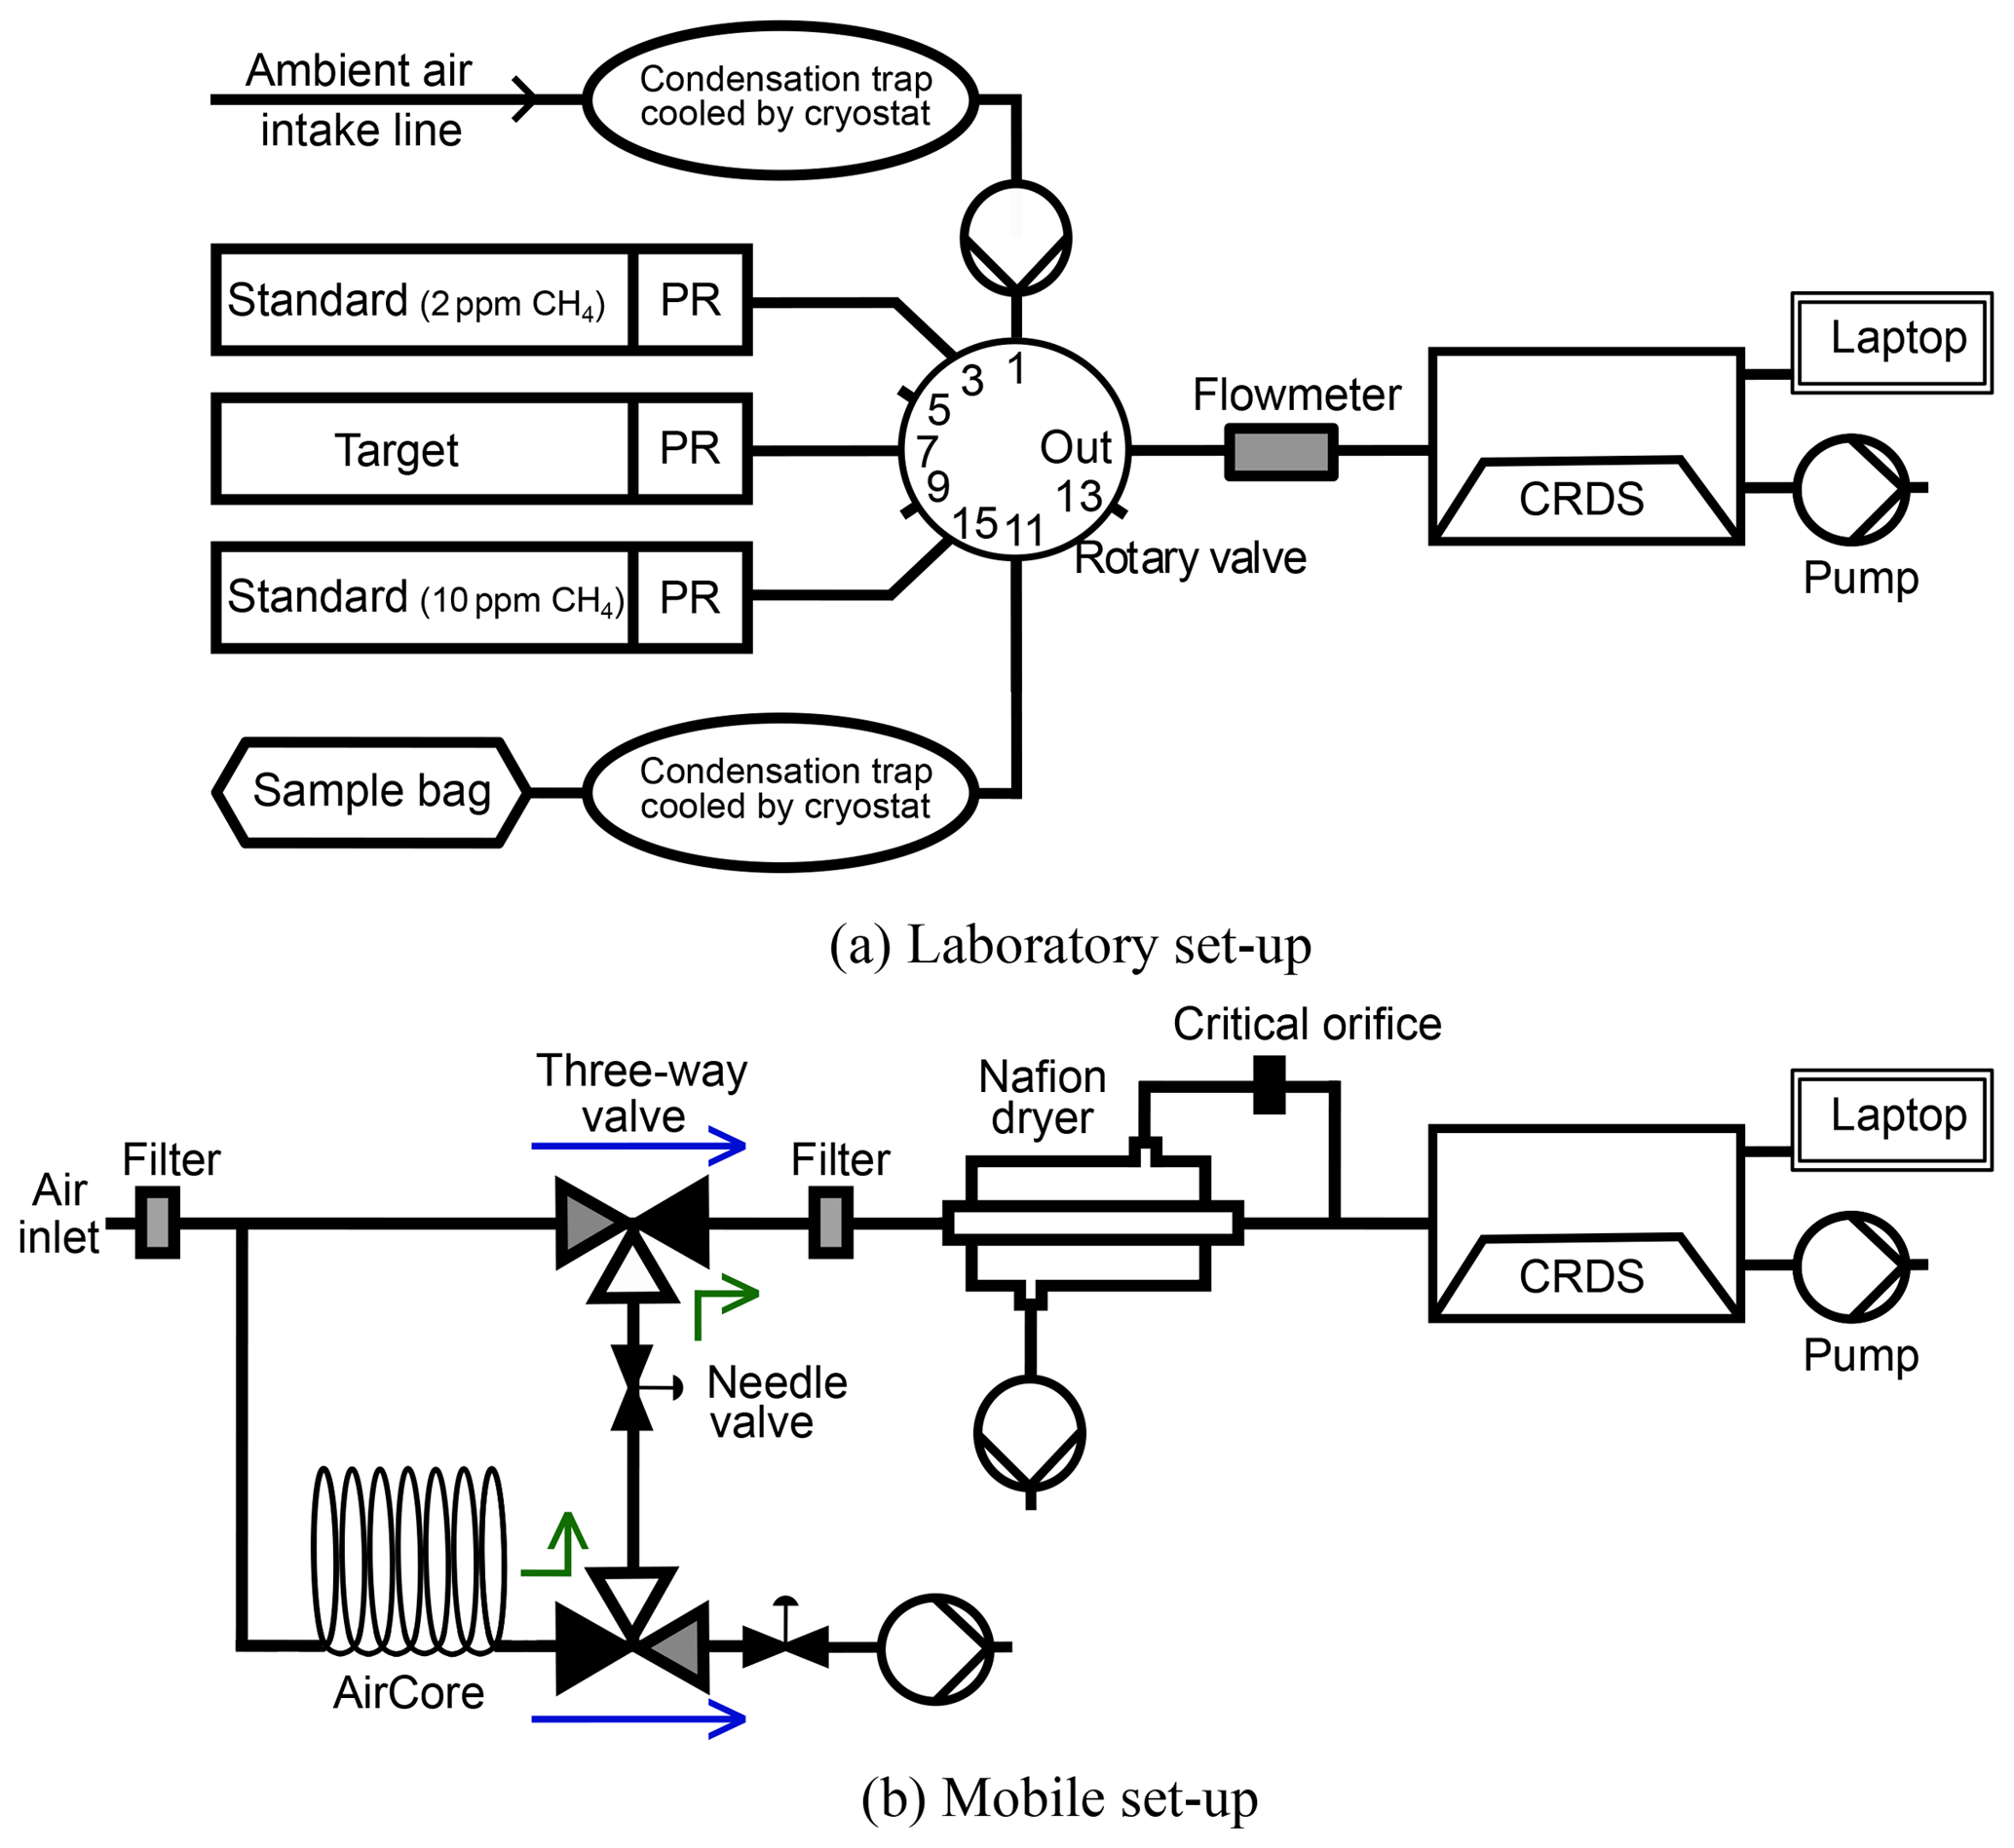
Figure 1Panel (a) shows the measurement set-up in the laboratory. Ambient air measurements are performed over port 1. Port 11 is used to measure sample bags. Standard gas and target cylinders are measured on ports 3, 7 and 15 to calibrate the above-mentioned measurements and also the mobile ones. Panel (b) shows the mobile measuring set-up installed inside a van. The blue arrows indicate the flow of air in “monitoring mode” and the green ones in “replay mode”.
Gas samples taken directly from different installations (e.g. natural gas pipelines, biogas plants, gas collecting systems of landfills and wastewater treatment plants) need to be diluted before the measurement with the CRDS analyser because such samples usually consist of between 50 % and 90 % CH4. Therefore, approximately 40 µL of the sample was injected into a 3 L bag (Tedlar® with polypropylene valve with septum, Restek GmbH, Bad Homburg, Germany) filled with synthetic air (20.5 ±0.5 % O2 in N2) to dilute the CH4 mole fraction to approximately 10 ppm in the new sample bag. Due to cross sensitivity with water vapour, these gas samples were dried using a cooling trap below a mole fraction of 0.0015 % water vapour prior to analysis. Each diluted sample was measured for 15 min. However, only the last 10 min were used to take into account 5 min stabilisation time.
2.1.2 Mobile measurement set-up
For mobile measurements the CRDS analyser is installed inside a vehicle and measures air while driving. The system consists of the CRDS analyser, a Nafion dryer and a storage tube, the so-called AirCore (Karion et al., 2010), which enables us to remeasure the stored air from the last 2 min of continuous measurement (Fig. 1b). The AirCore was built after Rella et al. (2015) using a 25 m Decabon tubing with an inner diameter of 9.5 mm and a volume of 1.77 L (Yeman, 2015). The set-up of the Nafion dryer is similar to the one built by Welp et al. (2013) using a Perma Pure MD-070-96-S Nafion dryer and a vacuum pump. The CRDS device and the vacuum pumps are powered by a portable power source (260 Ah deep-cycle battery, Winnerbatterien Germany) and a 1000 W inverter (e-ast HighPowerSinus HPLS 1000-12) which offers 230 V output), which allows for over 12 h of measurement time.
The ambient air enters the air intake line 20 cm above the vehicle roof. It can follow two different paths to the analyser depending on the valve positions. In the “monitoring mode”, indicated by blue arrows in Fig. 1b, the ambient air enters the CRDS analyser after the air is dried with the Nafion dryer to a mole fraction of less than 0.1 % water vapour. Simultaneously, a second split-off flow leads the ambient air through the AirCore. Due to the length of the intake line, the volume of the cavity and a flow rate of 160 mL min−1 the time lag between air sampling at inlet and measurement in the cavity of the CRDS analyser is 20 to 25 s.
The vehicle usually passes an emission plume of a CH4 source within 40 s and the analyser records approximately 10 data points per CH4 peak. To achieve higher time resolution and accuracy for δ13CH4 analysis, it is possible to remeasure CH4 peaks by analysing the air stored in the AirCore with the “replay mode” by switching the valves manually. This enables us to remeasure the stored air that contains the sampled CH4 peak. The average analysis time is then 4.5 min corresponding to approximately 70 data points, and thus the measurement in replay mode has a higher time resolution than the one in monitoring mode.
In Fig. 2a and b a typical mobile measurement of a plume from a biogas plant close to Heidelberg (Germany) is shown for CH4 mole fractions and δ13CH4 values. The vertical black line indicates the switching from monitoring mode to replay mode. The small dots represent the reported data in monitoring (blue) and replay (black) mode, logged approximately every 3.7 s, while the red lines show the 15 s averages in replay mode. For comparison the peak measured in monitoring mode (blue dots/line in a and b) is stretched by a factor of 12.5 in the x direction (blue line c and d) so that the peak measured with the AirCore and the stretched one measured without it have the same width. The peak measured in replay mode precisely corresponds to the stretched one measured in monitoring mode because both peaks reproduce the same emission plume. This differs from the AirCore measurements performed by Lopez et al. (2017), which show higher CH4 mole fractions in replay than in monitoring mode.
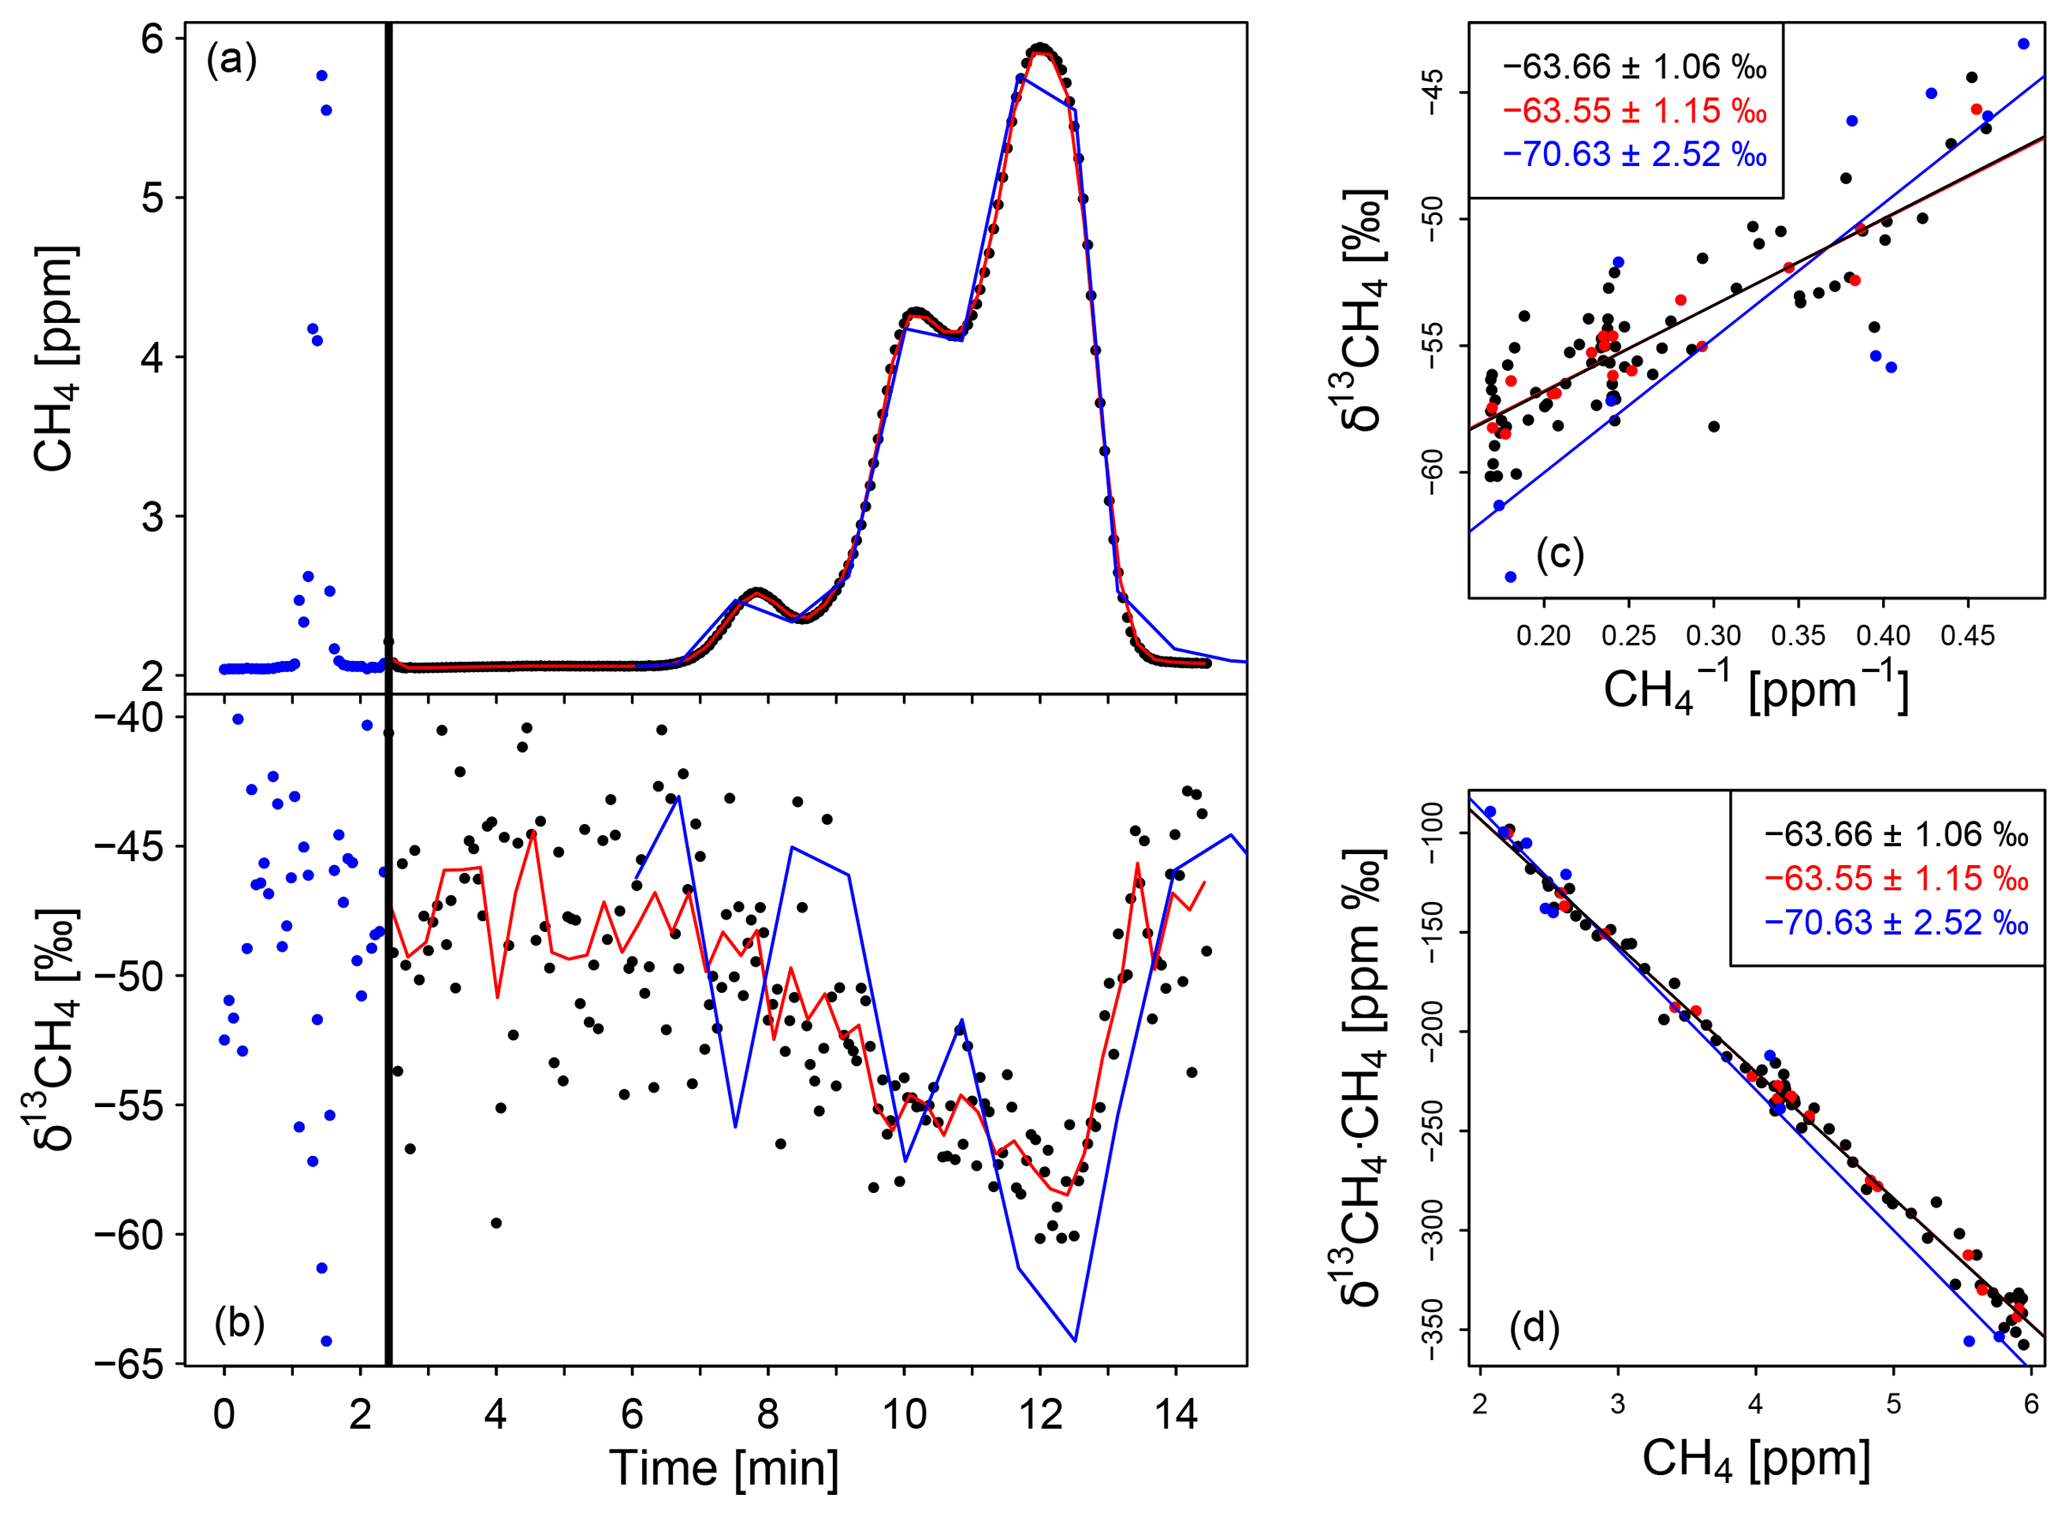
Figure 2Measurement of a typical plume passing a biogas plant as well as a Keeling plot and a Miller–Tans plot to calculate the δ13CH4 signature of the biogas plant. (a, b) Typical CH4 and δ13CH4 peaks in the biogas plant plume. The vertical black line shows the switch from monitoring to replay mode. The red data are 15 s average and the blue line is the in situ peak (first peak) stretched by a factor of 12.5. (c) Keeling plot (c) and Miller–Tans plot (d) to calculate the δ13CH4 source signature (insets). The blue colour represents the monitoring mode, the black and red (15 s mean) ones the replay mode. For better visibility the error bars are not displayed.
During the mobile measurements the vehicle position was recorded by a GPS mouse (Navilock 602u) with an accuracy of 2 m CEP (circullar error probable). A weather station (Vantage Pro2™, Davis Instruments) was set up near the measurement site to record the wind speed and direction, the temperature, and the incident solar radiation.
2.2 Characterisation of the CRDS analyser G2201-i
2.2.1 Correcting the measured δ13CH4 values
With regard to the publications of Rella et al. (2015) and Assan et al. (2017), our main focus during the instrumental characterisation was on δ13CH4. The cross sensitivities of H2O, CH4, CO2 and C2H6 mole fractions to δ13CH4 were investigated to determine correction factors. The correction factors subsequently applied in this study are summarised in Table 1. The correction scheme is sketched in Fig. 3 and described in more detail in Hoheisel (2017). The H2O interference on δ13CH4 was tested by carrying out several humidity tests (Fig. S1 in the Supplement). For this purpose, two dry compressed air gases with gas mixtures of 2.3 ppm and 10.1 ppm CH4 were humidified by flushing them through a reversed glass condensation trap kept at room temperature and filled with one droplet of deionised water. Due to evaporation of the water droplet, the humidity of the gas passing the condensation trap changed with time between 1.5 % and 0 % water vapour. Rella et al. (2015) recommended a reduction in the humidity below a mole fraction of 0.1 % water vapour for accurate δ13CH4 results. Our tests confirm this recommendation for humidity levels below 0.15 % but observed a significant cross sensitivity of 0.54±0.29 (‰ δ13CH4)(% H2O)−1 for humidity levels above 0.15 %. To reduce possible uncertainties due to humidity correction, the air was dried with a Nafion dryer below a mole fraction of 0.1 % water vapour during mobile measurement. However, the Nafion drying unit was not installed until September 2016, so the measurements before this date were corrected.
Table 1Correction and calibration factors for C2H6 and δ13CH4. The abbreviations of the correction and calibration factors in column two are re-adopted in Fig. 3.
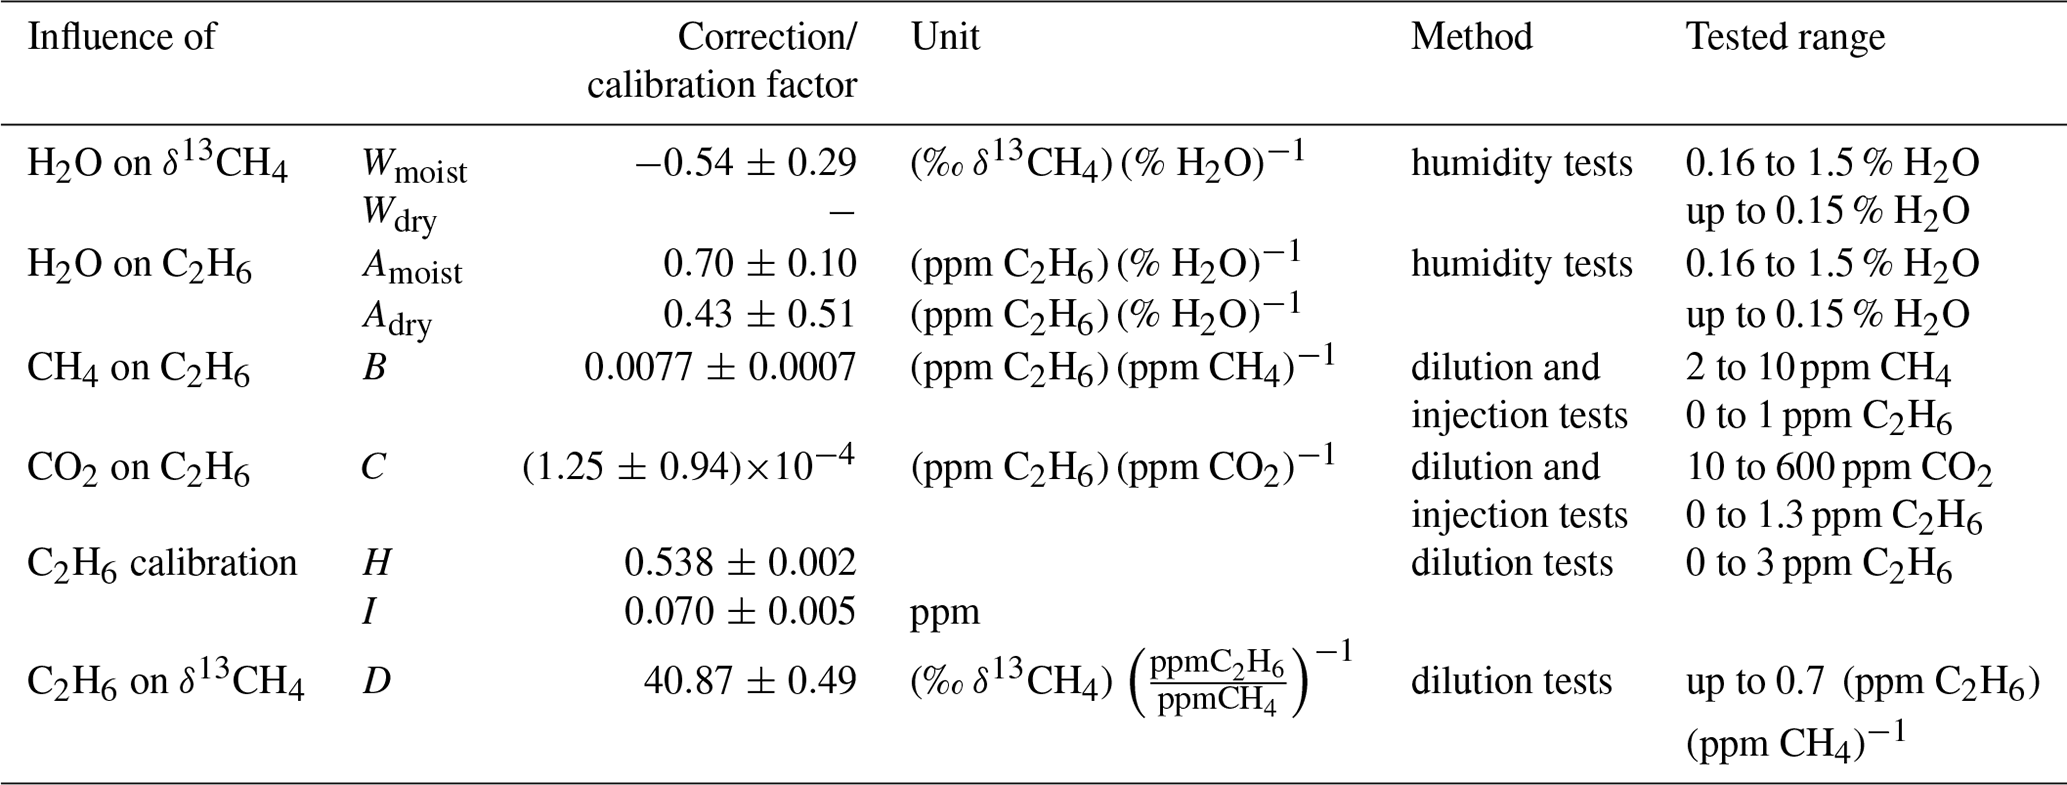

Figure 3Scheme to correct and calibrate C2H6 and δ13CH4. is the nominal (known value of the standard) and the measured (or interpolated) value of the calibration standard. The values for the correction and calibration factors are summarised in Table 1.
Additionally, the cross sensitivities of CH4 and CO2 on δ13CH4 were tested (Figs. S2 and S3). Two dilution tests were carried out, generating different gas mixtures. No significant cross sensitivities of CH4 and CO2 on δ13CH4 were detected up to mole fractions of 10 ppm CH4 or 450 ppm CO2.
Previous studies from Rella et al. (2015) and Assan et al. (2017) have reported higher δ13CH4 results when the gas sample contains C2H6. As typical natural gases in the pipeline network in Germany contain between 1.4 Mol % and 7 Mol % of C2H6 (Nitschke-Kowsky et al., 2012), the C2H6 interference is especially important when analysing CH4 emissions from natural gas facilities or the isotopic composition of natural gas. The C2H6 interference on δ13CH4 measurements was carefully tested with our analyser by carrying out three dilution tests, to determine a correction (Fig. S4). δ13CH4 increases linearly with an increasing C2H6-to-CH4 ratio. The slope of the regression line and thus the correction factor was found to be 40.87±0.49 ‰ (ppm CH4) (ppm C2H6)−1. A correction is necessary because for typical C2H6-to-CH4 ratios between 0.027 and 0.073 measured for our natural gas samples, δ13CH4 shows a bias between 1 ‰ and 3 ‰ to more enriched values. We must also keep in mind that similar shifts in δ13CH4 to less enriched values can occur when using a calibration cylinder which contains C2H6.
2.2.2 Correcting the measured C2H6 mole fraction
To correct for the strong cross sensitivity between C2H6 and δ13CH4 measurements, an accurate determination of the C2H6 mole fraction is required. Because the measurement of C2H6 is an additional feature of the instrument, correction and calibration of the C2H6 mole fraction were performed.
The C2H6 mole fraction decreases strongly with increasing humidity, even for H2O mole fractions below 0.15 % (Fig. S1). For humidity below 0.15 % a correction factor of 0.43±0.51 (ppm C2H6) (% H2O)−1 was determined, and for humidity higher than 0.16 % the correction factor is 0.70±0.10 (ppm C2H6) (% H2O)−1. There is no correction for H2O mole fractions between 0.15 % and 0.16 % because in this range the behaviour of C2H6 in the presence of H2O changes. However, no discontinuity, such as that observed by Assan et al. (2017), was seen.
Besides H2O, the mole fractions of CH4 and CO2 also interfere with the measured C2H6. To determine the cross sensitivities of CH4 and CO2 on C2H6 two dilution series and three injection tests were performed and produced gas mixtures with mole fraction ranges of 1.8 to 10 ppm CH4 or 2 to 600 ppm CO2. All dilution and injection tests with C2H6 mole fractions between 0 and 1.3 ppm show similar results with an average of 0.0077 ± 0.0007 (ppm C2H6) (ppm CH4)−1 and ((ppm C2H6) (ppm CO2) −1 (Fig. S5).
To calibrate the C2H6 measurement two dilution tests with C2H6 mole fractions ranging from 0 to 3 ppm were performed (Fig. S6). The measured C2H6 mole fractions were nearly twice as large as expected. After correcting the measured C2H6 mole fractions due to H2O, CH4 and CO2, a calibration factor (slope of the regression line) of 0.538 ± 0.002 ppm ppm−1 and a calibration intercept of 0.070 ± 0.005 ppm was determined.
2.2.3 Calibration to international scales
All calibration gases used in this study are compressed air filled in aluminium cylinders. The CH4 and CO2 mole fractions were calibrated against the WMO scale (Dlugokencky et al., 2005) using a GC system (Levin et al., 1999). To determine the δ13CH4 values, flasks filled from our calibration gases were analysed at Max Planck Institute (MPI) for Biogeochemistry in Jena (δ13CH4: ±0.05 ‰). These analyses connect our Heidelberg measurements to the VPDB (Vienna Pee Dee Belemnite) isotope scale (Sperlich et al., 2016). C2H6 is not yet calibrated to an international scale. One calibration cylinder filled by Deuste-Steininger (Mühlhausen, Germany) with 4.98 ppm C2H6 is certified by this company with an uncertainty of ±2 %.
All data measured with the CRDS analyser in the laboratory or during mobile campaigns were corrected using the factors from Table 1 and following Fig. 3 prior to the one-point calibration calculation.
The gas cylinder used for calibration was chosen according to the experiment to ensure a similar composition and similar mole fractions for sample and standard. For ambient air measurements in the laboratory and for mobile measurements a gas cylinder filled with compressed air is used to calibrate the data. For diluted gas samples from CH4 sources a gas cylinder with atmospheric mole fractions spiked with natural gas to 10 ppm CH4 is used. The calibration gas is measured before and after every experiment/field campaign in the laboratory or in the vehicle. Tests at the beginning of this study showed that measurements of the calibration gas inside the vehicle do not increase the precision and are therefore not necessary for mobile measurements of less than 10 h. To take into account possible drifts during the measurement, we determined the time function of the standard (), used in the one-point calibration, for each measuring point with a linear interpolation between the two calibration measurements.
2.2.4 Instrument performance and uncertainties
The repeatability of the analyser as a function of the CH4 mole fraction was determined by the measurement of three different gas cylinders for 120 min each. The Allan variance (Werle et al., 1993) was calculated with the raw data for averaging times of up to 15 min (Fig. 4). The Allan standard deviation σ (the square root of the Allan variance σ2) for the raw (3.7 s) CH4 data is between 0.34 and 2.69 ppb for gases with a CH4 mole fraction of 1900 to 10 000 ppb. For the corresponding δ13CH4 data, an improvement of the Allan standard deviation with a higher CH4 mole fraction from 3.76 ‰ to 0.77 ‰ can be seen. The Allan standard deviation of C2H6 is approximately 0.09 ppm for gases with C2H6 mole fractions up to 5 ppm.
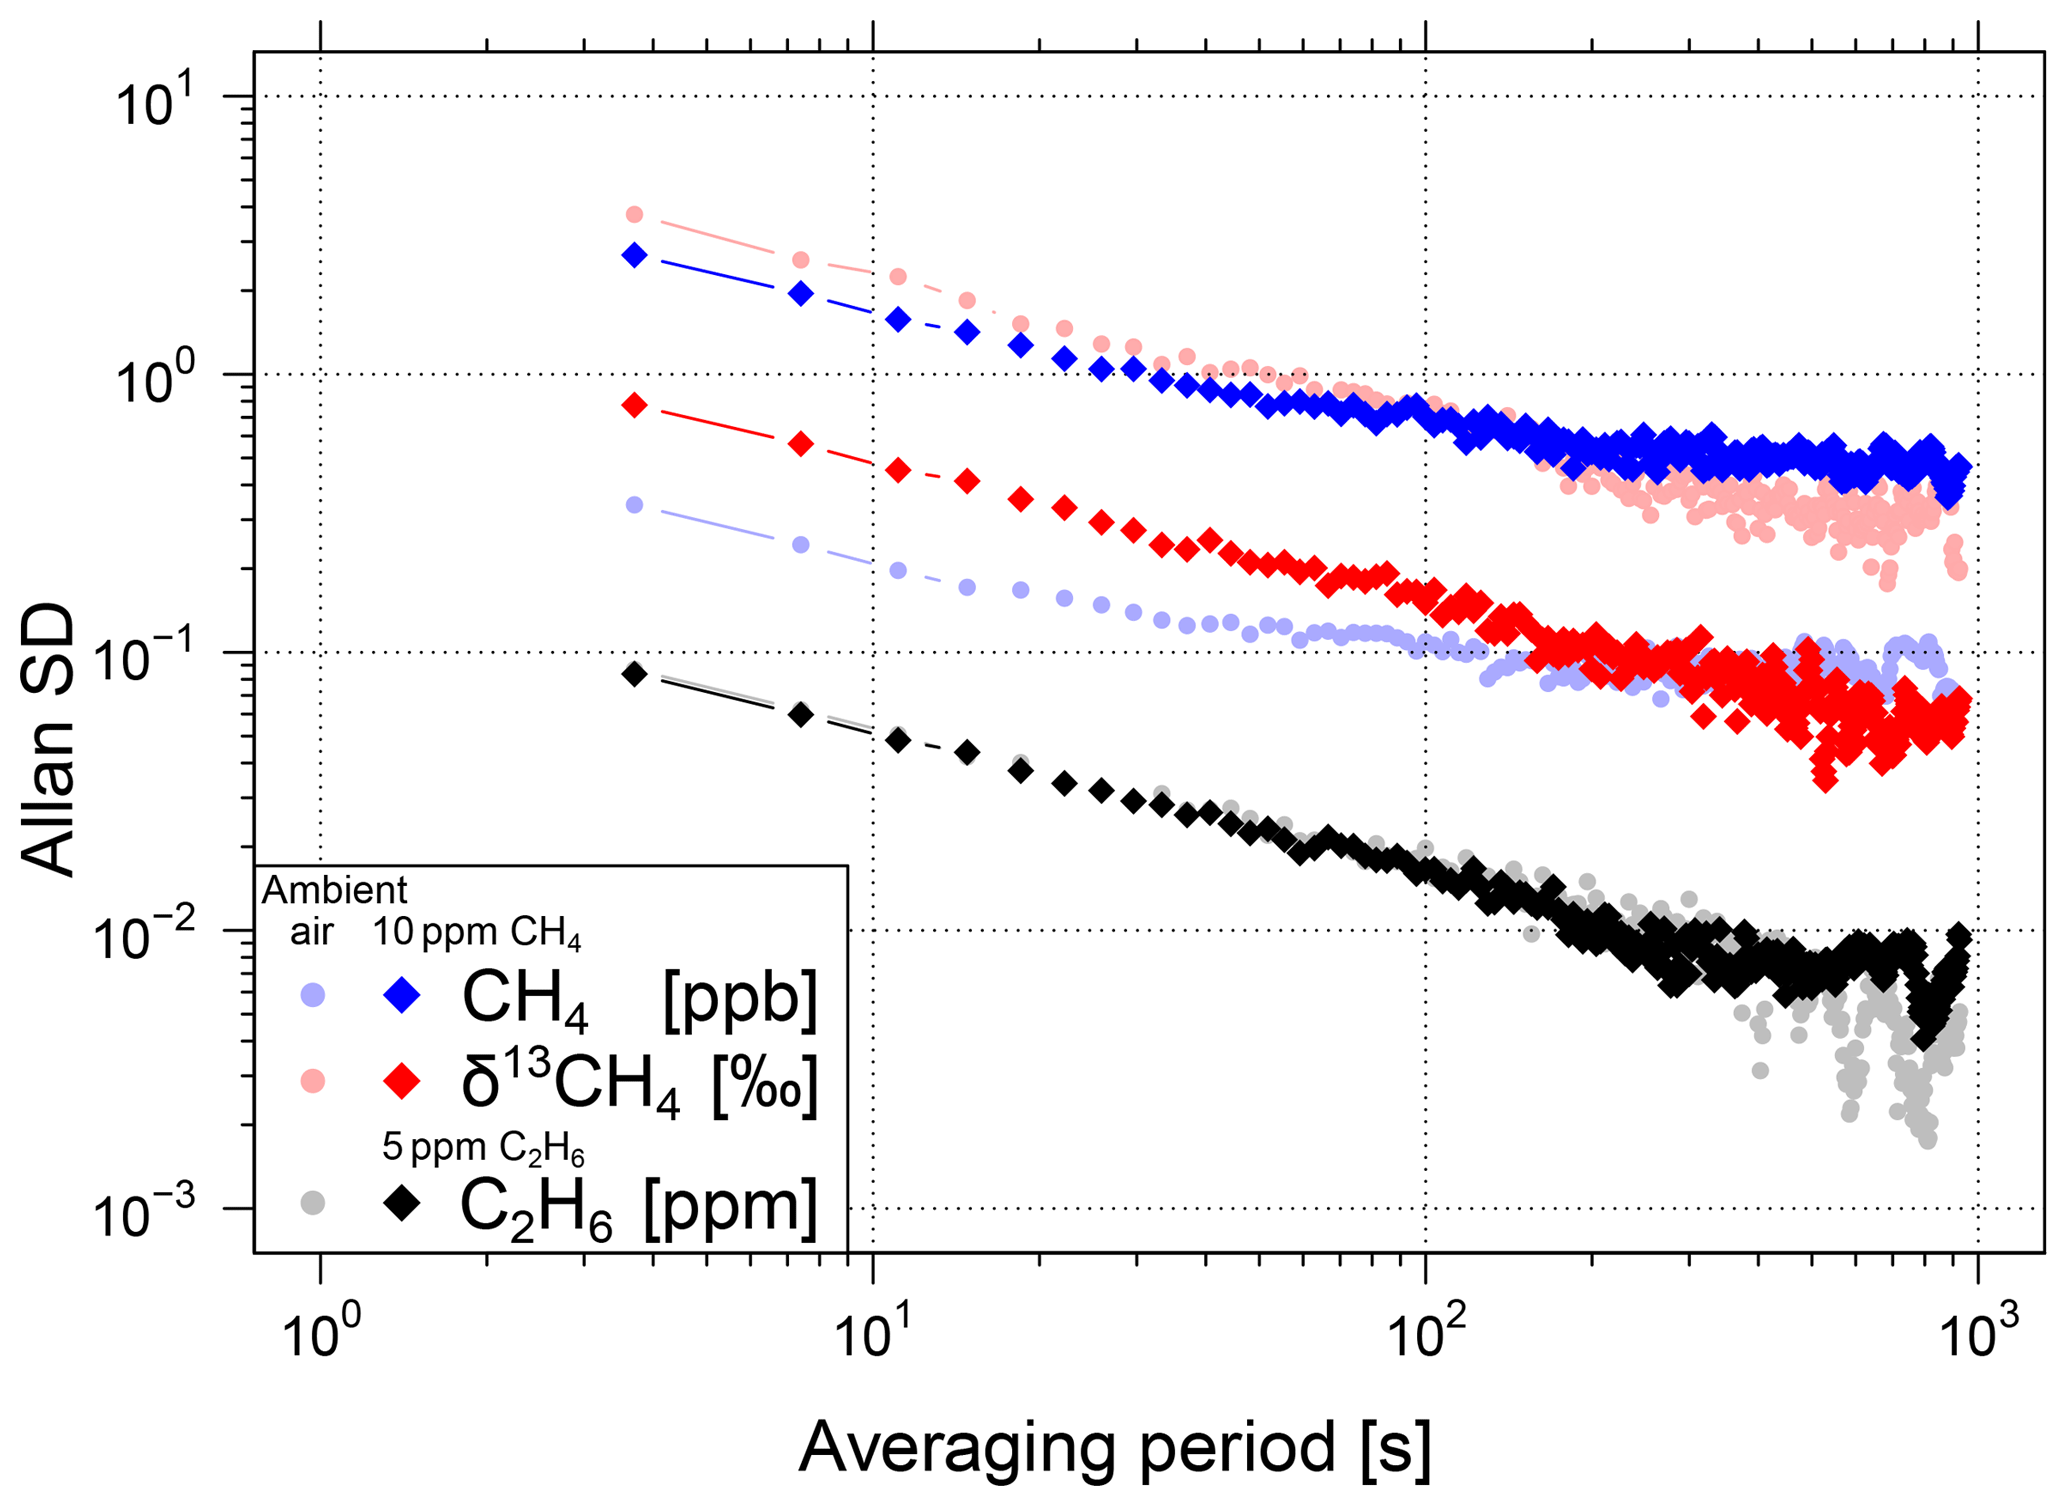
Figure 4Allan standard deviations of CH4, δ13CH4 and C2H6 for two different sample gases each. Results for the first sample gas at atmospheric concentrations are shown in light (red, blue and grey) colours. Results for the second sample gas with 10 ppm CH4 are shown in bright red and blue and for the third sample gas with 5 ppm C2H6 in black.
During mobile measurements especially, CH4 and δ13CH4 show rapid changes when driving through the emission plume of a CH4 source and thus do not allow us to average the data over long time periods. However, for sample measurements in the laboratory (e.g. natural gas samples) longer averaging times of up to 10 or 15 min significantly decrease the Allan standard deviation (see Fig. 4). For a 10 min averaging period, the Allan standard deviation of 1900 ppb or 10 000 ppb CH4 decreases to values of 0.09 and 0.47 ppb and for δ13CH4 to values of 0.40 ‰ and 0.06 ‰. The Allan standard deviation of C2H6 decreases to 0.006 ppm. Due to the correction and calibration of δ13CH4, there is a relative increase in the uncertainty in δ13CH4 of approximately 3 to 12 % for H2O mole fractions below 1.3 % and atmospheric CH4 mole fractions.
2.3 Analysis of δ13CH4
2.3.1 Gas samples from natural gas distribution network
Between December 2016 and November 2018, gas samples from the Heidelberg natural gas distribution network were collected two to three times a month from the glass blowing workshop at the university campus in 1 L sample bags (Tedlar® with polypropylene valve with septum, Restek GmbH, Bad Homburg, Germany).
The gas samples were measured as described in Sect. 2.1.1, corrected by the factors given in Table 1 and calibrated as described above. For each gas sample the average and standard deviation of the last 10 min over the 15 min measurement were calculated.
To determine the repeatability of a measurement as well as the storage effect, pair samples were taken and storage tests carried out, with storage times of the bags of up to 226 days and two to five measurements taken from each sample bag. Duplicate samples taken on the same day and measured one after another show a mean difference in δ13CH4 of 0.12 ± 0.08 ‰ with a maximum difference of 0.30 ‰. Storage tests of 12 natural gas samples stored on average for 104 days (41 to 226 days) in Tedlar® bags show an average drift of 0.0023 ± 0.0028 ‰ day−1 to more enriched values. The drift occurs especially due to fractionation by diffusion of air through the sample bag.
Since the samples are measured for the first time on average 26 days (0 to 88 days) after the sample day, the δ13CH4 value of a sample will change by approximately 0.06 ‰ due to this storage in Tedlar® bags. Even after 100 days the average drift is only 0.23 ‰ and therefore for each sample the δ13CH4 values measured within 100 days after sampling were averaged. To quantify the short-term variations in δ13CH4 from the local gas supply network, daily gas samples were taken over 5 days at the end of November 2017. The maximum difference between the samples was 0.7 ± 0.2 ‰.
2.3.2 Determination of δ13CH4 source signatures from mobile plume measurements
For mobile measurements the CRDS analyser is installed inside a vehicle and measurements are carried out as described in Sect. 2.1.2. The δ13CH4 signature of the CH4 sources were determined by the Miller–Tans approach (Miller and Tans, 2003) using the non-averaged data measured in replay mode with the AirCore. To fit a linear regression line to the data, the York fit (York et al., 2004) was used as recommended also by Wehr and Saleska (2017). York's solution is the general least-squares estimation solution, providing the best possible, unbiased estimates of the true intercept and slope in all cases where the points are independent and the errors are normally distributed (Wehr and Saleska, 2017). Because the York fit allows errors in x and y, it also accounts for the finding that the analyser can measure δ13CH4 more accurately at higher CH4 mole fractions. The errors for CH4 and δ13CH4 for different mole fractions were determined with the Allan standard deviation.
For accurate results the following criteria are used to select 79 AirCore measurements out of 135. Only δ13CH4 signatures with fit uncertainties lower than 5 ‰ are used. The number of data points and especially the peak height above background mole fraction control the uncertainty in the determined isotopic signature when applying a Miller–Tans plot; therefore, only plume measurements with peak heights above background mole fraction higher than 0.45 ppm and more than 25 data points fulfil this criterion. Furthermore, in some cases the reported C2H6 mole fraction jumps while driving although there cannot be a change in the C2H6 mole fraction of the ambient air. These jumps in C2H6 also results in δ13CH4 jumps. Therefore, all AirCore measurements with a sudden change in C2H6 larger than 1 ppm were neglected. With these criteria the isotopic signature of a CH4 source determined from one AirCore plume measurement has an average fit uncertainty of 1.8 ± 1.3 ‰.
2.3.3 Comparison of different methods to determine δ13CH4 source signatures
In order to define the optimal method for the determination of the source signature, the 135 AirCore measurements as well as simulated data were used. In the following the differences in the δ13CH4 source signature when using the Keeling method or the Miller–Tans approach (Keeling, 1958; Miller and Tans, 2003) will be discussed and the York fit will be compared to the ordinary least squares (OLS) fit (here the lm() fit function from R is used).
Similarly to the method described by Wehr and Saleska (2017) for CO2 and δ13CO2, we create several typical emission plume crossings. We generated synthetic CH4 peaks using a background mole fraction of 1.95 ppm CH4 and a Gaussian curve with 10–280 equidistant data points every 3.7 s and an enhancement of 100–10 000 ppb. The corresponding δ13CH4 values were calculated with CH4 source signatures between −35 ‰ and −65 ‰ and a background of −48 ‰. To reproduce the statistical uncertainties of a real measurement, we add a normally distributed scattering around zero to the synthetic CH4 mole fractions and the corresponding isotope ratios. The standard deviation of the normally distributed scattering depends on the CH4 mole fractions and was chosen as the Allan standard deviation measured for raw data of the analyser. However, when simulating possible improved analysers, we reduced the scattering by a factor 2 to 10. Such sets of data were generated 5000 times for each condition. To study the influence of the averaging time, we calculate mean data sets with varying averaging periods (up to 1 min). For each data set the δ13CH4 source signature was calculated with the Miller–Tans and the Keeling method using the York or the OLS fit.
For the York fit the δ13CH4 source signature determined using the Miller–Tans approach is identical within the relevant order of magnitude to the one calculated using the Keeling method. This can be shown for the AirCore measurements and is confirmed by our simulations. Figure 2 shows an example of the Keeling plot (panel c) and the Miller–Tans plot (panel d) used to calculate the isotopic signature of the corresponding CH4 source.
The δ13CH4 signature calculated with the simple OLS fit from the AirCore measurements differ between −2 ‰ and 2 ‰ depending on the method which is used (Miller–Tans or Keeling method). This finding is in agreement with the simulated results.
Comparing the isotopic source signatures of CH4 from the AirCore measurements resulting from York and the OLS fit in approximately 90 % of the measurements the result of the York fit lies in between the results from the OLS with the Miller–Tans and the Keeling method. This agrees well with our simulated results, where the value of the δ13CH4 signature determined with the York fit for peak enhancements between 0.1 and 3 ppm lies between the values calculated for the OLS fit with the Miller–Tans and Keeling method in more than 98.5 % of the results.
The average values for the 5000 determined isotopic signatures for the York and the OLS (Keeling and Miller–Tans) fit in this study are nearly the same (<0.05 ‰ for CH4 peaks higher than 0.2 ppm) and have in all three cases significantly larger differences to the true value (<0.2 ‰ for CH4 peaks higher than 0.2 ppm and <0.1 ‰ for CH4 ranges higher than 0.6 ppm) than between each other. However, the 5000 individual simulated values for the δ13CH4 signatures for one condition vary widely around the average and the true value.
Due to the comparisons described above, the York fit and the Miller–Tans approach were chosen to determine the δ13CH4 source signature in our study. A further characterisation of this method showed that the uncertainty in a single source signature determination depends mainly on three criteria: the CH4 range, the number of data points used for the fit and the precision of the analyser.
The first large limitation for a precise determination of the isotopic source signature is the CH4 mole fraction of the plume above background. The higher the CH4 peak the more accurately the δ13CH4 signature can be determined. Especially for small CH4 sources, it is important to drive as close as possible to the source to increase the peak height. In Fig. 5 the fit error of the isotopic signature of every AirCore measurement (black dots) is given as a function of CH4 peak height above background. For CH4 enhancements lower than 1 ppm, the uncertainty increases strongly to values higher than 20 ‰. The coloured lines show the standard deviation of the 5000 synthetic data with different numbers of data points used for the Miller–Tans approach. The synthetic data agree well with the measured values which were calculated from 25 to 280 data points.

Figure 5Dependency between peak height above background and error of the δ13CH4 signature from the corresponding measured peaks. The inserted figure shows an enlarged section with CH4 ranges up to 1 ppm. The measured δ13CH4 signatures with errors below 5 ‰ (data points within yellow shaded area) are used in this study. The lines show simulated data with different numbers of data points used in the Miller–Tans plot.
The second parameter which influences the accuracy of the determined δ13CH4 signature is the number of data points. During measurements, significantly different isotopic signatures were determined using the monitoring (approximately 10 data points) or replay mode with the AirCore (on average approximately 70 data points) (see Fig. 2). The synthetic data confirm that with an increasing number of data points, the uncertainty in the δ13CH4 signature improves (Fig. 5). The precision can be more than doubled by increasing the number of points from 10 to 70 and more than quadrupled by an increase from 10 to 280. In monitoring mode the number of data points per peak is constrained by the small width of the plume and the driving speed. Therefore, it is important to remeasure the plume using the AirCore to increase the number of data points and thus the precision of the determined δ13CH4 signature.
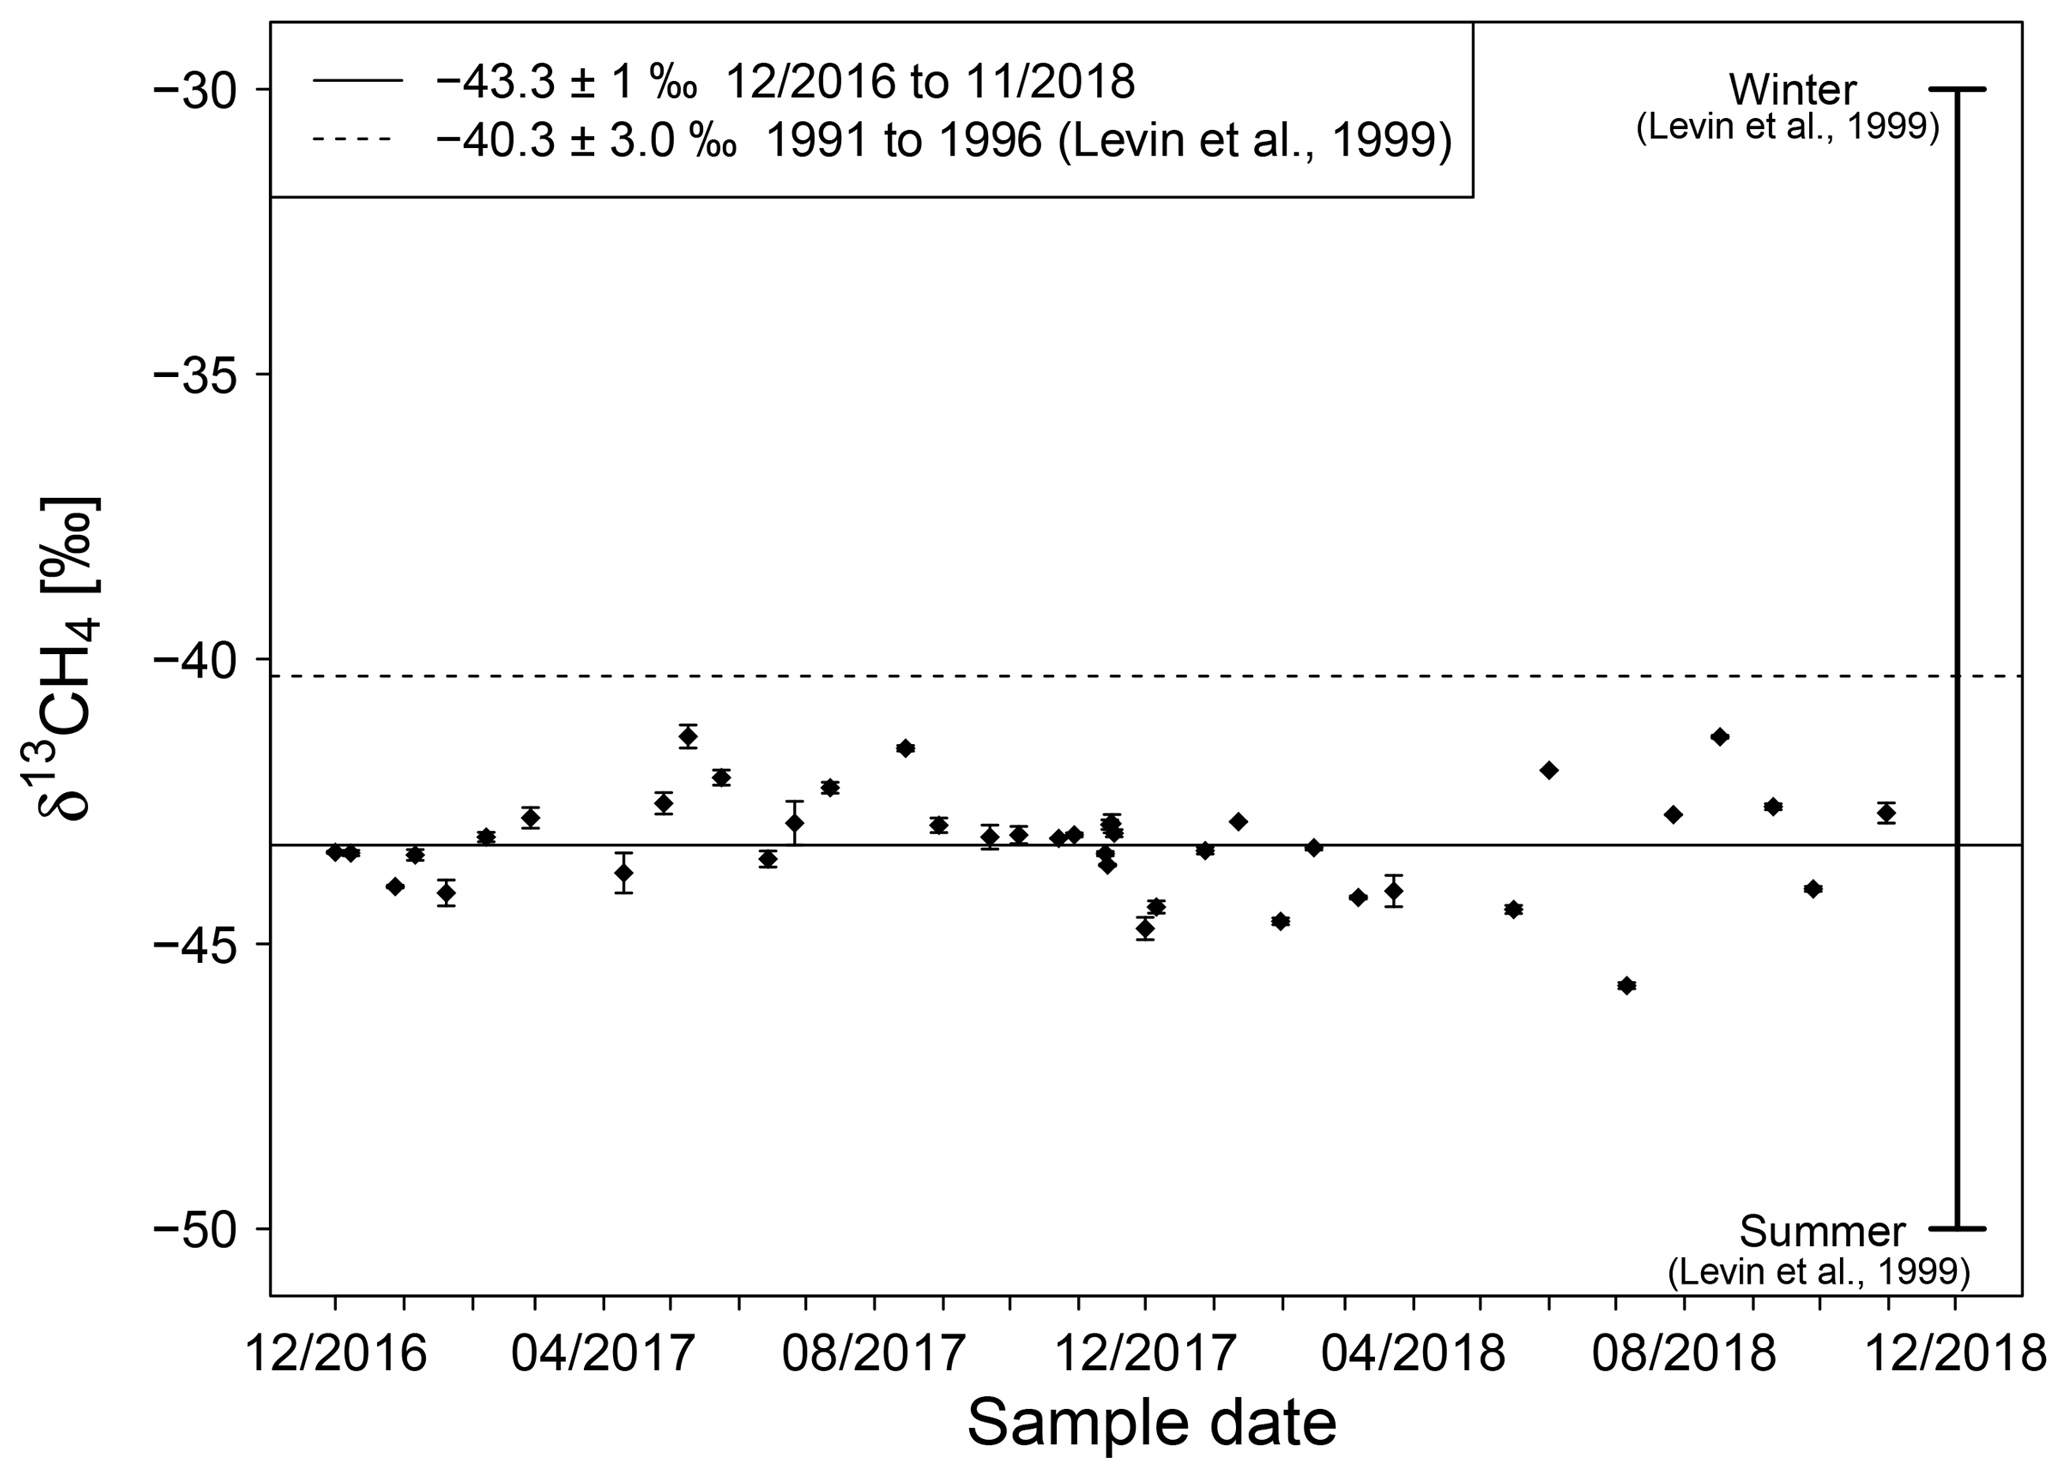
Figure 6Isotopic signature of natural gas in Heidelberg measured between end of 2016 and November 2018. The horizontal solid line is the average monthly mean δ13CH4 value. The horizontal dashed line is the average δ13CH4 value measured from 1991 to 1996 with data ranging from −50 ‰ in summer to −30 ‰ in winter (Levin et al., 1999).
The third limitation of the accuracy of the determined source signature is the measurement precision of the instrument for raw (3.7 s) data, especially for δ13CH4. The measuring intervals of the plume are short, and thus the CH4 mole fraction and isotopic composition change rapidly, making it impossible to increase the precision through averaging over time periods longer than 1 min. The value as well as the uncertainty in the isotopic signatures determined from the original and the 15 s averaged data from AirCore measurements do not show significant differences using the Keeling or the Miller–Tans approach for the real measurements (see Fig. 2). Moreover, additional tests with synthetic data show that averaging over 7 to 60 s improves the precision of the measurement but not the source signature determination due to a smaller number of data points. Therefore, the raw non-averaged data from the analyser measured in replay mode were used instead of the averaged ones. The Allan standard variance without averaging for δ13CH4 is up to 3.76 ‰ (1.9 ppm CH4).
An increase in the precision to a standard deviation of 1 ‰ would lead to a nearly 4 times better precision of the determined isotopic source signature. For future measurements more precise instruments are important. Finally, simulated results for different isotopic source signatures were compared and no dependence on the determined CH4 source signature was noticed.
3.1 δ13CH4 from Heidelberg gas distribution network
Between 1991 and 1996 δ13CH4 measurements of natural gas from the distribution network in Heidelberg were carried out by Glatzel-Mattheier (1997). The measured δ13CH4 values underlay a strong seasonal variation with −30 ‰ in winter and up to −50 ‰ in summer. The annual average was (Glatzel-Mattheier, 1997; Levin et al., 1999). The seasonal cycle in the isotopic composition of natural gas in the 1990s was explained by seasonal changes in gas imports, with a larger contribution from Russian gas in summer months and mainly from northern Germany and Scandinavia during winter because the isotopic signature of natural gas differs depending on its formation process and therefore its origin. Natural gas from Siberia has an isotopic signature between −48 ‰ and −54 ‰ (Cramer et al., 1998) and is thus less enriched than North Sea gas with δ13CH4 signatures of approximately (Lowry et al., 2001). In the late 1990s the percentage of natural gas from import and domestic production in Germany (BAFA, 2017) varied with the seasons. While in summer 1998 and 1999, approximately 44 % of the natural gas imports in Germany originated from Russia, in winter it was only 25 % to 30 %.
Between December 2016 and November 2018, the measured δ13CH4 values vary between −44.7 ‰ and −41.4 ‰ with an average value of (Fig. 6). No strong seasonal cycle as in the 1990s was observed during these 19 months. The measurements in our recent study show that natural gas in Heidelberg is today on average approximately 3 ‰ more depleted than in the 1990s. The percentage of natural gas from import and domestic production in Germany (BAFA, 2017) affirms our findings of no strong seasonal cycle, with reporting a mixture of natural gas which is nearly the same throughout the year. It should be noted that the statistics are for Germany as a whole, while no information for the Heidelberg region is available from the local gas network.
3.2 C2H6-to-CH4 ratio of direct samples and mobile measurements
The C2H6-to-CH4 ratio of gas samples from the natural gas distribution network in Heidelberg varies between 0.027 and 0.072 with lower ratios in winter (0.04 ± 0.01) and higher ones in summer (0.06 ± 0.01). This finding can indicate that the percentage of Russian gas is higher in winter than in summer taking into account that Nitschke-Kowsky et al. (2012) reported the C2H6-to-CH4 ratio for Russian natural gas to be 0.014, while for North Sea gas it is 0.078. Also the isotopic signatures of our natural gas samples support this trend with slightly more depleted values in winter than in summer.
Gas emitted by other CH4 sources like landfills, biogas plants and wastewater treatment plants do not contain C2H6. The C2H6-to-CH4 ratio of the gas samples taken directly at the gas collecting systems of these sources is zero within the errors and can be clearly separated from the natural gas samples (see Fig. 7).
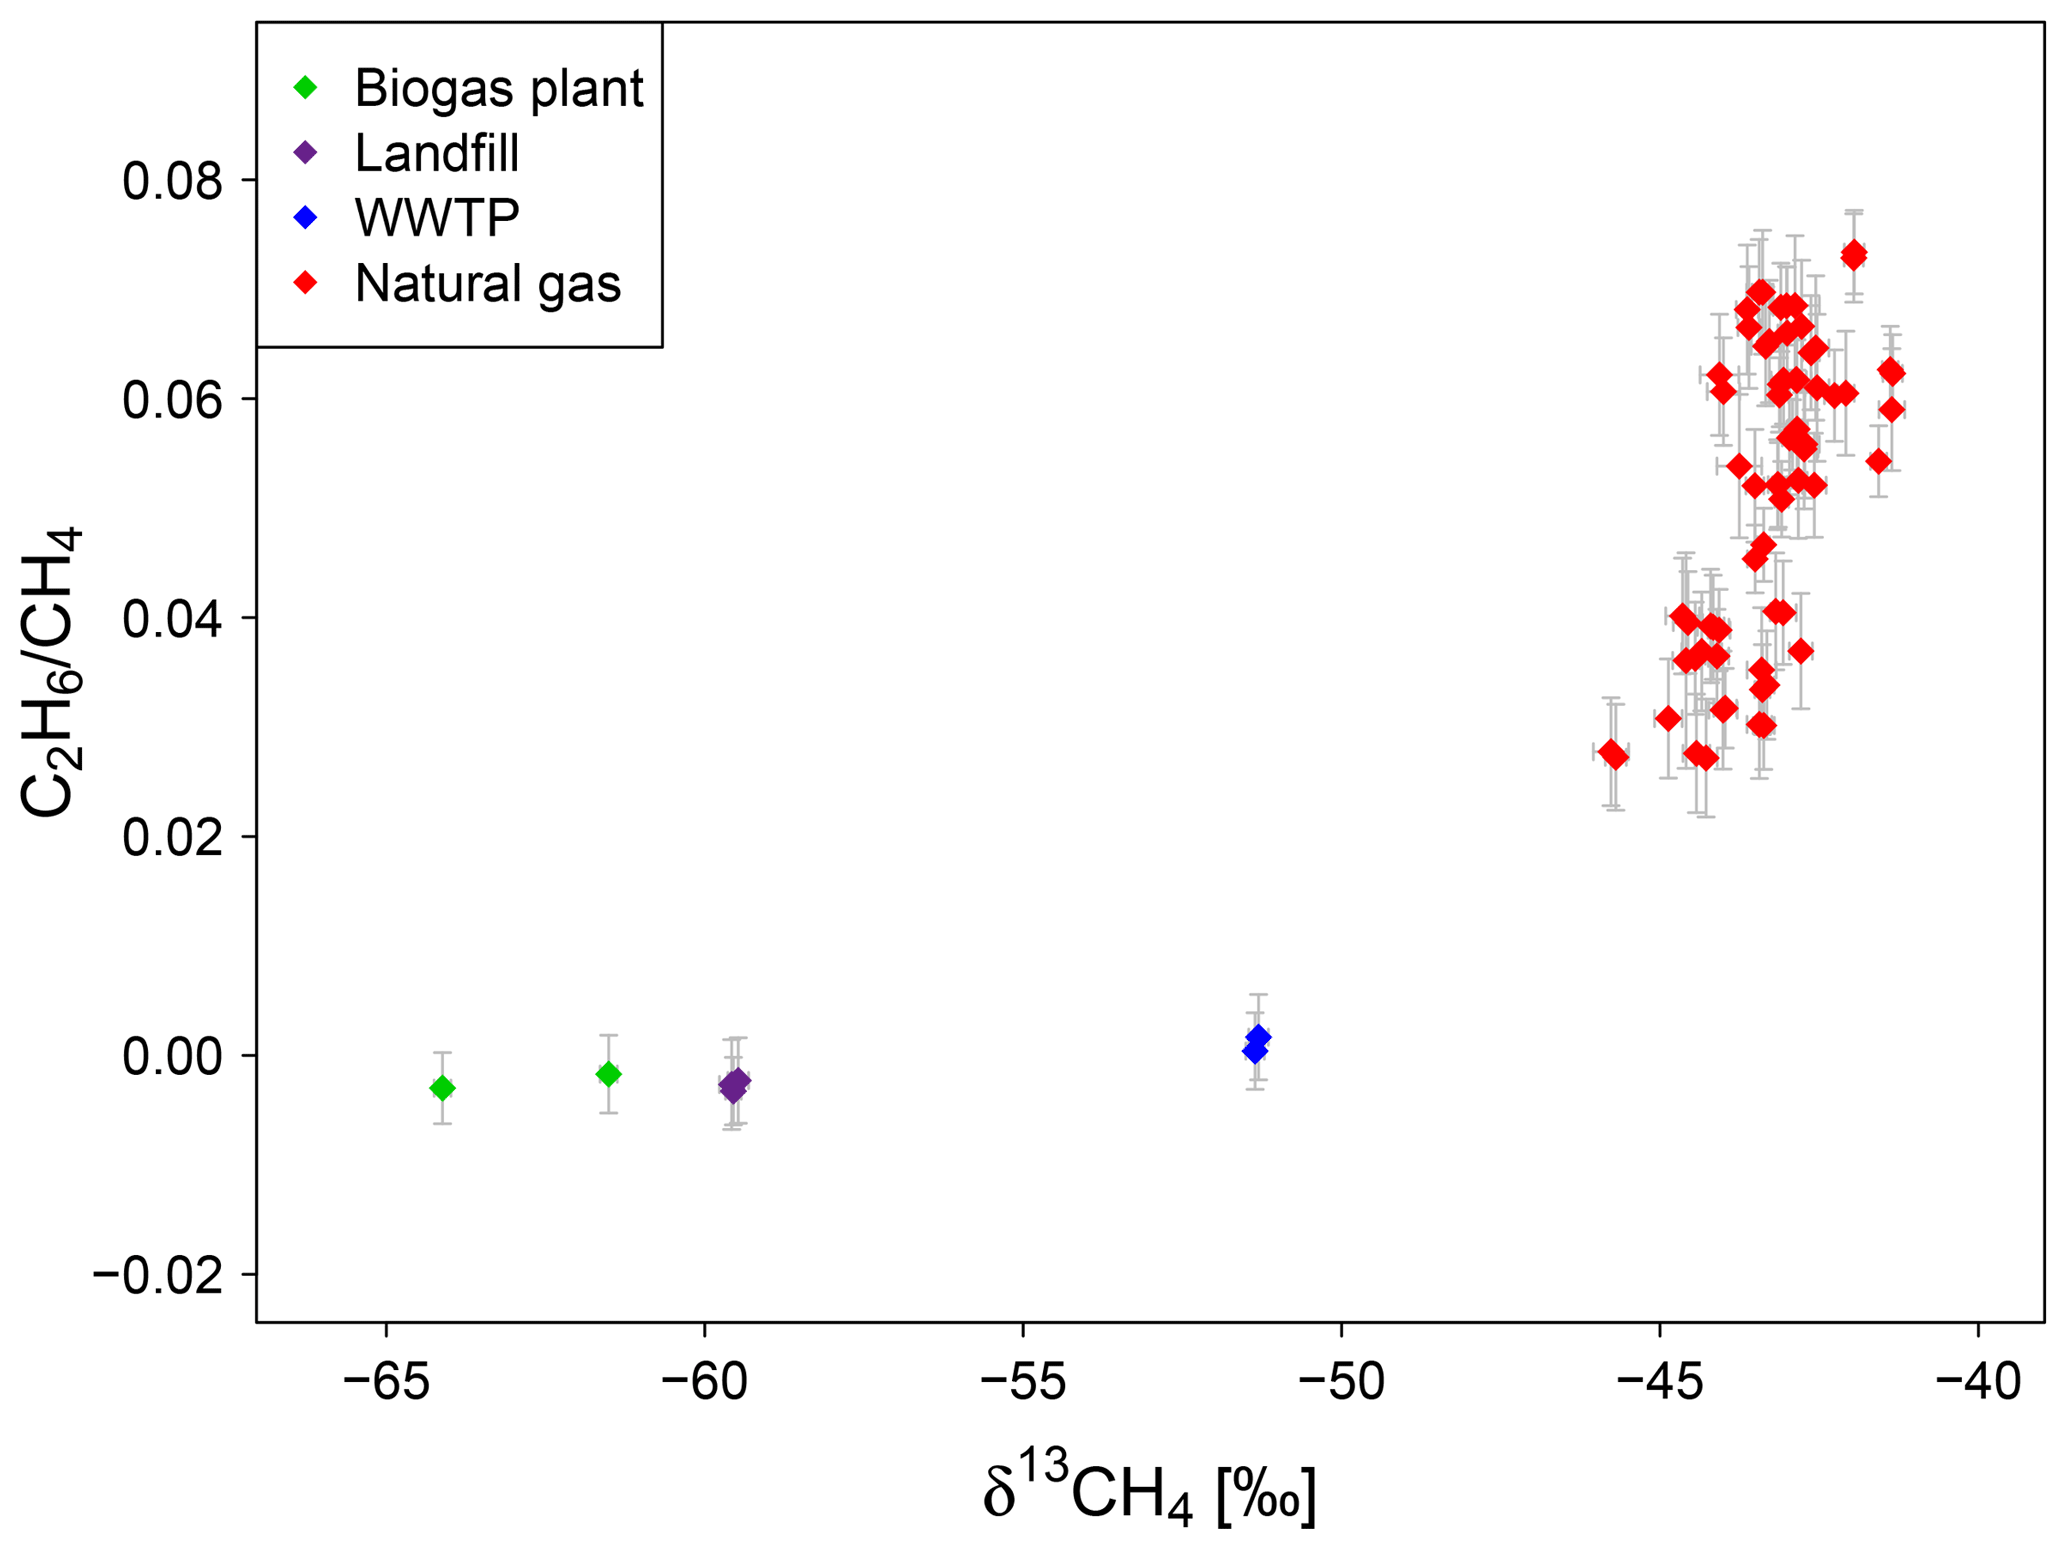
Figure 7Isotopic signature and C2H6-to-CH4 ratio of gas samples from a biogas plant, a landfill, a WWTP and the natural gas distribution system in Heidelberg measured between end of 2016 and November 2018.
The separation due to the C2H6-to-CH4 ratio works well with direct gas samples but unfortunately not for mobile AirCore measurements yet. In contrast to the direct sample measurement, in mobile AirCore measurements CH4 and C2H6 emitted by the source are diluted in the background. To determine the ratio, a linear fit of the measured C2H6 mole fraction to the measured CH4 mole fraction is used. However, due to the high uncertainty in the C2H6 measurement without averaging, as is possible for the direct sample measurement, in combination with the very small or non-existent changes in C2H6, the fit does not provide reasonable data.
Table 2Determined δ13CH4 signatures of CH4 sources.
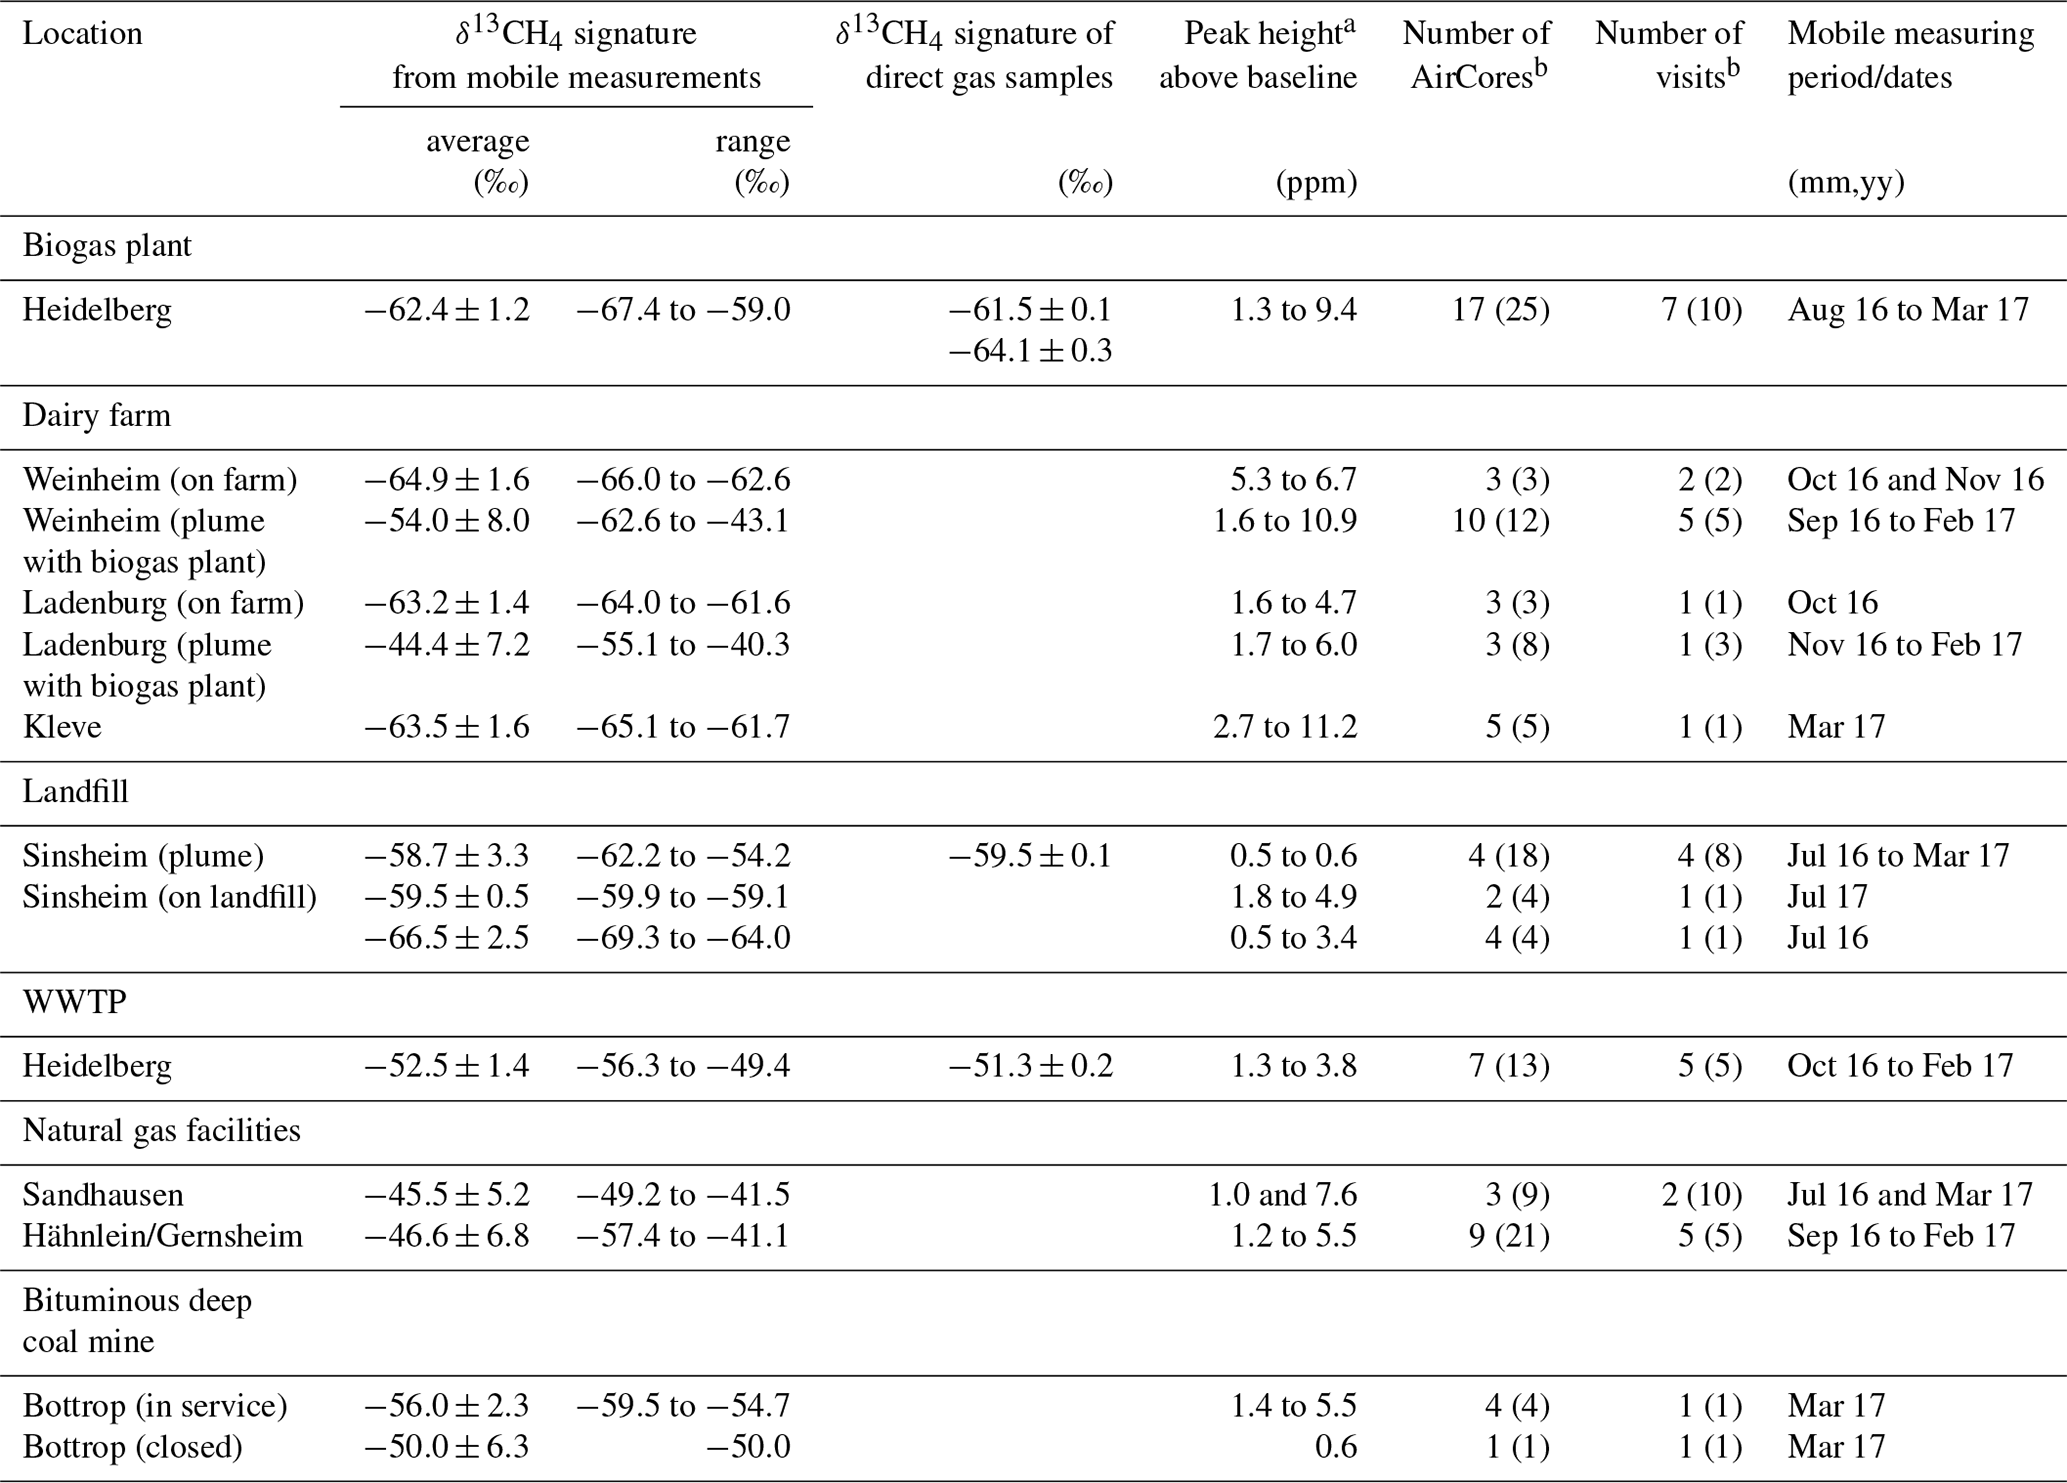
a The range of peak heights above baseline of the applied peaks measured with the AirCore. b AirCore measurements used and the corresponding visits. The number in brackets refer to all AirCore measurements and visits.
3.3 δ13CH4 source signatures from mobile measurements
The δ13CH4 signature for different CH4 sources (see Fig. 8) are determined from 135 plumes measured over 21 days while using the AirCore. For the evaluation, only 79 AirCore measurements with peak heights of more than 0.45 ppm above background and more than 25 data points were selected (see Sect. 2.3.2). During each measurement day, one to five AirCore measurements were carried out at selected CH4 sources, and the determined isotopic source signatures were averaged to daily means. For each source the daily mean values calculated for each visit were averaged (see Fig. 9 and Tables 2 and S1 in the Supplement).
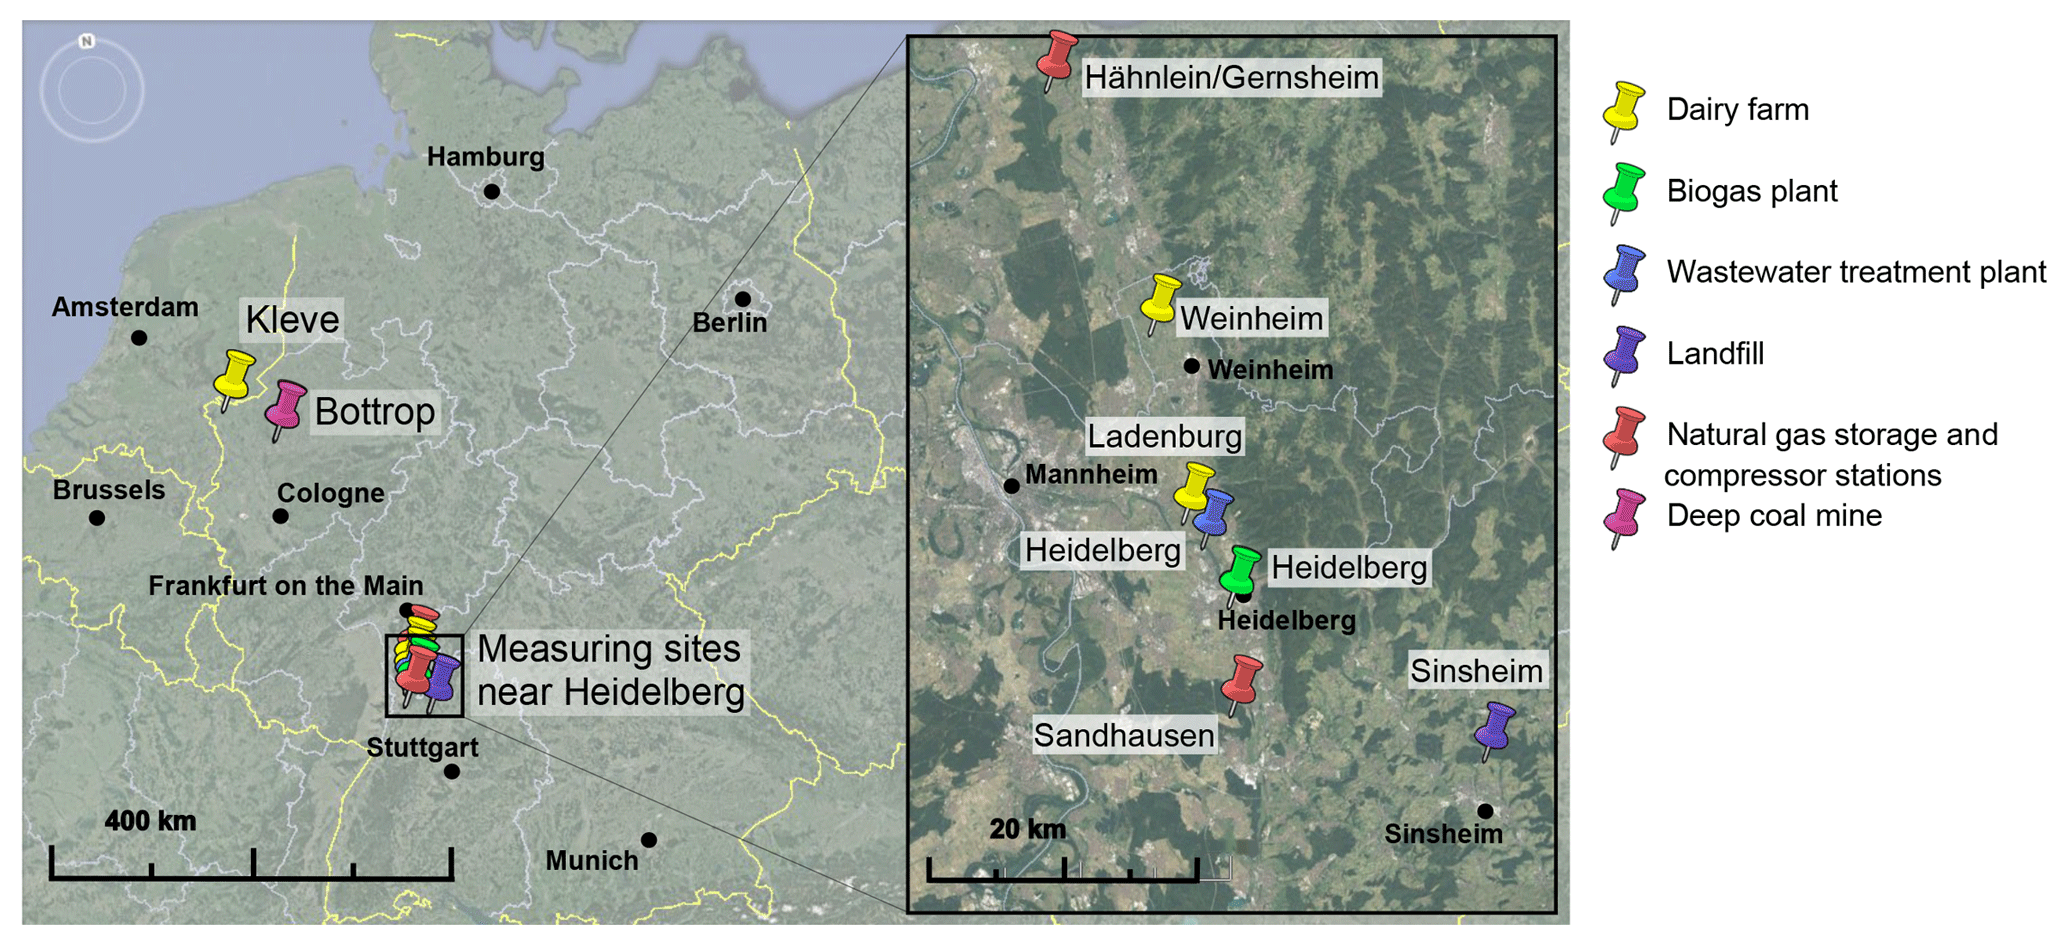
Figure 8Locations of the measuring sites. Map data: Google Earth, 2017 Google; Image Landsat/Copernicus, 2009 GeoBasis-DE/BKG, US Dept of State Geographer.
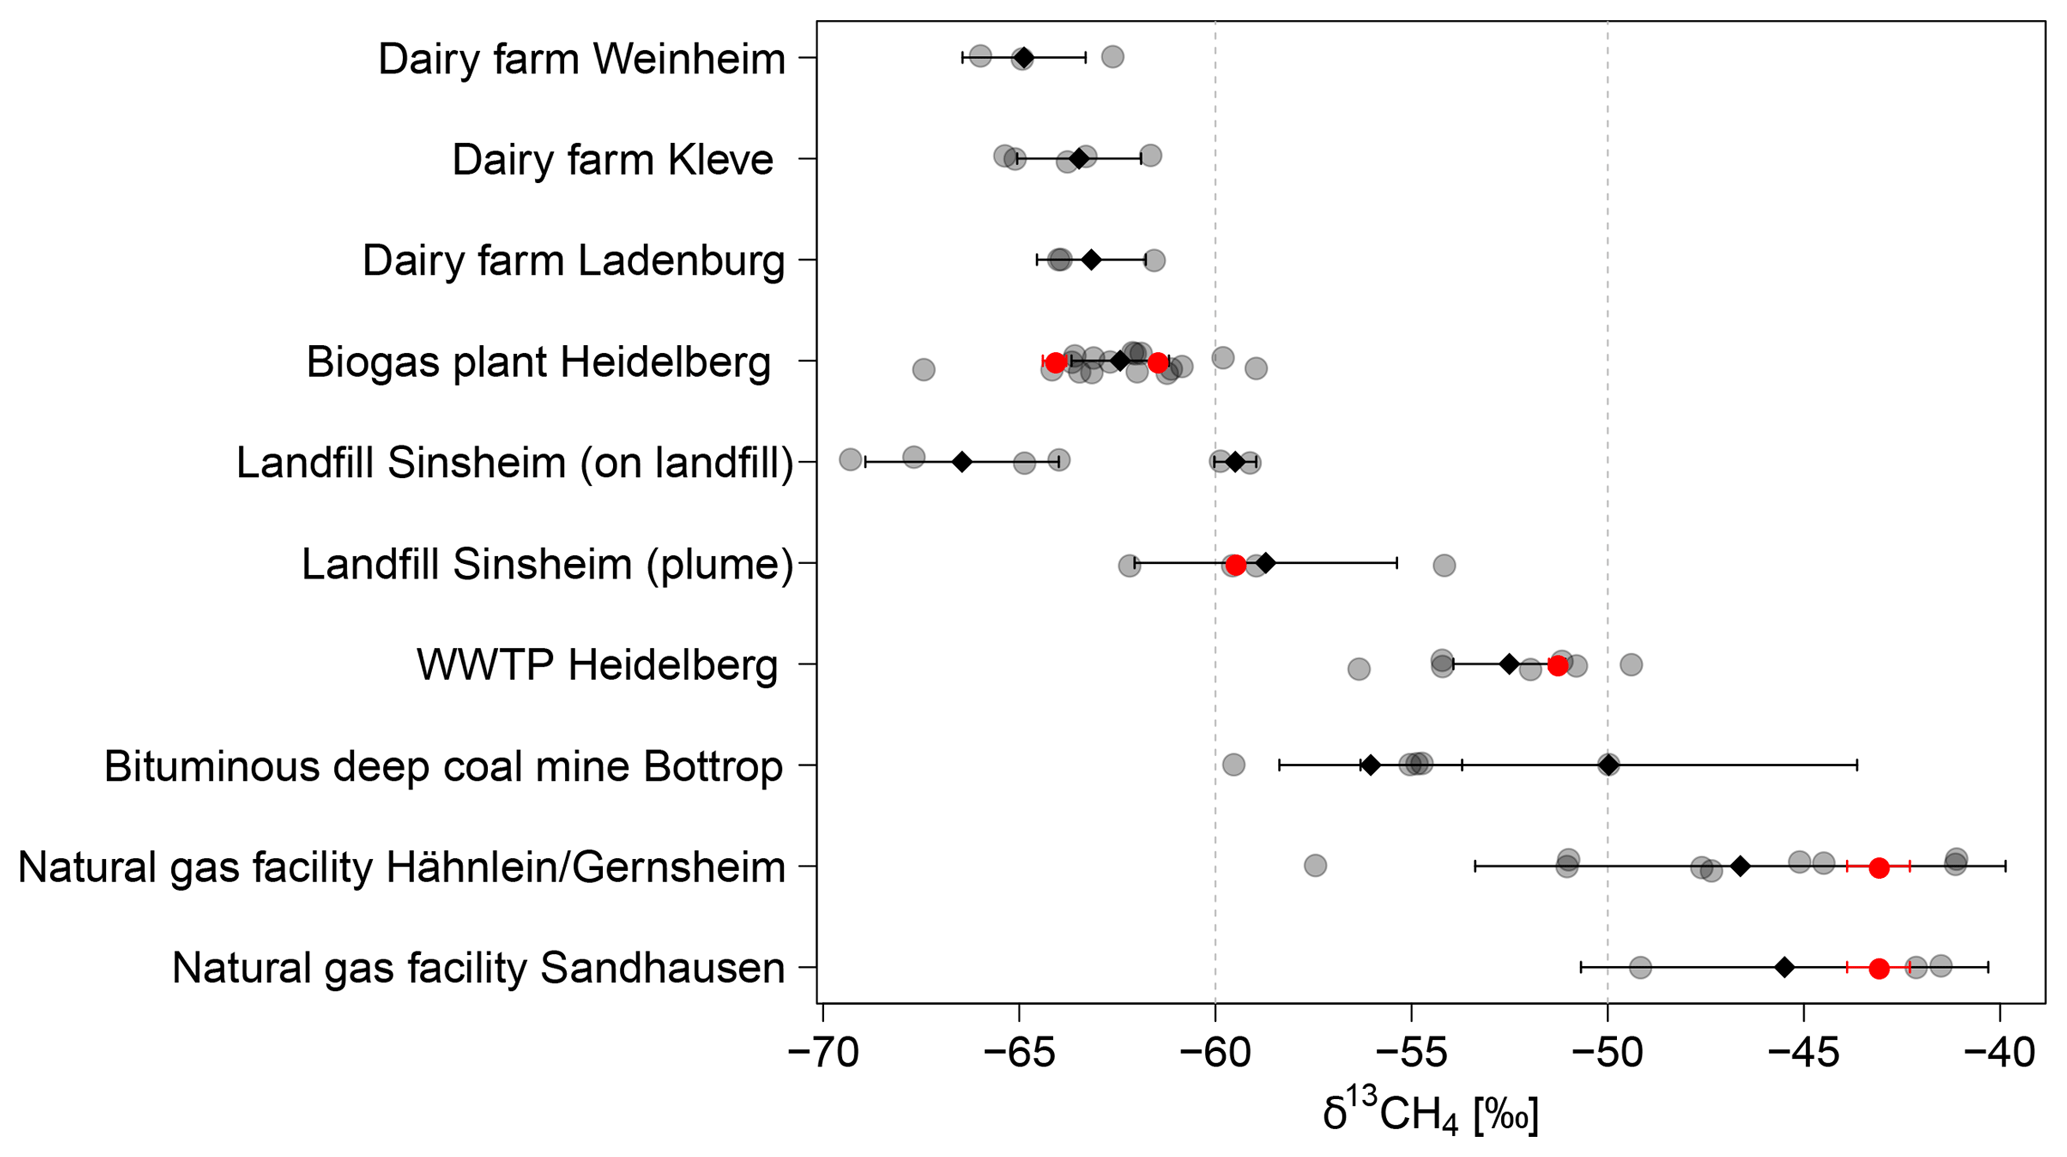
Figure 9δ13CH4 signature of CH4 sources. Each determined δ13CH4 signature is shown as a grey dot. The black diamond-shaped points show the average δ13CH4 signature with the standard deviation. The δ13CH4 signatures measured from gas samples taken at the different sites are plotted as red points. For both natural gas facilities, it was not possible to take direct samples. Here the red points indicate the mean δ13CH4 signature of natural gas in Heidelberg measured between end of 2016 and November 2018 as described in this study.
In the following the determined isotopic signatures of CH4 sources will be discussed for every measuring site and be compared with values from other studies and δ13CH4 signatures measured from gas samples taken at selected measuring sites.
3.3.1 Biogas plant
In biogas plants, microbial organisms produce CH4 under anaerobic conditions. The isotopic signature of CH4 in biogas can vary widely due to the substrate, the microbial producers of CH4 and kinetic values like temperature and frequency of feeding (Polag et al., 2015; personal communication Daniela Polag, 2017).
The biogas plant Pfistererhof in Heidelberg has two fermenter tanks. One is fed with a substrate mainly consisting of maize silage and the other predominantly of food waste. Gas samples from both fermenter tanks were taken and measured. The δ13CH4 signature of the produced biogas was for the maize-silage tank and for the food-waste tank. Therefore, the isotopic source signature determined from the measurement of the CH4 plume is expected to lie between the above-mentioned values because CH4 from both fermenter tanks is mixed downwind of the biogas plant.
Over 10 days, mobile measurements were carried out downwind of the biogas plant between August and December 2016 and in February and March 2017. The maximum CH4 mole fractions of the measured plumes varied between 2.5 and 17 ppm. Often multiple peaks were measured while driving through the plume, caused by several sources on the biogas plant. The isotopic signatures of CH4 emitted by the biogas plant were determined from 17 measured plumes. The values varied between −59.0 ‰ and −64.2 ‰ with one exception of −67.4 ‰, and the average δ13CH4 was . The determined isotopic signatures agree well with the isotopic signatures of the direct samples.
3.3.2 Dairy farms
The δ13CH4 source signature emitted at three dairy farms (in Ladenburg, Weinheim and Kleve) were characterised. The dairy farm in Weinheim holds 320 to 340 dairy cows and the one in Ladenburg holds 80 dairy cows. Haus Riswick in Kleve is an education and research centre of the Agricultural Chamber of North-Rhine Westphalia with 230 dairy cows in conventional livestock farming, 45 dairy cows in organic livestock farming, and more than 200 sheep and calves each. Feeding experiments and emission measurements were carried out (Schiefler, 2013; Schmithausen et al., 2016) in the largest dairy cowshed in Kleve (conventional dairy cowshed).
All three dairy farms have an associated biogas plant. This is not representative of Germany because most dairy farms do not have such a facility. In 2013 there were 285 000 agricultural holdings in Germany, 45.8 % of them were cattle farms including dairy cow farms. But only 2.2 % (6300) of all agricultural holdings had a biogas plant, and thus much less than 5 % of all cattle farms (including dairy cow farms) can have a biogas plant (Agrarstrukturerhebung, 2013).
Levin et al. (1993) showed that the isotopic signature of CH4 produced by cows strongly depends on the diet. Cows with a 100 % C3 () diet emit less enriched CH4 than cows with a 60 % to 80 % C4 diet (). In addition, CH4 emitted by liquid manure has a more depleted isotope ratio of .
The dairy cows in Weinheim are in the cowshed the entire time and are fed nearly identically throughout the year with 36 % C4 plants (maize) and 64 % C3 plants. Therefore, no strong variations in the determined δ13CH4 signature of CH4 would be expected. However, the values vary between −40 ‰ and −66 ‰. A more detailed inspection of the origin of the peaks showed a possible influence of the biogas plants placed on the farms. In Ladenburg and Weinheim most wind conditions made it impossible to separate between CH4 produced from the cows and from the biogas plant. To determine the CH4 emissions from the dairy cows and the cowshed, only AirCore measurements with distinct wind directions were used. These measurements were carried out directly next to the cowshed on the farm, where an influence of the biogas plant could be excluded.
In Weinheim only 3 of 15 plume measurements were used (September 2016 to February 2017) because during all other samplings an influence of the biogas plant cannot be excluded. These AirCore measurements were taken when driving directly across the farm. Therefore, the maximum CH4 mole fractions measured were relatively high with 8.3 to 8.9 ppm. The δ13CH4 signatures varied between −62.6 ‰ and −66.0 ‰ with an average of . For the 10 other AirCore measurements, CH4 emitted from the cowshed and the biogas plant cannot be separated. The resulting mean isotopic signature is spanning a range between −43.1 ‰ and −62.6 ‰. The plumes measured downwind of the dairy farm had CH4 mole fractions between 2.6 and 9 ppm with an average of 4.3 ppm.
Next to the dairy farm in Ladenburg, the plumes measured over 6 days between October 2016 and February 2017 most of the time had very small maximum CH4 mole fractions of 2.1 to 2.8 ppm (on average 2.4 ppm). As expected, due to fewer animals, the plumes were smaller than the ones measured near the dairy farm in Weinheim although the measurements were carried out closer to the source. Only on 1 day in November 2016 was a CH4 mole fraction of up to 8 ppm measured in the plume. The δ13CH4 signatures determined from three AirCore measurements taken when driving on the road next to the farm have values of around . For these measurements it was not possible to separate between CH4 emitted by the cows and by the biogas plant. To determine the isotopic signature of CH4 from the dairy cows and the cowshed alone, three AirCore measurements of the plume directly on the farm next to the cowshed were taken in October 2016, which had mole fractions up to 4.1 to 7.3 ppm. The determined δ13CH4 source signatures varied between −61.6 ‰ and −64.0 ‰ with an average of .
In Weinheim as well as in Ladenburg, the δ13CH4 signature of the whole farm (cowshed and biogas plant) is less depleted than the isotopic signature of the cowshed alone. Further experiments are needed to determine the isotopic signature of the biogas plants on dairy farms and the influence on the plume of the farm in total.
On 24 March 2017, five AirCore plume measurements were taken on the dairy farm in Kleve with maximum CH4 mole fractions between 4.7 and 13.6 ppm. The determined δ13CH4 signatures vary between −61.7 ‰ and −65.1 ‰, and the average is . The weather conditions made it possible to exclude an influence from the biogas plant. Two measurements were taken directly next to both the large cowshed with dairy cows of conventional farming and next to the organic cowsheds. The average isotopic signatures of CH4 emitted by the cowsheds of conventional and organic livestock, farming do not differ significantly. For conventional livestock the determined δ13CH4 signature is and for organic livestock . The fifth AirCore measurement was done on the downwind side of the farm ().
The average δ13CH4 signatures of all three dairy farms match each other and the isotopic signature expected from the results from Levin et al. (1993). It is important to note that the measured CH4 from the plume of cowsheds is a mixture of CH4 emitted by cows and manure.
3.3.3 Landfill
In addition to the source material and fractionation during the production the isotopic signature of gas emitted by landfills depends also on fractionation processes in the upper soil layers of the landfill. Due to the presence of oxygen in the upper soil layers, aerobic bacteria oxidise parts of CH4 which diffuses through the soil cover and shift the isotopic composition to more depleted values. Bergamaschi et al. (1998) measured these different isotopic signatures. They determined δ13CH4 signatures of different sample types from four German and Dutch landfills. For direct gas samples from the gas collecting system, they measured an isotopic signature of . Emission samples taken with static chambers at covered areas of the landfill showed, however, more enriched isotopic signatures of . Upwind–downwind measurements of CH4 around the landfill lead to an isotopic signature of .
In this study, the isotopic signature of CH4 emitted from a landfill with a disposal area of approximately 1.45 km2 which is located near Sinsheim, south-east of Heidelberg, was characterised. From 1978 to 1998 biodegradable domestic waste was deposited there. A degassing system collects the produced biogas, which is used to generate electricity (AVR, 2016). The landfill is covered in large parts by a final surface sealing, and during the measuring period construction work was underway to cover further parts.
Over 10 days from July to November 2016 and in March and July 2017, 26 plume measurements were performed. During this period the CH4 plume was measured twice on the landfill, and the other times, it was measured while driving on a public road next to it. The measured CH4 mole fractions of the plumes downwind of the landfill were relatively small with 2.1 to 2.7 ppm. Therefore, the δ13CH4 signature cannot be determined to a high accuracy. From 18 measured plumes only four can be used to determine the isotopic source signature precisely. The resulting values vary between −54.2 ‰ and −62.2 ‰. No seasonal variations were observed. The average is . This result is comparable to the upwind–downwind measurements of CH4 by Bergamaschi et al. (1998) and to the study of Zazzeri et al. (2015) in the UK with values between and , with an average of (2SD) ‰.
In July 2016 the CH4 mole fraction was measured directly on the landfill. With values of up to 6 ppm, the maximum measured mole fraction was higher than the ones measured downwind of the landfill. The average δ13CH4 signature is (−64.0 to −69.3 ‰). Nearly 1 year later, measurements were carried out on the landfill again. With (−59.9 ‰ and −59.1 ‰), the average δ13CH4 signature from two AirCore measurements is much more enriched and in good agreement with the measurements next to the landfill. The maximum CH4 mole fractions of the plumes, with values between 2.6 and 7.2 ppm, were again higher than the measurements downwind of the landfill.
Direct gas samples from the gas collecting system taken on the same day in July 2017 have an average isotopic signature of CH4 of . This value matches the isotope ratio of reported by Bergamaschi et al. (1998) for direct samples from the gas collecting system. Like Bergamaschi et al. (1998) the isotopic signature of CH4 in the gas collecting system is less enriched than the isotope ratio measured in the plume next to the landfill. The isotopic signature of CH4 determined from the plume on the landfill in July 2017 is the same as for the direct gas sample. The large CH4 peaks measured on the landfill seem to originate from the gas collecting system.
As previously mentioned, less enriched δ13CH4 signatures of −66 ‰ were determined from measurements carried out on the landfill in July 2016. Bergamaschi et al. (1998) measured such depleted δ13CH4 signatures of approximately −69 ‰, too, once for a gas sample from the gas collecting system and in one depth profile measurement. Our measurement may have been influenced by construction work which was underway on the landfill during the whole measurement period.
3.3.4 Wastewater treatment plant
Every year approximately 23 million m3 of wastewater is cleaned in the wastewater treatment plant (WWTP) in Heidelberg. During our field campaigns mobile measurements were carried out next to the southern part. There, the sludge treatment inside the digestion towers takes place in three septic tanks with a volume of 2500 m3 each, under anaerobic mesophilic conditions, which means without oxygen at 37 ∘C. The produced sewage gas consists predominantly of CH4 and is collected to be utilised in a block heating station (Abwasserzweckverband Heidelberg, 2017).
In February 2017 two gas samples of the collected gas were taken from the WWTP and were analysed in the laboratory. The average δ13CH4 signature of the gas produced in the WWTP is . In total, 13 plume measurements next to the WWTP were taken over 5 days in October 2016 to February 2017. The maximum CH4 mole fractions of the plumes varied between 2.4 and 8.5 ppm. The isotopic signature for the seven plume measurements used are within the range of −49.4 ‰ to −56.3 ‰ with an average of . This agrees well with the results of Zazzeri (2016), who reported isotopic signatures of CH4 between −48.1 ‰ to −59.2 ‰ for wastewater treatment emissions.
3.3.5 Natural gas facilities
Besides the direct sampling of natural gas in Heidelberg (see Sect. 3.1) the plumes at two natural gas facilities were measured to determine the isotopic signature of CH4 from natural gas in the region of Heidelberg. Between July 2016 and March 2017, the CH4 mole fraction around the natural gas storage site in Sandhausen was measured over 10 days. Except for 2 days, the CH4 mole fraction of the plumes was lower than 2.15 ppm, and four times no significant changes in CH4 could be measured at all. On these 2 days the maximum CH4 mole fraction of the plume was higher with values between 2.3 and 10 ppm, so that the isotopic source signature could be determined with the Miller–Tans approach. The resulting δ13CH4 signature was on average and (two AirCores) on one day and (one AirCore) on the other day. The natural gas storage in Sandhausen probably only emitted small amounts of CH4 except during some events, making it difficult to sample.
Between Hähnlein and Gernsheim, a natural gas storage, compressor stations and other natural gas facilities were placed together on one site. Over 5 days between September 2016 and February 2017, mobile measurements were carried out next to this site and showed that natural gas escaped at different locations. Contrary to the natural gas storage in Sandhausen, the measured CH4 plumes had maximum CH4 mole fractions between 2.2 ppm and 6 ppm, but some plumes even reached 6 to 25 ppm. The emissions from these natural gas facilities are not negligible and seem to be highly heterogeneous. The determined δ13CH4 signature of the CH4 plumes was between −41.1 ‰ and −57.4 ‰. The average was and thus a little bit less enriched than the isotopic signatures of CH4 measured in Sandhausen and than the natural gas samples taken in Heidelberg (). The location of this natural gas facility may be the explanation for more depleted values because the gas pipeline MEGAL directly passes this site and has a compressor station there. MEGAL runs from the border of the Czech Republic to France and mainly transports Russian natural gas, which has a more depleted isotopic signature.
3.3.6 Coal mines
On 25 March 2017 the emitted CH4 mole fractions from bituminous deep coal mines in Bottrop were measured. In particular, the plume of one closed mine shaft and two that are still in service was measured. In the plume of the closed mine shaft the maximum CH4 mole fraction measured was between 2.2 and 2.6 ppm, while for the mine shafts in service mole fractions between 3 and 7.5 ppm were detected, although the mobile measurements were carried out much closer to the closed mine shaft. It seems that the CH4 emissions from mine shafts in service are larger than from closed ones. The δ13CH4 signature of the closed mine shaft is while for the active mine shafts the average δ13CH4 signature is (−54.7 to −59.5 ‰). However, only one AirCore was measured for the closed mine shaft and the error of the isotopic source signature is larger than our criterion of 5 ‰. The determined isotope ratios of CH4 in Bottrop are less depleted than the values of the coal bed gas samples from Bottrop (−47.1 ‰ to −52.4 ‰) measured by Thielemann et al. (2004). However, the values are similar to the average isotope ratio of CH4 of −55 ‰ measured for CH4 from bituminous coal in deep mines by Zazzeri et al. (2016).
On 23 March 2017 mobile measurements of CH4 were carried out in the area around the lignite opencast mines Hambach and Garzweiler. However, no CH4 emitted directly by the opencast mines could be detected. Around the opencast mine Hambach, the CH4 mole fraction varied only slightly between 1.94 and 1.98 ppm when we measured upwind as well as downwind of the pit. Therefore, it was not possible to identify an emission peak. High CH4 mole fractions were only measured at two locations next to the opencast pit. However, the two detected CH4 plumes were measured upwind of the opencast mine and thus did not originate from the pit itself, but from the drainage system. The maximum CH4 mole fractions measured were between 3 and 7.5 ppm. The δ13CH4 signature of the measured CH4 is between −79.7 ‰ and −84.8 ‰ with an average of . These extremely depleted values indicate that the measured CH4 is of microbial origin and thus is probably produced by CO2 reduction similarly to one gas sample measured by Thielemann et al. (2004) with values of −85.1 ‰ to −85.9 ‰.
We have developed and tested a mobile instrument set-up to determine the δ13CH4 signature by measuring the plume of different CH4 sources. The advantage of such a mobile application is that measurements can be performed downwind of the emission source and therefore outside of any industrial installation such as a gas compressor station or landfill without the consent of the owners. For accurate results, a carefully characterisation of each individual analyser, especially the cross sensitivities of C2H6, and the drying of air prior to the measurement is required. To reduce the H2O mole fraction below 0.1 %, a Nafion dryer was installed in the mobile set-up and the cross sensitivity between C2H6 and the measurement of δ13CH4 was corrected as shown in Fig. 3. Especially for natural gas samples, the precise determination and correction of C2H6 is important as in our study C2H6 can bias δ13CH4 by up to 3 ‰ depending on the CH4-to-C2H6 ratio of the sample and the calibration cylinder.
For the precise determination of the isotopic signature of different CH4 sources, we use the Miller–Tans approach together with a York fit for most accurate results. There are three major limitations to the precise determination of the δ13CH4 source signature: the number of data points during plume crossing, the measured mole fraction enhancement and the precision of the analyser for isotope analysis. The number of data points limits the accuracy as the uncertainty decreases with an increasing number of data points. To enlarge the amount of points, the measurement should be carried out while driving as slowly as possible through the plume and then the plume should be remeasured using the AirCore. It is important to use the AirCore because it is a simple option to reduce the uncertainty by more than half. The most important limitation of the δ13CH4 source signature is the plume mole fraction above background. Measured plumes with a peak height above background smaller than 0.45 ppm have uncertainties larger than 5 ‰ and thus are not used in this study. Driving as close as possible to the source increases the CH4 mole fraction. However, where it is not possible, or the increase is not enough, the isotopic signature of the source cannot be determined with sufficient precision with this method. To get better results even for smaller enhancements, more precise instruments are required in the future.
In this study, the δ13CH4 signature of CH4 emitted from a biogas plant, a landfill, dairy farms, a wastewater treatment plant, natural gas storage and compressor stations, and bituminous deep mines were determined. The δ13CH4 signatures measured during mobile campaigns are in good agreement with the measured isotope ratios from direct samples taken at some of the CH4 sources and with values from other studies. Thus, this method provides an opportunity to characterise the CH4 emissions from a source where it is not possible or it is difficult to take direct samples, for example, from an industrial site without the authorisation of the operating company or from a large area where CH4 emits heterogeneously at multiple unknown positions. Gas samples from Heidelberg city gas supply from December 2016 to November 2018 confirm a change in the natural gas mixture, especially of Russian and North Sea gas. In previous years (1991 to 1996) strong seasonal variations in δ13CH4 were measured, whereas recently the isotopic signature is nearly constant throughout the year. In addition, the average is approximately 3 ‰ more depleted than in the 1990s.
δ13CH4 source signatures determined for each AirCore measurement are available in Table S1 and on request to the corresponding authors.
The supplement related to this article is available online at: https://doi.org/10.5194/amt-12-1123-2019-supplement.
AH performed the tests of the CRDS analyser to correct the δ13CH4 measurement, carried out the mobile measurements and analysed the data. FD and CY characterised the analyser, and HE helped with the field and sample measurements. AH prepared the manuscript with contributions from all co-authors. MS acquired funding, provided general guidance to the research, and assisted in writing and revising the paper.
The authors declare that they have no conflict of interest.
The authors thank Michael Sabasch and Ingeborg Levin for calibration of standard gases and Simone Wald for testing natural gas sample measurement. We thank Roland and Adelheid Pfisterer from biogas plant Pfistererhof and Klaus Erdmann, Richard Schröder and Bernd Schulz from Milchhof Weinheim for their help during our visits. Special thanks to Alexander Schmithausen from the University of Bonn, who welcomed us at Haus Riswick in Kleve, for the visit and helpful discussions. The support from Christoph Blumenthal from AVR Kommunal GMbH was appreciated. Evan Border and Ellis King are acknowledged for proofreading this article.
The CRDS analyser was funded through the DFG excellence initiative II. We are grateful to the MEMO2 project (Marie Sklodowska-Curie grant agreement no. 722479), which supported the measurement campaign to North Rhine-Westphalia.
We acknowledge financial support by Deutsche Forschungsgemeinschaft within
the funding programme Open Access Publishing, by the Baden-Württemberg
Ministry of Science, Research and the Arts and by Ruprecht-Karls-Universität
Heidelberg.
Edited by: Thomas Röckmann
Reviewed by: three anonymous referees
Abwasserzweckverband Heidelberg: Klärwerk Süd/Neue Erfolgsgeschichte, available at: http://www.azv-heidelberg.de/2_02_01_kwsued.htm, last access: 8 March 2018. a
Agrarstrukturerhebung: Land und Forstwirtschaft, Fischerei – Viehaltung der Betriebe, Fachserie 3 Reihe 2.1.3, Statistisches Bundesamt (Destatis), 2016 and Land und Forstwirtschaft, Fischerei – Landwirtschaftliche Betriebe mit Anlagen zur Nutzung erneuerbarer Energien, Statistisches Bundesamt (Destatis), 2013, available at: https://www.destatis.de/DE/Publikationen/Thematisch/LandForstwirtschaft/Betriebe/Argrarstukturerhebung.html (last access: 13 February 2019), 2013. a
Assan, S., Baudic, A., Guemri, A., Ciais, P., Gros, V., and Vogel, F. R.: Characterization of interferences to in situ observations of δ13CH4 and C2H6 when using a cavity ring-down spectrometer at industrial sites, Atmos. Meas. Tech., 10, 2077–2091, https://doi.org/10.5194/amt-10-2077-2017, 2017. a, b, c, d
AVR: Deponien Sinsheim und Wiesloch, available at: https://www.avr-kommunal.de/data/mediapool/2016_deponien_sinsheim_und_wiesloch.pdf (last access: 8 March 2018), 2016. a
Bundesamt für Wirtschaft und Ausfuhrkontrolle (BAFA): Entwicklung des deutschen Gasmarktes (monatliche Bilanz 1998–2016, Einfuhr seit 1960), available at: http://www.bafa.de/DE/Energie/Rohstoffe/Erdgas/erdgas_node.html, last access: 29 June 2017. a, b
Bergamaschi, P., Lubina, C., Königstedt, R., Fischer, H., Veltkamp, A. C., and Zwaagstra, O.: Stable isotopic signatures (δ13C, δD) of methane from European landfill sites, J. Geophys. Res.-Atmos., 103, 8251–8265, https://doi.org/10.1029/98jd00105, 1998. a, b, c, d, e
Cramer, B., Poelchau, H. S., Gerling, P., Lopatin, N. V., and Littke, R.: Methane released from groundwater: the source of natural gas accumulations in northern West Siberia, Mar. Petrol. Geol., 16, 225–244, https://doi.org/10.1016/s0264-8172(98)00085-3, 1999. a
Dinger, F.: Characterisation of a Cavity Ring-Down Spectrometer for measuring CO2, CH4, δ13CO2, and δ13CH4 in ambient air, MS thesis, Heidelberg University, Germany, 2014. a
Dlugokencky, E. J., Myers, R. C., Lang, P. M., Masarie, K. A., Crotwell, A. M., Thoning, K. W., Hall, B. D., Elkins, J. W., and Steele, L. P.: Conversion of NOAA atmospheric dry air CH4 mole fractions to a gravimetrically prepared standard scale, J. Geophys. Res.-Atmos., 110, D18306, https://doi.org/10.1029/2005jd006035, 2005. a
Dlugokencky, E. J., Bruhwiler, L., White, J. W. C., Emmons, L. K., Novelli, P. C., Montzka, S. A., Masarie, K. A., Lang, P. M., Crotwell, A. M., Miller, J. B., and Gatti, L. V.: Observational constraints on recent increases in the atmospheric CH4 burden, Geophys. Res. Lett., 36, L18803, https://doi.org/10.1029/2009gl039780, 2009. a
Fisher, R., Lowry, D., Wilkin, O., Sriskantharajah, S., and Nisbet, E. G.: High-precision, automated stable isotope analysis of atmospheric methane and carbon dioxide using continuous-flow isotope-ratio mass spectrometry, Rapid Commun. Mass Spectrom., 20, 200–208, https://doi.org/10.1002/rcm.2300, 2006. a
Glatzel-Mattheier, H.: Bilanzierung von CH4-Emissionen in Deutschland anhand atmosphärischer Messungen in Heidelberg, PhD thesis, University of Heidelberg, Germany, 1997. a, b
Hoheisel, A.: Characterization of a CRDS Analyzer and Determination of Isotopic Signatures of Anthropogenic CH4 Sources Using Mobile Measurements, MS thesis, Heidelberg University, Germany, 2017. a
Karion, A., Sweeney, C., Tans, P., and Newberger, T.: AirCore: An Innovative Atmospheric Sampling System, J. Atmos. Ocean. Tech., 27, 1839–1853, https://doi.org/10.1175/2010jtecha1448.1, 2010. a
Keeling, C. D.: The concentration and isotopic abundances of atmospheric carbon dioxide in rural areas, Geochim. Cosmochim. Ac., 13, 322–334, https://doi.org/10.1016/0016-7037(58)90033-4, 1958. a
Levin, I., Bergamaschi, P., Dörr, H., and Trapp, D.: Stable isotopic signature of methane from major sources in Germany, Chemosphere, 26, 161–177, https://doi.org/10.1016/0045-6535(93)90419-6, 1993. a, b
Levin, I., Glatzel-Mattheier, H., Marik, T., Cuntz, M., Schmidt, M., and Worthy, D. E.: Verification of German methane emission inventories and their recent changes based on atmospheric observations, J. Geophys. Res.-Atmos., 104, 3447–3456, https://doi.org/10.1029/1998jd100064, 1999. a, b, c, d, e, f, g
Lopez, M., Sherwood, O. A., Dlugokencky, E. J., Kessler, R., Giroux, L., and Worthy, D. E. J.: Isotopic signatures of anthropogenic CH4 sources in Alberta, Canada, Atmos. Environ., 164, 280–288, https://doi.org/10.1016/j.atmosenv.2017.06.021, 2017. a, b
Lowry, D., Holmes, C. W., Rata, N. D., O'Brien, P., and Nisbet, E. G.: London methane emissions: Use of diurnal changes in concentration and δ13C fo identify urban sources and verify inventories, J. Geophys. Res.-Atmos., 106, 7427–7448, https://doi.org/10.1029/2000jd900601, 2001. a, b
Miller, J. B. and Tans, P. P.: Calculating isotopic fractionation from atmospheric measurements at various scales, Tellus B, 55, 207–214, https://doi.org/10.1034/j.1600-0889.2003.00020.x, 2003. a, b
Nisbet, E. G., Dlugokencky, E. J., Manning, M. R., Lowry, D., Fisher, R. E., France, J. L., Michel, S. E., Miller, J. B., White, J. W. C., Vaughn, B., Bousquet, P., Pyle, J. A., Warwick, N. J., Cain, M., Brownlow, R., Zazzeri, G., Lanoiselle, M., Manning, A. C., Gloor, E., Worthy, D. E. J., Brunke, E. G., Labuschagne, C., Wolff, E. W., and Ganesan, A. L.: Rising atmospheric methane: 2007-2014 growth and isotopic shift, Global Biogeochem. Cy., 30, 1356–1370, https://doi.org/10.1002/2016gb005406, 2016. a
Nitschke-Kowsky, P., Schenk, J., Schley, P. and Altfeld, K.: Gasbeschaffenheit in Deutschland: Was zum Wobbe-Index gesagt werden muss, gwf-Gas|Erdgas, 6, 440–445, 2012. a, b
Phillips, N. G., Ackley, R., Crosson, E. R., Down, A., Hutyra, L. R., Brondfield, M., Karr, J. D., Zhao, K., and Jackson, R. B.: Mapping urban pipeline leaks: Methane leaks across Boston, Environ. Pollut., 173, 1–4, https://doi.org/10.1016/j.envpol.2012.11.003, 2013.
Polag, D., May, T., Müller, L., König, H., Jacobi, F., Laukenmann, S., and Keppler, F.: Online monitoring of stable carbon isotopes of methane in anaerobic digestion as a new tool for early warning of process instability, Bioresource Technol., 197, 161–170, https://doi.org/10.1016/j.biortech.2015.08.058, 2015. a
Rice, A. L., Butenhoff, C. L., Teama, D. G., Roger, F. H., Khalil, M. A. K., and Rasmussen, R. A.: Atmospheric methane isotopic record favors fossil sources flat in 1980s and 1990s with recent increase, P. Natl. Acad. Sci. USA, 113, 10791–10796, https://doi.org/10.1073/pnas.1522923113, 2016. a
Rigby, M., Montzka, S. A., Prinn, R. G., White, J. W. C., Young, D., O'Doherty, S., Lunt, M. F., Ganesan, A. L., Manning, A. J., Simmonds, P. G., Salameh, P. K., Harth, C. M., Muhle, J., Weiss, R. F., Fraser, P. J., Steele, L. P., Krummel, P. B., McCulloch, A., and Park, S.: Role of atmospheric oxidation in recent methane growth, P. Natl. Acad. Sci. USA, 114, 5373–5377, https://doi.org/10.1073/pnas.1616426114, 2017. a
Röckmann, T., Eyer, S., van der Veen, C., Popa, M. E., Tuzson, B., Monteil, G., Houweling, S., Harris, E., Brunner, D., Fischer, H., Zazzeri, G., Lowry, D., Nisbet, E. G., Brand, W. A., Necki, J. M., Emmenegger, L., and Mohn, J.: In situ observations of the isotopic composition of methane at the Cabauw tall tower site, Atmos. Chem. Phys., 16, 10469–10487, https://doi.org/10.5194/acp-16-10469-2016, 2016. a
Rella, C. W., Hoffnagle, J., He, Y., and Tajima, S.: Local- and regional-scale measurements of CH4, δ13CH4, and C2H6 in the Uintah Basin using a mobile stable isotope analyzer, Atmos. Meas. Tech., 8, 4539–4559, https://doi.org/10.5194/amt-8-4539-2015, 2015. a, b, c, d, e, f, g, h
Schaefer, H., Fletcher, S. E. M., Veidt, C., Lassey, K. R., Brailsford, G. W., Bromley, T. M., Dlugokencky, E. J., Michel, S. E., Miller, J. B., Levin, I., Lowe, D. C., Martin, R. J., Vaughn, B. H., and White, J. W. C.: A 21st-century shift from fossil-fuel to biogenic methane emissions indicated by (CH4)-C-13, Science, 352, 80–84, https://doi.org/10.1126/science.aad2705, 2016. a
Schiefler, I.: Greenhouse gas and ammonia emissions from dairy barns, PhD thesis, Landwirtschaftlichen Fakultät der Rheinischen Friedrich-Wilhelms-Universität Bonn, Germany, 2013. a
Schmithausen, A. J., Trimborn, M., and Buscher, W.: Methodological Comparison between a Novel Automatic Sampling System for Gas Chromatography versus Photoacoustic Spectroscopy for Measuring Greenhouse Gas Emissions under Field Conditions, Sensors, 16, 1638, https://doi.org/10.3390/s16101638, 2016. a
Sherwood, O. A., Schwietzke, S., Arling, V. A., and Etiope, G.: Global Inventory of Gas Geochemistry Data from Fossil Fuel, Microbial and Burning Sources, version 2017, Earth Syst. Sci. Data, 9, 639–656, https://doi.org/10.5194/essd-9-639-2017, 2017. a
Sperlich, P., Uitslag, N. A. M., Richter, J. M., Rothe, M., Geilmann, H., van der Veen, C., Röckmann, T., Blunier, T., and Brand, W. A.: Development and evaluation of a suite of isotope reference gases for methane in air, Atmos. Meas. Tech., 9, 3717–3737, https://doi.org/10.5194/amt-9-3717-2016, 2016. a
Thielemann, T., Cramer, B., and Schippers, A.: Coalbed methane in the Ruhr Basin, Germany: a renewable energy resource?, Org. Geochem., 35, 1537–1549, https://doi.org/10.1016/j.orggeochem.2004.05.004, 2004. a, b
Turner, A. J., Frankenbergb, C., Wennberg, P. O., and Jacob, D. J.: Ambiguity in the causes for decadal trends in atmospheric methane and hydroxyl, P. Natl. Acad. Sci. USA, 114, 5367–5372, https://doi.org/10.1073/pnas.1616020114, 2017. a
Wehr, R. and Saleska, S. R.: The long-solved problem of the best-fit straight line: application to isotopic mixing lines, Biogeosciences, 14, 17-29, https://doi.org/10.5194/bg-14-17-2017, 2017. a, b, c
Welp, L. R., Keeling, R. F., Weiss, R. F., Paplawsky, W., and Heckman, S.: Design and performance of a Nafion dryer for continuous operation at CO2 and CH4 air monitoring sites, Atmos. Meas. Tech., 6, 1217–1226, https://doi.org/10.5194/amt-6-1217-2013, 2013. a
Werle, P., Mücke, R., and Slemr, F.: The limits of signal averaging in atmospheric trace-gas monitoring by tunable diode-laser absorption spectroscopy (TDLAS), Appl. Phys. B, 57, 131–139, 10.1007/bf00425997, 1993. a
Yeman, C.: Quantifying emission rates and isotopic signatures of methane sources using a mobile CRDS analyzer, MS thesis, Heidelberg University, Germany, 2015. a
York, D., Evensen, N. M., Martinez, M. L., and Delgado, J. D.: Unified equations for the slope, intercept, and standard errors of the best straight line, Am. J. Phys., 72, 367–375, https://doi.org/10.1119/1.1632486, 2004. a
Zazzeri, G: Methane Emissions in UK: Deciphering Regional Sources with Mobile Measurements and Isotopic Characterisation, PhD thesis, Royal Holloway, University of London, 2016. a
Zazzeri, G., Lowry, D., Fisher, R. E., France, J. L., Lanoisellé, M., and Nisbet, E. G.: Plume mapping and isotopic characterisation of anthropogenic methane sources, Atmos. Environ., 110, 151–162, https://doi.org/10.1016/j.atmosenv.2015.03.029, 2015. a, b
Zazzeri, G., Lowry, D., Fisher, R. E., France, J. L., Lanoisellé, M., Kelly, B. F. J., Necki, J. M., Iverach, C. P., Ginty, E., Zimnoch, M., Jasek, A., and Nisbet, E. G.: Carbon isotopic signature of coal-derived methane emissions to the atmosphere: from coalification to alteration, Atmos. Chem. Phys., 16, 13669–13680, https://doi.org/10.5194/acp-16-13669-2016, 2016. a