the Creative Commons Attribution 4.0 License.
the Creative Commons Attribution 4.0 License.
The ICAD (iterative cavity-enhanced DOAS) method
Martin Horbanski
Denis Pöhler
Johannes Lampel
Ulrich Platt
Cavity-enhanced differential optical absorption spectroscopy (CE-DOAS or BB-CEAS DOAS) allows us to make in situ measurements while maintaining the kilometre-long light paths required by DOAS. This technique has been successfully used for several years to measure in situ atmospheric trace gases. A property of optical cavities is that in the presence of strong absorbers or scatterers the light path is reduced, in contrast to classical long-path DOAS measurements where the light path is fixed. Typical CE-DOAS or BB-CEAS evaluation schemes correct this effect using the measured total light intensity attenuation. This makes them sensitive to any variations in the light intensity not arising from the trace gas absorption. That means an important DOAS advantage, to be independent of total light intensity, is actually lost. In order to cope with this problem, the instrument setup would require a thorough stabilisation of the light source and a very rigid mechanical setup, which would make instrumentation more complex and error prone.
We present a new approach to cavity-enhanced (CE) DOAS based on an iterative algorithm (ICAD) which actually models the light path reduction from the derived absorbers in the optical resonator. It allows a sensitive and robust data analysis that does not depend on the total light intensity, allowing a simpler and more compact instrument setup. The algorithm is discussed and simulated measurements demonstrate its sensitivity and robustness. Furthermore, a new ICAD NO2 instrument is presented. It takes advantage of the advanced data evaluation to build a compact (50 cm cavity) and lightweight instrument (<10 kg) with low power consumption (25 W) for sensitive measurements of NO2 with a detection limit of 0.02 ppbv at an averaging time of 7 min. The instrument is characterised with a NO2 calibration source and good long-term stability is demonstrated in a comparison with a commercial chemiluminescence detector. As a new application of ICAD we show measurements on an automobile platform to investigate the two-dimensional NO2 distribution in an urban area. The instrument is so robust that even strong vibrations do not lead to any measurement problems.
- Article
(8220 KB) - Full-text XML
-
Supplement
(2014 KB) - BibTeX
- EndNote
Since its development by Perner et al. (1976) and Platt et al. (1979), differential optical absorption spectroscopy (DOAS) has been successfully applied to study atmospheric trace gases and their chemistry. It allows the quantitative detection of many important atmospheric trace gases (e.g. NO2, NO3, O3, SO2, BrO) by their distinct narrowband absorption structures. Due to the uniqueness of these absorption features DOAS can even separate several trace gases which absorb in the same spectral region, making the measurements virtually free of interferences. This is a great advantage over methods which only rely on monochromatic absorption (e.g. cavity ring-down spectroscopy), as these cannot distinguish between different overlapping absorbers, or indirect measurement methods (e.g. chemiluminescence). A further advantage is the inherent calibration feature of DOAS. However, sensitive trace gas measurements require long optical absorption paths of several hundreds of metres to several kilometres in length. Therefore, DOAS is classically used for remote sensing where long physical light paths are realised between a light source and the instrument (e.g. long-path DOAS or multi-axis DOAS). Even though multi-reflection cells have been successfully employed (e.g. Volkamer et al., 2001; Buxmann et al., 2012), they usually do not provide sufficiently long path lengths in a small setup and therefore prevent DOAS measurements in many applications where in situ measurements are required. These applications include measurements at a single sampling point, reaction chamber measurements and mobile measurements. Conversely, the advantages of the DOAS techniques are desirable, like being calibration gas free, without zero-point drift and independent of total light intensity. DOAS can be applied to in situ measurements by using an optical cavity, consisting typically of two highly reflective mirrors where light is reflected forward and backwards, and at each reflection a small part of the light is transmitted through the mirror (Fig. 1). Thus, (on average) photons travel a large distance in the cavity before being analysed behind the optical cavity and a sufficiently long light path is achieved with a compact instrumental setup. Optical cavities were first applied in cavity ring-down spectroscopy by O'Keefe and Deacon (1988), who analysed the ring-down time of pulsed monochromatic laser light at a wavelength matching an absorption peak of the gas under investigation. Another approach, known as cavity-enhanced absorption spectroscopy (CEAS), uses the time integrated light output of a constant monochromatic light source (e.g. Engeln et al., 1998; O'Keefe et al., 1999; Peeters et al., 2000) and relies on the fact that (on average) photons travel a large distance in the cavity before being analysed. Both techniques share the disadvantage of only making monochromatic measurements (see above). The combination of CEAS with a broadband light source (BB-CEAS) was first realised by Fiedler et al. (2003) using a Xe-arc lamp as a light source. In this technique wavelength-resolved spectra of the transmitted light are recorded rather than monochromatic light intensities (as in the case of CEAS). This allows us to derive absorption spectra which can be analysed with DOAS, leading to cavity-enhanced DOAS (CE-DOAS) or BB-CEAS DOAS. This technique has been successfully applied for sensitive trace gas measurements by several authors (e.g. Ball et al., 2004; Venables et al., 2006; Varma et al., 2009; Meinen et al., 2010; Kennedy et al., 2011) and has been under constant development since then. However, a severe weakness is the dependence of the data evaluation on the stability of the (broadband) light intensity, not only on stability of the light source itself, but also on stable light intensity transmission of all optical components (e.g. fibre, lenses and spectrometer). This requires a relatively complicated temperature-stabilised and rigid setup, which makes sensitive instruments heavy (typically >30 kg), and requires much maintenance (frequent zero-air reference measurements). Therefore, the instruments presented so far are typically limited to applications in a laboratory or larger mobile platforms (e.g. ships and medium-sized aeroplanes; see Zheng et al., 2018) where controlled environmental conditions are present. Applications in harsh environments are in principle possible, but require a high technical effort to achieve the required stability. Furthermore, the high maintenance requirements make unattended long-term operation difficult. Wu et al. (2009) made an attempt for a simplified but more robust NO2 CE-DOAS instrument for urban measurements. They use mirrors with lower reflectivity (R of 0.9955 instead of R>0.9995 in typical applications), which generally makes the setup mechanically more robust but comes at the price of a relatively large setup of more than 1 m length at a relatively low sensitivity with a detection limit of 4.4 ppbv (2σ). Thus long-term measurements and applications in a standard rack housing, on small mobile platforms (e.g. ultralight aeroplanes, cars) or as field portable devices, are so far not possible.
This paper describes a new ICAD (iterative CE-DOAS) method which is robust against fluctuations of the absolute light intensity, and thus against instabilities of the light source and mechanical perturbations (e.g. vibrations). First the algorithm is described and analysed using simulated measurements. In the second part a new ICAD NO2 instrument is presented which makes use of the ICAD method. The application of the ICAD algorithm allowed us to simplify the instrument and thus to make it compact, lightweight and low in power consumption. The instrument is characterised in laboratory tests and during different long-term inter-comparisons with a commercial chemiluminescence detectors. Finally we show a pilot study where the instrument was successfully applied to measure the two-dimensional NO2 distribution in an urban area. A CE-DOAS instrument with an earlier version of the analysis scheme described in this publication was already successfully applied in several measurement campaigns (e.g. Zhu et al., 2018, and the Hohenpeißenberg NOx side-by-side inter-comparison in the frame of ACTRIS WP3 deliverable 3.5).
In brief the principle of a cavity-enhanced absorption spectroscopy system can be described as follows.
Radiation with a broadband spectrum is continuously fed into an optical cavity consisting of two mirrors with reflectivity R (this is assumed for simplicity only; if the two mirrors have different reflectivities, one may take the geometric average reflectivity ). Initially only a portion 1−R of the radiation emitted by the light source will enter the cavity. Once in the cavity the light is reflected between the mirrors. But at each reflection a fraction 1−R of the light also leaves the cavity (Fig. 1). Light leaving the cavity at the opposite side of the light source is collected by a spectral detection unit (typically a spectrometer). The measured light is composed of photons which have undergone different numbers of reflections and therefore travelled different distances in the cavity. Thus, an effective light path for the average photon is defined (see Sect. 2.2 and 2.1). The data evaluation is further complicated compared to classical absorption spectroscopy as the length of the effective light path is non-linearly reduced if absorbers or scatterers are present in the cavity (e.g. Platt et al., 2009). Apart from the dependence of the light path length on the trace gas concentration, this effect also leads to a distortion of the trace gas absorption bands. This is due to the fact that the light path length in the centre of a band is shorter and thus the absorption weaker than in the wings of the band. This distortion effect can introduce considerable additional errors in the determination of trace gas concentrations as we show below. There are two different approaches, termed BB-CEAS and CE-DOAS, which can be used to account for this loss of sensitivity caused by absorbers/scatterers. They are discussed in the following sections.
2.1 Broadband cavity-enhanced absorption spectroscopy (BB-CEAS)
In the presence of an absorbing/scattering sample, light in the cavity is subject to additional losses. The extinction coefficient ε(λ) relates these losses to the concentration ci and absorption cross section σi(λ) of the molecules and particles in the air sample . Additional broadband extinction due to (Rayleigh and Mie) scattering and due to turbulence is summarised in εb(λ). To determine ε(λ), measurements of the transmitted light intensity conducted with an absorber-free cavity (I0(λ)) and when filled with sample gas (I(λ)) can be related to the extinction coefficient ε(λ) by summing over all light passes through the cavity (e.g. see Fiedler, 2005; Zheng et al., 2018). With the single-pass absorption length d (usually equal to the displacement of the cavity mirror), this gives
For the sake of clarity the wavelength dependency of ϵ(λ), I0(λ), I(λ) and was not written out in Eq. (1). Since it is not feasible to record I0(λ) under vacuum conditions, an effective reflectivity is used to account for the remaining extinction ε0(λ) in the absorber-free cavity (e.g. if I0 is recorded in clean air the additional extinction processes are Rayleigh scattering and in some spectra ranges absorption of the oxygen O2 or its dimer O4). In the case of small absorption losses per pass and for high-reflectivity mirrors , Eq. (1) can be approximated by a Taylor series expansion to the first-order as
with the effective path length of an absorber-free cavity. This is the equation most commonly used in BB-CEAS applications. Due to non-linear effects in the cavity, strong absorbers decrease the sensitivity of the measurement, due to on average a shorter path of the photons. In the BB-CEAS Eqs. (1) and (3) this is calculated from changes in the measured light intensity. It is important to note that this assumes absolute stability of the light source intensity and the optical setup between the measurement of I(λ) and I0(λ). Changes to I0(λ) or I(λ) which are not due to optical extinction cannot be distinguish from an actual absorber in the cavity. Therefore they lead to an error in the determination of ε (also in the narrowband differential absorption) and thus in the retrieved trace gas concentrations. For example, an absorber which causes a 10 % reduction of the light intensity I(λ) will also reduce the sensitivity by about 11 %. Now, if this intensity change is not caused by an absorber but by a fluctuation of the light source intensity, then the evaluation will overestimate all retrieved trace gas concentrations by 11 %. Intensity drifts of this magnitude are typical for such optical setups, e.g. due to intensity drifts of used light sources like LEDs or changes in the transmission of fibres when their bending radius slightly changes during transport or vibrations. While there are technical solutions for these problems, they add extra complexity, weight, and potential sources of hardware failure and often have to be adapted to the environmental conditions (e.g. parameters of the temperature controllers).
2.2 Cavity-enhanced differential optical absorption spectroscopy (CE-DOAS)
Platt et al. (2009) use a different approach which focuses on a DOAS evaluation of the cavity-enhanced measurement. DOAS, which was introduced by Platt et al. (1979), allows the detection of a broad variety of atmospheric trace gases. It decomposes the absorption cross sections σi(λ) of the trace gases into their broadband part σi,b(λ) with smooth spectral characteristics and the differential part , which contains the distinct narrowband absorption features of trace gases.
To derive concentrations ci the measured optical density is modelled using the differential absorption cross sections of the trace gases in the evaluated wavelength range:
where L is the length of the optical light path and 𝒫k(λ) is a polynomial of order k which models contributions that vary slowly with the wavelength like scattering, turbulence and broadband absorption. The trace gas concentrations ci and the coefficient of 𝒫k(λ) are then optimised by a combined linear and non-linear least-square fit to minimise the difference between Dmodel(λ) and Dmeas(λ) (Platt and Stutz, 2008). Therefore, a DOAS evaluation does not depend on the stability of the light source or optical setup as long as there are no narrowband intensity variations.
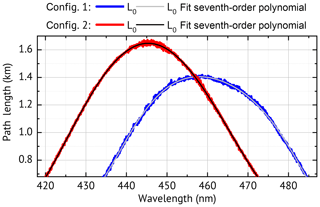
Figure 2Measured path length for a zero-air-filled cavity for two instrument configurations, both used in this paper. Contributions to the path length by mirror reflectivity, Rayleigh extinction and O4 absorption are shown for config 1 in the Supplement Fig. S1.
For CE-DOAS we define the cavity-enhanced optical density as
Note that σi(λ) is the total absorption cross section. Equation (6) introduces the effective optical path length , which describes the length of the absorption path for an equally sensitive classical (single pass) absorption measurement. As mentioned before non-linearly depends on the optical density DCE of the air sample in the cavity (see Platt et al., 2009). Mathematically this is expressed by
is the effective path length for the absorber-free cavity (DCE→0 and thus K(λ)→1) as present during the I0 measurement. Its strong wavelength dependency (see Fig. 2) is mainly caused by the wavelength dependency of the mirror reflectivity R(λ). The manufacturer's specification of R(λ) is generally not sufficient since small contaminations of the mirror have a strong influence on . Therefore, in order to derive the cavity is typically filled with a reference gas of known extinction (see Sect. 4.2).
K(λ) (second term in Eq. 7) accounts for the loss of sensitivity for increasing optical density of the gas, which can be caused by high concentrations of the trace gases themselves (see Figs. 3 and 9) or additional broadband extinction due to scattering (especially from aerosols) or turbulence in the cavity. The loss of sensitivity for increasing optical density can be understood since photons which have undergone more reflections (or passes through the cavity) are more likely to be absorbed or scattered out of the light path. Therefore, in the presence of an absorber/scatterer the transmitted light has, on average, travelled shorter paths, effectively decreasing and thus decreasing the sensitivity. The dependence of K(λ) on the total optical density DCE is shown in Fig. 3. For small optical densities below the correction is less than 1 % and can be neglected in these cases. However, there are several scenarios where high optical densities of several 10−1 up to more than one are common. These cases where K(λ) is important are as follows.
-
Measurements where aerosols are not removed from the air. This is always the case in open-path CE-DOAS systems where the cavity is open towards the atmosphere, but also some closed-path systems do not use aerosol filters to avoid losses on the filter surface.
-
If the instrument needs to measure trace gases over a wide concentration range of more than 1 order of magnitude. In this case the mirror reflectivities are typically chosen so that the lowest concentration to be measured causes a cavity-enhanced optical density of . Then according to Fig. 3 a trace gas concentration 100 times higher already requires a correction of K=0.95, which quickly increases for higher concentrations. This case is regularly encountered when measuring NO2 in urban areas where the mixing ratio typically varies between few parts per billion by volume and more than 100 ppbv and can even reach more than 1000 ppbv in highly polluted locations. Specification of a general correction factor for the derived concentration is not possible, as the correction factor K(λ) is wavelength-dependent and originates in the wavelength dependent absorption structure of the absorbing gases. Neglecting this dependency leads to spectral structures in the residual of the DOAS fit, as the band shapes are not reproduced correctly, and thus additionally leads to wrong derived concentrations.
-
If a weakly absorbing trace gas should be measured in the same spectral range as a strong absorber. In this case the mentioned residual structures from the fit of a strong absorber can strongly interfere with absorption structures of the weak absorber, resulting in a large error in the retrieved concentration of the weak absorber or even render its detection impossible. One example where this happens is the measurement of glyoxal in a polluted urban environment where high NO2 levels are present.
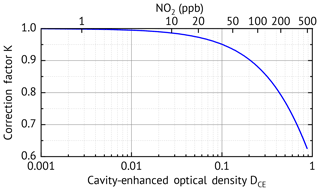
Figure 3Correction factor K as a function of the cavity-enhanced optical density DCE. Note that the correction factor is also wavelength dependent as the optical density DCE(λ) is wavelength dependent.
The simplest and most common approach to calculate K(λ) uses the measured optical density :
It has to be noted that in this case instrumental fluctuations of the light intensities, e.g. due to instabilities of the cavity or the light source intensity, affect the retrieved trace gas concentrations like in BB-CEAS. In fact, inserting Eq. (7) into Eq. (6) shows that in this case the CE-DOAS (Eq. 6) and BB-CEAS (Eq. 3) are equivalent and have the same stability requirements for the light source and mechanical setup, and therefore have the same disadvantages as mentioned for BB-CEAS.
Previous studies tried to solve this problem by using absorbers of known concentration to calculate K(λ) independently from the light intensity, e.g. using O4 absorption (Thalman and Volkamer, 2010). However, these approaches only give K(λ) at a single wavelength at a limited accuracy (see Sect. 4.2) and are restricted to a few spectral ranges where O4 absorption bands are present. Furthermore, as mentioned before, a scalar correction factor does not work for strong differential absorbers as the distortion of their absorption bands can only be corrected by a wavelength-resolved K(λ).
In this section we introduce a new approach which makes the CE-DOAS evaluation robust against fluctuations of the measured light intensities and therefore allows a simplified optical setup with high measurement accuracy.
Assuming that we know the number densities (concentrations) ci and the total cross sections σi(λ) of all absorbing and scattering species in our sample, as well as the aerosol extinction ϵaerosol, we calculate the optical density
and thus compute K(λ) according to Eq. (7). For the aerosol extinction a suitable parameterisation ϵaerosol(m,λ) with a parameter vector m can be chosen. Typically an Ångström exponent approach could be used. Unfortunately, except for Rayleigh scattering, the concentrations ci and the aerosol parameters m are not known a priori. But if all absorbers have sufficiently wavelength-dependent absorption structures, a DOAS fit could be used to iteratively calculate DCE(λ) and thus determine K(λ). If an aerosol-free air sample can be achieved by passing the air through a suitable aerosol filter prior to the measurement, the procedure is even more simplified. We focus in this paper on this aerosol-free realisation, setting ϵaerosol=0 in the following. In the presence of aerosols the removal of broadband absorption, as part of the DOAS analysis, needs to be performed with care not to interfere with the aerosol absorption. A basic approach which includes aerosol absorption is discussed in the Supplement Sect. S1.
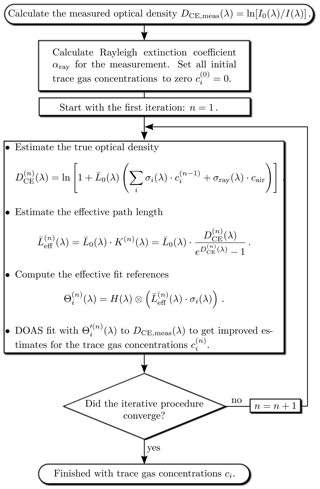
The iterative evaluation scheme, shown in Fig. 4, starts with all trace gas concentrations set to zero. In the first iteration (n=1) only the known Rayleigh scattering is considered to obtain a first an estimate of the optical density . The effect of Rayleigh scattering even vanishes if I0(λ) is recorded in (clean) air, at the same pressure and temperature as I(λ). is then used to calculate the effective path length of the first iteration. In order to account for the wavelength dependency of , effective reference spectra are computed for each trace gas, using literature data of highly resolved absorption reference spectra σi(λ):
The highly resolved effective references are then adapted in the usual way (see, e.g. Platt and Stutz, 2008) to the lower spectral resolution of the measurement by convolution with the instrument function H(λ) of the spectrometer:
The last step of the (first) iteration is a DOAS fit to the measured optical density which uses the narrowband (differential) part of the effective fit references to obtain first estimates for the trace gas concentrations . In the subsequent iteration these concentrations are used together with the Rayleigh extinction to compute an improved correction factor K(n+1)(λ) and thus and , which are used in a subsequent DOAS fit to obtain a more accurate set of trace gas concentrations . This scheme is then repeated until best estimates of the true trace gas concentrations are found. We require as strop criterion that for all trace gases the DOAS fit error exceeds the change in concentration between the last two iterations. Other criteria could also be used.
In some cases there are strong absorbers with absorption structures much narrower than the spectral resolution of the measurement. Then there is in general no linear relationship between the measured optical density and the trace gas concentrations. This is known as the saturation effect (e.g. Frankenberg et al., 2005). The ICAD algorithm also provides an easy way to correct for this effect. Starting from the second iteration we can correct for this effect since we have estimates for the fitted trace gas concentrations. The saturation-corrected fit references used in the next fit iteration are calculated as
where is the trace gas concentration retrieved in the last iteration.
The numerical convolution of highly resolved spectra is computationally intensive, especially since this has to be done for all fitted trace gases during each iteration. For the ICAD evaluations in this work, we therefore reduce the sampling of the reference spectra to 10 000 channels and a spectral resolution of 8 pm. This is still much higher than the spectral resolution of the measurements, which is typically on the order of 0.5 nm. In order to reduce computation time, it is desirable to reduce the required number of iteration steps to reach convergence. This can be achieved by choosing a starting concentration close to the final concentration. In a time series of measurements this is in practise the concentration of the previous data point.
3.1 Simulations using the ICAD method
In order to test the ICAD method, we evaluate modelled measurements (without noise) with different NO2 concentrations (1, 10, 100, 1000, 3000 ppbv). Furthermore, we compare the ICAD algorithm to evaluations with the BB-CEAS Eq. (3) and investigate their sensitivity to fluctuations in the light intensity. The instrumental parameters for the simulations (mirror reflectivity R(λ)≤99.97 %, cavity length d=50 cm and a Gaussian instrument function of the spectrometer H(λ) with a full width at half maximum (FWHM) of 0.5 nm) are based on our new ICAD NO2 instrument (config 1) described in Sect. 4.1. The spectral range of the simulated data evaluation between 458 and 480 nm is also matched to this, reducing the light path in the cavity.
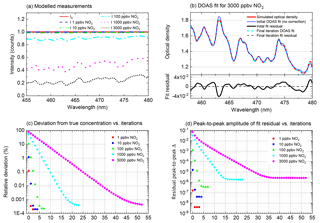
Figure 5ICAD evaluations of simulated measurements. Panel (a) shows the measured spectra (modelled without photon shot noise) for different NO2 mixing ratios (see Sect. 3.1). Panel (b) shows DOAS fits for a NO2 mixing ratio of 3000 ppbv. It shows the improvement of the DOAS fit from the initial iteration (fitted concentration of 676 ppbv) to the final iteration with optimised fit references (final derived concentration 2999.99 ppbv). In the final iteration the NO2 absorption bands of the simulated optical density are almost perfectly matched, reducing the fit residual by 4 orders of magnitude. The convergence of the retrieved NO2 towards its true value is shown in panel (c) as a function of the ICAD iteration number. Panel (d) shows the improvement of the fit residual during the iterative evaluation. In a real measurement the achievable noise levels are limited by the fundamental photon shot noise and instrumental error sources (see Sect. 4.3).
The intensity I0(λ) transmitted by the empty cavity is chosen to be unity over the entire spectral range. The intensity transmitted by the absorber-filled cavity is then calculated according to Fiedler (2005) as
where R(λ) is the reflectivity of the cavity mirrors, the single-pass transmittance of zero air and for the sample with a NO2 concentration . The NO2 absorption is calculated using the laboratory cross section of Vandaele et al. (2002) and for Rayleigh scattering the cross section σray(λ) from Bodhaine et al. (1999) is used. To capture high-resolution features of the NO2 spectrum the intensity I is calculated at a spectral resolution of 1 pm. In a final step the measured intensity Imeas(λ) is obtained from the high-resolution spectrum I(λ) by convolution with the instrument function H(λ). The modelled measurements are shown in Fig. 5a.
3.1.1 Evaluation with the ICAD method
The ICAD method is applied to the spectra modelled in the last section. The performance of the iterative algorithm is illustrated in Fig. 5. It converges for all tested mixing ratios. Even for a mixing ratio as high as 3000 ppbv it reaches a precision better than 99.9 % (starting from an initial underestimation of nearly 80 %; i.e. without correction only 20 % of the true value would be found in this – admittedly – extreme case). As expected, the convergence is faster for lower concentrations since they only cause little reduction of the effective light path. The improvement of the DOAS fit from the initial fit iteration to the final iteration with optimised fit references is illustrated in Fig. 5b. In the initial fit (zeroth iteration), the shape of the NO2 absorption bands of the simulated optical density and fit reference show significant differences, leading to strong residual structures with a peak-to-peak distance of . In the subsequent iterations the estimate of the NO2 concentration is improved and thus the correction factor K(λ) is improved. In the final iteration, the NO2 absorption bands in the simulated optical density are almost perfectly matched, reducing the fit residual by 4 orders of magnitude. There are still small residual structures, with increasing magnitude for higher concentrations (Fig. 5d). The reason for these small differences is that ICAD (and BB-CEAS) assumes a weak absorber (see Sect. 2), while the calculation of the modelled measurements with Eq. (13) does not make this assumption. However, even for mixing ratios as high as 3000 ppbv the residual is still more than 1 order of magnitude lower than the optimal noise levels (10−4 peak to peak), which could be achieved with typical spectrometers, and is thus negligible. It might be surprising that the initial fit in Fig. 5b clearly underestimates the NO2 concentration by nearly 80 %, even though the differential structures seem to match the measured optical density quite well. The reason is that additionally a large broadband absorption of NO2 is present, reducing the light path in the cavity and thus leading to an underestimation of the true concentration, without disturbing the differential band shape of the spectrum.
3.1.2 Comparison ICAD vs. BB-CEAS
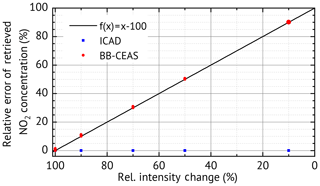
One of the major motivations for the development of the ICAD method is the need for an evaluation which is robust against broadband fluctuations of the measured radiation intensity. We simulated such fluctuations by scaling the amplitude of I0(λ) with different values (90 %, 70 %, 50 % and 10 %) and repeated the ICAD evaluations for each case. Furthermore, we also evaluated the same spectra with the BB-CEAS method to show the benefits of ICAD. The results (excluding statistical errors due to photon shot noise) shown in Fig. 6 clearly demonstrate that the ICAD method is insensitive to broadband intensity fluctuations. In contrast to that, using the same intensity fluctuations, the concentrations retrieved by the BB-CEAS evaluation show a linear dependency on the radiation intensity; see red dots in Fig. 6. The deviations of the derived number densities can reach up to 90 %.
The advantages of the ICAD analysis are used to build a simplified yet very sensitive instrument to measure NO2, which we call ICAD NO2. The realised ICAD NO2 prototype used in this study features a very lightweight (<10 kg) and compact design (measuring only cm3) with low power consumption (25 W). This is only possible as the ICAD method allows a cavity setup to be to built without temperature stabilisation, which greatly reduces the complexity of the setup along with energy consumption and weight. Obviously, this is especially important for mobile applications. Furthermore the long-term stability of measurements is improved as LED degradation has no influence on the measurement.
4.1 Instrumental setup
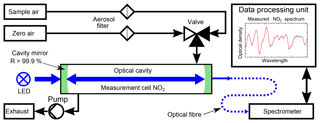
The instrumental setup of the ICAD NO2 is shown in Fig. 7. Its central element is a 40–50 cm long optical cavity, formed by two high reflective mirrors with 25 mm diameter and 1.0 m radius of curvature. The cavity is enclosed by a PTFE tube with gas connectors, forming a closed measuring cell. As a light source a blue high-power LED is used (see Table 1). Since the ICAD method does not depend on the absolute stability of the light intensity, in contrast to all other CE-DOAS and CEAS instruments we do not need a complicated thermal stabilisation and use a simple heat sink to passively cool the LED. The light emitted by the LED is coupled into the cavity by a plano-convex lens (f=25 mm). Light leaking out on the opposite side of the cavity is focused on a multimode fibre (d=400 nm, NA =0.22) by another plano-convex lens (f=50 mm). The fibre feeds the light into a compact spectrograph with a 0.5 nm spectral resolution, which is well suited for selective DOAS measurements of NO2 in the UV–vis range. The DOASIS software (Kraus, 2006) is used for automated acquisition and online evaluation of the spectral data. A membrane pump with a maximum flow rate of 3 L min−1 is used to draw air into the measuring cell, which has a volume of 0.3 L. Before entering the measuring cell, the air has to pass through a Teflon filter (2 µm pore size), which removes aerosols while it does not influence the NO2 concentration. The zero air for I0 reference measurements is produced from a NO2 scrubbing system as we found the usual application of clean-air gas cylinders to be impractical for field applications. The scrubber system consists of two cartridges, one filled with activated carbon and one with silica gel, which are known NOx scrubbers. This zero air is found to contain undetectable NO2 (<0.05 ppbv) at ambient air NO2 concentrations up to 100 ppbv. Due to further developments we present the instruments in two configurations summarised in Table 1. Config 1 is the original setup and config 2 utilises improvements in LED and mirror technology as well as a better optomechanical setup for an improved instrument performance. A detailed analysis of the instrument performance is given in Sect. 4.3.
Vandaele et al., 2002Vandaele et al., 2002Hermans et al., 1999Rothman et al., 2010Table 1Configurations and fit settings of the ICAD NO2 instrument used in this publication. Glyoxal detection limits were estimated using Volkamer et al. (2005). Glyoxal was removed from the final fits, as it could not be found in the performed test data analysis.
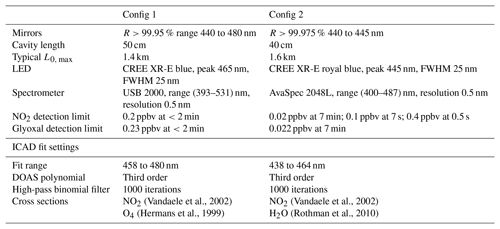
DOAS fit ranges were optimised to the spectral range with long optical path length, high LED intensity and strong differential NO2 absorption. In order to remove the broadband spectral features which are not captured by the DOAS polynomial, a binomial high-pass filter with 1000 iterations is applied to the measured optical densities and to the reference cross sections.
4.2 Path length calibration
As explained in Sect. 2.2, an accurate knowledge of the effective optical path length L0(λ) for an absorber-free cavity is required in order to determine trace gas concentrations from ICAD or CE-DOAS measurements. The optical path length can be determined from (1) wavelength-resolved cavity ring-down spectroscopy (CRDS) measurements (e.g. Langridge et al., 2008; Laurila et al., 2011), (2) the differential absorption by a trace gas with a known concentration (e.g. NO2: Langridge et al., 2006) or (3) the intensity change caused by gases of different Rayleigh scattering cross sections (Washenfelder et al., 2008).
-
Even though calibration with wavelength-resolved CRDS measurements has several advantages (independent of a stable light source), it requires additional components which are incompatible with the goal of a simple and lightweight instrumental setup.
-
The differential absorption of NO2 has previously been used to calibrate absorption path lengths (e.g. Langridge et al., 2006). However, this turns out be impractical for field campaigns since NO2 mixtures are not stable in gas cylinders and would have to be produced on site. Generally, calibration gas mixtures are problematic for field campaigns since they are difficult to obtain in many countries and shipment of compressed gas cylinders is complicated (and often expensive) due to safety regulations.
Alternatively one could use the O4 absorption peak at 477 nm to determine the path length. This measurement is in principle easier as it only requires zero air and nitrogen as the oxygen-free reference gas (which is much cheaper and more easily obtained than calibration gases in most countries). This could also be used to recalibrate the effective light path during measurements (Thalman and Volkamer, 2010). However, the DOAS fit of O4 is relatively imprecise with errors greater than 10 %, firstly because the effective optical path length (Fig. 2) decreases by more than 25 % over the FWHM of the 477 nm peak, which influences the band shape and thus lowers the quality of the fit. Secondly, this method only uses a single and relatively broad absorption band, which makes the fit result very sensitive to the degree of the DOAS polynomial. Finally, this method only gives the absorption path length at a single wavelength and thus would need an additional calibration to determine the wavelength dependency of L0(λ).
-
We derive the path length using Rayleigh scattering as described in Washenfelder et al. (2008) by purging the cavity with helium followed by a purge with zero air for reference (thus it also contains a small contribution from O4 absorption at 477 nm, which is accounted for in the evaluation). It has the advantage that Rayleigh scattering varies (relatively) slowly with wavelength (), thus allowing us to determine the path length smoothly over the entire spectral range, whereas the calibration with trace gases can only be applied at discrete wavelengths where they have absorption structures. Helium and zero air are chosen because their Rayleigh scattering coefficients differ by almost 2 orders of magnitude. This makes a relatively large change in intensity between both measurements of about 2 % per 1 km optical light path, which is important for an accurate L0 measurement. Furthermore, helium also has the advantage that it can be obtained easily in most countries, which helps to avoid shipping of gas cylinders. The disadvantage of this method is that it uses absolute spectroscopy and therefore has higher requirements on the stability of the measured light intensity during calibration. In this case absolute stability is required only for a very brief period of time (less than 15 min) to flush the cavity with the calibration gases (e.g. He and zero air). In the presented setups, the relative intensity drift over a calibration sequence is found to be about , giving a relative path length error of 2 % (for L0=1.4 km), which is almost an order of magnitude more precise than the tested calibration with O4. The He Rayleigh scattering cross section used for the evaluation is interpolated from the measurements of Shardanand and Rao (1977) using a λ−4 dependency. For air, the Rayleigh scattering cross section is calculated according to Bodhaine et al. (1999). The O4 absorption is accounted for using the reference cross section from Hermans et al. (1999).
Figure 2 shows the result of a path length calibration for both instrument configurations. The curves are smooth and can be represented by a seventh-order polynomial over the desired evaluation range. They have a maximum of km (config 1) and km. These correspond to maximum mirror reflectivities of R=99.96 % (config 1) and R=99.98 % (config 2), which are consistent with the manufacturer's specification of R≥99.95 % and R≥99.975 % respectively.
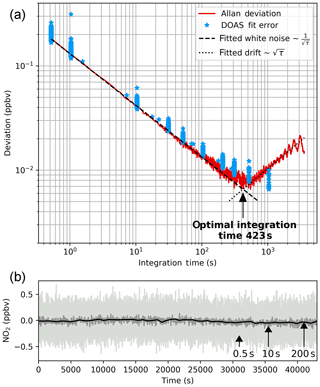
Figure 8Results from long-term zero-air measurements, recorded with instrument config 2. They are used to examine the instrument performance at different integration times. Spectra were recorded at 0.52 s integration time. Signal averaging was applied to create further time series with longer integration times up to 3591 s. ICAD evaluation was applied to the spectra according to Table 1. Panel (b) shows the time series for different integration times. Panel (a) shows the 1σ Allan deviation as a function of integration time. We used its minimum to determine an optimal integration time of 423 s. Beyond this point signal averaging does not improve the instrument performance due to drifts and non-white noise. Also, the 1σ DOAS fit error is shown, which also shows an optimal 2σ detection limit of 0.02 ppbv in 423 s.
4.3 Characterisation of the instrument
4.3.1 Measurement precision
Ideally the precision of an optical measurement is only limited by the photon shot noise of the measured intensity signal. Therefore we would expect that the uncertainty of the measurement decreases with the square root of the integration time. The same also applies to other sources of white noise (e.g. in the detector electronic). However, the real measurement process is also influenced by systematic error sources such as instrumental drifts. Therefore, signal averaging (i.e. increasing the integration time) can only be used to reduce the measurement uncertainty as long as white noise dominates over other error sources. The aim of this section is to investigate the relationship between the integration time and the measurement uncertainty and thereby find the best (i.e. lowest) detection limit achievable with our setup (we used setup config 2).
Since it is very difficult to produce stable NO2 concentrations over long time periods we used NO2-free zero air to characterise the instrument performance. A long time series of 78 181 subsequent zero air spectra at an integration time of 0.52 s (65 scans at 8 ms exposure time) was recorded (total acquisition time 11.9 h). The spectra were further processed to create averaged time series with integration times between 0.52 and 3591.12 s. The spectra were then analysed with the ICAD method using the fit settings from Table 1. Figure 8 shows three exemplary time series at 0.52, 10 and 200 s integration times in different grey colours which show the improvement of the signal-to-noise ratio with increasing signal averaging.
For each time series with integration time τ and m+1 data points yk(τ), the Allan variance was calculated (Allan, 1966; Werle et al., 1993).
Figure 8 shows the Allan deviation σA(τ), which is the square root of the Allan variance. This so-called Allan plot is used to determine the optimal integration time (e.g. Werle et al., 1993; Weibring et al., 2006; Langridge et al., 2008). As long as the measurement uncertainty is dominated by white noise the Allan deviation decreased with the square root of the integration time until the optimal integration time of 423 s is reached. Beyond this point instrumental drifts and non-white noise dominate and thereby cancel the improvement by signal averaging, leading to no further reduction or even (as in our case) an increase in the Allan deviation. Figure 8 also shows the DOAS fitting error as a function of the integration time, which is a good estimate for the 1σ measurement uncertainty as long as the measurements are in the white-noise-dominated regime (Stutz and Platt, 1996). We therefore determine the optimal 2σ NO2 detection limit of this instrument (in config 2) to be 0.02 ppbv (20 pptv) at an optimal integration time of 423 s.
4.3.2 Validation with calibration gas
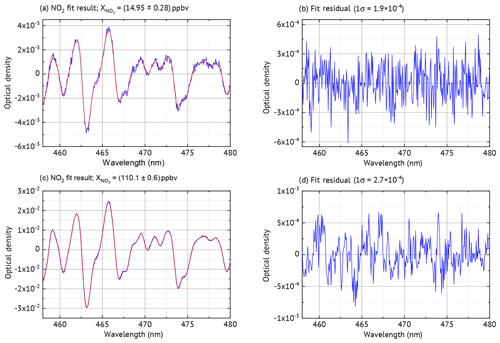
Laboratory measurements were conducted to characterise the NO2 ICAD, with air samples of different NO2 mixing ratios. For these measurements the instrument was used in config 1 (see Table 1). The calibration source produced well-defined NO2 mixing ratios by gas-phase titration of NO with O3 (see Fig. S3). During the measurements the air flow through the cavity was adjusted to 1 L min−1. The spectra were acquired at 53 ms exposure time and 2000 individual scans were added for each spectrum to improve the signal-to-noise ratio. NO2 was evaluated according to Table 1. Figure 10 shows the NO2 fit results for typical atmospheric mixing ratios of 14.95 and 72.45 ppbv. The standard deviation of the residual spectra is and . We estimate for setup config 1 an unambiguous measurement of NO2 down to a detection limit of 0.2 ppbv. The precise ICAD fit with very low achievable residual spectra also at high NO2 concentrations also allows the detection of weak absorbers like glyoxal. Such precise fits at high NO2 concentrations are typically not achieved with BB-CEAS instruments (e.g. Liang et al., 2019). Figure 9 shows the correlation between the ICAD measurements and the NO2 levels from the calibration source.
An almost perfect linear relation with a correlation coefficient of R=0.99997 is found when the data are evaluated with ICAD. The linear fit shows the absolute accuracy of the NO2 retrieval with a slight overestimate of (0.5±0.3) % lying well within the expected uncertainty of the path length calibration of 2 %. The small offset of (2.6±0.1 ppbv) is most likely due to an impurity in the zero-air gas cylinder from the NO2 calibration source. For comparison the data were also evaluated with a classical DOAS analysis, which does not consider the reduction of the effective path length Leff in the presence of an absorber. For low mixing ratios below 20 ppbv the error is negligible. However, for larger concentrations of NO2 the path length reduction becomes important, which leads to significantly underestimated NO2 mixing ratios by classical DOAS (e.g. 11 % for 110 ppbv NO2) as expected from the simulations presented in Sect. 3.1 above.
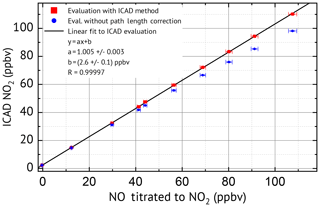
Figure 9Measurements (spectra recorded with instrument configuration 1) of gas mixtures with different NO2 concentration.
The following sections show the first applications of the ICAD NO2 instrument.
5.1 Long-term measurements
5.1.1 Measurements using config 1
In order to study the long-term behaviour of the ICAD NO2, ambient air measurements were conducted for a period of 24 d in February 2010 at the rooftop of the Institute of Environmental Physics in Heidelberg (IUP-HD) using config 1 (see Table 1). The sampling location is approximately 40 m above street level and 100 m from the next main road. The ICAD NO2 was operated similarly to the laboratory study from Sect. 4.3.2. Once an hour a solenoid valve switched from ambient air measurements to the zero-air system to automatically record I0 reference measurements. Like in the previous section spectra were acquired with a time resolution of 106 s giving a NO2 detection limit of 0.2 ppbv.
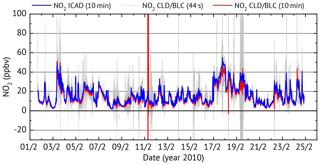
Figure 11Time series for the long-term NO2 comparison between the ICAD NO2 (instrument configuration 1) and a commercial CLD–BLC.
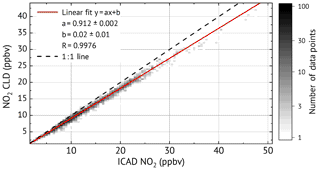
For comparison, NO2 was simultaneously measured by a CLD 770 AL ppt, a commercial NO chemiluminescence monitor from ECO Physics with a 44 s time resolution. Since a CLD can only measure NO, an additional photolytic NO2-to-NO converter (BLC) is used. The difference in NO between subsequent measurements with an activated and deactivated converter allow us to determine the NO2 concentration. This assumes a constant NO level between subsequent measurements. For atmospheric measurements the change of NO concentration between subsequent measurements introduces an error to the measured NO2 concentrations. Using the average of the NO measurement before and after the converter measurement reduced the error but the NO2 values at 44 s time resolution still show large fluctuations which are much higher than the expected atmospheric NO2 variations (see Fig. 11). The non-physical noise of the CLD NO2 measurements could be greatly reduced when 10 min averages are used, but is still not enough for a comparison to the ICAD NO2 measurements. In order to analyse the CLD noise, the general trend (interpolated 4 min trend) is subtracted from each data point before computing the standard deviation of the 10 min intervals. Intervals with a deviation of more than 3.5 ppbv are classified as non-physical and sorted out. These filtered CLD–BLC NO2 measurements are used for comparison with the ICAD time series.
As shown in Fig. 12, very good linear correlation (R=0.9976) is found between the NO2 mixing ratios from ICAD and CLD–BLC. It also shows that the CLD–BLC measurements are systematically 9 % lower compared to the CE-DOAS. However, this still lies within the uncertainty of the realised calibration of the CLD–BLC (≈10 %). Therefore it can be concluded that the ICAD instrument correctly measures NO2 under atmospheric conditions and derives with a much higher accuracy the real NO2 concentration at a high time resolution. A further analysis where the time series was divided into 3 d intervals showed that the relative calibration between the two instruments was stable over the entire time series (variation less than 3 %). This shows the good long-term stability of the ICAD instrument.
5.1.2 Measurements using config 2
A similar inter-comparison was repeated with two ICAD NO2 config 2 instruments and a Horiba APNA-370 CLD. The same sampling location at the rooftop of the IUP-HD was used. Measurements were conducted for a period of 28 d between February and March 2017.
The ICAD NO2 instruments called A and B were operated at a time resolution of 5 s and used the same zero-air reference during the entire comparison. A recalibration of the instruments was not necessary.
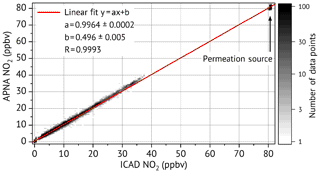
APNA-370 CLD primarily measures NO and uses a heated molybdenum NO2-to-NO converter to indirectly measure NO2. It provides NO2 measurements with a running mean of 3 min as it has to continuously switch between NO and NOx measurements like the CLD in the last section. The indirect NO2 measurement with the molybdenum converter has known problems of cross-interferences to other substances, but also known drifts of the converter efficiency, which makes a calibration prior to the comparison advisable. Therefore the APNA-370 CLD was calibrated with a NO2 permeation source from the Hessian agency for nature conservation, environment and geology (HLNUG, Wiesbaden, Germany). The permeation source was itself calibrated a few days before in a laboratory of HLNUG and provided a constant NO2 concentration of (80.5±0.5) ppbv.
Both the ICAD NO2 instruments and the APNA-370 CLD were measuring ambient air from the same sample line. ICAD NO2 A and the APNA-370 CLD were both connected to a solenoid valve, which could be automatically switched to the permeation source. Since the permeation source did not provide enough air flow for a third instrument, ICAD NO2 B could not measure simultaneously. Once a day the sample line was switched first to zero air for about an hour and successively to the permeation source for another hour. This way we could test if there were any zero point or calibration drifts of the instruments. Figure 13 shows the inter-comparison of NO2 measured by the ICAD NO2 A and the APNA-370 CLD. It shows a very good linear correlation (Pearson's R of 0.9993) with an almost perfect 1:1 correspondence. The APNA-370 CLD measured less than 1 % lower concentrations compared to the ICAD NO2, which is within the calibration accuracy. The narrow spread of permeation source measurements in Fig. 13 shows that both instrument have no significant drifts in their calibration. The inter-comparison between ICAD NO2 A and B (see Sect. S4) also shows a very good linear correlation between both instruments (Pearson's R of 0.999) with a slope of and a very low offset of (0.04±0.01) ppbv. A further analysis of the zero-air measurements shows that all three instruments have a stable zero point.
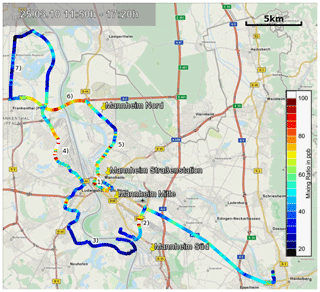
Figure 14Overview of the car-based measurements in the greater Mannheim–Ludwigshafen urban area. The colour of the route segments corresponds to the local NO2 mixing ratio. The areas marked on the map are (1) Mannheim city centre, (2) Mannheim railroad shunting yard, (3) Mannheim suburbs Altrip and Rheingönheim, (4) BASF industrial plant, (5) main road B44, (6) autobahn A6, (7) suburb Bobenheim-Roxheim. The yellow pins show the locations of the LUBW, air quality monitoring stations in the measuring area. The map overlay was created with Google Earth. Map information provided by MapQuest, OpenStreetMap, ODbL.
5.2 Mobile measurements
The combination of the simple and robust ICAD NO2 setup with its sensitivity to urban NO2 concentrations allows the application of ICAD to car-based NO2 in situ measurements using a cavity setup for the first time. This is of interest because the concentration of NO2 in urban areas is known to have a strong spatial and temporal variability, due to the large number of NOx emitting point sources (mainly traffic) that can be found in densely populated areas (e.g. Mayer et al., 1999). Conversely, air monitoring networks in urban areas continuously measure NO2 at only a few fixed locations, and thus are unable to capture the spatial variability. Hence, it can be assumed that there are areas with much higher or lower pollution compared to the values at the official measuring sites. In order to improve the air quality, better knowledge of the sources and the concentration distribution is required.
For a pilot study in March 2010 the ICAD NO2 instrument (configuration 1) was installed in a car to investigate the NO2 distribution in the greater Mannheim–Ludwigshafen urban area (Germany). These are to our knowledge the first car-based measurements of such a cavity-based setup. The air measured by the instrument was sampled at 2 m above the ground using a Teflon tube attached outside on the right side of the car. The air sample flow was adjusted to 2 L min−1, which gives a time constant of ≤12 s for a 70 % gas exchange in the measuring cell. This results in a spatial resolution of 167 m at a speed of 50 km h−1. The integration time per spectrum was adjusted to 6 s, giving a NO2 detection limit of 1 ppbv, which is sufficient for an urban area.
The route shown in Fig. 14 was selected to cover residential areas, industrial areas, the city centre and highways to get a representative coverage of the area. A strong spatial variability of the measured NO2 is found along our track (see Fig. 14). Low NO2 mixing ratios are generally found in the suburban/residential areas with low traffic and no industry. Elevated NO2 levels are found in the city centre of Mannheim and on the autobahn (A6), both areas with high traffic volumes, and next to BASF (Ludwigshafen), the largest industrial plant in the area.
A brief comparison to air quality stations operated by the State Office for the Environment, Measurements and Nature Conservation of the federal state of Baden-Württemberg (LUBW) can be found in the Sect. S2.
We developed a new ICAD (iterative CE-DOAS) method, a further development of the CE-DOAS technique from Platt et al. (2009), which makes the measurement independent of broadband variations in the light intensity. This solves one of the major problems of BB-CEAS/CE-DOAS instruments that have so far relied on an absolute stability of the light intensity, not only of the light source but also all light-transmitting components like the mechanical setup and fibre which easily could change due to vibrations. The new ICAD method is applicable to all CE-DOAS instruments, and the method works especially easily and reliably when aerosols are removed from the sampled air before it enters the cavity.
Simulated data evaluations showed that the ICAD method correctly retrieves the trace gas concentrations (better than 99.9 %), even for situations where the effective light path in the optical cavity is reduced by nearly 80 %. This demonstrates that ICAD correctly accounts for the non-linear behaviour of CE-DOAS/BB-CEAS measurements. Furthermore, we showed that the NO2 concentrations retrieved by the ICAD data evaluation are independent of broadband variations in the light intensity compared to a BB-CEAS evaluation of the same data where the retrieved NO2 linearly changed with the light intensity, which is a known BB-CEAS problem.
We used the benefits of the ICAD method to develop a new simplified instrument for the detection of NO2 at a detection limit of 0.02 ppbv (averaging time of ≈7 min) for monitoring. The system is distinguished by its compact setup only measuring cm3, low weight (10 kg) and low power consumption (25 W). It especially does not need temperature stabilisation of the light source or the mechanical setup, which is a major contribution to the mentioned improvements. We also developed a simple system for zero-air generation which uses silica gel and activated carbon for NO2 scrubbing, thus allowing routine operation without compressed gas cylinders, which is an important simplification in particular for campaign or mobile operation.
The absolute accuracy of our ICAD NO2 was verified in the laboratory using a NO2 calibration source where we found an almost perfect 1:1 correspondence with an error of less than 2 % and a correlation coefficient of R=0.99996. The good accuracy was verified under ambient air conditions during two 24 and 28 d long inter-comparisons with commercial NO–NO2 chemiluminescence detectors (CLD 770 AL ppt with BLC and Horiba APNA-370). The inter-comparison also showed the good long-term stability of the instrument and a significant calibration drift could not be observed.
We found that our ICAD NO2 instrument is so robust that even strong vibrations, as encountered in a car during driving, do not disturb the measurement accuracy, allowing a simple application to mobile platforms. This was demonstrated in a pilot study where the instrument was applied to car measurements in the Mannheim–Ludwigshafen urban area, which are to our knowledge the first car-based measurements with a cavity instrument.
On the basis of the here-presented ICAD method and instrument, an even smaller ICAD NO2 instrument (size cm3) was developed by Airyx GmbH (see http://www.airyx.de, last access: 14 June 2019).
The ICAD method was patented with PCT/EP2016/068344, US and CN patents pending.
Data used in this publication are available from the corresponding author on request (martin.horbanski@iup.uni-heidelberg.de).
The supplement related to this article is available online at: https://doi.org/10.5194/amt-12-3365-2019-supplement.
The authors declare that they have no conflict of interest.
This article is part of the special issue “Advances in cavity-based techniques for measurements of atmospheric aerosol and trace gases”. It is not associated with a conference.
The authors would like to thank Horst Fischer and Uwe Parchatka from MPIC, Mainz for helping with the calibrations of the CLDs and allowing us to use their laboratory for the instrument characterisation. We further would like to thank Horiba Europe GmbH and especially Stefan Karwisch for providing instruments and support for our inter-comparison in 2017. We acknowledge financial support by Deutsche Forschungsgemeinschaft within the funding programme Open Access Publishing, by the Baden-Württemberg Ministry of Science, Research and the Arts and by Ruprecht-Karls-Universität Heidelberg.
This paper was edited by Katherine Manfred and reviewed by three anonymous referees.
Allan, D. W.: Statistics of atomic frequency standards, P. IEEE, 54, 221–230, https://doi.org/10.1109/PROC.1966.4634, 1966. a
Ball, S. M., Langridge, J. M., and Jones, R. L.: Broadband cavity enhanced absorption spectroscopy using light emitting diodes, Chem. Phys. Lett., 398, 68–74, https://doi.org/10.1016/j.cplett.2004.08.144, 2004. a
Bodhaine, B., Wood, N., Dutton, E., and Slusser, J. R.: On Rayleigh Optical Depth Calculations, J. Atmos. Ocean. Tech., 16, 1854–1861, https://doi.org/10.1175/1520-0426(1999)016<1854:ORODC>2.0.CO;2, 1999. a, b
Buxmann, J., Balzer, N., Bleicher, S., Platt, U., and Zetzsch, C.: Observations of bromine explosions in smog chamber experiments above a model salt pan, Int. J. Chem. Kinet., 44, 312–326, https://doi.org/10.1002/kin.20714, 2012. a
Engeln, R., Berden, G., Peeters, R., and Meijer, G.: Cavity enhanced absorption and cavity enhanced magnetic rotation spectroscopy, Rev. Sci. Instrum., 69, 3763, https://doi.org/10.1063/1.1149176, 1998. a
Fiedler, S. E.: Incoherent Broad-Band Cavity-Enhanced Absorption Spectroscopy, PhD thesis, Technische Universität Berlin, https://doi.org/10.14279/depositonce-1087, 2005. a, b
Fiedler, S. E., Hese, A., and Ruth, A. A.: Incoherent broad-band cavity-enhanced absorption spectroscopy, Chem. Phys. Lett., 371, 284–294, https://doi.org/10.1016/S0009-2614(03)00263-X, 2003. a
Frankenberg, C., Platt, U., and Wagner, T.: Iterative maximum a posteriori (IMAP)-DOAS for retrieval of strongly absorbing trace gases: Model studies for CH4 and CO2 retrieval from near infrared spectra of SCIAMACHY onboard ENVISAT, Atmos. Chem. Phys., 5, 9–22, https://doi.org/10.5194/acp-5-9-2005, 2005. a
Hermans, C., Vandaele, A. C., Carleer, M., Fally, S., Colin, R., Jenouvrier, A., Coquart, B., and Merienne, M.-F.: Absorption cross-sections of atmospheric constituents: NO2, O2, and H2O, Environ. Sci. Pollut. Res., 6, 151–158, https://doi.org/10.1007/BF02987620, 1999. a, b
Kennedy, O. J., Ouyang, B., Langridge, J. M., Daniels, M. J. S., Bauguitte, S., Freshwater, R., McLeod, M. W., Ironmonger, C., Sendall, J., Norris, O., Nightingale, R., Ball, S. M., and Jones, R. L.: An aircraft based three channel broadband cavity enhanced absorption spectrometer for simultaneous measurements of NO3, N2O5 and NO2, Atmos. Meas. Tech., 4, 1759–1776, https://doi.org/10.5194/amt-4-1759-2011, 2011. a
Kraus, S. G.: DOASIS A Framework Design for DOAS, PhD thesis, University of Mannheim, Germany, 2006. a
Langridge, J. M., Ball, S. M., and Jones, R. L.: A compact broad band cavity enhanced absorption spectrometer for detection of atmospheric NO2 using light emitting diodes, Analyst, 131, 916–922, https://doi.org/10.1039/B605636A, 2006. a, b
Langridge, J. M., Ball, S. M., Shillings, A. J. L., and Jones, R. L.: A broadband absorption spectrometer using light emitting diodes for ultrasensitive, in situ trace gas detection, Rev. Sci. Instrum., 79, 123110, https://doi.org/10.1063/1.3046282, 2008. a, b
Laurila, T., Burns, I. S., Hult, J., Miller, J. H., and Kaminski, C. F.: A calibration method for broad-bandwidth cavity enhanced absorption spectroscopy performed with supercontinuum radiation, Appl. Phys. B, 102, 271–278, https://doi.org/10.1007/s00340-011-4818-3, 2011. a
Liang, S., Qin, M., Xie, P., Duan, J., Fang, W., He, Y., Xu, J., Liu, J., Li, X., Tang, K., Meng, F., Ye, K., Liu, J., and Liu, W.: Development of an incoherent broadband cavity-enhanced absorption spectrometer for measurements of ambient glyoxal and NO2 in a polluted urban environment, Atmos. Meas. Tech., 12, 2499–2512, https://doi.org/10.5194/amt-12-2499-2019, 2019. a
Mayer, H., Haustein, C., and Matzarakis, A.: Air Pollution VII, chap. Urban air pollution caused by motor-traffic, 251–260, WIT PRESS, Southhampton, 1999. a
Meinen, J., Thieser, J., Platt, U., and Leisner, T.: Technical Note: Using a high finesse optical resonator to provide a long light path for differential optical absorption spectroscopy: CE-DOAS, Atmos. Chem. Phys., 10, 3901–3914, https://doi.org/10.5194/acp-10-3901-2010, 2010. a
O'Keefe, A. and Deacon, D. A. G.: Cavity ring-down optical spectrometer for absorption measurements using pulsed laser sources, Rev. Sci. Instrum., 59, 2544, https://doi.org/10.1063/1.1139895, 1988. a
O'Keefe, A., Scherer, J., and Paul, J.: cw Integrated cavity output spectroscopy, Chem. Phys. Lett., 307, 343–349, https://doi.org/10.1016/S0009-2614(99)00547-3, 1999. a
Peeters, R., Berden, G., Apituley, A., and Meijer, G.: Open-path trace gas detection of ammonia based on cavity-enhanced absorption spectroscopy, Appl. Phys. B, 71, 231–236, https://doi.org/10.1007/s003400000302, 2000. a
Perner, D., Ehhalt, D. H., Pätz, H.tz, H. W., Platt, U., Röth, E. P., and Volz, A.: OH radicals in the lower troposphere, Geophys. Res. Lett., 3, 466–468, 1976. a
Platt, U. and Stutz, J.: Differential Optical Absorption Spectroscopy – Principles and Application, Springer, Heidelberg, Germany, 1. edn., 2008. a, b
Platt, U., Perner, D., and Pätz, H.: Simultaneous measurements of atmospheric CH2O, O3 and NO2 by differential optical absorption, J. Geophys. Res., 84, 6329–6335, https://doi.org/10.1029/JC084iC10p06329, 1979. a, b
Platt, U., Meinen, J., Pöhler, D., and Leisner, T.: Broadband Cavity Enhanced Differential Optical Absorption Spectroscopy (CE-DOAS) – applicability and corrections, Atmos. Meas. Tech., 2, 713–723, https://doi.org/10.5194/amt-2-713-2009, 2009. a, b, c, d
Rothman, L., Gordon, I., Barber, R., Dothe, H., Gamache, R., Goldman, A., Perevalov, V., Tashkun, S., and Tennyson, J.: HITEMP, the high-temperature molecular spectroscopic database, J. Quant. Spectrosc. Ra., 111, 2139–2150, https://doi.org/10.1016/j.jqsrt.2010.05.001, 2010. a
Shardanand, S. and Rao, P. A. D.: Absolute Rayleigh scattering cross sections of gases and freons of stratospheric interest in the visible and ultraviolet regions, Tech. rep., NASA, 1977. a
Stutz, J. and Platt, U.: Numerical analysis and error estimation of differential optical absorptin spectroscopy measurements with least squares methods, Appl. Opt., 35, 6041–6053, https://doi.org/10.1364/AO.35.006041, 1996. a
Thalman, R. and Volkamer, R.: Inherent calibration of a blue LED-CE-DOAS instrument to measure iodine oxide, glyoxal, methyl glyoxal, nitrogen dioxide, water vapour and aerosol extinction in open cavity mode, Atmos. Meas. Tech., 3, 1797–1814, https://doi.org/10.5194/amt-3-1797-2010, 2010. a, b
Vandaele, A., Hermans, C., Fally, S., Carleer, M., Colin, R., Mérienne, M.-F., Jenouvrier, A., and Coquart, B.: High-resolution Fourier transform measurement of the NO2 visible and near-infrared absorption cross-section: Temperature and Pressure effects, J. Geophys. Res., 107, 4348, https://doi.org/10.1029/2001JD000971, 2002. a, b, c
Varma, R. M., Venables, D. S., Ruth, A. A., Heitmann, U., Schlosser, E., and Dixneuf, S.: Long optical cavities for open-path monitoring of atmospheric trace gases and aerosol extinction, Appl. Opt., 48, B159–B171, https://doi.org/10.1364/AO.48.00B159, 2009. a
Venables, D. S., Gherman, T., Orphal, J., Wenger, J. C., and Ruth, A. A.: High Sensitivity in Situ Monitoring of NO3 in an Atmospheric Simulation Chamber Using Incoherent Broadband Cavity-Enhanced Absorption Spectroscopy, Environ. Sci. Technol., 40, 6758–6763, https://doi.org/10.1021/es061076j, 2006. a
Volkamer, R., Platt, U., and Wirtz, K.: Primary and Secondary Glyoxal Formation from Aromatics: Experimental Evidence for the Bicycloalkyl-Radical Pathway from Benzene, Toluene, and p-Xylene, J. Phys. Chem. A, 105, 7865–7874, https://doi.org/10.1021/jp010152w, 2001. a
Volkamer, R., Spietz, P., Burrows, J., and Platt, U.: High-resolution absorption cross-section of glyoxal in the UV-vis and IR spectral ranges, J. Photoch. Photobio. A, 172, 35–46, https://doi.org/10.1016/j.jphotochem.2004.11.011, 2005. a
Washenfelder, R. A., Langford, A. O., Fuchs, H., and Brown, S. S.: Measurement of glyoxal using an incoherent broadband cavity enhanced absorption spectrometer, Atmos. Chem. Phys., 8, 7779–7793, https://doi.org/10.5194/acp-8-7779-2008, 2008. a, b
Weibring, P., Richter, D., Fried, A., Walega, J., and Dyroff, C.: Ultra-high-precision mid-IR spectrometer II: system description and spectroscopic performance, Appl. Phys. B, 85, 207–218, https://doi.org/10.1007/s00340-006-2300-4, 2006. a
Werle, P., Mücke, R., and Slemr, F.: The limits of signal averaging in atmospheric trace-gas monitoring by tunable diode-laser absorption spectroscopy (TDLAS), Appl. Phys. B, 57, 131–139, https://doi.org/10.1007/BF00425997, 1993. a, b
Wu, T., Zhao, W., Chen, W., Zhang, W., and Gao, X.: Incoherent broadband cavity enhanced absorption spectroscopy for in situ measurements of NO2 with a blue light emitting diode, Appl. Phys. B, 94, 85–94, https://doi.org/10.1007/s00340-008-3308-8, 2009. a
Zheng, K., Zheng, C., Zhang, Y., Wang, Y., and Tittel, F. K.: Review of Incoherent Broadband Cavity-Enhanced Absorption Spectroscopy (IBBCEAS) for Gas Sensing, Sensors, 18, 3646, https://doi.org/10.3390/s18113646, 2018. a, b
Zhu, Y., Chan, K. L., Lam, Y. F., Horbanski, M., Pöhler, D., Boll, J., Lipkowitsch, I., Ye, S., and Wenig, M.: Analysis of spatial and temporal patterns of on-road NO2 concentrations in Hong Kong, Atmos. Meas. Tech., 11, 6719–6734, https://doi.org/10.5194/amt-11-6719-2018, 2018. a
- Abstract
- Introduction
- Cavity-enhanced absorption spectroscopy and basic evaluation schemes
- The ICAD (iterative CE-DOAS) method
- The ICAD NO2 instrument
- Applications
- Conclusions and outlook
- Data availability
- Competing interests
- Special issue statement
- Acknowledgements
- Review statement
- References
- Supplement


