the Creative Commons Attribution 4.0 License.
the Creative Commons Attribution 4.0 License.
 | 13 Sep 2019
Addition of fast gas chromatography to selected ion flow tube mass spectrometry for analysis of individual monoterpenes in mixtures
Michal Lacko
Nijing Wang
Kristýna Sovová
Pavel Pásztor
Patrik Španěl
Soft chemical ionization mass spectrometry (SCI-MS) techniques can be used to accurately quantify volatile organic compounds (VOCs) in air in real time; however, differentiation of isomers still represents a challenge. A suitable pre-separation technique is thus needed, ideally capable of analyses over a few tens of seconds. To this end, a bespoke fast gas chromatography (GC) instrument with an electrically heated 5 m long metallic capillary column was coupled to selected ion flow tube mass spectrometry (SIFT-MS) measurements. To assess the performance of this combination, a case study of monoterpene isomer (C10H16) analyses was carried out. The monoterpenes were quantified by SIFT-MS using H3O+ reagent ions (analyte ions , m∕z 137, and , m∕z 81) and NO+ reagent ions (analyte ions , m∕z 136, and , m∕z 93). The combinations of the fragment ion relative intensities obtained using H3O+ and NO+ were shown to be characteristic of the individual monoterpenes. Two non-polar GC columns (Restek Inc.) were tested: the advantage of MXT-1 was shorter retention, whilst the advantage of MXT-Volatiles was better separation. Thus, it is possible to identify components of a monoterpene mixture in less than 45 s using the MXT-1 column and to separate them in less than 180 s using the MXT-Volatiles column. Quality of the separation and the sensitivity of present technique (limit of detection, LOD, ∼16 ppbv) was found to be inferior compared to commercially available fast GC solutions coupled with proton transfer reaction mass spectrometry (PTR-MS, LOD ∼1 ppbv) due to the limited sample flow through the column. However, using combinations of two reagent ions improved identification of monoterpenes not well resolved by the chromatograms. As an illustrative example, the headspace of needle samples of three conifer species was analysed by both reagent ions and with both columns showing that mainly α-pinene, β-pinene and 3-carene were present. The system can thus be used for direct rapid monitoring of monoterpenes above 20 ppbv, such as applications in laboratory studies of monoterpene standards and leaf headspace analysis. Limitation of the sensitivity due to the total sample flow can be improved using a multi-column pre-separation.
- Article
(1736 KB) - Full-text XML
-
Supplement
(2319 KB) - BibTeX
- EndNote


Monoterpenes, mostly emitted from plants, are very important biogenic volatile organic compounds (BVOCs) in the atmosphere. Due to their high reactivity with atmospheric oxidants such hydroxyl radicals (OH•), oxidation of monoterpenes can lead to tropospheric ozone (O3) accumulation as well as secondary organic aerosol formation, which can affect human health and contribute to global climate change (Chameides et al., 1992; Fehsenfeld et al., 1992; Kulmala et al., 2004). Although all monoterpenes are comprised of two isoprene units, all of which have the same molecular formula, C10H16; their lifetime (inverse to reactivity) for reaction with OH• and O3 varies widely, from minutes to days (Atkinson and Arey, 2003) (see Table 1). The values of the total OH reactivity, which is dominated by BVOCs measured in rainforests, have been found to be higher than expected, which could be attributed to undetected monoterpenes or sesquiterpenes (Nolscher et al., 2016). Therefore, it is important to identify and individually quantify these BVOCs at their ambient trace levels.
Table 1Monoterpenes included in the present study, listed together with their atmospheric lifetime.
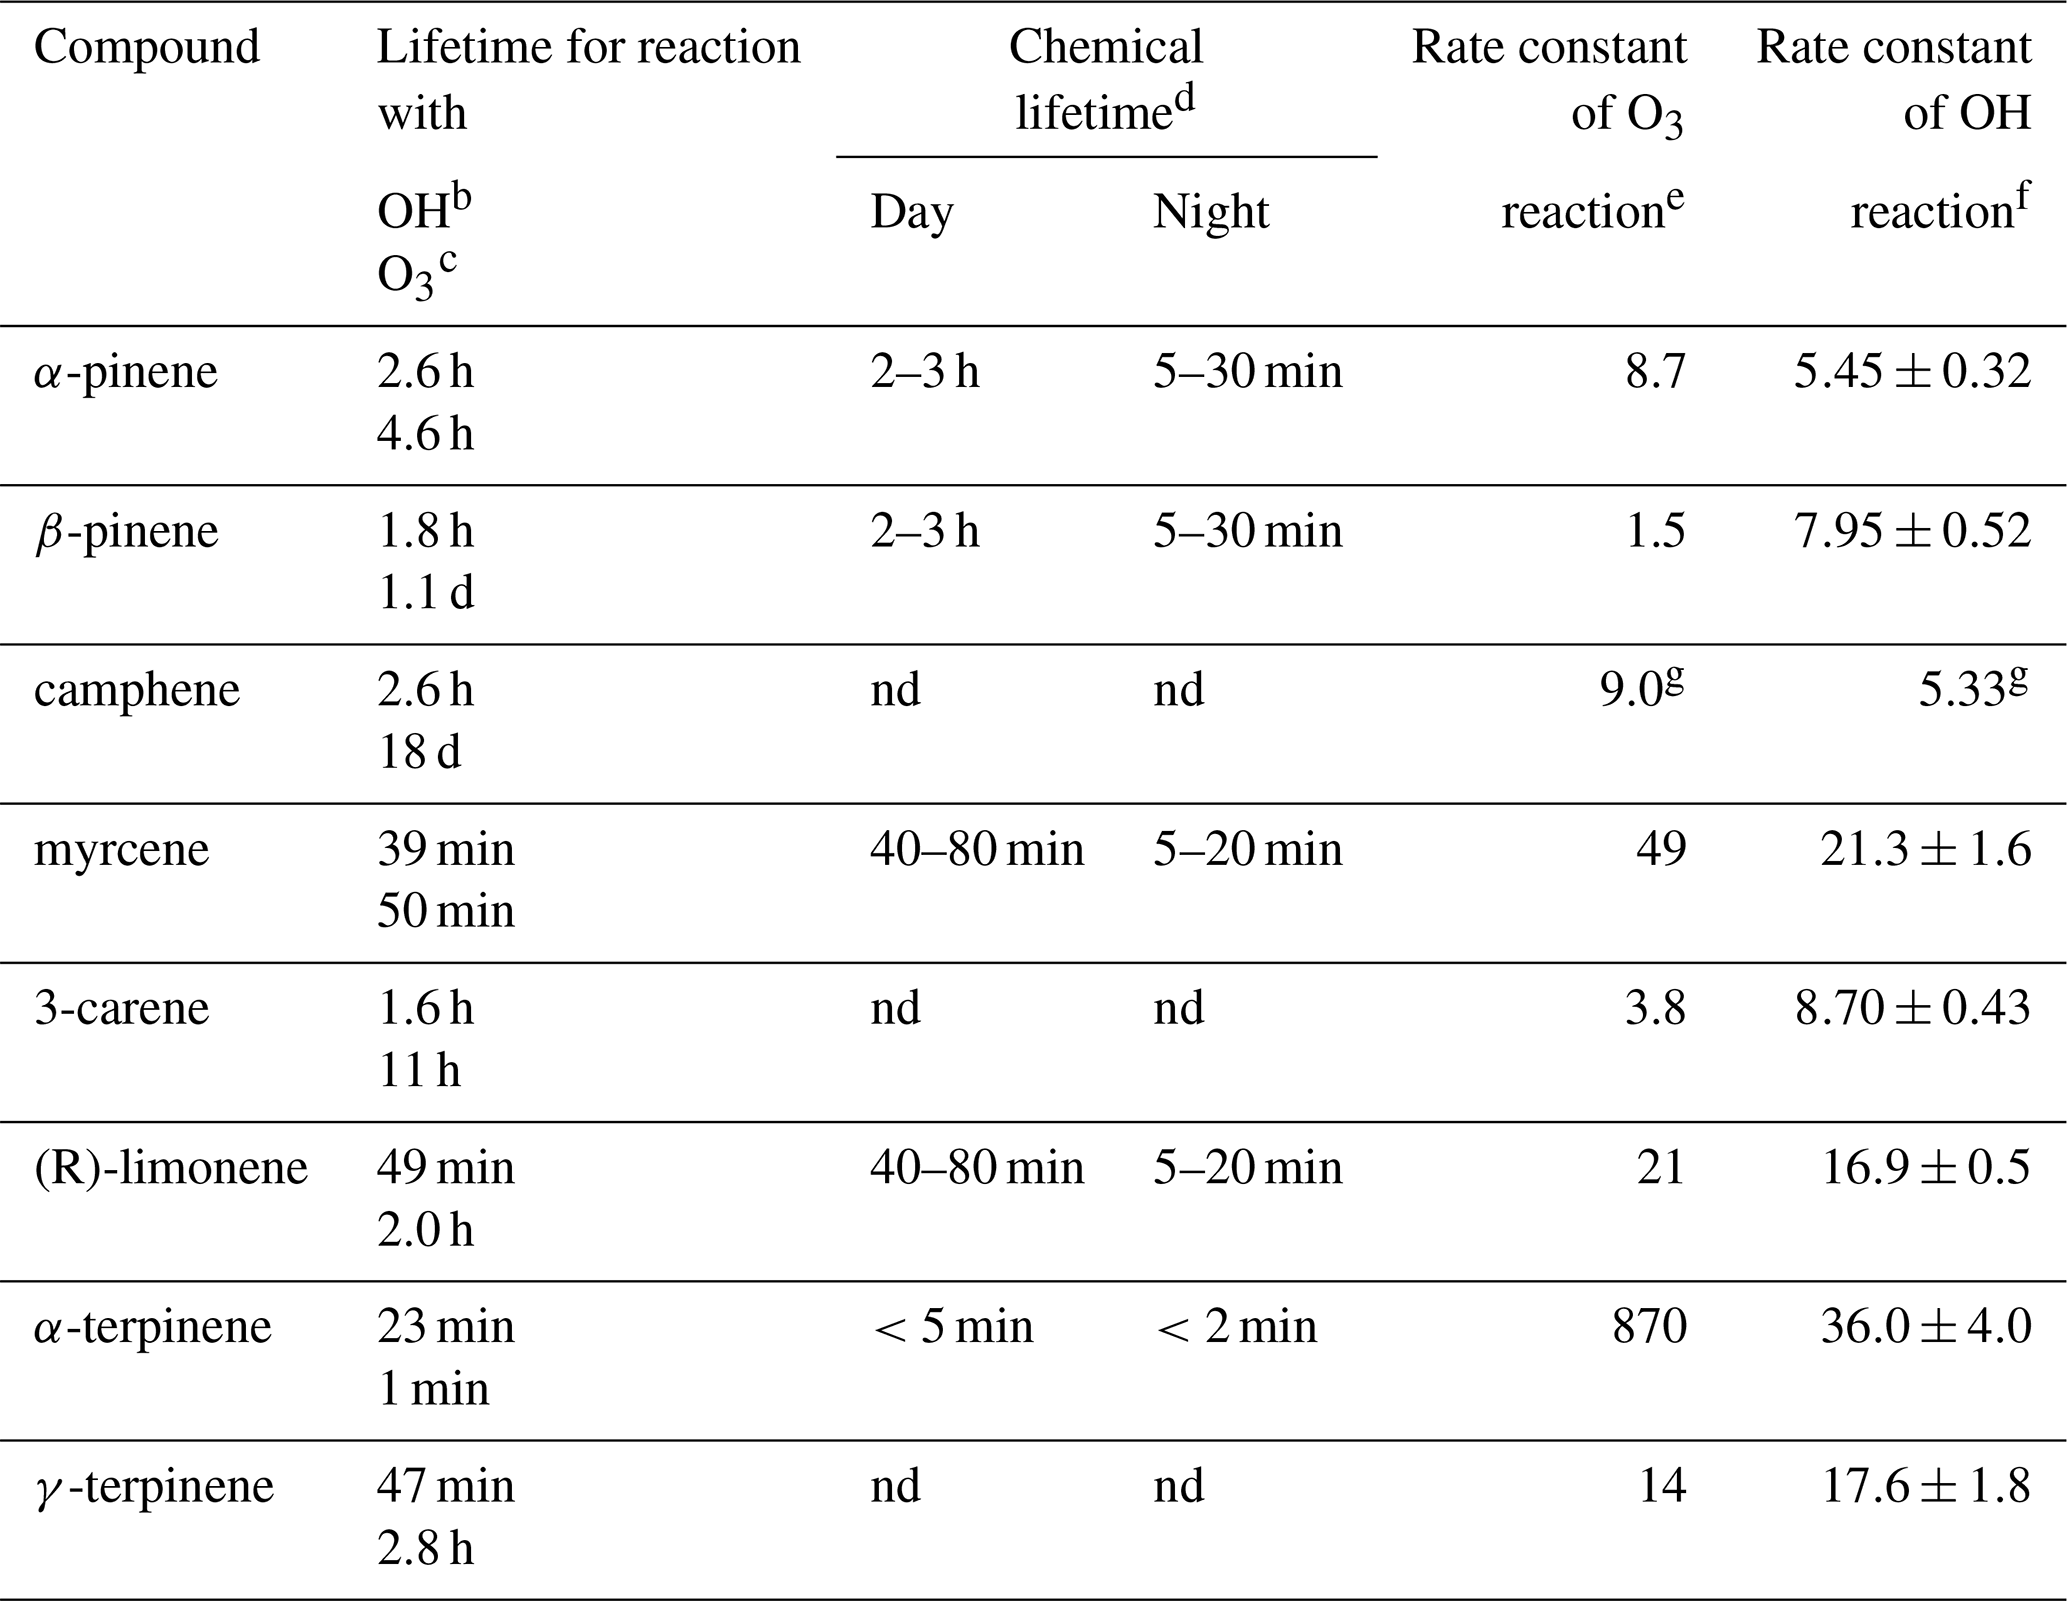
a Taken from Atkinson and Arey (2003) unless noted otherwise. b Assumed OH radical concentration: 2.0×10⁶ molecules cm−3, 12 h daytime average. c Assumed O3 concentration: 7×10¹¹ molecules cm−3, 24 h average. d Lifetimes are estimated in relation to [NO3] = 10 pptv, [O3] = 20 ppb for night and [OH] = 106 molecules cm3, [O3] = 20 ppb for daylight conditions (Kesselmeier and Staudt, 1999) unless noted otherwise. e Rate constants (in units of 10−17 cm3 molecules−1 s−1) for the gas-phase reactions of O3 with a monoterpenes have been determined at 296±2 K and 740 Torr total pressure of air or O2 using a combination of absolute and relative rate techniques (Atkinson et al., 1990) unless noted otherwise. f Rate constants (in units of 10−11 cm3 molecules−1 s−1) for the gas-phase reactions of the OH radical with monoterpenes have been determined in one atmosphere of air at 294±1 K (Atkinson et al., 1986) unless noted otherwise. g Rate constants of k (OH + isoprene) = cm3 molecules−1 s−1. O3 reaction rate constants determined in 10−19 cm3 molecules−1 s−1 units. OH radical reaction rate constants determined in 10−11 cm3 molecules−1 s−1 units (Atkinson et al., 1990). nd: no data.
Standard analytical methods used to identify and quantify volatile organic compounds (VOCs) in air, such as thermal desorption gas chromatography mass spectrometry (TD-GC-MS), are often time-consuming and cannot be used to investigate temporal changes in chemically evolving systems. In contrast, soft chemical ionization mass spectrometry (SCI-MS) techniques, such as selected ion flow tube mass spectrometry (SIFT-MS) (Smith and Španěl, 2011a; Španěl et al., 2006) and proton transfer reaction mass spectrometry (PTR-MS) (Lindinger et al., 1998; Ellis and Mayhew, 2013; Smith and Španěl, 2011b), represent well-established real-time tools for analysing a wide variety of VOCs in ambient air (Amelynck et al., 2013; de Gouw and Warneke, 2007; Malásková et al., 2019; Rinne et al., 2005; Schoon et al., 2003) and in the headspace of biological samples (Shestivska et al., 2011, 2012, 2015). The advantage of SIFT-MS and PTR-MS lies in the possibility of online, real-time analysis obviating sample collection and pre-concentration of VOCs. In these techniques, defined reagent ions (usually H3O+, NO+ or ) interact with trace VOCs present in gas samples introduced into a flow tube or a flow–drift tube. The chemical ionization reactions that produced analyte ions are variously proton transfer, adduct ion formation, charge transfer and hydride ion transfer, principally depending on the type of reagent ions used. This ion chemistry has been thoroughly reviewed in a number of publications (Smith and Španěl, 2005). These ion–molecule reactions are not greatly exothermic, thus few product (analyte) ions result in each reaction that can readily be identified, often just one or two. However, chemically similar molecules with the same atomic composition (structural isomers) usually produce identical analyte ions with similar branching ratios, and therefore the neutral analyte molecules cannot be easily differentiated using SCI-MS alone (Smith et al., 2012). As a result, standard SCI-MS techniques such as SIFT-MS and PTR-MS are limited to reporting concentrations of the sum of monoterpenes presented in the sample, and the composition of the monoterpenes present cannot be determined. However, the reactions of the isomeric molecules may have different rate coefficients with the different reagent ions and lead to product ions at recognizably different branching ratios, depending on their molecular geometry (Jordan et al., 2009; Pysanenko et al., 2009; Španěl and Smith, 1998; Wang et al., 2003). So the concurrent use of the available reagent ions in SIFT-MS analysis can sometimes be used to analyse and identify particular isomers.
Quantitative measurement of monoterpenes is often problematic due to problems of stability of monoterpene mixtures in certified gas standards (Rhoderick and Lin, 2013). Therefore, fresh individual monoterpene standards or monoterpene mixtures can be prepared from liquid standards. To determine an accurate instrument sensitivity to individual monoterpenes, the relative abundance of monoterpene isomers must be known (de Gouw et al., 2003).
Gas chromatography mass spectrometry (GC-MS) coupled with pre-concentration techniques has been developed to successfully identify and quantify different atmospheric monoterpenes (Janson, 1993; Räisänen et al., 2009; Song et al., 2015). However, the requirements of pre-concentration and long cycle time (more than 1 h) are obviously unsuitable for real-time measurements.
A promising approach to the near-real-time analysis of isomeric molecules is to combine both SCI-MS and fast GC methods. Pre-separation provided by fast GC requires short columns with thin active layers, fast temperature ramps, fast injection systems and time resolutions below 5 min (Matisová and Dömötörová, 2003). Materić et al. (2015) established a system using PTR-MS coupled with a fast GC to detect individual monoterpenes and achieved the separation of the six most common monoterpenes at a limit of detection down to 1 ppbv. Pallozzi et al. (2016) then compared a fast CG-PTR time-of-flight (ToF) MS system with traditional GC-MS methods, discussing the limitations of the fast GC peak separation on some BVOCs emitted from plants, including monoterpenes (Pallozzi et al., 2016). The authors then recommended applying longer columns operating with a fast temperature gradient, such as 25 ∘C min−1. SIFT-MS is also widely used in VOCs analyses (Allardyce et al., 2006; Smith and Španěl, 2011b, 2005b), which has well-defined analytical reaction conditions and the H3O+, NO+ and reagent ions can be switched rapidly to analyse time-varying trace gas concentrations in air samples. In the present article, we report experimental developments aimed at selectively analysing individual monoterpenes in mixtures in air using a bespoke fast GC and SIFT-MS combination with H3O+ and NO+ reagent ions. This involved the analysis of both prepared laboratory monoterpene–air mixtures and the headspace of the foliage of different pine trees.
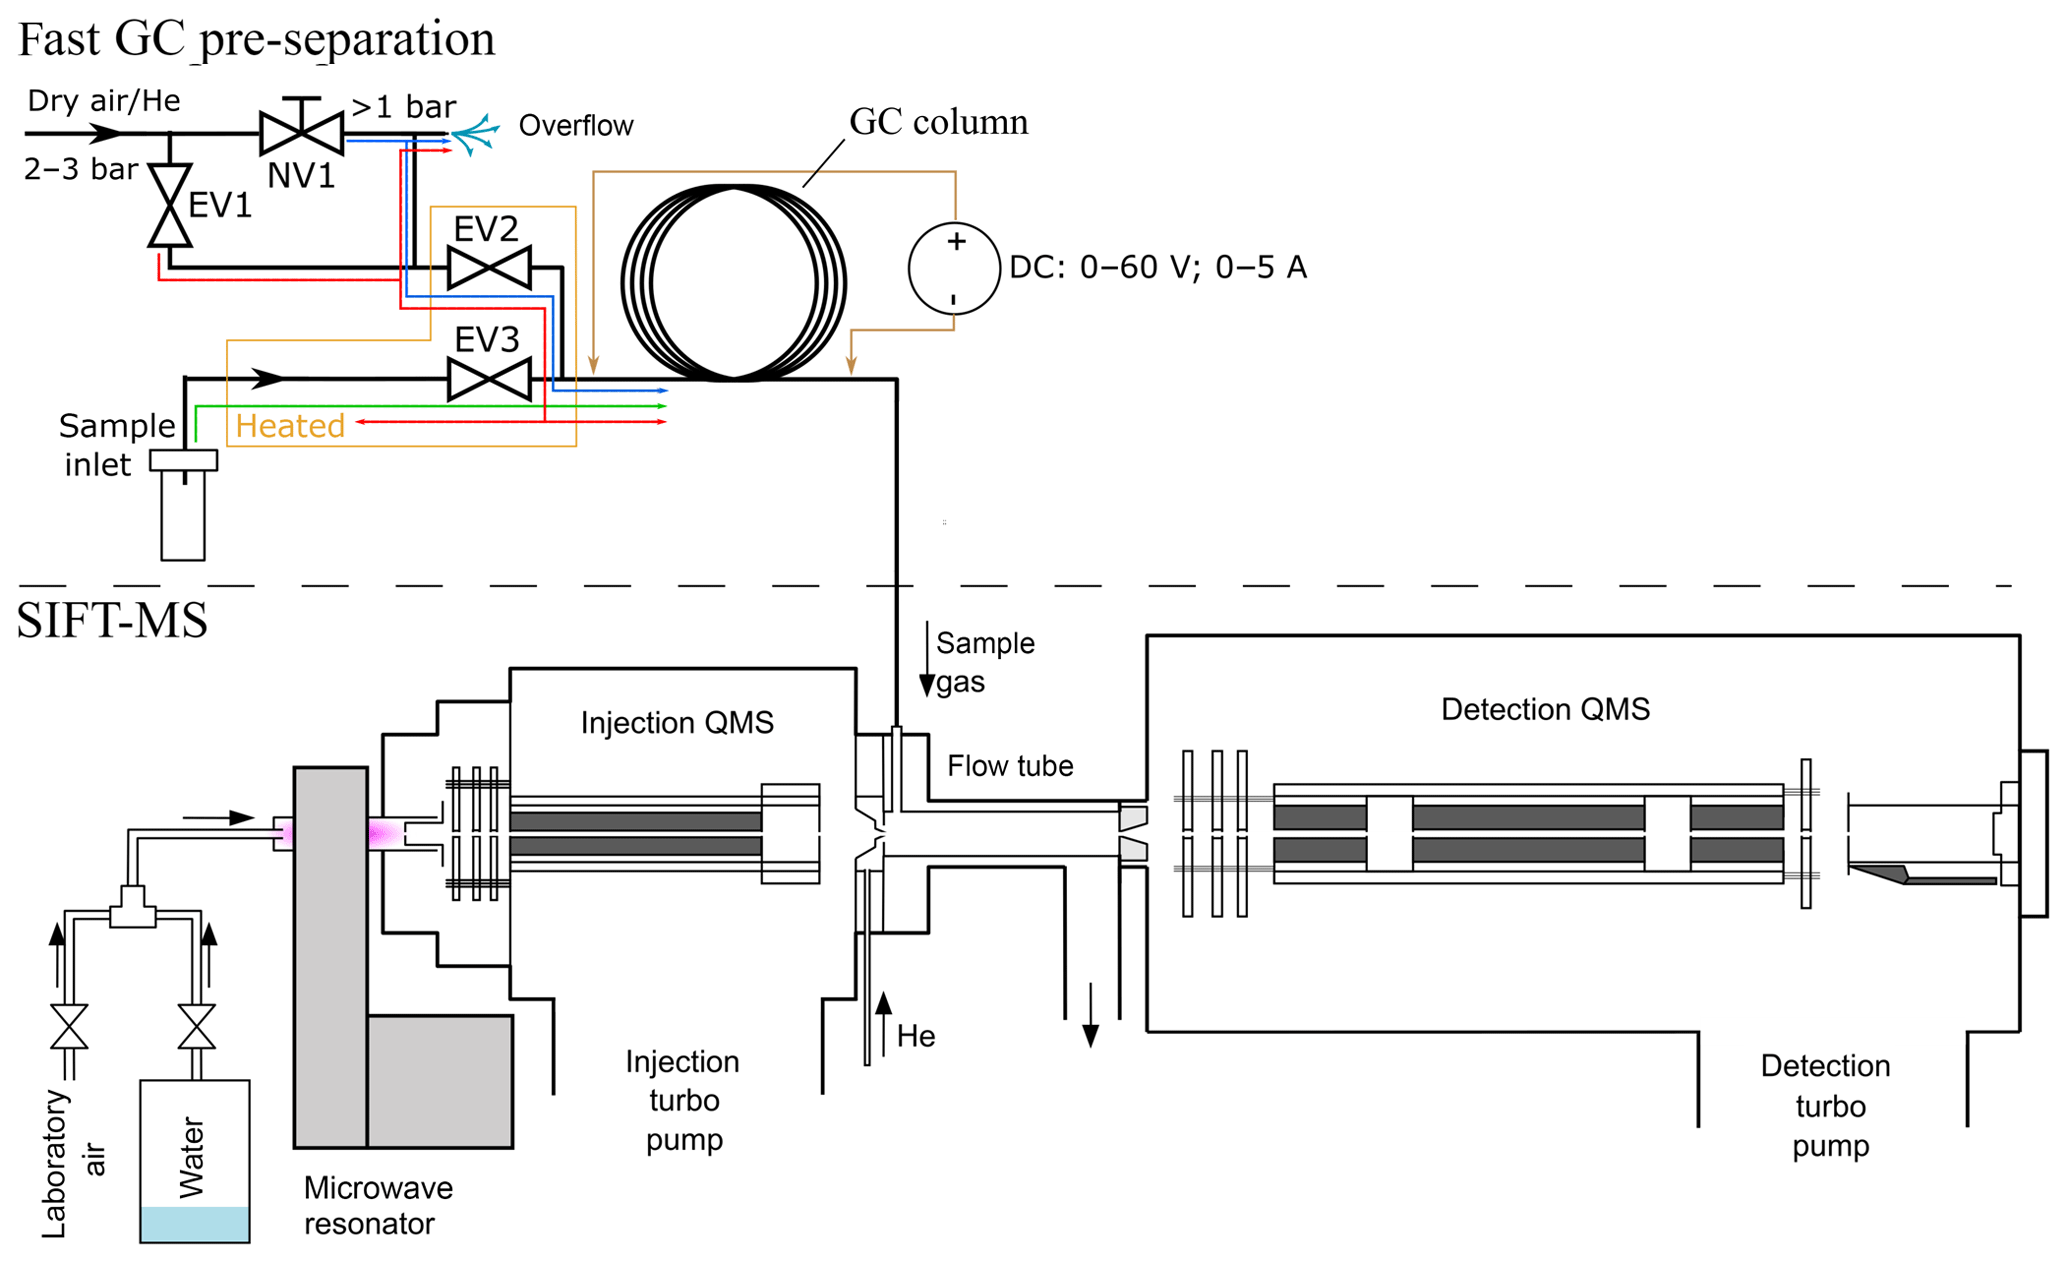
Figure 1Schematic visualization of the fast GC and SIFT-MS experiment. Coloured lines in the inlet part of the fast CG represent gas flow through the system of valves EV1–3. The blue line traces the “normal mode” regime, the green line represents the “sampling mode” and the red line represents the “cleaning mode”.
The experimental setup of the bespoke fast GC setup constructed as an addition to SIFT-MS is shown in Fig. 1. The routing of the sample and the carrier gases was controlled by solenoid valves (Parker VSONC-2S25-VD-F, <30 m s response), labelled in Fig. 1 as EV1, EV2 and EV3. The needle valve NV1 was used in combination with an overflow relief tube to finely adjust the flow rate of the carrier gas (20–50 sccm from a gas cylinder, regulator set to about 2 bar) so that the air pressure at the column entrance is held just above ambient. The region of the sampling input line, EV2, EV3 and their connection with the column are permanently heated to ∼60 ∘C to prevent adsorption of sample gas and vapour and to reduce memory effects.
Three modes of gas flow are possible, as illustrated in Fig. 1.
-
The normal mode. EV2 is open and both EV1 and EV3 are closed. Carrier gas flows through NV1, partly vented via the overflow relief but mostly into the column. The pressure at the column entrance is just above the ambient atmosphere and a constant flow rate of clean carrier gas (synthetic air or helium) is thus achieved.
-
The sampling mode. EV1 and EV2 are closed and EV3 is open. Sample air is introduced into the column over a short period (1 to 12 s), after which the normal mode is resumed.
-
The cleaning mode. All valves are open and the carrier gas taken directly from the cylinder regulator is introduced into the column (higher than normal flow) and purges the sample line via EV3. The overflow relief flow rate is not sufficient to diminish the pressure.
The modes can be switched either manually or remotely by from the SIFT-MS software.
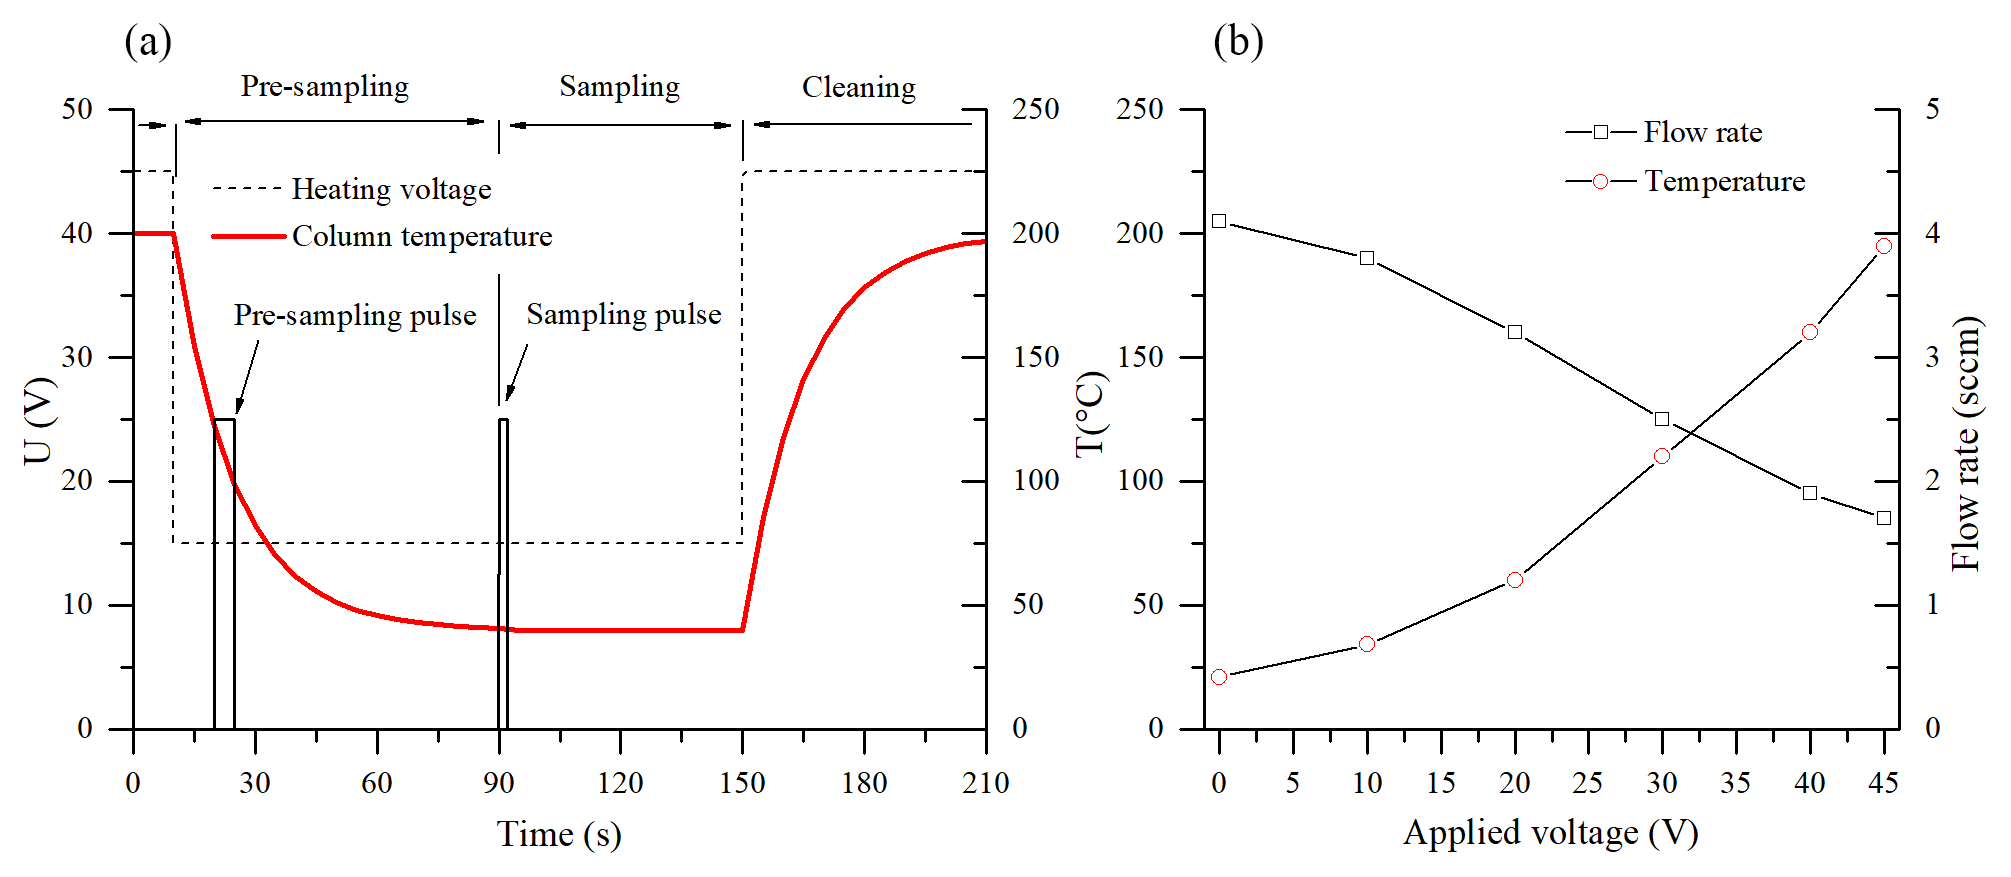
Figure 2(a) The applied heating voltage (dashed) and the temperature profile of the column (red) during the fast GC cycle. The pulses indicate the opening of valve EV3 during the pre-sampling and the sampling periods. (b) The increase in the column temperature and the related decrease in the carrier gas flow rate with the heating voltage.
The operation sequence for air sample analysis is as follows: the column is first heated up to 200 ∘C in the cleaning mode for 3 min prior to commencing the normal mode with an appropriate heating voltage setting (e.g. 15 V as shown in Fig. 2). Whilst the column cools down, a pre-sampling interval (8–10 s sampling mode; see Fig. 2) is applied in order to refill the “dead volume”, comprised of the EV3 valve and the sampling inlet by air at its entrance. After the column reaches working temperature and a steady flow of clean carrier gas is established, the sample for actual analysis is introduced by enabling the sampling mode for a selected time period.
In the experiments, two different GC columns were tested. First, a 5 m long nonpolar general-purpose chromatography metallic column MXT-1 (0.28 mm ×0.1 µm active phase, Restek Inc.) uses dry air as the carrier gas. The column was chosen according to the previous PTR-MS fast GC analyses (Romano et al., 2014). Additionally, a second, application-specific column for volatile organic pollutants, MXT-Volatiles (0.28 mm ×1.25 µm active phase, Restek Inc.), was used with helium carrier gas. In order to facilitate direct resistive heating, the coil-shaped stainless steel columns (resistivity ∼4.2 Ω m−1) were electrically isolated and connected to a regulated 60 V, 5 A DC power supply. Appearance of cold spots was suppressed by ensuring that the electrical current runs through the entire length of the columns. The temperatures of the columns were monitored by a K-type probe connected to their centres (see the right part of Fig. 2 for the temperature variation with applied voltage). It is interesting to note that the flow of sampled air, established by the pressure difference between ambient atmosphere and the low pressure of the SIFT-MS flow tube, changes with the column temperature due to the variation in the dynamic viscosity of the air (see Fig. 2). This effect can be estimated by direct measurement of the column flow rate and has to be accounted for in the quantification calculation (see Eq. 6).
In the initial tests with the first generic MXT-1 column, the sampling mode duration was fixed at 1.8 s due to SIFT-MS software limitations. For the later tests with the second MXT-Volatiles column, the SIFT-MS operational software was upgraded to provide an arbitrary timing of the sampling mode duration, where 6 or 12 s sampling intervals were used. Sampling was repeated several times to improve signal quality. The GC separation then takes place over typically 60–300 s, whilst the eluent is continuously analysed by SIFT-MS. It is possible to apply a heating ramp during this period.
Several heating ramp profiles were tested (see data for MXT-1 column in Fig. S1 in the Supplement); however, due to the short GC column and relatively long injection time, the monoterpene chromatogram peaks coalesced when the column temperature exceeded 60 ∘C and it was found that optimal chromatograms were obtained isothermally at 40 ∘C (15 V heating voltage). Effects of the heating voltage on the retention time and the chromatogram profile are illustrated in Fig. S4 (data for MXT-Volatiles column).
In the present study, a Profile 3 SIFT-MS instrument (Instrument Science, Crewe, UK) was used (Smith et al., 1999). Reagent ions are formed in a microwave discharge through a mixture of water vapour and atmospheric air (see Fig. 1). A mixture of ions is extracted from the discharge and focused into a quadrupole mass filter where they can be analysed according to their mass-to-charge ratio, m∕z. Thus, the reagent ions H3O+, NO+ or can be selected ( was not used in the present experiment) and separately injected into flowing helium carrier gas (pressure p=1.4 mbar; temperature T=24 ∘C). Any internal energy possessed by the reagent ions is rapidly quenched in collisions with helium atoms, leaving a thermalized ion swarm that is convected down the flow tube. Sample gas is introduced into the helium and thermalized swarm at a known flow rate that (in the present experiments) changes with the GC column temperature. The reagent ions react with the VOC molecules in the sample gas during a time period, defined by the known flow speed of the ion swarm and the length of the flow tube. At the end of the flow tube, the ionic products (analyte ions) generated by the analytical ion–molecule reactions are sampled by a pinhole orifice into the analytical quadrupole mass spectrometer. The count rates of the reagent and analyte ions are obtained using a single channel electron multiplier. Thus, full scan (FS) spectra can be obtained over a chosen m∕z range to identify the analyte ions or rapidly switched between selected m∕z values using the multiple-ion monitoring mode (MIM) (Španěl and Smith, 2011a, 2013). For the present monoterpene study, the FS mode was used for SIFT-MS analyses, whilst the MIM mode was used for the fast GC and SIFT-MS setup. The typical count rate of the reagent ions was one million counts per second (cps) while those for the analyte ions were usually below 1 cps. Switching between the H3O+ and NO+ reagent ions required a few milliseconds, depending mainly on the velocity of the carrier gas (12 000 cm s−1) and the length of the flow tube (5 cm). Therefore, the only limiting factor is the software sampling frequency, which depends on the number of monitored ions but is usually below 1 s.
3.1 Reactions of the H3O+ and NO+ reagent ions with monoterpenes
In the present study, SIFT-MS analyses of monoterpenes were carried out using the previously investigated reactions of monoterpenes with H3O+ and NO+ ions (Schoon et al., 2003; Wang et al., 2003). The H3O+ reactions are known to proceed via proton transfer, forming (m∕z 137) ions that partially fragments to (m∕z 81) by the elimination of a C4H8 moiety from the nascent (C10H17) excited ion.
The known values of the proton affinities (PA) of α-pinene, camphene (both 878 kJ mol−1) (Solouki and Szulejko, 2007) and (R)-limonene (875 kJ mol−1) (Fernandez et al., 1998) are well above the PA of water (691 kJ mol−1) (NIST, 2019). The excess energy following proton transfer (almost 2 eV) allows the observed dissociation to occur.
NO+ reacts with monoterpenes by charge transfer, forming the parent cation (m∕z 136) and a number of fragment ions, including .
The exothermicity of the charge transfer in Reaction 2a is represented by the difference between the ionization energies of the neutral NO (9.26 eV) and that for the particular monoterpene (ranging from 8.07 eV for α-pinene to 8.4 eV for (R)-limonene) (Garcia et al., 2003; NIST, 2019). Other fragment ions, including , , and , are also seen and the branching ratios between the channels (Reactions 2a to 2b) and other fragments depend on the isomeric structure of the monoterpene (Schoon et al., 2003; Wang et al., 2003). The branching ratios are given in Table S1 in the Supplement. Based on this known ion chemistry, for the present study the monoterpene analysis was accomplished using both the H3O+ reagent ions (recording the (m∕z 137) and (m∕z 81) analyte ions) and NO+ reagent ion (recording the (m∕z 136) and (m∕z 93) analyte ions). To facilitate identification of specific monoterpenes on the basis of the branching ratios of Reactions (1) and (2), the analyte ion signal ratios and were determined under the same conditions as the Profile 3 SIFT-MS instrument as used for the standard monoterpene mixtures. These branching ratios (r), given in Table 2, are discussed in Sect. 4.2.
The interaction of the primary ions with monoterpenes may be affected by the presence of neutral water molecules and thus by different sample humidity. Wang et al. (2003) first reported this phenomenon when observing a change of the product ion signal ratio, r, in the reactions (see Sect. 3.2). For H3O+ reagent ions, this change was significant for β-pinene (r reducing from 0.75 to 0.51), (R)-limonene (0.45 to 0.34) and 3-carene (0.33 to 0.23). For the NO+ reagent ion, a significant effect was observed only for α-pinene (0.32 to 0.08) and β-pinene (0.25 to 0.05). The decrease in r can be explained by the formation of hydrates in the reagent ions. It can be shown that the PA of monoterpenes is sufficiently high to allow direct proton transfer from H3O+H2O ions.
3.2 Analysis of the product ion intensity ratios
To facilitate assignment of the fast GC elution peaks to specific monoterpenes, mean fragment ion fractions (or, for NO+, ) were calculated for each interval of retention times t1 to t2, as the weighted mean of the product ion signal ratios :
The weights (wi) applied to each of several discrete measurements were based on the total signal count rates of both ions fi and gi in order to emphasize the area within the peak. Time intervals t1 to t2 were chosen for each isomer as the area of the chromatographic peak where the total ion signal was >10 % of the peak value.
The quality of the ratio estimation was assessed from the variation in the fi∕gi ratio estimated as
where μf and μg represent intensities of the selected fragments and and are the variances of the μf and μg intensities, estimated according to the Poisson distribution as the sum of distribution variance equal to the expected value λ=μ and background variance (Van Kempen and Van Vliet, 2000).
From this variation, the standard error of the weighted mean was calculated as follows:
The weighted standard deviation of the fi∕gi ratios was also routinely calculated as follows:
3.3 Fast GC and SIFT-MS limits of detection and quantification
The total amount of eluting analyte, C, in each GC peak is determined by SIFT-MS from the area under the curve from the number density of the analyte molecules [M] (Španěl et al., 2006) in the flow tube recorded as a function of time, t, according to the following equation:
where NA is the Avogadro constant and S is the constant volume flow rate of the sample and carrier gas mixture flowing into the SIFT-MS carrier gas as determined by the pumping speed of the SIFT-MS primary vacuum pump. Note that the flow rate of GC eluent gas does not enter this calculation and does not directly affect the determined amount of analyte expressed in nanomoles, nmol. [M] is calculated by the Profile 3 software according to the SIFT-MS general method for the calculation of absolute trace gas concentrations from the reagent and product ion count rates, the reaction rate constants (see Table S1), and the reaction time considering differential diffusion losses (see Eq. 15 in Španěl et al., 2006).
The amount of neutral analyte (monoterpene) is proportional to its concentration [A] in sampled air and the sampled volume, V, given by the sampling flow rate (usually 3 sccm) and sampling time (1.8 to 12 s) as follows:
where [Vm] = 24.0 L mol−1 is the molar volume of air at 293 K. Note that the sampled volume, V, calculated from the sampling flow rate and sampling time, changes with the column temperature as mentioned previously. The flow rate needs to be carefully determined by a direct flow measurement.
The limit of detection (LOD) was determined for α-pinene and (R)-limonene from analysis of a calibration curve as 3 times the standard error of the predicted intercept value divided by the slope of the calibration regression line (Graus et al., 2010). α-pinene and (R)-limonene were chosen as they have the lowest and the highest reaction rate constants for proton transfer (2.3 for α-pinene and 2.6 for (R)-limonene, in 10−9 cm3 s−1). For a reagent ion the count rate was 106 counts s−1, with a 12 s sampling interval and the LOD of the current setup was found to be 16.3 ppbv for α-pinene and 19.5 ppbv for (R)-limonene, using the column temperature 40 ∘C. For a column temperature 69 ∘C, the LOD for α-pinene decreased to 6.1 ppbv.
3.4 Reference chemicals and plant samples
All monoterpenes used in the experiments, i.e. (+)–α-pinene (98 %), (+)–β-pinene (≥98.5 % analytical standard), camphene (95 %), myrcene (≥90 % analytical standard), 3-carene (≥98.5 % analytical standard), (+)–(R)-limonene (≥99.0 % analytical standard), α-terpinene (≥95 %) and γ-terpinene (97 %), were purchased from Sigma-Aldrich. Individual monoterpene vapour standards and monoterpene vapour mixtures were prepared using the diffusion tube method (Thompson and Perry, 2009). Thus, for individual standards, about 5 µL of each monoterpene liquid was placed in a 2 mL vial closed by polytetrafluoroethylene (PTFE) septum caps. Each vial was then penetrated with a diffusion tube (0.0625 in. outer diameter × 0.010 in. inner diameter × 5 cm in length PEEK capillary) and placed into a 15 mL glass vial closed by a PTFE septum. The headspace of the 15 mL vial was sampled after stabilization (>30 min) of the concentration. The humidity of the headspace was typically 1.5 % water vapour by volume, as determined by SIFT-MS. For α-pinene, the vapour concentration was too high and thus it had to be reduced by placing only a much smaller amount of the sample into the 2 mL vial. For the mixture preparations, a similar approach was used in which several vials containing different monoterpenes, penetrated by PEEK capillaries, were placed together into a 500 mL bottle. Note that the concentrations of the individual isomers in the mixture were different due to the variations in the saturated vapour pressures of their liquids. The same mixture was used for H3O+ and NO+ experiments with the MXT-1 column.
To demonstrate the applicability of the fast GC and SIFT-MS analyses to real samples, three different types of coniferous tree needles were prepared: spruce (Picea pungens), fir (Abies concolor) and pine (Pinus nigra) (see Figs. S5–S7). For the first study using the MXT-1 column, the needle samples (0.26 g spruce, 0.42 g fir and 0.32 g pine) were collected in the urban area of Prague (June 2017) and placed into 10 mL vials from which the headspace was sampled 30 min after harvesting. For the later study using the MXT-Volatiles column, pine tree twigs were collected (June 2018) from the same trees (21.8 g spruce, 21.4 g fir and 20.6 g pine). The exposed cuts of the twigs were sealed by wrapping parafilm around the cut. The samples were placed into a Nalophan bag with a volume of approximately 1 L. During the analyses, the analytical laboratory was thermalized to the outdoor temperature (about 30 ∘C) to reduce thermal shock to the samples. In the laboratory, only a scattered natural light was present.
To investigate if the various monoterpenes in a mixture could be effectively distinguished using SIFT-MS enhanced by the fast GC pre-separation, eight common biogenic monoterpenes were investigated. Individual monoterpene standards were analysed first with both MXT-1 and MXT-Volatiles column to obtain the instrument response in terms of retention times and product ion ratios using the two reagent ions H3O+ and NO+. Then, the separation of monoterpenes was demonstrated through analysis of a prepared monoterpene mixture. Separation of both GC columns was compared using isothermal GC at a temperature of 40 to 45 ∘C. The elution times of all studied monoterpenes were within 45 s of the total retention time for MXT-1 column and within 180 s for the MXT-Volatiles column. Using the information on the ratios of ion products for the H3O+ and NO+ reactions together with the GC retention times, it was possible to identify the composition of a reference standard mixture. Finally, the same procedure was used to analyse the leaf headspace of three coniferous samples to demonstrate the analysis of real samples.
4.1 Comparison of columns: MXT-1 vs. MXT-Volatiles
In the present experiment both columns were heated isothermally to approximately 40 ∘C, selected to optimize temperature stability and chromatographic separation (see Fig. S4). For higher temperatures, the monoterpene chromatogram peaks coalesced, while for lower temperatures a significant influence of the lab air temperature fluctuations was apparent. However, even at these optimized conditions for the MXT-1 column, monoterpenes are not fully separated, and thus fast GC with the MXT-1 column alone (at 40 ∘C) provides only qualitative analysis.
The retention times determined from the chromatograms obtained for individual monoterpenes at 40 ∘C are given in Table 2 and further supported by Fig. S2. For the MXT-1 column, the apparent difference in retention times observed between the two reagent ions was probably caused by the temperature fluctuations of the column. Whilst the retention times for individual monoterpenes are different, they are not sufficiently stable (i.e. they fluctuate by >1 s; see Table 2) in the present fast GC device for analyses based only on retention time to be reliable. A noticeable effect of ambient temperature on the rate of passive column cooling was observed, resulting in changes of the column temperature profile and thus in variations in the monoterpene retention times. Therefore, for a longer column and a higher temperature it may be reduced. Use of the MXT-Volatiles column resulted in about 5 times longer retention times and better GC peaks separation at the same operational conditions (flow rate, temperature and pressure), due to the higher efficiency of the 1.25 µm active phase (compared to 0.1 µm for MXT-1 column).
The quality of the separation can be increased by using hydrogen as a carrier gas and by a faster sample injection, as demonstrated by Materić et al. (2015) with fast GC PTR-MS where complete separation of monoterpenes was achieved using the MXT-1 column. As observed for both columns, separation can be improved by decreasing the column temperature (see Figs. 3 and S4); however, this increases the chromatogram width.
The performance of both the MXT-1 and MXT-Volatiles columns were compared by analyses of a gas mixture of eight monoterpenes. For the MXT-1 column, four characteristic GC peaks were identified for both reagent ions, marked as A, B, C, and D with retention times of 17.6, 20.8, 26.3, and ∼30 s for H3O+ and 17.5, 20.7, 26.3, and ∼30 s for NO+ (see Fig. 4). Based on the retention times obtained for individual monoterpenes (see Table 2 and Fig. S2), peak A is due to co-elution of α-pinene, camphene, and myrcene; peak B is due to the presence of β-pinene exclusively; and peaks C and D are due to the remaining four monoterpenes, mainly 3-carene and (R)-limonene. Note that the individual peak heights are influenced by the monoterpene-saturated vapour pressures (see Table 2). Using the MXT-1 column under these conditions it is not possible to achieve separate GC peaks for individual monoterpenes; however, qualitative analysis is possible.
The MXT-Volatiles column facilitates identification of all monoterpenes present in the mixture for a column temperature close to room temperature (see Fig. 3). For the MXT-Volatiles tests, the sampling mode was extended to 12 s, representing the collection of approximately 0.6 mL of the monoterpene mixture headspace. At a column temperature 40 ∘C, the monoterpene peaks are well separated; however, α-pinene and camphene are likely to co-elute. It is interesting to note that the chromatogram (see Fig. S4) changes with the temperature of the column and additional peaks appear at higher temperatures, probably as a result of the presence of different conformers. It thus seems that at the column temperature ∼45 ∘C, using 20 V heating voltage (see Fig. 4) in the mixture chromatogram, the small β-pinene is hidden behind the second camphene peak and the α-terpinene peak also disappears (see also the fragmentation analyses later in Sect. 4.2).
Table 2Ratios of the H3O+ and NO+ reaction product ion signals and the GC retention times, s, for the eight monoterpenes at a column temperature of 40 ∘C. Also given are the saturated vapour pressures (Torr). The standard error of the fast GC values for individual monoterpenes estimated by Eq. (3) is less than 5 % (except 8.6 % for camphene) and less than ±0.02 overall.
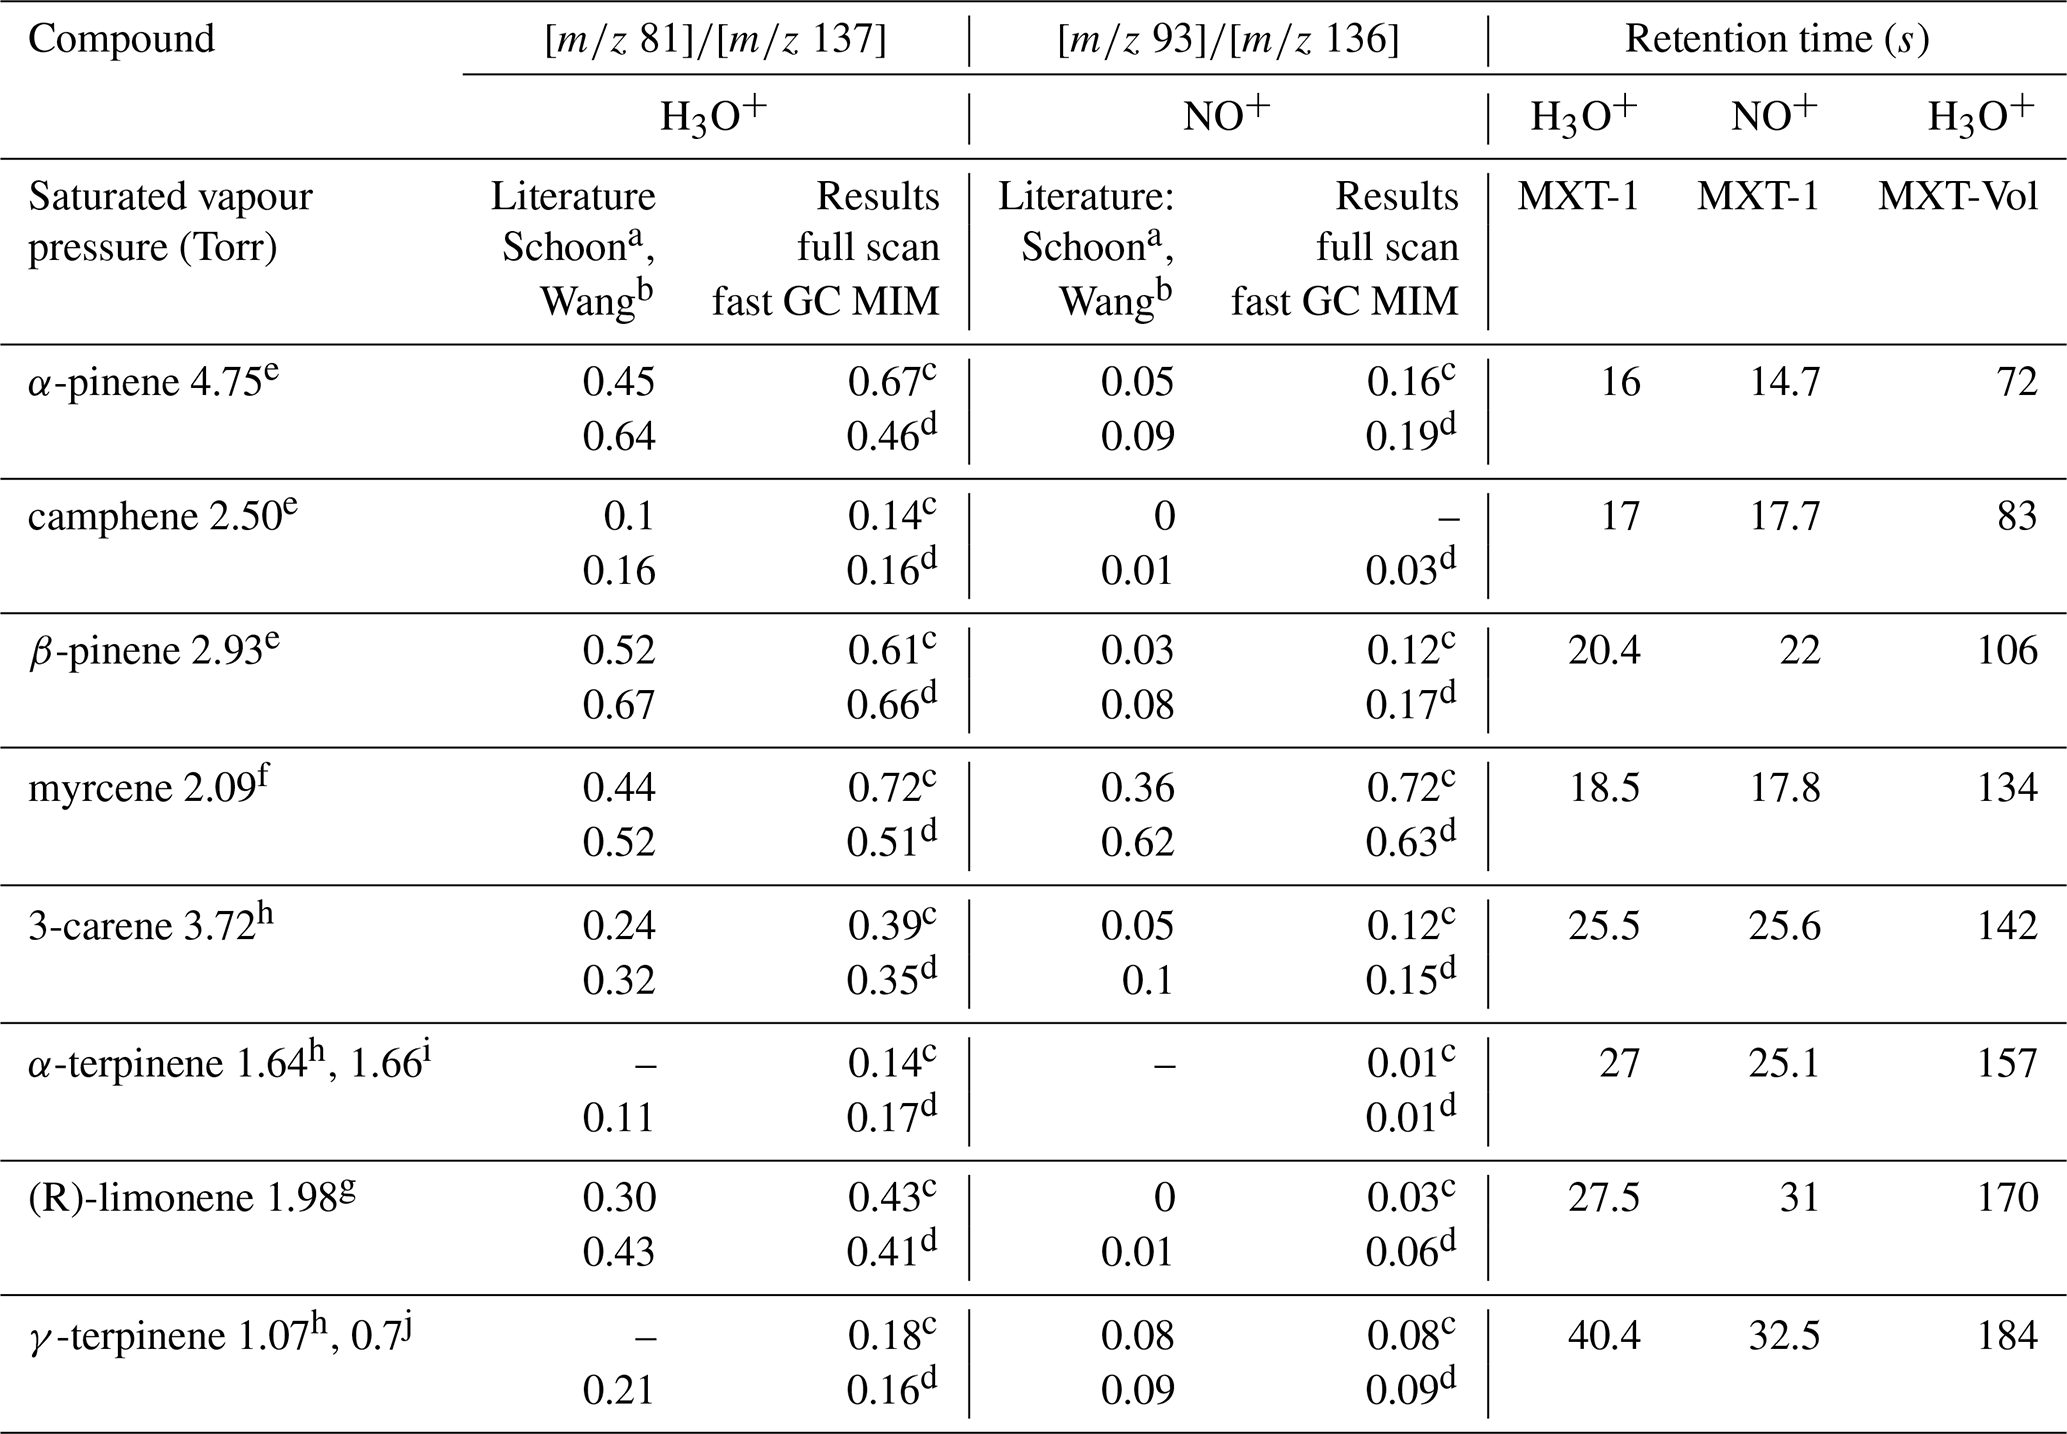
a Schoon et al. (2003). b Wang et al. (2003). c Present result based on SIFT-MS measurement. d Present results based on fast GC and SIFT-MS measurement. Saturated vapour pressures in Torr at 25 ∘C, according to e Daubert (1989), f Haynes (2014), g Yaws (1994), h TGSC, i Takasago (2011), and at 20 ∘C, according to j Chemical Book (2016).
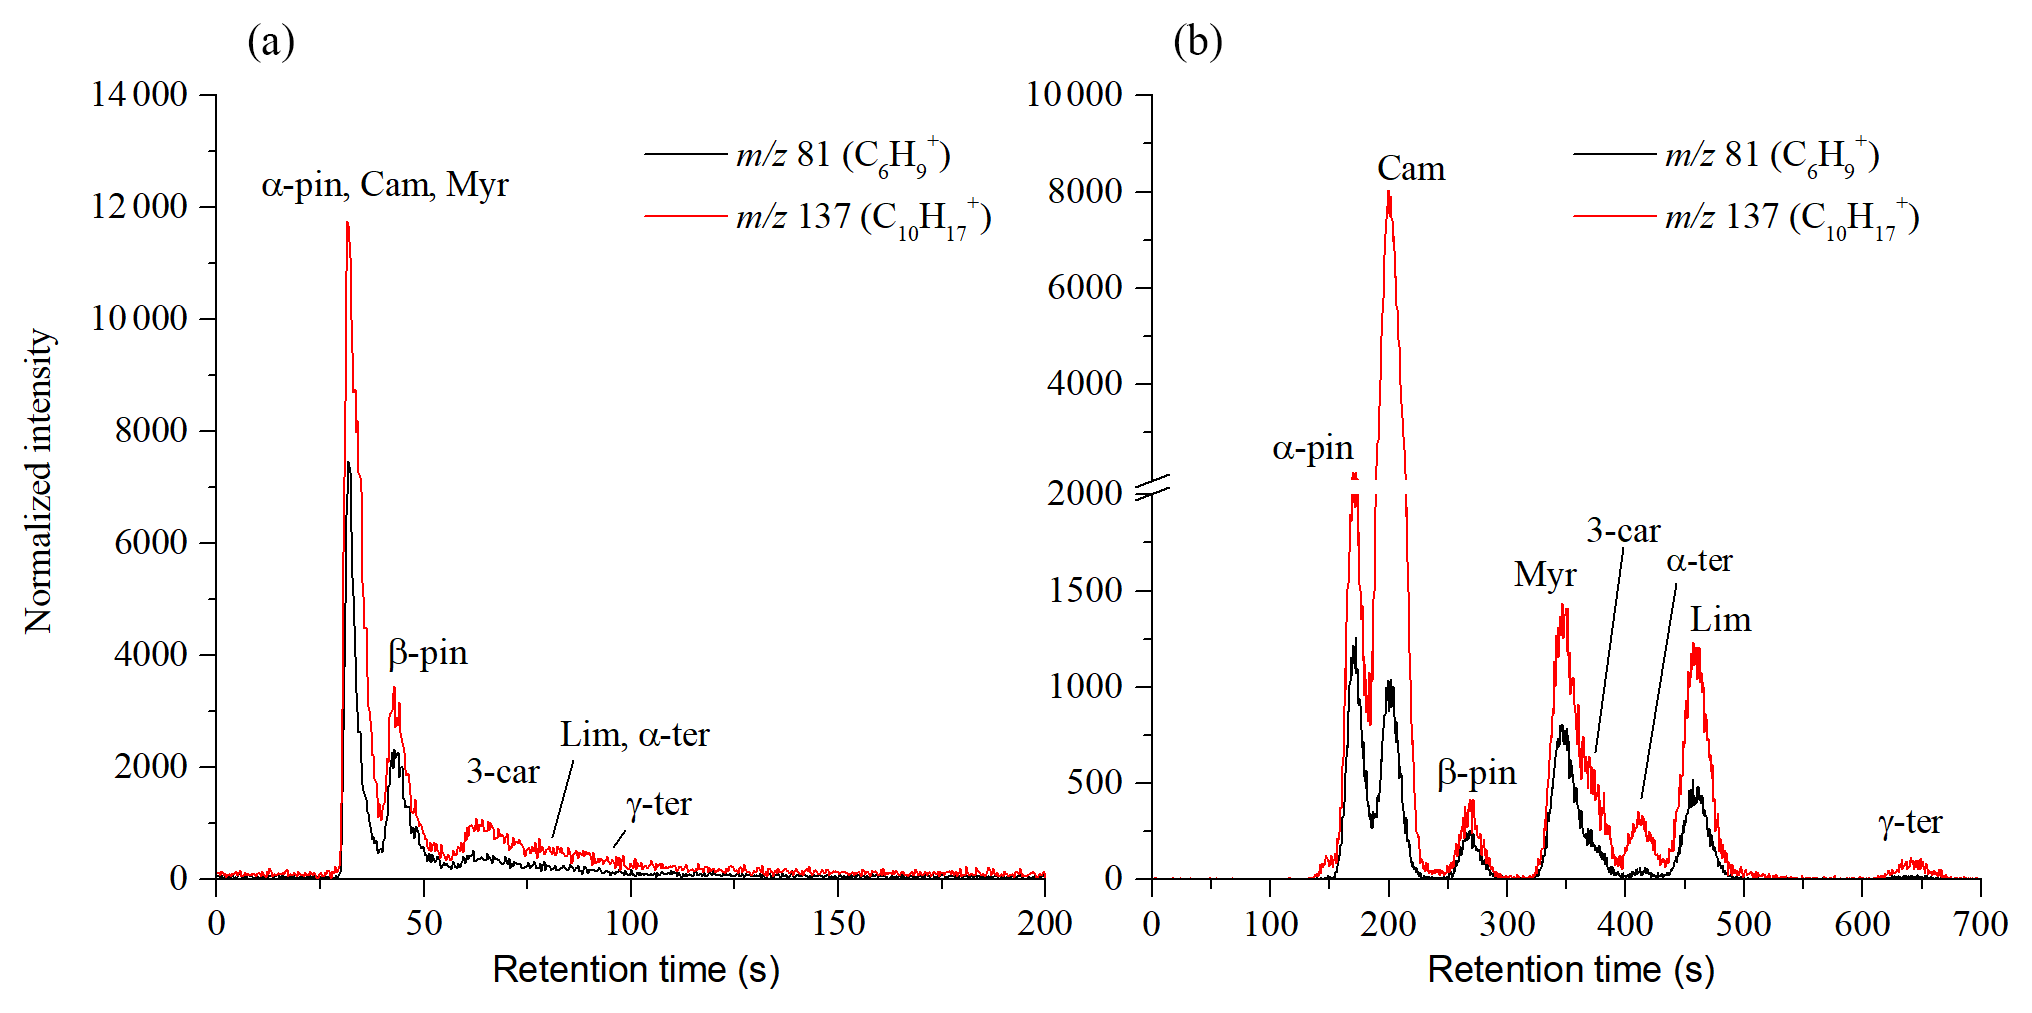
Figure 3Chromatograms of mixtures of monoterpenes at room temperature obtained using the MXT-1 column (a) and the MXT-Volatiles column (b). Chromatogram peaks in the MXT-1 column are not fully separated, but separation takes less than 150 s compared to the 700 s required for the MXT-Volatiles column. The signal intensities are the analyte ion count rates normalized to a H3O+ reagent ion count rate of 106 s−1.
4.2 Analysis of product ratio and use of the NO+ reagent ions
The inadequate separation of monoterpenes due to a short column or high temperature (as for the MXT-1 column) can be mitigated by the analysis of the product ion signal ratios ri (see Sect. 3.2) and additionally by using an additional reagent ion. It may be possible to improve identification of myrcene or camphene (often co-eluted with α-pinene), as well as of other monoterpenes, by exploiting the different ion chemistry of the NO+ reagent ions. These data, in combination with H3O+ data, allow identification of compounds on the basis of the ratios of four different product ions. The NO+ reagent ions were used only for the MXT-1 column because full separation of monoterpenes using H3O+ reagent ions was not achieved and thus retention time cannot be effectively used as a parameter for their identification. However, as will be shown, use of the NO+ reagent ions brings additional benefits and thus it may be a valuable source of information even for fully separated chromatograms. Note that the retention times are determined by the fast GC conditions and do not depend on which SIFT-MS reagent ion is used (see Table 2).
The values (see Table 2) obtained from the SIFT-MS FS data and the MIM data for the fast GC peaks for most of the isomers are in good agreement. However, the ratios obtained for α-pinene and myrcene are somewhat variable between the FS and MIM data and they also differ somewhat from the literature values (α-pinene from 0.45 to 0.67 for H3O+; myrcene from 0.44 to 0.72 for H3O+). This may be caused by the different humidities of the samples, as discussed in Sect. 3.1, where it was seen that an increase in humidity lowers the values. In the fast GC setup, water retention time is much shorter than the retention time for monoterpenes; thus, water influence on the ion chemistry is negligible for most monoterpenes. α-pinene can be slightly affected as it is the first one presented in the chromatogram. Therefore, only values obtained using the fast GC are used for further study. The standard error of the fast GC values for individual monoterpenes estimated by Eq. (3) (using the MXT-1 column) is less than 5 % (except 8.6 % for camphene) and is smaller than the observed variability between the analytical methods. The values for MXT-Volatiles column were similar to those obtained with MXT-1 column, as expected.
Analysis of values can now be used to improve identification of monoterpenes in standard mixtures. For the MXT-1 column, the values for peaks A, B, C and D (see Fig. 4) were calculated as 0.49±0.09, 0.63±0.07, 0.45±0.04 and 0.40±0.05, respectively, for H3O+ and as 0.21±0.05, 0.21±0.04, 0.27±0.06 and 0.14±0.03 for NO+. Based on these ratios (using fast GC data from Table 2), peak B could clearly be assigned as β-pinene. However, the remaining peaks contain several isomers and thus the values do not provide unique identification. Therefore, the variations in the dynamic profile of ri needed to be investigated to see if it can provide additional information. The time profile of rw in the chromatogram is shown in the bottom part of Fig. 4. To recognize trends in these data, Savitzky–Golay smoothing (Savitzky and Golay, 1964) was used (i.e. second-order polynomial across 10 data points (OriginPro 9.0, OriginLab Corporation, Northampton, MA, USA, 2018). Also plotted (grey area in Fig. 4) is the standard deviation of the data points from the smoothed line in the interval of retention times from 15 to 40 s. Note that this standard deviation is greater than the standard error of the data points, possibly due to a lower accuracy of data at the longer retention times. The standard deviation allows assessment of the significance of the changes in .
According to the elution time, the first chromatographic peak A consists of three monoterpenes: α-pinene, camphene and myrcene. For the H3O+ reagent ions, the value corresponds to both α-pinene and myrcene, considering the value for peak A (0.49) or rw close to the peak maxima (0.55–0.6). However, a more obvious difference between α-pinene and myrcene is observed using NO+ reagent ions. The value of the weighted mean ratio for peak A (0.21) is close to the ratio for α-pinene. In the maxima of peak A, however, rw approaches the value of 0.3, which is close to the value expected for a combination of both these monoterpenes (0.32, considering the data from fast GC measurement and the vapour pressure in Table 2). For camphene, rw in the chromatograph did not reach the low values expected for both reagent ions. However, its presence is clearly visible as a dip in rw situated between peaks A and B. In the absence of camphene, the ratio should linearly move to values characteristic of peak B without any dip. The depth of the dip does not reach the rw expected for camphene due to the persistent tails of the peaks for both α-pinene and myrcene.
Peak B in the chromatograms is identified as β-pinene by its retention time. The values for the H3O+ and NO+ reagent ions are 0.63 and 0.21, respectively. The rw values are similar to and slightly higher than the fast GC standard values for β-pinene (see Table 2).
Peaks C and D are not clearly separated in the chromatogram. For the H3O+ reagent ions, the value is similar for both peaks; thus, the presence of (R)-limonene, 3-carene or α-terpenine is likely because the values for peaks C (0.45) and D (0.4) are comparable with the analyte signal ratios (see Table 2) for (R)-limonene and 3-carene. A lower ri for α-terpinene might be interpreted as a dip similar to that for camphene. However, the observed dip in ri at peak D is not as statistically significant as the dip for camphene, and the vapour pressure for both α- and γ-terpinene is lower than those for the other monoterpenes. Analysis of peaks C and D using the NO+ reagent ion shows a clearer difference between them. The calculated for peak C (0.27), as well as the maximum ri (0.35), are, unexpectedly, much higher than for the remaining monoterpenes. This can only be explained by the influence of myrcene or by the presence of impurities in the form of an additional monoterpene in the mixture (for example, ocimene has a high ri of 0.62; Wang et al., 2003). Amongst the eight monoterpenes, 3-carene has the highest ri within the retention time of peak C. The second peak D (0.14) can be then associated with (R)-limonene, which has a low ri (0.06) for NO+ reagent ions, with some contribution by α-terpinene. The presence of γ-terpenine is not apparent due to its low vapour pressure, but there may be some contribution in the peak D that is much smaller than the contribution by (R)-limonene.
To summarize, combining analyses using both H3O+ and NO+ reagent ions with dynamic variations in ri allows the identification of α-pinene, camphene and myrcene in peak A and the presence of β-pinene only in peak B. Peak C is characterized as 3-carene and peak D as (R)-limonene and/or α-terpinene. γ-terpenine contributes only weakly due to its low vapour pressure and has no recognizable response in the chromatogram compared to the remaining monoterpenes.
Analysis of the values for the MXT-Volatiles column is simpler due to better separation of peaks. The value of ri clearly change for different monoterpenes, according to the expected values for individual monoterpenes. The usefulness of the ri analysis for the MXT-Volatiles column can be observed in the analysis of β-pinene, which is featureless compared to that for camphene. Camphene, additionally, produces a second chromatographic peak, which can be incorrectly associated with β-pinene. Analysis of the ri shows values below 0.2 for both peak maxima, characteristic of camphene. The presence of β-pinene is visible as an increase in the ri value up to 0.4 at a retention time of 60 s.
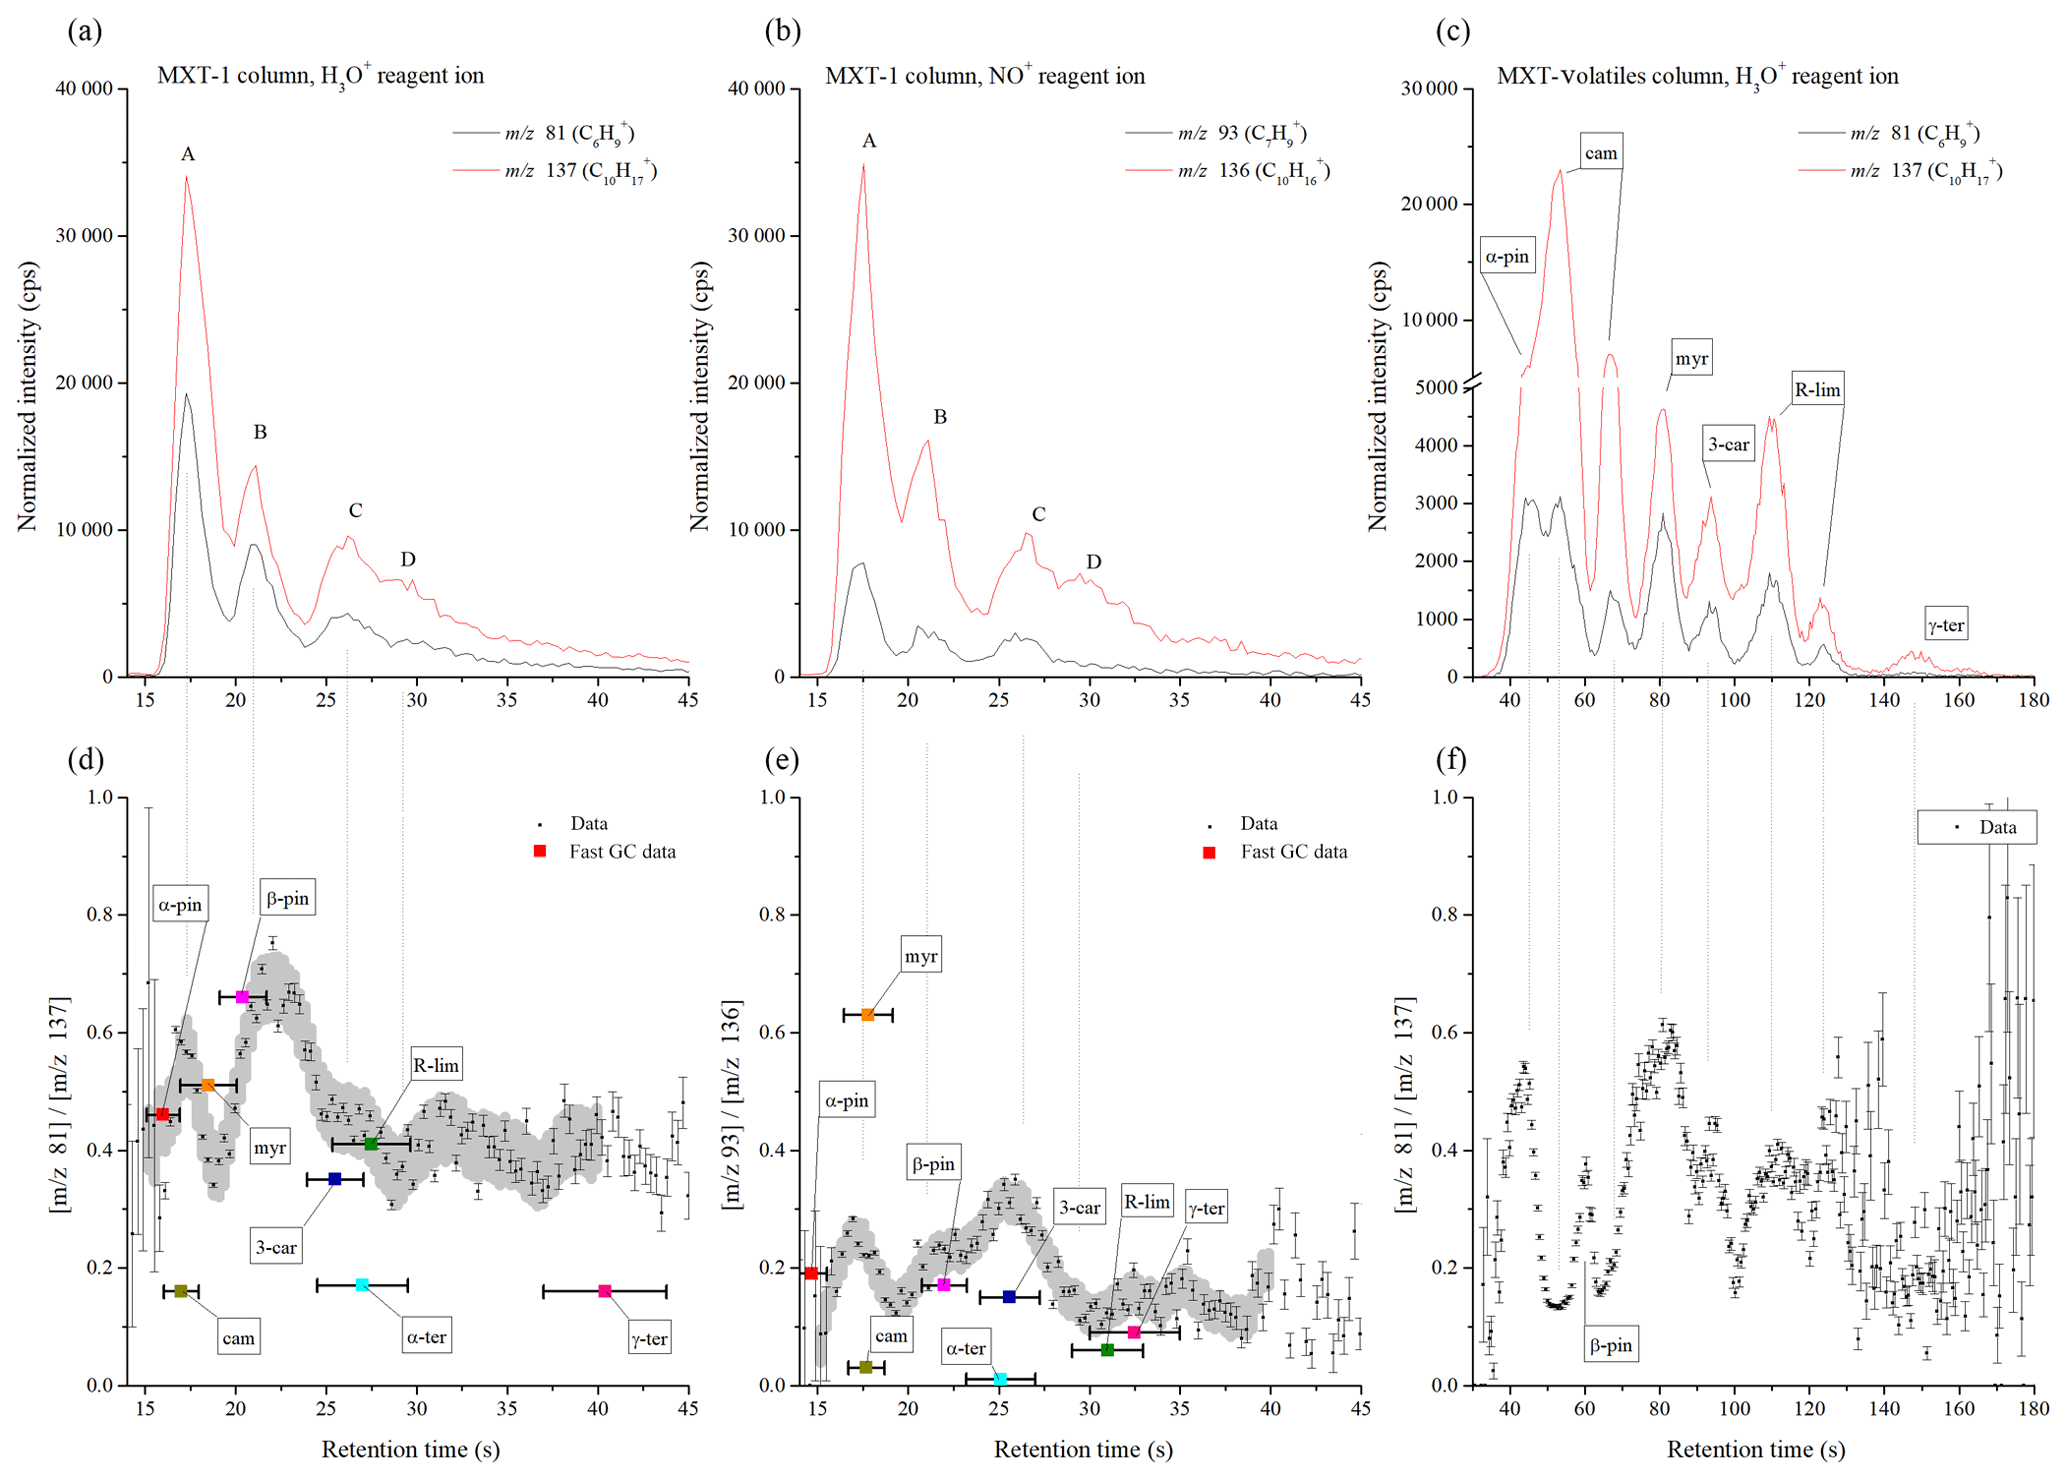
Figure 4Chromatograms of the mixture of monoterpenes (top row) measured by H3O+ (a) and NO+ (b) reagent ions, obtained using the MXT-1 column. A, B, C, and D represent characteristic peaks in the chromatogram. For each chromatogram, the product ion signal ratio ri is presented in the lower figures. The grey data background represents the calculated standard deviation of the data by Savitzky–Golay smoothing between 15 and 40 s. The position and value of the ratio for individual monoterpenes is based on the fast GC MXT-1 measurements presented in Table 1. Note that the retention times are determined by the fast GC conditions and do not depend on which SIFT-MS reagent ion is used. The signal intensities are the analyte ion count rates normalized to a reagent ion count rate of 106 s−1.
4.3 Tree sample investigation using the MXT-1 column
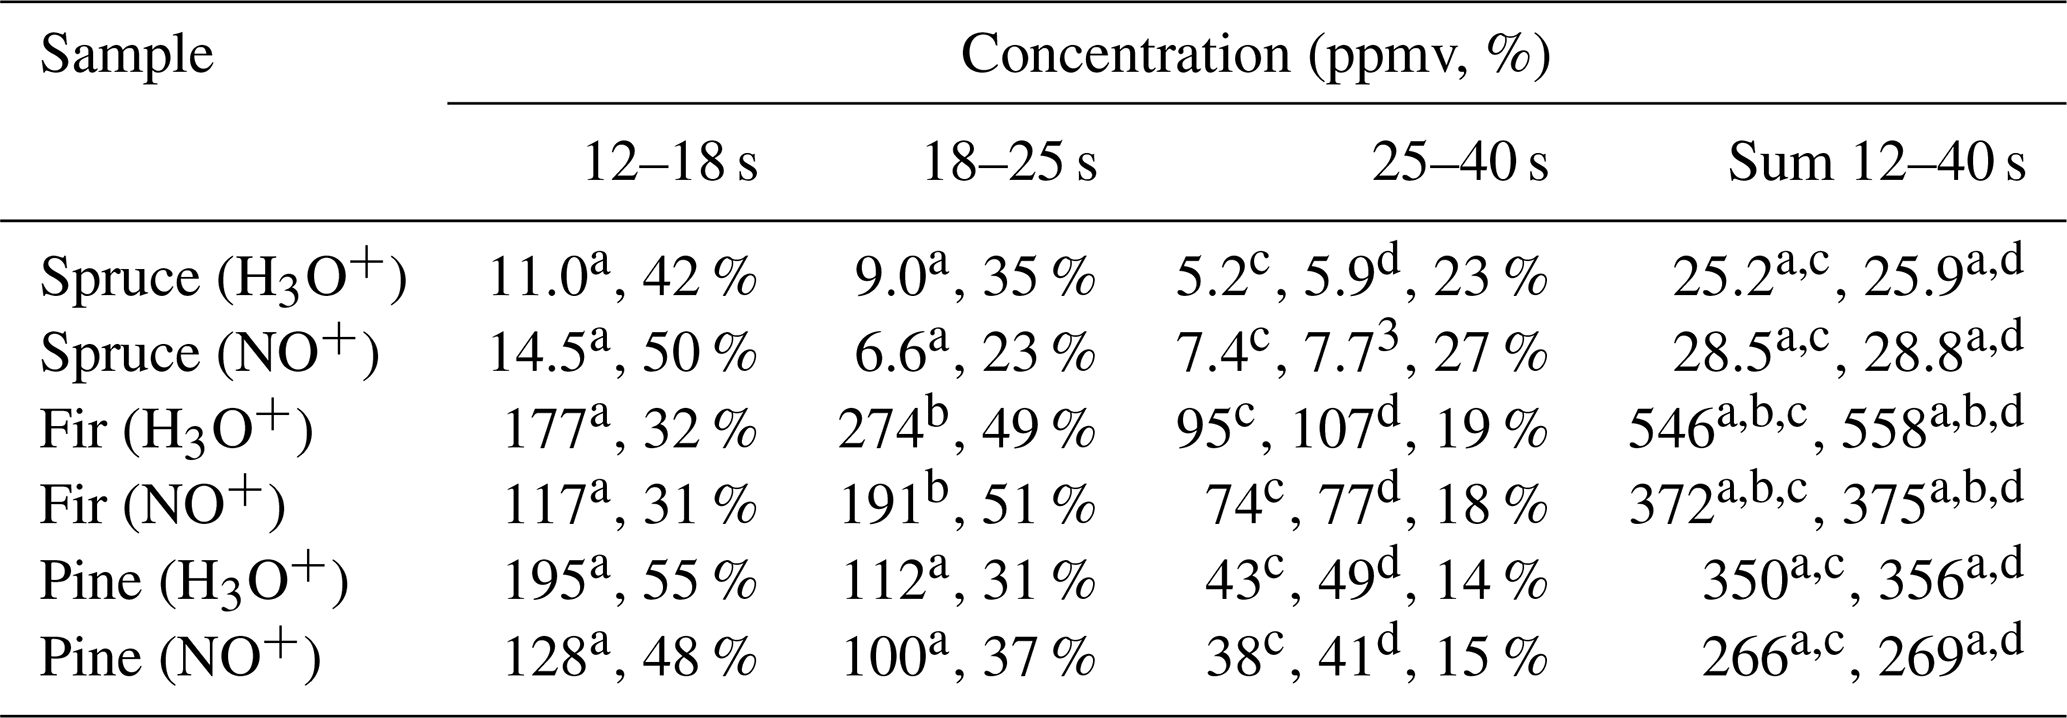
To test how the fast GC and SIFT-MS combination is applicable for analyses of real botanical samples, VOC emissions were analysed from three fresh coniferous tree needle samples: spruce, fir and pine, as shown in Fig. 5. The analytical MS obtained using a H3O+ reagent ion are shown in Fig. S3. Based on the results of the above GC data for standard monoterpene mixtures, the chromatograms were divided into three regions. The first region is characterized by the presence of α-pinene, camphene and myrcene with retention times of between 12 and 18 s, the second region is characterized by the presence of β-pinene with retention times between 18 and 25 s and the third region characterized is by presence of 3-carene and (R)-limonene with retention times between 25 and 40 s. The values were calculated for the specific regions as follows.
Spruce. In the first region of the main peak there was 0.35±0.07 (H3O+) and 0.11±0.04 (NO+). Note that the very low for NO+ indicates the absence of myrcene. The value for H3O+ is lower than expected for β-pinene and higher than expected for camphene. Therefore, the first peak is mainly due to α-pinene, perhaps with a small amount of camphene. In the second region of the main peak there was 0.31±0.07 (H3O+) and 0.09±0.08 (NO+). for H3O+ is lower than expected for β-pinene and higher than that for camphene. The signal therefore belongs to the decay of α-pinene. The signal ratio is 0.38±0.14 (H3O+); 0.14±0.12 (NO+) in the third region indicates presence of (R)-limonene or 3-carene.
Fir. The chromatogram shows two large peaks. The calculations of for the first region (0.40±0.04 for H3O+ and 0.14±0.04 for NO+) and for the second region (0.56±0.04 for H3O+ and 0.15±0.02 for NO+) indicate the presence of both α-pinene and β-pinene. The decreasing for the H3O+ reagent ions in the last part (0.48±0.06 for H3O+ and 0.19±0.05 for NO+) indicates the presence of 3-carene.
Pine. The chromatogram contains only one peak. is stable for both reagent ions for all retention times (0.55±0.06 for H3O+ and 0.21±0.05 for NO+ for the first sector; 0.57±0.05 for H3O+ and 0.22±0.04 for NO+ for the second sector; 0.57±0.09 for H3O+ and 0.22±0.10 for NO+ for the third sector). Together with the retention time of the peak (16.4 s) this certainly corresponds to α-pinene.
Concentrations of individual monoterpenes were calculated according to the procedure described in Sect. 3.3 for all selected regions. Calculation of monoterpene concentrations depends primarily on the individual reaction rate constants (see Table S1), which change from 2.3 to 2.6 for H3O+ and from 2.0 to 2.3 for NO+ (in units of 10−9 cm3 s−1). Incorrect identification of the monoterpene will thus lead to a maximum 20 % error in the concentration calculation. According to the values in selected regions, the most representative rate constant was adopted to calculate the monoterpene concentration in the selected region (see Table 3).
Table 3Calculated concentrations of monoterpenes (in ppmv and %) in the headspace over coniferous needles in selected regions of chromatograms obtained using MXT-1 column at column temperature 40 ∘C, using an injection time of 1.8 s and a column flow of 3 sccm. Rate constant used for the calculation of concentration in selected regions was chosen according to the analysis.
Calculations were performed using the reaction rate constants for a α-pinene, b β-pinene, c (R)-limonene or d 3-carene.

Figure 5Chromatograms derived using the product ions for the reactions of H3O+ (a, b, c) and NO+ (g, h, i) reagent ions with monoterpenes obtained for the three investigated pine tree samples (s1, s2 and s3) using the MXT-1 column. The signal intensities are the analyte ion count rates normalized to a reagent ion count rate of 106 s−1. The black and red curves represent (m∕z 81) and (m∕z 137) product ions for H3O+ and (m∕z 93) and (m∕z136) product ions for NO+ reagent ions. The lower row shows calculated ratios of product ions ri for both reagent ions (green and blue curves) and for peaks areas calculated (red and black).
4.4 Tree sample analyses using the MXT-Volatiles column
Similar experiments were conducted using the MXT-Volatiles column as well but using a different set of coniferous samples. The retention times for the individual monoterpenes were taken from the standard data obtained at the same column temperature (40 ∘C). The higher retention times of the MXT-Volatiles provides more accurate peak identification than the MXT-1 analysis does. However, the different sample types resulted in a lower monoterpene concentration and thus the uncertainty of the values significantly increased. The headspaces of the prepared tree needles were sampled for 6 s, representing a headspace volume of 0.3 mL. The chromatograms obtained for the spruce, fir and pine samples are shown in Fig. 6 and represent the means of analyte ion count rates from five consecutive runs normalized to a constant reagent ion count rate of 106 s−1.
Spruce. In the chromatogram, four peaks were observed. The first peak, with a retention time of 68 s, corresponds to α-pinene with of 0.60±0.16 for H3O+ and 0.24±0.15 for NO+ reagent ions. The trailing edge of the first peak shows a decrease in (0.29±0.11 for H3O+ and 0.14±0.26 for NO+) attributed to a small contribution by camphene. The second peak is attributed to β-pinene and characterized by a retention time of 94 s with of 1.05±0.59 for H3O+ and 0.50±0.15 for NO+. The standard deviation in rw was unfortunately substantial. The position of the third peak is assigned to myrcene. The values (0.43±0.25 for H3O+, 0.41±0.54 for NO+) were again imprecise due to the low intensity and do not fully agree with the unique for myrcene (see Table 2). The observed weak peak could therefore be due to monoterpenes other than those eight included in Table 1. The last peak is associated with 3-carene with as 0.48±0.27 for H3O+ and 0.16±0.39 for NO+ reagent ions.
Fir. In the chromatogram, three peaks are present where the first is due to both α-pinene and camphene. Transition of from the left (0.57±0.21 for H3O+, 0.23±0.13 for NO+) to the right (0.22±0.07 for H3O+ and 0.04±0.04 for NO+) part of the first peak is clearly visible on the Fig. 6 in the middle column. The first peak thus consists of two isomers. The second peak is attributed to β-pinene ( 0.80±0.21 for H3O+ and 0.26±0.19 for NO+), and the third peak is attributed to 3-carene ( 0.39±0.17 for H3O+ and 0.15±0.27 for NO+).
Pine. The chromatogram shows three clear peaks due to α-pinene (0.73±0.13 for H3O+ and 0.30±0.04 for NO+), β-pinene (0.92±0.22 for H3O+ and 0.26±0.13 for NO+) and 3-carene (0.49±0.15 for H3O+ and 0.13±0.15 for NO+) with only a very small and statistically insignificant indication of camphene. The retention times for α-pinene, β-pinene and 3-carene were 69.6, 97 and 141 s, respectively.
The concentrations of individual monoterpenes were calculated according to the procedure described in Sect. 3.3 based on the individual reaction rate constants (see Table S1). Calculated monoterpene concentrations are presented in Table 4.
Table 4Calculated concentrations of monoterpenes (in ppmv and %) in the headspace of coniferous twigs in selected regions of chromatogram obtained using the MXT-Volatiles column at a column temperature of 40 ∘C, using an injection time of 6 s and a column flow of 3 sccm.

nd: no data.
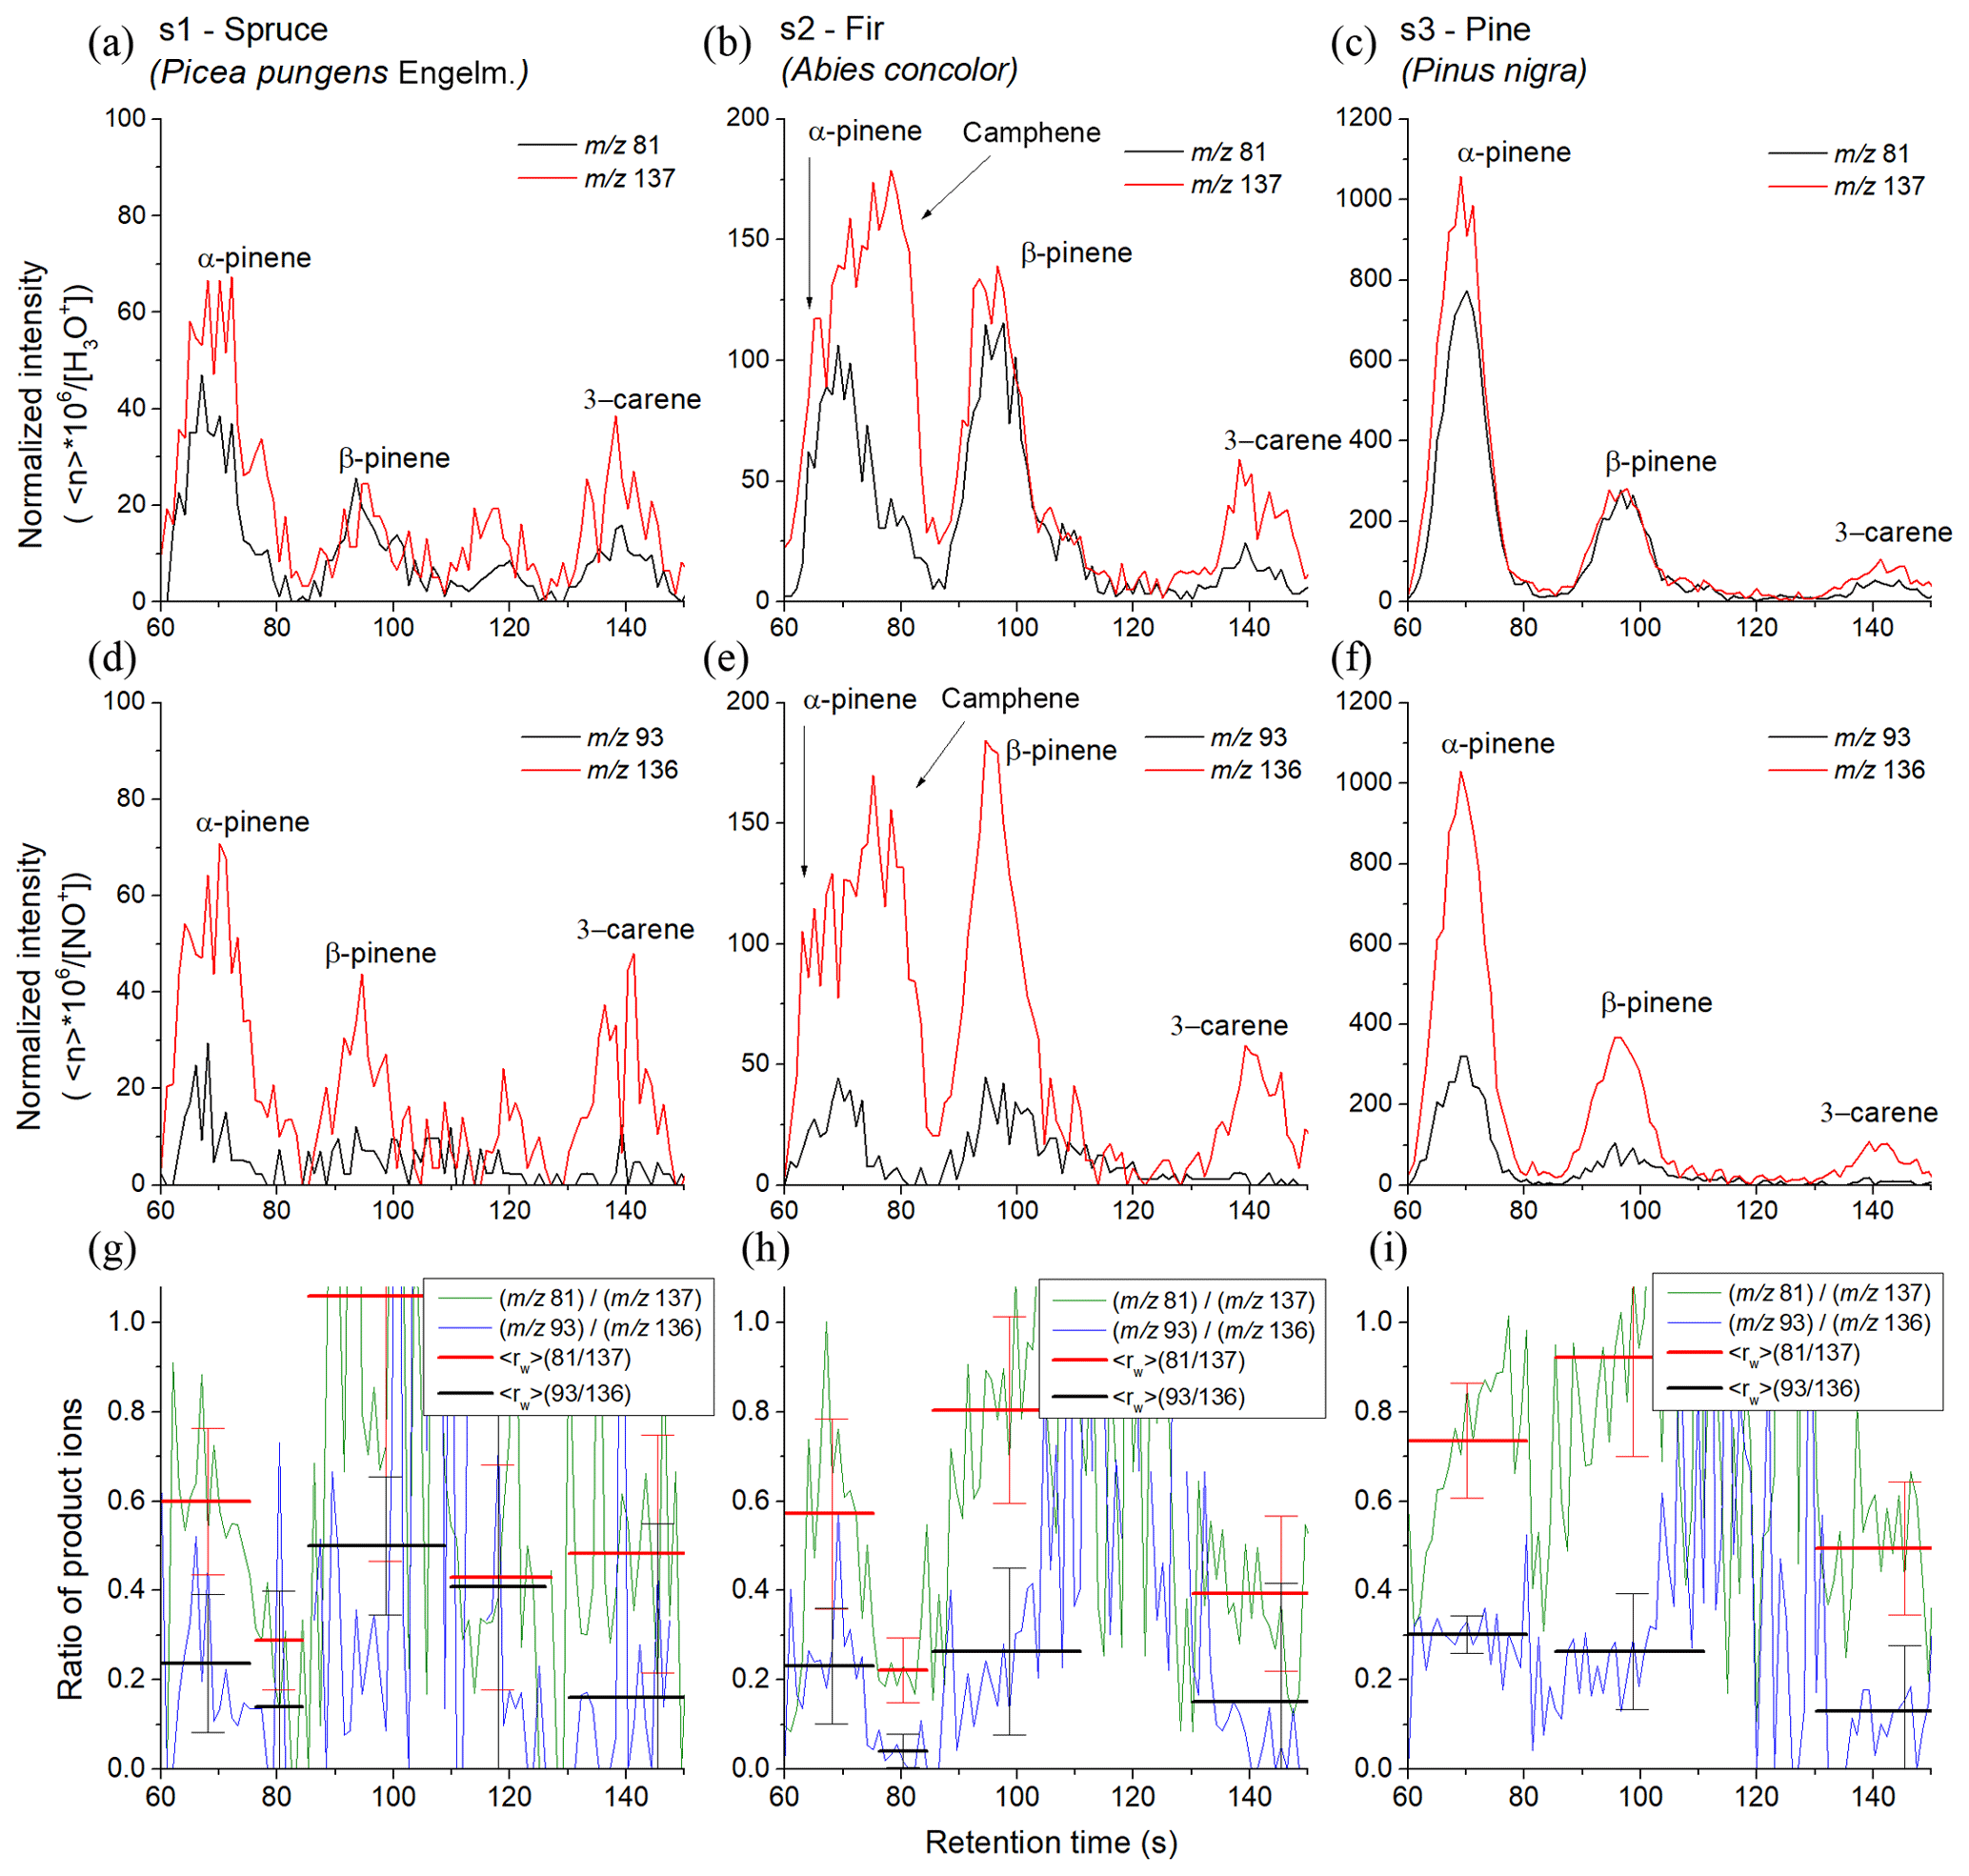
Figure 6SIFT-MS-selected ion mode, fast GC and SIFT-MS chromatograms for monoterpene emissions from pine tree samples (s1, s2 and s3) obtained using the MXT-Volatiles column. The upper and lower rows were obtained using H3O+ and NO+ reagent ions, respectively. The signal intensities are the analyte ion count rates normalized to a reagent ion count rate of 106 s−1. The black and red curves stand for monitored ions (m∕z 81) and (m∕z 137) for H3O+ reagent ions and (m∕z 93) and (m∕z 136) for NO+ reagent ions, respectively. The last row shows calculated ratios of product ions ri for both reagent ions (green and blue curves) and for calculated peaks areas (red and black). The signal intensities are the analyte ion count rates normalized to a reagent ion count rate of 106 s−1.
4.5 Comparison of the tree sample analyses
Some differences are seen between the results from the MXT-1 and MXT-Volatiles columns. The most significant differences are the presence of a camphene peak in the fir sample headspace and the presence of β-pinene and 3-carene in the pine sample headspace when the MXT-Volatiles column was used. However, samples were collected at different times of the year and the character of the samples was also different (only needles for MXT-1 and whole twigs for the MXT-Volatiles analyses). Different sample sources could also cause differences in monoterpene concentration (see Tables 3 and 4).
Additionally, the recorded analyte ions may include interference by ions originating from other BVOCs emitted by the samples, especially when plants are physically damaged, since they emit so-called “leaf aldehydes” such as 2-hexenal and 3-hexenal (Tani et al., 2003). Whilst the reaction of 2-hexenal with H3O+ proceeds as a proton transfer forming a product ion at m∕z 99 (100 %), it has been found that reaction of cis-3-hexenal with H3O+ results in H2O elimination producing a dominant fragment at m∕z 81 (Španěl et al., 1997). If these interferences occur, they may eventually lead to the increase and to misinterpretation of the estimated value. To avoid an overlap of 3-hexenal with monoterpenes, it is thus more reliable to use the product or analyte ion at m∕z 137 and exclude the m∕z 81 ion. Another possibility is to choose NO+ as a precursor ion, where the product ions of 3-hexenal (m∕z 97, 69 and 74) do not overlap with those of monoterpenes (m∕z 92, 93 and 136) (Wang et al., 2003). Unfortunately, we did not carry out the fast GC analysis of 3-hexenal, so we do not know if it actually interfered with any of the detected monoterpene peaks.
4.6 Comparison with previous studies
The present experiments indicate that using the fast GC and SIFT-MS combination, it is possible to achieve analysis of monoterpene mixtures. The estimated LODs are as follows: 16.3 ppbv for α-pinene and 19.5 ppbv for (R)-limonene, using the column temperature at 40 ∘C, and for the column temperature 69 ∘C, the LOD for α-pinene decreased to 6.1 ppbv. This is inferior to the previously described limit of the detection of up to 1–2 ppbv and full separation achieved by a fast GC-PTR-MS systems (Materić et al., 2015; Pallozzi et al., 2016). The higher LOD of the fast GC and SIFT-MS combination is due to the low flow rate of the sampling gas (∼3 sccm) through the fast GC column, which is less than the commonly used 30 sccm. This could be resolved by using a wider column or by using multiple capillaries in parallel.
However, one clear advantage of SIFT-MS analyses is the ability to use three reagent ions that provide different analyte ions. This study has shown that the combination of the data from the two reagent ions, together with the analyses of the product ion signal ratios ri, can improve the identification of monoterpenes, especially the identification of camphene and myrcene.
Importantly, it must be kept in mind that monoterpenes are not the only BVOCs emitted by plants. The presence of 2-hexenal and 3-hexenal, as already discussed in Sect. 4.5, can be problematical, but the interference from this can be alleviated using NO+ reagent ions. The same approach may be used to analyse other isomeric or isobaric molecules present in the environment. A further benefit of employing NO+ reagent ions in atmospheric analysis is the quantification of isoprene, which when using H3O+ reagent ion mode suffers mass interference from product ions of other biogenic species, including furan, C5 aldehydes and 2-methylbut-3-en-2-ol (Karl et al., 2012, 2014) as well as the second hydrate of methanol that is also emitted by plants (12 % of global BVOC emissions) (Španěl et al., 1999). Another benefit of using SIFT-MS compared to other techniques is that calculation of VOC concentration in the sample depends only on the known physical constants, reaction rate constants and analyte ion abundance, so complicated calibration procedures are not required.
The results obtained for monoterpene composition in leaf headspace samples agree well with other published studies. Because the emissions from plants depend on various physical parameters, here we only compare monoterpene composition. In a previous study (Mumm et al., 2004) of the volatiles emitted by Pinus nigra needles, 35 terpenoid compounds were identified, with the following being most abundant: α-pinene (45 %), β-phellandrene (9 %), limonene (8 %), β-pinene (5 %) and 3-carene (2 %). Holzke et al. (2006) studied diurnal and seasonal variation in monoterpenes and sesquiterpenes from Scots pine. The main monoterpene isomers they observed were α-pinene, β-pinene and 3-carene, which represented 90 % of the total terpene emission. A similar study on monoterpene emissions from boreal Scots pine showed that the most abundant monoterpenes measured above the forest and from the canopy were α-pinene and 3-carene (Räisänen et al., 2009). Kainulainen et al. (1992) investigated the effect of drought and waterlogging stress on monoterpenes released by needles of Picea abies (spruce). In the controlled group, the most abundant monoterpenes were camphene (22 %), limonene (14 %), α-pinene (9 %) and myrcene (6 %). In the emissions from southern and central Swedish spruce (Janson, 1993) the following isomers were most abundant: α-pinene (60 %–70 %), camphene (10 %), limonene (10 %) and 3-carene (4 %).
Zavarin et al. (1975) studied cortical oleoresin from Abies concolor (fir) that were collected in 43 different localities in order to analyse their composition of monoterpenoid fractions. They concluded that the production of camphene and 3-carene varied geographically. In the study of Pureswaran et al. (2004) they focused on quantitative variations in monoterpenes from four species of conifers, concluding that the four species (Douglas fir, lodgepole pine, interior spruce and interior fir) did not differ qualitatively, but there were significant differences in their quantitative profiles. For example, coastal Douglas fir needle samples contained 10 % of α-pinene, 31 % of Sabinene and 40 % of β-pinene, and in samples of interior Douglas fir the most abundant isomers were bornyl acetate (26 %), camphene (25 %), α-pinene and β-pinene (both 15 %).
In the present headspace study, we detected the presence of α-pinene, β-pinene, camphene and 3-carene, representing common emissions emitted from pine, spruce and fir samples. The present results thus agree with the usually reported composition of monoterpenes emitted from pine trees and their constituent parts.
The addition of a fast GC pre-separation stage to SIFT-MS allows analyses of monoterpenes in mixtures at the expense of some loss of sensitivity. The bespoke electrically heated fast GC systems constructed for this study achieved separation in less than 45 s for a 5 m MXT-1 column and less than 180 s for a 5 m MXT-Volatiles column held at 40 ∘C. However, due to the insufficient GC separation, the analysis was not accurately quantitative, but it can be improved using a longer GC column operating at higher temperature. The identification of individual monoterpenes was aided by using information on the ratios of the product and analyte ion signals of both H3O+ and NO+ reagent ions. It was shown that combining the SIFT-MS product ion ratios and the GC retention times, seven of eight monoterpenes were identified in a prepared mixture using the MXT-Volatiles column. To demonstrate the analytical value of this novel combination of fast GC with SIFT-MS, volatile emissions from spruce, fir and pine samples were analysed. α-pinene was identified together with smaller amounts of β-pinene and 3-carene. A significant contribution of camphene was also observed in the fir sample headspace.
Due to their different OH reactivity, the ability to distinguish individual monoterpenes at high time resolution with fast GC and SIFT-MS has the potential to improve the understanding of the contribution of individual monoterpenes in atmospheric chemistry processes, such as the formation of tropospheric ozone and secondary organic aerosols.
A major limitation of the fast GC and SIFT-MS system described here is the relatively high LOD (∼16 ppbv), which currently preclude its application in measurement of monoterpenes in typical ambient concentrations. An additional weakness of the current fast GC setup is its relatively poor temperature stability, caused by a strong dependence on the laboratory ambient temperature. But this can surely be improved by active temperature feedback to control the column temperature. The flow rate through the 5 m long and 0.28 mm internal diameter column was about 10 times lower than the conventional flow rate used in direct SIFT-MS analyses and this resulted in commensurate worsening of the LOD. This could be resolved by using a wider column or by using multiple capillaries in parallel. A clear advantage of SIFT-MS is the ready availability of three different reagent ions to determine different fragmentation ratios for the same retention time to improve the identification of compounds.
All data are available upon request from the corresponding author (Michal Lacko).
The supplement related to this article is available online at: https://doi.org/10.5194/amt-12-4965-2019-supplement.
ML and NW created the experimental hardware and provided experiments with the MXT-1 column. ML, KS and PP then provided experiments with the MXT-Volatiles column. PS and ML provided data treatment and paper preparation.
The authors declare that they have no conflict of interest.
We would like to thank David Smith for his advice and help in the preparation of the manuscript.
This project has received funding from the European Union's Horizon 2020 research and innovation programme under the Marie Skłodowska-Curie grant agreement no. 674911. We also gratefully acknowledge partial funding from The Czech Science Foundation (GACR Project No. 17-13157Y).
This paper was edited by Yoshiteru Iinuma and reviewed by three anonymous referees.
Allardyce, R. A., Langford, V. S., Hill, A. L., and Murdoch, D. R.: Detection of volatile metabolites produced by bacterial growth in blood culture media by selected ion flow tube mass spectrometry (SIFT-MS), J. Microbiol. Meth., 65, 361–365, 2006.
Amelynck, C., Schoon, N., and Dhooghe, F.: SIFT Ion Chemistry Studies Underpinning the Measurement of Volatile Organic Compound Emissions by Vegetation, Curr. Anal. Chem., 9, 540–549, 2013.
Atkinson, R., Aschmann, S. M., and Pitts Jr, J. N.: Rate constants for the gas-phase reactions of the OH radical with a series of monoterpenes at 294±1 K, Int. J. Chem. Kinet., 18, 287–299, 1986.
Atkinson, R., Aschmann, S. M., and Arey, J.: Rate constants for the gas-phase reactions of OH and NO3 radicals and O3 with sabinene and camphene at 296±2 K, Atmos. Environ. A-Gen., 24, 2647–2654, 1990.
Atkinson, R., Hasegawa, D., and Aschmann, S. M.: Rate constants for the gas-phase reactions of O3 with a series of monoterpenes and related compounds at 296±2 K, Int. J. Chem. Kinet., 22, 871–887, 1990.
Atkinson, R. and Arey, J.: Gas-phase tropospheric chemistry of biogenic volatile organic compounds: a review, Atmos. Environ., 37, 197–219, 2003.
Chameides, W., Fehsenfeld, F., Rodgers, M., Cardelino, C., Martinez, J., Parrish, D., Lonneman, W., Lawson, D., Rasmussen, R., and Zimmerman, P.: Ozone precursor relationships in the ambient atmosphere, J. Geophys. Res.-Atmos., 97, 6037–6055, 1992.
ChemicalBook: available at: https://www.chemicalbook.com/ChemicalProductProperty_EN_CB4443087.htm, last access: Januar 2019.
Daubert, T. E.: Physical and thermodynamic properties of pure chemicals: Data compilation Hemisphere Pub. Corp., New York, ISBN 978-0891169482, 2030 pp., 1989.
de Gouw, J. and Warneke, C.: Measurements of volatile organic compounds in the earth's atmosphere using proton transfer reaction mass spectrometry, Mass Spectrom. Rev., 26, 223–257, 2007.
de Gouw, J. A., Goldan, P. D., Warneke, C., Kuster, W. C., Roberts, J. M., Marchewka, M., Bertman, S. B., Pszenny, A. A. P., and Keene, W. C.: Validation of proton transfer reaction mass spectrometry (PTR-MS) measurements of gas-phase organic compounds in the atmosphere during the New England Air Quality Study (NEAQS) in 2002, J. Geophys. Res.-Atmos., 108, https://doi.org/10.1029/2003JD003863, 2003.
Ellis, A. M. and Mayhew, C. A.: Proton transfer reaction mass spectrometry: principles and applications, John Wiley & Sons, ISBN 1-118-68357-9, 368 pp., 2013.
Fehsenfeld, F., Calvert, J., Fall, R., Goldan, P., Guenther, A. B., Hewitt, C. N., Lamb, B., Liu, S., Trainer, M., and Westberg, H.: Emissions of volatile organic compounds from vegetation and the implications for atmospheric chemistry, Global Biogeochem. Cy., 6, 389–430, 1992.
Fernandez, M. T., Williams, C., Mason, R. S., and Cabral, B. J. C.: Experimental and theoretical proton affinity of limonene, J. Chem. Soc., 94, 1427–1430, 1998.
Garcia, G. A., Nahon, L., and Powis, I.: Near-threshold photoionization spectroscopy of the mono-terpenes limonene and carvone, Int. J. Mass Spec., 225, 261–270, 2003.
Graus, M., Müller, M., and Hansel, A.: High resolution PTR-TOF: quantification and formula confirmation of VOC in real time, J. Am. Soc. Mass Spectr., 21, 1037–1044, 2010.
Haynes, W. M.: CRC handbook of chemistry and physics, CRC press, New York, ISBN 978-1-4822-0868-9, 2704 pp., 2014.
Holzke, C., Hoffmann, T., Jaeger, L., Koppmann, R., and Zimmer, W.: Diurnal and seasonal variation of monoterpene and sesquiterpene emissions from Scots pine (Pinus sylvestris L.), Atmos. Environ., 40, 3174–3185, 2006.
Janson, R. W.: Monoterpene emissions from Scots pine and Norwegian spruce, J. Geophys. Res.-Atmos., 98, 2839–2850, 1993.
Jordan, A., Haidacher, S., Hanel, G., Hartungen, E., Herbig, J., Märk, L., Schottkowsky, R., Seehauser, H., Sulzer, P., and Märk, T. D.: An online ultra-high sensitivity Proton-transfer-reaction mass-spectrometer combined with switchable reagent ion capability (PTR + SRI − MS), Int. J. Mass Spectr., 286, 32–38, 2009.
Kainulainen, P., Oksanen, J., Palomäki, V., Holopainen, J., and Holopainen, T.: Effect of drought and waterlogging stress on needle monoterpenes of Picea abies, Can. J. Botany, 70, 1613–1616, 1992.
Karl, T., Hansel, A., Cappellin, L., Kaser, L., Herdlinger-Blatt, I., and Jud, W.: Selective measurements of isoprene and 2-methyl-3-buten-2-ol based on NO+ ionization mass spectrometry, Atmos. Chem. Phys., 12, 11877–11884, https://doi.org/10.5194/acp-12-11877-2012, 2012.
Karl, T., Kaser, L., and Turnipseed, A.: Eddy covariance measurements of isoprene and 232-MBO based on NO+ time-of-flight mass spectrometry, Int. J. Mass Spectr., 365, 15–19, 2014.
Kesselmeier, J. and Staudt, M.: Biogenic Volatile Organic Compounds (VOC): An Overview on Emission, Physiology and Ecology, J. Atmos. Chem., 33, 23–88, 1999.
Kulmala, M., Suni, T., Lehtinen, K. E. J., Dal Maso, M., Boy, M., Reissell, A., Rannik, Ü., Aalto, P., Keronen, P., Hakola, H., Bäck, J., Hoffmann, T., Vesala, T., and Hari, P.: A new feedback mechanism linking forests, aerosols, and climate, Atmos. Chem. Phys., 4, 557–562, https://doi.org/10.5194/acp-4-557-2004, 2004.
Lindinger, W., Hansel, A., and Jordan, A.: On-line monitoring of volatile organic compounds at pptv levels by means of proton-transfer-reaction mass spectrometry (PTR-MS) medical applications, food control and environmental research, Int. J. Mass Spectrom., 173, 191–241, 1998.
Malásková, M., Henderson, B., Chellayah, P., Ruzsanyi, V., Mochalski, P., Cristescu, S. M., and Mayhew, C. A.: Proton transfer reaction time-of-flight mass spectrometric measurements of volatile compounds contained in peppermint oil capsules of relevance to real-time pharmacokinetic breath studies, J. Breath Res., 13, https://doi.org/10.1088/1752-7163/ab26e2, 2019.
Materić, D., Lanza, M., Sulzer, P., Herbig, J., Bruhn, D., Turner, C., Mason, N., and Gauci, V.: Monoterpene separation by coupling proton transfer reaction time-of-flight mass spectrometry with fast GC, Anal. Bioanal. Chem., 407, 7757–7763, 2015.
Matisová, E. and Dömötörová, M.: Fast gas chromatography and its use in trace analysis, J. Chromatogr. Sci., 1000, 199–221, 2003.
Mumm, R., Tiemann, T., Schulz, S., and Hilker, M.: Analysis of volatiles from black pine (Pinus nigra): significance of wounding and egg deposition by a herbivorous sawfly, Phytochemistry, 65, 3221–3230, 2004.
NIST WebBook Chemie: NIST Standard Reference Database Number 69, U.S. Secretary of Commerce, National Institute of Standards and Technology: Gaithersburg, MD: http://webbook.nist.gov/chemistry/, 2019.
Nolscher, A. C., Yanez-Serrano, A. M., Wolff, S., de Araujo, A. C., Lavric, J. V., Kesselmeier, J., and Williams, J.: Unexpected seasonality in quantity and composition of Amazon rainforest air reactivity, Nat. Commun., 7, 10383, https://doi.org/10.1038/ncomms10383, 2016.
OriginPro 9.0: OriginLab Corporation, One Roundhouse Plaza, Suite 303, Northampton, MA 01060, United States, 1800-969-7720, avaialable at: https://www.originlab.com/, last access: December 2018.
Pallozzi, E., Guidolotti, G., Ciccioli, P., Brilli, F., Feil, S., and Calfapietra, C.: Does the novel fast-GC coupled with PTR-TOF-MS allow a significant advancement in detecting VOC emissions from plants?, Agr. Forest Meteorol., 216, 232–240, 2016.
Pureswaran, D. S., Gries, R., and Borden, J. H.: Quantitative variation in monoterpenes in four species of conifers, Biochem. Syst. Ecol., 32, 1109–1136, 2004.
Pysanenko, A., Španěl, P., and Smith, D.: Analysis of the isobaric compounds propanol, acetic acid and methyl formate in humid air and breath by selected ion flow tube mass spectrometry, SIFT-MS, Int. J. Mass Spectrom., 285, 42–48, 2009.
Räisänen, T., Ryyppö, A., and Kellomäki, S.: Monoterpene emission of a boreal Scots pine (Pinus sylvestris L.) forest, Agr. Forest Meteorol., 149, 808–819, 2009.
Rhoderick, G. C. and Lin, J.: Stability assessment of gas mixtures containing monoterpenes in varying cylinder materials and treatments, Anal. Chem., 85, 4675–4685, 2013.
Rinne, J., Ruuskanen, T. M., Reissell, A., Taipale, R., Hakola, H., and Kulmala, M.: On-line PTR-MS measurements of atmospheric concentrations of volatile organic compounds in a European boreal forest ecosystem, Boreal Environ. Res., 10, 425–436, 2005.
Romano, A., Fischer, L., Herbig, J., Campbell-Sills, H., Coulon, J., Lucas, P., Cappellin, L., and Biasioli, F.: Wine analysis by Fast GC proton-transfer reaction-time-of-flight-mass spectrometry, Int. J. Mass Spectrom., 369, 81–86, 2014.
Savitzky, A. and Golay, M. J.: Smoothing and differentiation of data by simplified least squares procedures, Anal. Chem., 36, 1627–1639, 1964.
Schoon, N., Amelynck, C., Vereecken, L., and Arijs, E.: A selected ion flow tube study of the reactions of H3O+, NO+ and with a series of monoterpenes, Int. J. Mass Spectrom., 229, 231–240, 2003.
Shestivska, V., Nemec, A., Dřevínek, P., Sovová, K., Dryahina, K., and Španěl, P.: Quantification of methyl thiocyanate in the headspace of Pseudomonas aeruginosa cultures and in the breath of cystic fibrosis patients by selected ion flow tube mass spectrometry, Rapid Commun. Mass Sp., 25, 2459–2467, 2011.
Shestivska, V., Spanel, P., Dryahina, K., Sovova, K., Smith, D., Musilek, M., and Nemec, A.: Variability in the concentrations of volatile metabolites emitted by genotypically different strains of Pseudomonas aeruginosa, J. Appl. Microbiol., 113, 701–713, 2012.
Shestivska, V., Antonowicz, S. S., Dryahina, K., Kubišta, J., Smith, D., and Španěl, P.: Direct detection and quantification of malondialdehyde vapour in humid air using selected ion flow tube mass spectrometry supported by gas chromatography/mass spectrometry, Rapid Commun. Mass Sp., 29, 1069–1079, 2015.
Smith, D. and Španěl, P.: Selected ion flow tube mass spectrometry (SIFT-MS) for on-line trace gas analysis, Mass Spec. Rev., 24, 661–700, 2005.
Smith, D. and Španěl, P.: Ambient analysis of trace compounds in gaseous media by SIFT-MS, Analyst, 136, 2009–2032, 2011a.
Smith, D., and Španěl, P.: Direct, rapid quantitative analyses of BVOCs using SIFT-MS and PTR-MS obviating sample collection, TrAC Trends in Analytical Chemistry, 30, 945–959, 2011b.
Smith, D., Španěl, P., Holland, T. A., Al Singari, W., and Elder, J. B.: Selected ion flow tube mass spectrometry of urine headspace, Rapid Commun. Mass Sp., 13, 724–729, 1999.
Smith, D., Sovová, K., and Španěl, P.: A selected ion flow tube study of the reactions of H3O+, NO+ and with seven isomers of hexanol in support of SIFT-MS, Int. J. Mass Spectrom., 319, 25–30, 2012.
Solouki, T. and Szulejko, J. E.: Bimolecular and unimolecular contributions to the disparate self-chemical ionizations of α-pinene and camphene isomers, J. Am. Soc. Mass Spectr., 18, 2026–2039, 2007.
Song, M., Xia, Y., and Tomasino, E.: Investigation of a Quantitative Method for the Analysis of Chiral Monoterpenes in White Wine by HS-SPME-MDGC-MS of Different Wine Matrices, Molecules, 20, 7359–7378, 2015.
Španěl, P. and Smith, D.: Advances in On-line Absolute Trace Gas Analysis by SIFT-MS, Curr. Anal. Chem., 9, 525–539, 2013.
Španěl, P., Ji, Y., and Smith, D.: SIFT studies of the reactions of H3O+, NO+ and with a series of aldehydes and ketones, Int. J. Mass Spectrom., 165, 25–37, 1997.
Španěl, P. and Smith, D.: Selected ion flow tube studies of the reactions of H3O+, NO+, and O2+ with several aromatic and aliphatic hydrocarbons, Int. J. Mass Spectrom., 181, 1–10, 1998.
Španěl, P., Davies, S., and Smith, D.: Quantification of breath isoprene using the selected ion flow tube mass spectrometric analytical method, Rapid Commun. Mass Sp., 13, 1733–1738, 1999.
Španěl, P., Dryahina, K., and Smith, D.: A general method for the calculation of absolute trace gas concentrations in air and breath from selected ion flow tube mass spectrometry data, Int. J. Mass Spectrom., 249, 230–239, 2006.
Takasago: available at: http://www.takasago.com/cgi-bin/pdf/alphaterpinene.pdf, last access: January 2019.
Tani, A., Hayward, S., and Hewitt, C.: Measurement of monoterpenes and related compounds by proton transfer reaction-mass spectrometry (PTR-MS), Int. J. Mass Spectrom., 223, 561–578, 2003.
TGSC: The Good Scents Company Information System: http://www.thegoodscentscompany.com/, last access: January 2019.
Thompson, J. M. and Perry, D. B.: A new system of refillable and uniquely identifiable diffusion tubes for dynamically generating VOC and SVOC standard atmospheres at ppm and ppb concentrations for calibration of field and laboratory measurements, J. Environ. Mon., 11, 1543–1544, 2009.
Van Kempen, G. M. P. and Van Vliet, L. J.: Mean and variance of ratio estimators used in fluorescence ratio imaging, Cytom. Part A, 39, 300–305, 2000.
Wang, T., Španěl, P., and Smith, D.: Selected ion flow tube, SIFT, studies of the reactions of H3O+, NO+ and with eleven C10H16 monoterpenes, Int. J. Mass Spec., 228, 117–126, 2003.
Yaws, C. L.: Handbook of Vapor Pressure, Vol 3: C8–C28 Compounds, Gulf Pub Co., Houston, ISBN 978-0884151913, 392 pp., 1994.
Zavarin, E., Snajberk, K., and Fisher, J.: Geographic variability of monoterpenes from cortex of Abies concolor, Biochem. Syst. Ecol., 3, 191–203, 1975.