the Creative Commons Attribution 4.0 License.
the Creative Commons Attribution 4.0 License.
 | 10 Mar 2020
Effect of aerosol composition on the performance of low-cost optical particle counter correction factors
Ajit Singh
Louisa J. Kramer
Marvin D. Shaw
Mohammed S. Alam
Joshua S. Apte
William J. Bloss
Lea Hildebrandt Ruiz
Pingqing Fu
Weiqi Fu
Shahzad Gani
Michael Gatari
Evgenia Ilyinskaya
Alastair C. Lewis
David Ng'ang'a
Rachel C. W. Whitty
Siyao Yue
Stuart Young
Francis D. Pope
There is considerable interest in using low-cost optical particle counters (OPCs) to supplement existing routine air quality networks that monitor particle mass concentrations. In order to do this, low-cost OPC data need to be comparable with particle mass reference instrumentation; however, there is currently no widely agreed upon methodology to accomplish this. Aerosol hygroscopicity is known to be a key parameter to consider when correcting particle mass concentrations derived from low-cost OPCs, particularly at high ambient relative humidity (RH). Correction factors have been developed that apply κ-Köhler theory to correct for the influence of water uptake by hygroscopic aerosols. We have used datasets of co-located reference particle measurements and low-cost OPC (OPC-N2, Alphasense) measurements, collected in four cities on three continents, to explore the performance of this correction factor. We provide evidence that the elevated particle mass concentrations, reported by the low-cost OPC relative to reference instrumentation, are due to bulk aerosol hygroscopicity under different RH conditions, which is determined by aerosol composition and, in particular, the levels of hygroscopic aerosols (sulfate and nitrate). We exploit measurements made in volcanic plumes in Nicaragua, which are predominantly composed of sulfate aerosol, as a natural experiment to demonstrate this behaviour in the ambient atmosphere; the observed humidogram from these measurements closely resembles the calculated pure sulfuric acid humidogram. The results indicate that the particle mass concentrations derived from low-cost OPCs during periods of high RH (>60 %) need to be corrected for aerosol hygroscopic growth. We employed a correction factor based on κ-Köhler theory and observed that the corrected OPC-N2 PM2.5 mass concentrations were within 33 % of reference measurements at all sites. The results indicated that a κ value derived in situ (using suitable reference instrumentation) would lead to the most accurate correction relative to co-located reference instruments. Applying a κ values from the literature in the correction factor also resulted in improved OPC-N2 performance, with the measurements being within 50 % of the reference values. Therefore, for areas where suitable reference instrumentation for developing a local correction factor is lacking, using a literature κ value can result in a reasonable correction. For locations with low levels of hygroscopic aerosols and low RH values, a simple calibration against gravimetric measurements (using suitable reference instrumentation) would likely be sufficient. Whilst this study generated correction factors specific for the Alphasense OPC-N2 sensor, the calibration methodology developed is likely amenable to other low-cost PM sensors.
- Article
(1435 KB) - Full-text XML
-
Supplement
(215 KB) - BibTeX
- EndNote


Advances in miniaturization technology have led to the development of many different kinds of low-cost air pollution sensors, ranging from passive gas samplers to miniaturized versions of reference instruments (Lewis et al., 2018; Jayaratne et al., 2018). The term low-cost is relative and typically refers to the sensor being at least an order of magnitude cheaper than corresponding reference instrumentation (Lewis et al., 2018). Monitoring of key air pollutants (e.g. PM2.5, NOx and O3) has traditionally been performed via reference standard or equivalent monitors at fixed monitoring stations. However, this approach can lack the necessary spatial coverage to properly assess personal exposure due to significant spatial heterogeneity in the concentration of air pollutants in urban areas (de Nazelle et al., 2017). Low-cost sensors are an attractive option due to their reduced costs and portability, making them viable for mobile or highly spatially resolved measurements, to complement existing monitoring frameworks. This has led to low-cost sensors becoming a common feature of an increasing number of air pollution monitoring operations (Snyder et al., 2013; Morawska et al., 2018).
The trade-off when using low-cost sensors is that they are currently not as accurate, precise, selective or sensitive when compared with research- or regulatory-grade instrumentation (Mead et al., 2013; Lewis et al., 2016, 2018; Smith et al., 2017; Crilley et al., 2018; Borrego et al., 2016; Popoola et al., 2016). Consequently, low-cost sensors of air pollutants need to be carefully characterized to ensure that they meet the specific requirements of the intended application (Castell et al., 2017). In their review, Morawska et al. (2018) concluded that low-cost sensors were appropriate for many applications, such as supplementing routine air quality measurements and engaging the public and community groups. However, there is still work needed if low-cost sensors are to be used for accurate exposure measurements or for compliance monitoring in the future, which are both of particular interest in under-monitored low- and middle-income countries (LMICs). LMICs typically have high urban air pollution, but the resources and infrastructure are sometimes lacking to support continuous classical reference air quality measurements (Pope et al., 2018). One of the challenges with using low-cost sensors in this setting is that there is currently no agreed upon methodology for the evaluation of their accuracy and precision as well as their subsequent calibration (Lewis et al., 2018).
Airborne particulate matter (PM) is a key pollutant for air monitoring networks due to its well-established detrimental physical health effects (Cohen et al., 2005; Landrigan et al., 2018). In particular, exposure to fine particles (PM2.5, particles with an aerodynamic diameter less than 2.5 µm) is known to have multiple disease pathways (Landrigan et al., 2018). Recently, short-term exposure to PM2.5 has been linked to short-term cognitive decline (Shehab and Pope, 2019). PM2.5 mass regulatory limits are based on the dry particle mass concentration; thus, regulatory-grade particle mass instrumentation dries the aerosol before measurement to record the dry aerosol mass concentrations. Low-cost optical particle counters (OPCs) measure the particle diameter and number concentrations using light scattering and convert these measurements to particle mass concentrations by assuming particle sphericity and a uniform density. Low-cost OPCs typically do not dry the aerosol before measurement, and this can result in an overestimation of the dry particle size (compared with that which would be determined after drying) under high-RH conditions (Crilley et al., 2018; Jayaratne et al., 2018; Di Antonio et al., 2018), which is thought to be related to the uptake of water by hygroscopic aerosol. Consequently, the reported PM mass concentrations from low-cost OPCs are the wet particle mass concentrations and need to be converted to dry particle mass concentrations in order be comparable with regulatory standards and reference instrumentation. One solution to measuring the dry mass of particles would be the addition of a preconditioning drying step prior to the OPC measurements; however, this would result in higher costs, greater power consumption and less instrument portability, thereby reducing the unique selling points (USPs) of low-cost sensor devices.
Recently, a methodology to correct the wet particle mass concentrations to dry mass concentrations was proposed by Crilley et al. (2018) based upon the κ-Köhler theory (Petters and Kreidenweis, 2007). The κ-Köhler theory describes the relationship between particle hygroscopicity and volume using a single value, κ, and it can be adapted to relate particle mass to average bulk hygroscopicity at a given RH. Crilley et al. (2018) calculated κ values representative of ambient bulk hygroscopicity using co-located reference instruments to determine a correction factor for the derived OPC-N2 (Alphasense) particle mass concentrations. Application of this in situ correction factor by Crilley and co-workers notably improved the OPC-N2 PM2.5 and PM10 mass concentrations to within 33 % of the reference instrumentation at an urban background location with high ambient RH. Subsequently, Di Antonio et al. (2018) proposed a similar method that applied κ-Köhler theory to correct the particle size distribution measured by the OPC-N2 and then calculated the particle mass fraction concentration using this corrected particle size. Using this approach, Di Antonio and co-workers also observed notable improvement in the OPC-N2 to within 43 % of the reference PM2.5 mass concentrations. Di Antonio and co-workers assumed κ values for their correction factor, based upon the assumed major hygroscopic components of the aerosol mix (ammonium sulfate and sodium chloride), which may not be realistic considering the complex multi-compositional nature of urban particles.
It is clear that the aerosol hygroscopicity is a key parameter to consider when correcting particle mass concentration derived by a low-cost OPC (Crilley et al., 2018; Di Antonio et al., 2018). Aerosol hygroscopicity is dependent on the chemical compounds present; consequently, the derived correction factor may vary from location to location due to differences in the particle bulk composition, shape and density. To investigate this, we utilized datasets containing co-located particle measurements from reference instruments and a low-cost OPC that were collected in four cities on three continents: Birmingham, UK; Nairobi, Kenya; Delhi, India; and Beijing, China. Across these four cities, the airborne particle composition and range of ambient RH varied considerably allowing for the exploration of sensor performance in response to these factors (composition and RH) and how these factors affected the calculated correction factors. We also report measurements taken near a volcano in Nicaragua: a location that received regular volcanic plumes that contained particles which were typically chemically homogenous. The aim of this paper was to investigate whether a universal correction method can be reasonably applied to reported particle mass concentrations from low-cost OPCs across a wide variety of locations.
The datasets used in the current work were acquired at different times during several different field campaigns, but the same type of low-cost particle sensor was deployed at all five locations – the OPC-N2 manufactured by Alphasense. This sensor has been described in detail in Sousan et al. (2016) and Crilley et al. (2018) and can be considered as a miniaturized optical particle counter. The measured particle number concentration from the OPC-N2 is converted via an onboard factory calibration to particle mass concentrations for the PM1, PM2.5 and PM10 size fractions according to European Standard EN 481 (OPC-N2 manual). Data collection with the OPC-N2 followed the procedures outlined in Crilley et al. (2018) at the four urban locations via a Raspberry Pi computer employing the py-opc Python library (Hagan et al., 2018). Uncorrected PM mass concentrations were used without any modification. In Birmingham, Delhi, Beijing and Nairobi, the OPC-N2 was housed within a custom-built unit with the same inlet length (12 cm diameter stainless steel tubing, see Crilley et al. (2018) for details) and was placed outside. At Nicaragua, the OPC-N2 was part of the commercially available AQMesh system (Air Monitors), and the uncorrected PM concentrations were extracted.
2.1 Measurement locations
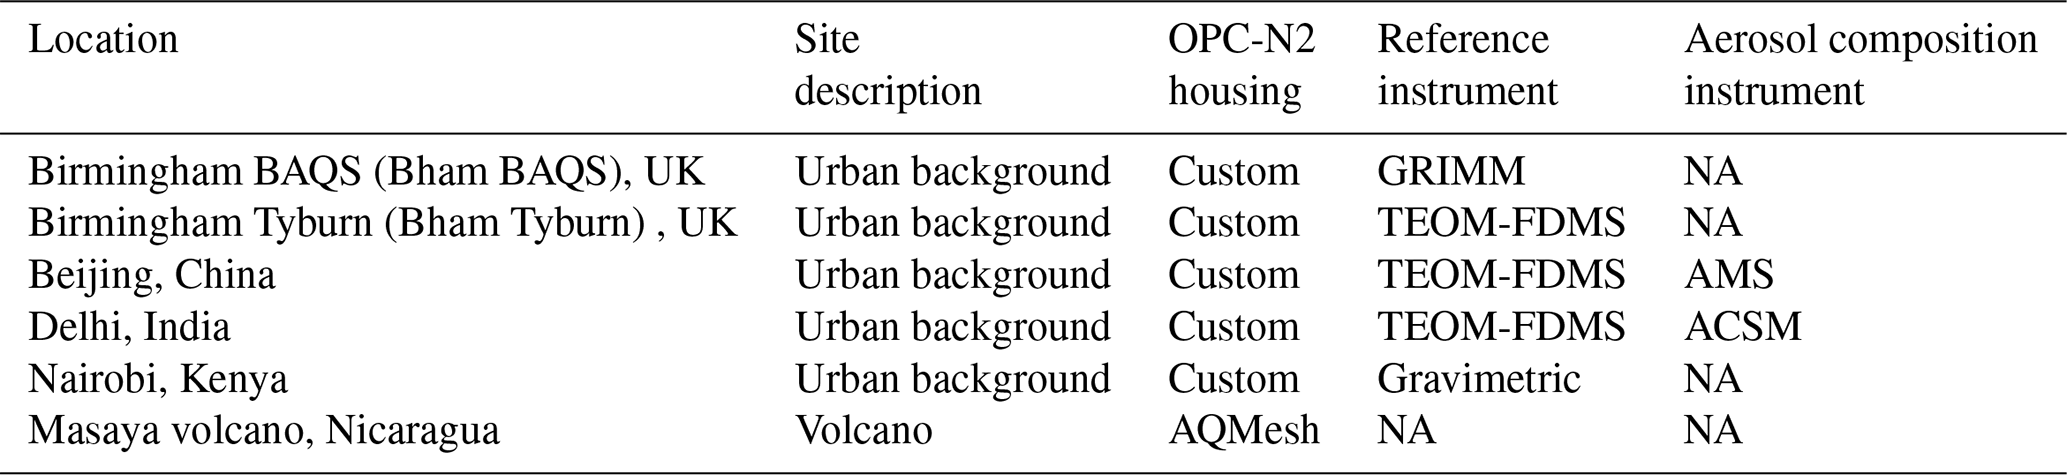
All of the sites in this study, other than the volcanic Nicaraguan site, are classed as urban background with respect to their respective cities. We have focused on PM2.5 mass concentrations in this study, as this particle size fraction was measured by reference instrumentation at all study sites. We also note that we used a different OPC-N2 sensor at each site. Previous work has shown that co-located multiple OPC-N2 sensors have an inter-unit precision of 22±13 % for PM10 mass concentrations (Crilley et al., 2018). A summary of the measurement locations is provided in Table 1.
Table 1Summary of the measurement sites. Full details available in the text. NA signifies not available. Custom housing for the OPC-N2 as per the description in the text.
2.1.1 Birmingham, United Kingdom
The OPCs were deployed at two urban background locations in Birmingham. The first was the Birmingham Air Quality Supersite at Elms Road (BAQS; 52.4554∘ N, 1.9286∘ W), which is located on the University of Birmingham campus (Alam et al., 2015) and will hereafter be referred to as “Bham BAQS”. The second site was the Tyburn Road air monitoring station, which is part of the UK Automatic Rural Urban Network (AURN), and will hereafter be referred to as “Bham Tyburn”. This dataset has previously been described in Crilley et al. (2018), and the current work focuses on the long-term measurements (October 2016 to February 2017) at Bham BAQS, using the OPC-N2 that gave the most complete time series. The reference instrument for PM2.5 mass concentration measurements at Bham Tyburn was a tapered element oscillating microbalance with a filter dynamic measurement system (TEOM-FDMS). The Bham Tyburn dataset is used for comparison with other sites that had the same reference instrument (Beijing and Delhi, see Sect. 2.1.2 and 2.1.3). The reference instrument at Bham BAQS was a GRIMM portable aerosol sampler (model 1.108) that was serviced and calibrated before the measurements. The GRIMM is an OPC-type device that is similar to the low-cost sensors, but it does contain a preconditioning step that reduces the internal RH of the device. Previous work, based on co-located measurements with a TEOM-FDMS, has demonstrated that the GRIMM is not affected by RH (Crilley et al., 2018).
2.1.2 Beijing, China
The measurements in Beijing formed part of “Air Pollution and Human Health in a Chinese Megacity”, APHH-Beijing, which is a joint UK–China programme addressing air quality in Beijing (Shi et al., 2019). The measurements took place at the Chinese Academy of Science Institute of Atmospheric Physics (IAP) tower campus (39.9735∘ N, 116.3723∘ E), located in the northern suburbs of Beijing. The OPC-N2 sampled on top of a shipping container at a height of approximately 2.5 m from 5 to 9 December 2016. In addition, co-located ground level measurements were obtained from a TEOM-FDMS set to measure PM2.5 mass concentrations as well as an Aerodyne aerosol mass spectrometer (AMS; Xu et al., 2019).
2.1.3 Delhi, India
The measurements in Delhi were part of “Air Pollution and Human Health in an Indian Megacity” (APHH-Delhi, http://www.urbanair-india.org, last access: 3 March 2020), which is a joint UK–India programme tackling air pollution in Delhi. The sampling location was the Indian Institute of Technology Delhi (IITD) main campus in Hauz Khas (28.5464∘ N, 77.1913∘ E), which is located in the southern suburbs of New Delhi. The instruments were located on the roof (four stories) of Block IV at IITD. The inlet for the co-located PM2.5 TEOM-FDMS was approximately 5 m from the OPC-N2 at the same sampling height. On-line measurements of inorganic aerosol concentrations were provided by an Aerodyne aerosol chemical speciation monitor (ACSM), located nearby in Block V on the IITD campus, at the same sampling height (Gani et al., 2019).
2.1.4 Nairobi, Kenya
The measurements in Nairobi have previously been reported in Pope et al. (2018). These measurements are part of the “A Systems Approach to Air Pollution” programme (ASAP East Africa, http://www.asap-eastafrica.com, 3 March 2020). In the current work, we used the urban background data that were collected on the rooftop of the American Wing building at the University of Nairobi (1.2801∘ S, 36.8163∘ E). The sampling inlet was at a height of 17 m a.g.l. (metres above ground level) with unobstructed airflow in all directions. The measurement period was from 2 February to 24 March 2017. Calibration of the OPC was carried out in situ using a standardized gravimetric approach that involved co-location of the OPC with an Anderson dichotomous impactor (Sierra Instruments Inc., USA).
2.1.5 Masaya volcano, Nicaragua
Masaya is an active volcano that is currently degassing; due to its low altitude (600 m a.s.l., metres above sea level), the volcanic plume causes persistent gas and PM air pollution in nearby populated areas. The results presented are part of the first study of high temporal and long-term measurements of PM and SO2 concentrations in several populated areas near the Masaya volcano. Here, we will discuss the results from station 789, which was set up in Pacaya community (11.9553∘ N, 86.3013∘ W, 870 m a.s.l.) 15 km to the west of Masaya volcano. Because it is located at a higher altitude than the degassing crater, the volcanic plume frequently grounds at this location. The station was set up on a post approximately 6 m a.g.l. at the Susie Syke private clinic, where it was not obstructed by vegetation, buildings or other objects. The site is not believed to be influenced by firewood burning. It is located ∼100 m from a paved highway (that is busy during the morning and evening rush hours), but it is upwind of it during the predominant weather conditions. Measurements were performed using an “AQMesh” pod, which is a commercially available sensor package. SO2 concentrations were measured using an Alphasense B4-series electrochemical sensor, whereas particle concentrations were measured by the OPC-N2. Note that uncorrected particle mass concentrations were extracted from the AQMesh. The AQMesh was operational between 27 February 2017 and 15 December 2017. Gaps in the data time series are due to power outages.
2.2 Description of the correction factor applied
The methodology for the correction factor applied has previously been described in detail by Crilley et al. (2018). Briefly, the correction factor uses κ-Köhler theory to relate the particle mass to hygroscopicity for a given RH (Pope, 2010), according to Eq. (1):
where aw is the water activity (); m and mo are the wet and dry (RH=0 %) particle mass respectively; and ρw and ρp are the density of the dry particles and water respectively. The value for κ, which relates the bulk aerosol composition to hygroscopicity, can be determined by the non-linear curve fitting of a humidogram, calculated using the ratio of wet/dry particle mass as a function of water activity (aw, RH∕100). We have used the raw mass concentrations as reported by the OPC-N2. We utilized the reference instrument measurements (TEOM-FDMS and GRIMM, as indicated in Sect. 2.2) as the dry particle mass, whereas the raw OPC-N2 measurements were the wet particle mass concentration. The TEOM-FDMS employs a Nafion dryer and, therefore, measures the dry particle mass concentration (Grover et al., 2006). Equation (1) can be rearranged to calculate the correction factor C as follows:
To calculate the particle mass concentration from the measured particle number size distribution, spherical particles of a uniform density and shape are assumed by the OPC; this is not strictly true for airborne particles in an urban atmosphere but is considered to be a standard approximation. For full details, see Crilley et al. (2018). The OPC-N2 assumes the ambient particle density to be 1.65 g cm−3 across all size bins to derive the particle mass concentrations from the measured particle number concentrations (Crilley et al., 2018); therefore, we used this density for the dry particles (ρp) in Eq. (2). We assume that the particle density is uniform across the particle size distribution measured by the OPC-N2. Furthermore, we assume that both the OPC-N2 and the reference instrument respond to dry aerosol mass in the same way for all particles below the size cut-off on the reference instrument. We also note that we assume that both the OPC-N2 and the reference instrument responses are linear over the range of measured concentrations at each site. The raw particle mass concentrations derived by the OPC-N2 are corrected according to Eq. (3):
A wide range of ambient particle concentrations and relative humidity values were observed across the different measurement locations, and an overview of these values is provided in Table 2. Typically, low particle concentrations were observed in Birmingham and Nairobi with higher humidity levels in Birmingham compared with Nairobi (Table 2). Meanwhile, a high particle load was observed in Delhi and Beijing, as would be expected for winter in these two cities. In Delhi, there was a wide range of humidities observed (10 %–100 %), whereas it was relatively dry (median of 35 %) in Beijing during the measurement periods. The observed difference in particle load and composition between sites allows for the effect of relative humidity on the OPC-N2 measurements to be examined and for the applied correction factor to be explored in the following sections.
Table 2Summary of measurement datasets. Reported OPC-N2 PM2.5 mass concentrations are uncorrected. For the Nicaragua measurements, there was no co-located reference instrumentation. Only one 24 h average gravimetric PM2.5 concentration was available for Nairobi, which is presented with the stated measurement uncertainty.

3.1 Effect of RH on the OPC-N2 measurements at all sites
To explore if there was evidence of an artefact in the OPC-N2-derived PM2.5 mass concentrations due to RH, we plotted the reported PM2.5 mass concentrations from the OPC-N2 as a function of RH (Fig. 1 and Fig. S1 in the Supplement). From Fig. 1, there is clear influence of RH on the measurements performed in Delhi and Birmingham, which is evidenced by the observed exponential increase in particle mass with RH (Fig. 1a, d). In Beijing, the observed stepwise increase in the derived measured particle mass between a RH of 40 % and 50 % may point to deliquescence of a predominant PM component (Fig. 1c), which is explored further in later sections. What was evident from these three sites (Beijing, Birmingham and Delhi) was that there was a large spread in the derived PM2.5 mass concentrations at high RH, which likely reflects the heterogeneous nature of the particle composition and, hence, hygroscopicity.
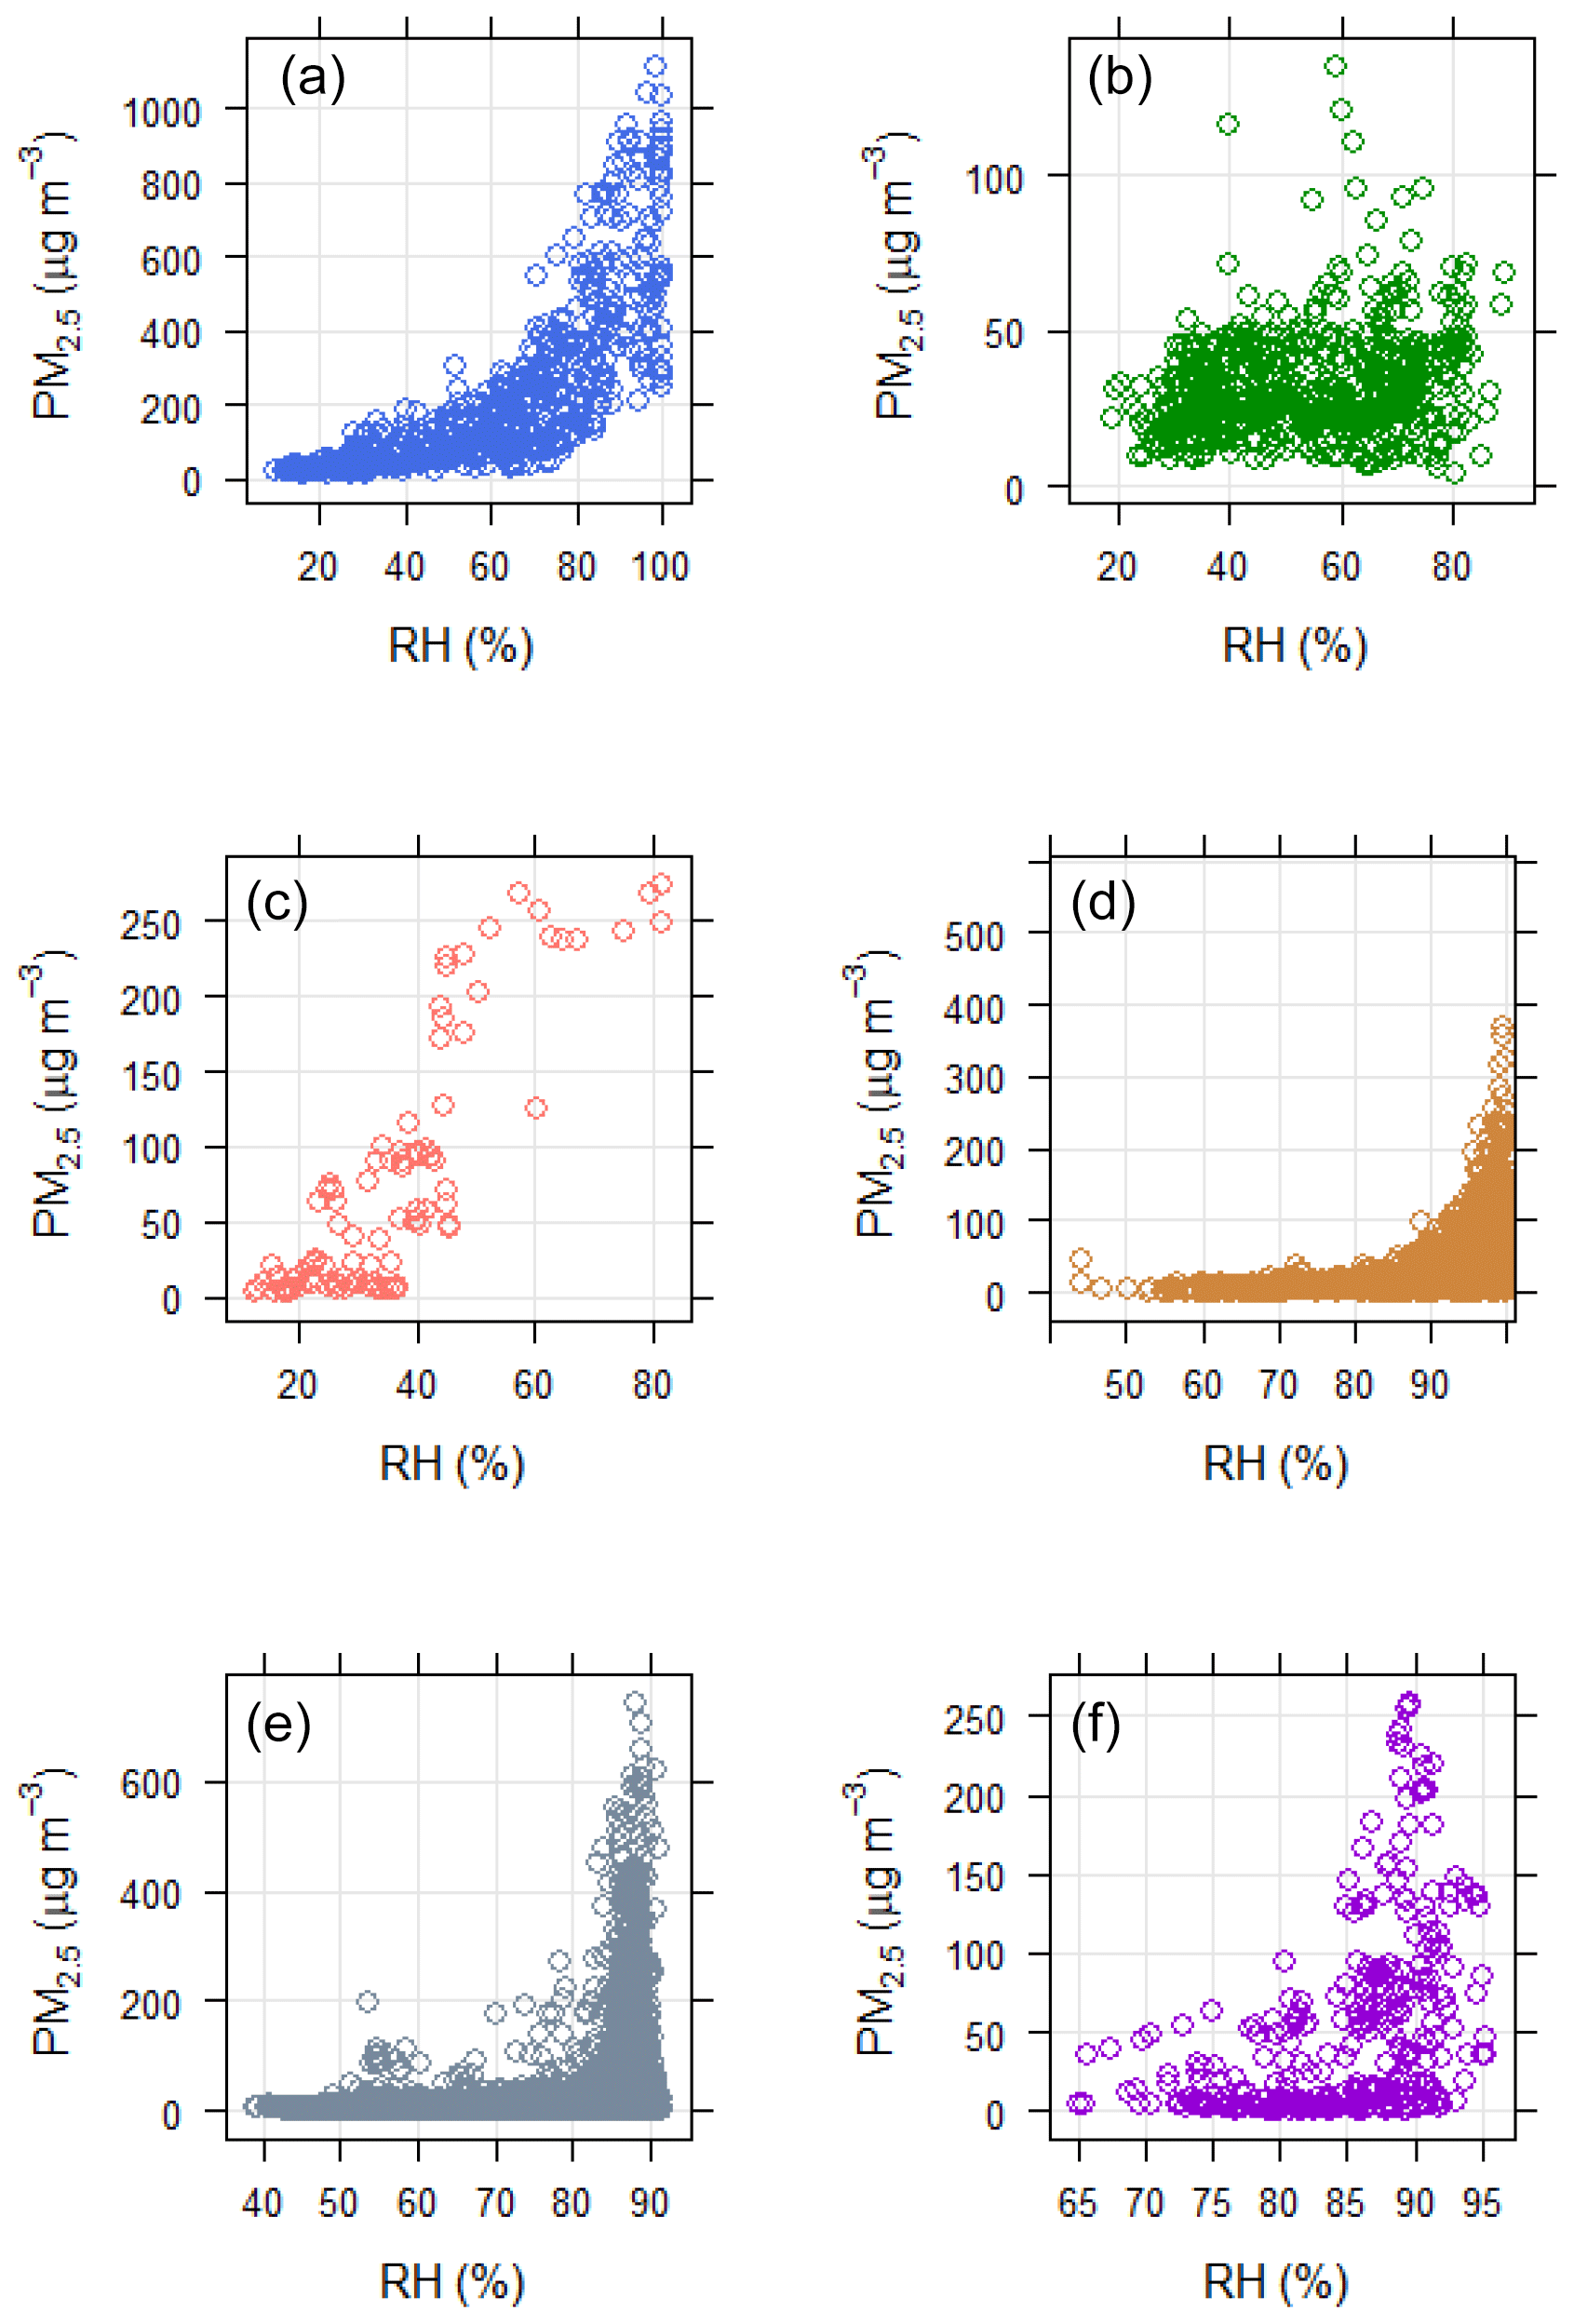
Figure 1Plot of the reported PM2.5 mass concentration from the OPC-N2 against ambient RH for the whole measurement period in Delhi (a), Nairobi (b), Beijing (c), Bham BAQS (d), Nicaragua (e) and Bham Tyburn (f). Note the different y and x axis scales.
Meanwhile at Nairobi, the derived concentrations from the OPC-N2 appeared to be independent of RH. Typically, during the dry season in Nairobi, airborne mineral dust comprises a large fraction of PM2.5 (35 % annual mean; Gaita et al., 2014), which is known to have low hygroscopicity. Furthermore, we note that the measurements in Nairobi were performed during the dry season and, as a result, the ambient RH was typically less than 85 %: this was the threshold RH value identified in Crilley et al. (2018) at which the OPC-N2 becomes significantly sensitive to RH. Lower humidity levels combined with the low hygroscopicity of the aerosol in Nairobi was the likely reason why there was little evidence of a RH artefact observed in the OPC-N2 measurements (Pope et al., 2018). Therefore, a simple calibration against gravimetric measurements is likely to be sufficient in locations with low RH and a low proportion of hygroscopic aerosols, such as Nairobi.
As posited in Crilley et al. (2018), the RH artefact in the OPC-N2 measurements was likely related to the ambient aerosol bulk hygroscopicity. Therefore, in Fig. 2 we plotted humidograms for the sites from Fig. 1 that showed evidence of a RH effect, where reference particle mass concentration data were available (i.e. Birmingham, Delhi and Beijing; Table 2). In Beijing, there were insufficient data at high RH levels due to the short sampling period (4 d). The factors affecting the response of the OPC-N2 in Beijing are explored in more detail in Sect. 3.2.1. A quasi-exponential increase in the ratio the OPC-N2 to reference instrument concentrations at high RH levels was observed in Birmingham and Delhi, as would be expected if the aerosols were undergoing hygroscopic growth (Fig. 2). Using κ-Köhler theory (Petters and Kreidenweis, 2007), the calculated κ values were 0.1 and 0.16 for Birmingham and Delhi respectively. These κ values are typical of continental regions with high organic loadings (Pringle et al., 2010). While high organic loadings would be expected for Delhi during winter, there are also significant loadings of hygroscopic aerosols such as sulfate and nitrate (Gani et al., 2019), which is explored in more detail in the following. Differences in aerosol composition would likely explain why the calculated κ value at Bham BAQS (0.1) was lower than that observed at Bham Tyburn (0.38–0.41; Crilley et al., 2018). Previous work in Birmingham has demonstrated that the proportion of ammonium sulfate and nitrate decreases in winter compared with summer (Yin et al., 2010), which may explain the observed lower κ value over winter. What becomes evident from Fig. 2 is that different κ values were observed at each site. If the aerosol composition was broadly similar at each site, we would expect the same κ value. This suggests that the aerosol composition varies significantly over the different measurement sites. The scatter in the OPC ∕ TEOM observed in Fig. 2 as a function of RH was likely due to temporal variability in the aerosol composition due to changing sources and sinks (both local and regional).
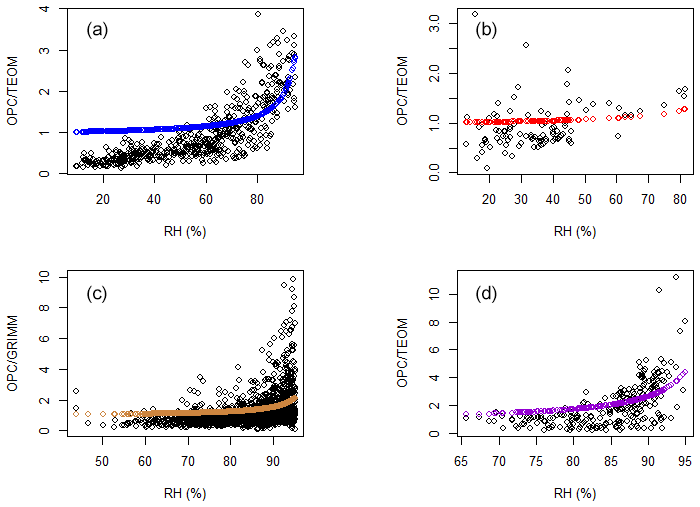
Figure 2Humidograms with the corresponding κ fit (shown in colour) for Delhi (a), Beijing (b), Bham BAQS (c) and Bham Tyburn (d). Note the different y axis and x axis scales. The two-stage correction factor described in Sect. 3.3.1 has not been applied for these humidograms.
3.2 Effect of aerosol composition on the OPC-N2 RH correction factor
3.2.1 Mixed aerosol composition (urban)
To explore the effect of aerosol composition on the correction factor for the OPC-N2, we first focus on the Beijing and Delhi measurements (as co-located on-line aerosol composition data were available at these two sites). During the measurements in Beijing, there were periods when the OPC-N2 and TEOM were in reasonable agreement, which typically occurred at lower PM concentrations (as observed by the regulatory-grade equipment). Figure 3a demonstrates that there was linear relationship between the reported OPC-N2 and TEOM concentrations at concentrations below approximately 150 µg m−3 (r2 of 0.85), with a slope of 0.72. When the PM2.5 mass concentrations were above 150 µg m−3, the relationship appeared to deviate from linearity, although these were also the times when the RH was higher (>50 %, Fig. 3a). Generally, periods of high RH also corresponded to periods of relatively high sulfate concentrations (Fig. 3b) and, to a lesser extent, high particle nitrate concentrations (Fig. S2). Both nitrate and sulfate aerosol have high hygroscopicities (Petters and Kreidenweis, 2007).
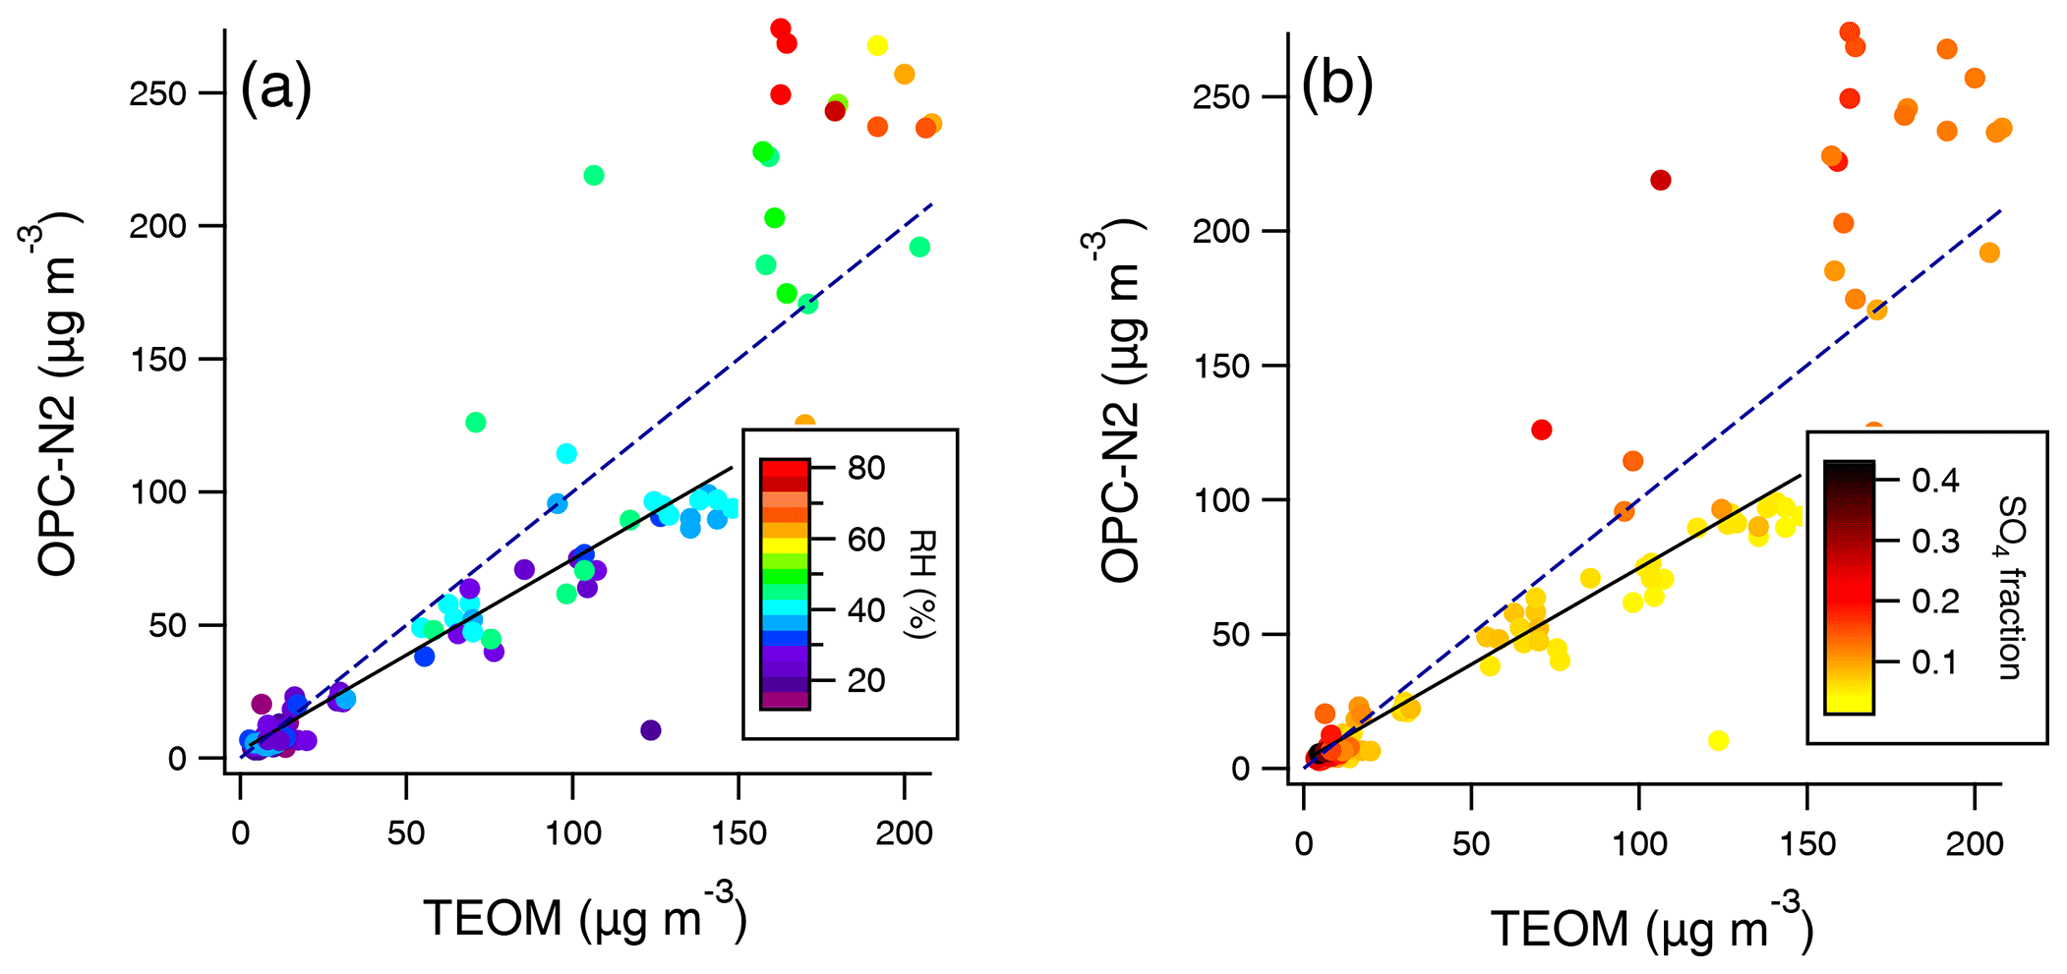
Figure 3Derived OPC-N2 uncorrected PM2.5 mass concentrations against TEOM PM2.5 mass concentration measurements coloured by ambient RH (a) and the fraction of sulfate to the total PM2.5 mass (b) in Beijing. The straight line indicates the linear regression fit for concentrations below 150 µg m−3. The dashed line is the 1:1 line.
Similar trends were also observed in the Delhi measurements. Generally, at low RH there appears to be a linear relationship between the reported OPC-N2 and TEOM concentrations (Fig. 4a), but this deviates from linearity at high RH, which is similar to the behaviour observed in Beijing. For periods when the ambient RH in Delhi was less than 50 %, we observed that the OPC-N2 generally recorded PM2.5 mass concentrations that were half those of the TEOM (slope of 0.48 and r2 of 0.55). This was broadly similar to the behaviour observed in Beijing (Fig. 3a) and suggests that the OPC-N2 generally under-reports PM2.5 mass concentrations at low RH (<50 %). It is also apparent from Fig. 4a that there were times in Delhi when the RH was high (>80 %), but the PM2.5 mass concentrations from the OPC-N2 showed a similar relationship to the TEOM measurements as that seen at low RH levels.
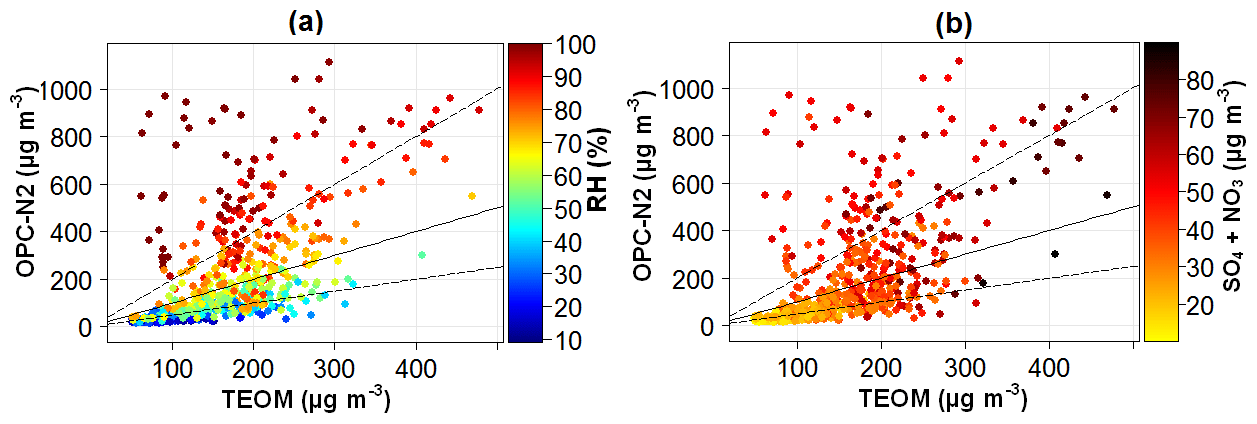
Figure 4Derived OPC-N2 uncorrected PM2.5 mass concentrations against TEOM PM2.5 mass concentration measurements coloured by (a) ambient RH and (b) the sum of the particle sulfate and nitrate concentrations in Delhi. The solid line is the 1:1 line, and the dashed lines are the 0.5:1 and 2:1 lines.
Therefore, we plotted the relationship of the OPC-N2 and TEOM PM2.5 mass concentrations coloured by the sum of the sulfate and nitrate concentrations (Fig. 4b, see Fig. S3 in the Supplement for individual plots of sulfate and nitrate); generally, when the concentration of these species and the RH were high, we observed notably higher OPC-N2 concentrations relative to the reference. Both sulfate and nitrate are highly hygroscopic aerosols which suggests that the high readings by the OPC-N2 relative to the TEOM in Beijing and Delhi were due to water uptake by hygroscopic particles, as suggested by Crilley et al. (2018). From Figs. 3 and 4, it appears that this effect occurred at RH values above 50 %, which is below the deliquescence point of ammonium sulfate (79 %) and indicates that the ammonium sulfate component of the aerosol was in a metastable state. Aerosols with multi-component mixtures are observed to deliquesce earlier than the deliquescence points of the individual components (e.g. Pope et al., 2010). It is noted that the nitrate component of the aerosols have a smoother continual uptake of water with respect to RH (Gibson et al., 2006; Hu et al., 2010).
3.2.2 Homogenous aerosol composition (volcano plume)
The composition of fresh volcanic plumes are typically dominated by sulfuric acid; therefore, these plumes offer an opportunity to explore the use of κ-Köhler theory to develop the correction factor in a substantially homogenous aerosol mix under ambient conditions. If the RH artefact is due to aerosol hygroscopicity, the resultant humidogram using data collected by the OPC-N2 in the plume should resemble that for sulfuric acid. To derive the volcanic plume humidogram, shown in Fig. 5, the following steps were taken: the plume was identified at station 789 when the co-located gas phase SO2 measurement was greater than 20 ppm; the aerosol within the plume was assumed to be composed solely of sulfuric acid with a corresponding κ value of 1.19 (Wexler and Clegg, 2002); the dry mass of the volcanic particles were calculated using Eq. (1), with a RH input from the co-located measurements at site 789; and the derived humidogram was compared with the pure sulfuric acid humidogram calculated using the Extended Aerosol Inorganics Model (E-AIM, Model I; Fig. 5). The observed agreement between the model and measurements strongly points to particle hygroscopic growth driving the high particle mass concentrations observed by the OPC-N2 at high RH.
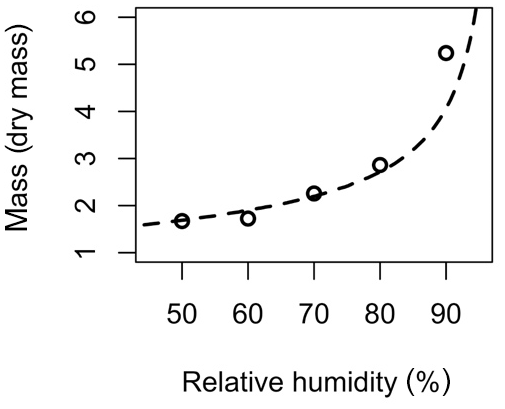
Figure 5Comparison of humidograms from pure sulfuric acid and the Nicaragua volcanic plume. Circles denote the Nicaragua plume aerosol, and the dashed line represents the modelled sulfuric acid humidogram from the E-AIM model.
3.3 Evaluation of the OPC-N2 performance in Delhi and Birmingham
During the measurements in Delhi, the OPC-N2 typically over-reported the PM2.5 mass concentrations relative to the reference (Fig. 6a). The OPC-N2 assumes a uniform particle density of 1.65 g cm−3 in the particle counts to mass conversion, and this density may be inappropriate for Delhi aerosol during winter. Previous measurements of aerosol density during winter in Delhi at midday were 1.28±0.12 g cm−3 on average (Sarangi et al., 2016), which is lower than that applied by the OPC-N2. Generally, the OPC ∕ TEOM ratio was below 1 (Fig. 2a) and would not fully explain this discrepancy. Is can be noted from Fig. 6a that higher PM2.5 mass concentrations relative to the reference were reported by the OPC-N2 towards the start of the measurement period (Fig. 6a), generally during periods of high RH (e.g. 25–29 January, Fig. 6b). We also note that the reported concentrations from the OPC-N2 towards the end of the measurements in Delhi (11 February onwards, Fig. 6a) were in better agreement with reference. The cause of this change in performance is unclear, but it could reflect lower RH values or changes in the aerosol composition.
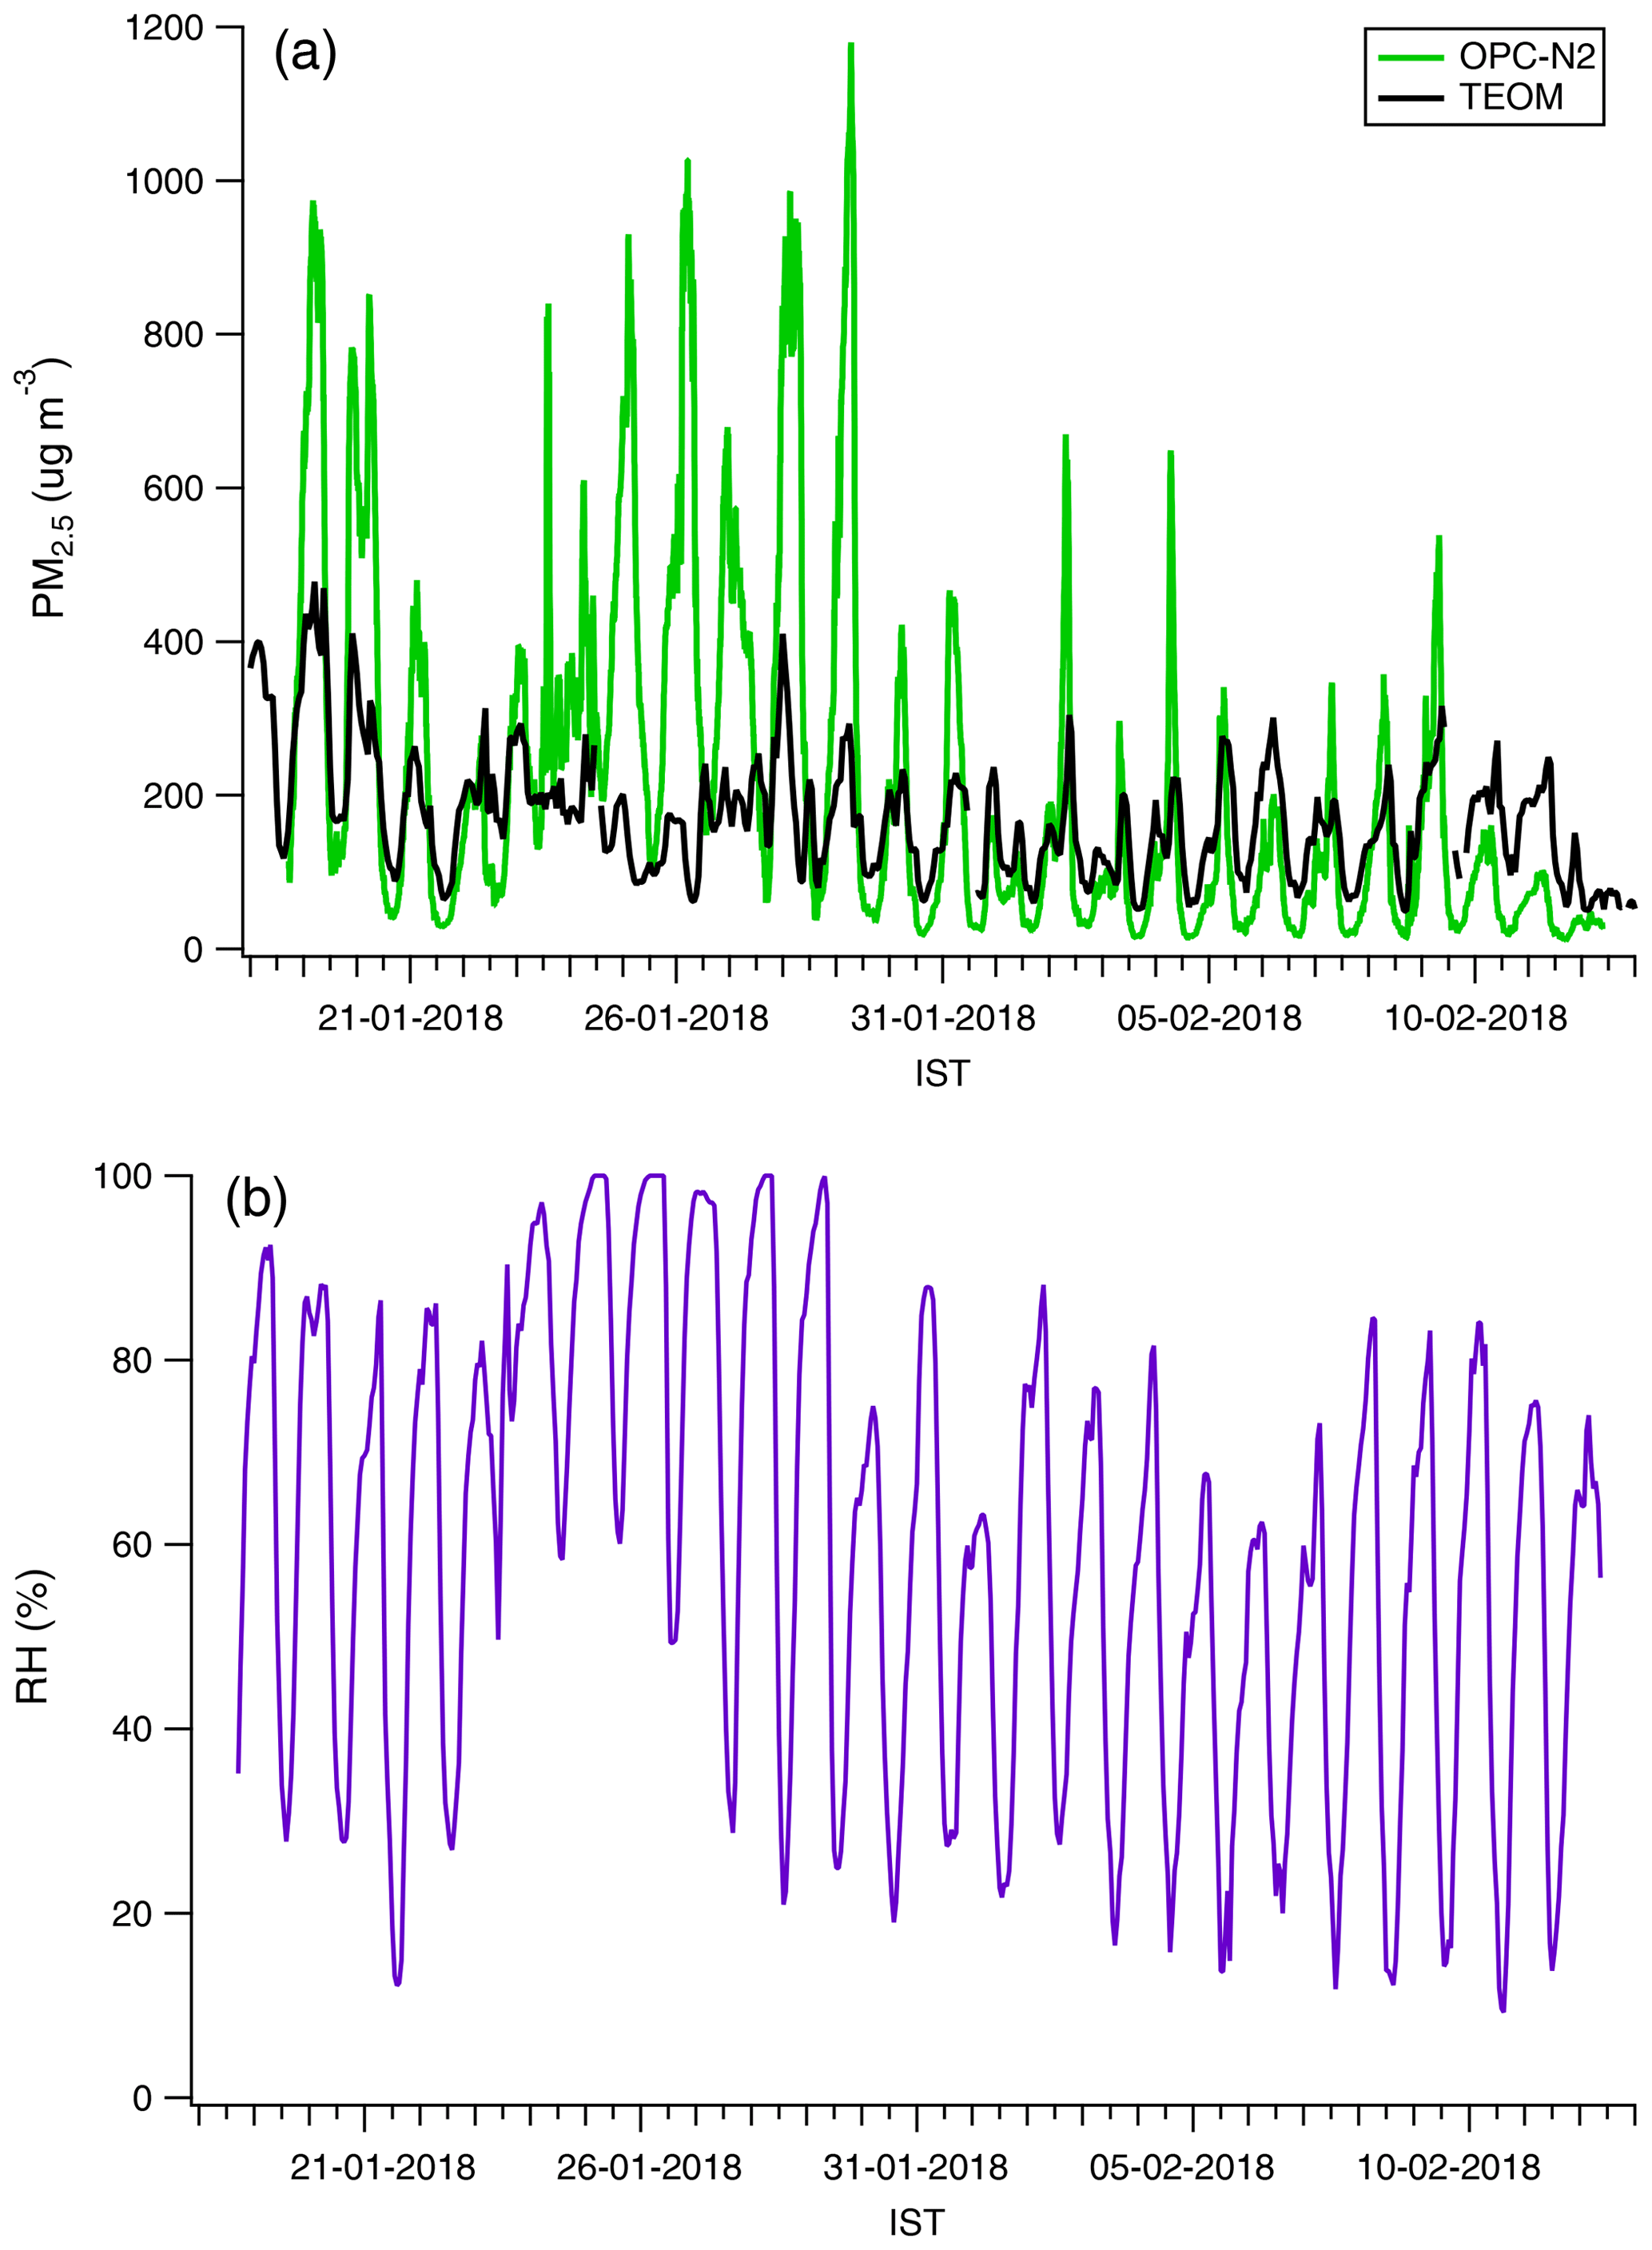
Figure 6Time series of reported OPC-N2 and TEOM-FDMS PM2.5 mass concentrations (a) and ambient RH (b) at IIT Delhi.
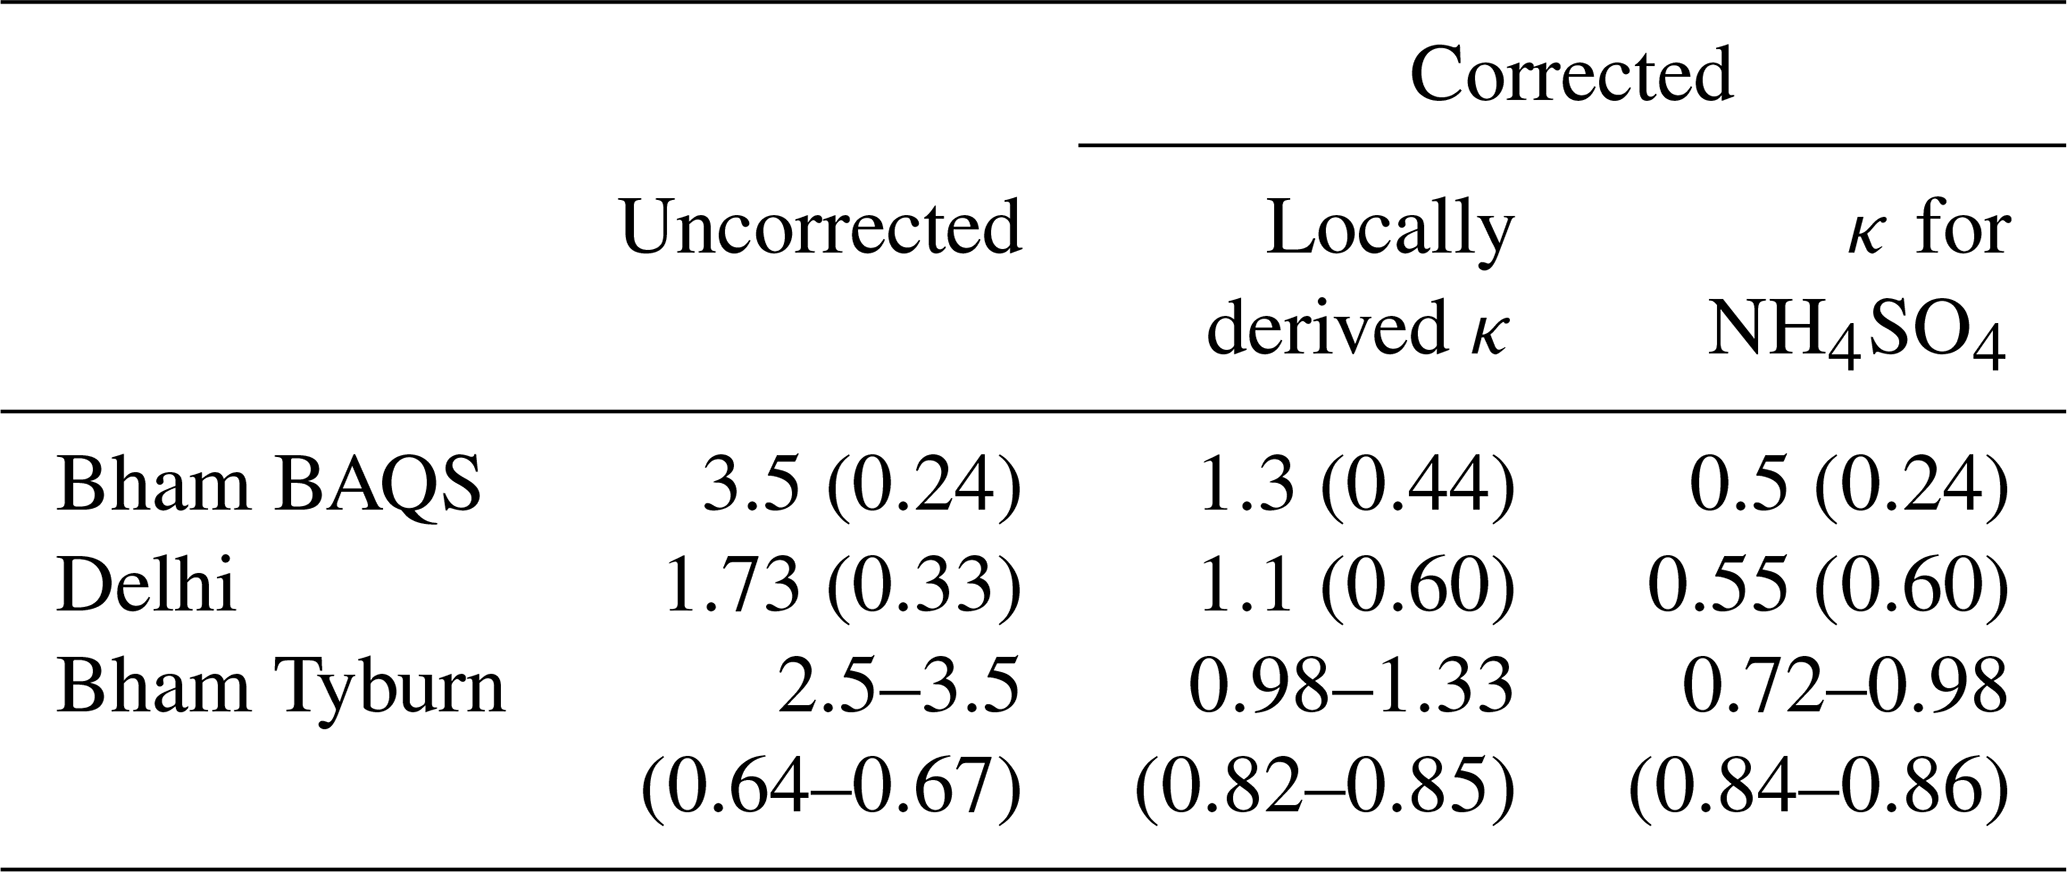
As the reported OPC-N2 concentrations in Birmingham and Delhi demonstrated an artefact due to RH (Fig. 2), we applied the correction factor from Crilley et al. (2018), using the in situ locally derived κ values. In addition, the κ value for ammonium sulfate (0.61) was also used, as Di Antonio et al. (2018) suggested it may be more representative for urban aerosols. The results for the correction factors relative to the co-located reference instruments are summarized in Table 3. Compared with the uncorrected OPC-N2 concentrations, the application of a correction factor with both κ values resulted in improved performance of the reported concentrations relative to the reference. However, the use of the locally derived κ resulted in the best correction of the OPC-N2 (to within 33 % of the reference measurements) compared with using the ammonium sulfate κ value (Table 3).
Table 3Slopes of uncorrected and corrected PM2.5 mass concentrations from the OPC-N2 relative to the reference instruments (r2 in parentheses). Intercepts were not constrained to zero. There were four OPC-N2 sensors measuring at Bham Tyburn, and the range of measurements from these instruments is presented.
We also observed that the ratio of OPC-N2 ∕ GRIMM concentrations was low at high RH at Bham BAQS (Fig. 2c). The spread in OPC ∕ GRIMM ratios observed at high RH at Bham BAQS is indicative of a diverse aerosol composition with differing hygroscopicity over the 4 months. With respect to the calculated κ value for each month in Birmingham, very little variability (0.1–0.12) was found from October to January which suggests that the bulk hygroscopicity of the aerosols was consistent on average, although within a large range (as indicated by the large spread in the OPC ∕ TEOM ratio in Fig. 2c).
3.3.1 Two-stage correction methodology for datasets with a wide range of ambient RH values
For the Delhi dataset, the observed wide range of ambient RH values may have affected the correction factor (Fig. 2), as particle hygroscopic growth would be limited at low RH. Consequently, at low RH, defined as a RH less than 60 %, a linear correction factor may be more appropriate. From Fig. 2, there appeared to be a linear relationship between the OPC-N2 and TEOM PM2.5 measurements for RH values less 60 %. Therefore, we calculated a linear correction factor for the OPC-N2 relative to the TEOM when the ambient RH was less than 60 % (Fig. S4) and applied it to the reported OPC-N2 PM2.5 concentrations. Using these normalized OPC-N2 concentrations, the humidogram was replotted (Fig. 7), and the corresponding κ fit was calculated (Fig. 7). With the above-mentioned normalized OPC-N2 measurements, the κ line is also a better fit to the observed OPC ∕ TEOM (Fig. 7) compared with using the uncorrected OPC-N2 data (Fig. 2). The calculated κ value from Fig. 7 was 0.45, which may be considered more realistic considering the high sulfate and nitrate loading in Delhi (Fig. 4). Using the κ from Fig. 7, we corrected the normalized OPC-N2 PM2.5 concentrations using Eqs. (2) and (3). The time series of the corrected OPC-N2 concentrations is shown in Fig. S5, and the application of this two-stage correction method resulted in the OPC-N2 being in good agreement with the reference instrument (slope of 1.1, r2 of 0.61). However, we note that this is similar to the agreement observed when the OPC-N2 was corrected without the two-stage approach (Table 3). Nevertheless, the two-stage approach resulted in more physically realistic humidograms and κ values (Fig. 7) for Delhi, and this approach may be more appropriate for locations that experience a wide range of ambient RH values.
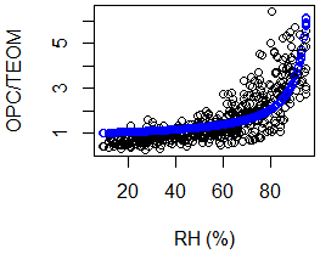
Figure 7Humidograms for Delhi using the normalized OPC-N2 PM2.5 mass concentrations with the corresponding κ fit.
3.4 The global applicability of correction factors
The results so far point to the need to establish the aerosol composition in order to accurately apply a suitable correction factor, which is in agreement with previous work (Di Antonio et al., 2018; Crilley et al., 2018). However, the determination of the aerosol composition at the necessary time resolution would require expensive co-located equipment to measure the aerosol composition (e.g. an aerosol mass spectrometer), and this would somewhat negate the USPs of a low-cost monitor. Di Antonio et al. (2018) suggested that the air mass origin (determined using HYSPLIT) could provide compositional information in order to determine the appropriate κ value to use in the correction. Therefore, we examined the long-term Birmingham dataset for times when the correction factor that was applied over/under-corrected the OPC-N2 mass concentrations relative to reference instrument. However, unlike Di Antonio et al. (2018), we could not find any consistent patterns with respect to air mass origin and the performance of the correction factor. Furthermore, the application of a correction factor using this approach would require significant post-processing time. This raises the question of whether the method would then remain a “low-cost” option or not.
To remain a low-cost option, a simple correction that can be applied to the OPC-N2 irrespective of aerosol composition changes is needed, although this may decrease the accuracy of the correction factor. For many locations around the world, ambient PM2.5 mass concentrations are measured using gravimetric-based techniques (e.g. filters or TEOM) for regulatory purposes. Consequently, we focused on developing a simple correction factor using TEOM data as a reference. To explore if this was viable, we plotted the OPC ∕ TEOM ratio for all sites where it was available (Bham Tyburn, Delhi and Beijing) on one plot (Fig. 8). Note we used the two-stage correction for the OPC-N2 measurements in Delhi, as described in Sect. 3.3.1, for Fig. 8. We did not apply this correction to the Bham Tyburn data as the RH was higher than 60 %.
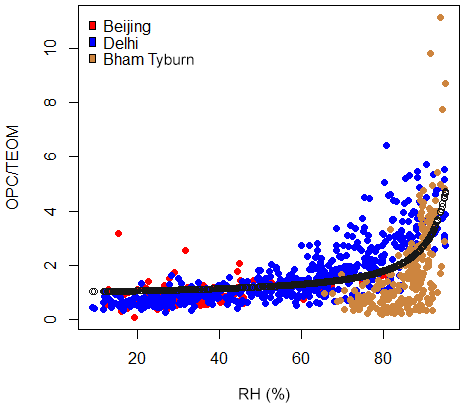
Figure 8Humidogram using OPC-N2 data where there was dry reference mass (TEOM), coloured by location. The resultant κ fit (black) was generated using data from all three sites.
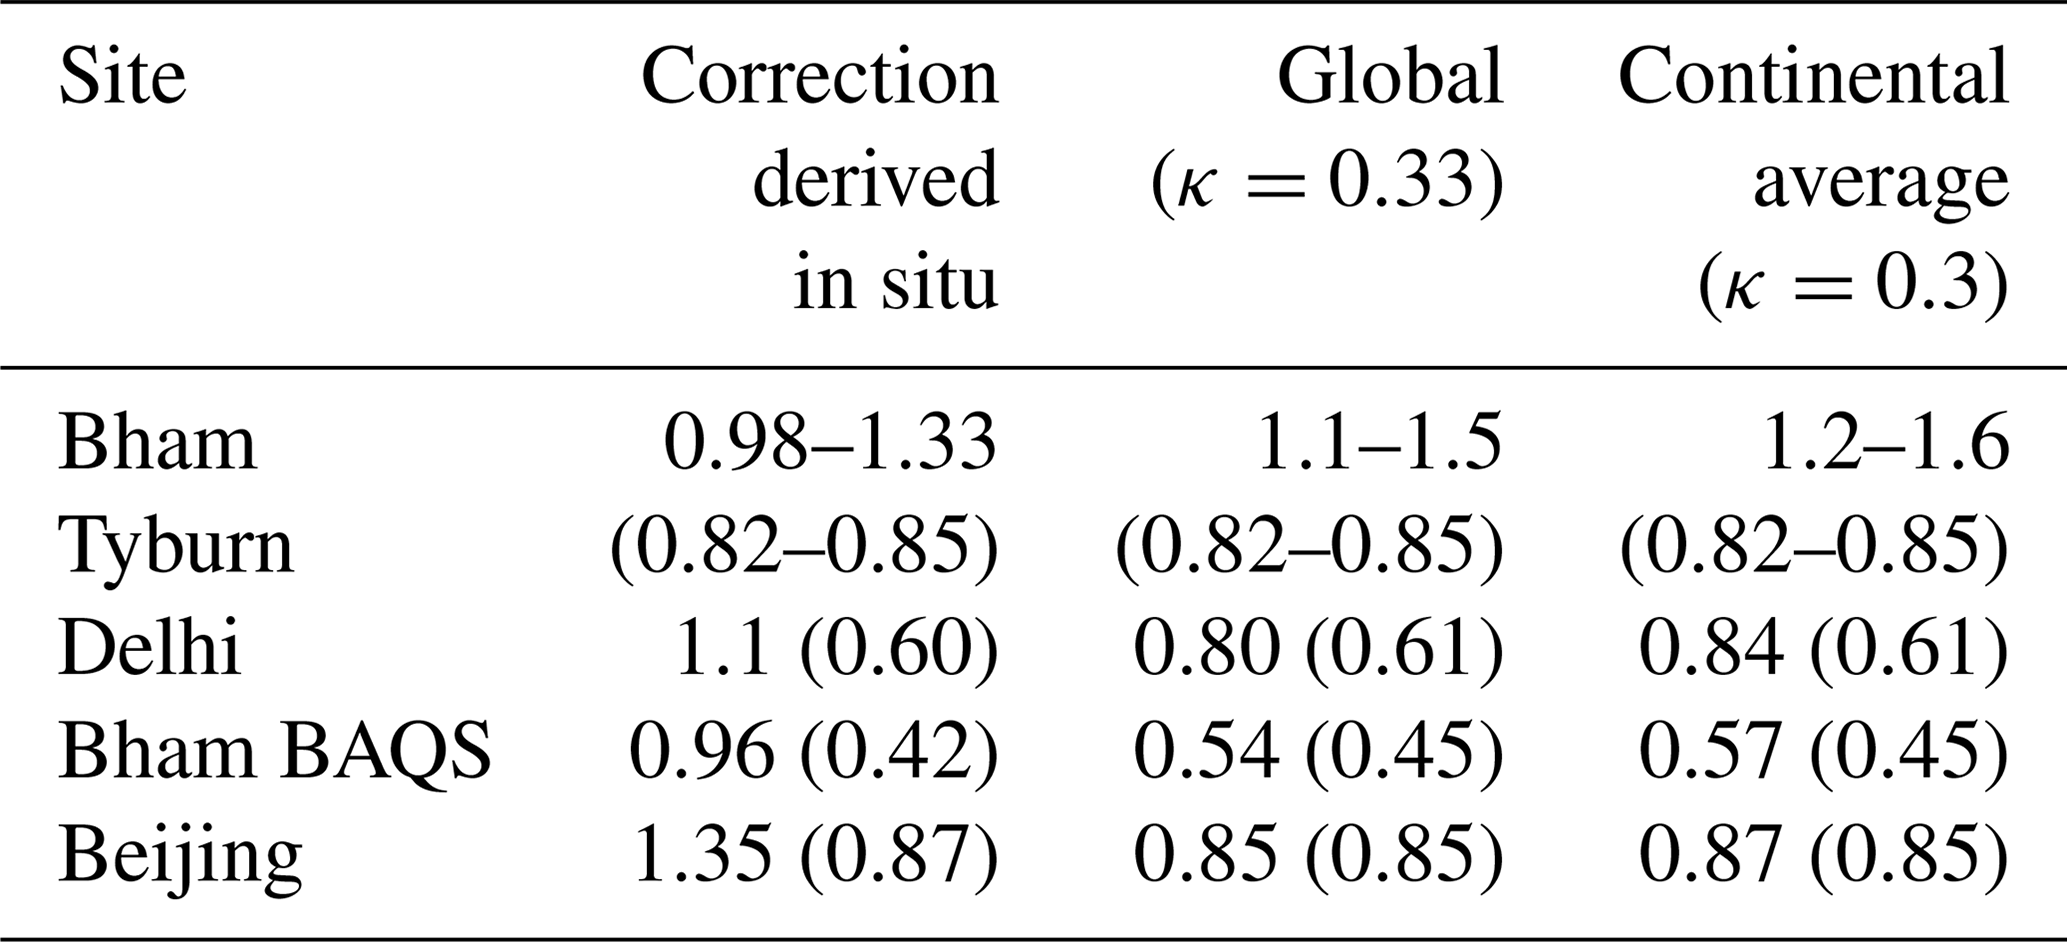
From Fig. 8, a κ value of 0.33 (assuming a uniform particle density of 1.65 for all sites) was calculated, which is slightly higher than the average of 0.3 suggested for continental regions (Pringle et al., 2010). Consequently, we refer to the calculated κ value from Fig. 8 as global κ, but we note that it was calculated from three urban background sites on two continents. We applied this κ (0.33) to correct the OPC-N2 data at all sites as well as the average for continental regions (0.3), and the results are summarized in Table 4. Variation in the κ values generally resulted in changes in the slope, while the correlation co-efficient remained similar. While the κ value that was derived in situ resulted in a reasonable correction of the OPC-N2 relative to the reference (±10 %–30 %, Table 4), using the κ from Fig. 8 (0.33) was comparable. Correcting the datasets using the global κ of 0.33 resulted in an agreement with the reference instruments of within 50 % at all sites, with the Beijing, Delhi and some of the Bham Tyburn corrected OPC-N2 values being within 20 % of the reference (Table 4). The only site with a notably poorer agreement using the global compared with the in situ κ value was Bham BAQS, and this may be because the locally derived κ value for the Bham BAQS measurements (0.1) was different from the other sites. This notwithstanding, we do note that using a κ value of 0.33 resulted in a significant improvement in accuracy compared with the uncorrected OPC-N2-derived particle mass concentrations at Bham BAQS (slope of 3.5, Table 3). Overall, when considering the most appropriate correction or κ value, the results from Table 3 suggest that a locally derived κ value, based on an in situ calibration with reference instrumentation, is preferable. However, the global κ value derived using data from the three urban background locations in this study (0.33, Fig. 8) gave comparable results to the correction that was derived in situ (Table 4). Therefore, this suggests that using this κ value or a suitable value from the literature for urban background sites may be acceptable should there be no reference instruments available for calibration.
Table 4Comparison of the performance of the local and global correction factors for correcting OPC-N2 measurements using the Crilley et al. (2018) method: shown as a slope relative to the reference instrument with the r2 values given in parentheses. Intercepts were not constrained to zero.
Recent work has demonstrated that aerosol hygroscopicity is likely the key parameter to consider when correcting particle mass concentrations derived using a low-cost OPC, particularly at high ambient RH. Consequently, correction factors have been developed that apply κ-Köhler theory to correct for the influence of water uptake by hygroscopic aerosols. In the current work, we explored the performance of this correction factor using datasets from reference instruments and low-cost OPCs (OPC-N2) co-located in environments that had differing aerosol compositions, particle loads and ambient RH values. We observed evidence that the enhanced high concentrations reported by the OPC-N2 relative to reference instrumentation during periods of high RH were related to the amount of hygroscopic aerosols (sulfate and nitrate) and RH, which would be expected if the bulk aerosol hygroscopicity was driving this response. This was most clearly observed during measurements in volcanic plumes in Nicaragua, where the observed humidogram closely resembled the calculated pure sulfuric acid humidogram. This agreement between the model and measurements strongly points to particle hygroscopic growth driving the high particle mass concentrations observed by the OPC-N2 during times of high ambient RH.
The results indicate that the particle mass concentration measurements reported by low-cost OPCs during periods of high RH (>60 %) need to be corrected for aerosol hygroscopic growth. We employed the correction factor method outlined in Crilley et al. (2018) to account for this and observed corrected OPC-N2 PM2.5 mass concentrations to be within 33 % of the reference at all sites. The choice of the κ value applied was found to be critical. The results from the current work indicate that a κ value derived in situ (using suitable reference instrumentation) leads to the most accurate correction relative to co-located reference instruments. The κ value derived in situ would also likely be dependent on the time of year if there were any local seasonality to the bulk aerosol composition, and this would need to be considered when determining appropriate calibration procedures.
An average κ value of 0.33 was calculated using measurements from three urban locations around the globe (Beijing, Birmingham and Delhi). Applying this global κ value in the correction factor notably improved the reported OPC-N2 PM2.5 mass concentrations, relative to the uncorrected measurements, to within 50 % of reference measurements at all sites. Therefore, for areas where suitable reference instrumentation for developing a local correction factor is lacking, using a literature κ value can result in a reasonable correction. For locations with low levels of hygroscopic aerosols and low RH (such as Nairobi), a simple calibration against gravimetric measurements (using suitable reference instrumentation) would likely be sufficient. Whilst this study specifically generated correction factors for the Alphasense OPC-N2 sensor, the calibration methodology developed is likely amenable to other low-cost PM sensors.
The data use in this study are available upon request.
The supplement related to this article is available online at: https://doi.org/10.5194/amt-13-1181-2020-supplement.
LRC and FDP conceived the study. LRC, AS, LJK and FDP performed the data analysis. LRC, LJK, MDS, MSA, SY, WF, PF, YS, SG, JSA, AS, RCWW, EI, DN, MG and FDP contributed to data investigation and curation. LRC wrote the original draft of the paper, and all co-authors contributed to reviewing and editing the paper.
The authors declare that they have no conflict of interest.
We acknowledge Zifa Wang and Jie Li from IAP for hosting the APHH-Beijing campaign at IAP. We thank Zongbo Shi, Di Liu, Roy Harrison and Tuan Vu from the University of Birmingham; Liangfang Wei, Hong Ren, Qiaorong Xie, Wanyu Zhao, Linjie Li, Ping Li, Shengjie Hou and Qingqing Wang from IAP; Rachel Dunmore and James Lee from the University of York; Kebin He and Xiaoting Cheng from Tsinghua University; and James Allan and Hugh Coe from the University of Manchester for providing logistic and scientific support for the field campaigns. We gratefully acknowledge Mukesh Khare, Isha Kanna, Saif Khan, Rulan Verma and Gazala Habib from IIT Delhi for hosting and facilitating the measurements at IIT Delhi. Scientific research support from the International Science Programme in Sweden to the Institute of Nuclear Science and Technology at the University of Nairobi was appreciated.
The APHH-Beijing project was funded by the UK Natural Environment Research Council (NERC), the Medical Research Council and the Natural Science Foundation of China within the framework of the Newton Innovation Fund (grant nos. NE/N007190/1 and NE/N007077/1). Leigh R. Crilley, Louisa J. Kramer, Mohammed S. Alam and William J. Bloss acknowledge funding for ASAP-Delhi as part of the APHH-India project by the UK Natural Environment Research Council (NERC), the Indian Ministry of Earth Sciences (MoES) and the Department for Biotechnology (DBT; grant no. NE/P016499/1). The work in the UK was funded via a NERC grant (Quantification of Utility of Atmospheric Network Technologies, QUANT, grant no. NE/T001968/1). The work in Kenya was funded via an EPSRC grant (Global Challenges Research Fund grant no. IS2016), the Royal Society and Royal Society of Chemistry International Exchanges Award (grant no. IE170267) and DFID via the East African Research Fund (EARF) “A Systems Approach to Air Pollution (ASAP) East Africa” grant. The work in Nicaragua was funded by the GCRF UNRESP project (grant nos. NE/P015271/1 and NE/R009465/1).
This paper was edited by Charles Brock and reviewed by Don Collins and one anonymous referee.
Alam, M. S., Keyte, I. J., Yin, J., Stark, C., Jones, A. M., and Harrison, R. M: Diurnal variability of polycyclic aromatic compound (PAC) concentrations: relationship with meteorological conditions and inferred sources, Atmos. Environ., 122, 427–438, 2015.
Borrego, C., Costa, A. M., Ginja, J., Amorim, M., Coutinho, M., Karatzas, K., Sioumis, T., Katsifarakis, N., Konstantinidis, K., De Vito, S., Esposito, E., Smith, P., André, N., Gérard, P., Francis, L. A., Castell, N., Schneider, P., Viana, M., Minguillón, M. C., Reimringer, W., Otjes, R. P., von Sicard, O., Pohle, R., Elen, B., Suriano, D., Pfister, V., Prato, M., Dipinto, S., and Penza, M.: Assessment of air quality microsensors versus reference methods: The EuNetAir joint exercise, Atmos. Environ., 147, 246–263, https://doi.org/10.1016/j.atmosenv.2016.09.050, 2016.
Castell, N., Dauge, F. R., Schneider, P., Vogt, M., Lerner, U., Fishbain, B., Broday, D., and Bartonova, A.: Can commercial low-cost sensor platforms contribute to air quality monitoring and exposure estimates?, Environ. Int., 99, 293–302, https://doi.org/10.1016/j.envint.2016.12.007, 2017.
Cohen, A. J., Ross Anderson, H., Ostro, B., Pandey, K. D., Krzyzanowski, M., Künzli, N., Gutschmidt, K., Pope, A., Romieu, I., Samet, J. M., and Smith, K.: The Global Burden of Disease Due to Outdoor Air Pollution, J. Toxicol. Env. Health A, 68, 1301–1307, https://doi.org/10.1080/15287390590936166, 2005.
Crilley, L. R., Shaw, M., Pound, R., Kramer, L. J., Price, R., Young, S., Lewis, A. C., and Pope, F. D.: Evaluation of a low-cost optical particle counter (Alphasense OPC-N2) for ambient air monitoring, Atmos. Meas. Tech., 11, 709–720, https://doi.org/10.5194/amt-11-709-2018, 2018.
de Nazelle, A., Bode, O., and Orjuela, J. P.: Comparison of air pollution exposures in active vs. passive travel modes in European cities: A quantitative review, Environ. Int., 99, 151–160, https://doi.org/10.1016/j.envint.2016.12.023, 2017.
Di Antonio, A., Popoola, O., Ouyang, B., Saffell, J., and Jones, R.: Developing a Relative Humidity Correction for Low-Cost Sensors Measuring Ambient Particulate Matter, Sensors, 18, 2790, https://doi.org/10.3390/s18092790, 2018.
Gaita, S. M., Boman, J., Gatari, M. J., Pettersson, J. B. C., and Janhäll, S.: Source apportionment and seasonal variation of PM2.5 in a Sub-Saharan African city: Nairobi, Kenya, Atmos. Chem. Phys., 14, 9977–9991, https://doi.org/10.5194/acp-14-9977-2014, 2014.
Gani, S., Bhandari, S., Seraj, S., Wang, D. S., Patel, K., Soni, P., Arub, Z., Habib, G., Hildebrandt Ruiz, L., and Apte, J. S.: Submicron aerosol composition in the world's most polluted megacity: the Delhi Aerosol Supersite study, Atmos. Chem. Phys., 19, 6843–6859, https://doi.org/10.5194/acp-19-6843-2019, 2019.
Gibson, E. R., Hudson, P. K., and Grassian, V. H: Physicochemical properties of nitrate aerosols: Implications for the atmosphere, J. Phys. Chem. A., 110, 11785–11799, 2006.
Grover, B. D., Eatough, N. L., Eatough, D. J., Chow, J. C., Watson, J. G., Ambs, J. L., Meyer, M. B., Hopke, P. K., Al-Horr, R., Later, D. W., and Wilson, W. E.: Measurement of Both Nonvolatile and Semi-Volatile Fractions of Fine Particulate Matter in Fresno, CA, Aerosol. Sci. Tech., 40, 811–826, https://doi.org/10.1080/02786820600615071, 2006.
Hagan, D. H., Tolmie, A., and Trochim, J.: py-opc: operate the Alphasense OPC-N2 from a raspberry pi or other popular microcontrollers/microcomputers, Journal of Open Source Software, 3, 782, https://doi.org/10.21105/joss.00782, 2018.
Hu, D., Qiao, L., Chen, J., Ye, X., Yang, X., Cheng, T., and Fang, W.: Hygroscopicity of inorganic aerosols: size and relative humidity effects on the growth factor, Aerosol. Air. Qual. Res., 10, 255–264, 2010.
Jayaratne, R., Liu, X., Thai, P., Dunbabin, M., and Morawska, L.: The influence of humidity on the performance of a low-cost air particle mass sensor and the effect of atmospheric fog, Atmos. Meas. Tech., 11, 4883–4890, https://doi.org/10.5194/amt-11-4883-2018, 2018.
Landrigan, P. J., Fuller, R., Acosta, N. J. R., Adeyi, O., Arnold, R., Basu, N., Baldé, A. B., Bertollini, R., Bose-O'Reilly, S., Boufford, J. I., Breysse, P. N., Chiles, T., Mahidol, C., Coll-Seck, A. M., Cropper, M. L., Fobil, J., Fuster, V., Greenstone, M., Haines, A., Hanrahan, D., Hunter, D., Khare, M., Krupnick, A., Lanphear, B., Lohani, B., Martin, K., Mathiasen, K. V., McTeer, M. A., Murray, C. J. L., Ndahimananjara, J. D., Perera, F., Potočnik, J., Preker, A. S., Ramesh, J., Rockström, J., Salinas, C., Samson, L. D., Sandilya, K., Sly, P. D., Smith, K. R., Steiner, A., Stewart, R. B., Suk, W. A., van Schayck, O. C. P., Yadama, G. N., Yumkella, K., and Zhong, M.: The Lancet Commission on pollution and health, The Lancet, 391, 462–512, https://doi.org/10.1016/S0140-6736(17)32345-0, 2018.
Lewis, A., Peltier, W. R., and von Schneidemesser, E.: Low-cost sensors for the measurement of atmospheric composition: Overview of topic and future applications, Research Report, World Meteorological Organization (WMO), Geneva, Switzerland, 2018.
Lewis, A. C., Lee, J. D., Edwards, P. M., Shaw, M. D., Evans, M. J., Moller, S. J., Smith, K. R., Buckley, J. W., Ellis, M., Gillot, S. R., and White, A.: Evaluating the performance of low cost chemical sensors for air pollution research, Faraday Discuss., 189, 85–103, https://doi.org/10.1039/C5FD00201J, 2016.
Mead, M. I., Popoola, O. A. M., Stewart, G. B., Landshoff, P., Calleja, M., Hayes, M., Baldovi, J. J., McLeod, M. W., Hodgson, T. F., Dicks, J., Lewis, A., Cohen, J., Baron, R., Saffell, J. R., and Jones, R. L.: The use of electrochemical sensors for monitoring urban air quality in low-cost, high-density networks, Atmos. Environ., 70, 186–203, https://doi.org/10.1016/j.atmosenv.2012.11.060, 2013.
Morawska, L., Thai, P. K., Liu, X., Asumadu-Sakyi, A., Ayoko, G., Bartonova, A., Bedini, A., Chai, F., Christensen, B., Dunbabin, M., Gao, J., Hagler, G. S. W., Jayaratne, R., Kumar, P., Lau, A. K. H., Louie, P. K. K., Mazaheri, M., Ning, Z., Motta, N., Mullins, B., Rahman, M. M., Ristovski, Z., Shafiei, M., Tjondronegoro, D., Westerdahl, D., and Williams, R.: Applications of low-cost sensing technologies for air quality monitoring and exposure assessment: How far have they gone?, Environ. Int., 116, 286–299, https://doi.org/10.1016/j.envint.2018.04.018, 2018.
Petters, M. D. and Kreidenweis, S. M.: A single parameter representation of hygroscopic growth and cloud condensation nucleus activity, Atmos. Chem. Phys., 7, 1961–1971, https://doi.org/10.5194/acp-7-1961-2007, 2007.
Pope, F. D.: Pollen grains are efficient cloud condensation nuclei, Environ. Res. Lett., 5, 044015, https://doi.org/10.1088/1748-9326/5/4/044015, 2010.
Pope, F. D., Dennis-Smither, B. J., Griffiths, P. T., Clegg, S. L., and Cox, R. A.: Studies of Single Aerosol Particles Containing Malonic Acid, Glutaric Acid, and Their Mixtures with Sodium Chloride. I. Hygroscopic Growth, J. Phys. Chem. A, 114, 5335–5341, https://doi.org/10.1021/jp100059k, 2010.
Pope, F. D., Gatari, M., Ng'ang'a, D., Poynter, A., and Blake, R.: Airborne particulate matter monitoring in Kenya using calibrated low-cost sensors, Atmos. Chem. Phys., 18, 15403–15418, https://doi.org/10.5194/acp-18-15403-2018, 2018.
Popoola, O. A. M., Stewart, G. B., Mead, M. I., and Jones, R. L.: Development of a baseline-temperature correction methodology for electrochemical sensors and its implications for long-term stability, Atmos. Environ., 147, 330–343, https://doi.org/10.1016/j.atmosenv.2016.10.024, 2016.
Pringle, K. J., Tost, H., Pozzer, A., Pöschl, U., and Lelieveld, J.: Global distribution of the effective aerosol hygroscopicity parameter for CCN activation, Atmos. Chem. Phys., 10, 5241–5255, https://doi.org/10.5194/acp-10-5241-2010, 2010.
Sarangi, B., Aggarwal, S. G., Sinha, D., and Gupta, P. K.: Aerosol effective density measurement using scanning mobility particle sizer and quartz crystal microbalance with the estimation of involved uncertainty, Atmos. Meas. Tech., 9, 859–875, https://doi.org/10.5194/amt-9-859-2016, 2016.
Shehab, M. A. and Pope, F. D.: Effects of short-term exposure to particulate matter air pollution on cognitive performance, Sci. Rep., 9, 8237, https://doi.org/10.1038/s41598-019-44561-0, 2019.
Shi, Z., Vu, T., Kotthaus, S., Harrison, R. M., Grimmond, S., Yue, S., Zhu, T., Lee, J., Han, Y., Demuzere, M., Dunmore, R. E., Ren, L., Liu, D., Wang, Y., Wild, O., Allan, J., Acton, W. J., Barlow, J., Barratt, B., Beddows, D., Bloss, W. J., Calzolai, G., Carruthers, D., Carslaw, D. C., Chan, Q., Chatzidiakou, L., Chen, Y., Crilley, L., Coe, H., Dai, T., Doherty, R., Duan, F., Fu, P., Ge, B., Ge, M., Guan, D., Hamilton, J. F., He, K., Heal, M., Heard, D., Hewitt, C. N., Hollaway, M., Hu, M., Ji, D., Jiang, X., Jones, R., Kalberer, M., Kelly, F. J., Kramer, L., Langford, B., Lin, C., Lewis, A. C., Li, J., Li, W., Liu, H., Liu, J., Loh, M., Lu, K., Lucarelli, F., Mann, G., McFiggans, G., Miller, M. R., Mills, G., Monk, P., Nemitz, E., O'Connor, F., Ouyang, B., Palmer, P. I., Percival, C., Popoola, O., Reeves, C., Rickard, A. R., Shao, L., Shi, G., Spracklen, D., Stevenson, D., Sun, Y., Sun, Z., Tao, S., Tong, S., Wang, Q., Wang, W., Wang, X., Wang, X., Wang, Z., Wei, L., Whalley, L., Wu, X., Wu, Z., Xie, P., Yang, F., Zhang, Q., Zhang, Y., Zhang, Y., and Zheng, M.: Introduction to the special issue “In-depth study of air pollution sources and processes within Beijing and its surrounding region (APHH-Beijing)”, Atmos. Chem. Phys., 19, 7519–7546, https://doi.org/10.5194/acp-19-7519-2019, 2019.
Smith, K. R., Edwards, P., Evans, M. J., Lee, J. D., Shaw, M. D., Squires, F. A., and Lewis, A.: Clustering approaches to improve the performance of low cost air pollution sensors, Faraday Discuss., 200, 1–15, 2017.
Snyder, E. G., Watkins, T. H., Solomon, P. A., Thoma, E. D., Williams, R. W., Hagler, G. S. W., Shelow, D., Hindin, D. A., Kilaru, V. J., and Preuss, P. W.: The Changing Paradigm of Air Pollution Monitoring, Environ. Sci. Technol., 47, 11369–11377, https://doi.org/10.1021/es4022602, 2013.
Sousan, S., Koehler, K., Hallett, L., and Peters, T. M.: Evaluation of the Alphasense optical particle counter (OPC-N2) and the Grimm portable aerosol spectrometer (PAS-1.108), Aerosol. Sci. Tech., 50, 1352–1365, 2016.
Wexler, A. S. and Clegg, S. L.: Atmospheric aerosol models for systems including the ions H+, , Na+, , , Cl−, Br−, and H2O, 107, J. Geophys. Res.-Atmos., 107, ACH 14-11–ACH 14-14, https://doi.org/10.1029/2001JD000451, 2002.
Yin, J., Harrison, R. M., Chen, Q., Rutter, A., and Schauer, J. J.: Source apportionment of fine particles at urban background and rural sites in the UK atmosphere, Atmos. Environ., 44, 841–851, https://doi.org/10.1016/j.atmosenv.2009.11.026, 2010.
Xu, W., Sun, Y., Wang, Q., Zhao, J., Wang, J., Ge, X., Xie, C., Zhou, W., Du, W., Li, J., Fu, P., Wang, Z., Worsnop, D. R., and Coe, H.: Changes in Aerosol Chemistry from 2014 to 2016 in Winter in Beijing: Insights from High Resolution Aerosol Mass Spectrometry, J. Geophys. Res., 124, 1132–1147, https://doi.org/10.1029/2018JD029245, 2019.