the Creative Commons Attribution 4.0 License.
the Creative Commons Attribution 4.0 License.
 | 15 Jul 2020
A new optical-based technique for real-time measurements of mineral dust concentration in PM10 using a virtual impactor
Jean Sciare
Iasonas Stavroulas
Spiros Bezantakos
Michael Pikridas
Florin Unga
Chrysanthos Savvides
Bojana Višić
Maja Remškar
Griša Močnik
Atmospheric mineral dust influences Earth's radiative budget, cloud formation, and lifetime; has adverse health effects; and affects air quality through the increase of regulatory PM10 concentrations, making its real-time quantification in the atmosphere of strategic importance. Only few near-real-time techniques can discriminate dust aerosol in PM10 samples and they are based on the dust chemical composition. The online determination of mineral dust using aerosol absorption photometers offers an interesting and competitive alternative but remains a difficult task to achieve. This is particularly challenging when dust is mixed with black carbon, which features a much higher mass absorption cross section. We build on previous work using filter photometers and present here for the first time a highly time-resolved online technique for quantification of mineral dust concentration by coupling a high-flow virtual impactor (VI) sampler that concentrates coarse particles with an aerosol absorption photometer (Aethalometer, model AE33). The absorption of concentrated dust particles is obtained by subtracting the absorption of the submicron (PM1) aerosol fraction from the absorption of the virtual impactor sample (VI-PM1 method). This real-time method for detecting desert dust was tested in the field for a period of 2 months (April and May 2016) at a regional background site of Cyprus, in the Eastern Mediterranean. Several intense desert mineral dust events were observed during the field campaign with dust concentration in PM10 up to 45 µg m−3. Mineral dust was present most of the time during the campaign with an average PM10 of about 8 µg m−3. Mineral dust absorption was most prominent at short wavelengths, yielding an average mass absorption cross section (MAC) of 0.24±0.01 m2 g−1 at 370 nm and an absorption Ångström exponent of 1.41±0.29. This MAC value can be used as a site-specific parameter for online determination of mineral dust concentration. The uncertainty of the proposed method is discussed by comparing and validating it with different methods.
- Article
(2435 KB) - Full-text XML
-
Supplement
(735 KB) - BibTeX
- EndNote


Atmospheric dust often dominates PM10 aerosol mass concentrations in many regions of the world and is the second most abundant aerosol source at a global scale just after sea spray. Its lifetime in the atmosphere is similar to carbonaceous aerosols (Boucher et al., 2013). Dust particles modify the Earth's radiation balance as they absorb and scatter light, affecting regional climate and precipitation regimes. The net radiative effect of atmospheric dust depends on the interplay between the heating of the atmosphere, due to the increased absorption of sunlight, and cooling due to scattering of sunlight back into space, leading to a direct radiative forcing for dust estimated around W m−2 (Myhre et al., 2013). Dust deposits on snow and ice increase the ion content in snow and snow water (Greilinger et al., 2018), and these exert a warming influence after deposition (Di Mauro et al., 2015). Desert dust impacts our health and economy. Saharan dust events have been shown to increase morbidity and have a negative influence on health, mainly through respiratory and cardiovascular effects (Middleton et al., 2008; Perez et al., 2012). The health effects of mineral dust are being considered in the context of regulation (WHO, 2018). Dust soiling of photovoltaics is a significant factor in energy production and decreases output by up to several percent (Mani and Pillai, 2010). Desert dust is a hazard for air and road transport, can cause electric fields detrimental for communication, and impacts water quality and plants, when deposited, resulting in great economic cost (Middleton, 2017), leading to the fictionalization due to its importance (Herbert, 1965).
Dust particles are often transported from the Sahara over the Mediterranean and southern Europe and can contribute significantly to mass concentration of particles smaller than 10 µm in diameter – PM10 (Rodriguez et al., 2001; Vrekoussis et al., 2005). Mineral dust is considered natural aerosol within the European Air Quality Directive (2008/50/EC) and, as such, can be subtracted from the daily (24 h) PM10 reported by EU member states, potentially reducing the number of days with PM10 exceedances (European Commission, 2011).
Daily time resolution of the described method has been validated with chemical composition and positive matrix factorization (PMF): the PM10 concentration above the daily regional background monthly 40th percentile has been shown to correlate well with aluminum (as a tracer of mineral dust) and the mineral dust factor from a PMF analysis (Viana et al., 2010). Methods with higher temporal resolution have the potential to bring considerably more detail and information to the analysis of dust in PM10. These methods capture the temporal variability dependent on the synoptic conditions more accurately; they allow for the discrimination of long-range-transported dust from the locally resuspended dust (traffic as an important example); they provide considerably more detail to constrain chemistry-transport models and can be used in real time to inform the public and stakeholders and therefore improve adaptation measures. The higher time resolution requires use of novel and innovative approaches and instrumentation.
There are several sampling devices which allow for hourly or subhourly sampling of ambient dust aerosols, such as the Streaker sampler, the DRUM (Davis Rotating-drum Unit for Monitoring) sampler (Bukowiecki et al., 2005; Visser et al., 2015), and the SEAS (Semi-continuous Elements in Aerosol Sampler) (Chen et al., 2016). Mass loadings of trace metals collected by these samplers can be analyzed with highly sensitive accelerator-based analytical techniques. However, a major drawback of these analyses is that they require a large commitment of analytical resources and time. Recent technical developments have resulted in more precise, accurate, and frequent measurement of ambient metal species, such as the XactTM 625 automated multi-metals analyzer (Fang et al., 2015; Jeong et al., 2016; Phillips-Smith et al., 2017; Cooper et al., 2010).
Dust scatters and absorbs light and its optical properties have been used in online measurements to derive the wavelength dependence of the single scattering albedo (SSA) (parameterized with the Ångström exponent) as the criterion to characterize Saharan dust events in the high Alpine region (Collaud Coen et al., 2004). The impact of Saharan dust events, showing increased absorption and scattering, was determined in the Eastern Mediterranean (Vrekoussis et al., 2005) and the Western Mediterranean (Pandolfi et al., 2011, 2014; Ealo et al., 2016). These measurements with high time resolution have shown that the optical properties can be used to identify dust events. Additionally, combining back-trajectory analysis and the SSA wavelength dependence, one can possibly detect local resuspension of dust, which impacts local air quality. However, these methods cannot determine the contribution of desert dust to PM10 concentrations in a quantitative manner.
Few studies have reported the potential of using dust aerosol absorption properties to infer their ambient concentrations in PM10. These efforts started by using Aethalometer instruments to determine the absorption coefficient attributed to iron compounds in dust, the determination of their mass absorption cross section, and the determination of black carbon and dust in the marine boundary layer (Fialho et al., 2005, 2006, 2014). The absorption of dust was due to iron compounds which were quantified using instrumental neutron activation analysis. Zhang et al. (2008) used thermal-optical reflection to measure the carbonaceous fraction and proton-induced X-ray emission for elemental analysis, and they again used iron as the dust tracer to separate the contributions of these two light-absorbing aerosol components. These publications systematically biased the absorption coefficients too high due to the assumption that the attenuation of light in the filter is due to non-filter-enhanced absorption, neglecting the enhancement due to the scattering in the filter matrix. Using different influences of iron-containing mineral dust and black carbon on SSA at different wavelengths and contrasting fine and coarse fractions, Derimian et al. (2008) quantified the iron concentrations in mineral dust. Lately, more sophisticated techniques using filter photometers were employed to determine the mineral dust absorption coefficients, mass absorption cross sections, and dust SSA. Caponi et al. (2017) used the multiwavelength absorbance analyzer to determine the absorption coefficients at multiple wavelengths and obtain the absorption Ångström exponents and mass absorption cross sections in a chamber study. The chamber study was also used to determine the filter enhancement in Aethalometer instruments challenged with dust (Di Biagio et al., 2017); then, they used these parameters to determine the optical properties as a function of iron content for different dust samples from all over the world (Di Biagio et al., 2019).
Additionally, quantitative determination of ambient concentration of mineral dust has been performed in the mixture of Saharan dust and carbonaceous matter in a wildfire plume (Schauer et al., 2016). These two may be internally mixed (Hand et al., 2010). The relationship between the columnar optical properties and the in situ ones during dusty and dust-free days due to the mixing of the dust with the dominant local air pollution is challenging to interpret (Valenzuela et al., 2015).
Previous work has used two-component models to infer dust concentrations sampling ambient air on a filter in filter absorption photometers. However, the determination of the optical absorption of pure mineral dust – when being externally mixed with black carbon – is more difficult because black carbon features a much higher mass absorption cross section, obscuring the smaller contribution of dust to absorption. Enriching the aerosol coarse fraction, and hence increasing the contribution of weakly absorbing dust, may represent an innovative alternative way to increase dust aerosol absorption relative to black carbon.
We present here an improvement in real-time detection of mineral dust in ambient PM by concentrating the coarse particle fraction with a high-volume virtual impactor system, similar to the one reported by Sioutas et al. (1994), and coupled with an aerosol absorption monitor (Aethalometer model AE33). We demonstrate its performance at a regional background site frequently impacted by Saharan dust.
First the enhanced absorption of coarse particles is determined from the difference of absorption measured by Aethalometer instruments with the virtual impactor and PM1 inlet, respectively. This parameter is divided by the enhancement factor calculated from the particle size distributions, yielding the absorption of coarse particles. The correlation between mineral dust absorption and reference mineral dust concentration provides us with the mass absorption cross section of the mineral dust, which is then used to determine mineral dust concentration with high time resolution.
2.1 Field campaign site description
Field validation took place at the Cyprus Atmospheric Observatory (CAO) between 1 April and 31 May 2016. This field campaign was organized as part of the European projects ACTRIS (Aerosols, Clouds, and Trace gases Research InfraStructure) and BACCHUS (Impact of Biogenic versus Anthropogenic emissions on Clouds and Climate: towards a Holistic UnderStanding). CAO is situated at a regional background site on the foothills of mount Troodos (35.04∘ N, 33.06∘ E; 535 m a.s.l.) in the center of Cyprus, an island located in the Eastern Mediterranean – Levantine basin. Lying in close proximity to the Middle East and North Africa (MENA) region, Cyprus is often influenced by air masses carrying mineral dust particles, originating from either the Saharan desert or the Middle East (Mamouri et al., 2013; Pikridas et al., 2018). During this field campaign, a large suite of in situ and remote-sensing instrumentation was deployed at ground level and onboard unmanned aerial vehicles in order to better characterize the influence of desert dust on ice nuclei (Schrod et al., 2017; Marinou et al., 2019), lidar retrieval of vertically resolved PM (Mamali et al., 2018), and performance of miniaturized light absorption sensors (Pikridas et al., 2019). More information on the climatology of air mass origin and PM at the Cyprus Atmospheric Observatory can be found in Pikridas et al. (2018).
2.2 Instrumentation
Real-time aerosol absorption of the dust-containing coarse fraction was determined by subtracting aerosol absorption of black carbon-containing submicron aerosols from the absorption of the concentrated coarse aerosols from the outlet of a virtual impactor (VI). A detailed description of this instrumental setup as well as complementary aerosol instruments is provided in the following.
2.2.1 Virtual impactor design
Based on a design similar to the one reported by Sioutas et al. (1994), our virtual impactor is sampling ambient air (TSP, total suspended particle) at a total flow rate of 100 L min−1. The major flow (Fin=98 L min−1) is carried out of the VI by a large capacity pump, while the coarse particles are inertially impacted (enriched) into the minor flow (Fout=2 L min−1) of the VI connected to the absorption photometer (Fig. 1). The enrichment of coarse particles in the minor flow is a function of the ratio of the two (major/minor) flows; its efficiency depends also on the design and manufacturing of the VI. For that reason, the VI was thoroughly tested and characterized in the lab in order to estimate the concentration efficiency (CE) of coarse particles as a function of aerodynamic particle size (using NIST polystyrene latex (PSL) spheres with nominal aerodynamic sizes from 0.7 to 10 µm) and two different flow rate ratios (19 and 50, respectively). The laboratory characterization of the VI is described in the Supplement Sect. S1, while the methodology used to reconstruct the size distribution of concentrated coarse particles (in the minor flow Fout) is presented in Sect. 3.1.

2.2.2 Aerosol absorption and light scattering coefficients
Three Aethalometer instruments (model AE33, Magee Scientific, USA) were used during the field campaign with different inlet setups: one sampling through a PM1 sharp-cut cyclone (BGI Inc., model SCC 1.197), one sampling through a custom-made total suspended particle (TSP) inlet, and a third one sampling through the VI described above (Sect. 2.2.1). The first two instruments (with PM1 and TSP) were sampling at a 5 L min−1 flow rate while the third was sampling through the VI at a 2 L min−1 flow rate. This flow rate of 2 L min−1 was selected so as to increase concentration efficiency (CE) of the VI and consequently increase the absorption signal of dust aerosols.
The AE33 Aethalometer measures attenuation of light by two samples collected at different flow rates. This results in two sample spots that feature different attenuation values. The measurement of light transport through the sample-laden filter is nonlinear and the measurements using two sample spots allow for the online compensation of the nonlinearity of the black carbon measurement (Drinovec et al., 2015). Given that the online filter loading compensation was not working efficiently for the AE33 coupled with the virtual impactor (see Sect. 3.3, below), the obtained data were compensated using fixed filter loading compensation parameter k values as described in the Sect. S2.
Absorption coefficient (babs) was calculated from the attenuation coefficient (batn) using the value of the multiple scattering parameter C of 2.57:
The calculation of the absorption coefficient was updated from Drinovec et al. (2015) following the WMO guideline (WMO, 2016): we updated the value of the filter multiple-scattering parameter C. The multiple-scattering parameter C in Drinovec et al. (2015) determined the AE33 filter C values relative to the value of the quartz filter, used in older AE31 instruments. This AE31 value was assumed to be 2.14 (Weingartner et al., 2003), but it was later recommended to use an AE31 value of 3.5 (WMO, 2016). The parameter C=1.57 used for the AE33 filter (Drinovec et al., 2015) was renormalized using the same factor resulting in a new value C=2.57. The mass absorption cross section, σair, for black carbon was adjusted in the inverse manner to obtain the same BC. The new mass absorption cross section for black carbon, σair, at 880 nm is now 4.74 m2 g−1 instead of 7.77 m2 g−1:
The Aethalometer instruments were intercompared in the laboratory before the campaign. The correlation slope for 1 min resolution data differed less than 4 % between the instruments with R2=0.996. The analysis of the actual uncertainty of Aethalometer measurements during the campaign is presented in the Sect. S3.
Total scattering and back-scattering coefficients (bscat & bbscat) of the ambient (TSP) aerosol were monitored continuously using a three-wavelength (450, 550, and 700 nm) integrated nephelometer (TSI Inc., model 3563; Anderson and Ogren, 1998). The nephelometer was sampling through a vertical, straight sampling line, coupled with a TSP inlet, a Nafion dryer, and measuring at 1 min time resolution. Calibration was conducted using CO2 as a high span gas, and zero air as a low span gas, prior to the field campaign. This nephelometer went through a successful intercomparison exercise at the European Center for Aerosol Calibration (ECAC-report-IN-2015-1-5, 2016) ahead of the instrument field deployment. Nevertheless, due to miscalibration of the green channel, 550 nm measurements were excluded from the analysis. Single scattering albedo (SSA) was calculated at 450 and 700 nm using the total scattering coefficient from nephelometer and absorption coefficient obtained from AE33 by linear interpolation of absorption coefficients from adjacent wavelength pairs. Single scattering albedo Ångström exponent (SSAAE) was calculated from SSA450 nm and SSA700 nm.
2.2.3 Other in situ aerosol instrumentation
Dried particle number size distributions (PNSDs) were measured using a TSI Inc. aerodynamic particle sizer (APS, model 3321). The APS measures PNSDs in the 0.5–20 µm aerodynamic diameter size range at a 5 min temporal resolution. The APS was sampling at a total flow rate of 5 L min−1 through a straight vertical sampling line, a Nafion dryer, and a TSP inlet, identical to the nephelometer. Aerosol mass concentration for fine (PM2.5) and coarse aerosols (PM10–2.5) was measured using a continuous dichotomous ambient particulate monitor (Thermo Scientific, 1405-DF TEOM-FDMS system) deployed at the Agia Marina Xyliatou EMEP station, co-located with CAO, at a 1 h temporal resolution (see more details in Pikridas et al., 2019).
2.3 Filter sampling and analysis
2.3.1 Filter sampling
Aerosol samples were collected during the field campaign at a flow rate of 2.3 m3 h−1 on pre-weighed filters (Pall Tissuquartz 2500 QAT-UP) using two autonomous filter samplers (Leckel SEQ 47/50) for determination of mass concentration (PM2.5 and PM10, respectively) with 24 h time resolution from midnight to midnight according to local standard time. Particle mass concentration (PM2.5 and PM10) on the filter substrates was determined gravimetrically before and after the sampling, under constant conditions dictated by protocol EN12341 with the use of an analytical balance with six digits of precision (Mettler Toledo, Model XP26C). According to that protocol, filters were subjected to 45 %–50 % relative humidity at 20±1 ∘C for 48 h.
2.3.2 Aerosol chemical mass closure
Filter samples were subsequently analyzed for major ions by ion chromatography (Thermo, Model ICS5000) following the protocol reported in Sciare et al. (2011) and complying with the European committee for standardization for the measurement of anions and cations in PM2.5 (EN 16913:2017, CEN, 2017a) and elemental carbon (EC) concentration and organic carbon (OC) concentration with a Sunset Laboratory instrument, the EUSAAR_2 thermo-optical protocol (Cavalli et al., 2010) and complying with the European committee for standardization (EN 16909:2017, CEN, 2017b). Quality of ion measurements is checked at the biannual intercomparison studies performed in the framework of the EMEP and WMO networks, while the quality of EC/OC measurements is confirmed on an annual basis in the framework of the ACTRIS network.
Estimation of dust in PM2.5 and PM10 was performed following the methodology proposed by Sciare et al. (2005) for a regional background (Crete island) located in the Eastern Mediterranean, assuming a constant calcium-to-dust ratio of 0.12. Reconstruction of PM from chemical analyses versus PM from gravimetry is reported in Sect. S6 and shows very good correlation (R2=0.99) and slope close to one, supporting the consistency and robustness of our calculation of mineral dust in PM.
2.3.3 Trace-metal analysis using inductively coupled plasma mass spectrometry (ICP-MS)
An acid microwave digestion procedure was applied to the PM10 filters followed by inductively coupled plasma mass spectrometry (ICP-MS, Thermo Electron X Series) to measure metal concentrations of Al, V, Cr, Mn, Fe, Ni, Cu, Zn, Cd, and Pb, following the procedure from Poulakis et al. (2015).
2.3.4 Scanning electron microscopy energy dispersive X-ray (SEM-EDX) analysis
Scanning electron microscopy measurements were performed at Jožef Stefan Institute using SEM model Supra 35 VP (Carl Zeiss, Germany). Measurements were performed on punches of PM10 filters that were attached to the sample holder through a double-sided carbon tape. The filters were previously sputter-coated with a thin gold film (with Au nanoparticle approximate size of 10 nm) using an SCD 005 cool sputter coater (BAL-TEC GmbH, Leica Microsystems, Wetzlar, Germany). The microscope was equipped with the energy dispersive spectroscopy module (EDX, Oxford INCA 400, Oxford Instruments Analytical, UK), which was operated at an accelerating voltage of 20 kV.
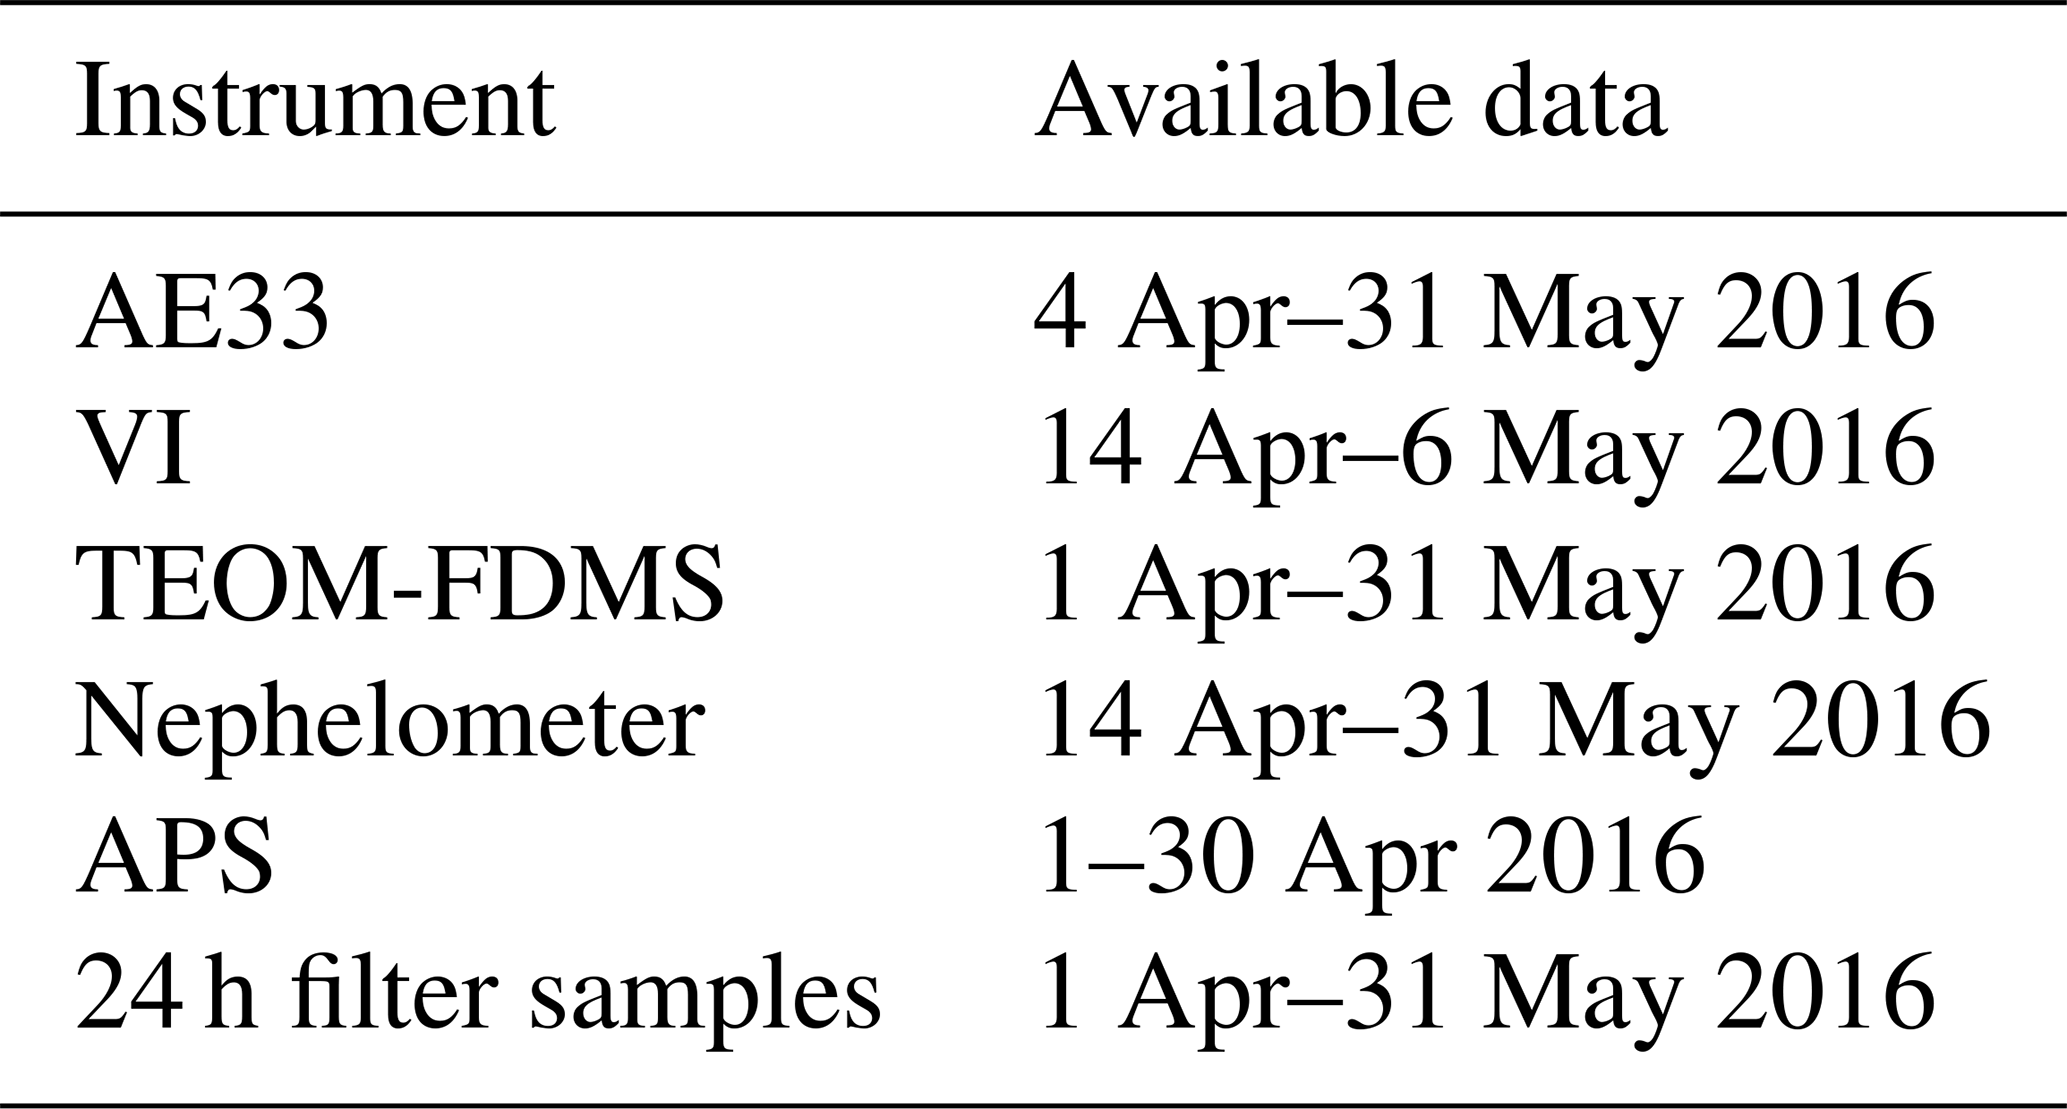
2.4 Data coverage
The measurement campaign took place in April and May 2016. Due to technical reasons, not all of the instruments were running throughout the campaign (Table 1). This limited some of the analysis to a shorter time periods with most of the data available between 14 April and 6 May.
Table 1Data coverage for online instrumentation and filter sampling.
The absorption of the fine aerosol fraction, dominated by black carbon, is usually much larger compared to the absorption in the coarse fraction, which contains mineral dust. In other words, babs,TSP is expected to be close to . Subtracting these two signals close in absolute values (but with large uncertainties), would result in a close-to-zero number associated with a large measurement error. The proposed VI method takes advantage of the concentration of coarse particles using a virtual impactor to enhance the coarse fraction in the sample and subtracts the absorption of the fine fraction (as the VI sample contains the same amount of fine fraction as an ambient sample). To calculate the absorption of the coarse fraction, the concentration efficiency of the virtual impactor must be taken into account.
The methodology to derive real-time concentration of dust in PM10 is presented as per the following: the robustness of the system (VI+AE33) is tested first in the field for a period of 1 month in Sect. 3.1. The enhancement factor (EF) downstream of the virtual impactor is calculated in Sect. 3.2. Real-time absorption of ambient dust aerosols is calculated in Sect. 3.3. It is corrected for (1) the influence of black carbon measured by a colocated AE33 Aethalometer equipped with PM1 inlet and (2) the enhancement factor of the VI. Real-time dust concentration of PM10 (Sect. 3.4) is then derived by dividing the absorption of dust aerosols calculated in Sect. 3.3 with a mass absorption cross section (MAC) for dust calculated using filter-based chemical analyses.
3.1 Field campaign overview
Optical, physical, and size-resolved chemical properties of ambient aerosols at the Cyprus Atmospheric Observatory were characterized continuously in April and May 2016 using several online and offline methods as illustrated in Fig. 2. During the campaign a total of four intense events (16 and 26 April, 1 and 15 May 2016) were detected with increased PM concentration of the coarse fraction concurrent with increase in the light scattering coefficient, but no correlation with black carbon concentration (Fig. 2). By combining light absorption and scattering measurements it is possible to identify the mineral dust events as the periods during which the single scattering albedo Ångström exponent (SSAAE) becomes negative, indicating the presence of mineral dust (Collaud Cohen et al., 2004).
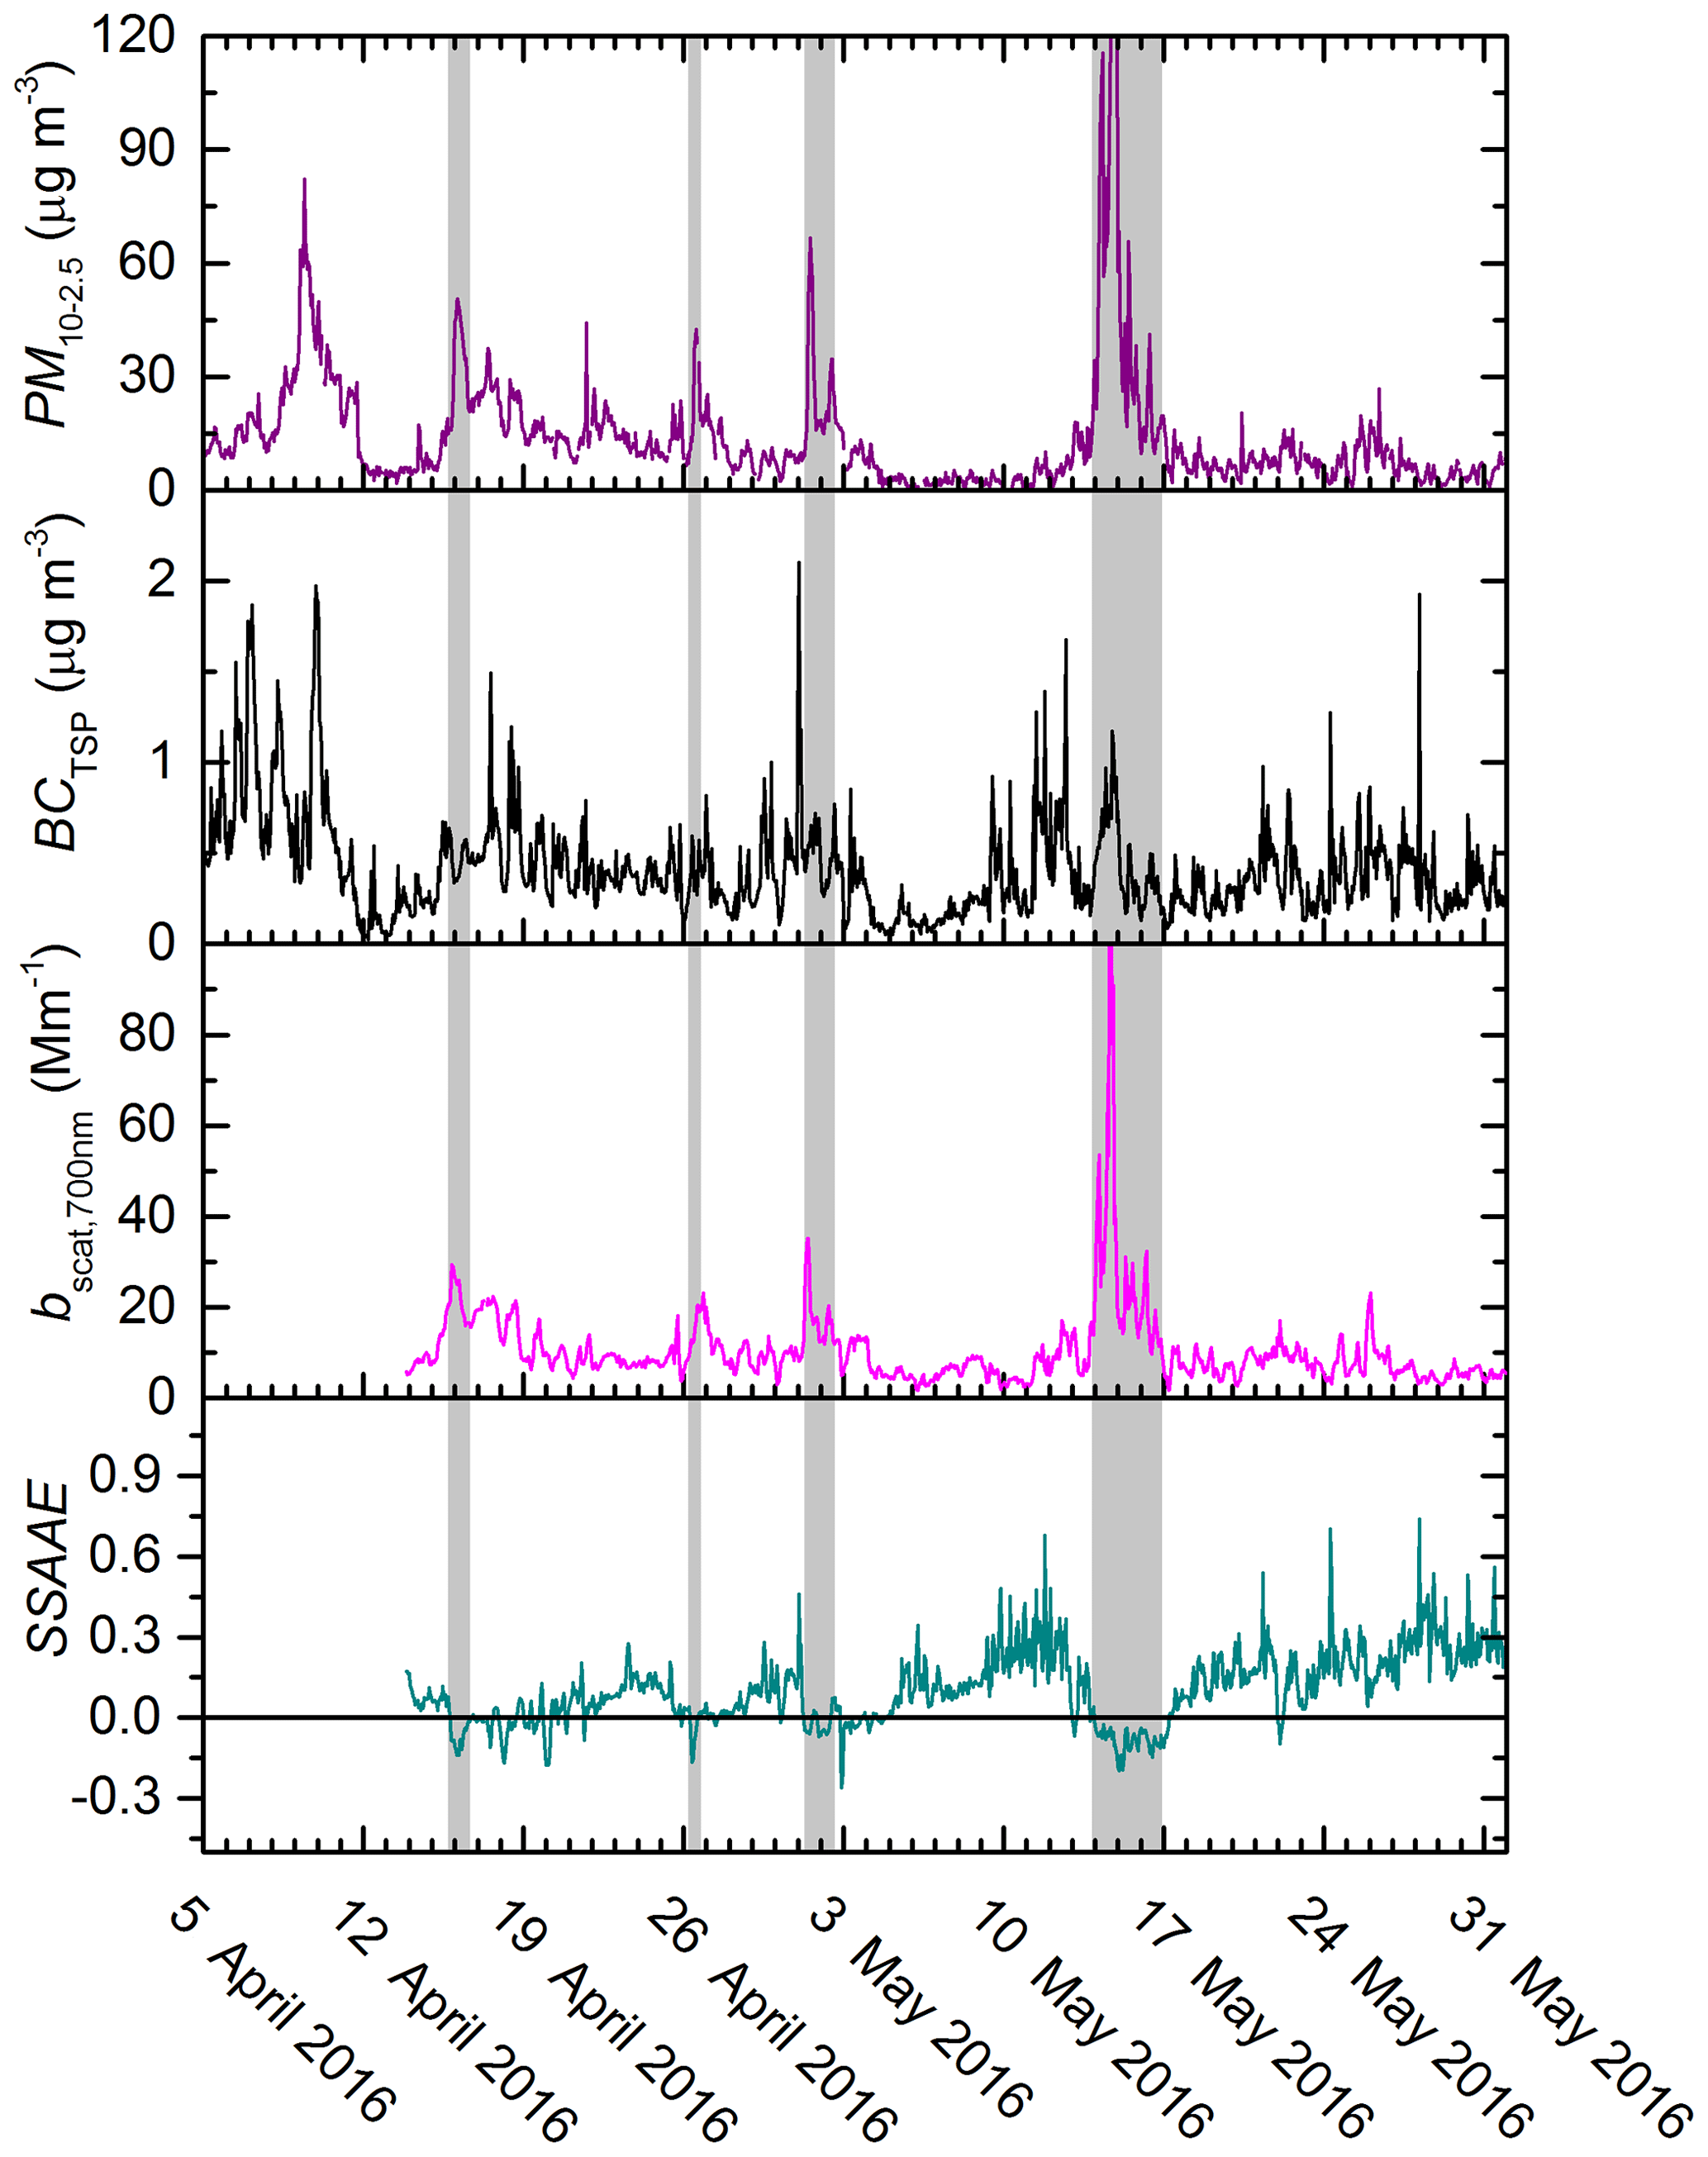
Figure 2Time series of the mass concentration of coarse particles (PM10–2.5) obtained by TEOM-FDMS, black carbon concentration (BC) for total suspended particles (TSP) obtained by AE33 Aethalometer, the light scattering coefficient at 700 nm obtained by nephelometer, and single scattering albedo Ångström exponent (SSAAE). The four periods with negative SSAAE during the campaign are shadowed.
Figure 3 reports continuous measurements of aerosol absorption during the field campaign for three different aerosol size fractions that were achieved using different inlets for three Aethalometer instruments, AE33, running in parallel: (1) a PM1, (2) a total suspended particle (TSP) counter, and (3) a virtual impactor (VI). During the first days of the campaign, the VI was operated manually for several periods of few hours in order to perform several tests related to the collection and light absorption detection of the coarse faction. The VI was set to be on continuously from 14 April until 6 May. Given the strong sensitivity of dust aerosol absorption in the UV range compared to black carbon (see Sect. 3.3), the 370 nm channel was selected here to compare aerosol absorption measurements from the three Aethalometer instruments.
As shown in Fig. 3 the absorption in TSP is closely related to the one of PM1. The differences are inside the measurement uncertainty of the Aethalometer instruments (Sect. S3). On the contrary, the absorption measured when the virtual impactor was ON shows very high values and very poor correlation with the other absorption measurements. During the periods when the VI pump was not operating, the aerosol absorption agrees well with the one using the TSP, showing that the enhancement of aerosol absorption is entirely related to the enhancement of the coarse fraction.
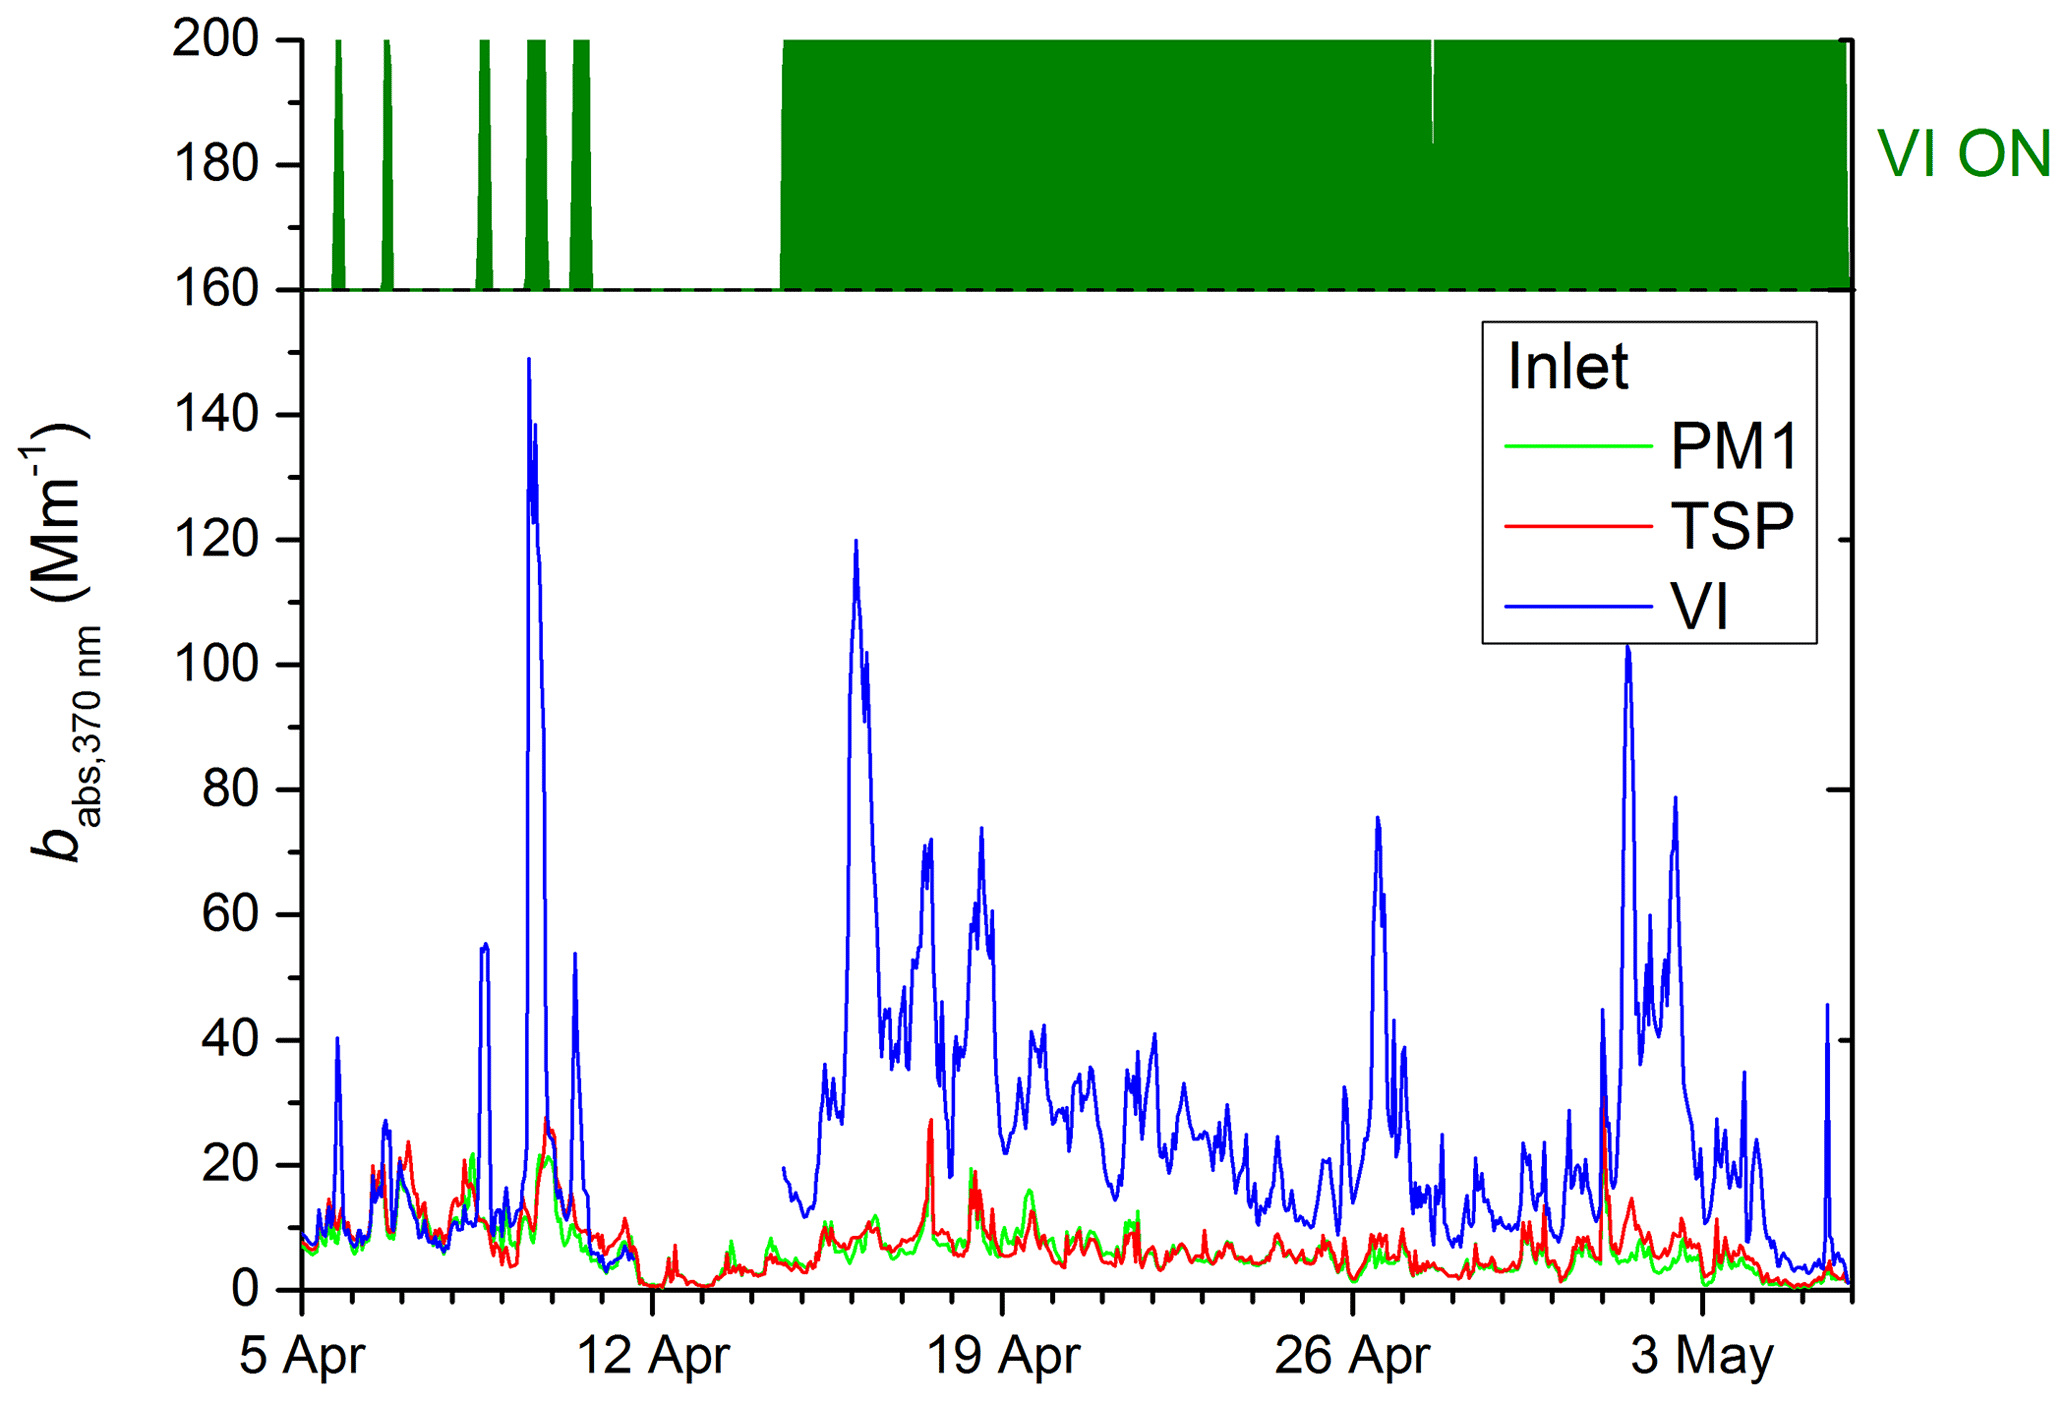
Figure 3Time series of the aerosol absorption coefficient at 370 nm for three Aethalometer instruments, AE33, running in parallel and equipped with different inlets: PM1, total suspended particle (TSP), and virtual impactor (VI). The periods when VI was operating are marked in green (VI ON).
3.2 Experimental characterization of the enhancement factor of coarse particles using the virtual impactor
The concentration efficiency of the virtual impactor depends on the aerodynamic particle diameter. For that reason, an aerodynamic particle sizer (APS, model 3321) was used both for analysis of aerodynamic particle size distribution during the campaign and virtual impactor characterization (Sect. S1). The maximum concentration efficiency (CE) was obtained for a Fin/Fout ratio of 50 (Table S1). Using the minimum sample flow of AE33 of 2 L min−1 and maximum flow of the virtual impactor pump, we obtained the maximum Fin∕Fout ratio of 50. As shown in Table S1 for a Fin∕Fout ratio of 50, the concentration efficiency of aerosols with aerodynamic diameters of 1 µm and below is close to unity. This result is expected for a virtual impactor whose operating principle is based on the concentration of large aerosols. Consequently, the black carbon fraction – mainly located in the submicron mode – is not enriched in the VI. On the contrary, dust aerosols – mostly located in the coarse aerosol fraction (above 1 µm diameter) – are concentrated efficiently by the virtual impactor (Fig. 4).

Figure 4Average aerodynamic volume size distribution spectrum measured by APS between 1 and 30 April 2016 (black line) and the predicted spectrum of aerosol concentrated using the virtual impactor (red line). Blue line represents the virtual impactor concentration efficiency measured in laboratory (Sect. S1). Shaded area denotes the particles larger than 10 µm.
The enhancement factor (EF) of the VI is defined as a multiplication factor that reflects the enrichment of the coarse fraction downstream of the VI. EF was determined experimentally during the field test using the aerodynamic particle sizer (APS) to derive both the volume concentration of the unperturbed sample (V) and volume concentration enhanced using a virtual impactor (VVI):
where D is the particle aerodynamic diameter, and CE is the concentration efficiency of the VI as characterized in Sect. S1. The enhancement factor is then calculated as
The average aerosol volume concentration size spectrum obtained during the campaign by the APS is presented in Fig. 4 (black line), along with the spectrum calculated for the virtual impactor (red line), using the concentration efficiency determined during the laboratory campaign (Table S1). For ambient aerosol, we observe a mode around 3.5 µm. Because the virtual impactor is more efficient towards larger particles, the ambient volume size distribution is not reproduced downstream of the VI, which shows a maximum around 9 µm. The collection efficiency of particles larger than 10 µm in the AE33 Aethalometer downstream of the VI is expected to be rather low due to losses in tubing and sample lines inside the Aethalometer. Overall, the uncertainty associated with the enhancement factor remains difficult to assess in the aerosol range close to 10 µm diameter, where particles are usually difficult to collect in a quantitative way.
The enhancement factor of the VI defined in Eq. (5) depends on the ambient aerosol volume size distribution measured by the APS, which changes over time. Figure 5 reports the temporal variation of EF during the field campaign at 5 min time resolution. There are time intervals with a stable EF of approximately 9 (11–13 April 2016); also, we can observe some peaks with EF as high as 16. For the PM10–PM1 particles we obtained a campaign average VI enhancement factor:
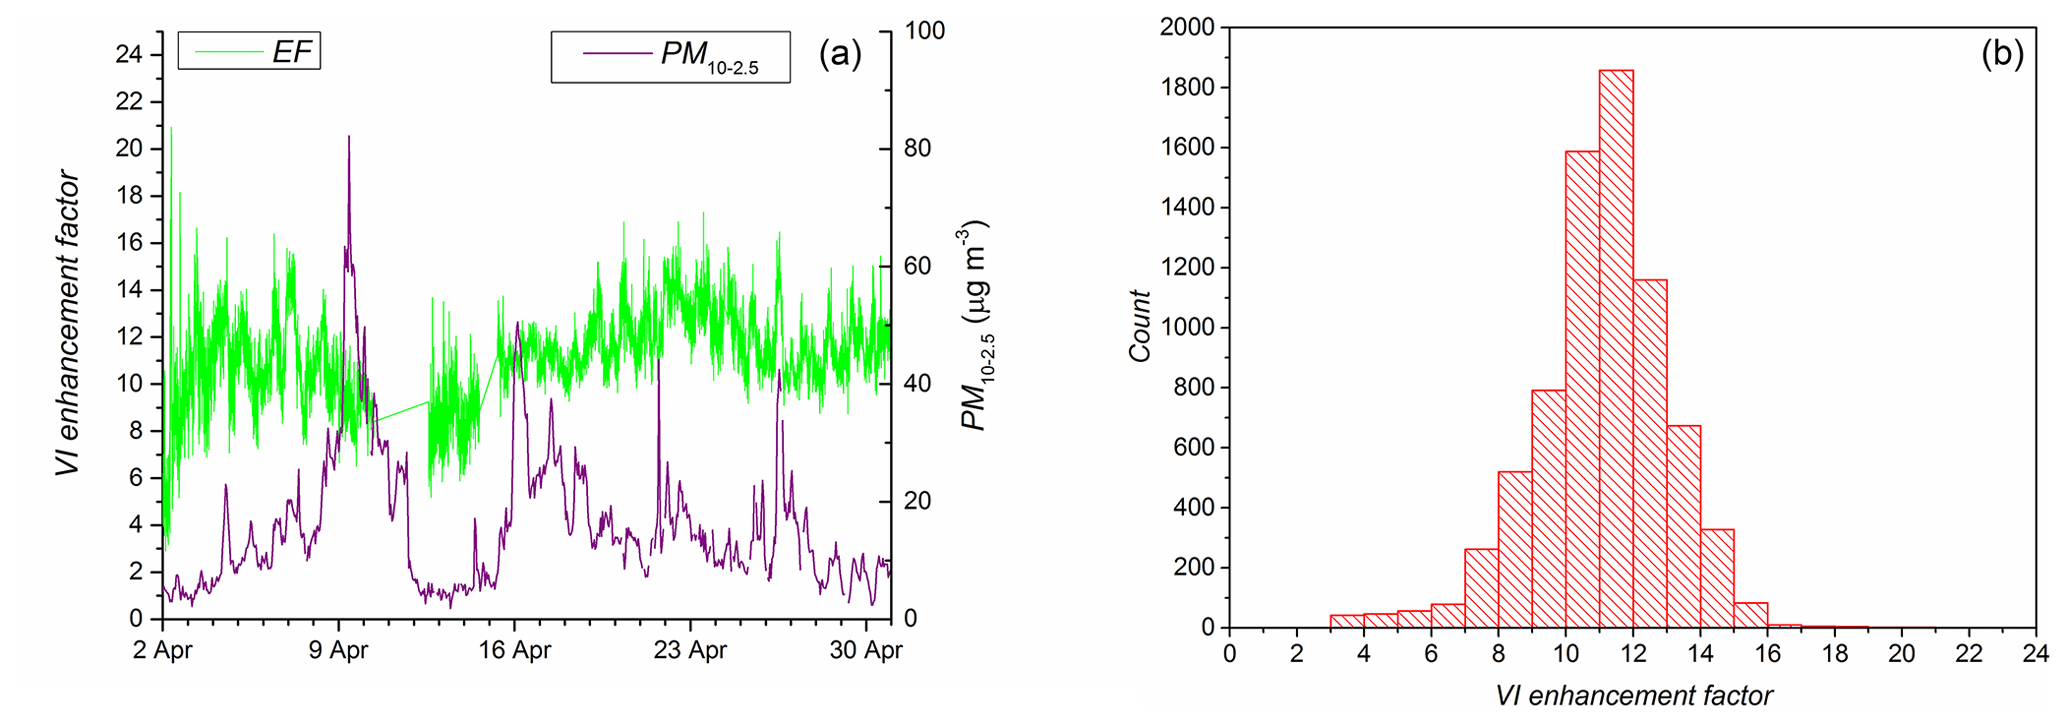
Figure 5Time series of the virtual impactor enhancement factor calculated from aerodynamic size distributions measured by APS (a) for the PM10 aerosol fraction. The enhancement factor frequency distribution is shown on the right (b).
3.3 Calculation of the absorption coefficient of coarse particles
The operating principle of the virtual impactor allows for concentration of the coarse particles while the fine particles remain present at the same amount as in the ambient air. To determine the absorption induced by ambient mineral dust, we need to subtract the fine particle absorption signal (dominated by black carbon) from the total virtual impactor absorption and normalize by the enhancement factor, following the equation
where , babs,VI, and represent absorption coefficients of dust in ambient conditions, aerosols downstream of the virtual impactor, and submicron aerosols, respectively. Because absorption of the PM1 fraction is dominated by black carbon, it is essential to compensate absorption data for the filter loading effect (Drinovec et al., 2017). If the compensation parameter is wrong by 0.005, this can result in over- or underestimation of babs by up to 60 % at 370 nm and by 25 % at 950 nm. For the Aethalometer with the PM1 inlet, the absorption data are sufficiently compensated by the built-in dual-spot algorithm. For the Aethalometer connected to the virtual impactor, the method was not able to measure accurately the loading effect due to the presence of coarse particles (Sect. S2). The main reason for this behavior lies in the fact that a single particle (deposited on one of the two spots) potentially causes significant absorption only in one of the two measurement spots. This requires an application of offline compensation using fixed values of the compensation parameters (Sect. S2).
The absorption induced by dust (Eq. 6) during the field campaign was calculated for each of the seven wavelengths of the AE33 Aethalometer and averaged, as shown in Fig. 6. The spectral dependence of absorption by mineral dust shows an increase at shorter wavelengths, significantly deviating from the Ångström exponent of 1. The best discrimination between the mineral dust particles and black carbon is achieved at the lowest wavelength of 370 nm, which is the wavelength that has been selected in our procedure to derive the absorption and the atmospheric concentration of mineral dust.
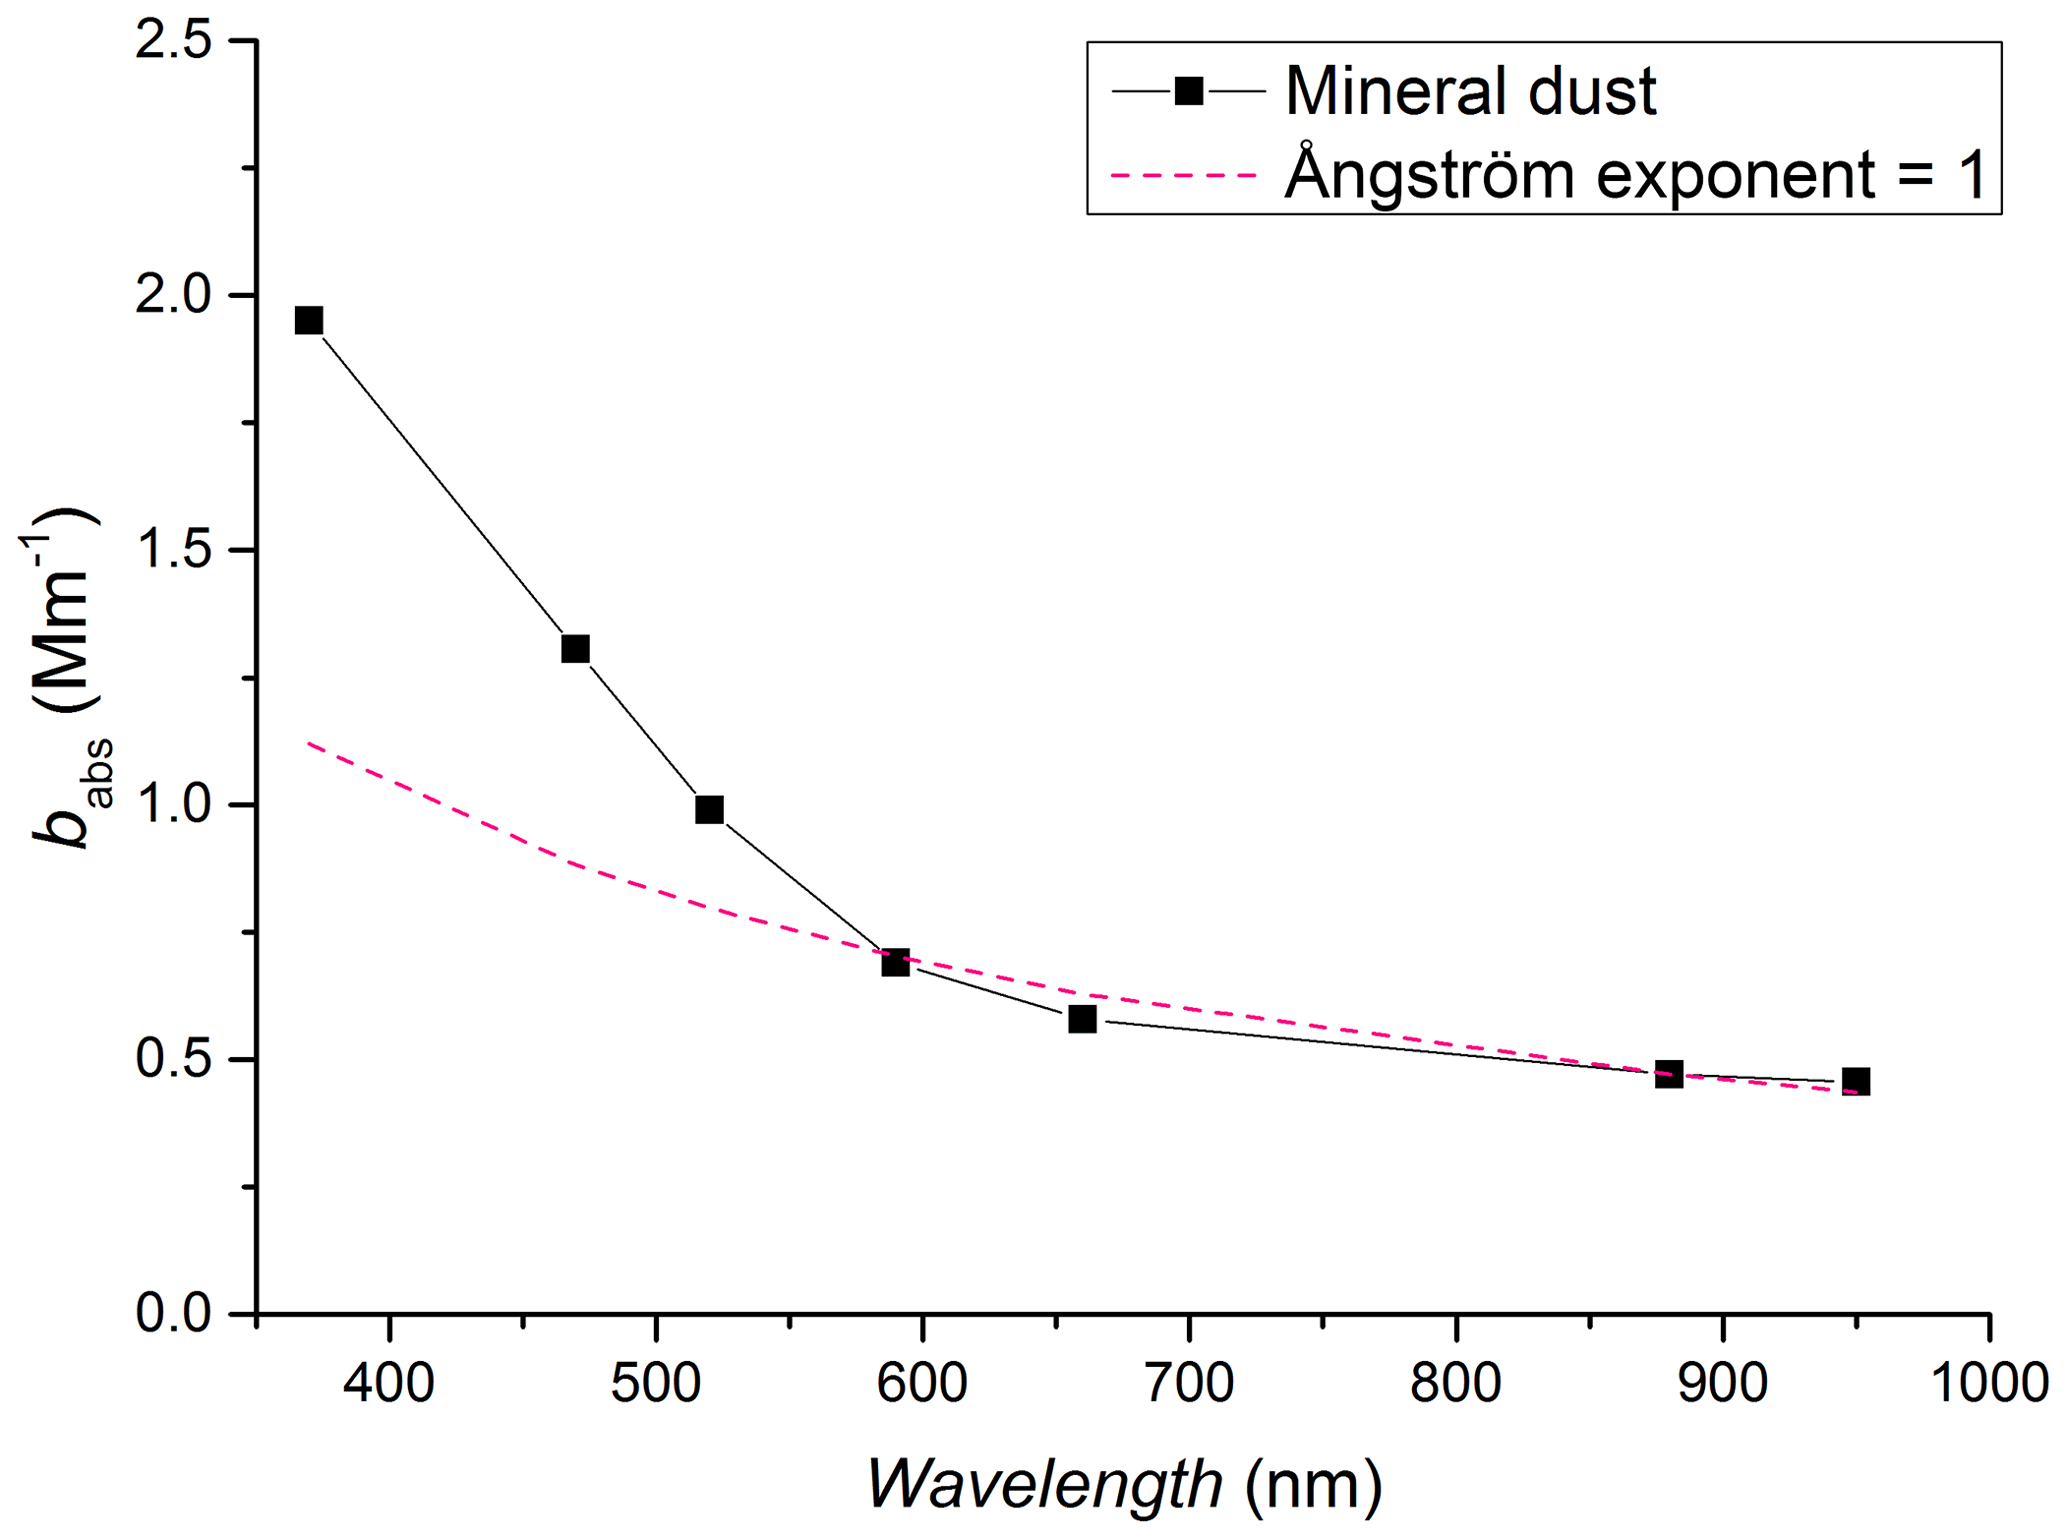
Figure 6Averaged absorption coefficient during the campaign for ambient dust (as calculated in Eq. 6) in the coarse fraction of aerosols as calculated from the difference of the absorption coefficients measured with a virtual impactor and a PM1 inlet and divided by the average enhancement factor (black line). The dotted red line shows a theoretical curve with Ångström exponent of 1, extrapolated from measurements at 880 nm.
Campaign averages show the mean value for absorption at 370 nm being higher for TSP compared to the PM1 inlet (Table 2). The absorption signal reported in this table for the AE33 behind the VI is more than a factor of 4 higher compared to the AE33 with the PM1 inlet, and this is due to the concentrated mineral dust in the coarse fraction. The average absorption coefficient of ambient dust as calculated using Eq. (6) was 2.0±2.1 Mm−1. Similarly to absorption, AAE shows a higher value for TSP compared to the PM1 inlet, as the mineral dust in the coarse fraction increases absorption in the UV and blue part of the spectrum. As expected there is high variability both for absorption and AAE during the campaign. The average difference between absorption for TSP and PM1 inlets is lower than expected from the (VI-PM1)/2 absorption value. This is a consequence of high measurement uncertainty of up to 18 % during the campaign (as estimated comparing Aethalometer instruments with different inlets, Sect. S3). Mineral dust absorption calculated from the difference between babs,370 nm for TSP and PM1 of 0.6 Mm−1 has an uncertainty of 2.1 Mm−1.
Table 2Average absorption coefficient at 370 nm, the absorption Ångström exponent (AAE), and their variations during the campaign (15 April and 6 May 2016). AAEs were calculated as averages of 1 h values for the wavelength pair of 370 and 950 nm.

3.4 Determination of mineral dust mass absorption cross section
For the determination of the mineral dust mass absorption cross section, we need to establish the mineral dust concentration in our samples. For this purpose, we performed mass closure on 24 h PM10 and PM2.5 filter samples (see Sect. S6). Mineral dust concentration was determined from calcium concentration, assuming 12 % Ca in mineral dust. Since the virtual impactor concentrates larger particles with higher efficiency (where we expect to have the largest contribution of mineral dust), we used the coarse fraction PM10–2.5 for the calibration (Fig. 7).
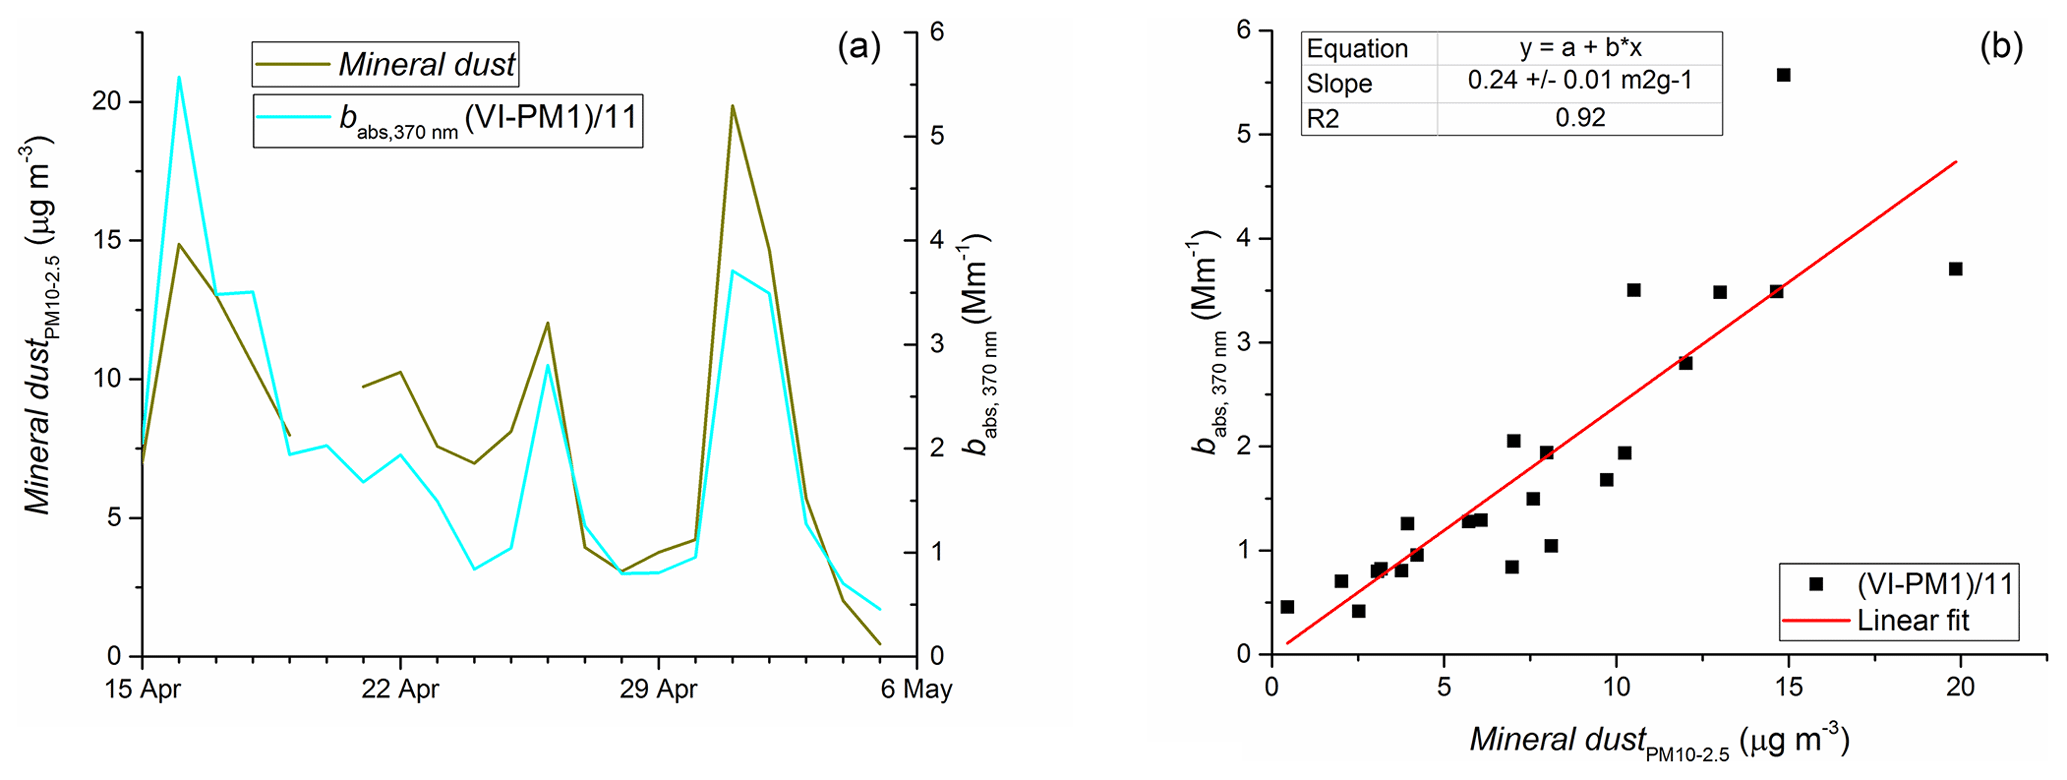
Figure 7The time series (a) and the correlation (b) between the absorption coefficient of coarse particles obtained using the VI-PM1 method versus mineral dust concentration in the coarse fraction.
The correlation between mineral dust absorption and filter measurements is very good, with an R2 of 0.92 showing good agreement between the methods. The mineral dust mass absorption cross section was obtained from the regression between mineral dust mass and the coarse fraction absorption coefficient at 370 nm:
This MAC value, obtained with 24 h time resolution, allows us to calculate mineral dust concentrations with the high time resolution of the absorption measurements:
The concentration of coarse particles and its composition show a huge variability during the campaign (Fig. 8a): the average mineral dust concentration was 8.1 µg m−3 with peaks up to 45 µg m−3. On average, mineral dust represented about one-half of the coarse fraction. The average BC was much lower at 0.39 µg m−3. Due to its much higher mass absorption cross section (MACBC,370 nm=11.2 m2 g−1; 47 times higher compared to mineral dust), the absorption of black carbon dominated the aerosol absorption in Cyprus during the campaign, and mineral dust absorption could not be detected directly. Using the virtual impactor allows us to concentrate the dust, measure its absorption coefficient, and determine its mass absorption cross section with a low uncertainty.
The Ångström exponent of the fine fraction oscillates between 1 and 1.5 (Fig. 8b). The lower values correspond to BC peaks, originating from local traffic and other efficient combustion sources. The higher values are a mixture of mineral dust and local pollution. The Ångström exponent of the coarse fraction reaches a value of 2.1 during intense mineral dust periods. After these events the AAE value drops slowly and reaches a value of 1.2 during the period with low presence of mineral dust (around 27 April–1 May 2019).

Figure 8Time series of BC in the fine fraction and mineral dust determined using the VI-PM1 method (a) and Ångström exponent for fine and coarse fraction of the aerosol (b).
Knowledge of the virtual impactor enhancement factor allowed us to calculate the average MAC for mineral dust during the Cyprus campaign. Reportedly, its value depends mostly on the absorption of iron oxides (Sokolik and Toon, 1999; Alfaro et al., 2004; Fialho et al., 2005, 2006, 2014; Caponi et al., 2017; Di Biagio et al., 2019). During the campaign we obtained 1.9 % iron in PM10. If we take into account that mineral dust represented about one-half of PM10 (Sect. S6), we get a good agreement with iron concentrations measured for mineral dust from the Middle East of 3.15 %–3.5 % (Linke et al., 2006), 3.8 %–5 % (Caponi et al., 2017) and Sahara of 3.6 %–6.6 % (Caponi at al., 2017). Surprisingly our MAC m2 g−1 is much larger compared to mineral dust from Saudi Arabia of 0.09 m2 g−1, Libya of 0.089 m2 g−1, and Algeria of 0.099 m2 g−1 (Caponi et al., 2017) or northeastern Africa of 0.099 m2 g−1 (Fialho et al., 2006). Higher MAC goes along with the low Ångström exponent value of 2.1 obtained for the fresh mineral dust reaching Cyprus. This value is lower than AAE of 2.8–4.1 reported for the Middle East (2.8–4.1) and Sahara (2.5–3.2) by Caponi et al. (2017) or 2.9–4 for northeastern Africa (Fialho et al., 2005, 2006). Differences in MAC values and the Ångström exponent can be an indicator that the coarse fraction of mineral dust is contaminated with black carbon, with the mixing occurring in or close to the source regions much earlier than mineral dust reached Cyprus. Simulations show that black carbon stuck to the mineral dust particles can severely change its optical properties, but the effect depends on the particle size (Scarnato et al., 2015). Because of the differences in dust mineral composition and contamination with BC, we expect MAC to be source region specific.
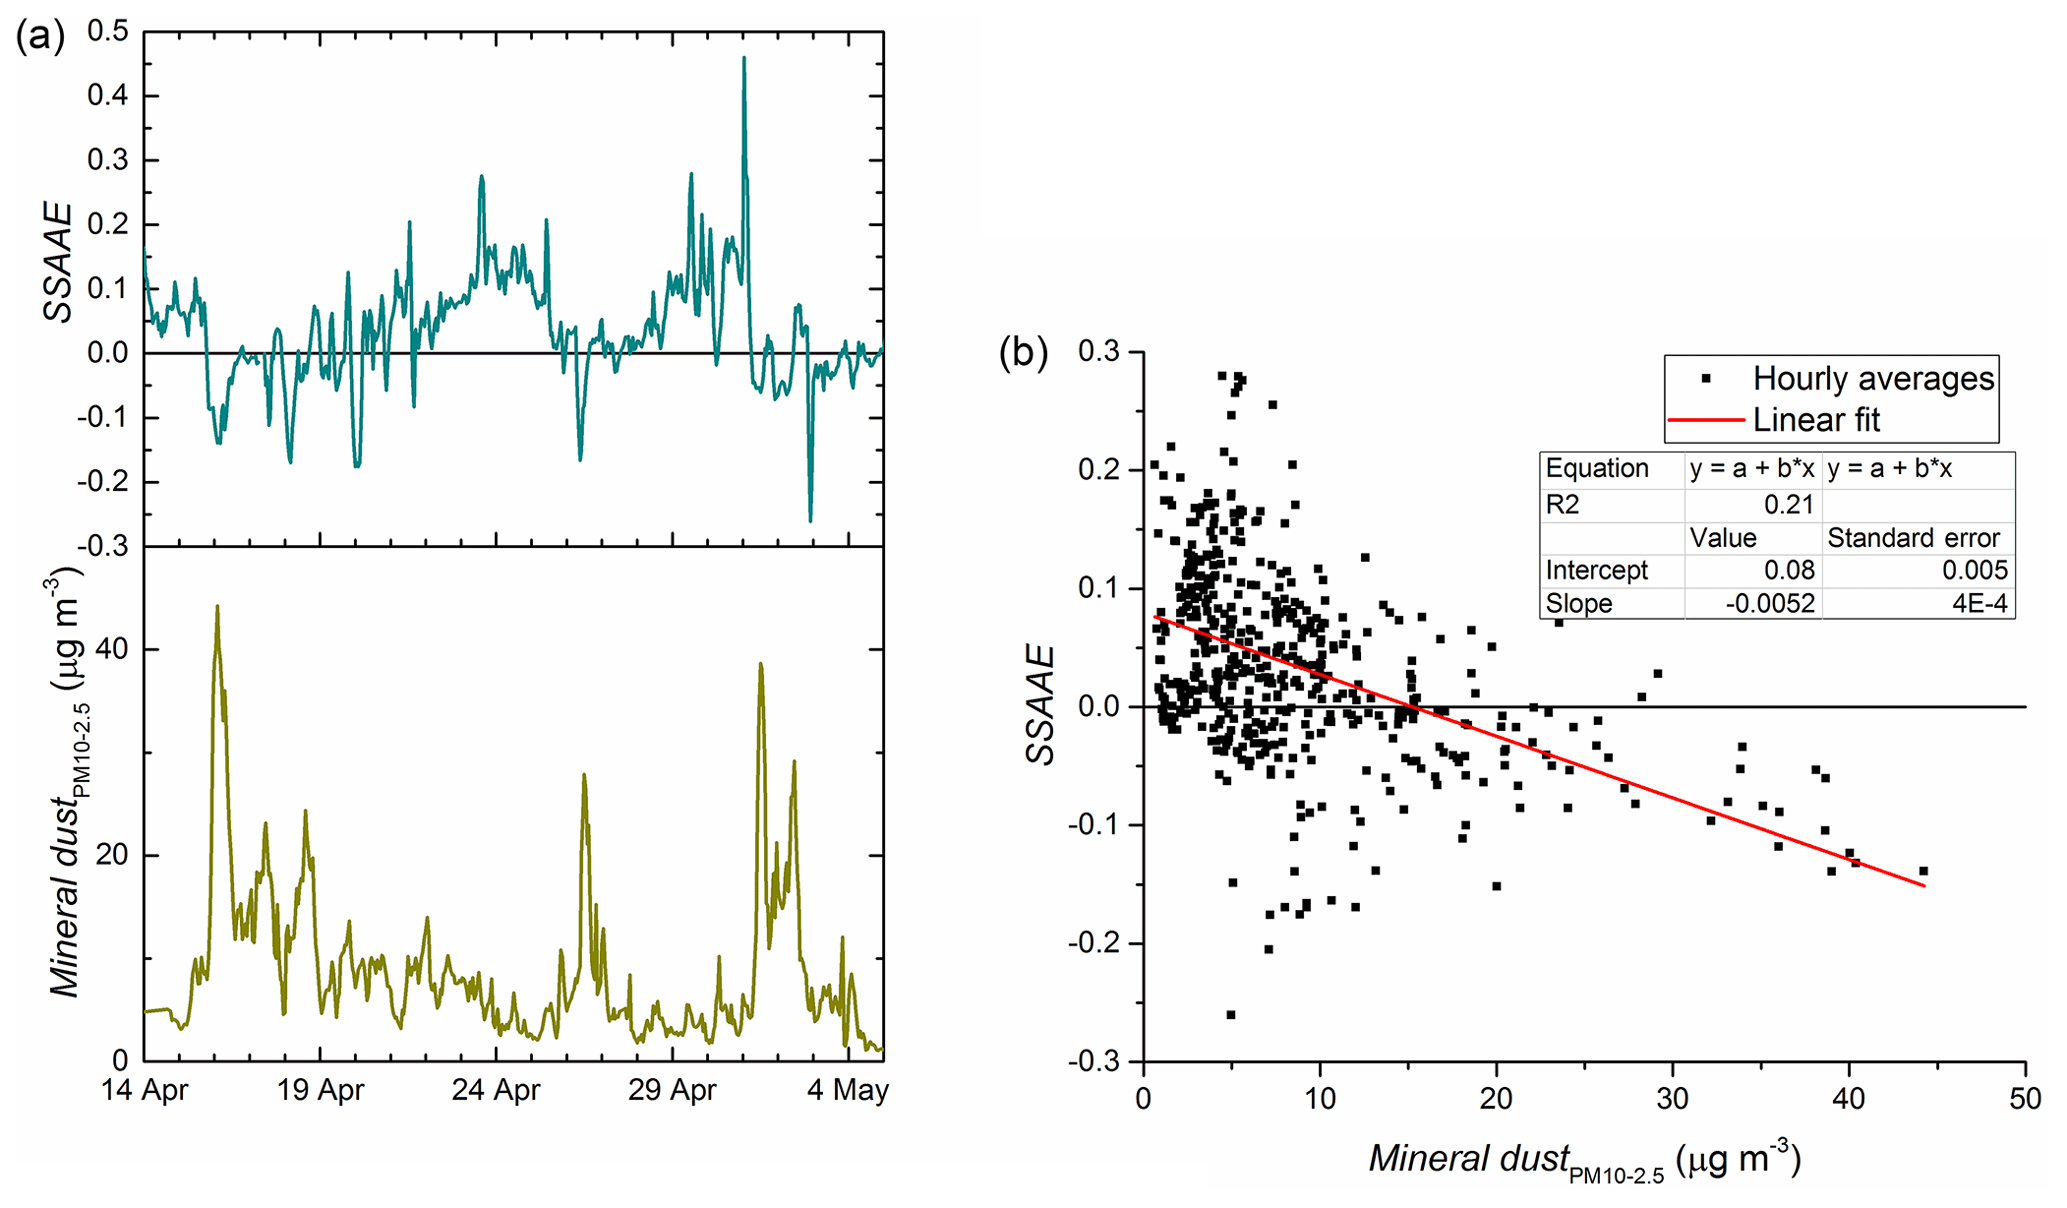
Figure 9Time series (a) and correlation (b) of the single scattering albedo Ångström exponent (SSAAE) and mineral dust concentration.
The determination of the mineral dust concentration was tested using the Collaud Coen et al. (2004) method for the qualitative determination of Saharan dust events. As expected the peaks in mineral dust concentration correspond to the periods featuring negative values of single scattering albedo Ångström exponent. It is shown (Fig. 9) that SSAAE becomes negative when the mineral concentration becomes larger than 15 µg m−3. The correlation between the mineral dust (determined from the chemical composition, notably calcium ions) and SSAAE is not perfect because of the contribution to scattering from other aerosol components (organics, sulfates, etc.), which amounts to about one-half of the aerosol mass and the absorption of organics. While the SSAAE method provides an identification of dust events, the VI-PM1 method allows for the quantitative determination of mineral dust – even at high black carbon concentrations in the fine fraction.
3.5 Uncertainty of the VI-PM1 method for the determination of mineral dust concentrations in PM10
The uncertainty in the determination of mineral dust concentration using the VI-PM1 method arises from the measurement uncertainties, variability of optical and chemical properties of mineral dust, and potential systematic biases of the method itself. Since the VI-PM1 method is calibrated using mineral dust in the coarse fraction only, 6 % lower values compared to total mineral dust in PM10 are reported. This bias can be avoided by using a correction factor.
The uncertainty of 10 % in the determination of the attenuation coefficient at 880 nm by the AE33 Aethalometer was reported (Drinovec et al., 2015). The performance of the Aethalometer instruments during this campaign was investigated by comparing signals from the instruments with TSP and PM1 inlets. The variation not related to the presence of mineral dust was used to determine measurement uncertainties of 11 % at 880 nm and 18 % at 370 nm (Sect. S3). The influence of the scattering material in the filter matrix, already included in the measurement uncertainty, could be reduced by explicitly taking into account the contribution of the scattering coefficient to the apparent absorption coefficient. However, this would require knowledge of the particle size distribution, as the cross-sensitivity to scattering of the filter-based measurement depends on the particle size (Drinovec et al., 2015). The value of the multiple scattering parameter C (Weingartner et al., 2003; Drinovec et al., 2015; WMO, 2016) does not add to the final uncertainty, because the same value is used for the calibration and the determination of mineral dust concentration, canceling out in the final calculation. However, the selection of the parameter C influences the calculation of mineral dust absorption coefficient and MAC. Similar to parameter C, the selected value of EF influences the determination of absorption coefficients and MAC but not the calculation of mineral dust concentration. It is the variation of EF, caused by the changes in the particle size distribution (Fig. 5a), which induces about 18 % uncertainty. This uncertainty can be reduced by using time-resolved measurements of EF or modifying the virtual impactor design to sharpen its response.
The main uncertainty comes from the variability of the chemical composition, mainly from the variability of the ratio of Fe∕Ca. This ratio is important, because MAC of mineral dust depends mostly on the iron content, whereas calcium was used as a reference method for determination of mineral dust concentration. The SEM-EDX analysis of single particle chemical composition shows large particle-to-particle variation inside the 24 h filter sample (Sect. S8). As expected the day-to-day variability of chemical composition is much lower as shown by ICP-MS analysis of trace metals (Sect. S7) – we obtained 40 % variability of the Fe∕Ca ratio both for the campaign period and for the yearlong dataset.
Desert dust may mix with BC emissions, and this is relevant especially at source regions, where concentrations are large enough for efficient coagulation between dust and BC to occur (Clarke et al., 2004; Rodriguez et al., 2011), with up to a third of carbonaceous particles internally mixed with mineral dust (Hand et al., 2010). The presence of BC on large dust particles will increase the MAC of the coarse fraction. The presence of BC on dust means, for these source regions, larger MAC values will be used to convert the optical measurements into dust concentrations. BC present on dust particles contributes negligibly to the mass, and the resulting increase in PM10 concentrations is due to dust mass only. The increased MAC of these coagulated particles is also the relevant climate parameter, as dust and BC need to be taken into account together when estimating the direct radiative efficiency of such particles. To reduce the uncertainty resulting from different MAC values, a mineral dust source location can be determined using back-trajectory analysis and an appropriate MAC should be used for each source location.
The combined uncertainty in the determination of mineral dust concentration during the Cyprus campaign assuming independent contributions is 44 %. The main reason for this uncertainty is the variation of the measured parameters used for the calibration of the method, essentially “assuming the worst-case scenario” of ever-changing aerosolized dust composition and resulting in an overestimation of the uncertainty. Alternatively, it is possible to derive the uncertainty from the measurement accuracy to compare daily mineral dust concentrations obtained using the VI-PM1 method with the reference values obtained using mass closure. This compares different methods measuring the same sample. Standard deviation of the ratio between predicted and reference mineral dust concentration was 29 %. This is a quantification of the scatter of the regression (R2=0.92) between the mineral dust concentrations determined using the two methods, as seen in Fig. 7.
We have demonstrated the potential of the method by showing its applicability at a regional background site in Agia Marina Xyliatou (Cyprus), frequently impacted by desert dust. We have shown how to determine the sample MAC and use it to quantify with high time resolution the contribution of desert dust to local PM10 concentrations.
Although black carbon contribution to the coarse mode is expected to be very small, internal mixture of dust and black carbon may potentially affect the MAC values determined by our methodology. On the other hand, it will not alter the capacity of our methodology to deliver high time resolution PM10 concentrations of dust. Instead, our measurement system will be calibrated with such aerosol mixture, and a site-specific MAC value will be derived, which takes into account this mixing state. Our approach is particularly relevant when using dust optical properties in climate models which need to account for real-world MAC values to determine the heating of the atmosphere due to these aerosols.
The variability of our calibration methodology, and therefore the range of experimentally determined MAC values, is currently investigated through long-term (multiyear) continuous observations at two regional background sites of the Mediterranean: Agia Marina Xyliatou (Cyprus) and Montseny (Spain). Such data will offer the unique opportunity to explore the factors controlling dust MAC values and in particular the influence of mineralogy of the different source regions (and especially their hematite and goethite contents) and the potential impact of complex mixtures of dust with black carbon.
The main conclusions are the following:
-
An online method (named VI-PM1) for the determination of mineral dust concentration in ambient air based on absorption of coarse particles was developed.
-
The VI-PM1 method was calibrated using mass closure performed on 24 h filter samples yielding the uncertainties of 29 % and 44 %, using measurement accuracy and variation of the measured parameters, respectively.
-
The VI-PM1 method allows for easy quantification of mineral dust in environments, where dust absorption is otherwise masked by absorption by black carbon in the fine aerosol fraction.
-
During the campaign, we observed a continuous presence of mineral dust with an average of 8 µg m−3 and several intense events with concentrations up to 45 µg m−3.
-
An average MACmineral_dust,370 nm of 0.24±0.01 m2 g−1 and Ångström exponent of 1.41±0.29 were obtained for mineral dust measured at a background location in Cyprus. This seems to indicate that the coarse fraction might be contaminated by black carbon.
Campaign data can be accessed at the data repository of The Cyprus Institute using the following link: https://mybox.cyi.ac.cy/public.php?service=files&t=624a471bf356165df49cad6cc747b051 (last access: 8 July 2020).
The supplement related to this article is available online at: https://doi.org/10.5194/amt-13-3799-2020-supplement.
LD, JS, and GM designed the study. LD, JS, IS, SB, MP, FU, and CS installed and operated the instrumentation for ambient and laboratory aerosol measurements. BV and MR analyzed the samples with the SEM. LD analyzed the ambient data. SB performed laboratory characterisation of virtual impactor concentration efficiency. LD and GM wrote the article with input from all authors. All authors helped with the replies to review.
Luka Drinovec and Griša Močnik were, at the time of the campaign but not during analysis and writing of the article, also employed by the manufacturer of the AE33 Aethalometer (Aerosol d.o.o., Slovenia). The methodology was protected with a patent application.
This article is part of the special issue “Dust aerosol measurements, modeling and multidisciplinary effects (AMT/ACP inter-journal SI)”. It is not associated with a conference.
This research has been supported by the Javna agencija za raziskovalno dejavnost RS (grant no. BI-FR/CEA/15-17-004, and programs P1-0099 and P1-0385), and the Ministrstvo za gospodarski razvoj in tehnologijo (DNAAP).
This paper was edited by Vassilis Amiridis and reviewed by three anonymous referees.
Alfaro, S. C., Lafon, S., Rajot, J. L., Formenti, P., Gaudichet, A., and Maillé, M.: Iron oxides and light absorption by pure desert dust: An experimental study, J. Geophys. Res., 109, D08208, https://doi.org/10.1029/2003JD004374, 2004.
Anderson, T. L. and Ogren, J. A.: Determining Aerosol Radiative Properties Using the TSI 3563 Integrating Nephelometer, Aerosol Sci. Tech., 29, 57–69, https://doi.org/10.1080/02786829808965551, 1998.
Boucher, O., Randall, D., Artaxo, P., Bretherton, C., Feingold, G., Forster, P., Kerminen, V.-M., Kondo, Y., Liao, H., Lohmann, U., Rasch, P., Satheesh, S. K., Sherwood, S., Stevens, B., and Zhang, X. Y.: Clouds and Aerosols, in: Climate Change 2013: The Physical Science Basis. Contribution of Working Group I to the Fifth Assessment Report of the Intergovernmental Panel on Climate Change, edited by: Stocker, T. F., Qin, D., Plattner, G.-K., Tignor, M., Allen, S. K., Boschung, J., Nauels, A., Xia, Y., Bex, V., and Midgley, P. M., Cambridge University Press, Cambridge, United Kingdom and New York, NY, USA. 2013.
Bukowiecki, N., Hill, M., Gehrig, R., Zwicky, C. N., Lienemann, P., Hegedüs, F., Falkenberg, G., Weingartner, E., and Baltensperger, U.: Trace metals in ambient air: Hourly size-segregated mass concentrations determined by synchrotron-XRF, Environ. Sci. Technol., 39, 5754–5762, https://doi.org/10.1021/es048089m, 2005.
Caponi, L., Formenti, P., Massabó, D., Di Biagio, C., Cazaunau, M., Pangui, E., Chevaillier, S., Landrot, G., Andreae, M. O., Kandler, K., Piketh, S., Saeed, T., Seibert, D., Williams, E., Balkanski, Y., Prati, P., and Doussin, J.-F.: Spectral- and size-resolved mass absorption efficiency of mineral dust aerosols in the shortwave spectrum: a simulation chamber study, Atmos. Chem. Phys., 17, 7175–7191, https://doi.org/10.5194/acp-17-7175-2017, 2017.
Cavalli, F., Viana, M., Yttri, K. E., Genberg, J., and Putaud, J.-P.: Toward a standardised thermal-optical protocol for measuring atmospheric organic and elemental carbon: the EUSAAR protocol, Atmos. Meas. Tech., 3, 79–89, https://doi.org/10.5194/amt-3-79-2010, 2010.
Chen, B., Stein, A. F., Castell, N., Gonzalez-Castanedo, Y., Sanchez de la Campa, A. M., and de la Rosa, J. D.: Modeling and evaluation of urban pollution events of atmospheric heavy metals from a large Cu-smelter, Sci. Total Environ., 539, 17–25, https://doi.org/10.1016/j.scitotenv.2015.08.117, 2016.
Clarke, A. D., Shinozuka, Y., Kapustin, V.N., Howell, S., Huebert, B., Doherty, S., Anderson, T., Covert, D., Anderson, J., Hua, X., Moore II, K. G., McNaughton, C., Carmichael, G., and Weber, R.: Size distributions and mixtures of dust and black carbon aerosol in Asian outflow: Physiochemistry and optical properties, J. Geophys. Res., 109, D15S09, https://doi.org/10.1029/2003JD004378, 2004.
Collaud Coen, M., Weingartner, E., Schaub, D., Hueglin, C., Corrigan, C., Henning, S., Schwikowski, M., and Baltensperger, U.: Saharan dust events at the Jungfraujoch: detection by wavelength dependence of the single scattering albedo and first climatology analysis, Atmos. Chem. Phys., 4, 2465–2480, https://doi.org/10.5194/acp-4-2465-2004, 2004.
Cooper, J. A., Petterson, K., Geiger, A., Siemers, A., and Rupprecht, B.: Guide for developing a multi-metals, fenceline monitoring plan for fugitive emissions using X-ray based monitors, Cooper Environmental Services, Portland, Oregon, 1–42, 2010.
Derimian, Y., Karnieli, A., Kaufman, Y. J., Andreae, M. O., Andreae, T. W., Dubovik, O., Maenhaut, W., and Koren, I.: The role of iron and black carbon in aerosol light absorption, Atmos. Chem. Phys., 8, 3623–3637, https://doi.org/10.5194/acp-8-3623-2008, 2008.
Di Biagio, C., Formenti, P., Cazaunau, M., Pangui, E., Marchand, N., and Doussin, J.-F.: Aethalometer multiple scattering correction Cref for mineral dust aerosols, Atmos. Meas. Tech., 10, 2923–2939, https://doi.org/10.5194/amt-10-2923-2017, 2017.
Di Biagio, C., Formenti, P., Balkanski, Y., Caponi, L., Cazaunau, M., Pangui, E., Journet, E., Nowak, S., Andreae, M. O., Kandler, K., Saeed, T., Piketh, S., Seibert, D., Williams, E., and Doussin, J.-F.: Complex refractive indices and single-scattering albedo of global dust aerosols in the shortwave spectrum and relationship to size and iron content, Atmos. Chem. Phys., 19, 15503–15531, https://doi.org/10.5194/acp-19-15503-2019, 2019.
Di Mauro, B., Fava, F., Ferrero, L., Garzonio, R., Baccolo, G., Delmonte, B., and Colombo, R.: Mineral dust impact on snow radiative properties in the European Alps combining ground, UAV, and satellite observations, J. Geophys. Res.-Atmos., 120, 6080–6097, https://doi.org/10.1002/2015JD023287, 2015.
Drinovec, L., Močnik, G., Zotter, P., Prévôt, A. S. H., Ruckstuhl, C., Coz, E., Rupakheti, M., Sciare, J., Müller, T., Wiedensohler, A., and Hansen, A. D. A.: The ”dual-spot” Aethalometer: an improved measurement of aerosol black carbon with real-time loading compensation, Atmos. Meas. Tech., 8, 1965–1979, https://doi.org/10.5194/amt-8-1965-2015, 2015.
Drinovec, L., Gregorič, A., Zotter, P., Wolf, R., Bruns, E. A., Prévôt, A. S. H., Petit, J.-E., Favez, O., Sciare, J., Arnold, I. J., Chakrabarty, R. K., Moosmüller, H., Filep, A., and Močnik, G.: The filter-loading effect by ambient aerosols in filter absorption photometers depends on the coating of the sampled particles, Atmos. Meas. Tech., 10, 1043–1059, https://doi.org/10.5194/amt-10-1043-2017, 2017.
Ealo, M., Alastuey, A., Ripoll, A., Pérez, N., Minguillón, M. C., Querol, X., and Pandolfi, M.: Detection of Saharan dust and biomass burning events using near-real-time intensive aerosol optical properties in the north-western Mediterranean, Atmos. Chem. Phys., 16, 12567–12586, https://doi.org/10.5194/acp-16-12567-2016, 2016.
ECAC-report-IN-2015-1-5: Intercomparison of Integrating Nephelometers and Extinction monitors, available at: https://www.actris-ecac.eu/files/ECAC-report-IN-2015-1-5_the-cyprus-institute_TSI3563-1082.pdf (last access: 17 June 2019), 2016.
European Commission: Establishing guidelines for demonstration and subtraction of exceedances attributable to natural sources under the Directive 2008/50/EC on ambient air quality and cleaner air for Europe, SEC(2011) 208 final, Brussels, 15 February 2011, available at: http://ec.europa.eu/environment/air/quality/legislation/pdf/sec_2011_0208.pdf (last access: 13 May 2019), 2011.
European Committee for Standardisation (CEN): EN 16913:2017 Ambient Air – Standard Method for the Measurement of , , Cl−, , Na+, K+, , in PM2.5 as deposited on filters, CEN, Brussels, 2017a.
European Committee for Standardisation (CEN): EN 16909:2017 Ambient air – Measurement of elemental carbon (EC) and organic carbon (OC) collected on filters, CEN, Brussels, 2017b.
Fang, G. C., Kuo, Y. C., and Zhuang, Y. J.: Source Analysis of Trace Metal Pollution Received at Harbor, Airport and Farmland Locations in Central Taiwan, Aerosol Air Qual. Res, 15, 1774–1786, https://https://doi.org/10.4209/aaqr.2014.12.0314, 2015.
Fialho, P., Hansen, A. D. A., and Honrath, R. E.: Absorption coefficients by aerosols in remote areas: a new approach to decouple dust and black carbon absorption coefficients using seven-wavelength Aethalometer data, J. Aerosol Sci., 36, 267–282, https://doi.org/10.1016/j.jaerosci.2004.09.004, 2005.
Fialho, P., Freitas, M. C., Barata, F., Vieira, B., Hansen, A. D. A., and Honrath, R. E.: The Aethalometer calibration and determination of iron concentration in dust aerosols, J. Aerosol Sci., 37, 1497–1506, https://doi.org/10.1016/j.jaerosci.2006.03.002, 2006.
Fialho, P., Cerqueira, M., Pio, C., Cardoso, J., Nunes, T., Custódio, D., Alves, C., Almeida, S. M., Almeida-Silva, M., Reis, M., and Rocha, F.: The application of a multi-wavelength Aethalometer to estimate iron dust and black carbon concentrations in the marine boundary layer of Cape Verde, Atmos. Environ., 97, 136–143, https://doi.org/10.1016/j.atmosenv.2014.08.008, 2014.
Greilinger, M., Schauer, G., Baumann-Stanzer, K., Skomorowski, P., Schöner, W., and Kasper-Giebl, A.: Contribution of Saharan Dust to Ion Deposition Loads of High Alpine Snow Packs in Austria (1987–2017), Front. Earth Sci., 6, 1–14, https://doi.org/10.3389/feart.2018.00126, 2018.
Hand, V. L., Capes, G., Vaughan, D. J., Formenti, P., Haywood, J. M., and Coe, H.: Evidence of internal mixing of African dust and biomass burning particles by individual particle analysis using electron beam techniques, J. Geophys. Res., 115, D13301, https://doi.org/10.1029/2009JD012938, 2010.
Herbert F.: Dune, Chilton books, Philadelphia, 1965.
Jeong, C.-H., Wang, J. M., and Evans, G. J.: Source Apportionment of Urban Particulate Matter using Hourly Resolved Trace Metals, Organics, and Inorganic Aerosol Components, Atmos. Chem. Phys. Discuss., https://doi.org/10.5194/acp-2016-189, 2016.
Linke, C., Möhler, O., Veres, A., Mohácsi, Á., Bozóki, Z., Szabó, G., and Schnaiter, M.: Optical properties and mineralogical composition of different Saharan mineral dust samples: a laboratory study, Atmos. Chem. Phys., 6, 3315–3323, https://doi.org/10.5194/acp-6-3315-2006, 2006.
Mamali, D., Marinou, E., Sciare, J., Pikridas, M., Kokkalis, P., Kottas, M., Binietoglou, I., Tsekeri, A., Keleshis, C., Engelmann, R., Baars, H., Ansmann, A., Amiridis, V., Russchenberg, H., and Biskos, G.: Vertical profiles of aerosol mass concentration derived by unmanned airborne in situ and remote sensing instruments during dust events, Atmos. Meas. Tech., 11, 2897–2910, https://doi.org/10.5194/amt-11-2897-2018, 2018.
Mamouri, R. E., Ansmann, A., Nisantzi, A., Kokkalis, P., Schwarz, A., and Hadjimitsis, D.: Low Arabian extinctionto-backscatter ratio, Geophys. Res. Lett., 40, 4762–4766, https://doi.org/10.1002/grl.50898, 2013.
Mani, M. and Pillai, R.: Impact of dust on solar photovoltaic (PV) performance: Research status, challenges and recommendations, Renew. Sust. Energ. Rev., 14, 3124–3131, https://doi.org/10.1016/j.rser.2010.07.065, 2010.
Marinou, E., Tesche, M., Nenes, A., Ansmann, A., Schrod, J., Mamali, D., Tsekeri, A., Pikridas, M., Baars, H., Engelmann, R., Voudouri, K.-A., Solomos, S., Sciare, J., Groß, S., Ewald, F., and Amiridis, V.: Retrieval of ice-nucleating particle concentrations from lidar observations and comparison with UAV in situ measurements, Atmos. Chem. Phys., 19, 11315–11342, https://doi.org/10.5194/acp-19-11315-2019, 2019.
Middleton, N., Yiallouros, P., Kleanthous, S., Kolokotroni, O., Schwartz, J., Dockery, D. W., Demokritou, P., and Koutrakis, P.: A 10-year time-series analysis of respiratory and cardiovascular morbidity in Nicosia, Cyprus: the effect of short-term changes in air pollution and dust storms, Environ. Health, 7, 39, https://doi.org/10.1186/1476-069X-7-39, 2008.
Middleton, N. J.: Desert dust hazards: A global review, Aeolian Res., 24, 56–63, https://doi.org/10.1016/j.aeolia.2016.12.001, 2017.
Myhre, G., Shindell, D., Bréon, F.-M., Collins, W., Fuglestvedt, J., Huang, J., Koch, D., Lamarque, J.-F., Lee, D., Mendoza, B., Nakajima, T., Robock, A., Stephens, G., Takemura, T., and Zhang, H.: Anthropogenic and Natural Radiative Forcing, in: Climate Change 2013: The Physical Science Basis. Contribution of Working Group I to the Fifth Assessment Report of the Intergovernmental Panel on Climate Change, edited by: Stocker, T. F., Qin, D., Plattner, G.-K., Tignor, M., Allen, S. K., Boschung, J., Nauels, A., Xia, Y., Bex, V., and Midgley, P. M., Cambridge University Press, Cambridge, United Kingdom and New York, NY, USA, 2013.
Pandolfi, M., Cusack, M., Alastuey, A., and Querol, X.: Variability of aerosol optical properties in the Western Mediterranean Basin, Atmos. Chem. Phys., 11, 8189–8203, https://doi.org/10.5194/acp-11-8189-2011, 2011.
Pandolfi, M., Ripoll, A., Querol, X., and Alastuey, A.: Climatology of aerosol optical properties and black carbon mass absorption cross section at a remote high-altitude site in the western Mediterranean Basin, Atmos. Chem. Phys., 14, 6443–6460, https://doi.org/10.5194/acp-14-6443-2014, 2014.
Perez, L., Tobías, A., Querol, X., Pey, J., Alastuey, A., Díaz, J., and Sunyer, J.: Saharan dust, particulate matter and cause-specific mortality: A case–crossover study in Barcelona (Spain), Environ. Int., 48, 150–155, https://doi.org/10.1016/j.envint.2012.07.001, 2012.
Phillips-Smith, C., Jeong, C.-H., Healy, R. M., Dabek-Zlotorzynska, E., Celo, V., Brook, J. R., and Evans, G.: Sources of particulate matter components in the Athabasca oil sands region: investigation through a comparison of trace element measurement methodologies, Atmos. Chem. Phys., 17, 9435–9449, https://doi.org/10.5194/acp-17-9435-2017, 2017.
Pikridas, M., Vrekoussis, M., Sciare, J., Kleanthous, S., Vasiliadou, E., Kizas, C., Savvides, C., and Mihalopoulos, N.: Spatial and temporal (short and long-term) variability of submicron, fine and sub-10µm particulate matter (PM1, PM2.5, PM10) in Cyprus, Atmos. Environ., 191, 79–93, https://doi.org/10.1016/j.atmosenv.2018.07.048, 2018.
Pikridas, M., Bezantakos, S., Močnik, G., Keleshis, C., Brechtel, F., Stavroulas, I., Demetriades, G., Antoniou, P., Vouterakos, P., Argyrides, M., Liakakou, E., Drinovec, L., Marinou, E., Amiridis, V., Vrekoussis, M., Mihalopoulos, N., and Sciare, J.: On-flight intercomparison of three miniature aerosol absorption sensors using unmanned aerial systems (UASs), Atmos. Meas. Tech., 12, 6425–6447, https://doi.org/10.5194/amt-12-6425-2019, 2019.
Poulakis, E., Theodosi, C., Bressi, M., Sciare, J., Ghersi, V., and Mihalopoulos, N.: Airborne mineral components and trace metals in Paris region: spatial and temporal variability, Environ. Sci. Pollut. R, 22, 14663–14672, 2015.
Rodríguez, S., Querol, X., Alastuey, A., Kallos, G., and Kakaliagou, O.: Saharan dust contributions to PM10 and TSP levels in Southern and Eastern Spain, Atmos. Environ., 35, 2433–2447, https://doi.org/10.1016/S1352-2310(00)00496-9, 2001.
Rodríguez, S., Alastuey, A., Alonso-Pérez, S., Querol, X., Cuevas, E., Abreu-Afonso, J., Viana, M., Pérez, N., Pandolfi, M., and de la Rosa, J.: Transport of desert dust mixed with North African industrial pollutants in the subtropical Saharan Air Layer, Atmos. Chem. Phys., 11, 6663–6685, https://doi.org/10.5194/acp-11-6663-2011, 2011.
Scarnato, B. V., China, S., Nielsen, K., and Mazzoleni, C.: Perturbations of the optical properties of mineral dust particles by mixing with black carbon: a numerical simulation study, Atmos. Chem. Phys., 15, 6913–6928, https://doi.org/10.5194/acp-15-6913-2015, 2015.
Schauer, G., Kasper-Giebl, A., and Močnik, G.: Increased PM concentrations during a combined wildfire and Saharan dust event observed at high-altitude sonnblick observatory, Austria, Aerosol Air Qual. Res., 16, 542–554, https://doi.org/10.4209/aaqr.2015.05.0337, 2016.
Schrod, J., Weber, D., Drücke, J., Keleshis, C., Pikridas, M., Ebert, M., Cvetković, B., Nickovic, S., Marinou, E., Baars, H., Ansmann, A., Vrekoussis, M., Mihalopoulos, N., Sciare, J., Curtius, J., and Bingemer, H. G.: Ice nucleating particles over the Eastern Mediterranean measured by unmanned aircraft systems, Atmos. Chem. Phys., 17, 4817–4835, https://doi.org/10.5194/acp-17-4817-2017, 2017.
Sciare, J., Oikonomou, K., Cachier, H., Mihalopoulos, N., Andreae, M. O., Maenhaut, W., and Sarda-Estève, R.: Aerosol mass closure and reconstruction of the light scattering coefficient over the Eastern Mediterranean Sea during the MINOS campaign, Atmos. Chem. Phys., 5, 2253–2265, https://doi.org/10.5194/acp-5-2253-2005, 2005.
Sciare, J., D'Argouges, O., Esteve, R. S., Gaimoz, C., Dolgorouky, C., Bonnaire, N., Favez, O., Bonsang, B., and Gros, V.: Large contribution of water insoluble secondary organic aerosols in the region of Paris (France) during wintertime, J. Geophys. Res., 116, D22203, https://doi.org/10.1029/2011JD015756, 2011.
Sioutas, C., Koutrakis, P., and Burton, R. M.: Development of a low cutpoint slit virtual impactor for sampling ambient fine particles, J. Aerosol Sci., 25, 1321–1330, https://doi.org/10.1016/0021-8502(94)90128-7 1994.
Sokolik, I. and Toon, O.: Incorporation of mineralogical composition into models of the radiative properties of mineral aerosol from UV to IR wavelengths, J. Geophys. Res., 104, 9423–9444, 1999.
Valenzuela, A., Olmo, F. J., Lyamani, H., Antón, M., Titos, G., Cazorla, A., and Alados-Arboledas, L.: Aerosol scattering and absorption Angström exponents as indicators of dust and dust-free days over Granada (Spain), Atmos. Res., 154, 1–13, https://doi.org/10.1016/j.atmosres.2014.10.015, 2015.
Viana, M., Salvador, P., Artíñano, B., Querol, X., Alastuey, A., Pey, J., Latz, A. J., Cabañas, M., Moreno, T., Dos Santos, S. G., Herce, M. D., Hernández, P. D., García D. R., and Fernández-Patier, R.: Assessing the Performance of Methods to Detect and Quantify African Dust in Airborne Particulates, Environ. Sci. Technol., 44, 8814–8820, https://doi.org/10.1021/es1022625, 2010.
Visser, S., Slowik, J. G., Furger, M., Zotter, P., Bukowiecki, N., Canonaco, F., Flechsig, U., Appel, K., Green, D. C., Tremper, A. H., Young, D. E., Williams, P. I., Allan, J. D., Coe, H., Williams, L. R., Mohr, C., Xu, L., Ng, N. L., Nemitz, E., Barlow, J. F., Halios, C. H., Fleming, Z. L., Baltensperger, U., and Prévôt, A. S. H.: Advanced source apportionment of size-resolved trace elements at multiple sites in London during winter, Atmos. Chem. Phys., 15, 11291–11309, https://doi.org/10.5194/acp-15-11291-2015, 2015.
Vrekoussis, M., Liakakou, E.,Koçak, M., Kubilay, N., Oikonomou, K., Sciare, J., and Mihalopoulos, N.: Seasonal variability of optical properties of aerosols in the Eastern Mediterranean, Atmos. Environ., 39, 7083–7094, https://doi.org/10.1016/j.atmosenv.2005.08.011, 2005.
Weingartner, E., Saathoff, H., Schnaiter, M., Streit, N., Bitnar, B., and Baltensperger, U.: Absorption of light by soot particles: determination of the absorption coefficient by means of aethalometers, J. Aerosol Sci., 34, 1445–1463, https://doi.org/10.1016/S0021-8502(03)00359-8, 2003.
WHO: Workshop: Evaluating the short-term health effects of desert and anthropogenic dust, 29 October 2018, Geneva, WHO, 2018.
WMO: Report No. 227: WMO/GAW Aerosol Measurement Procedures, Guidelines and Recommendations, 2nd Edition, Geneva, WMO, 2016.
Zhang, X. Y., Wang, Y. Q., Zhang, X. C., Guo, W., Niu, T., Gong, S. L., Yin, Y., Zhao, P., Jin, J. L., and Yu M.: Aerosol monitoring at multiple locations in China: contributions of EC and dust to aerosol light absorption, Tellus B, 60, 647–656, https://doi.org/10.1111/j.1600-0889.2008.00359.x, 2008.