the Creative Commons Attribution 4.0 License.
the Creative Commons Attribution 4.0 License.
 | 29 Oct 2020
Measurement of NOx and NOy with a thermal dissociation cavity ring-down spectrometer (TD-CRDS): instrument characterisation and first deployment
Nils Friedrich
Ivan Tadic
Jan Schuladen
James Brooks
Eoghan Darbyshire
Frank Drewnick
Horst Fischer
Jos Lelieveld
We present a newly constructed, two-channel thermal dissociation cavity ring-down spectrometer (TD-CRDS) for the measurement of NOx (NO+NO2), NOy ( etc.), NOz (NOy−NOx) and particulate nitrate (pNit). NOy-containing trace gases are detected as NO2 by the CRDS at 405 nm following sampling through inlets at ambient temperature (NOx) or at 850 ∘C (NOy). In both cases, O3 was added to the air sample directly upstream of the cavities to convert NO (either ambient or formed in the 850 ∘C oven) to NO2. An activated carbon denuder was used to remove gas-phase components of NOy when sampling pNit. Detection limits, defined as the 2σ precision for 1 min averaging, are 40 pptv for both NOx and NOy. The total measurement uncertainties (at 50 % relative humidity, RH) in the NOx and NOy channels are 11 %+10 pptv and 16 %+14 pptv for NOz respectively. Thermograms of various trace gases of the NOz family confirm stoichiometric conversion to NO2 (and/or NO) at the oven temperature and rule out significant interferences from NH3 detection (<2 %) or radical recombination reactions under ambient conditions. While fulfilling the requirement of high particle transmission (>80 % between 30 and 400 nm) and essentially complete removal of reactive nitrogen under dry conditions (>99 %), the denuder suffered from NOx breakthrough and memory effects (i.e. release of stored NOy) under humid conditions, which may potentially bias measurements of particle nitrate.
Summertime NOx measurements obtained from a ship sailing through the Red Sea, Indian Ocean and Arabian Gulf (NOx levels from <20 pptv to 25 ppbv) were in excellent agreement with those taken by a chemiluminescence detector of NO and NO2. A data set obtained locally under vastly different conditions (urban location in winter) revealed large diel variations in the NOz to NOy ratio which could be attributed to the impact of local emissions by road traffic.
- Article
(3471 KB) - Full-text XML
-
Supplement
(628 KB) - BibTeX
- EndNote


1.1 Atmospheric NOx and NOy
Total reactive nitrogen NOy (= NOx+NOz) consists of nitrogen oxide, NO; nitrogen dioxide, NO2 (NO+NO2 = NOx); and their reservoir species, NOz ( ), where X is a halogen atom. HCN and NH3 are generally not considered to be components of NOy (Logan, 1983).
The formation of both peroxy nitrates (PNs; RO2NO2) and alkyl nitrates (ANs; RONO2) requires the presence of organic peroxy radicals (RO2), which are formed by processes such as the reaction of OH radicals with volatile organic compounds (VOCs) and oxygen (Reaction R1). RO2 radicals subsequently react with NO2 or NO to form peroxy nitrates (PNs; RO2NO2) or alkyl nitrates (ANs; RONO2, Reactions R2 and R3). Reaction (R3) competes with the formation of an alkoxy radical (RO) and the oxidation of NO to NO2 (Reaction R4), which consumes the dominant fraction of RO2. The branching ratio between these two pathways depends on atmospheric conditions such as pressure and temperature and on the structure and length of the organic backbone (Lightfoot et al., 1992). HNO3 is produced mainly via the reaction of NO2 with OH (Reaction R5).
The lifetimes of peroxy nitrates in the low troposphere are mainly governed by the temperature. PNs with an additional acyl group (PANs), such as peroxyacetyl nitrate (PAN), are generally more stable than PNs without an acyl group (e.g. pernitric acid, HO2NO2), which are observed only in cold regions (Slusher et al., 2002). Thus, of the peroxy nitrates, only PANs are considered able to act as transportable reservoirs for NOx. At higher altitudes in the troposphere (above ca. 7 km) photolysis becomes the most important loss process for PAN, while the reaction with OH is negligible throughout the troposphere (Talukdar et al., 1995).
The absence of photolysis reactions and low levels of the OH radical at night-time provide alternative pathways for the formation of NOz species. NO2 is oxidised by O3 to produce the nitrate radical NO3, which exists in thermal equilibrium with N2O5 (Reactions R6 and R7). The reaction of NO3 with hydrocarbons represents a night-time source of alkyl nitrates (Reaction R8), and N2O5 can be hydrolysed on aqueous aerosol, resulting in the formation of HNO3 (Reaction R9) and ClNO2 (Reaction R10) if particulate chloride is available (Finlayson-Pitts et al., 1989).
Nitric acid formation via the reaction of NO2 and OH (Reaction R5), followed by wet or dry deposition of HNO3, is considered to be the dominant daytime loss process for atmospheric NOx (Roberts, 1990), although the reduction of NOx may result in an increasingly important role for organic nitrates (e.g. in the USA; Romer Present et al., 2020). As some organic nitrates have longer lifetimes than HNO3, the atmospheric transport of NOx to remote locations would lead to a more even distribution of NOx, instead of hotspots in polluted regions close to emission sources. Atmospheric removal processes for ANs include oxidation by OH or O3 (which may lead to a loss of the nitrate functionality), deposition to the Earth's surface and photolysis. Additionally, partitioning into the aerosol phase is possible for large and multifunctional ANs (Perring et al., 2013). Alkyl nitrates possessing no further functionality (e.g. double bonds or hydroxyl groups) can be unreactive and have long lifetimes (Talukdar et al., 1997). On the global average, RONO2 has a lifetime of close to 3 h (2.6–3 h) with ∼ 30 % being lost by hydrolysis (Zare et al., 2018).
The formation of NOz in the lower atmosphere reduces the NOx lifetime, and the partitioning of NOy into NOx and NOz can provide information about the chemical history of an air mass (Day et al., 2002; Wild et al., 2014). In regions impacted by biogenic emissions, the sources and sinks of ANs account for a large fraction of NOx lost both during the day and night and, thus, control the lifetime of NOx (Romer et al., 2016; Sobanski et al., 2017).
Laboratory experiments have shown that particulate nitrates (pNits) are formed at high yields in the atmospheric degradation of terpenoids in the presence of NOx and play an important role in the formation and growth of secondary organic aerosol (SOA; Ng et al., 2017; Ammann et al., 2019). This has been confirmed in field studies, which provide evidence for the partitioning of organic nitrate to the aerosol phase both during day- and night-time (Rollins et al., 2012; Fry et al., 2013; Palm et al., 2017) with the formation of highly functionalised molecules and large contributions (up to 25 %) of particulate organic nitrates to the total aerosol mass (Xu et al., 2015; Lee et al., 2016; Huang et al., 2019).
1.2 Detection of NOx
Methods for the detection of NO and NO2 include chemiluminescence (CLD), differential optical absorption spectroscopy (DOAS), laser-induced fluorescence (LIF) and cavity ring-down spectroscopy (CRDS). A description and intercomparison of these methods is given in Fuchs et al. (2010), and we restrict the following discussion to an outline of the basic principles. The CLD method detects NO by chemiluminescent emission in its reaction with O3; detection of ambient NO2 by CLD follows its catalytic or photolytic conversion to NO. The best CLD devices have detection limits for NO and NO2 in the single-digit parts per trillion by volume (pptv) range (Hosaynali Beygi et al., 2011; Reed et al., 2016; Tadic et al., 2020). Detection of NO2 via LIF involves photoexcitation in its visible absorption band at wavelengths > 400 nm and detection of fluorescent emission at wavelengths > 600 nm, with detection limits of the order of parts per trillion by volume achieved for an integration time of a few seconds (Day et al., 2002; Javed et al., 2019). The structured spectrum of NO2 between ≈400 and 600 nm is used to detect light absorption by ambient NO2 by DOAS, using either broadband light sources (long-path DOAS, with a path length of more than a few kilometres) or natural sunlight (Platt et al., 1979; Leser et al., 2003; Pohler et al., 2010; Merten et al., 2011).
The CRDS detection method for NO2 also utilises its visible absorption spectrum, with high sensitivity being reached by achieving very long path lengths for optical extinction in an optical resonator (see Sect. 2.1). Limits of detection for NO2 with CRDS of <20 pptv with a 1 s integration time have been reported (Wild et al., 2014). NO can be detected as NO2 following its oxidation by O3 (Reaction R6; Fuchs et al., 2009).
1.3 Detection of NOy
The first NOy measurements were based on the conversion of all reactive nitrogen trace gases (apart from NO) to NO on catalytic metal surfaces of gold at ∼ 300–320 ∘C or of molybdenum oxide (MoO) at ∼ 350–400 ∘C (Fahey et al., 1985; Williams et al., 1998), with subsequent CLD detection of NO. Au converters were designed to exclude particulate nitrates, whereas MoO set-ups aimed at a response towards pNit (Williams et al., 1998). In recent years, the thermal decomposition of NOz to NO2 has been employed to detect NOz using inlets held at temperatures high enough (> 650–700 ∘C) to thermally dissociate the most strongly bound reactive nitrogen trace gas, HNO3, to NO2 (Day et al., 2002; Rosen et al., 2004; Wooldridge et al., 2010; Perring et al., 2013; Wild et al., 2014) and/or using multiple inlets at intermediate temperatures (Paul et al., 2009; Paul and Osthoff, 2010; Sadanaga et al., 2016; Sobanski et al., 2016; Thieser et al., 2016). Following thermal decomposition, the NO2 product can be detected using LIF (Day et al., 2002, 2003; Rosen et al., 2004; Murphy et al., 2006; Wooldridge et al., 2010) or cavity-enhanced absorption spectroscopy (Paul et al., 2009; Wild et al., 2014; Sadanaga et al., 2016; Sobanski et al., 2016; Thieser et al., 2016). These techniques are impacted to various degrees by secondary reactions at high temperatures, including the loss of NO2 via recombination with α-carbonyl peroxy radicals or reaction with O(3P) atoms (formed by the thermolysis of ambient O3) and the generation of extra NO2 from the oxidation of NO via reactions with peroxy radicals (Day et al., 2002; Sobanski et al., 2016; Thieser et al., 2016; Womack et al., 2017). Measures to reduce potential measurement artefacts and avoid excessive data correction include operation at low pressures (Day et al., 2002; Womack et al., 2017) and the addition of surfaces to scavenge peroxy radicals (Sobanski et al., 2016). Nonetheless, data correction may still be necessary and may involve laboratory characterisation and chemical simulation of the chemical reactions within the heated inlet (Sobanski et al., 2016; Thieser et al., 2016).
In this paper we present a two-channel TD-CRDS instrument for the detection of NOx, NOy, NOz and pNit that overcomes these limitations. Compared with the set-ups described by Thieser et al. (2016), the following changes were implemented: (1) the addition of O3 for NOx detection, (2) use of an oven that was located directly at the front of the inlet and which was operated at a higher temperature (to detect HNO3), and (3) the use of a charcoal denuder for separate measurement of pNit and gas-phase NOz. The addition of O3 (after the TD inlet) ensures that we detect NO as well as NO2 and, thus, removes bias caused by factors such as the pyrolysis of O3 and reactions of O(3P) which reduce NO2 to NO.
Our TD-CRDS instrument consists of two identically constructed cavities to monitor NO2 at 405 nm which are largely unchanged compared to those described by Thieser et al. (2016). In the present set-up, the two cavities are connected to three different inlets. One cavity monitors NOx via an inlet at ambient temperature, and the second samples air via one of two heated inlets (one equipped with a denuder, see below), thereby monitoring either NOy or particle nitrate. A schematic diagram (not to scale) of the instrument is given in Fig. 1.
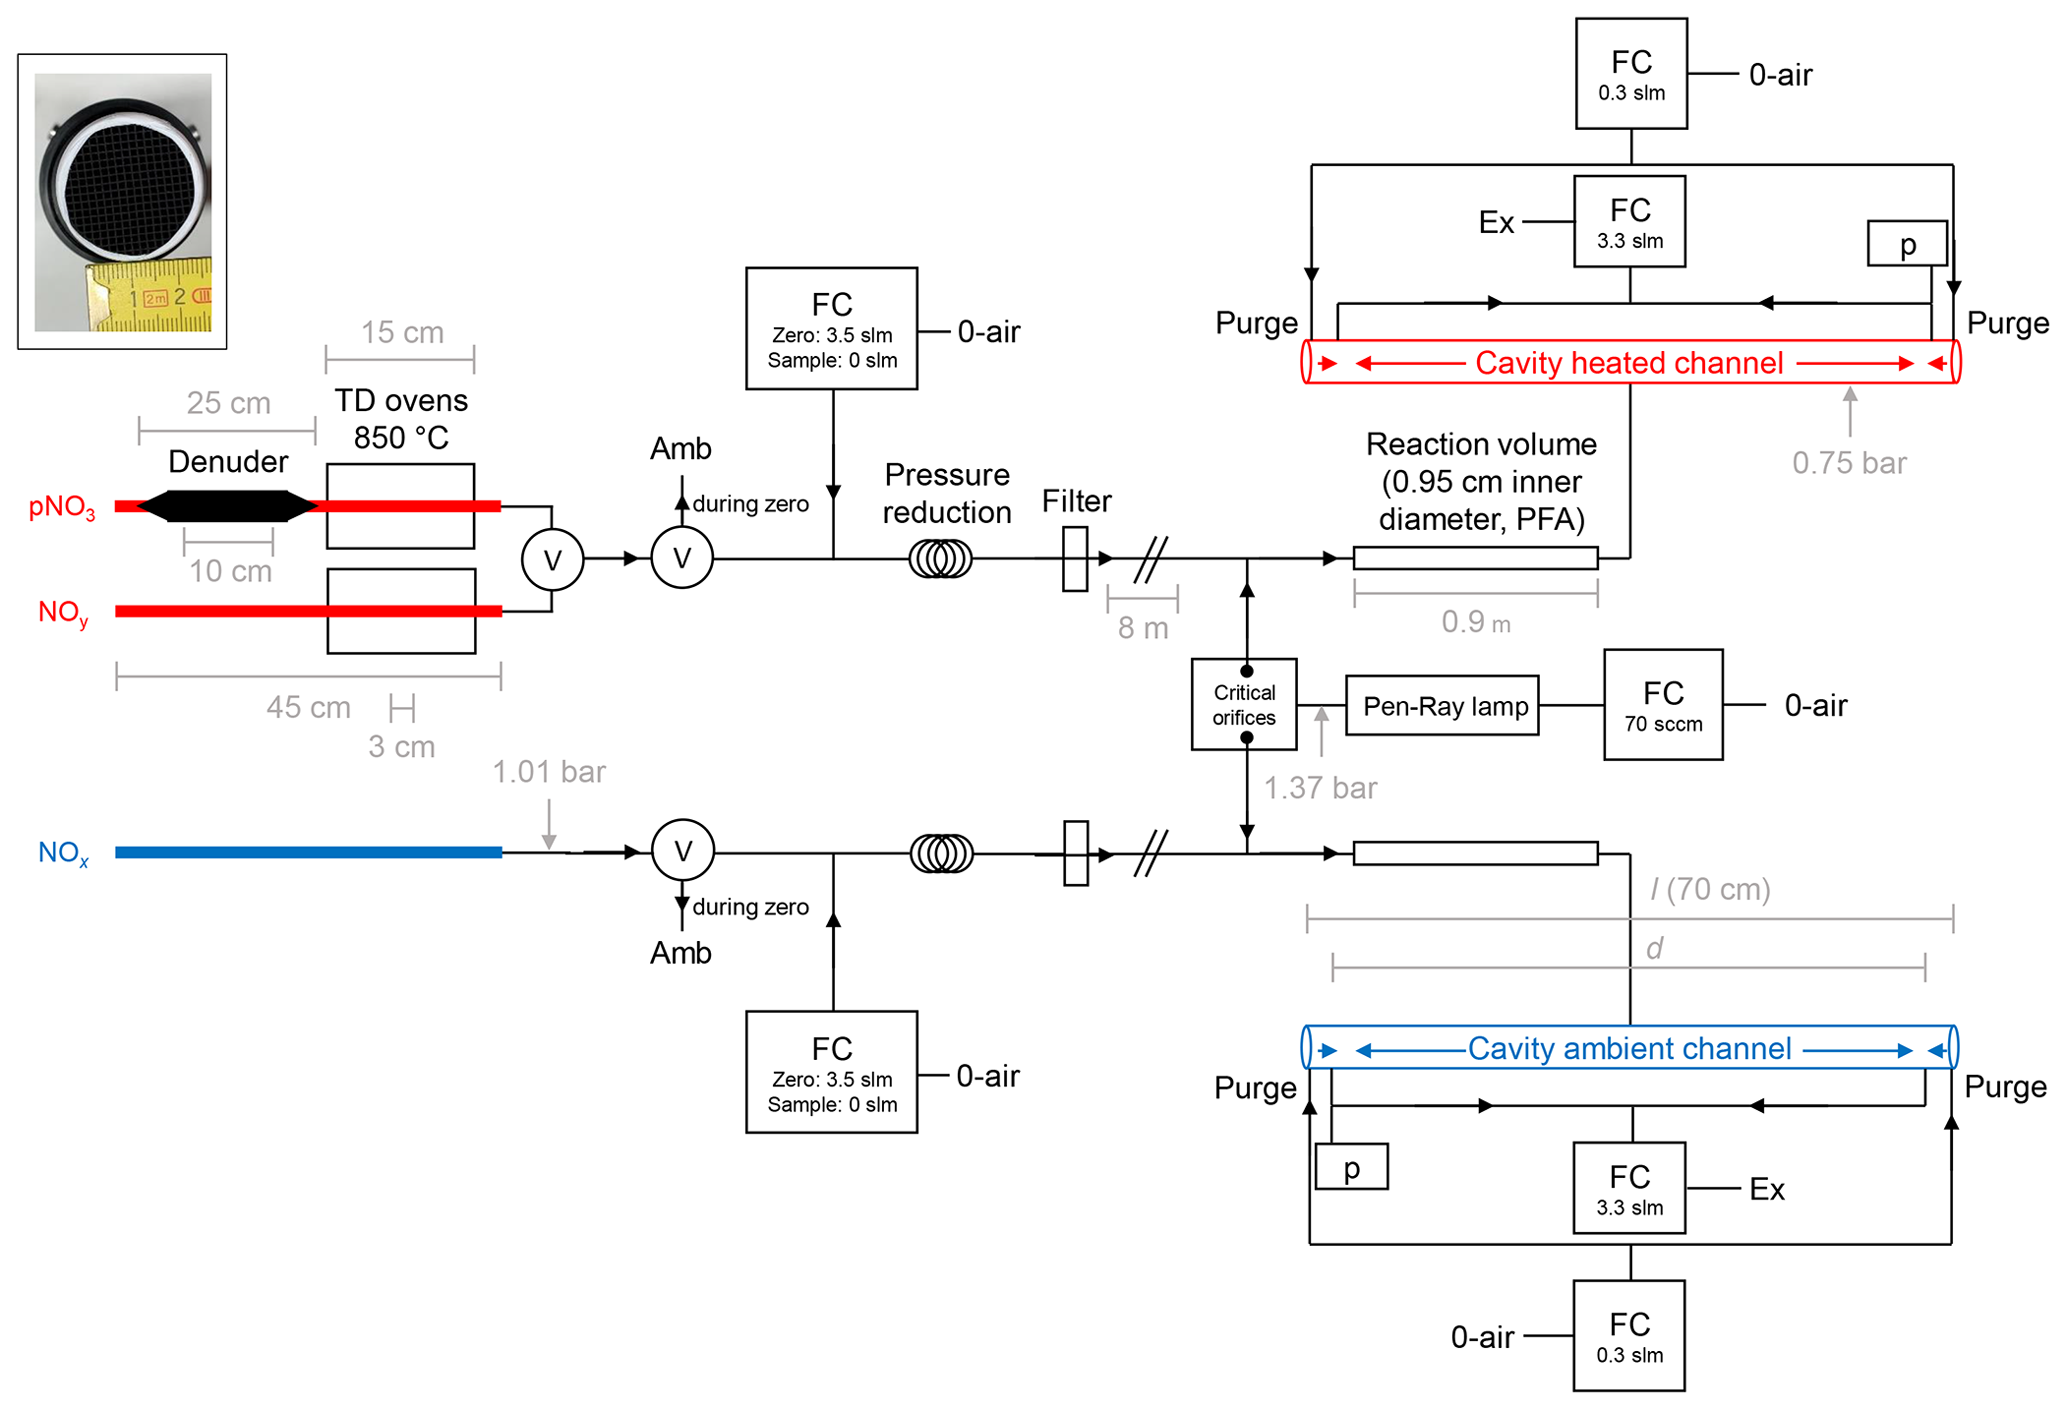
Figure 1Schematic diagram of the TD-CRDS instrument (not to scale). NOy and pNit are detected via the heated channel, and NOx is detected via the ambient channel. Ozone is generated via a Pen-Ray lamp (185 nm) and serves to convert NO to NO2. TD denotes thermal dissociation, and FC denotes flow controller. The flows listed are those used under normal operating conditions. p denotes a pressure sensor, Ex denotes a membrane pump and exhaust, Amb denotes ambient air and V denotes an electronically switchable PTFE valve. “Filter” is a PTFE filter, 2 µm pore size. O-air refers to zero air. The inset (photo) shows the honeycomb structure of the activated carbon denuder. The critical orifices have diameters of ≈0.05 mm. (“slm” is used to refer to standard litres per minute in this figure.)
2.1 CRDS operation principals
The optical resonator consists of two mirrors (1 m radius of curvature) with a nominal 0.999965 reflectivity at 405 nm (Advanced Thin Films), which are mounted 70 cm apart. The cavity volumes are defined by Teflon (FEP) coated DURAN glass tubes with an inner diameter of 10 mm.
Under normal operating conditions each cavity samples 3.0 L (STP) min−1 (slpm; standard litres per minute) of ambient air (where STP refers to 0 ∘C and 1013 hPa). Additional purge flows (0.14 slpm dry synthetic air) are introduced directly in front of each mirror to prevent surface degradation by atmospheric trace gases. The cavities are operated at pressures of 540 to 580 Torr (1 Torr = 1.333 hPa), resulting in a residence time of ∼ 1.2 s. A 405 nm laser light (square-wave modulated at 1666 Hz and a 50 % duty cycle) is provided by a laser diode (LASER COMPONENTS), the emission of which is coupled into an optical fibre with a Y piece for splitting into both cavities. Temperature and current control of the laser diode are achieved by a Thorlabs ITC502 control unit. The laser emission spectrum is monitored continuously by coupling scattered light from one of the cavity mirrors into a 3648 pixel CCD (charge-coupled device) spectrograph (OMT, ∼ 0.1 nm resolution).
The intensity of light exiting the cavity is measured with a photomultiplier (Hamamatsu Photonics), with ring-up and ring-down profiles recorded by a digital oscilloscope (PicoScope 3000). NO2 mixing ratios are derived from the decay constant (k or k0) describing the exponential decrease in light intensity after the laser has been switched off:
where c is the speed of light, σ is the effective absorption cross section of NO2 over the emission spectrum of the laser (Vandaele et al., 2002), and k and k0 are the decay constant with and without NO2 present in the cavity respectively. Thus, k0 is defined by the mirror reflectivity and light scattering by the dry, synthetic air.
The ratio l∕d accounts for the difference between the physical length of the cavity (l) and the effective optical path length (d) in which NO2 is present as well as for dilution effects. d is shorter than l due to the purge flows of zero air in front of the mirrors, and a value of was determined by adding a constant flow of NO2 and varying the purge-gas flow rate (Schuster et al., 2009; Thieser et al., 2016). k0 is typically determined every 5 min (for 1 min) by overflowing the inlets with zero air from a commercial zero air generator (CAP 180, Fuhr GmbH) attached to a source of compressed ambient air. PTFE filters (47 mm diameter, 2 µm pore size) prevent particles from entering the cavities. The filter's efficiency, tested with laboratory air containing 1.8 ×10³ particles cm−3 and a CPC (TSI 3025 A), was > 98 %.
Raw data sets (i.e. ring-down constants) undergo a few basic corrections before further analysis:
-
k0 is interpolated onto the k time grid. The first three data points after switching from sampling to zeroing are discarded in order to enable the stabilisation of the zero signal. The remaining data points of each zero cycle are averaged. Finally, a linear interpolation between the averaged k0 values is performed, allowing for the subtraction of k0 for each individual data point.
-
Depending on conditions of flow, the pressure and the inlet set-up (see Sect. 2.2 and 2.3), changes in flow resistance between the zeroing and sampling periods result in slight changes in the cavity pressure. The resulting change in Rayleigh scattering of the 405 nm light owing to a pressure change of 6.5 Torr was found to be equivalent to a change of ca. 300 pptv in the NO2 mixing ratio, which is in accordance with earlier experiments using previous versions of this instrumental set-up (Thieser et al., 2016). We have also used an alternative set-up in which the inlet is overflowed with zero air added close to the tip of the inlet (downstream of the oven); this reduces the pressure difference but has the disadvantage that hot air is blown out of the instrument when zeroing, which may interfere with co-located inlets. The addition of zero air upstream of the quartz inlets would remove this problem, but it would also increase the complexity of the inlet and potentially result in the loss of sticky molecules such as HNO3.
-
A further correction is associated with the difference in the Rayleigh scattering coefficient between dry air (during zeroing) and humid air (whilst taking ambient measurements). This effect was corrected using the H2O scattering cross sections reported by Thieser et al. (2016), leading, for example, to a correction of 116 pptv at 70 % RH and 20 ∘C.
2.2 Detection of NOx
In order to measure NO (which does not absorb at 405 nm), it is converted to NO2 by reaction with an excess of ozone (O3); the O3 was generated by passing zero air over a Hg Pen-Ray lamp emitting at 185 nm, which was housed inside a glass vessel at ca. 980 Torr pressure. The gas stream containing O3 is split up equally by critical orifices and directed into two identical reaction volumes made of 88 cm long PFA tubing (1∕2 inch outer diameter, residence time 1.05 s). The concentration of O3 (monitored by a commercial monitor, Model 202, 2B Technologies) was optimised in laboratory experiments in which the efficiency of the conversion of NO to NO2 was varied by changing the flow of air over the Pen-Ray lamp. The maximum concentration of NO2 (corresponding to 96 % of the NO in the gas bottle) was observed when the flow over the Pen-Ray lamp was between 60 and 80 cm3 (STP) min−1 (hereafter sccm), which resulted in 19 ppmv O3 in the reaction volumes. This result could be confirmed by numerical simulation (see Table S1 in the Supplement) of the reactions involved in the formation and loss of NO2 when NO reacts with O3. According to the simulation, the maximum conversion of NO to NO2 during the 1.05 s residence time occurs between ca. 12 and 20 ppmv O3. The conversion efficiency decreases at higher O3 concentrations due to the formation of N2O5 and NO3. The results from the experiments to determine the optimum parameters for O3 generation are summarised in Fig. S1.
For NO2, the performance of the instrument was first described by Thieser et al. (2016), who reported a measurement uncertainty of that was dominated by uncertainty in the effective cross section of NO2 and the wavelength stability of the laser diode. The NOx detection limit of 40 pptv (2σ, 1 min average) for the present instrument (laboratory conditions) was derived from an Allan variance analysis and is worse than that reported by Thieser et al. (2016) (6 pptv at 40 s) due to degradation of the mirror reflectivity. Corrections applied to take humidity and pressure changes into account are discussed in Sect. 2.1. The total uncertainty in NOy will depend on the uncertainty in the conversion of both gaseous and particulate nitrate to NOx and, thus, depends on the individual components of NOy in the air sampled. For purely gaseous NOy, the major problem is likely to be related to the loss of sticky molecules at the inlet, and we choose to quote a “worst case” uncertainty of 15 %.
2.3 Thermal dissociation inlets: detection of NOy
The thermal dissociation inlets used to dissociate NOy to NO2 are quartz tubes housed in commercial furnaces (Carbolite, MTF 10/15/130). The oven temperature was regulated with a custom-made electronic module, which enabled spatial separation between the heating elements and insulation and the control electronics. The distance between the heated section of the quartz tubes and the point at which air was taken into the inlet was kept short (ca. 30 cm) in order to minimise losses of trace gases with a high affinity for surfaces, especially HNO3 (Neuman et al., 1999). Experiments characterising the thermal conversion of various trace gases to NO2 are described in Sect. 3.1. An electronic, PTFE three-way valve (Neptune Research, Inc., type 648T032, orifice diameter 4 mm) under software control switches between the two heated inlets, one of which is equipped with a denuder. Memory effects on the valves' surfaces were not observed for NO2. Bypassing the valve under normal sampling conditions led to a 0.6 Torr pressure change. The sampling flow through both heated inlets is 3.0 slpm. When sampling ambient air via the denuder, we expect to remove all gas-phase NOy components and, thus, measure only particulate nitrate (pNit). Experiments to characterise the transmission of the denuder for particles and various trace gases are presented in Sect. 3.3.
2.4 Active carbon denuder
The active carbon denuder (Dynamic AQS) has a honeycomb structure with 225 quadratic channels (1 mm × 1 mm) of 10 cm length in a cylindrical form (diameter 3 cm) which is housed inside an aluminium casing with 1∕2 inch connections (see Fig. 1). The geometric surface area of the denuder is ∼ 45 cm2. Assuming a specific surface area for activated carbon of 1000 m2 g−1 (Atsuko et al., 1996), we calculate a BET (Brunauer–Emmett–Teller, Brunauer et al., 1938) surface area of the order of 108 cm2.
2.5 Chemicals
A stock, liquid sample of PAN in n-tridecane (> 98 %, Alfa Aesar) was synthesised according to the procedures described by Gaffney et al. (1984) and Talukdar et al. (1995). Samples of lower concentration (as used in the experiments described below) were produced by diluting the original sample with additional n-tridecane. Acetone (>99 %), isopropyl nitrate (>98.0 %) and (R)-(+)-limonene (97 %) were obtained from Sigma-Aldrich. An ammonia permeation source (324 ng min−1) was supplied by VICI Metronics. Methanol (>99.9 %) was acquired from Merck, isoprene (98 %, stabilised) from Acros Organics, and ethanol from Martin and Werner Mundo oHG. Both nitric acid (65 %) and β-pinene (pure) were obtained from Carl Roth. N2O5 crystals were synthesised according to Davidson et al. (1978) by reacting NO (5 %) with excess O3 in a glass reactor. O3 was produced via electrical discharge through O2 using a commercial ozone generator (Ozomat Com, Anseros). The crystals were trapped and stored at −78 ∘C in dry ice and ethanol.
3.1 Trace gas thermograms
The fractional conversion of NOz to NO2 in the TD inlets was investigated in a series of experiments in which constant flows of various NOz trace gases were passed through the heated inlet (bypassing the denuder) while the temperature was varied and NO2 was monitored. NOx impurity levels were determined either via the simultaneous operation of the NOx channel or via the NOy channel mixing ratio at room temperature, before and after heating the inlet. By inserting a thermocouple into the middle part of the heated section under normal sampling conditions, we were able to show that the temperature of the gas was ≈80 ∘C lower than that indicated by the oven's internal temperature sensor in the 200–300 ∘C temperature range and about 40 ∘C lower at a set temperature of 600 ∘C (see Fig. S3a). We were unable to measure the temperatures of the gas stream at oven temperatures above about 600 ∘C, and we refer only to the temperature indicated by the internal sensor of the oven throughout the paper.
In the following, we show that the thermograms (plots of fractional dissociation of NOz to NOx versus temperature) which we measure with this instrument are broader and are shifted in temperature compared with other examples found in the literature, including those from this laboratory. As this instrument is built for the measurement of NOy and is not intended for separate measurement of species such as PNs, ANs and HNO3, overlap of the individual thermograms does not represent a problem.
3.1.1 PAN
A stream of 200 sccm synthetic air was used to elute a constant supply of gaseous PAN from its solution (held at a constant temperature of 0 ∘C in a glass vessel) into the CRDS inlet. The thermogram is presented in Fig. 2, and the absolute NO2 mixing ratios are depicted in Fig. S2a. In this experiment the maximum amount of NO2 observed (at temperatures > 400 ∘C) was 2.2 ppbv. At temperatures < 100 ∘C, there was no measurable thermal decomposition of PAN to NO2. Increasing the temperature from 100 ∘C to 300 ∘C resulted in a sharp increase in NO2 which flattened off at temperatures > 380 ∘C. We conclude that PAN is stoichiometrically converted to NO2 at temperatures above 400 ∘C in our oven. The steepest part of the isotherm at ∼ 200 ∘C, i.e. 50 % conversion of PAN to NO2, is therefore shifted by ca. 80 ∘C compared with those reported in the literature by Wild et al. (2014), Thieser et al. (2016) and Sobanski et al. (2016). This is a consistent feature of our TD ovens and is related to the short time available for thermal decomposition (see below) and a significantly lower gas temperature than indicated by the oven's internal temperature sensor.
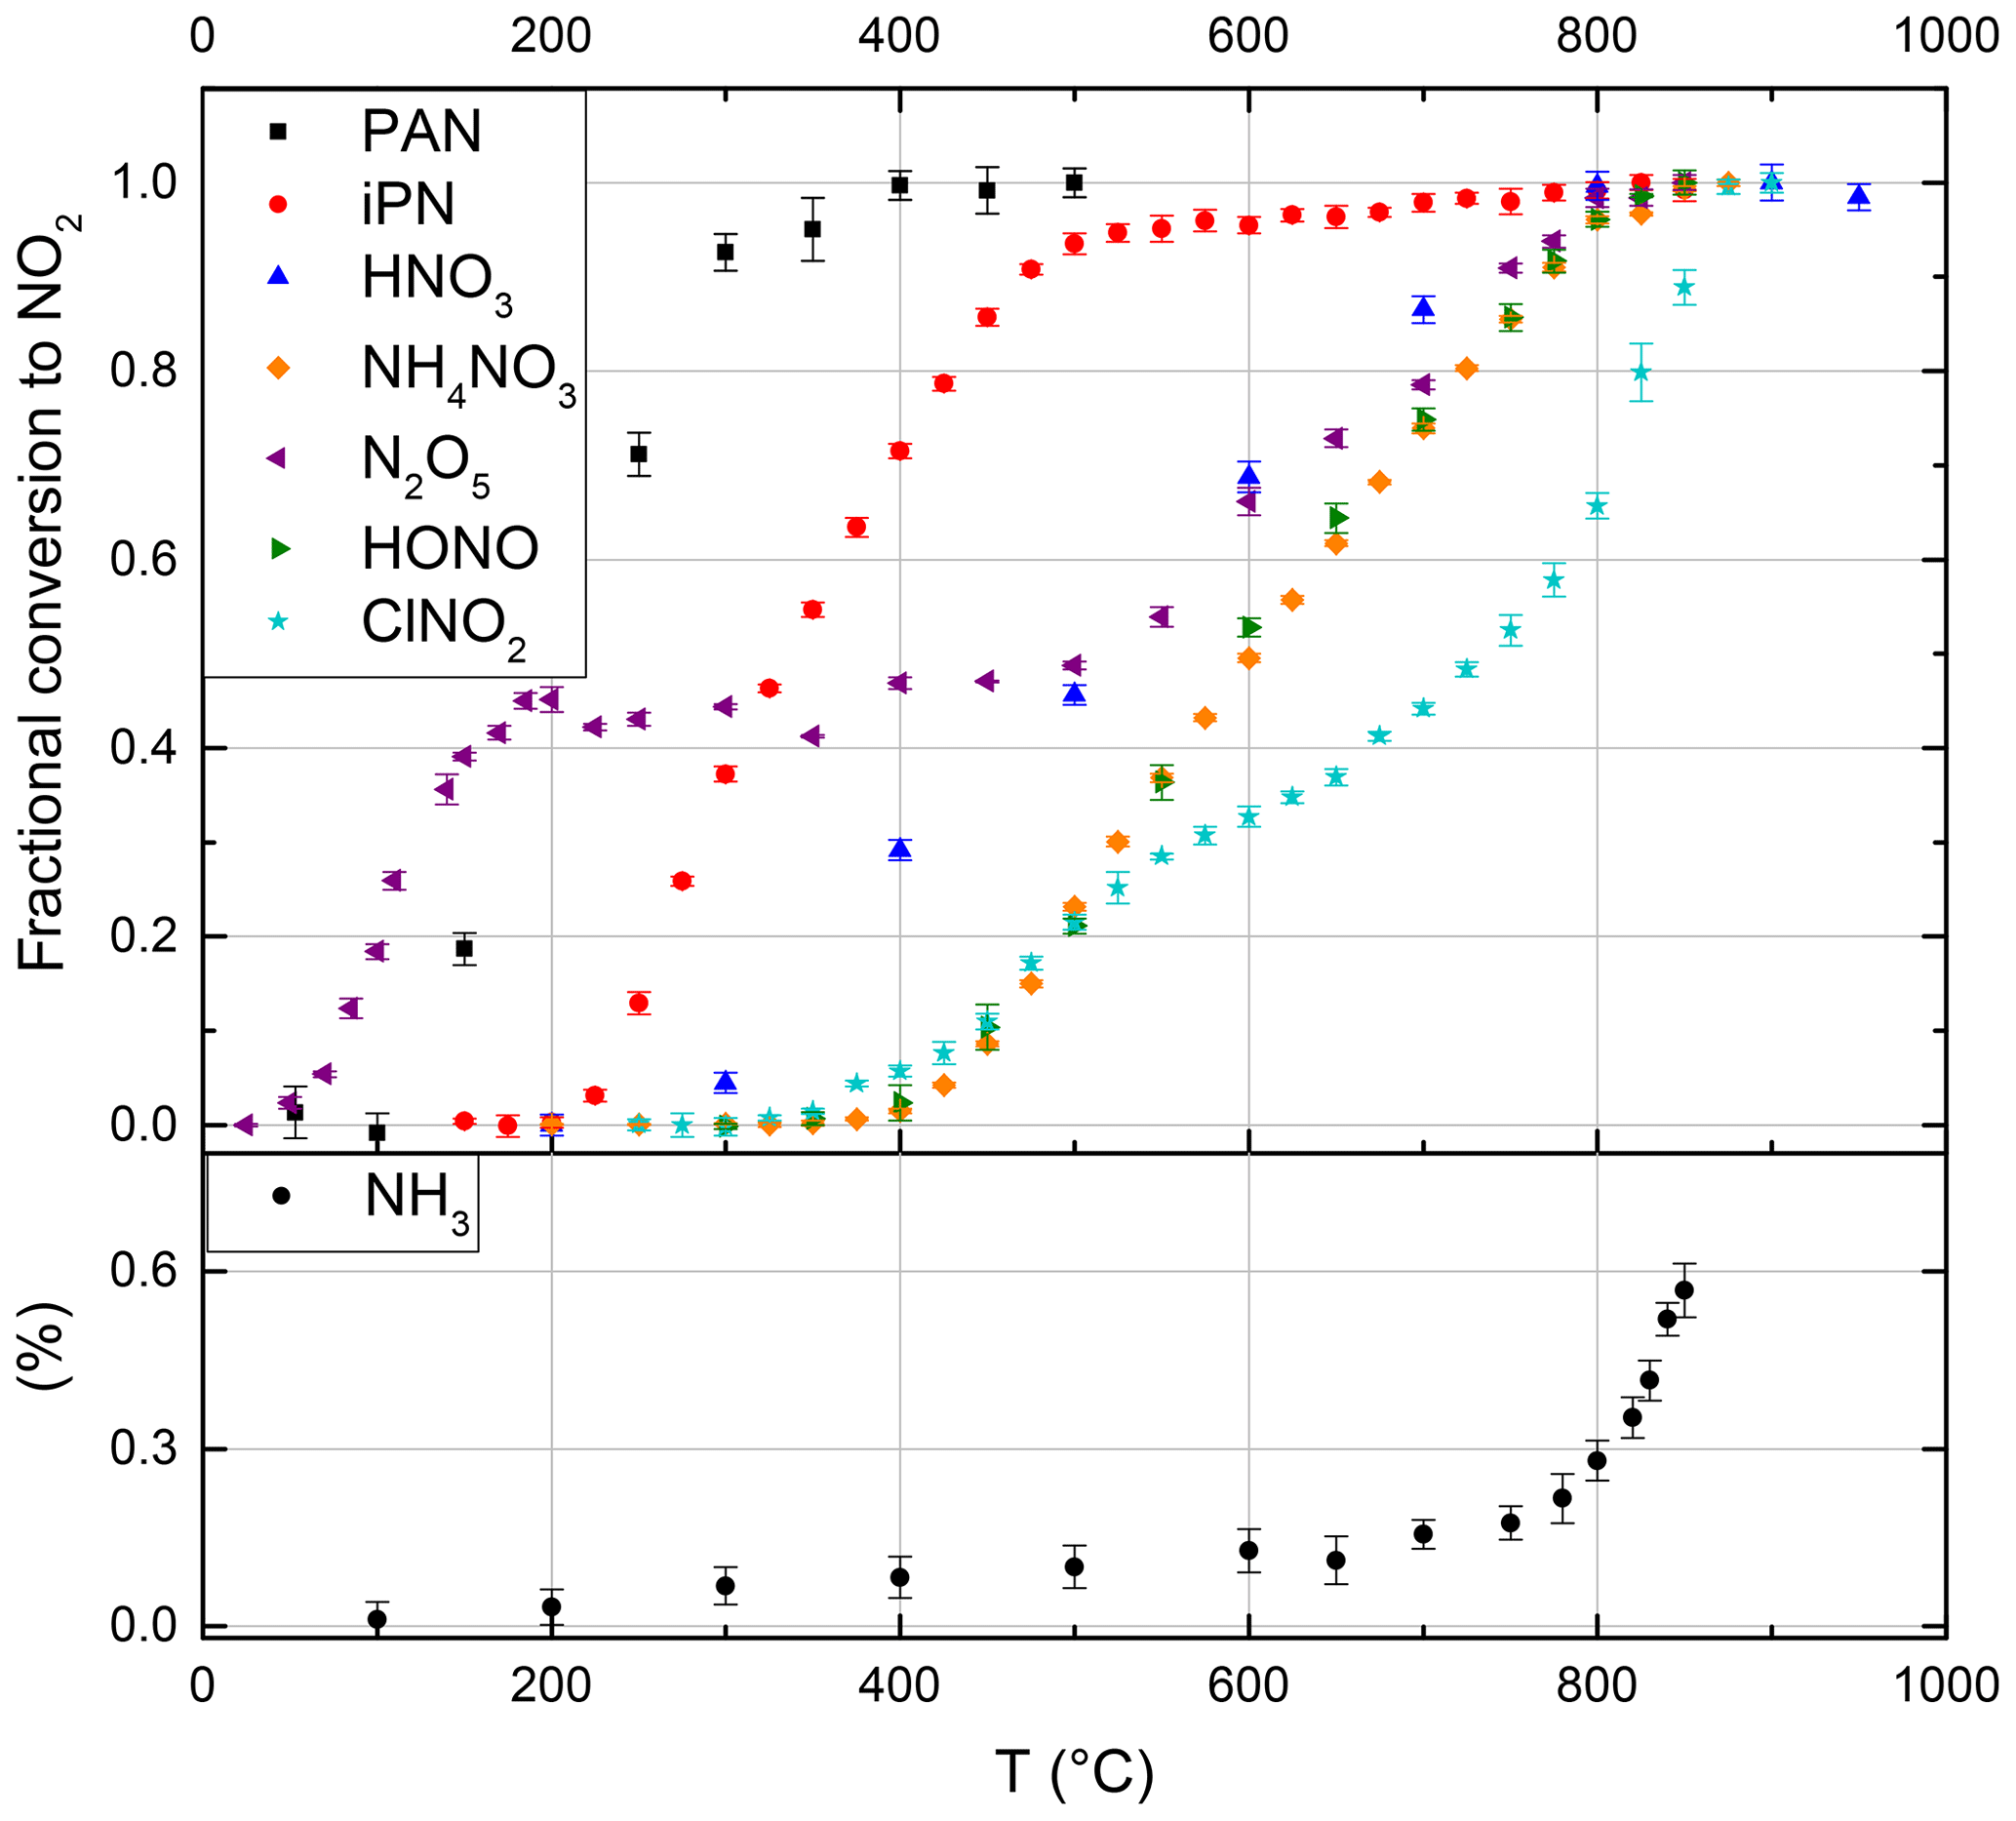
Figure 2Thermograms of the NOz species PAN, iPN (isopropyl nitrate), HNO3, NH4NO3, N2O5, HONO, ClNO2 and the potential interference from NH3 (without added O3). The NH3 fractional conversion is calculated relative to the calibrated output of the permeation source, whereas all other species are calculated relative to the observed mixing ratio at maximum conversion. Error bars are derived from the standard deviations during the averaging intervals. At the set temperature of 850 ∘C, PAN, iPN, NH4NO3, N2O5 (x2), HONO and HNO3 are converted quantitatively to NO2, while the NH3 interference is negligible under typical ambient conditions.
3.1.2 Isopropyl nitrate
A 10 L stainless-steel canister containing 10.3 ppmv of isopropyl nitrate (iPN) at a pressure of 4 bar N2 was prepared using a freshly vacuum-distilled liquid sample utilising standard manometric methods. NOx impurities were ∼ 4.7 ppbv, although we note that diluted iPN stored in stainless-steel canisters for periods of several weeks degrades to form NO2 and HNO3.
The thermogram is displayed in Fig. 2, and the absolute concentrations are shown in Fig. S2b. Based on the mixing ratio of iPN in the canister and the dilution flows, 10.7 ppbv represents (101±11) % conversion. The shaded area around the expected iPN mixing ratio in Fig. S2b signifies the uncertainty of this value based on the propagation of the errors during the manometric and dilution procedures (2 % for flow rates, 5 % for pressures measured with digital pressure gauges and 10 % for the last dilution step using the analogue pressure gauge of the canister).
Between 550 and 850 ∘C, we observe a weak increase in NO2 from 10.7 to 11.2 ppbv, which is likely due to small amounts of HNO3 in the sample. For iPN, the temperature at 50 % conversion is 50 ∘C higher than those reported by Thieser et al. (2016) and Sobanski et al. (2016). Wild et al. (2014) employed a gaseous mixture of different alkyl nitrates and also observed an initial increase in NO2 (up to 80 % conversion) for temperatures < 300 ∘C, followed by a slower increase up to 800 ∘C. The alkyl nitrates thermogram of Wild et al. (2014) has been included into Fig. S2b to illustrate this behaviour and to facilitate direct comparison.
3.1.3 HNO3
A custom-made permeation source was used to provide a constant, known flow of HNO3 (with ∼ 8 % NOx impurity) to the TD-CRDS inlet. The permeation source consisted of a length (≈1 m) of PFA tubing immersed in 66 % HNO3 solution held at 50 ∘C through which 100 sccm of dry, zero air was passed. The concentration of HNO3 and, thus, its permeation rate, sccm, was derived by measuring the optical extinction of HNO3 at 185 nm using the absorption cross section of Dulitz et al. (2018). The uncertainty is related to the uncertainty in the absorption cross section and the reproducibility of the output. The HNO3 thermogram (Figs. 2 and S2c) has a plateau at temperatures above ≈800 ∘C. In the plateau region of Fig. 2, the HNO3 mixing ratio measured is 13.0±0.8 ppb, which (within combined uncertainties) is in agreement with the expected value (15.2±1.98 ppbv) calculated from the permeation rate and uncertainty in the dilution factor. We cannot rule out some loss of HNO3 in the tubing connecting the permeation source to the TD-CRDS, although previous studies have shown that irreversible losses are ∼ 5 % or less under dry conditions (Neuman et al., 1999). We note that inlet loss of HNO3 is minimised under ambient sampling conditions, as only a short section (∼ 20 cm) of the quartz tubing at ambient temperature is upstream of the heated section in which HNO3 is converted to NO2. Therefore, our observations are in accord with previous studies that found the complete conversion of HNO3 to NO2 in similar set-ups (Day et al., 2002; Di Carlo et al., 2013; Wild et al., 2014; Womack et al., 2017).
3.1.4 N2O5
A sample of N2O5 was prepared by flowing 80 sccm of synthetic air over N2O5 crystals, kept at −70 ∘C, with further dilution with 20 slpm synthetic air. An 8.5 cm long nylon tube was used to reduce HNO3 impurity. Two distinct dissociation steps can be observed in Fig. 2. The first step, between 50 and 185 ∘C (in which NO2 increases to 4.2 ppbv, see Fig. S2d), is due to the dissociation of N2O5 to NO2+NO3. In the second step, in which NO3 is dissociated to NOx between 450 and 800 ∘C, the NO2 mixing ratio was 9.2 ppbv. As the amount of N2O5 derived from the first dissociation step was in accord with simultaneous measurements of N2O5 using a further TD-CRDS set-up (Sobanski et al., 2016), we conclude that some HNO3 was present in the sample, which was presumably the result of N2O5 hydrolysis. Our thermogram is similar to that reported by Womack et al. (2017), who also observed two steps – the first with a plateau at T> 100 ∘C and the second at T> 650 ∘C. The shift in temperature (100–150 ∘C) compared with our results is rationalised in Sect. 3.1.8.
3.1.5 HONO
Gaseous HONO was produced by flowing HCl in air (22 ppbv; relative humidity, RH, ca. 50 %), over a bed of continuously stirred sodium nitrate crystals (Wollenhaupt et al., 2000). In our set-up, the thermal dissociation of HONO to NO starts at ∼ 400 ∘C and reaches a plateau (6.2 ppbv) between ca. 800 and 850 ∘C (Fig. 2). We did not have access to independent instrumentation to characterise the concentrations of HONO and potential impurities generated using this method. Previous investigations have reported that HONO thermally dissociates between 450 and 650 ∘C (Perez et al., 2007) and between 200 and 700 ∘C (Wild et al., 2014). The reasons for such large divergence in the positions and widths of the thermograms may be partially related to the presence of impurities in the HONO samples used, although the details of the ovens used to thermally dissociated HONO also play an important role as described in see Sect. 3.1.8.
3.1.6 ClNO2
ClNO2 was generated by passing Cl2 (33 ppbv in air) over sodium nitrate at room temperature. The thermogram, depicted in Fig. 2, has two steps – one with an apparent plateau at ∼ 500 ∘C and a second at ∼ 800 ∘C. The lower temperature plateau in which ClNO2 dissociates to NO2 corresponds to that reported previously (Thaler et al., 2011; Sobanski et al., 2016; Thieser et al., 2016). The observation of further NO2 formation at higher temperature is consistent with the observations of Wild et al. (2014). We hypothesise, that the second dissociation step might be associated with the presence of ClNO which dissociates to NO (and would therefore not have been detected by instruments that monitor NO2 rather than NOx). Even at temperatures > 850 ∘C, we still see an increase in the NO2 signal. However, as ClNO is not considered to be an important atmospheric trace gas, this has no repercussions for the deployment of the instrument.
3.1.7 NH4NO3 and NaNO3 particles
NH4NO3 and NaNO3 particles were generated from an aqueous solution (ca. 1 g in 500 mL deionised water) using an atomiser (TSI 3076). The particles were dried prior to size selection (DMA, TSI 3080) and were diluted in a total flow of 6 slpm synthetic air which was split between a condensation particle counter (CPC) and the heated TD-CRDS inlet (after further dilution). The relative thermogram for NH4NO3 is displayed in Fig. 2 and, similar to HNO3, displays a plateau region at temperatures above 830 ∘C. The shift in the thermogram when comparing HNO3 and NH4NO3 (which we expect to detect in a two-step process in which NH4NO3 first decomposes to HNO3) may be related to the time required to fully thermally decompose particles (e.g. of 200 nm diameter) containing several million molecules. Particle numbers (in cm−3) detected by the CPC were converted to molar mixing ratios via the diameters and densities of the dry particles (1.72 g cm−3 for NH4NO3 and 2.26 g cm−3 for NaNO3). The fraction of NH4NO3 detected as NOx following passage through the oven is illustrated in Fig. S5, which indicates values between ≈60 % and 120 % depending on particle size. The total uncertainty in the concentration was estimated as 41 %, which includes 10 % uncertainty in the particle diameter (based on measured size distributions of latex calibration particles), 20 % uncertainty in the particle number (including the error in the multiple charge correction) and 10 % uncertainty in the density, due to possible differences between single crystal and bulk density. As the particle mass scales to the third order with the particle diameter, the correction for double-charged particles introduces a large uncertainty in the calculated mixing ratios, with the effect being largest in the size range between 100 and 150 nm, which probably explains the lower NH4NO3 detection efficiencies in this range. We consider the data obtained at 200 nm to be the most reliable and conclude that, similar to other TD instruments (Womack et al., 2017; Garner et al., 2020), our instrument also detects NH4NO3 particles as NO2 with close to 100 % efficiency. In contrast, our experiments using NaNO3 resulted in much smaller NOx concentrations despite identical experimental conditions in back-to-back experiments and produced detection efficiencies of close to 25 %. While the inefficient detection of NaNO3 is consistent with a previous reports suggesting that NaNO3 would not be detected in TD inlets (Womack et al., 2017), it contrasts strongly with the very recent result of Garner et al. (2020), who observed quantitative conversion of NaNO3 to NO2 at 600 ∘C. This difference may be related to residence times in the heated section of the inlet.
3.1.8 Summary of thermograms
The thermograms obtained by the present instrument deviate from others reported in the literature, with the temperatures required for 50 % dissociation generally being higher by, for example, 80 ∘C for PAN, 50 ∘C for iPN and 150 ∘C for HNO3 respectively (Day et al., 2002; Wild et al., 2014; Sobanski et al., 2016; Thieser et al., 2016; Womack et al., 2017). This lack of agreement with other set-ups is not unexpected, as the degree of dissociation of a trace gas at any temperature depends not only on the temperature but also on the time over which the molecule is exposed to that temperature (Womack et al., 2017). To illustrate this, based on rate coefficients (related to bond-dissociation energies, BDEs) for the thermal dissociation of PAN (Bridier et al., 1991), iPN (Barker et al., 1977), HNO3 (Glänzer and Troe, 1974), N2O5 (Ammann et al., 2019), ClNO2 (Baulch et al., 1981) and HONO (Tsang and Herron, 1991), we calculated the theoretical 50 % conversion temperature for each molecule as a function of residence time inside the oven (see Fig. S3b). At short residence times the dependence on temperature is very steep (especially for large BDEs) which partially explains the differences between our short heated section inlet and longer ones. However, in practise, we do not know the precise average temperature of the gas at the centre of the oven nor can we characterise the axial and radial gradients in temperature in the quartz tubes; thus, the calculations of fractional dissociation (or complete thermograms) based on bond-dissociation energies are only a rough guide at best. We note that the use of different flows, oven diameters and operational pressures will strongly affect heat transfer from the oven walls to the gas; therefore, reporting the temperature of the external oven wall (as done here and in all reports in the literature) to some extent precludes comparison between different set-ups. The width of the thermograms (i.e. the temperature difference between e.g. 10 % and 90 % dissociation) will also depend on details of axial and radial temperature gradients in the tubing located within the oven as well as in the downstream section of tubing, which represents a transition regime between oven and room temperature. The impact of temperature gradients inside the quartz tube was explored by calculating the HNO3 thermogram using an Arrhenius expression for its thermal dissociation and the gas residence time within the quartz tube. We initially assumed that all HNO3 molecules experience the same temperature and then compared this to the situation in which 20 % of the HNO3 molecules experience an 80 ∘C lower temperature and 20 % experience an 80 ∘C higher temperature. The resultant thermograms are displayed in Fig. S3c and indicate that the presence of temperature gradients results in an increase in the width of the thermogram from 250 to 350 ∘C.
The thermograms we report here serve only to determine the temperature needed to ensure the maximum conversion of each trace gas to NO2. This is achieved in the present set-up with a temperature of 850 ∘C. Where possible, we have verified that operation at the plateau of the thermogram resulted in quantitative conversion of the traces gases and particles studied, with one exception – NaNO3 particles. We further note that, in an instrument designed only to measure NOy, there is no need to ensure separation (in temperature) of the thermograms for different classes of molecules.
3.1.9 Detection of NH3
As described previously (Wild et al., 2014; Womack et al., 2017) ammonia represents a potential interference in NOy measurements. In order to quantify this interference, we measured NO2 formation in air containing 131 ppbv NH3 delivered by a calibrated permeation source (VICI METRONICS, permeation rate 324 ng min−1 at 45 ∘C). The results are summarised in Fig. 2. In NH3–air mixtures, we observe a small NO2 signal, increasing slowly at first and then (from ≈700 ∘C) rapidly with temperature; the amount of NO2 observed at 850 ∘C corresponds to a fractional conversion of NH3 to NO2 of 0.006±0.002. This result is in broad agreement with Wild et al. (2014), who found a conversion efficiency of < 0.01 at 700 ∘C. In experiments with NH3 in zero air with relative humidities of 17 %, 31 % and 53 %, we were unable to observe the conversion of NH3 to NO2, which is again consistent with the humidity-related suppression of NO2 formation observed by Wild et al. (2014).
In additional experiments, we investigated the potential influence of ozone on the NH3 to NO2 conversion efficiency in zero air containing O3. The addition of O3 results in a significant increase in NO2 with a linear dependence on the O3 mixing ratio (Fig. 3) and up to 11.4 % conversion of NH3 to NO2 at 200 ppbv O3. This was not reduced measurably by the addition of water vapour to the air–O3 mixture. In further experiments, we spiked air with the headspace of various organic liquids (acetone, methanol, ethanol, β-pinene, limonene and isoprene). The gas-phase mixing ratios of the organic trace gases were unknown, but the formation of NO2 was suppressed or completely stopped in each case. A more quantitative investigation was carried out using a known concentration (1 ppmv gas bottle) of isoprene. We found that the addition of 30 ppbv isoprene to zero air (containing 330 ppbv O3) did not significantly reduce the NH3-to-NO2 conversion efficiency under dry conditions, but it decreased it by a factor of 2 when the RH was increased to 50 %.
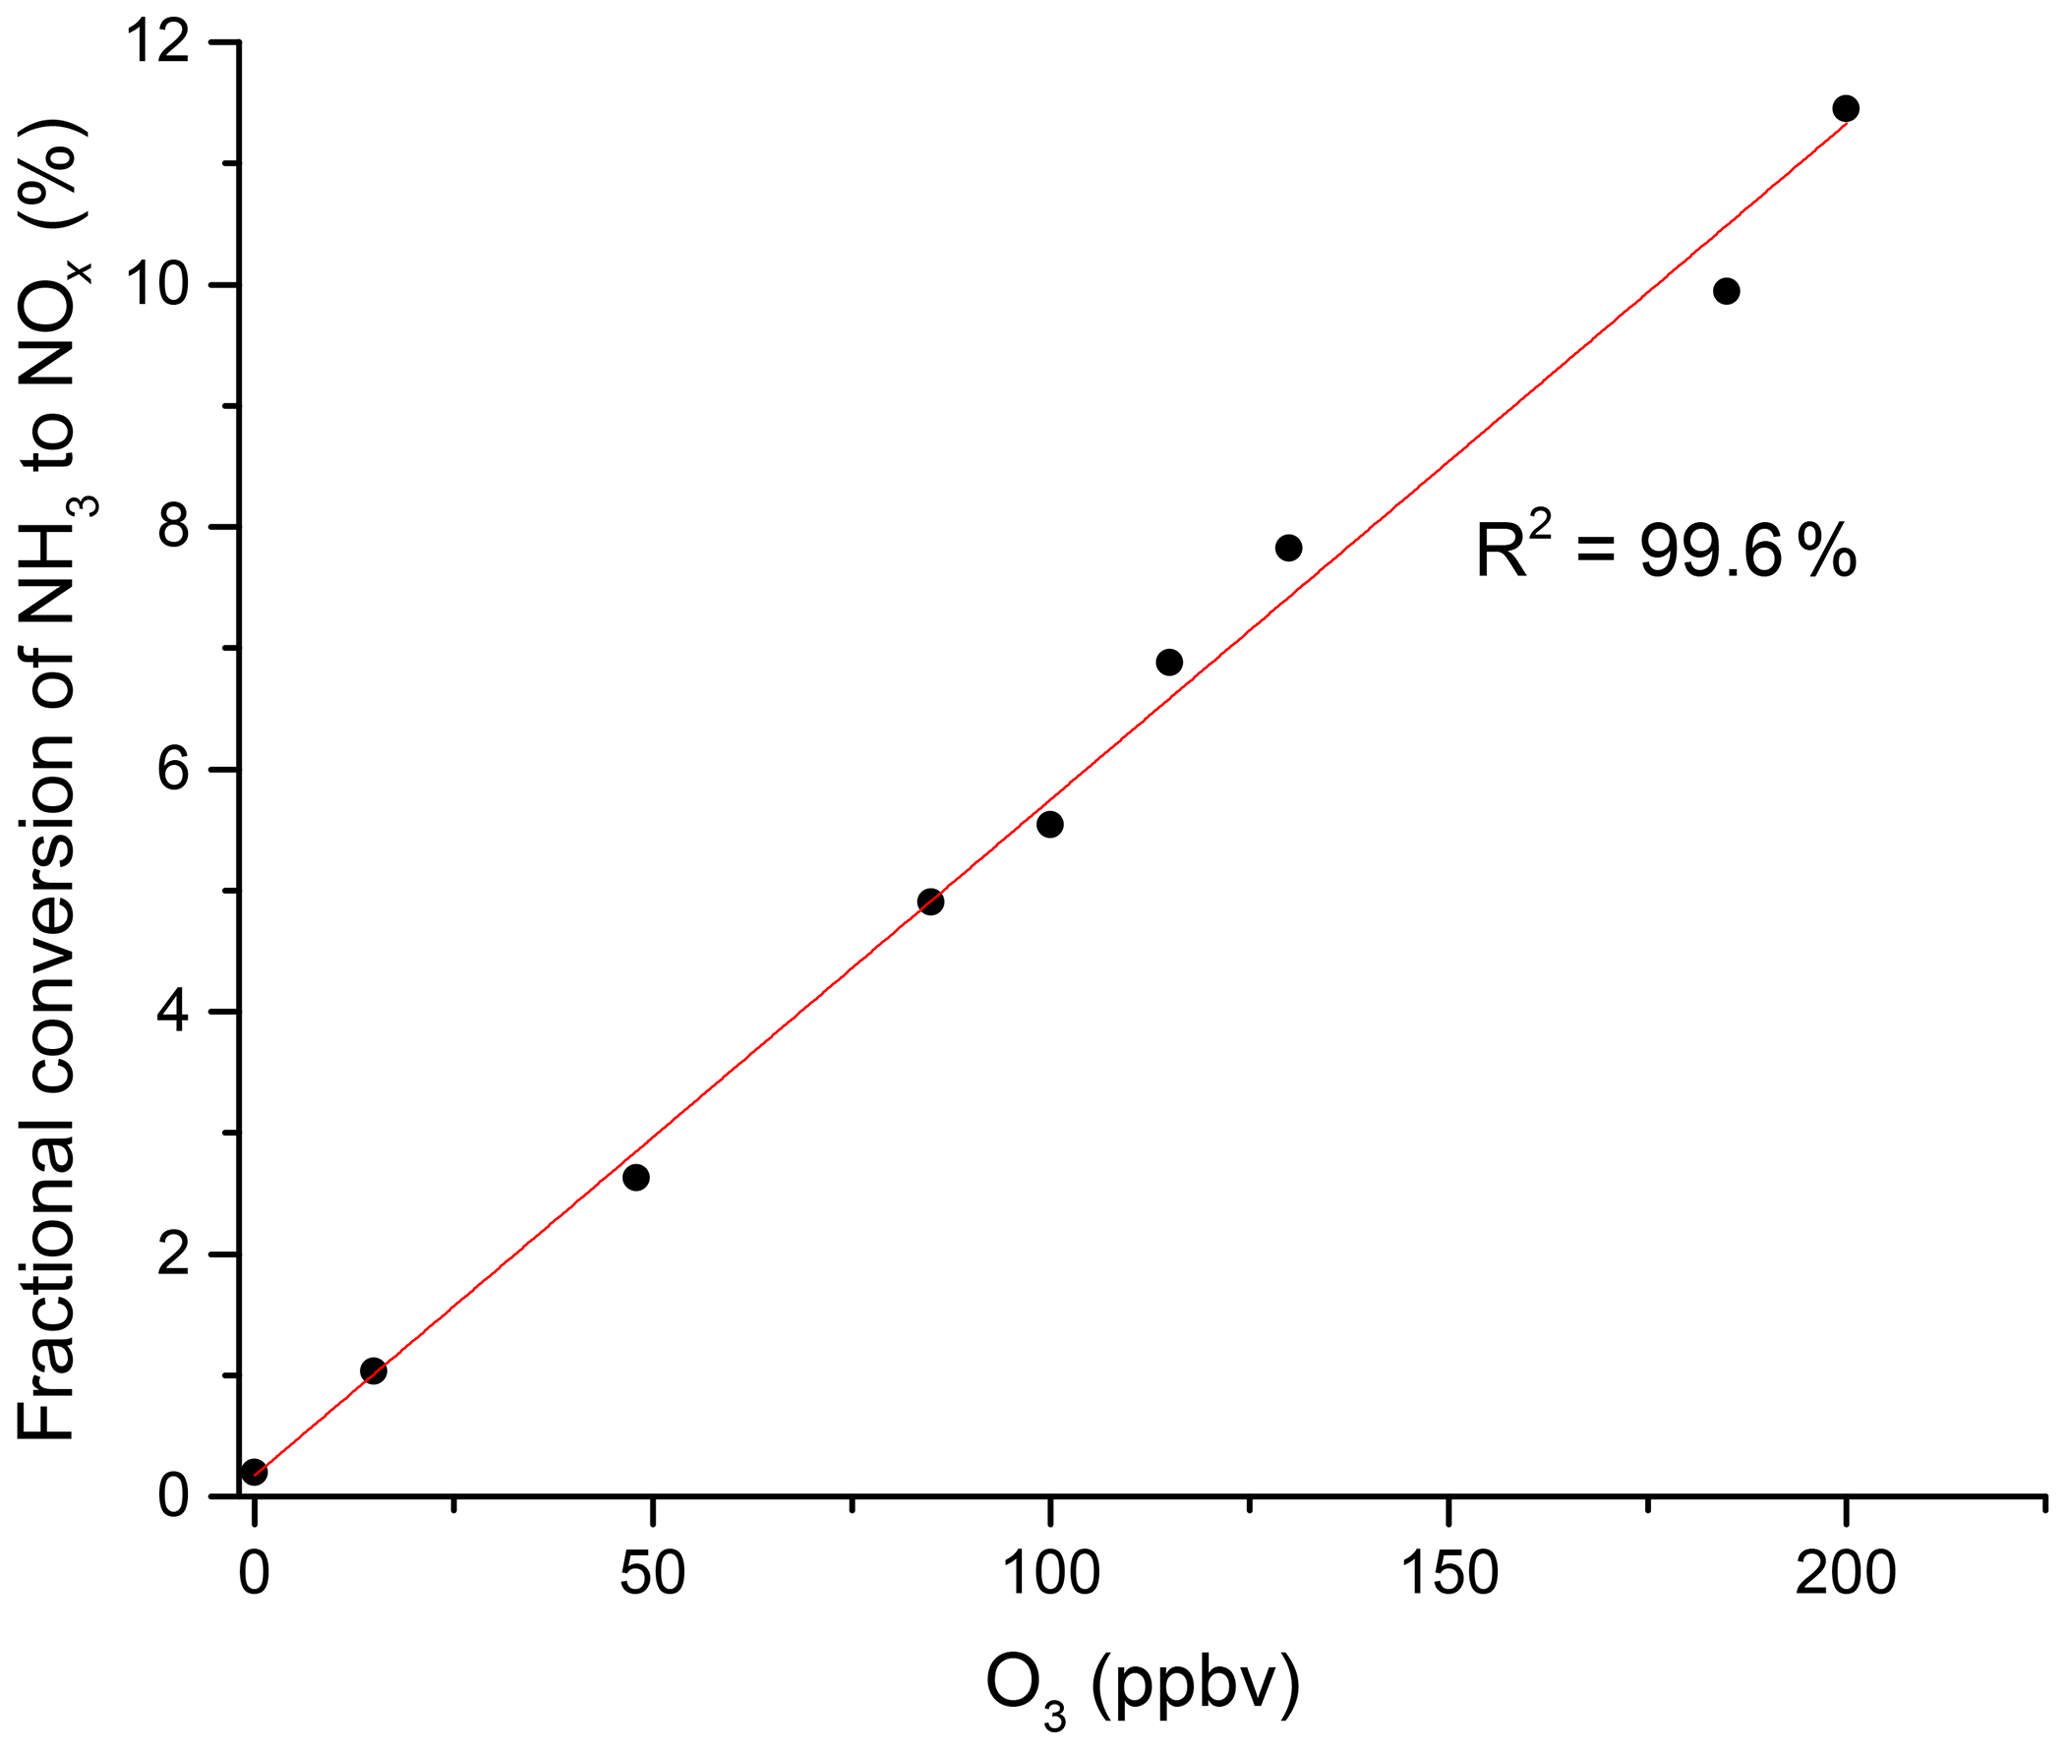
Figure 3NH3 to NOx conversion in the heated inlet channel of the instrument in the presence of O3. The fractional conversion of NH3 to NOx is calculated from the 13.1 ppmv of NH3 from the permeation source.
A tentative chemical mechanism, based partially on Womack et al. (2017), to explain the formation of NO2 from NH3 and O3 at high temperatures and the processes that suppress it is given in Reactions (R11) to (R15). In this scheme, the oxidation of NH3 is initiated and propagated by O(3P), which is formed from the thermal dissociation of O3 (Peukert et al., 2013). This leads to the formation of NO and HNO (Reaction R13a and R13b), both of which can be oxidised to NO2 (Reactions R14 and R15). Forward and reverse rate coefficients for Reaction (R11) indicate that O3 is converted almost stoichiometrically to O(3P) in the ≈10 ms reaction time in the heated inlet. The rate constants (at 1123 K) for the subsequent reactions involving O(3P) are as follows: cm3 molec.−1 s−1, cm3 molec.−1 s−1 and cm3 molec.−1 s−1) (Cohen and Westberg, 1991). Reaction (R12) converts 0.3 % of the initial NH3 molecules to NH2 within 10 ms (at 100 ppbv O3 and 1123 K).
The experimental results obtained in zero air indicate that reactions involving O(3P) from O3 thermolysis can result in the conversion of NH3 to NO and NO2. These results could, however, not be reproduced when adding NH3 to ambient air sampled from outside of the building. In this case, the addition of NH3 (at 50–60 ppbv O3) did not result in a measurable increase in NO2, which was in accord with the observations of Womack et al. (2017). The scavenging of NH2 radicals and O(3P) by both volatile organic compounds and H2O provides a likely explanation for this. Womack et al. (2017) also found that the addition of 100 ppbv CO can reduce the conversion of NH3 to NOx.
In summary, our experiments indicate that the conversion of NH3 to NO2 is suppressed in ambient air samples, or in synthetic air with added VOCs and water. The ambient air used in these experiments was from an urban and polluted environment (typical NOx levels between 10 and 50 ppbv; see Sect. 4.2). As high levels of atmospheric NH3 are associated with agricultural activity (Langford et al., 1992; Schlesinger and Hartley, 1992) and are often accompanied by high NOx and VOC levels, the NH3 interference under these conditions is most likely to be small compared with ambient NOz levels. Long-term measurements of NH3 have additionally found a positive correlation between NH3 concentrations and ambient temperature (Yamamoto et al., 1988; Wang et al., 2015; Yao and Zhang, 2016), with the latter promoting the presence of high levels of biogenic VOCs, such as isoprene (Tingey et al., 1979), which would also help to minimise the NH3-related interference.
3.2 Bias caused by secondary reactions in the TD ovens
Thermal dissociation techniques coupled to CRD systems for the measurement of organic nitrates suffer bias to different degrees owing to reactions of organic peroxy radicals with NO and NO2 (Sobanski et al., 2016; Thieser et al., 2016). According to previous studies (Day et al., 2002; Rosen et al., 2004; Thieser et al., 2016), in experiments using iPN at an oven temperature of 450 ∘C, an overestimation of ANs in the presence of NO is caused by reactions of the initially formed alkoxy radical, C3H7O, which results in the formation of both HO2 and CH3O2 (Reactions R16–R21).
In order to investigate the potential bias in the measurement of ANs under the present experimental conditions, a set of experiments was conducted in which NO (up to 12 ppbv) was added to various amounts of iPN. The NO mixing ratio was determined by modulating the addition of O3. The results (Fig. 4a) show that NO2 derived from the thermal decomposition of iPN increases with the amount of NO added and results in overestimation (factor of ∼ 1.6) at 12 ppbv NO, which is consistent with the observations by Thieser et al. (2016). This disappears when 19 ppmv ozone is added in front of the cavity so that NOx rather than NO2 is measured (blue data points). This is readily explained by the compensation of the additional NO2 formed via reactions of NO with RO2 by an equal loss in NO, which is only detected when introducing O3. This is illustrated graphically in Fig. S4.
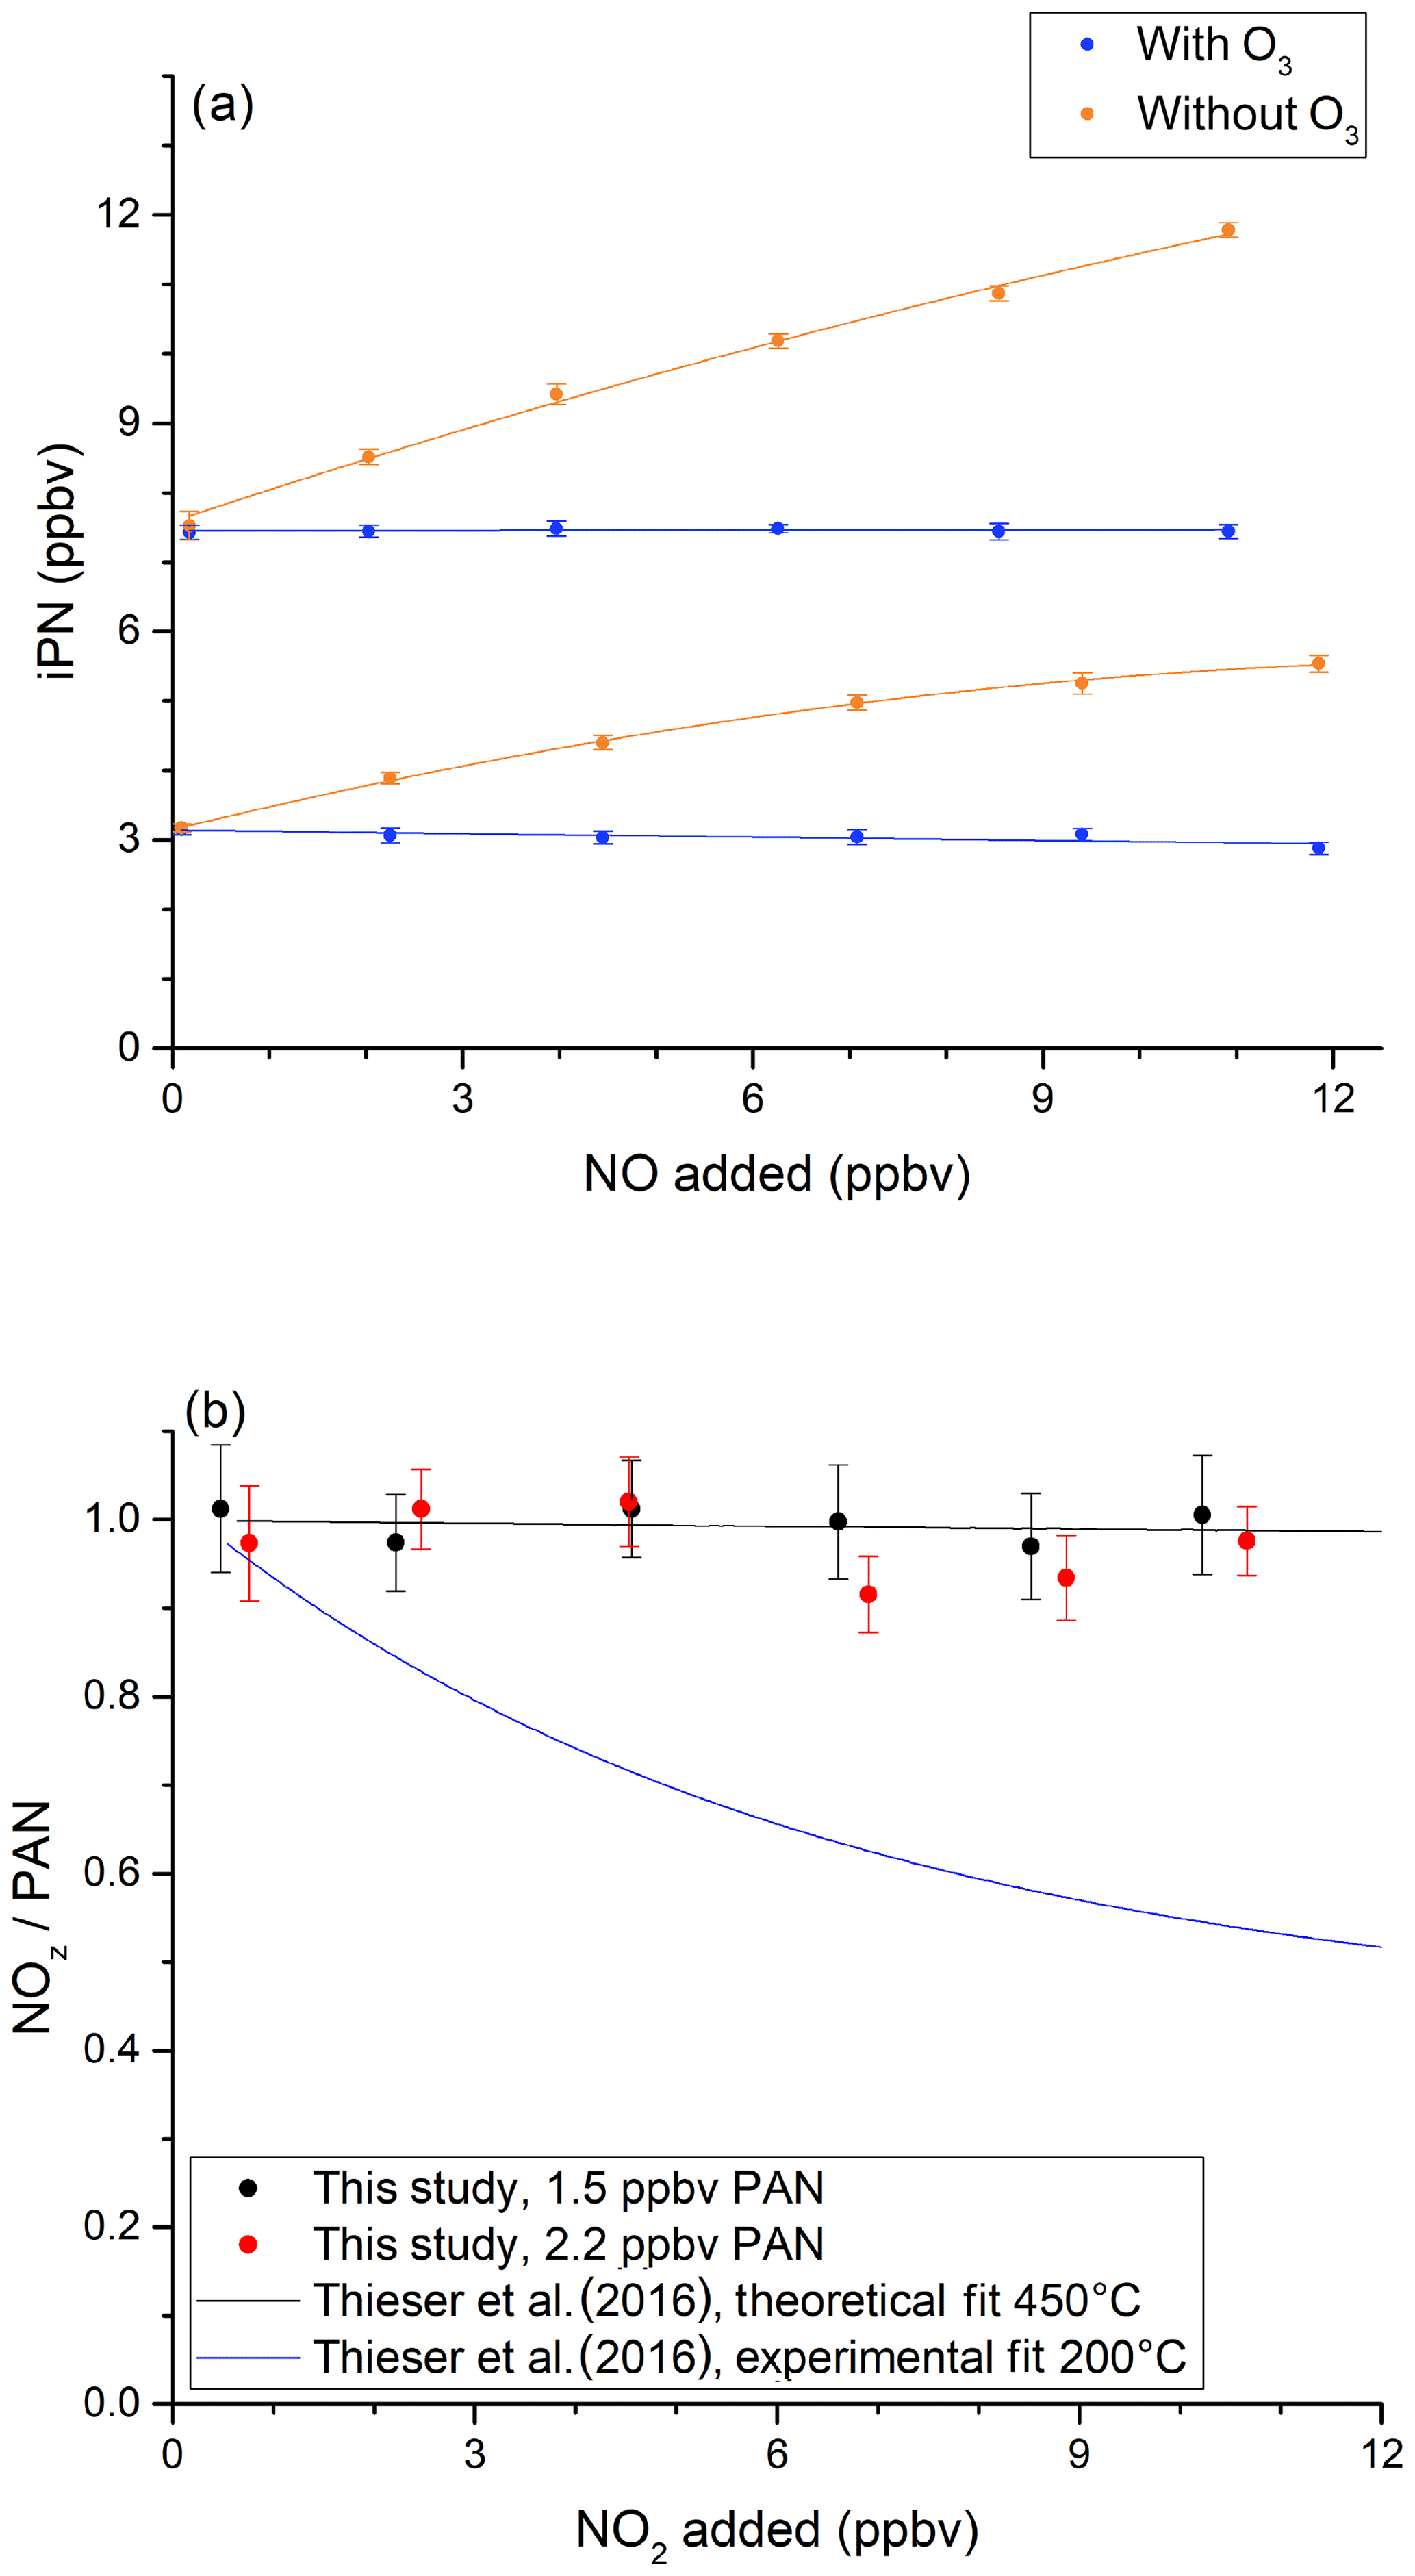
Figure 4Investigation of bias caused by reactions of NO with HO2 and RO2 when measuring iPN. (a) NO varied for two initial iPN mixing ratios in the presence (blue data points) and absence (orange data points) of added O3. The NOx background signal from the iPN cylinder was subtracted from the iPN mixing ratios. (b) The investigation of bias caused by the recombination of RO2 and NO2 during the thermal decomposition of PAN. In both experiments, the oven temperature was 850 ∘C. In both plots, the error bars indicate the standard deviation over the averaging interval.
We also explored the potential for bias caused by the recombination of CH3C(O)O2 and NO2 (Reaction R22b), following the thermal decomposition of PAN (Reaction R22a). Thieser et al. (2016) reported that PAN was underestimated by a factor 0.45 when adding 10 ppbv NO2 to an air sample containing PAN at 200 ∘C. This behaviour was not apparent at 450 ∘C, which is related to the decomposition (Reaction R23a) or isomerisation (Reaction R23b) of CH3C(O)O2 at the higher temperature. The results of a similar experiment with our 850 ∘C inlet are presented in Fig. 4b. In this plot, the measured NOz relative to the input PAN is plotted versus the mixing ratio of added NO2. For PAN concentrations from 1.5 to 2.2 ppbv, no effect was observed for NO2 concentrations of up to 10 ppbv. This is consistent with the reaction scheme presented by Thieser et al. (2016) at 450 ∘C.
A potential source of bias when measuring HNO3 includes its reformation via the reaction of OH and NO2 (Reaction R24). Compared with the RO and RO2 radicals formed in the thermal dissociation of PNs and ANs, OH exhibits a higher affinity for surfaces and is likely to be efficiently removed at the oven wall. Day et al. (2002) estimated that wall losses are the dominant OH sink and that the resulting underestimation of HNO3 would be < 2 % for NOy levels < 5 ppbv. At our oven temperature, the diffusion coefficient for OH (DOH) can be calculated according to Tang et al. (2014):
Using an average of the literature values for DOH at room temperature from Ivanov et al. (2007), 165 Torr cm2 s−1, and Bertram et al. (2001), 192 Torr cm2 s−1, a value of DOH (1123 K) = 1841 Torr cm2 s−1 was derived. The maximum rate constant for OH wall loss (assuming laminar flow) can subsequently be approximated according to Zasypkin et al. (1997):
With the radius of the oven quartz tube r (0.45 cm) and the pressure p (760 Torr), the maximum value of kwall is 44 s−1. The first-order loss rate coefficient for the reaction of OH with NO2 is given by [NO2], where k(OH+NO2) is the rate coefficient for the reaction between OH and NO2 at 1123 K cm3 molec.−1 s−1 (Ammann et al., 2019) and [NO2] molec. cm−3 (the concentration of 10 ppb NO2 at the pressure and temperature of the oven). The first-order loss rate of OH via reaction with NO2 is then s−1. Clearly, the efficiency of uptake of OH to the wall would have to be very low in order to reduce the maximum value of 44 s−1 to values that are comparable to the reaction with NO2, which is very unlikely. We conclude that reformation of HNO3 via Reaction (R24) will not bias measurements of HNO3 with the present set-up.
3.3 Denuder characterisation
The efficiency of the removal of NOy trace gases and the transmission of submicron particles was determined in a series of experiments, which are described below.
3.3.1 Transmission of ammonium nitrate particles (10–414 nm)
In order to characterise the transmission of the denuder for particles of different diameter, a constant flow of particles was generated by passing 3.3 slpm of nitrogen through an atomiser (TSI 3076) containing an aqueous solution of ammonium nitrate. The flow rate (3.3 slpm) was matched to the typical sampling flow through the denuder. A total of 0.28 slpm of the flow was sampled into a scanning mobility particle sizer (SMPS)/CPC system (TSI 3080 and TSI 3025A) to measure the number density and size distribution (10–414 nm) of the ammonium nitrate particles. The flow was delivered either directly to the SMPS/CPC via straight metal tubing (length 27 cm, inner diameter 0.9 cm), for which we assume 100 % particle transmission, or via the denuder. Thus, the ratio of the particle numbers in each size bin represents the size-dependent denuder transmission. As shown in Fig. 5, the transmission of the denuder is > 80 % for particles between 30 and 400 nm in diameter. As expected, some diffusive loss is observed for particles < 20 nm in diameter and loss due to impaction and/or settling is observed for particles >300 nm. The particle transmission T as a function of particle diameter D can be represented by the following empirical expression:
The particle transmission through the denuder channels was also calculated using the Particle Loss Calculator (PLC) developed by von der Weiden et al. (2009). The results of this calculation are plotted in Fig. 5. The observed loss of particles smaller than 40 nm is not replicated by the PLC, which was developed for cylindrical piping and not for the square honeycomb shape of the denuder; thus, it does not consider losses due to impact at the finite surface area which the gas and particle flow is exposed to at the entrance to the honeycomb. The PLC does a better job at predicting a reduction in transmission for the largest particles that we measured, indicating a transmission of 74 % at 1 µm and 45 % at 2 µm. Therefore, in certain environments, nitrate associated with coarse-mode particles represents a potential bias for TD-CRDS measurements of NOy.
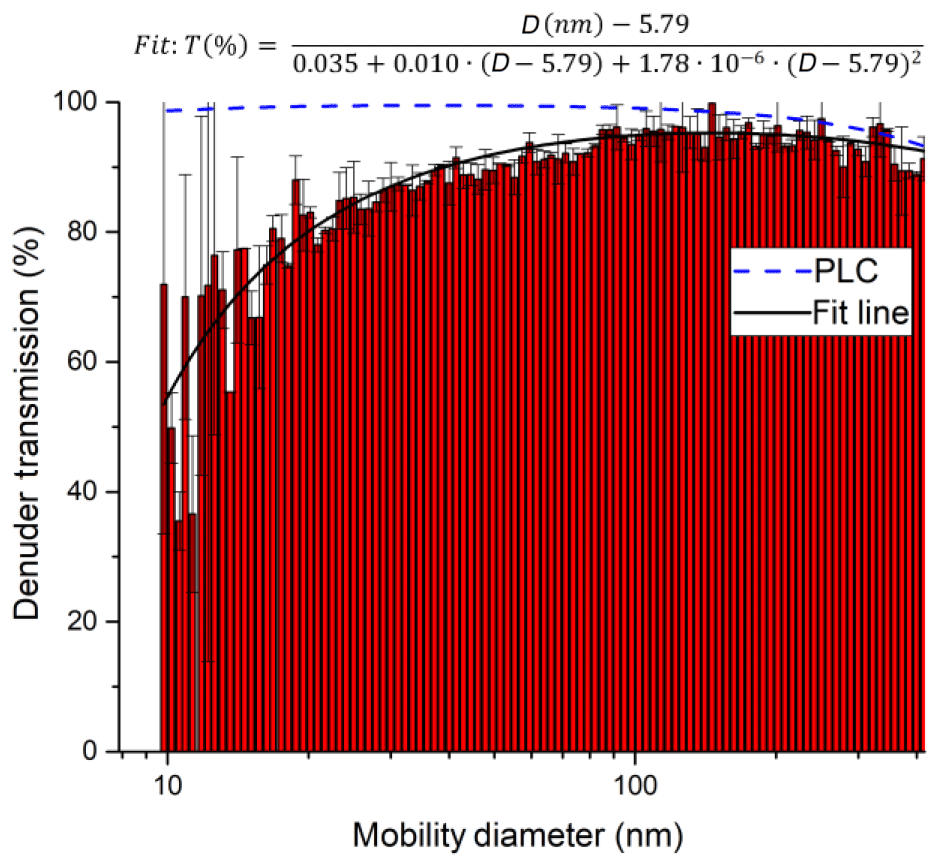
Figure 5Transmission of ammonium nitrate particles through the denuder inlet. Relative transmissions are derived by dividing the number size distribution when sampling through the denuder by a size distribution obtained without the denuder. Error bars are based on the standard deviation of three consecutive measurements with and without the denuder. An aerosol flow of 3.3 slpm was directed through the denuder (diameter 3 cm, see Sect. 2.4), and a DMA subsequently sampled 0.3 slpm from the stream exiting the denuder. The plot also includes a fit of the experimental (solid, black line) data and a theoretical transmission distribution computed with the Particle Loss Calculator (PLC).
3.3.2 Efficiency of removal of NOy trace gases
The efficiency of the removal of trace gases in the denuder under typical flow conditions (3.3 slpm) was investigated for NO, NO2, PAN, iPN, HONO, N2O5, ClNO2 and HNO3 as representative NOy species. The efficiency of removal of each trace gas (generally present at 5–40 ppbv) was determined by measuring its relative concentration when flowing through the denuder (pNit channel) and when bypassing the denuder (NOy channel). The results (Fig. 6) indicate that, in dry air, all of these trace gases were removed with an efficiency of close to 100 %. However, when the main dilution flow was humidified, RH-dependent breakthrough of NO was observed, with only 60 % stripped from the gas phase at an RH close to 100 %. HONO was removed with 85 % efficiency at an RH of 46 %, and ClNO2 was removed with a 75 % efficiency at an RH of 60 %. In contrast, humidification only had a marginal effect on the scrubbing efficiency for NO2, iPN and HNO3, for which an efficiency of ≥ 95 % was observed. The precise values that the removal efficiencies in Fig. 6 were determined from are listed in Table S2.
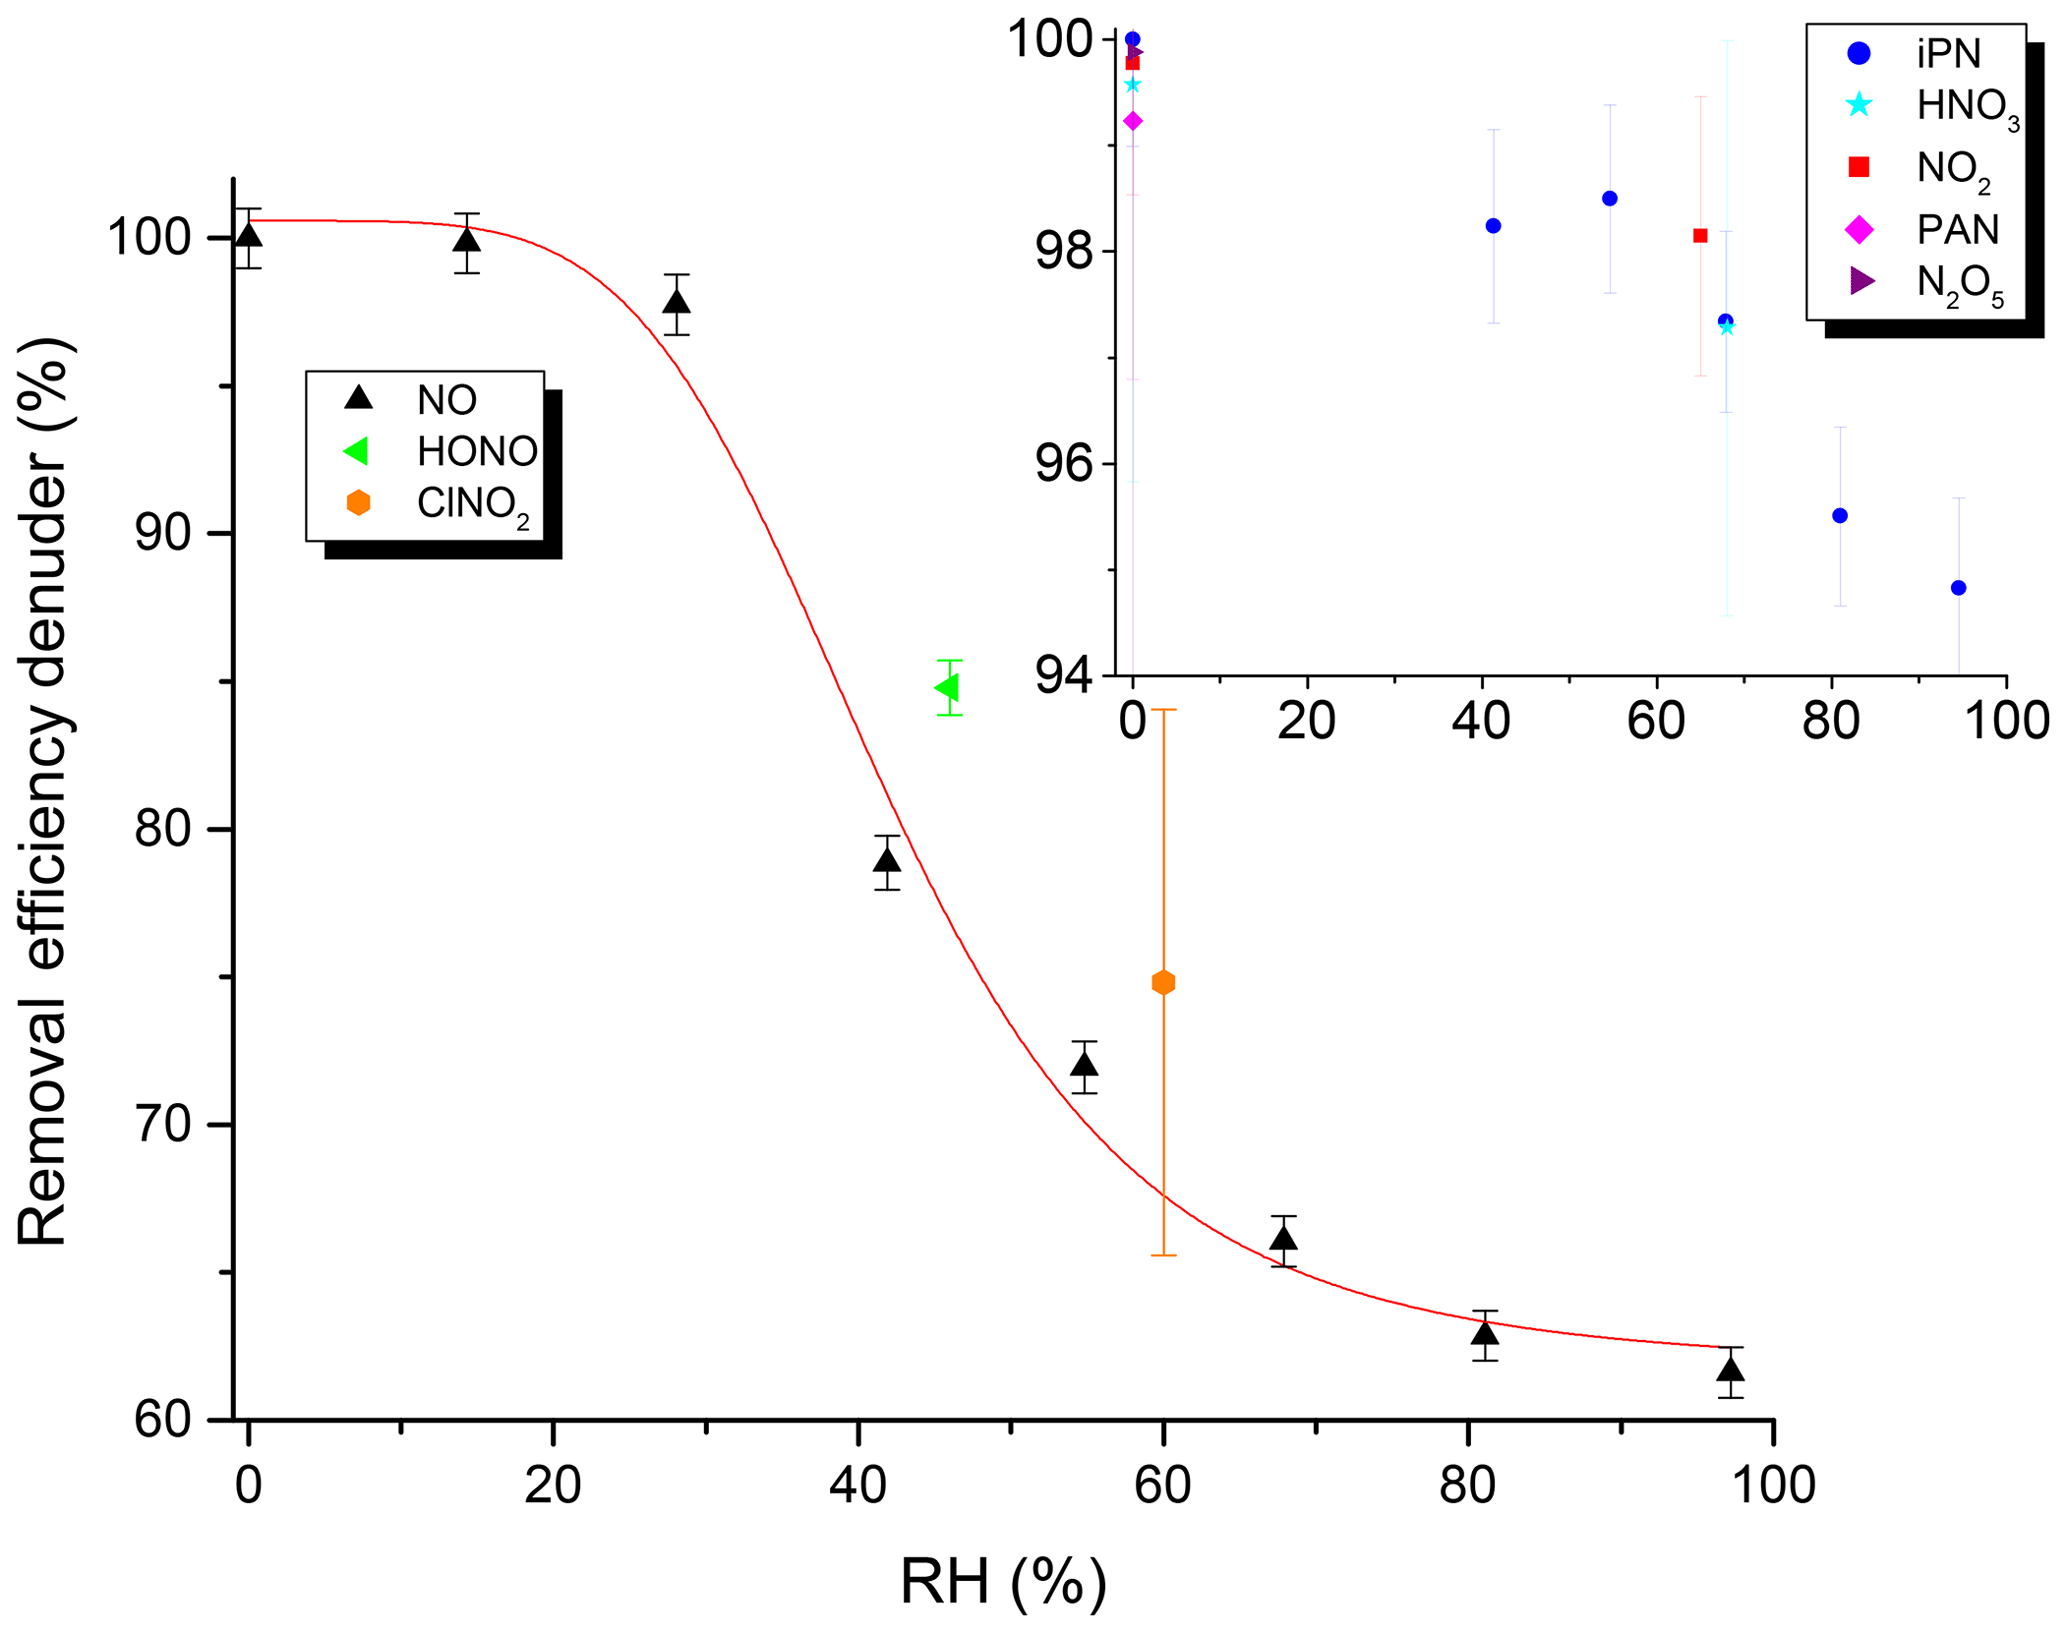
Figure 6Removal efficiency of the denuder for various NOy trace gases as a function of RH. Units of the inset are identical to the main graph. See Table S2 for the exact values and information on the error determination.
In further experiments, we examined the potential for re-release of NOy that had previously been stored in the activated carbon substrate of the denuder. In these experiments, in which either NOx or NOy was continuously monitored, the denuder was exposed to a flow of 9.5 ppm iPN in dry nitrogen for 90 min during which 2.30 ×10¹⁷ molecules of iPN were stripped from the gas phase and deposited onto the denuder. This exposure is equivalent to a month-long exposure to 20 ppb of iPN. The air passing through the denuder was subsequently humidified to an RH of 65 %. The results (Fig. 7a) indicate a high initial (11:40–11:50 UTC) rate of release of NOx under humid conditions (resulting in a maximum mixing ratio of 2 ppbv at 11:45 UTC). At 11:50 UTC, humidification of the air was stopped and the rate of release of NOx dropped gradually towards zero. During a second period, in which the air was again humidified (from 11:50 UTC onwards), NOx was released from the denuder, albeit at a lower rate than during the first humidification. From 12:25 UTC onwards, the oven behind the denuder was heated to 850 ∘C so that NOy was added. No significant increase in NO2 was observed, indicating that the trace gas(es) species released from the denuder surface upon humidification are predominantly NOx. During this experiment, 2.55 ×10¹⁵ molecules of NOx desorbed from the denuder, indicating that the major fraction of iPN molecules remained stored on the denuder surface upon humidification.
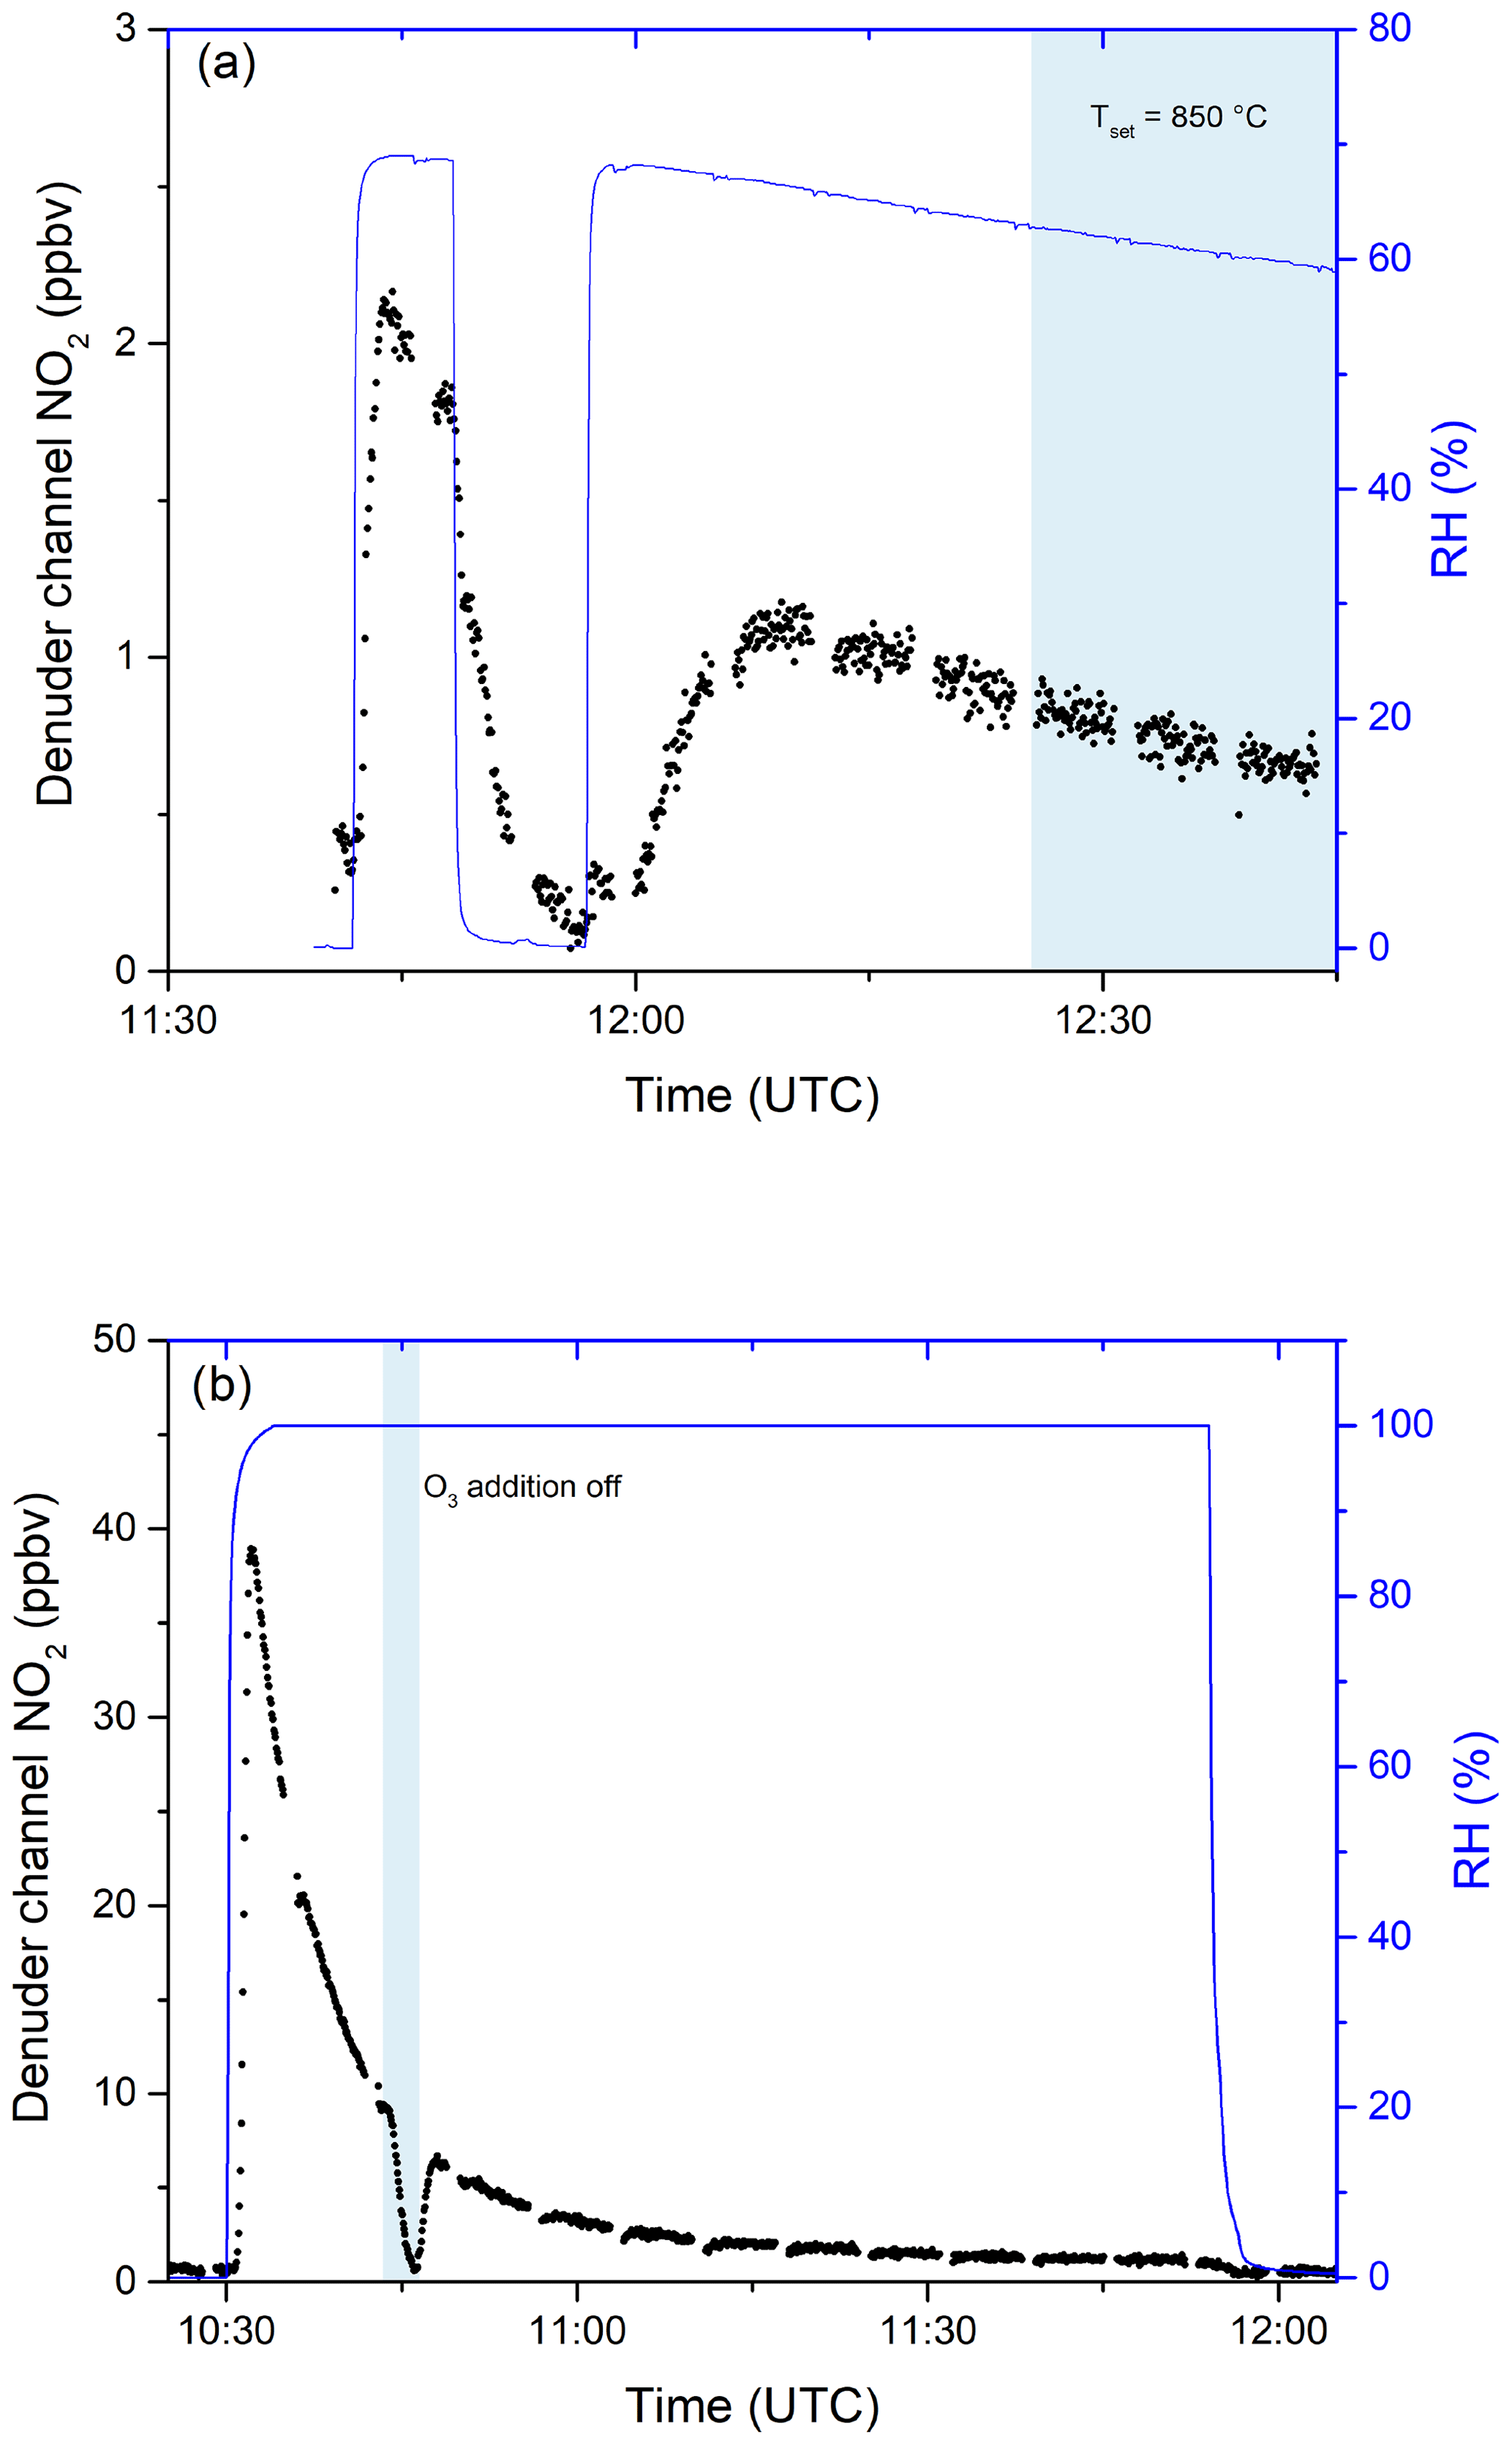
Figure 7(a) Release of NOx from the denuder in humid air after exposure to 9.5 ppmv iPN for 1.5 h. Relative humidity was measured before passing through the denuder. The blue shaded area signifies the period in which the inlet oven was heated to 850 ∘C. Changes in RH are achieved by flowing parts of the zero air stream through deionised water. (b) The release of NOx from the denuder in humid air after exposure to 0.83 ppmv NO2 for 4.8 d. O3 addition was switched off during the blue shaded period.
Similar denuder exposure experiments were performed with HNO3 and NO2. For HNO3, no evidence for desorption of NOx or NOy during exposure to humidified air was observed, whereas NO2 exhibited a similar behaviour to iPN (Fig. 7b). After loading the denuder with 5 sccm from a 0.831 ppm NO2 gas bottle for 4.8 d (a total of 7.60×10¹⁷ molecules were deposited as derived from the flow rate, the exposure time and the gas bottle mixing ratio), the effect of passing humidified air through the denuder was to release NOx, which was observed at concentrations up to ≈39 ppbv. While the relative humidity was kept constant at close to 100 %, the NOx released decreased over time so that after 30 min, 3.2 ppbv of NOx could still be detected. By switching the O3 source off (at ≈10:45 UTC), the NO2 measured went to ≈0, indicating that predominantly NO was released (and not NO2). Integrating these results over time yielded a value of 1.63×10¹⁶ molecules desorbed NO from the denuder surface in humid air. Qualitatively similar results, i.e. humidity-induced formation and release of NOx from the denuder, were observed when the denuder was exposed to variable levels of NOx (i.e. up to 20 ppbv) under dry conditions for periods of weeks.
Clearly, adsorption of water molecules onto the denuder surface can initiate and/or catalyse chemical transformation at the surface that convert stored NOz into forms which can desorb and be detected as NOx. To further our understanding of the underlying processes that occur upon humidification, a series of experiments were conducted to examine the adsorption of water on the denuder. In these experiments, the denuder was first dried by exposing it to dry air for several hours until the relative humidity of the air exiting the denuder was close to zero. Subsequently, humidified air was passed through the denuder and the RH of air exiting it was continuously monitored. The results of an experiment in which the air was humidified to 68 % are shown in Fig. 8a. After 77 min of exposure to this humidity, the RH of the air exiting the denuder acquired a maximum value of 64 %. After switching back to dry synthetic air (at 09:37 UTC), ∼ 60 minutes passed before the RH dropped to values close to zero. In this period, the RH did not decrease monotonically, with the rate of change of relative humidity exiting the denuder revealing a number of discreet steps. Figure 8b plots the derivatives (dRH/dt) of the drying phases of a series of experiments in which the initial RH was varied between 47 % and 75 %. A similar pattern emerges for each experiment with the greatest desorption rates occurring at the beginning of the drying phase followed by a minimum in the desorption rate and a second maximum (at ≈15 % relative humidity). This behaviour is a clear indication that H2O is bound to more than one chemically or physically distinct surface sites on the activated carbon.
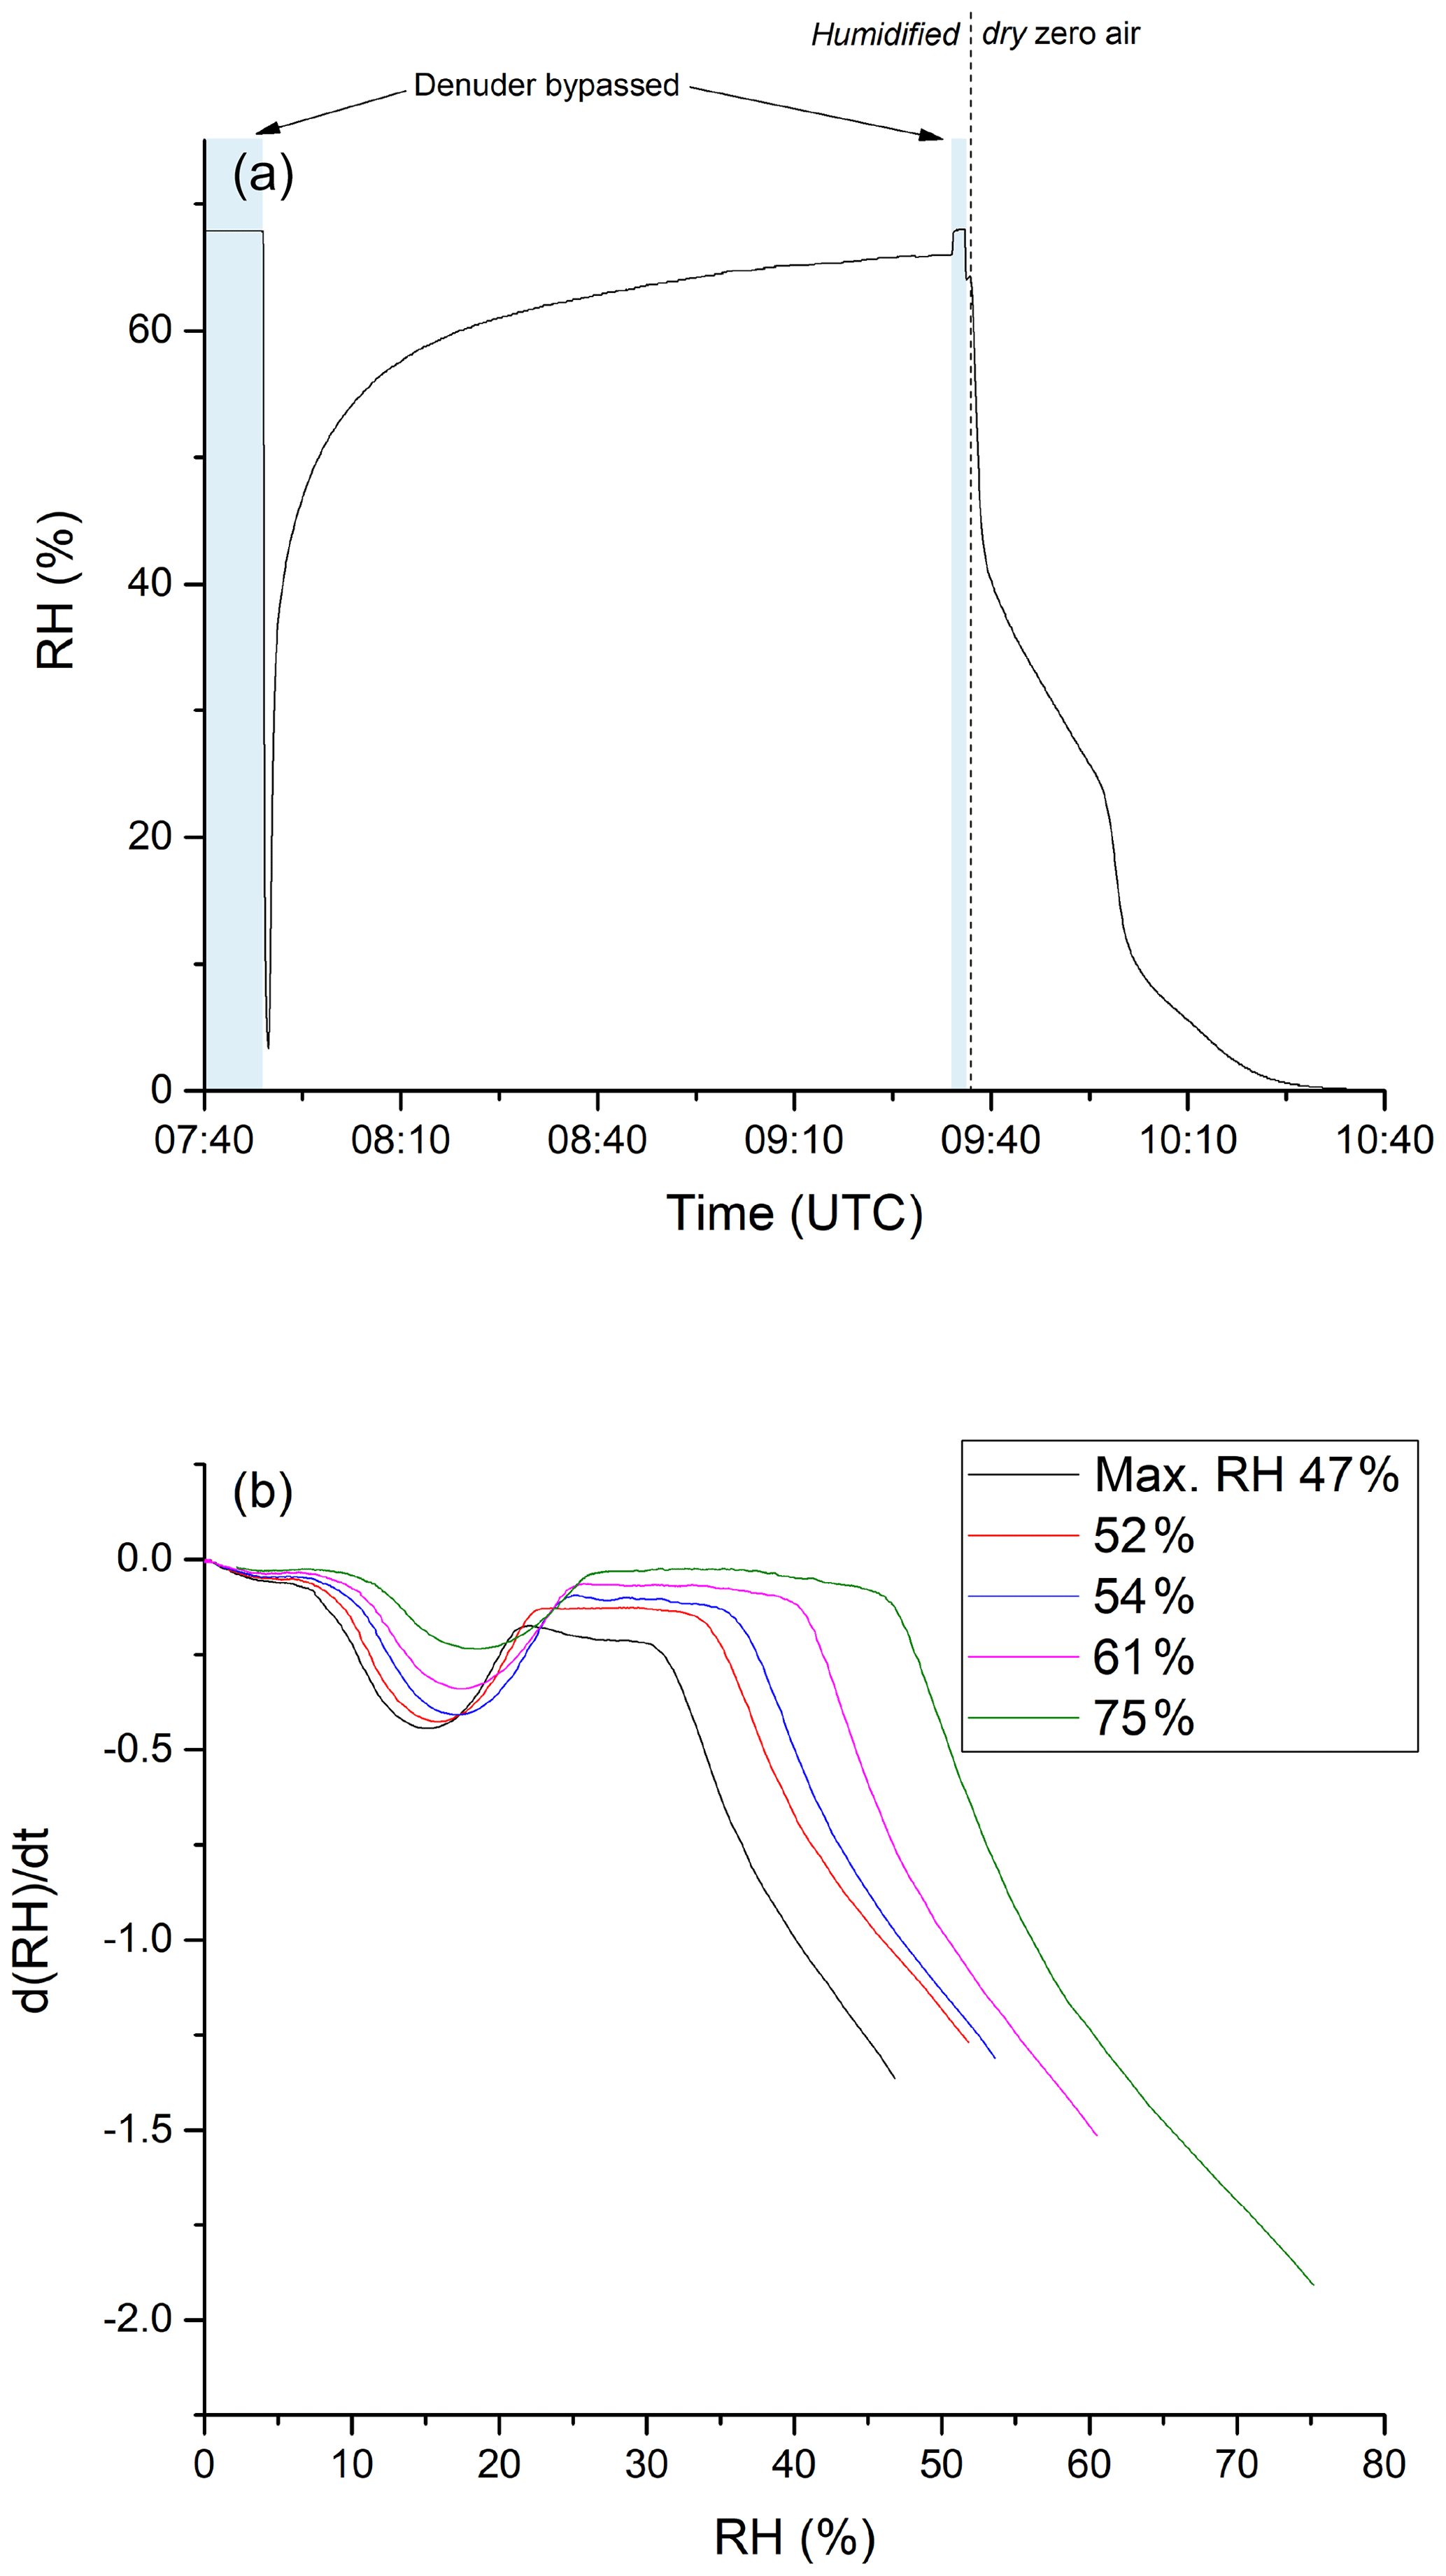
Figure 8(a) RH of humidified zero air after passing through the denuder. The initial RH was determined by bypassing the denuder before and after the experiment. Zero air was humidified by flowing a fraction of the stream through deionised water stored in a glass vessel. The time at which the experiment was conducted is given on the x axis. Until ca. 09:35 UTC, zero air with constant humidity (RH ca. 68 %) was sent through the denuder. Afterwards the denuder was exposed to dry zero air. (b) Derivative of the measured RH during the drying period. The step during the drying phase occurs in a higher RH area when starting the drying from a larger RH value.
By measuring the change in the RH of the air flowing into and out of the denuder, we can derive an equilibrium adsorption isotherm for H2O at the active carbon surface. An example is given in Fig. 9 where it is also compared to a literature isotherm for the adsorption of water vapour on activated carbon fibre (Kim et al., 2008). The data of Kim et al. (2008) have been scaled by matching the number of adsorbed water molecules at an RH of 65.9 % to our observed value at an RH of 67.2 %. The exposure of carbonaceous surfaces to inert gases at high temperatures (2000 ∘C) reduces the capacity for water uptake, whereas functionalising the carbon surface with oxygen-containing groups (e.g. from HNO3) enhances the water adsorption capacity (Dubinin et al., 1982; Barton and Koresh, 1983; Liu et al., 2017). Thus, in our experiments, the uptake of gas-phase NOy is expected to generate oxygenated sites on our denuder surface, which, in turn, will influence water uptake and subsequent further trace gas accommodation.
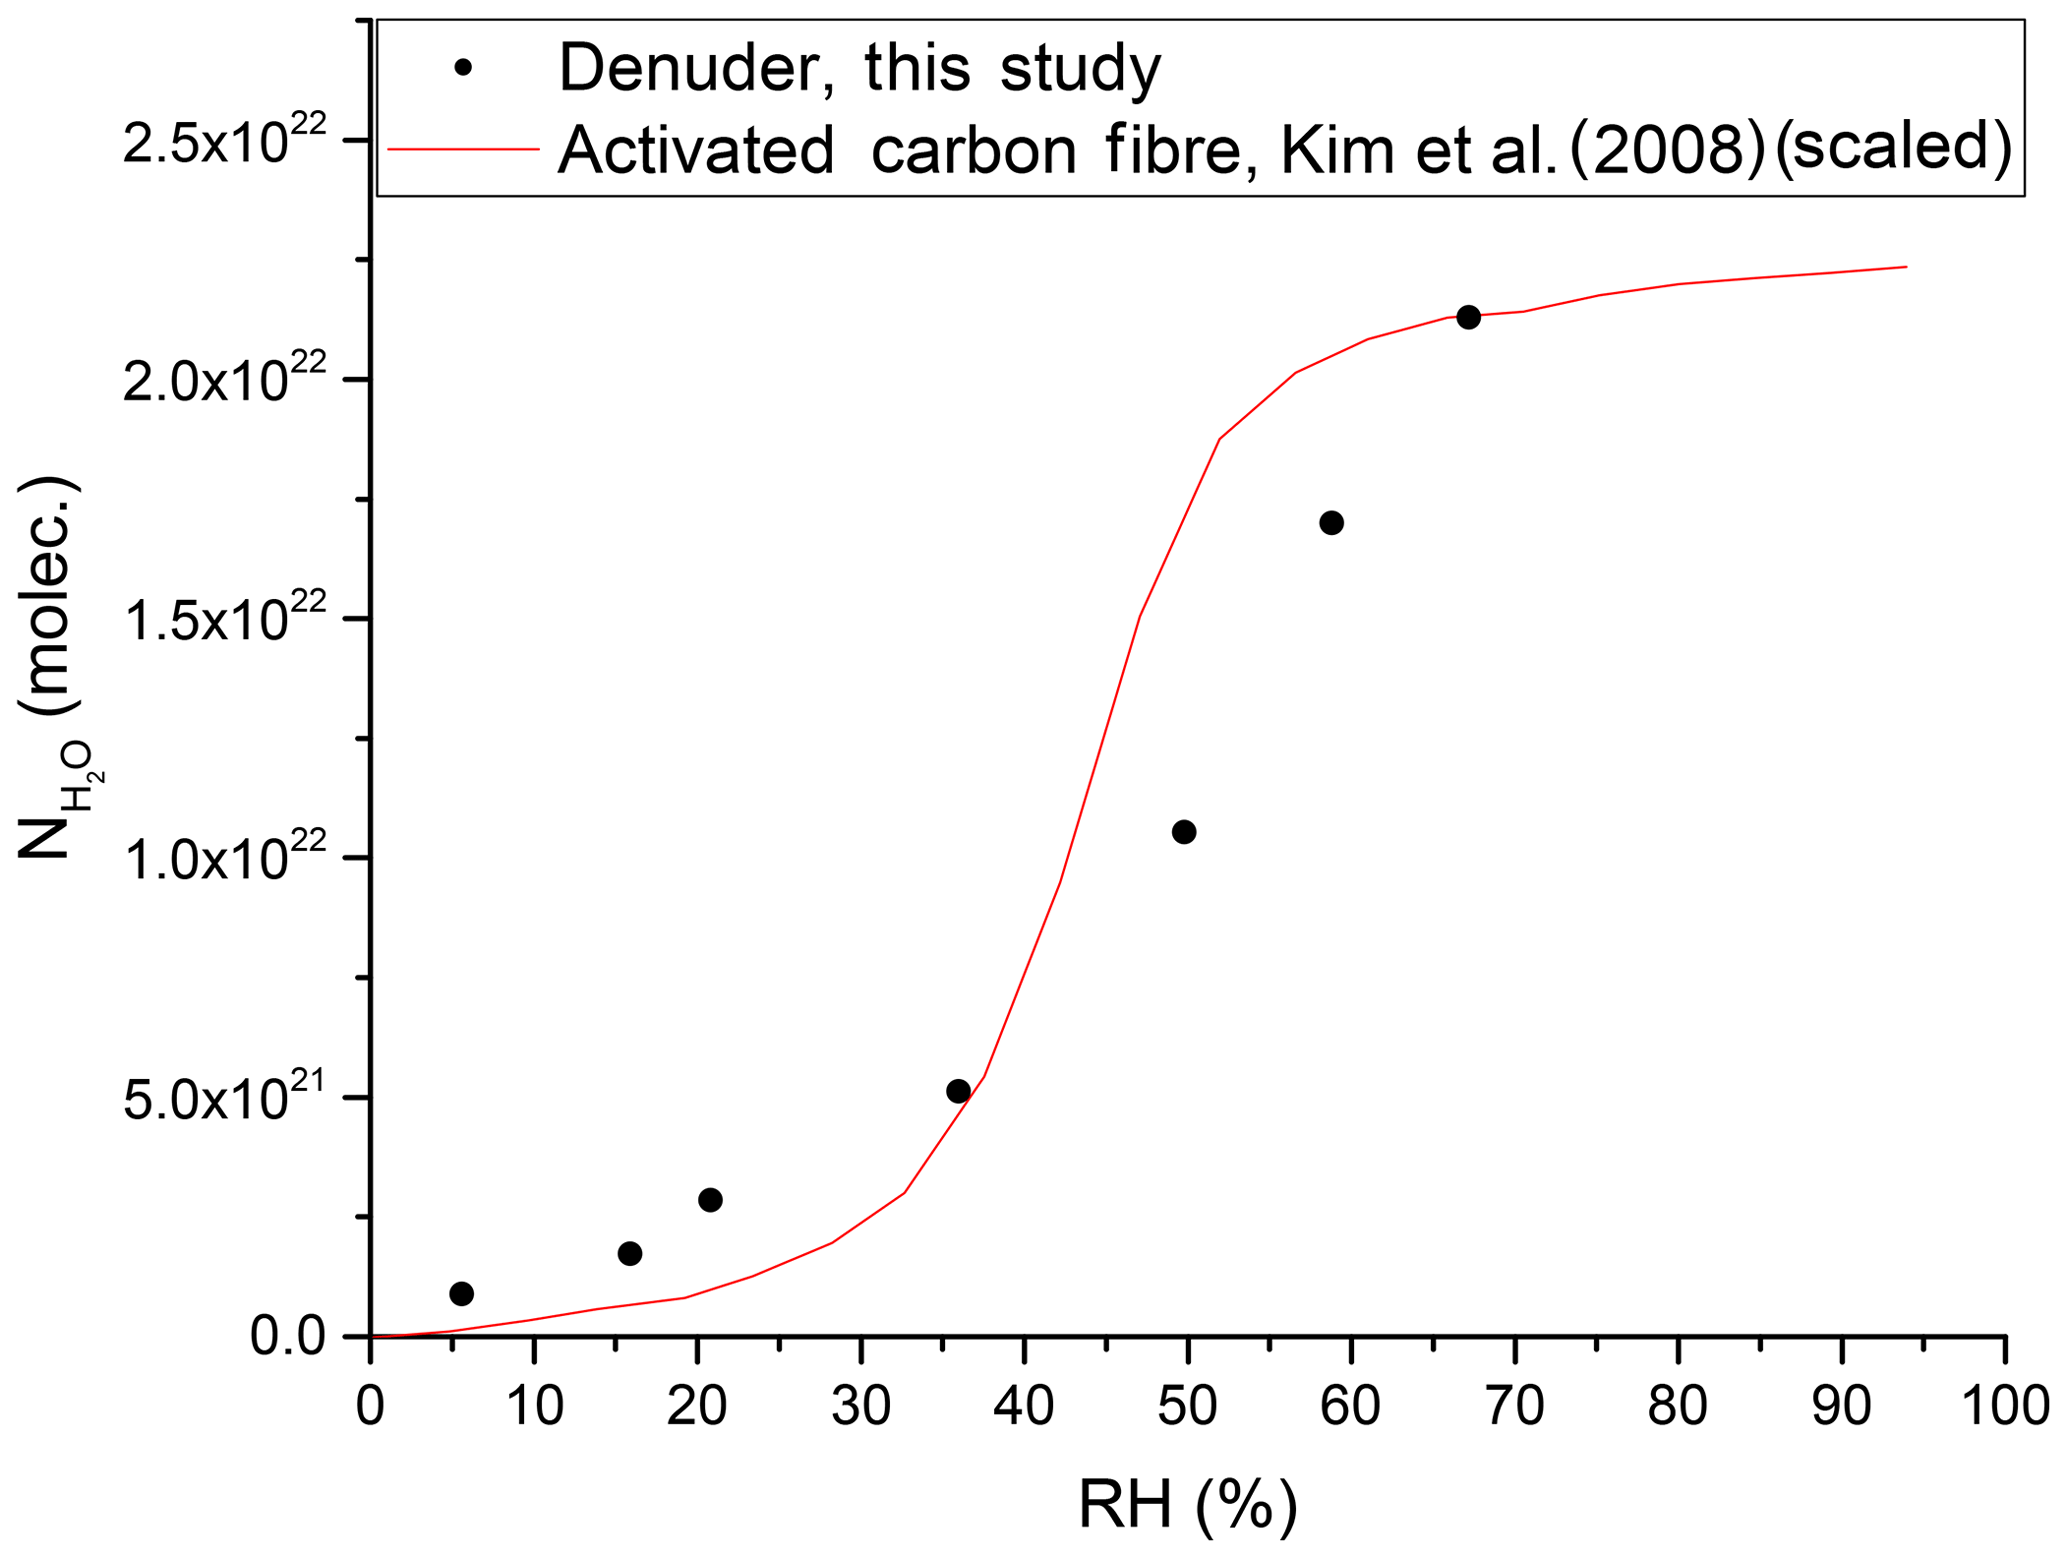
Figure 9Number of adsorbed water molecules onto the denuder surface at equilibrium versus RH. The red line represents (scaled) results from a study on activated carbon fibre (Kim et al., 2008).
The chemistry leading to the formation of gas-phase NOx from NOy trace gases adsorbed at the denuder surface under humid conditions cannot be elucidated in detail with our experimental set-up. However, a strong humidity dependence in the heterogeneous generation of HONO and NO from NO2 adsorbed on soot particles has been reported (Kalberer et al., 1999; Kleffmann et al., 1999). Formation of HONO from NOx has also been observed on wet aerosol and ground surfaces in field studies (Lammel and Perner, 1988; Notholt et al., 1992). Previous investigations report the adsorption of NO2 on activated carbon at ambient or close to ambient temperatures (30–50 ∘C), followed by its reduction to NO, with the simultaneous oxidation of the carbon surface (Shirahama et al., 2002; Zhang et al., 2008; Gao et al., 2011). These results are consistent with our observation of processes such as the conversion of NO2 to NO at the denuder surface under humid conditions. In our experiments, we observed that NO2 was converted to NO (rather than HONO) at the denuder surface. It is possible that the initial step is the formation of HONO (e.g. by the surface-catalysed hydrolysis of NO2 or iPN) which undergoes further reduction on the surface to NO. The release of HONO and NO has also been observed from soil, after the nitrification of or the reduction of (Su et al., 2011; Pilegaard, 2013; Meusel et al., 2018). Oswald et al. (2013) found comparable HONO and NO emission fluxes from non-acidic soils, providing another example of the heterogeneous formation of HONO from other atmospheric nitrogen species, followed by the gas-phase release of NO.
We conclude that the use of this denuder type (and the assumption of complete removal of gaseous NOy) may potentially result in a positive bias in measurements of particle nitrate owing to the variable breakthrough and release of NOx (dependent on the historical exposure of the denuder and relative humidity). Our findings may be applicable (at least in a qualitative sense) to similar denuders using activated carbon surfaces, and careful characterisation of the NOy components' capacity to adsorb, breakthrough and release should be carried out prior to use in the field.
Reliable surface reactivation techniques for similar denuders would be useful to ensure continuous, efficient scrubbing of NOy and NOx and circumnavigate the potential overestimation of pNit. In this regard, attempts to “reactivate” the denuder by cleaning with distilled water, drying at 50 ∘C and exposure to ca. 300 ppbv O3 for 1 h did not result in an improvement of the direct NO breakthrough or in the background pNit signal upon humidification. Surface-sensitive spectroscopic investigation of the water-induced transformation of organic and inorganic NOy to NOx (and its subsequent release to the gas phase) on denuder surfaces would be useful in resolving these issues.
3.4 Comparison of the TD-CRDS with existing methods for NOx and NOy and instruments
In this section, our instrument's performance is compared to other methods for NOx and NOy detection. We consider only instruments that measure NOx and/or NOy and not those that measure individual trace gases from each family.
Table 1Comparison of NOx and/or NOy measurements.
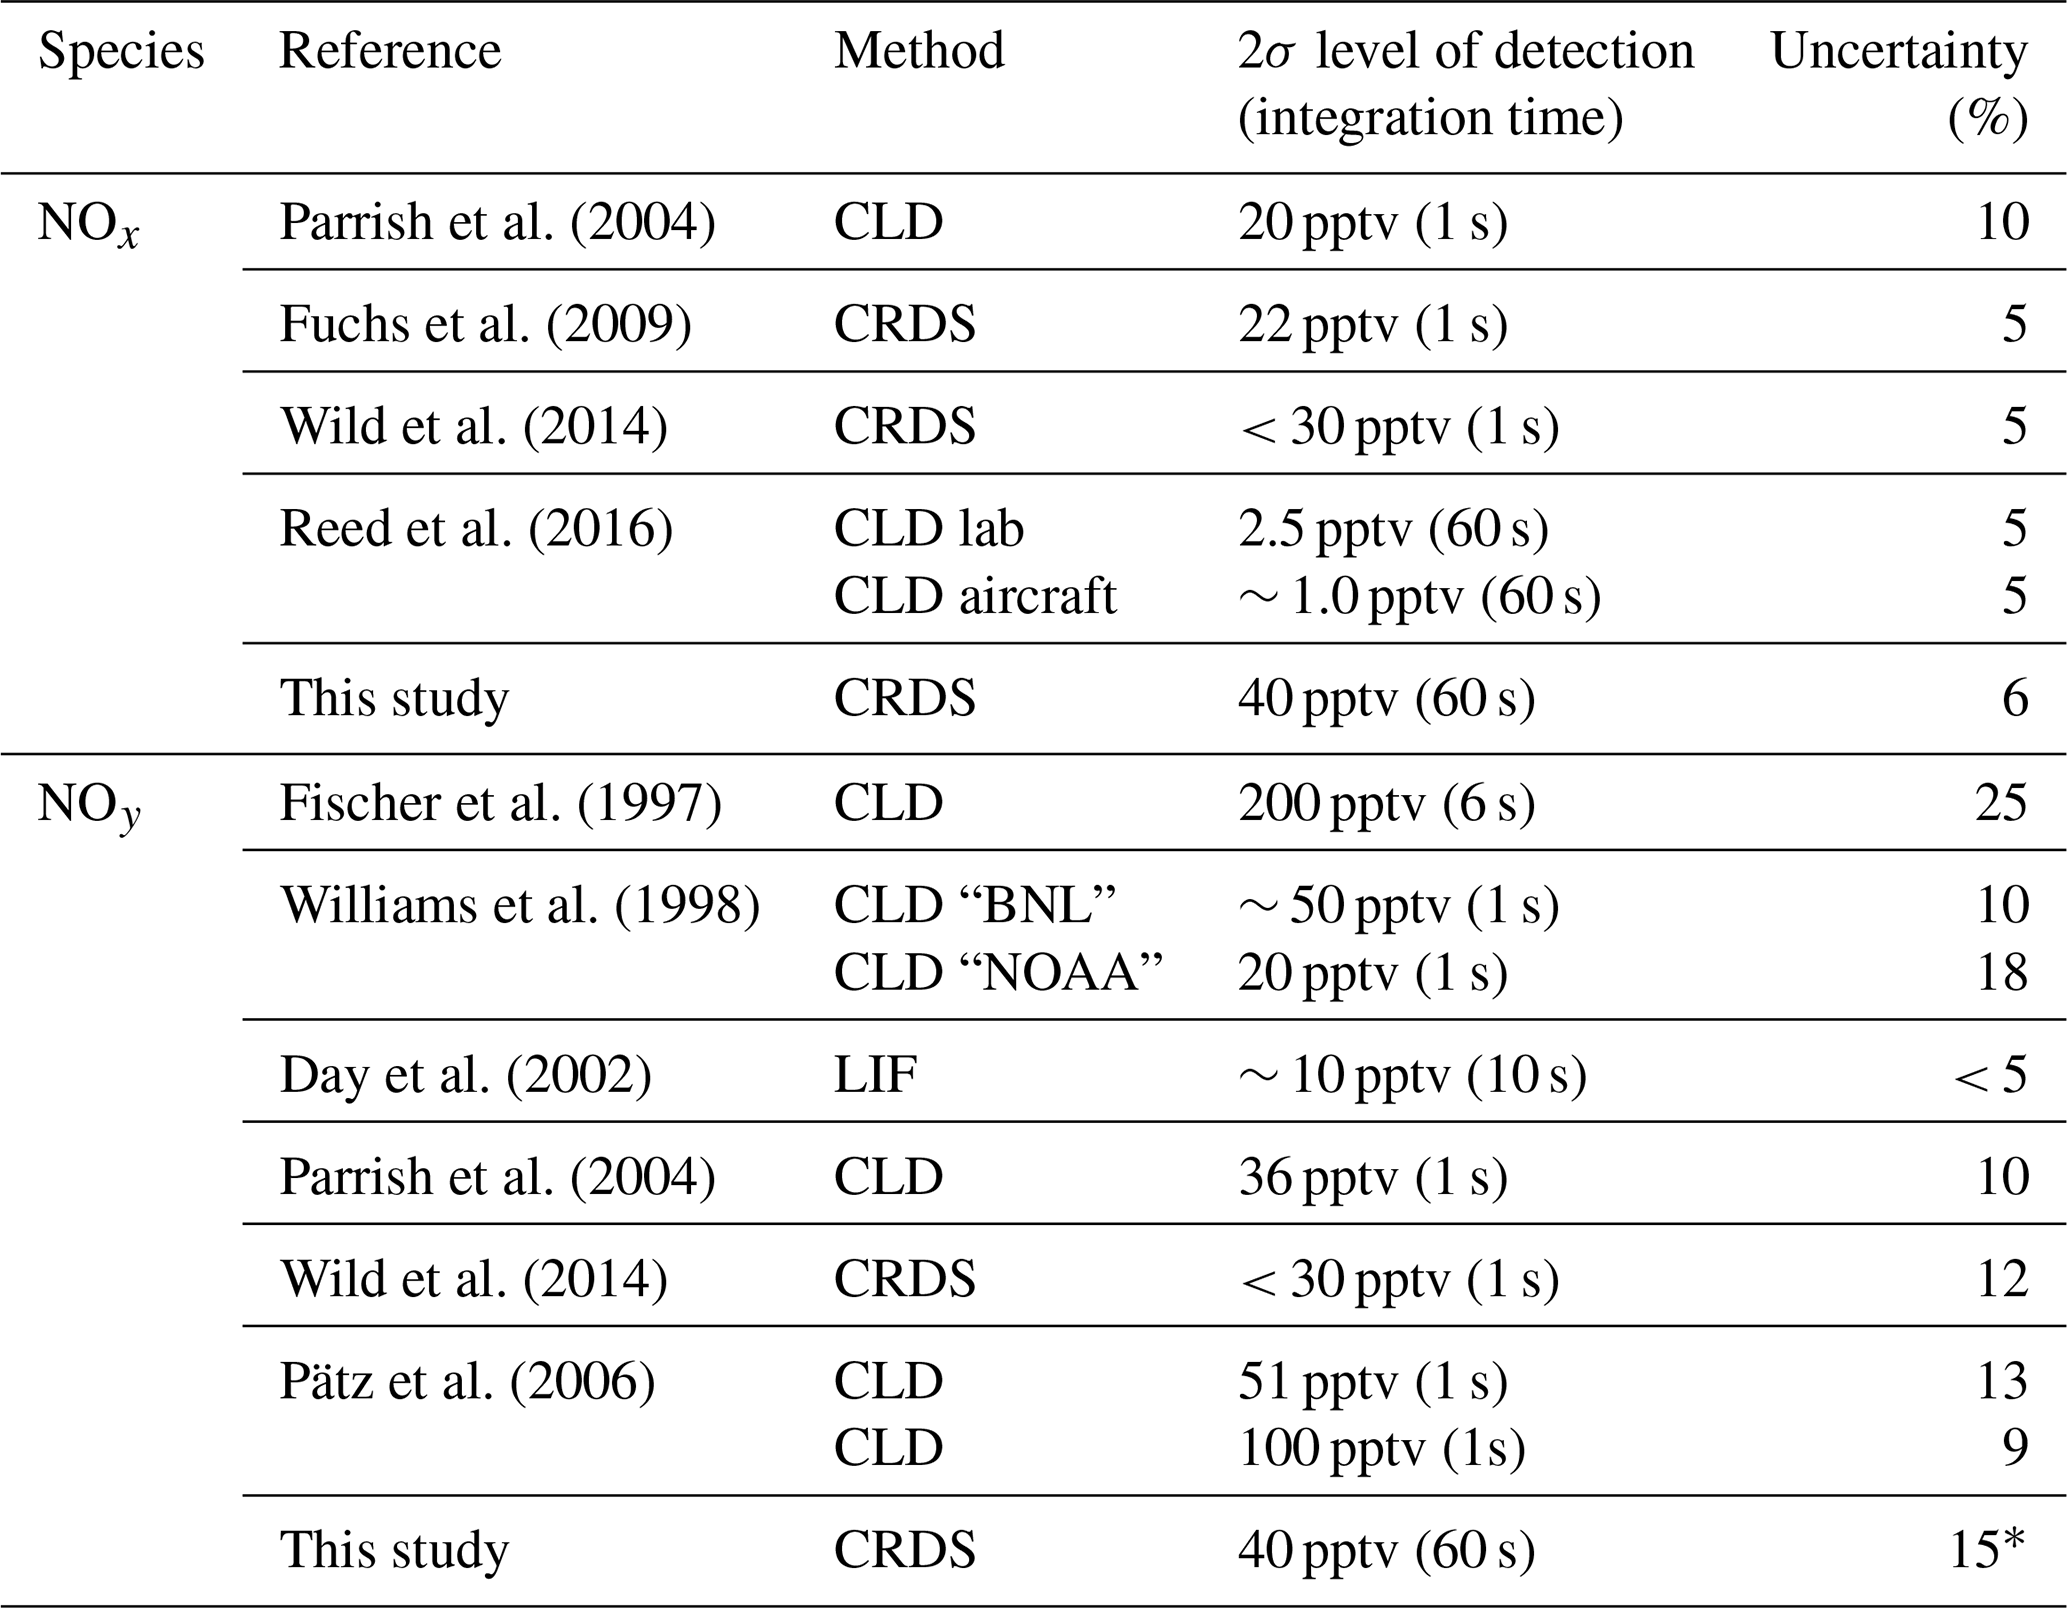
Note: ∗ Refers to gas-phase NOy only.
NOx has traditionally been measured by two-channel CLD instruments, which have one channel for NO and one channel for NO2 respectively: NO is detected by chemiluminescence from its reaction with O3, and NO2 is converted to NO on a molybdenum converter or by photolysis at wavelengths close to 390 nm. Examples of this type of instrument as well as the reported levels of detection (LODs) and overall uncertainties are listed in Table 1. In Table 1, we also list the LOD and uncertainty of a recently developed CRDS set-up which is similar in principal of operation to the one described here (Fuchs et al., 2009).
NOy has frequently been measured by CLD instruments with Au and/or MoO-coated thermal dissociation inlets that reduce NOz to NO, which is detected as described above for CLD-NOx instrument. Although such instruments have very low detection limits, they have been shown to be vulnerable to degradation of the NOy conversion efficiency and suffer from interferences by HCN, CH3CN and NH3 (Kliner et al., 1997) as well as loss of NOy in the inlet (Zenker et al., 1998; Parrish et al., 2004). Table 1 summarises the LODs and uncertainties reported by other NOy instruments.
Table 1 indicates that the total uncertainty of the present instrument is comparable to those reported for both NOx and NOy. However, our present detection limit for both NOx and NOy is worse than that reported (for NO2) for the same instrument in 2016 (Thieser et al., 2016), which is a result of mirror degradation since that study.
4.1 NOx intercomparison and pNit measurements during the AQABA campaign
The first deployment of the instrument was during the AQABA (Air Quality and climate change in the Arabian Basin) ship campaign in summer 2017. From 31 July to 2 September, the ship “Kommander Iona” followed a route from southern France via the Mediterranean Sea, the Suez Channel, the Red Sea, the Arabian Sea and the Arabian Gulf to Kuwait and back. The instrument was located in a container in front of the ship, with the inlet ovens located in an aluminium box on the roof of the container. The (unheated) tips of quartz inlet tubes protruded about 15 cm from the side of the aluminium box. Here, we compare the NOx and pNit measurements with other measurements of these parameters made during the campaign.
During AQABA, NOx levels ranged from a few parts per trillion by volume (maritime background) up to several tens of parts per billion by volume in heavily polluted air masses in shipping lanes or in harbours. In Fig. 10a, we compare NOx measured with the TD-CRDS with the results of a chemiluminescence detector (CLD 790 SR, ECO PHYSICS; Tadic et al., 2020), which measured NO and NO2. The data points represent 1 min averages for the entire campaign, excluding air masses that were contaminated by the ship's exhaust. Additionally, periods with very high NOx variability were not included, with a data point being discarded whenever the differences in mean values exceeded 2 ppbv for consecutive data points.
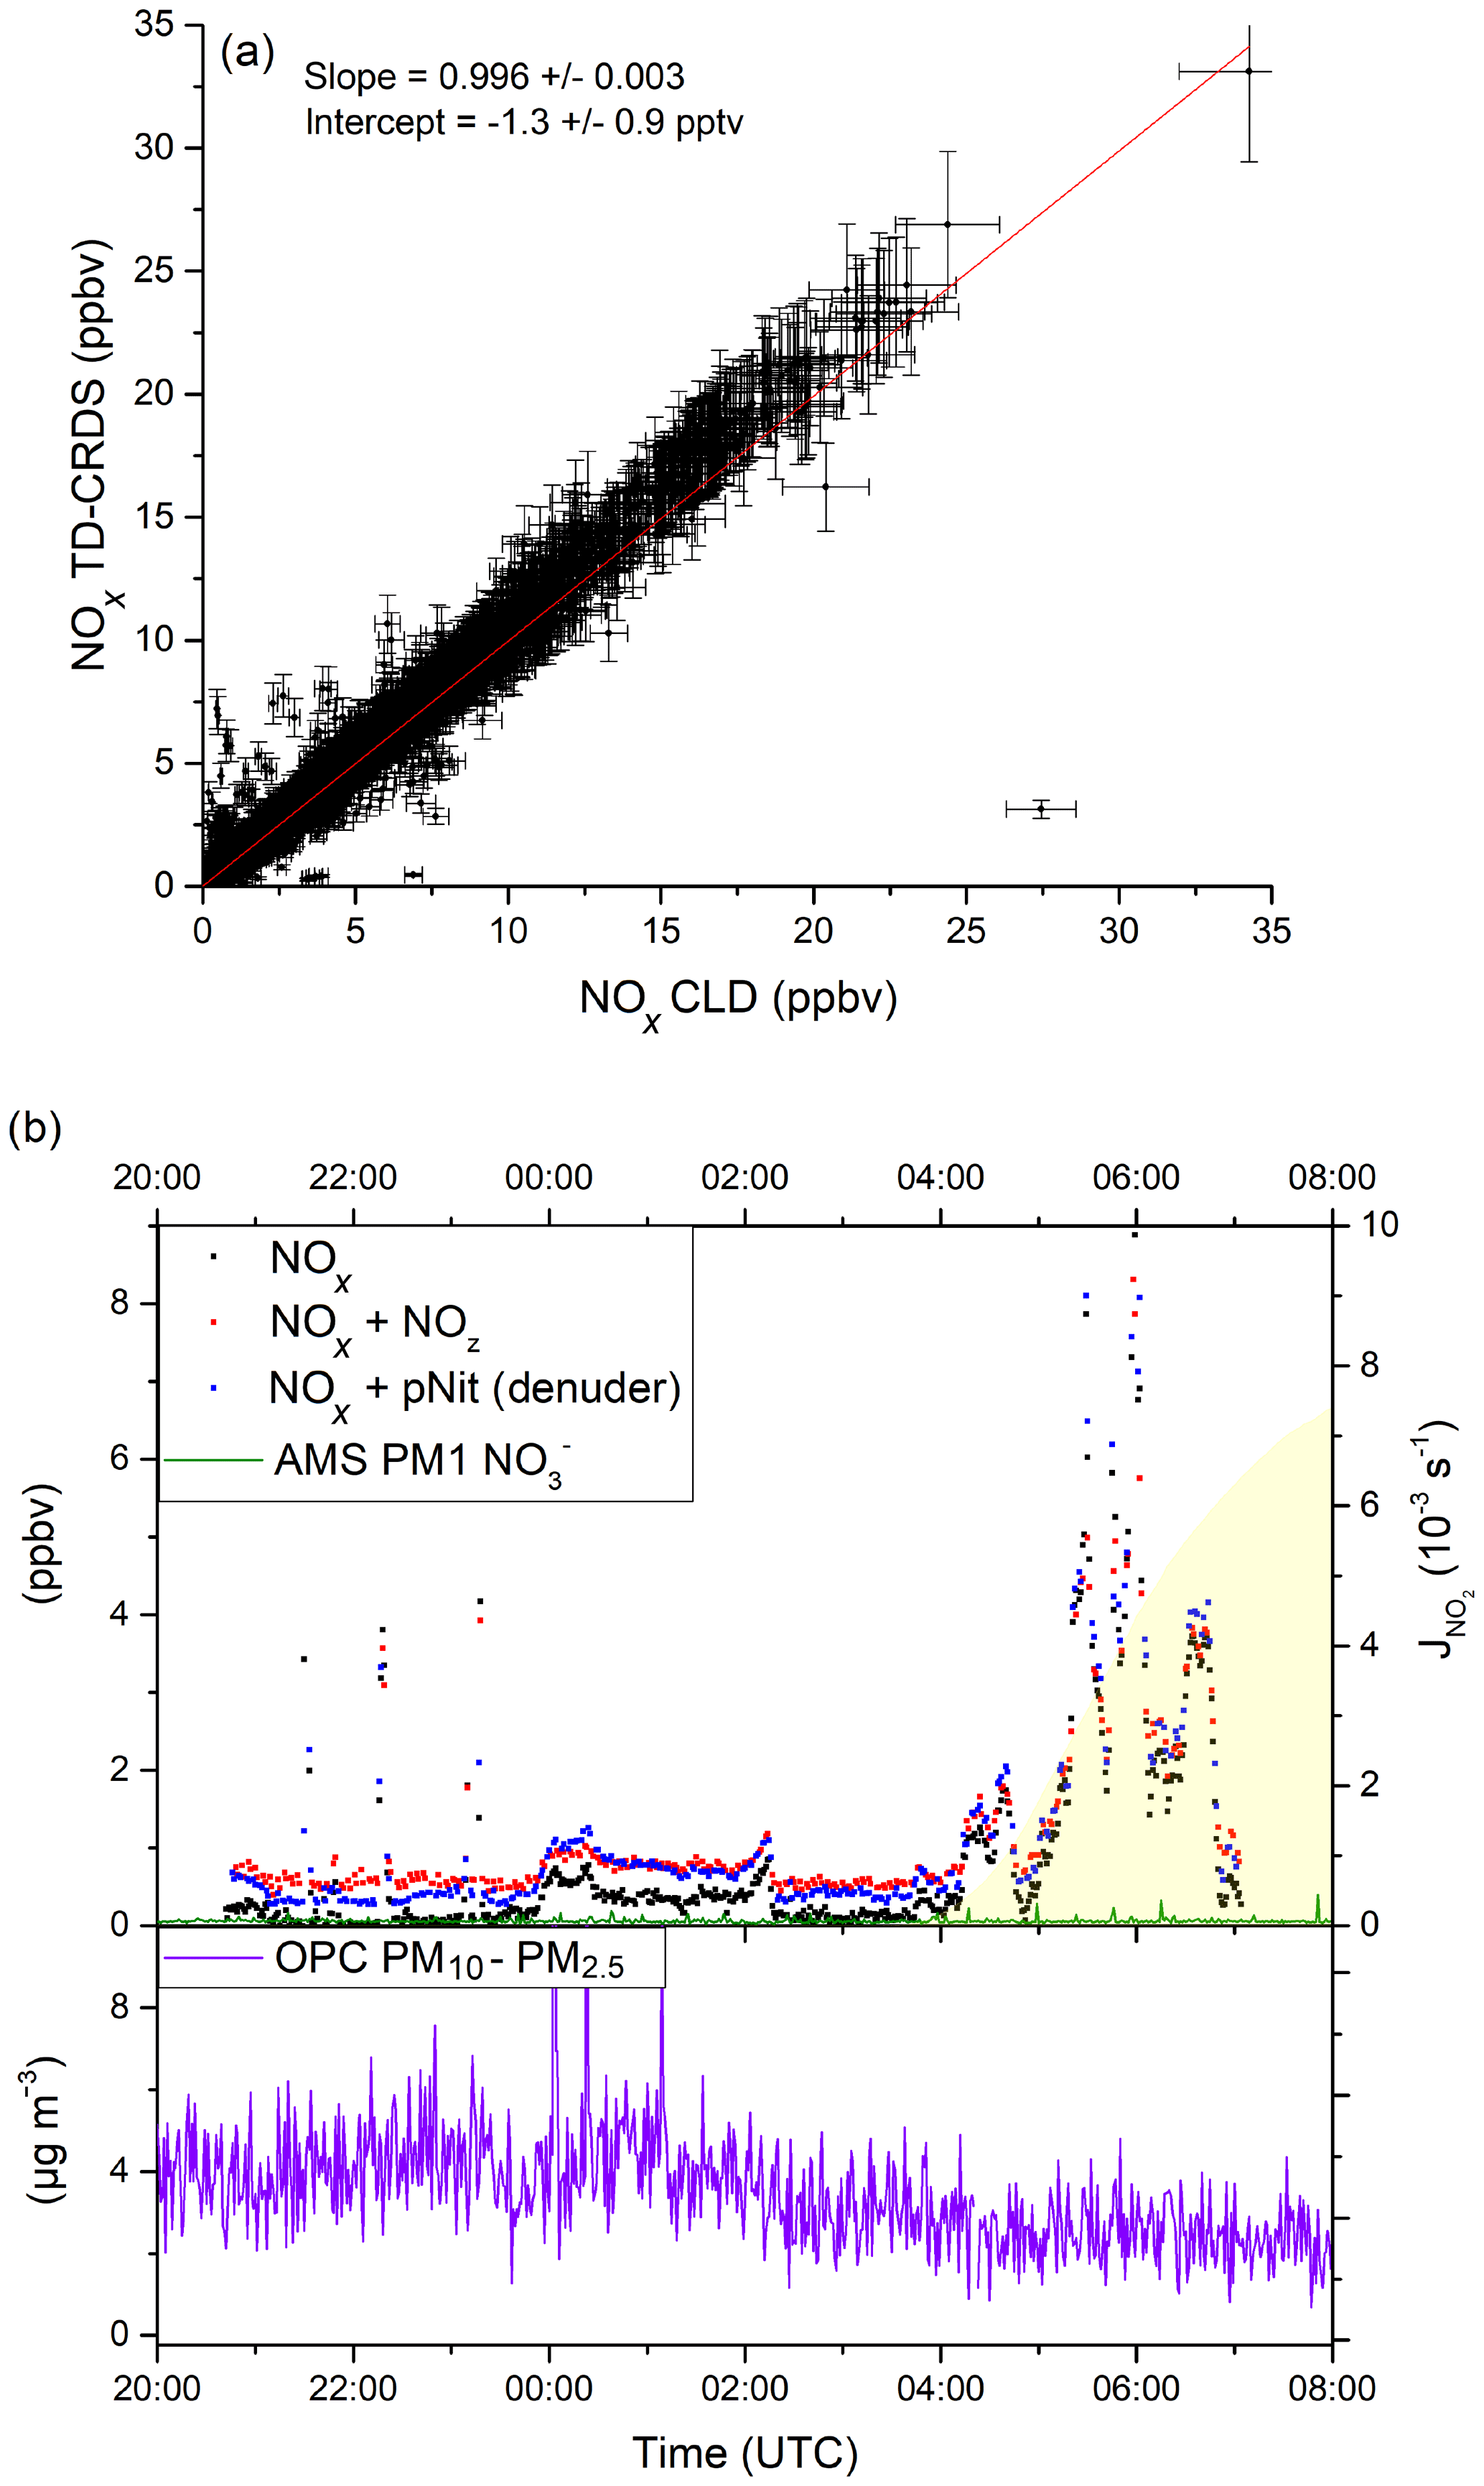
Figure 10(a) Correlation between the TD-CRDS NOx measurements (1 min averages) and an independent CLD NOx instrument from the AQABA campaign. Data obtained during phases of very high NOx variability have been excluded (see Sect. 4.1). See Fig. S6 for a histogram of the NOx data points. (b) pNit measurements using the denuder channel (blue data points) during AQABA and comparison with particulate from an AMS (aerosol mass spectrometer). The discrepancy towards the AMS and the correlation with the NOx mixing ratios indicate a positive bias in the pNit measurements, caused by humidity effects on the denuder surface. OPC (optical particle counter) measurements are added in the lower panel of (b) in order to assess the potential influence of coarse-mode aerosol nitrates.
A bivariate fit to the data sets (York, 1966), which incorporates total uncertainties for both instruments (CLD: 8.6 %; TD-CRDS: ) resulted in a slope of 0.996±0.003 and an intercept of −1.3 pptv. This very good agreement serves to underline the general applicability of the TD-CRDS in NOx measurements, even under difficult conditions (e.g. a non-static platform). In this context, we note that the deployment on a ship resulted in a degradation in performance (the LOD was ≈100 pptv) owing to the ship's motion, especially in heavy seas, which resulted in drifts in the instrument zero.
Figure 10b shows a ca. 10 h time frame with pNit measurements from the denuder channel of the TD-CRDS. Unfortunately, the TD oven of the denuder channel broke down very early in the campaign and was not operational afterwards. The data from the pNit channel are presented along with the NOx and NOy measurements as well as particulate nitrate mass concentrations measured by an aerosol mass spectrometer (Aerodyne HR-ToF-AMS; DeCarlo et al., 2006; Brooks et al., 2020). The night-to-day transition is indicated via the NO2 photolysis rates derived from a spectral radiometer (Metcon GmbH). The relative humidity was > 80 % throughout the period shown. During the two periods when, apart from some short spikes, NOx was very low (21:10–23:45 and 02:20–03:40 UTC), TD-CRDS data indicate the presence of 300–400 pptv of pNit, which would then constitute ∼ 80 % NOy. Such mixing ratios of particulate nitrate are not commensurate with those measured by the AMS, which, on average, are a factor of 6–8 lower. As the AMS does not detect particles larger than ∼ 600 nm with high efficiency (Drewnick et al., 2005), the difference could potentially indicate that a significant fraction of the particulate nitrate is associated with coarse-mode aerosol. In the lower panel of Fig. 10b, we plot the coarse-mode aerosol mass concentration determined from measurements of an optical particle counter (OPC) that measures particles between 0.2 and 20 µm. In the two low-NOx periods outlined above, the OPC-derived aerosol mass concentrations were between 3 and 5 µg m−3. If 10 % of this coarse-mode aerosol mass concentration was nitrate, which is a typical value in the Mediterranean (Koulouri et al., 2008; Calzolai et al., 2015; Malaguti et al., 2015), this would account for 100–200 pptv of the pNit observed by the TD-CRDS and not by the AMS. However, the time profile of pNit measured by the TD-CRDS is not consistent with those of either the OPC or the AMS and rather resembles the NOx mixing ratios. This strongly suggests that the large difference between pNit reported by the TD-CRDS and the AMS does not result from the non-detection or detection of supermicron particulate nitrate by the AMS but instead results from the denuder artefacts described in Sect. 3.3.2. This short case study serves to highlight the potential positive bias in denuder-based TD-CRDS measurements of pNit under humid field conditions.
4.2 Ambient NOx and NOy measurements in an urban environment (Mainz, Germany)
NOx and NOy mixing ratios were obtained in air sampled outside the Max Planck Institute for Chemistry (MPIC). The MPIC (49∘59′27.5′′ N 8∘13′44.4′′ E) is located on the outskirts of Mainz but within 200 m of two busy two- and four-lane roads and within 500 m of additional university buildings as well as commercial and residential areas. The city of Mainz (217 000 inhabitants) is located in the densely populated Rhine–Main area along with the cities of Frankfurt (753 000 inhabitants) and Wiesbaden (278 000 inhabitants); the air in this region is strongly influenced by local pollution. The sampling location was on the top floor of a three-story building (ca. 12 m above ground level). Air was subsampled to the inlets of the instrument from a ∼ 1 m long 0.5 inch outer diameter PFA tube that was connected to a membrane pump and flow controller to generate a 20 slpm bypass flow. Aerosol transmission was probably < 100 % in these measurements.
Figure 11a summarises the 8 d of measurement (data coverage 82 %) as a time series for NOx, NOy, NOz, (10 min averages) wind speed (1 h averages) and the NOz∕NOy ratio. The NOx and NOy mixing ratios were highly variable throughout this period, with NOx mixing ratios between 0.7 and 148.3 ppbv (mean and median values of 22.1 and 6.9 ppbv respectively). Traffic-related morning rush-hour peaks in NOx were observed on all weekdays (14, 16, 17 and 20 January) between 05:00 and 10:00 UTC. The morning NOx peak is reduced or absent on the weekends (18 and 19 January). NOx levels stayed above 50 ppbv for nearly a full day from 18:00 UTC on 16 January until 18:00 UTC on 17 January, which coincides with constantly low wind speeds and the sampling of air masses that were predominantly local, and thus highly polluted. NOz mixing ratios were usually between 0.5 and 2.5 ppbv (minimum < LOD, maximum 3.1 ppbv, mean 1.0 ppbv and median 0.9 ppbv), with NOz∕NOy ratios below 0.5. These values indicate that the air masses had been impacted by recent (local) NOx emissions.
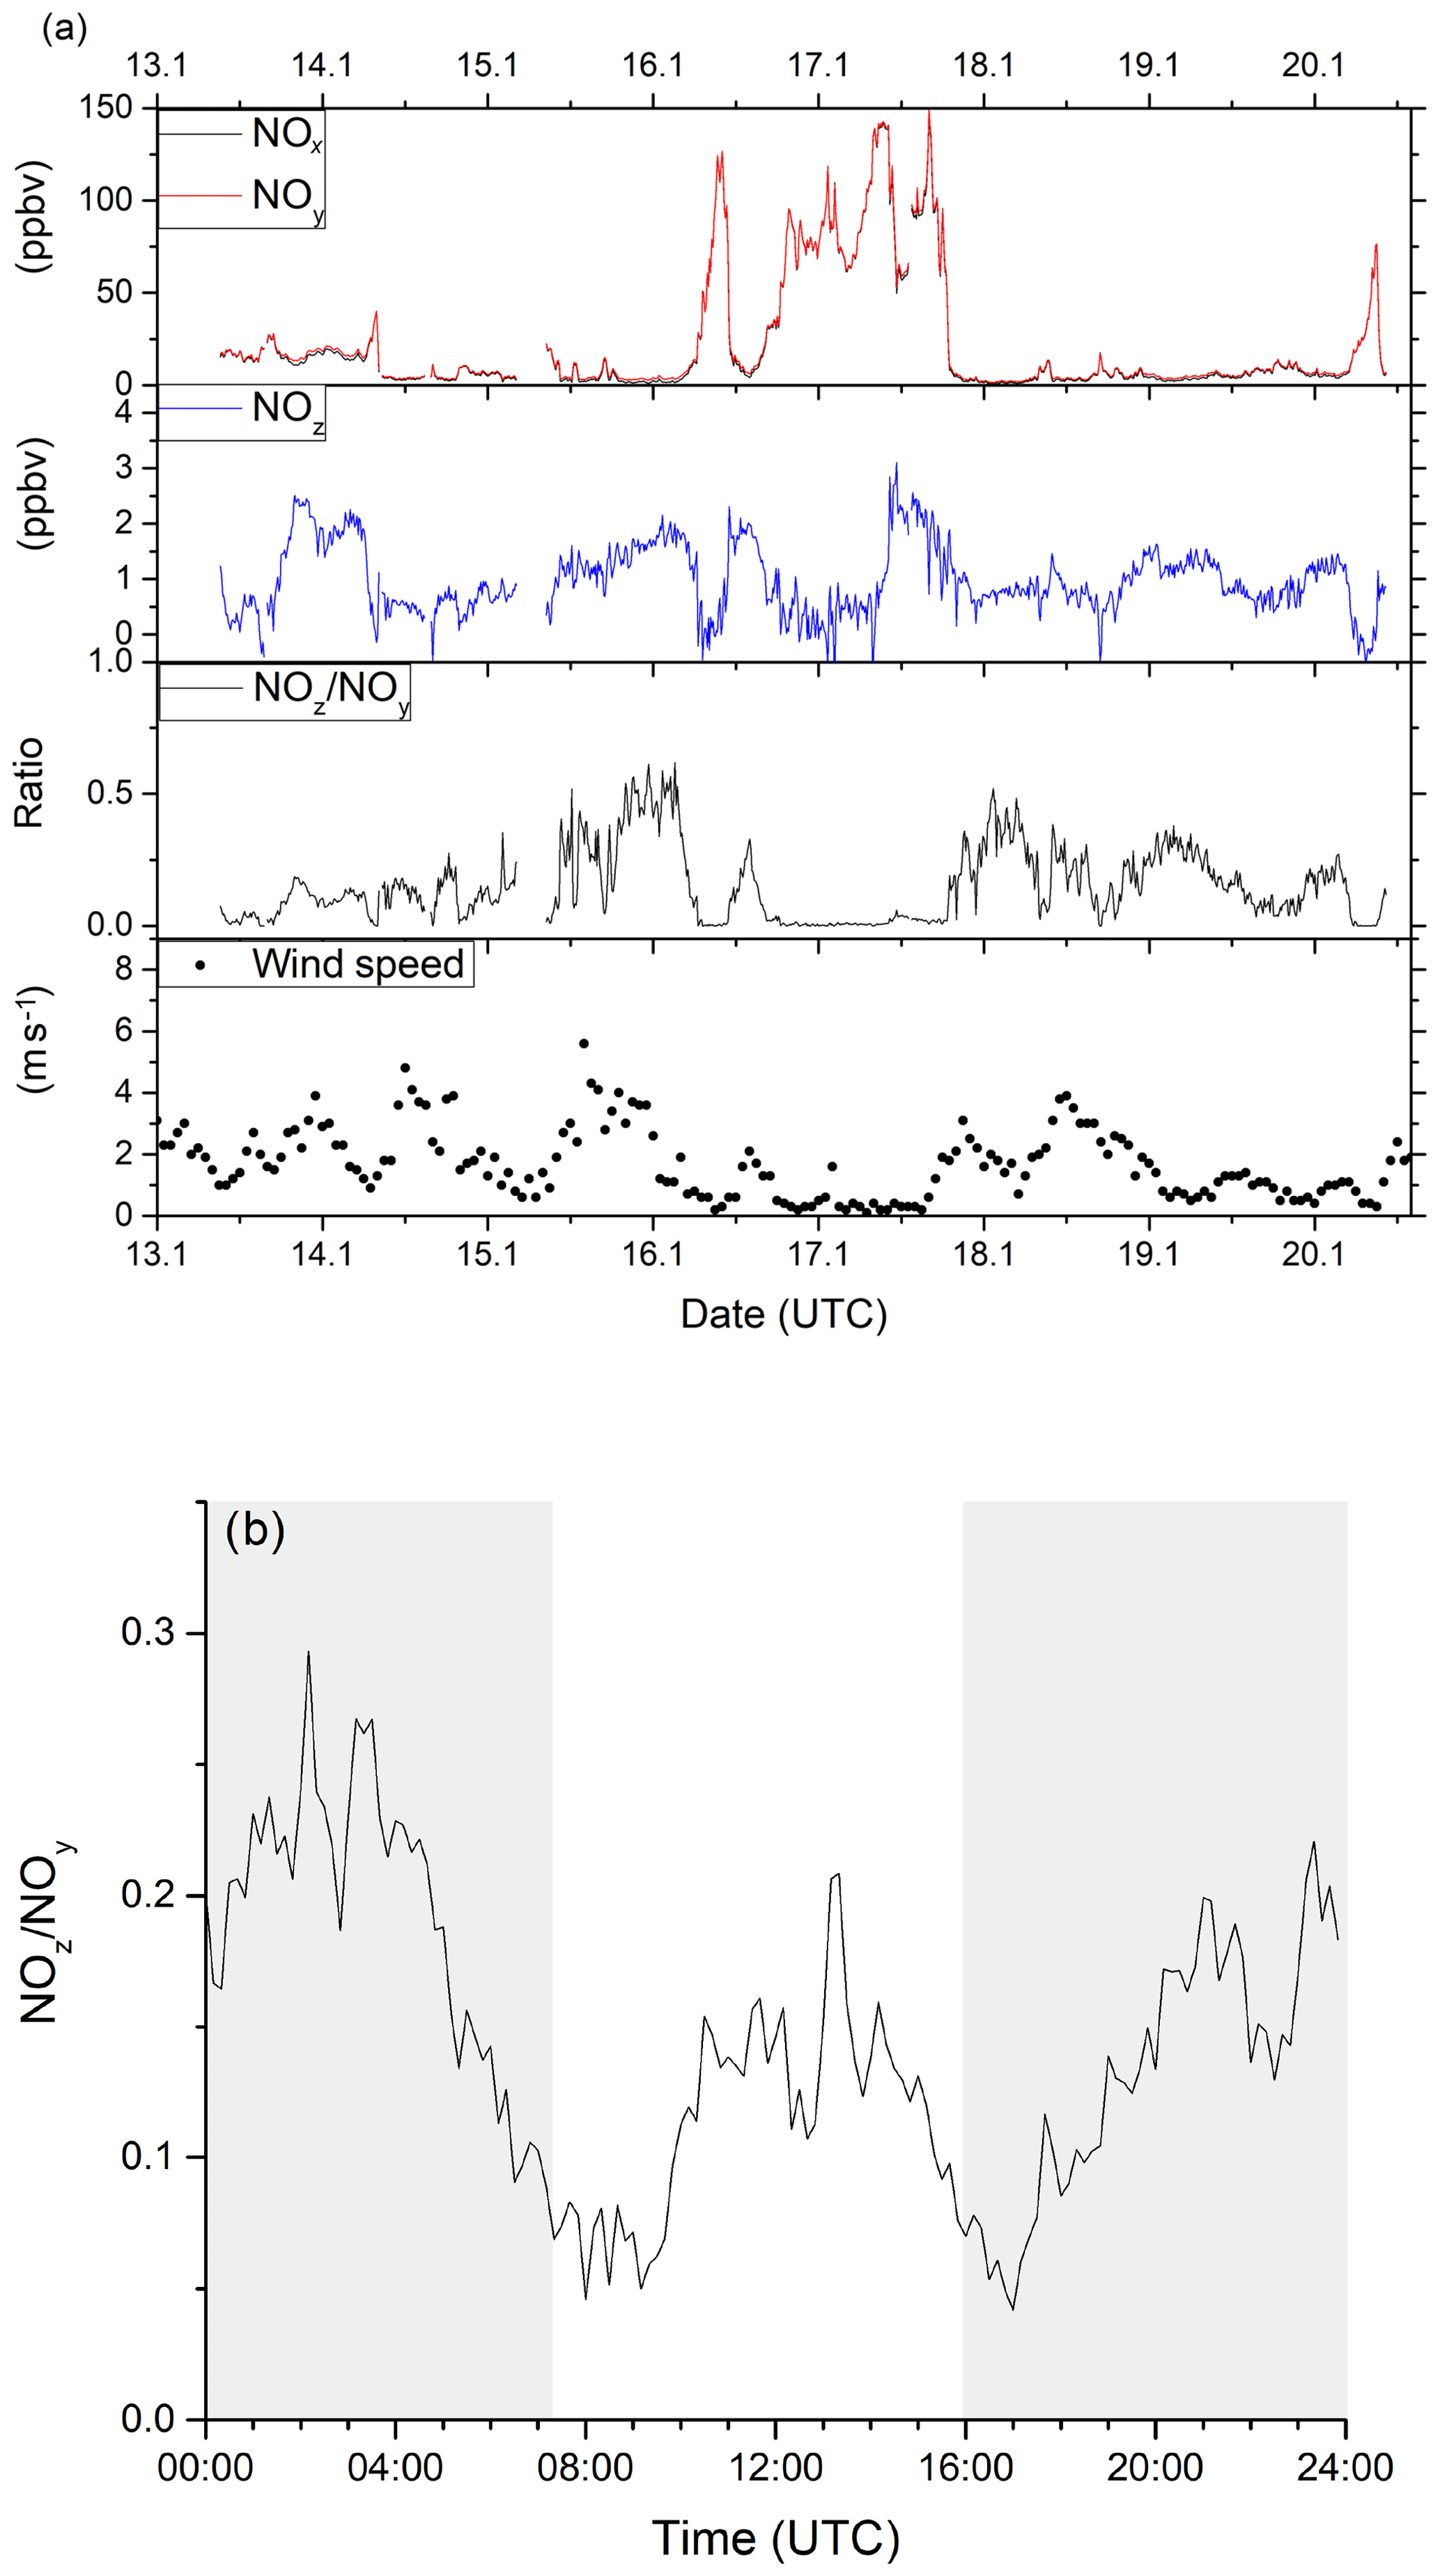
Figure 11(a) Time series of NOx, NOy, NOz, NOz∕NOy and wind speed from ambient measurements in Mainz, Germany, in January 2020. Highly variable NOx (between 0 and 150 ppbv) and moderate NOz (between 0 and 3 ppbv) mixing ratios were observed, identifying the sampled air masses as being dominated by anthropogenic emissions. Wind speed data was obtained from Agrarmeteorologie Rheinland-Pfalz (http://www.wetter.rlp.de, last access: 20 October 2020). (b) Diel profile of the NOz∕NOy ratio including all measurement days, showing distinct minima during the morning and evening rush hours. Shaded areas signify the time between sunset and sunrise.
The NOz∕NOy ratio can be used as indicator of the degree of chemical processing of an air mass. In Fig. 11b, a median diel profile (including all measurement days) for the NOz∕NOy ratio from the ambient measurement is shown. The diel profile displays two distinct minima in NOz∕NOy during the morning and evening rush hours, where NOz only makes up 5 %–10 % of the total NOy. This fraction increases up to 15 % during midday and up to 25 % during night-time, when emissions of NOx are reduced. The diel profiles of NOz∕NOy are strongly influenced by fresh emissions of NOx. As the measurement location is strongly influenced by traffic, there is a decrease in NOx (and an increase in NOz∕NOy) at night-time. Night-time increases in NOz (13–14, 15–16, 18–19 and 19–20 January 2020) may also be partially caused by the formation of N2O5 as previously observed (Schuster et al., 2009) and which would have been favoured by the low night-time temperatures (< 10 ∘C) in winter.
These measurements serve to illustrate the applicability of our TD-CRDS over a wide range of NOx and NOy concentrations under realistic field conditions and in the investigation of processes that transform NOx into its gas- and particle-phase reservoirs.
We report on the development, characterisation and first deployment of a TD-CRDS instrument for the measurement of NOx, NOy, NOz and pNit. Our laboratory experiments suggest that the different gas-phase NOz species investigated (PAN, iPN, N2O5, HONO, ClNO2 and HNO3) are converted with near-stoichiometric efficiency to NOx at a nominal oven temperature of 850 ∘C. NH4NO3 particles of 200 nm in diameter are also detected quantitatively as NOx, whereas the efficiency of detection of NaNO3 particles of similar diameter was closer to 25 %. The efficiency of the detection of coarse-mode particles will be further reduced by their lower transmission through the denuder.
The potential for NH3 to bias NOy measurements was assessed and was found to be insignificant in ambient air or synthetic air containing VOCs and water. The conversion to NO2 (by reaction with O3) of atmospheric NO, as well as NO formed in the heated inlet, circumvents bias resulting from O3 thermolysis (leading to an NO2 overestimation) and secondary processes, which are initiated by the thermal dissociation of organic nitrates.
For our activated carbon denuder, we observed > 90 % transmission for ammonium nitrate particles with diameters between 40 and 400 nm. Under humid conditions, the denuder suffered from the direct breakthrough of NO and the re-release of previously stored iPN and NO2 in the form of NO, indicating a potential bias of pNit measurements using this technique and potentially limiting its deployment to low-NOx and low-NOz environments. When using comparable denuders, we recommend regular checks with humidified zero air to characterise potential breakthrough. Our experiments demonstrated that the release of NOx from the denuder exposed to humid zero air for several hours can decrease to values below 1 ppbv, which, in a first approximation, could be treated as an offset. Cycling between multiple denuders would help to reduce the size of any bias.
The performance of the instrument under field conditions was demonstrated by measurements in Mainz, Germany, and during the AQABA ship campaign. NOx measurements with the new instrument were in good agreement with those from an established, independent CLD-based instrument.
The NOx data set from the AQABA campaign is available at https://doi.org/10.5281/zenodo.4134659 (Friedrich, 2020). Data used to generate the figures in this paper can be obtained upon request from the corresponding author.
The supplement related to this article is available online at: https://doi.org/10.5194/amt-13-5739-2020-supplement.
NF developed the TD-CRDS, performed all laboratory and campaign measurements, evaluated the data sets and wrote the paper. IT and HF provided the AQABA CLD NOx measurements. JS designed the heated inlet system and performed actinic flux measurements during AQABA. JB, ED and FD provided AMS and OPC measurements from AQABA. JL and JNC designed and supervised the study and the campaigns. JNC, JL and FD contributed to the paper.
The authors declare that they have no conflict of interest.
We thank Ezra Wood for providing us with the activated carbon denuder and Chemours for the provision of the FEP sample (FEPD 121) used to coat the cavity walls. This work was supported by the Max Planck Graduate Center with the Johannes Gutenberg-Universität Mainz (MPGC).
The article processing charges for this open-access publication were covered by the Max Planck Society.
This paper was edited by Dwayne Heard and reviewed by three anonymous referees.
Atsuko, N., Kazuya, S., Toshiaki, E., Kei-ichi, K., Morinobu, E., and Norifumi, S.: Electronic and Magnetic Properties of Activated Carbon Fibers, Bull. Chem. Soc. Jpn., 69, 333–339, https://doi.org/10.1246/bcsj.69.333, 1996.
Barker, J. R., Benson, S. W., Mendenhall, G. D., and Goldern, D. M.: Measurements of rate constants of importance in smog, Rep. PB-274530, Natl. Tech. Inf. Serv., Springfield, Va., USA, 1977.
Barton, S. S. and Koresh, J. E.: Adsorption Interaction of Water with Microporous Adsorbents 1. Water-Vapor Adsorption on Activated Carbon Cloth, J. Chem. Soc. Faraday Trans. I, 79, 1147–1155, https://doi.org/10.1039/f19837901147, 1983.
Baulch, D. L., Duxbury, J., Grant, S. J., and Montague, D. C.: Evaluated kinetic data for high temperature reactions. Volume 4 Homogeneous gas phase reactions of halogen- and cyanide-containing species, J. Phys. Chem. Ref. Data, 10, 1–721, 1981.
Bertram, A. K., Ivanov, A. V., Hunter, M., Molina, L. T., and Molina, M. J.: The reaction probability of OH on organic surfaces of tropospheric interest, J. Phys. Chem. A, 105, 9415–9421, 2001.
Bridier, I., Caralp, F., Loirat, H., Lesclaux, R., Veyret, B., Becker, K. H., Reimer, A., and Zabel, F.: Kinetic and Theoretical-studies of the Reactions between 248 K and 393 K and Between 30-torr and 760-torr, J. Phys. Chem., 95, 3594–3600, 1991.
Brooks, J., Darbyshire, E., Drewnick, F., Alfarra, R., Struckmeier, C., Fachinger, F., Borrmann, S., Allen, G., and Coe, H.: Characterisation of accumulation mode aerosol across the Middle East and Mediterranean during a ship campaign in the summer of 2017, in preperation, 2020.
Brunauer, S., Emmett, P. H., and Teller, E.: Adsorption of gases in multimolecular layers, J. Am. Chem. Soc., 60, 309–319, 1938.
Calzolai, G., Nava, S., Lucarelli, F., Chiari, M., Giannoni, M., Becagli, S., Traversi, R., Marconi, M., Frosini, D., Severi, M., Udisti, R., di Sarra, A., Pace, G., Meloni, D., Bommarito, C., Monteleone, F., Anello, F., and Sferlazzo, D. M.: Characterization of PM10 sources in the central Mediterranean, Atmos. Chem. Phys., 15, 13939–13955, https://doi.org/10.5194/acp-15-13939-2015, 2015.
Cohen, N. and Westberg, K. R.: Chemical Kinetic Data Sheets for High-Temperature Reactions .2., J. Phys. Chem. Ref. Data, 20, 1211–1311, https://doi.org/10.1063/1.555901, 1991.
Davidson, J. A., Viggiano, A. A., Howard, C. J., Dotan, I., Fehsenfeld, F. C., Albritton, D. L., and Ferguson, E. E.: Rate Constants for Reactions of , , NO+, H3O+, , , and Halide Ions with N2O5 at 300 K, J. Chem. Phys., 68, 2085–2087, 1978.
Day, D. A., Wooldridge, P. J., Dillon, M. B., Thornton, J. A., and Cohen, R. C.: A thermal dissociation laser-induced fluorescence instrument for in situ detection of NO2, peroxy nitrates, alkyl nitrates, and HNO3, J. Geophys. Res.-Atmos., 107, 4046, https://doi.org/10.1029/2001jd000779, 2002.
Day, D. A., Dillon, M. B., Wooldridge, P. J., Thornton, J. A., Rosen, R. S., Wood, E. C., and Cohen, R. C.: On alkyl nitrates, O3, and the “missing NOy”, J. Geophys. Res.-Atmos., 108, 4501, https://doi.org/10.1029/2003jd003685, 2003.
DeCarlo, P. F., Kimmel, J. R., Trimborn, A., Northway, M. J., Jayne, J. T., Aiken, A. C., Gonin, M., Fuhrer, K., Horvath, T., Docherty, K. S., Worsnop, D. R., and Jimenez, J. L.: Field-deployable, high-resolution, time-of-flight aerosol mass spectrometer, Anal. Chem., 78, 8281–8289, https://doi.org/10.1021/ac061249n, 2006.
Di Carlo, P., Aruffo, E., Busilacchio, M., Giammaria, F., Dari-Salisburgo, C., Biancofiore, F., Visconti, G., Lee, J., Moller, S., Reeves, C. E., Bauguitte, S., Forster, G., Jones, R. L., and Ouyang, B.: Aircraft based four-channel thermal dissociation laser induced fluorescence instrument for simultaneous measurements of NO2, total peroxy nitrate, total alkyl nitrate, and HNO3, Atmos. Meas. Tech., 6, 971–980, https://doi.org/10.5194/amt-6-971-2013, 2013.
Drewnick, F., Hings, S. S., DeCarlo, P., Jayne, J. T., Gonin, M., Fuhrer, K., Weimer, S., Jimenez, J. L., Demerjian, K. L., Borrmann, S., and Worsnop, D. R.: A new time-of-flight aerosol mass spectrometer (TOF-AMS) – Instrument description and first field deployment, Aerosol Sci. Tech., 39, 637–658, https://doi.org/10.1080/02786820500182040, 2005.
Dubinin, M. M., Andreeva, G. A., Vartapetyan, R. S., Vnukov, S. P., Nikolaev, K. M., Polyakov, N. S., Seregina, N. I., and Fedoseev, D. V.: Adsorption of Water and the Micropore Structures of Carbon Adsorbents .5. Pore Structure Parameters of Thermally Treated Carbon Adsorbents and the Adsorption of Water-Vapor on These Materials, B. Acad. Sci. Ussr. Ch.+, 31, 2133–2137, https://doi.org/10.1007/Bf00958379, 1982.
Dulitz, K., Amedro, D., Dillon, T. J., Pozzer, A., and Crowley, J. N.: Temperature-(208–318 K) and pressure-(18–696 Torr) dependent rate coefficients for the reaction between OH and HNO3, Atmos. Chem. Phys., 18, 2381–2394, https://doi.org/10.5194/acp-18-2381-2018, 2018.
Fahey, D. W., Eubank, C. S., Hubler, G., and Fehsenfeld, F. C.: Evaluation of a Catalytic Reduction Technique for the Measurement of Total Reactive Odd-Nitrogen Noy in the Atmosphere, J. Atmos. Chem., 3, 435–468, https://doi.org/10.1007/Bf00053871, 1985.
Finlayson-Pitts, B. J., Ezell, M. J., and Pitts, J. N. J.: Formation of chemically active chlorine compounds by reactions of atmospheric NaCl particles with gaseous N2O5 and ClONO2, Nature, 337, 241–244, 1989.
Fischer, H., Waibel, A. E., Welling, M., Wienhold, F. G., Zenker, T., Crutzen, P. J., Arnold, F., Burger, V., Schneider, J., Bregman, A., Lelieveld, J., and Siegmund, P. C.: Observations of high concentrations of total reactive nitrogen (NOy) and nitric acid (HNO3) in the lower Arctic stratosphere during the stratosphere-troposphere experiment by aircraft measurements (STREAM) II campaign in February 1995, J. Geophys. Res.-Atmos., 102, 23559–23571, https://doi.org/10.1029/97jd02012, 1997.
Friedrich, N.: Measurement of NOx and NOy with a thermal dissociation cavity ring-down spectrometer (TD-CRDS): Instrument characterisation and first deployment [Data set], Zenodo, https://doi.org/10.5281/zenodo.4134659, 2020.
Fry, J. L., Draper, D. C., Zarzana, K. J., Campuzano-Jost, P., Day, D. A., Jimenez, J. L., Brown, S. S., Cohen, R. C., Kaser, L., Hansel, A., Cappellin, L., Karl, T., Hodzic Roux, A., Turnipseed, A., Cantrell, C., Lefer, B. L., and Grossberg, N.: Observations of gas- and aerosol-phase organic nitrates at BEACHON-RoMBAS 2011, Atmos. Chem. Phys., 13, 8585–8605, https://doi.org/10.5194/acp-13-8585-2013, 2013.
Fuchs, H., Dube, W. P., Lerner, B. M., Wagner, N. L., Williams, E. J., and Brown, S. S.: A Sensitive and Versatile Detector for Atmospheric NO2 and NOx Based on Blue Diode Laser Cavity Ring-Down Spectroscopy, Environ. Sci. Technol., 43, 7831–7836, https://doi.org/10.1021/es902067h, 2009.
Fuchs, H., Ball, S. M., Bohn, B., Brauers, T., Cohen, R. C., Dorn, H.-P., Dubé, W. P., Fry, J. L., Häseler, R., Heitmann, U., Jones, R. L., Kleffmann, J., Mentel, T. F., Müsgen, P., Rohrer, F., Rollins, A. W., Ruth, A. A., Kiendler-Scharr, A., Schlosser, E., Shillings, A. J. L., Tillmann, R., Varma, R. M., Venables, D. S., Villena Tapia, G., Wahner, A., Wegener, R., Wooldridge, P. J., and Brown, S. S.: Intercomparison of measurements of NO2 concentrations in the atmosphere simulation chamber SAPHIR during the NO3Comp campaign, Atmos. Meas. Tech., 3, 21–37, https://doi.org/10.5194/amt-3-21-2010, 2010.
Gaffney, J. S., Fajer, R., and Senum, G. I.: An Improved Procedure for High-Purity Gaseous Peroxyacyl Nitrate Production – Use of Heavy Lipid Solvents, Atmos. Environ., 18, 215–218, https://doi.org/10.1016/0004-6981(84)90245-2, 1984.
Gao, X. A., Liu, S. J., Zhang, Y., Luo, Z. Y., Ni, M. J., and Cen, K. F.: Adsorption and reduction of NO2 over activated carbon at low temperature, Fuel Process. Technol., 92, 139–146, https://doi.org/10.1016/j.fuproc.2010.09.017, 2011.
Garner, N. M., Matchett, L. C., and Osthoff, H. D.: Quantification of Non-refractory Aerosol Nitrate in Ambient Air by Thermal Dissociation Cavity Ring-Down Spectroscopy, Environ. Sci. Technol., 54, 9864–9861, https://doi.org/10.1021/acs.est.0c01156, 2020.
Glänzer, K. and Troe, J.: Thermal Decomposition of Nitrocompounds in Shock Waves. IV: Decomposition of Nitric Acid, Berichte der Bunsengesellschaft für physikalische Chemie, 78, 71–76, https://doi.org/10.1002/bbpc.19740780112, 1974.
Hosaynali Beygi, Z., Fischer, H., Harder, H. D., Martinez, M., Sander, R., Williams, J., Brookes, D. M., Monks, P. S., and Lelieveld, J.: Oxidation photochemistry in the Southern Atlantic boundary layer: unexpected deviations of photochemical steady state, Atmos. Chem. Phys., 11, 8497–8513, https://doi.org/10.5194/acp-11-8497-2011, 2011.
Huang, W., Saathoff, H., Shen, X. L., Ramisetty, R., Leisner, T., and Mohr, C.: Chemical Characterization of Highly Functionalized Organonitrates Contributing to Night-Time Organic Aerosol Mass Loadings and Particle Growth, Environ. Sci. Technol., 53, 1165–1174, https://doi.org/10.1021/acs.est.8b05826, 2019.
Ammann, M., Cox, R. A., Crowley, J. N., Herrmann, H., Jenkin, M. E., McNeill, V. F., Mellouki, A., Rossi, M. J., Troe, J., and Wallington, T. J.: Evaluated Kinetic and Photochemical Data for Atmospheric Chemistry, Task Group on Atmospheric Chemical Kinetic Data Evaluation, IUPAC, available at: http://iupac.pole-ether.fr/index.html (last access: 28 October 2020), 2019.
Ivanov, A. V., Trakhtenberg, S., Bertram, A. K., Gershenzon, Y. M., and Molina, M. J.: OH, HO2, and ozone gaseous diffusion coefficients, J. Phys. Chem. A, 111, 1632–1637, 2007.
Javed, U., Kubistin, D., Martinez, M., Pollmann, J., Rudolf, M., Parchatka, U., Reiffs, A., Thieser, J., Schuster, G., Horbanski, M., Pöhler, D., Crowley, J. N., Fischer, H., Lelieveld, J., and Harder, H.: Laser-induced fluorescence-based detection of atmospheric nitrogen dioxide and comparison of different techniques during the PARADE 2011 field campaign, Atmos. Meas. Tech., 12, 1461–1481, https://doi.org/10.5194/amt-12-1461-2019, 2019.
Kalberer, M., Ammann, M., Arens, F., Gaggeler, H. W., and Baltensperger, U.: Heterogeneous formation of nitrous acid (HONO) on soot aerosol particles, J. Geophys. Res.-Atmos., 104, 13825–13832, 1999.
Kim, P., Zheng, Y. J., and Agnihotri, S.: Adsorption equilibrium and kinetics of water vapor in carbon nanotubes and its comparison with activated carbon, Ind. Eng. Chem. Res., 47, 3170–3178, https://doi.org/10.1021/ie0713240, 2008.
Kleffmann, J., Becker, K. H., Lackhoff, M., and Wiesen, P.: Heterogeneous conversion of NO2 on carbonaceous surfaces, Phys. Chem. Chem. Phys., 1, 5443–5450, https://doi.org/10.1039/a905545b, 1999.
Kliner, D. A. V., Daube, B. C., Burley, J. D., and Wofsy, S. C.: Laboratory investigation of the catalytic reduction technique for measurement of atmospheric NOy, J. Geophys. Res.-Atmos., 102, 10759–10776, https://doi.org/10.1029/96jd03816, 1997.
Koulouri, E., Saarikoski, S., Theodosi, C., Markaki, Z., Gerasopoulos, E., Kouvarakis, G., Makela, T., Hillamo, R., and Mihalopoulos, N.: Chemical composition and sources of fine and coarse aerosol particles in the Eastern Mediterranean, Atmos. Environ., 42, 6542–6550, https://doi.org/10.1016/j.atmosenv.2008.04.010, 2008.
Lammel, G. and Perner, D.: The Atmospheric Aerosol as a Source of Nitrous-Acid in the Polluted Atmosphere, J. Aerosol Sci., 19, 1199–1202, https://doi.org/10.1016/0021-8502(88)90135-8, 1988.
Langford, A. O., Fehsenfeld, F. C., Zachariassen, J., and Schimel, D. S.: Gaseous Ammonia Fluxes and Background Concentrations in Terrestrial Ecosystems of the United States, Global Biogeochem. Cy., 6, 459–483, https://doi.org/10.1029/92gb02123, 1992.
Lee, B. H., Mohr, C., Lopez-Hilfiker, F. D., Lutz, A., Hallquist, M., Lee, L., Romer, P., Cohen, R. C., Iyer, S., Kurten, T., Hu, W. W., Day, D. A., Campuzano-Jost, P., Jimenez, J. L., Xu, L., Ng, N. L., Guo, H. Y., Weber, R. J., Wild, R. J., Brown, S. S., Koss, A., de Gouw, J., Olson, K., Goldstein, A. H., Seco, R., Kim, S., McAvey, K., Shepson, P. B., Starn, T., Baumann, K., Edgerton, E. S., Liu, J. M., Shilling, J. E., Miller, D. O., Brune, W., Schobesberger, S., D'Ambro, E. L., and Thornton, J. A.: Highly functionalized organic nitrates in the southeast United States: Contribution to secondary organic aerosol and reactive nitrogen budgets, P. Natl. Acad. Sci. USA, 113, 1516–1521, https://doi.org/10.1073/pnas.1508108113, 2016.
Leser, H., Honninger, G., and Platt, U.: MAX-DOAS measurements of BrO and NO2 in the marine boundary layer, Geophys. Res. Lett., 30, 1537, https://doi.org/10.1029/2002GL015811, 2003.
Lightfoot, P. D., Cox, R. A., Crowley, J. N., Destriau, M., Hayman, G. D., Jenkin, M. E., Moortgat, G. K., and Zabel, F.: Organic peroxy radicals – kinetics, spectroscopy and tropospheric chemistry, Atmos. Environ., A-Gen., 26, 1805–1961, 1992.
Liu, L. M., Tan, S. L., Horikawa, T., Do, D. D., Nicholson, D., and Liu, J. J.: Water adsorption on carbon – A review, Adv. Colloid Interf. Sci., 250, 64–78, https://doi.org/10.1016/j.cis.2017.10.002, 2017.
Logan, J. A.: Nitrogen-Oxides in the Troposphere – Global and Regional Budgets, J. Geophys. Res.-Oceans, 88, 78-5-807, https://doi.org/10.1029/JC088iC15p10785, 1983.
Malaguti, A., Mircea, M., La Torretta, T. M. G., Telloli, C., Petralia, E., Stracquadanio, M., and Berico, M.: Chemical Composition of Fine and Coarse Aerosol Particles in the Central Mediterranean Area during Dust and Non-Dust Conditions, Aerosol Air Qual. Res., 15, 410–425, https://doi.org/10.4209/aaqr.2014.08.0172, 2015.
Merten, A., Tschritter, J., and Platt, U.: Design of differential optical absorption spectroscopy long-path telescopes based on fiber optics, Appl. Optics, 50, 738–754, 2011.
Meusel, H., Tamm, A., Kuhn, U., Wu, D., Leifke, A. L., Fiedler, S., Ruckteschler, N., Yordanova, P., Lang-Yona, N., Pöhlker, M., Lelieveld, J., Hoffmann, T., Pöschl, U., Su, H., Weber, B., and Cheng, Y.: Emission of nitrous acid from soil and biological soil crusts represents an important source of HONO in the remote atmosphere in Cyprus, Atmos. Chem. Phys., 18, 799–813, https://doi.org/10.5194/acp-18-799-2018, 2018.
Murphy, J. G., Day, D. A., Cleary, P. A., Wooldridge, P. J., and Cohen, R. C.: Observations of the diurnal and seasonal trends in nitrogen oxides in the western Sierra Nevada, Atmos. Chem. Phys., 6, 5321–5338, https://doi.org/10.5194/acp-6-5321-2006, 2006.
Neuman, J. A., Huey, L. G., Ryerson, T. B., and Fahey, D. W.: Study of inlet materials for sampling atmospheric nitric acid, Environ. Sci. Technol., 33, 1133–1136, 1999.
Ng, N. L., Brown, S. S., Archibald, A. T., Atlas, E., Cohen, R. C., Crowley, J. N., Day, D. A., Donahue, N. M., Fry, J. L., Fuchs, H., Griffin, R. J., Guzman, M. I., Herrmann, H., Hodzic, A., Iinuma, Y., Jimenez, J. L., Kiendler-Scharr, A., Lee, B. H., Luecken, D. J., Mao, J., McLaren, R., Mutzel, A., Osthoff, H. D., Ouyang, B., Picquet-Varrault, B., Platt, U., Pye, H. O. T., Rudich, Y., Schwantes, R. H., Shiraiwa, M., Stutz, J., Thornton, J. A., Tilgner, A., Williams, B. J., and Zaveri, R. A.: Nitrate radicals and biogenic volatile organic compounds: oxidation, mechanisms, and organic aerosol, Atmos. Chem. Phys., 17, 2103–2162, https://doi.org/10.5194/acp-17-2103-2017, 2017.
Notholt, J., Hjorth, J., and Raes, F.: Formation of HNO2 on Aerosol Surfaces During Foggy Periods in the Presence of NO and NO2, Atmos. Environ. A-Gen., 26, 211–217, 1992.
Oswald, R., Behrendt, T., Ermel, M., Wu, D., Su, H., Cheng, Y., Breuninger, C., Moravek, A., Mougin, E., Delon, C., Loubet, B., Pommerening-Roser, A., Sorgel, M., Poschl, U., Hoffmann, T., Andreae, M. O., Meixner, F. X., and Trebs, I.: HONO Emissions from Soil Bacteria as a Major Source of Atmospheric Reactive Nitrogen, Science, 341, 1233–1235, https://doi.org/10.1126/science.1242266, 2013.
Palm, B. B., Campuzano-Jost, P., Day, D. A., Ortega, A. M., Fry, J. L., Brown, S. S., Zarzana, K. J., Dube, W., Wagner, N. L., Draper, D. C., Kaser, L., Jud, W., Karl, T., Hansel, A., Gutiérrez-Montes, C., and Jimenez, J. L.: Secondary organic aerosol formation from in situ OH, O3, and NO3 oxidation of ambient forest air in an oxidation flow reactor, Atmos. Chem. Phys., 17, 5331–5354, https://doi.org/10.5194/acp-17-5331-2017, 2017.
Parrish, D. D., Ryerson, T. B., Holloway, J. S., Neuman, J. A., Roberts, J. M., Williams, J., Stroud, C. A., Frost, G. J., Trainer, M., Hubler, G., Fehsenfeld, F. C., Flocke, F., and Weinheimer, A. J.: Fraction and composition of NOy transported in air masses lofted from the North American continental boundary layer, J. Geophys. Res.-Atmos., 109, D09302, doi10.1029/2003jd004226, 2004.
Pätz, H.-W., Volz-Thomas, A., Hegglin, M. I., Brunner, D., Fischer, H., and Schmidt, U.: In-situ comparison of the NOy instruments flown in MOZAIC and SPURT, Atmos. Chem. Phys., 6, 2401–2410, https://doi.org/10.5194/acp-6-2401-2006, 2006.
Paul, D. and Osthoff, H. D.: Absolute Measurements of Total Peroxy Nitrate Mixing Ratios by Thermal Dissociation Blue Diode Laser Cavity Ring-Down Spectroscopy, Anal. Chem., 82, 6695–6703, https://doi.org/10.1021/ac101441z, 2010.
Paul, D., Furgeson, A., and Osthoff, H. D.: Measurements of total peroxy and alkyl nitrate abundances in laboratory-generated gas samples by thermal dissociation cavity ring-down spectroscopy, Rev. Sci. Instrum., 80, 114101, https://doi.org/10.1063/1.3258204 2009.
Perez, I. M., Wooldridge, P. J., and Cohen, R. C.: Laboratory evaluation of a novel thermal dissociation chemiluminescence method for in situ detection of nitrous acid, Atmos. Environ., 41, 3993–4001, https://doi.org/10.1016/j.atmosenv.2007.01.060, 2007.
Perring, A. E., Pusede, S. E., and Cohen, R. C.: An observational perspective on the atmospheric impacts of alkyl and multifunctional nitrates on ozone and secondary organic aerosol, Chem. Rev., 113, 5848–5870, https://doi.org/10.1021/cr300520x, 2013.
Peukert, S. L., Sivaramakrishnan, R., and Michael, J. V.: High temperature shock tube studies on the thermal decomposition of O3 and the reaction of dimethyl carbonate with O-Atoms, J. Phys. Chem. A, 117, 3729–3738, https://doi.org/10.1021/jp400613p, 2013.
Pilegaard, K.: Processes regulating nitric oxide emissions from soils, Philos. T. Roy. Soc. B, 368, 20130126, https://doi.org/10.1098/rstb.2013.0126, 2013.
Platt, U., Perner, D., and Patz, H. W.: Simultaneous Measurement of Atmospheric CH2O, O3, and NO2 by Differential Optical-Absorption, J. Geophys. Res.-Oceans, 84, 6329–6335, https://doi.org/10.1029/JC084iC10p06329, 1979.
Pohler, D., Vogel, L., Friess, U., and Platt, U.: Observation of halogen species in the Amundsen Gulf, Arctic, by active long-path differential optical absorption spectroscopy, P. Natl. Acad. Sci. USA, 107, 6582–6587, https://doi.org/10.1073/pnas.0912231107, 2010.
Reed, C., Evans, M. J., Di Carlo, P., Lee, J. D., and Carpenter, L. J.: Interferences in photolytic NO2 measurements: explanation for an apparent missing oxidant?, Atmos. Chem. Phys., 16, 4707–4724, https://doi.org/10.5194/acp-16-4707-2016, 2016.
Roberts, J. M.: The atmospheric chemistry of organic nitrates, Atmos. Environ. A-Gen., 24, 243–287, https://doi.org/10.1016/0960-1686(90)90108-y, 1990.
Rollins, A. W., Browne, E. C., Min, K.-E., Pusede, S. E., Wooldridge, P. J., Gentner, D. R., Goldstein, A. H., Liu, S., Day, D. A., Russell, L. M., and Cohen, R. C.: Evidence for NOx Control over Nighttime SOA Formation, Science, 337, 1210–1212, 2012.
Romer, P. S., Duffey, K. C., Wooldridge, P. J., Allen, H. M., Ayres, B. R., Brown, S. S., Brune, W. H., Crounse, J. D., de Gouw, J., Draper, D. C., Feiner, P. A., Fry, J. L., Goldstein, A. H., Koss, A., Misztal, P. K., Nguyen, T. B., Olson, K., Teng, A. P., Wennberg, P. O., Wild, R. J., Zhang, L., and Cohen, R. C.: The lifetime of nitrogen oxides in an isoprene-dominated forest, Atmos. Chem. Phys., 16, 7623–7637, https://doi.org/10.5194/acp-16-7623-2016, 2016.
Romer Present, P. S., Zare, A., and Cohen, R. C.: The changing role of organic nitrates in the removal and transport of NOx, Atmos. Chem. Phys., 20, 267–279, https://doi.org/10.5194/acp-20-267-2020, 2020.
Rosen, R. S., Wood, E. C., Wooldridge, P. J., Thornton, J. A., Day, D. A., Kuster, W., Williams, E. J., Jobson, B. T., and Cohen, R. C.: Observations of total alkyl nitrates during Texas Air Quality Study 2000: Implications for O3 and alkyl nitrate photochemistry, J. Geophys. Res.-Atmos., 109, D07303, https://doi.org/10.1029/2003jd004227, 2004.
Sadanaga, Y., Takaji, R., Ishiyama, A., Nakajima, K., Matsuki, A., and Bandow, H.: Thermal dissociation cavity attenuated phase shift spectroscopy for continuous measurement of total peroxy and organic nitrates in the clean atmosphere, Rev. Sci. Instrum., 87, 074102, https://doi.org/10.1063/1.4958167, 2016.
Schlesinger, W. H. and Hartley, A. E.: A Global Budget for Atmospheric NH3, Biogeochemistry, 15, 191–211, 1992.
Schuster, G., Labazan, I., and Crowley, J. N.: A cavity ring down/cavity enhanced absorption device for measurement of ambient NO3 and N2O5, Atmos. Meas. Tech., 2, 1–13, https://doi.org/10.5194/amt-2-1-2009, 2009.
Shirahama, N., Moon, S. H., Choi, K. H., Enjoji, T., Kawano, S., Korai, Y., Tanoura, M., and Mochida, I.: Mechanistic study on adsorption and reduction of NO2 over activated carbon fibers, Carbon, 40, 2605–2611, https://doi.org/10.1016/S0008-6223(02)00190-2, 2002.
Slusher, D. L., Huey, L. G., Tanner, D. J., Chen, G., Davis, D. D., Buhr, M., Nowak, J. B., Eisele, F. L., Kosciuch, E., Mauldin, R. L., Lefer, B. L., Shetter, R. E., and Dibb, J. E.: Measurements of pernitric acid at the South Pole during ISCAT 2000, Geophys. Res. Lett., 29, 2011, https://doi.org/10.1029/2002gl015703, 2002.
Sobanski, N., Schuladen, J., Schuster, G., Lelieveld, J., and Crowley, J. N.: A five-channel cavity ring-down spectrometer for the detection of NO2, NO3, N2O5, total peroxy nitrates and total alkyl nitrates, Atmos. Meas. Tech., 9, 5103–5118, https://doi.org/10.5194/amt-9-5103-2016, 2016.
Sobanski, N., Thieser, J., Schuladen, J., Sauvage, C., Song, W., Williams, J., Lelieveld, J., and Crowley, J. N.: Day and night-time formation of organic nitrates at a forested mountain site in south-west Germany, Atmos. Chem. Phys., 17, 4115–4130, https://doi.org/10.5194/acp-17-4115-2017, 2017.
Su, H., Cheng, Y. F., Oswald, R., Behrendt, T., Trebs, I., Meixner, F. X., Andreae, M. O., Cheng, P., Zhang, Y., and Poschl, U.: Soil Nitrite as a Source of Atmospheric HONO and OH Radicals, Science, 333, 1616–1618, https://doi.org/10.1126/science.1207687, 2011.
Tadic, I., Crowley, J. N., Dienhart, D., Eger, P., Harder, H., Hottmann, B., Martinez, M., Parchatka, U., Paris, J.-D., Pozzer, A., Rohloff, R., Schuladen, J., Shenolikar, J., Tauer, S., Lelieveld, J., and Fischer, H.: Net ozone production and its relationship to nitrogen oxides and volatile organic compounds in the marine boundary layer around the Arabian Peninsula, Atmos. Chem. Phys., 20, 6769–6787, https://doi.org/10.5194/acp-20-6769-2020, 2020.
Talukdar, R. K., Burkholder, J. B., Schmoltner, A. M., Roberts, J. M., Wilson, R. R., and Ravishankara, A. R.: Investigation of the loss processes for peroxyacetyl nitrate in the atmosphere: UV photolysis and reaction with OH, J. Geophys. Res.-Atmos., 100, 14163–14173, https://doi.org/10.1029/95jd00545, 1995.
Talukdar, R. K., Herndon, S. C., Burkholder, J. B., Roberts, J. M., and Ravishankara, A. R.: Atmospheric fate of several alkyl nitrates .1. Rate coefficients of the reactions alkyl nitrates with isotopically labelled hydroxyl radicals, J. Chem. Soc. Faraday T., 93, 2787–2796, 1997.
Tang, M. J., Cox, R. A., and Kalberer, M.: Compilation and evaluation of gas phase diffusion coefficients of reactive trace gases in the atmosphere: volume 1. Inorganic compounds, Atmos. Chem. Phys., 14, 9233–9247, https://doi.org/10.5194/acp-14-9233-2014, 2014.
Thaler, R. D., Mielke, L. H., and Osthoff, H. D.: Quantification of nitryl chloride at part per trillion mixing ratios by thermal dissociation cavity ring-down spectroscopy, Anal. Chem., 83, 2761–2766, https://doi.org/10.1021/ac200055z, 2011.
Thieser, J., Schuster, G., Schuladen, J., Phillips, G. J., Reiffs, A., Parchatka, U., Pöhler, D., Lelieveld, J., and Crowley, J. N.: A two-channel thermal dissociation cavity ring-down spectrometer for the detection of ambient NO2, RO2NO2 and RONO2, Atmos. Meas. Tech., 9, 553–576, https://doi.org/10.5194/amt-9-553-2016, 2016.
Tingey, D. T., Manning, M., Grothaus, L. C., and Burns, W. F.: Influence of Light and Temperature on Isoprene Emission Rates from Live Oak, Physiol. Plant., 47, 112–118, https://doi.org/10.1111/j.1399-3054.1979.tb03200.x, 1979.
Tsang, W. and Herron, J. T.: Chemical kinetic data base for propellant combustion. I. Reactions involving NO, NO2, HNO, HNO2, HCN and N2O, J. Phys. Chem. Ref. Data, 20, 609–663, 1991.
Vandaele, A. C., Hermans, C., Fally, S., Carleer, M., Colin, R., Merienne, M. F., Jenouvrier, A., and Coquart, B.: High-resolution Fourier transform measurement of the NO2 visible and near-infrared absorption cross sections: Temperature and pressure effects, J. Geophys. Res.-Atmos., 107, 4348, https://doi.org/10.1029/2001JD000971, 2002.
von der Weiden, S.-L., Drewnick, F., and Borrmann, S.: Particle Loss Calculator – a new software tool for the assessment of the performance of aerosol inlet systems, Atmos. Meas. Tech., 2, 479–494, https://doi.org/10.5194/amt-2-479-2009, 2009.
Wang, S. S., Nan, J. L., Shi, C. Z., Fu, Q. Y., Gao, S., Wang, D. F., Cui, H. X., Saiz-Lopez, A., and Zhou, B.: Atmospheric ammonia and its impacts on regional air quality over the megacity of Shanghai, China, Sci. Rep.-UK, 5, 15842, https://doi.org/10.1038/srep15842, 2015.
Wild, R. J., Edwards, P. M., Dube, W. P., Baumann, K., Edgerton, E. S., Quinn, P. K., Roberts, J. M., Rollins, A. W., Veres, P. R., Warneke, C., Williams, E. J., Yuan, B., and Brown, S. S.: A measurement of total reactive nitrogen, NOy, together with NO2, NO, and O3 via cavity ring-down spectroscopy, Environ. Sci. Technol., 48, 9609–9615, https://doi.org/10.1021/es501896w, 2014.
Williams, E. J., Baumann, K., Roberts, J. M., Bertman, S. B., Norton, R. B., Fehsenfeld, F. C., Springston, S. R., Nunnermacker, L. J., Newman, L., Olszyna, K., Meagher, J., Hartsell, B., Edgerton, E., Pearson, J. R., and Rodgers, M. O.: Intercomparison of ground-based NOy measurement techniques, J. Geophys. Res.-Atmos., 103, 22261–22280, https://doi.org/10.1029/98jd00074, 1998.
Wollenhaupt, M., Carl, S. A., Horowitz, A., and Crowley, J. N.: Rate coefficients for reaction of OH with acetone between 202 and 395 K, J. Phys. Chem. 104, 2695–2705, 2000.
Womack, C. C., Neuman, J. A., Veres, P. R., Eilerman, S. J., Brock, C. A., Decker, Z. C. J., Zarzana, K. J., Dube, W. P., Wild, R. J., Wooldridge, P. J., Cohen, R. C., and Brown, S. S.: Evaluation of the accuracy of thermal dissociation CRDS and LIF techniques for atmospheric measurement of reactive nitrogen species, Atmos. Meas. Tech., 10, 1911–1926, https://doi.org/10.5194/amt-10-1911-2017, 2017.
Wooldridge, P. J., Perring, A. E., Bertram, T. H., Flocke, F. M., Roberts, J. M., Singh, H. B., Huey, L. G., Thornton, J. A., Wolfe, G. M., Murphy, J. G., Fry, J. L., Rollins, A. W., LaFranchi, B. W., and Cohen, R. C.: Total Peroxy Nitrates (ΣPNs) in the atmosphere: the Thermal Dissociation-Laser Induced Fluorescence (TD-LIF) technique and comparisons to speciated PAN measurements, Atmos. Meas. Tech., 3, 593–607, https://doi.org/10.5194/amt-3-593-2010, 2010.
Xu, L., Suresh, S., Guo, H., Weber, R. J., and Ng, N. L.: Aerosol characterization over the southeastern United States using high-resolution aerosol mass spectrometry: spatial and seasonal variation of aerosol composition and sources with a focus on organic nitrates, Atmos. Chem. Phys., 15, 7307–7336, https://doi.org/10.5194/acp-15-7307-2015, 2015.
Yamamoto, N., Kabeya, N., Onodera, M., Takahahi, S., Komori, Y., Nakazuka, E., and Shirai, T.: Seasonal-Variation of Atmospheric Ammonia and Particulate Ammonium Concentrations in the Urban Atmosphere of Yokohama over a 5-Year Period, Atmos. Environ., 22, 2621–2623, https://doi.org/10.1016/0004-6981(88)90498-2, 1988.
Yao, X. and Zhang, L.: Trends in atmospheric ammonia at urban, rural, and remote sites across North America, Atmos. Chem. Phys., 16, 11465–11475, https://doi.org/10.5194/acp-16-11465-2016, 2016.
York, D.: Least-Squares Fitting of a Straight Line, Can. J. Phys., 44, 1079–1086, https://doi.org/10.1139/p66-090, 1966.
Zare, A., Romer, P. S., Nguyen, T., Keutsch, F. N., Skog, K., and Cohen, R. C.: A comprehensive organic nitrate chemistry: insights into the lifetime of atmospheric organic nitrates, Atmos. Chem. Phys., 18, 15419–15436, https://doi.org/10.5194/acp-18-15419-2018, 2018.
Zasypkin, A. Y., Grigoreva, V. M., Korchak, V. N., and Gershenson, Y. M.: A formula for summing of kinetic resistances for mobile and stationary media: 1. Cylindrical reactor, Kinet. Catal.+, 38, 772–781, 1997.
Zenker, T., Fischer, H., Nikitas, C., Parchatka, U., Harris, G. W., Mihelcic, D., Müsgen, P., Pätz, H. W., Schultz, M., Volz-Thomas, A., Schmitt, R., Behmann, T., Weißenmayer, M., and Burrows, J. P.: Intercomparison of NO, NO2, NOy, O3, and ROx measurements during the Oxidizing Capacity of the Tropospheric Atmosphere (OCTA) campaign 1993 at Izaña, J. Geophys. Res.-Atmos., 103, 13615–13634, https://doi.org/10.1029/97jd03739, 1998.
Zhang, W. J., Bagreev, A., and Rasouli, F.: Reaction of NO2 with activated carbon at ambient temperature, Ind. Eng. Chem. Res., 47, 4358–4362, https://doi.org/10.1021/ie800249s, 2008.