the Creative Commons Attribution 4.0 License.
the Creative Commons Attribution 4.0 License.
 | 09 Nov 2020
Optimizing the detection, ablation, and ion extraction efficiency of a single-particle laser ablation mass spectrometer for application in environments with low aerosol particle concentrations
Hans-Christian Clemen
Johannes Schneider
Thomas Klimach
Frank Helleis
Franziska Köllner
Andreas Hünig
Florian Rubach
Stephan Mertes
Heike Wex
Frank Stratmann
André Welti
Rebecca Kohl
Fabian Frank
Stephan Borrmann
The aim of this study is to show how a newly developed aerodynamic lens system (ALS), a delayed ion extraction (DIE), and better electric shielding improve the efficiency of the Aircraft-based Laser ABlation Aerosol MAss spectrometer (ALABAMA). These improvements are applicable to single-particle laser ablation mass spectrometers in general. To characterize the modifications, extensive size-resolved measurements with spherical polystyrene latex particles (PSL; 150–6000 nm) and cubic sodium chloride particles (NaCl; 400–1700 nm) were performed. Measurements at a fixed ALS position show an improved detectable particle size range of the new ALS compared to the previously used Liu-type ALS, especially for supermicron particles. At a lens pressure of 2.4 hPa, the new ALS achieves a PSL particle size range from 230 to 3240 nm with 50 % detection efficiency and between 350 and 2000 nm with 95 % detection efficiency. The particle beam divergence was determined by measuring the detection efficiency at variable ALS positions along the laser cross sections and found to be minimal for PSL at about 800 nm. Compared to measurements by single-particle mass spectrometry (SPMS) instruments using Liu-type ALSs, the minimum particle beam divergence is shifted towards larger particle sizes. However, there are no disadvantages compared to the Liu-type lenses for particle sizes down to 200 nm. Improvements achieved by using the DIE and an additional electric shielding could be evaluated by size-resolved measurements of the hit rate, which is the ratio of laser pulses yielding a detectable amount of ions to the total number of emitted laser pulses. In particular, the hit rate for multiply charged particles smaller than 500 nm is significantly improved by preventing an undesired deflection of these particles in the ion extraction field. Moreover, it was found that by using the DIE the ion yield of the ablation, ionization, and ion extraction process could be increased, resulting in up to 7 times higher signal intensities of the cation spectra. The enhanced ion yield results in a larger effective width of the ablation laser beam, which in turn leads to a hit rate of almost 100 % for PSL particles in the size range from 350 to 2000 nm. Regarding cubic NaCl particles the modifications of the ALABAMA result in an up to 2 times increased detection efficiency and an up to 5 times increased hit rate. The need for such instrument modifications arises in particular for measurements of particles that are present in low number concentrations such as ice-nucleating particles (INPs) in general, but also aerosol particles at high altitudes or in pristine environments. Especially for these low particle number concentrations, improved efficiencies help to overcome the statistical limitations of single-particle mass spectrometer measurements. As an example, laboratory INP measurements carried out in this study show that the application of the DIE alone increases the number of INP mass spectra per time unit by a factor of 2 to 3 for the sampled substances. Overall, the combination of instrument modifications presented here resulted in an increased measurement efficiency of the ALABAMA for different particle types and particles shape as well as for highly charged particles.
- Article
(5572 KB) - Full-text XML
-
Supplement
(2220 KB) - BibTeX
- EndNote


Single-particle mass spectrometry (SPMS) is an in situ method to analyze the chemical composition of single aerosol particles. Measurements of particle chemical composition improve our knowledge of particle sources and atmospheric processing. This knowledge is necessary for a better understanding of aerosol–radiation and aerosol–cloud interactions and thus the contribution of aerosol particles to radiative forcing (Haywood and Boucher, 2000; Boucher et al., 2013; Stocker et al., 2013). However, due to a large number of poorly constrained parameters the estimates of aerosol forcing are still subject to large uncertainties (e.g., Boucher et al., 2013; Stocker et al., 2013; IPCC, 2014; Prospero et al., 2010). In particular, the contribution of ice-nucleating particles (INPs) to aerosol–cloud interactions can only be estimated under various assumptions due to their partly unknown chemical composition, different possible freezing processes, and the limited number of suitable aircraft-based measurements (Boucher et al., 2013; Cziczo et al., 2017; Kanji et al., 2017; Heymsfield and Willis, 2014; DeMott et al., 2011; Gettelman et al., 2012).
One method to analyze the chemical composition of INPs is a combination of an ice nucleation chamber, a pumped counterflow virtual impactor (PCVI; Boulter et al., 2006; Kulkarni et al., 2011a), and an SPMS instrument as described in Hiranuma et al. (2016), Schenk et al. (2014), Corbin et al. (2012), Baustian et al. (2012), and Cziczo et al. (2003). In short, the ice chamber serves to initiate heterogeneous ice nucleation, which is triggered by INPs. After a defined residence and growth time in the ice chamber, the ice crystals are separated from the background aerosol particles and from activated droplets using the PCVI. After the separation of the ice crystals, their water content is sublimated or evaporated such that the ice residuals can be chemically analyzed with the SPMS instrument. However, several difficulties arise when using this combination of devices as described in Schenk et al. (2014). Together with the typically low atmospheric INP number concentration between about 10−6 and 104 stdL−1 (Kanji et al., 2017; Cziczo et al., 2017), the statistical limitation became a decisive problem in these measurements. This requires a high measurement efficiency of instruments analyzing the particle chemical composition. In the past, SPMS instruments showed low lens transmission, particle detection, and/or ablation and ionization efficiencies. For example, in Cziczo et al. (2003) a particle transmission efficiency of about 10 % is given for the inlet of the particle analysis by laser mass spectrometry (PALMS) instrument. As described in Corbin et al. (2012), an aerosol time-of-flight mass spectrometer (ATOFMS) typically achieved a detection efficiency of less than 10 %, which in turn was one of the reasons why only 196 INP mass spectra were recorded with the ATOFMS within 35 h in their study. As a consequence, the authors stated that it was not possible to quantify the importance of the measured potential INPs due to the statistical limitations (Corbin et al., 2012). It should also be mentioned that in general the duration of an experiment that can be run with an ice nucleation chamber is limited such that the statistical limitations cannot be simply overcome by increasing the measurement time. Particularly, the Aircraft-based Laser ABlation Aerosol MAss spectrometer (ALABAMA) in connection with an ice nucleation chamber and PCVI had issues with the particle counting statistics and the hit rate of the INPs. Atmospheric INP measurements showed a significant decrease in hit rate compared to the measurement of the atmospheric aerosol particles without prior ice activation and separation. Thus, the hit rate decreased from typical values by 10 %–20 % (Köllner, 2020; Schneider et al., 2020) to 0 %–2 %.
Transmission efficiencies, detection efficiencies, and hit rates well below 100 % indicate the challenges and optimization potential for single-particle mass spectrometers. Several instrument sections of the SPMS are particularly decisive for low efficiencies. First, the inlet system consisting of a critical nozzle and an aerodynamic lens is characterized by the particle transmission efficiency. Second, the particle detection efficiency is dependent on the focusing width of the particle beam and the sensitivity of the detection units. Third, the hit rate is determined not only by the absorption efficiency and the ionization efficiency of the particle components, but also by other factors, such as electrostatic forces within the mass spectrometer and the time interval between the ionization of particle fragments and ion extraction, as presented in this paper.
In this paper, we report on a modified inlet system for the ALABAMA, also known as an aerodynamic lens system. In this context, we have analyzed the dependencies of the detection efficiency and particle beam properties on particle size and lens pressure associated with the new aerodynamic lens system. Additionally, we report how the application of a delayed ion extraction and shielding of the electric field created by the ion optics affects the hit rate. The results are compared to results obtained using two configurations without a delayed ion extraction. In this context, we discuss the particle-size-dependent influence of particle charges and the influence of ion extraction efficiency on the hit rate.
Figure 1 shows a schematic of the bipolar single-particle laser ablation mass spectrometer ALABAMA. The setup can be subdivided into three different sections based on the respective modes of operation.
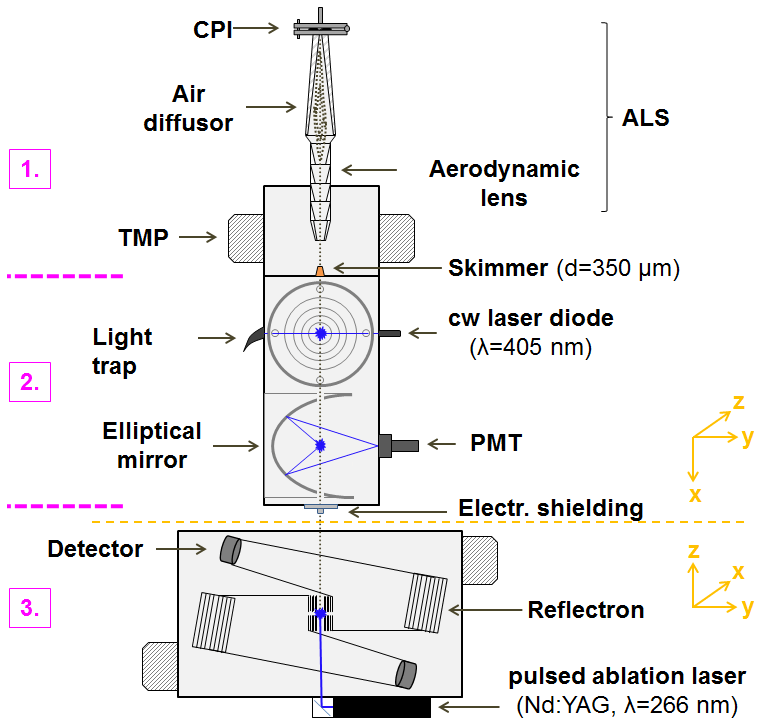
Figure 1Schematic of the ALABAMA (modified according to Brands et al., 2011), with subdivision of three sections according to their functional principles. The gray dotted line indicates the flight path of the aerosol particles from the inlet to the ablation spot. Abbreviations: ALS – aerodynamic lens system, CPI – constant pressure inlet, TMP – turbomolecular pump, PMT – photomultiplier tube, cw – continuous wave.
In the first section, the aerosol particles are focused into a narrow particle beam and are separated from the surrounding air as efficiently as possible. To achieve this, the particles in the sample flow (1.06–2.1 cm3 s−1 at lens pressure of 1.5–2.6 hPa) are first passed through an aerodynamic lens system (ALS) consisting of a constant pressure inlet (CPI), an air diffusor, and an aerodynamic lens. The actual focusing of the particles takes place in the aerodynamic lens. In short, a series of orifices with different diameters initially reduce the cross section of the airflow. Due to the reduced cross section, the streamlines of the air are radially shifted, and thus the particle trajectories are also shifted in the direction of the centerline of the aerodynamic lens. This causes the particles to move away from the streamlines of the air at different distances depending on their inertia. After passing through the single orifices, the air expands back to the original cross section. However, the particles can only partially follow the streamlines of the air. As a result, the particle radial position behind the single orifices usually deviates from the corresponding air streamline radial position, which is described by the particle stream contraction factor (Liu et al., 1995a). Ideally, at the exit of the ALS, the vast majority of particles are focused on a line on the axis of rotation of the aerodynamic lens. After leaving the ALS, a large portion of the air expands into the first pump stage ( hPa) and is removed. To reduce the amount of air reaching the detection stage (Sect. 2), a skimmer with a diameter of 350 µm is installed between the first and second section. Assuming optimal focusing, the particles are not influenced by the expanding air and can therefore continue to fly unhindered through the skimmer.
In the second section, the particles are detected and their velocity is measured. The particle velocity is determined using the flight time of the particles between two continuous wave detection laser beams (λ=405 nm, referred to as detection lasers herein). To achieve this, the particles have to pass through the detection lasers in such a way that a sufficiently large light-scattering signal is detected by the photomultiplier tube (PMT) at each detection unit. Elliptical mirrors and signal amplifiers are used to detect even weak scattering signals from small particles (down to 100 nm) or at the edges of the detection lasers (for further details, see Brands et al., 2011, although in the original ALABAMA version a wavelength of 532 nm was used). All particles that produce two detectable light-scattering signals within a defined time interval (∼0.3–1.3 ms) are referred to as sized particles in the following, since only for such particles can a vacuum aerodynamic diameter (dva) be determined. Size determination is performed by converting the flight time of the particles (DeCarlo et al., 2004) using a size calibration performed with particle size standards (see Sect. S1 in the Supplement). The determined particle velocities are also required to trigger the pulsed ablation laser (λ=266 nm, max. repetition rate 20 Hz, Nd:YAG laser; Quantel Laser, 2019).
The evaporation of the particles and the ionization of their molecular fragments by the ablation laser pulse take place in the third section, the mass spectrometer (Z-shaped bipolar ToF-MS; TOFWERK AG, Thun Switzerland). As soon as a particle is hit by an intense laser pulse, a part of the available energy can be absorbed by the matter. The absorption of photons leads to an electronic excitation, which can return back to the ground state via a transition in the vibrational energy levels of molecules within the particles. The laser pulse duration of a few nanoseconds is significantly longer than the time required for transferring energy from the electrons to the atomic lattice. This enables the conversion of a large portion of the energy into heat, which in turn leads to a complete or at least a partial ablation of the particles (Klimach, 2012; Drewnick, 2000; Miller, 1994). Whether a particle is ablated completely, partially, or not at all depends, among other things, on the power density of the laser pulse. At power densities of the laser above ∼108 W cm−2, the ablation of the sample material is accompanied by the formation of ions or the formation of a plasma within the ablation plume in which atoms and molecules can partially be ionized (Amoruso et al., 1998; Drewnick, 2000; Miller, 1994; Conzemius and Capellen, 1980). The formation of ions is essentially limited to the duration of the laser pulse (Van Breemen et al., 1983).
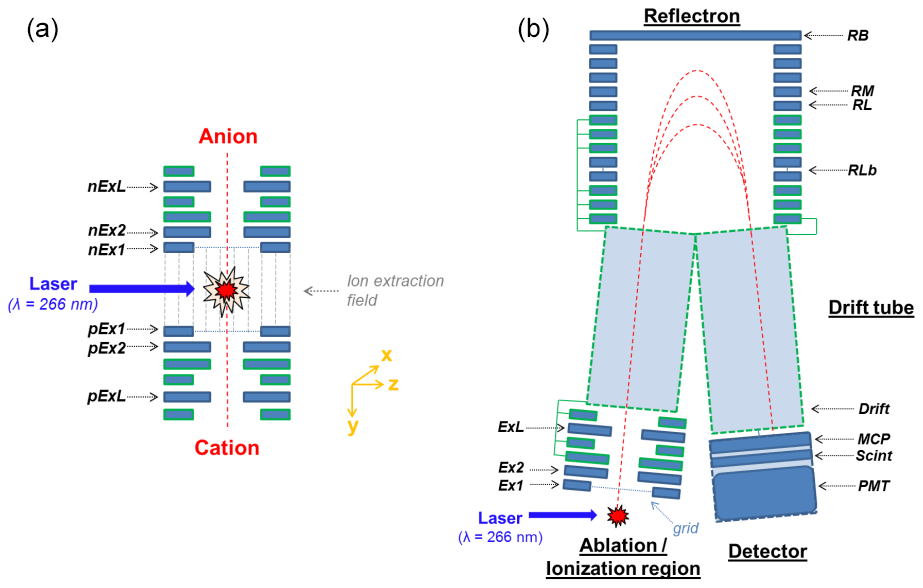
Figure 2Cross-sectional view of the ion optics within the mass spectrometer. (a) Ion extraction components, consisting of several consecutive ring electrodes (Ex1, Ex2, and ExL for both polarities). Furthermore, the ablation spot, the ion extraction field between the electrodes nEx1 and pEx1, and the trajectories of the extracted ions are shown. (b) Fictitious ion trajectory (red dashed lines) from the ablation spot to the detectors, shown for one polarity. The ion optics are only shown in cross section, so the ring shape of the electrodes is not visible. The labeling of the electrodes corresponds to their names. Abbreviations: MCP – micro-channel plate, Scint – scintillator, PMT – photomultiplier tube.
After the ion formation process, the positive and negative ions are extracted in opposite directions from the ablation and ionization spot by means of the electric field formed between the first positive (nEx1) and the first negative (pEx1) electrode (see Fig. 2).
Within the electric field, the ions are accelerated and thereby separated depending on their inertia during their further flight path (∼610 mm; Brands et al., 2011) up to the detectors (consisting of a microchannel plate + scintillator + PMT). The time-dependent signals can be converted to a mass spectrum as a function of the mass-to-charge ratio (m∕z) of the ions. By means of a reflectron (see Fig. 2), the different initial conditions of the ions caused by the ablation and ion formation process such as location, time, and flight direction are reduced, and thus a higher mass resolution is achieved (Cornett et al., 1992; Mamyrin et al., 1973).
3.1 Aerodynamic lens system (ALS)
The new ALS consists of the CPI (Fig. 3), the air diffusor, and the aerodynamic lens. As part of this study, the ALS was mounted on a new alignment holder, which is shown in Fig. 4 together with the air diffusor and the aerodynamic lens.
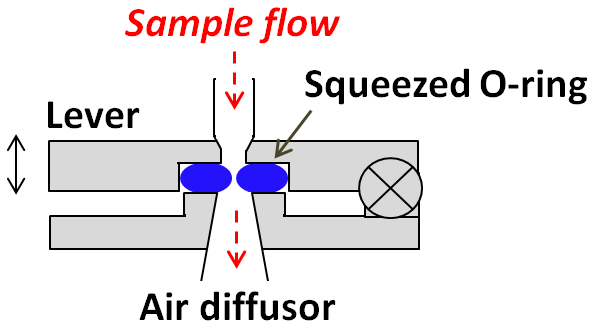
Figure 3Schematic drawing of the constant pressure inlet (CPI) used in the ALABAMA. The double arrow on the lever indicates the possible directions of movement for squeezing the O-ring. The desired position of the lever is reached by means of a motor, which operates as a function of the set lens pressure and the ambient sample air pressure.
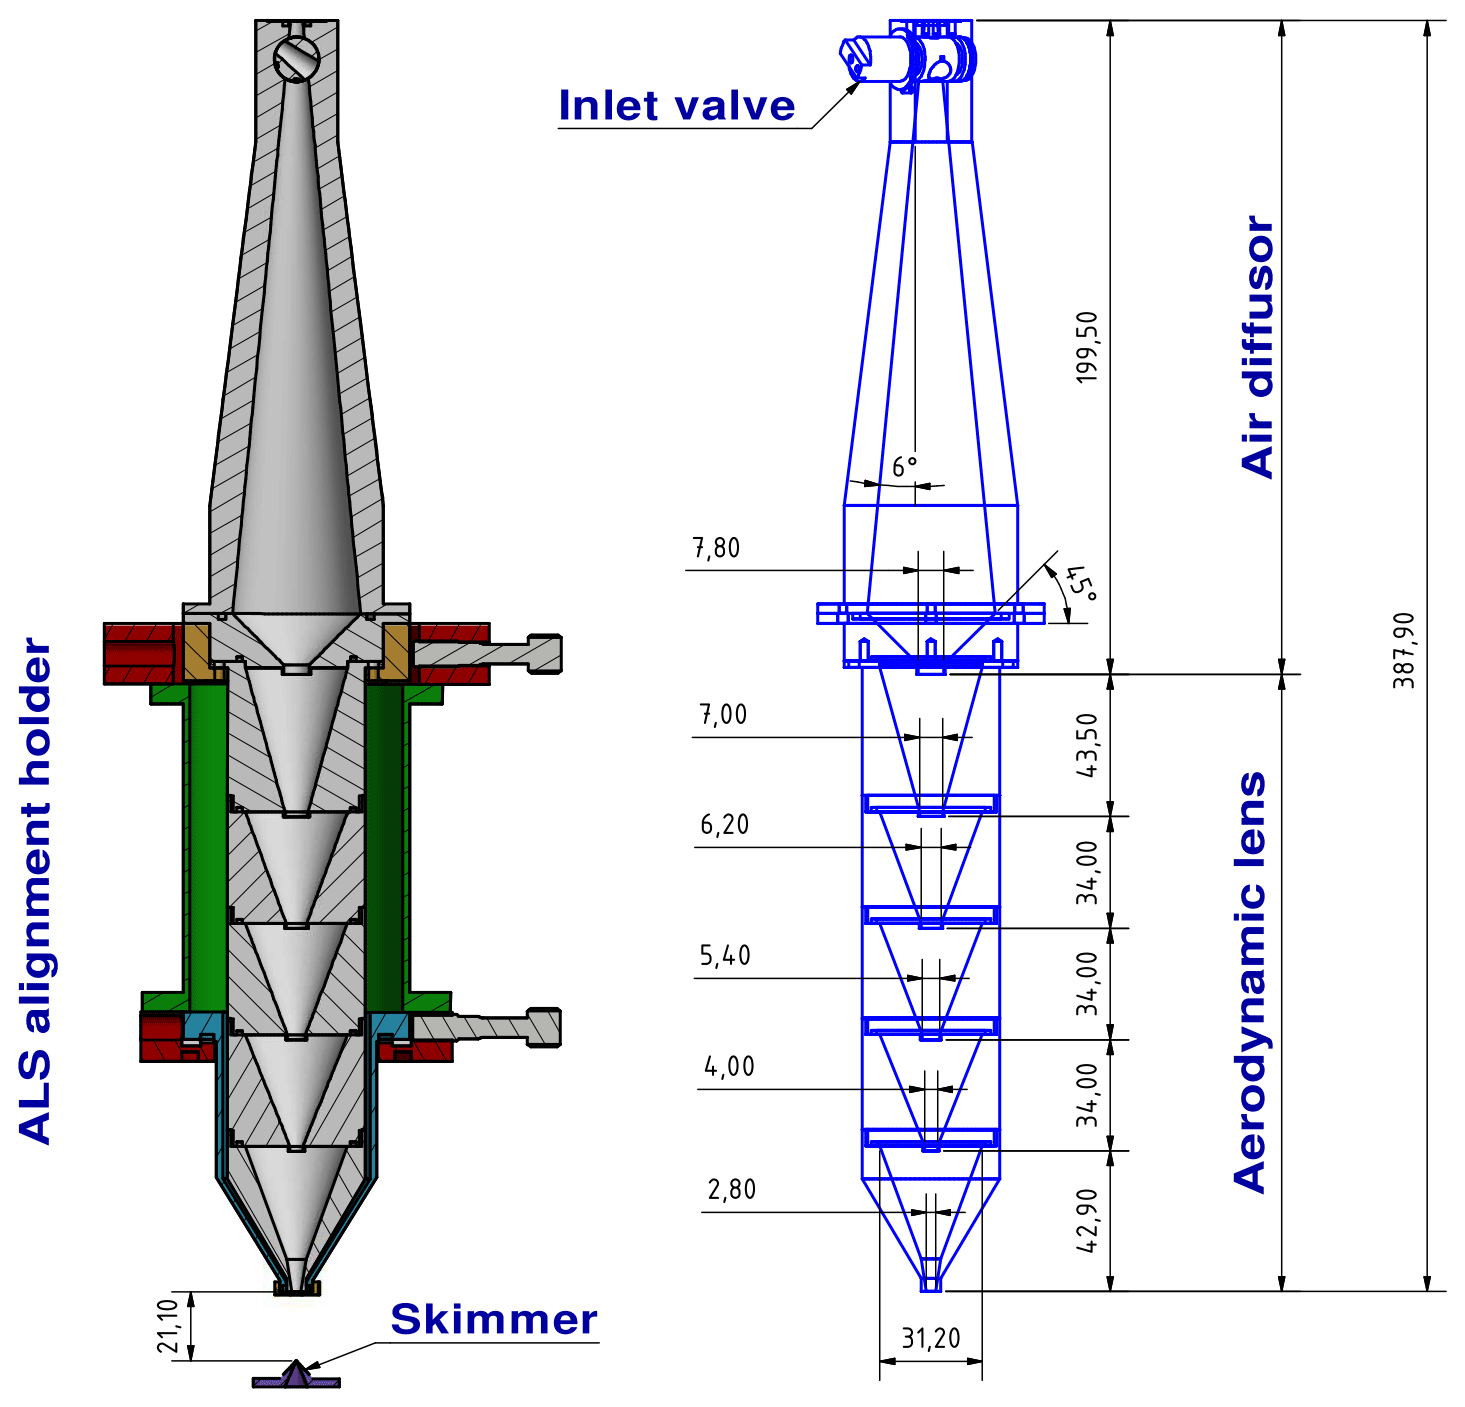
Figure 4Schematic of the new aerodynamic lens, the air diffusor (including a conical-shaped valve), and the ALS alignment holder, as well as the corresponding dimensions in millimeters. On the left side, the cross section of the ALS alignment holder in the x–z plane is presented, which is why only one upper and one lower adjusting screw is shown, whereas the adjusting screws perpendicular to them (in the y direction) are not shown. The two lower screws precisely align the pivot point of the ALS (O-ring center close to the lens exit) centrally above the skimmer; the upper screws tilt the ALS around the pivot point, aligning the aerodynamic particle path to the geometrical detection system axis (see also Sect. S7 in the Supplement). The two upper screws have now been replaced by motors (as described in Sect. 3.1.3). A spring mechanism is used for the required restoring force on the opposite side of the adjusting screws and motors.
3.1.1 Constant pressure inlet and air diffusor
In the ALABAMA, the CPI is used instead of a fixed critical orifice that is frequently adopted for stationary measurements. A schematic of the CPI is shown in Fig. 3. A detailed description of the CPI that is similar to the one used in the ALABAMA is presented by Molleker et al. (2020). Since ALABAMA has been developed particularly for aircraft-based measurements (Schneider et al., 2020; Wendisch et al., 2019; Köllner et al., 2017; Brands et al., 2011), an inlet is required that can quickly adapt to changing atmospheric pressure conditions while still allowing sufficient particle transmission. With the CPI, it is possible to keep the mass flow into the instrument and thus also the pressure within the aerodynamic lens constant.
The principle of the CPI is as follows. The lever with an integrated opening (d=1 mm, with a 45∘ conical inlet in front of it) can be pulled by means of a motor against the fixed base part with the appropriate opening (d=2 mm at the beginning and opening conically downstream at an angle of about 6∘). Between the lever and the base part, there is an in-house-manufactured O-ring with an inner opening diameter of 0.5 mm (Molleker et al., 2020) that encompasses the openings and is squeezed when the lever is pulled down. This allows the O-ring to act as a critical orifice. The squeezing is controlled by a pressure sensor such that the lens pressure can be kept constant for different ambient pressures by changing the O-ring opening. A comparison measurement between a fixed critical orifice and a CPI with the new O-ring type at ground level shows comparable particle-size-dependent transmission behavior for polystyrene latex (PSL) particles (Molleker et al., 2020). In particular, the new in-house-manufactured O-ring type has led to a significantly better transmission of particles compared to previously used commercially available O-rings (Molleker et al., 2020). In addition, compared to a previous version of the CPI (Köllner, 2020), the new design allows a more uniform squeezing of the O-ring such that the circular shape of the opening's cross section is better maintained irrespective of the applied squeezing. Furthermore, compared to the previous version, the new CPI has a reduced inner diameter of the tube on the inlet side (in Fig. 3, from 6.35 to 3.18 mm), which in turn should have a positive effect on particle transmission (Molleker et al., 2020).
The air diffusor is located between the CPI and the aerodynamic lens. This device is used to smoothly expand the air behind the critical orifice at an angle of 6∘, reducing radial flow velocities due to jet expansion (Hwang et al., 2015). This can in turn reduce particle impaction on the walls behind the critical orifice and diffusion losses of small particles due to recirculation in a developing downstream vortex (Hwang et al., 2015; Chen et al., 2007). As shown in Hwang et al. (2015), the downstream vortex in the area of the critical nozzle can be suppressed by reducing the opening angle. However, diffusion losses in the ALS are expected only for particle sizes below 100 nm (Hwang et al., 2015; Chen et al., 2007) and can therefore currently be neglected for the ALABAMA. Much more important is the ability of the air diffusor to increase the transmission of large particles (Hwang et al., 2015; Cahill et al., 2014; Williams et al., 2013). For the transmission of supermicron particles, the inner diameter and length of the air diffusor in relation to the particle velocities are decisive. First, the inner diameter should be larger than the maximum radial stopping distance of the particles. Second, the length of the air diffusor should be larger than the longest axial distance to the bending point of the particle trajectories (Hwang et al., 2015). The stopping distance and the position of the bending point depend on the size, velocity, mass, exit position, and exit angle of the particles with respect to the critical orifice. The diffusor presented in Hwang et al. (2015) is designed for particle sizes up to 10 µm (dva). The resulting length (up to 60 cm) of the diffusor is not suitable for the ALABAMA. Also, it is not necessary to aim for 10 µm particles due to the very low number concentration of such particles at higher altitudes. Thus, we altered the dimension of the air diffusor presented by Hwang et al. (2015). Additionally, a 45∘ taper was implemented at the transition point from the air diffusor to the aerodynamic lens (see Fig. 4) to optimize the transmission of large particles. This in turn reduces the inner diameter of the ALS from a maximum of 39 mm at the end of the diffusor (IDDi(max)) to 7.8 mm at the first single orifice (IDOr(1)). With a comparatively small ratio of 0.2 (IDOr(1)∕IDDi(max)) it can be assumed that the transmission at the upper end of the particle size range drops quite sharply, according to numerical calculations by Zhang et al. (2002). Since no particle focusing has occurred in this section of the ALS, the highest probability of impaction of large particles within the ALS is suspected in the transition from the air diffusor to the aerodynamic lens.
3.1.2 Aerodynamic lens
The concept behind the new aerodynamic lens design is to optimize the particle beam (focusing) properties within the detectable particle size range of the ALABAMA in comparison to the design of the previously installed Liu-type lens (Köllner, 2020; Brands et al., 2011; Kamphus et al., 2008). In addition, the new geometry should reduce impaction losses of large particles. The physical dimensions of the new aerodynamic lens are mainly based on calculations using the aerosol lens calculator (Wang and McMurry, 2006). In particular, the diameters of the individual orifices and the lens were determined with the help of this tool. In order to obtain an optimized particle beam focusing in the detectable particle size range of the ALABAMA, the required lens dimensions were empirically tested with the aerosol lens calculator. A comparison of the resulting calculations for the previous and the new aerodynamic lens design is presented in Sect. S2 in the Supplement. The main focus of this comparison was the size-resolved particle beam width. The particle sizes marked in green (500–2000 nm) are those which theoretically lead to improved particle focusing with the new lens design. However, the calculations with the aerosol lens calculator are based on the assumption that the individual orifices correspond to thin cylindrical disks. This is a major reason why the calculations show that particle transmissions with the new lens design become worse with increasing particle size than with the previous lens design (not shown). To counteract this problem, conical-shaped single orifices were used instead of cylindrical disks. The cone angles were adapted to the lens geometry obtained with the aerosol lens calculator. In the following, the influence of the conical orifice shapes used here is discussed.
The calculations resulted in a significantly larger inner diameter of the lens (IDLe) of 31.2 mm compared to the previously used Liu-type lens (9.5 mm). Due to the larger diameter of the new lens and the enlarged openings of the single orifices (IDOr), we expect a shift in the maximal focusing diameter towards larger particle sizes (Zhang et al., 2002). Compared to the previously used aerodynamic lens, the new design has a different ratio of the IDOr to the IDLe, since the openings of the single orifices have not increased to the same extent. A smaller IDOr∕IDLe results, on the one hand, in a sharper drop at the upper end of the particle size range and, on the other hand, in an enhanced particle beam contraction at a single orifice (Zhang et al., 2002). In this case, the enhanced particle beam contraction would rather lead to an overfocusing of the particles. However, particle overfocusing is compensated for due to the conical shape of the single orifices (Zhang et al., 2002). Further advantages of conical orifices are a reduced particle impaction and thus a better transmission of large particles (Zhang et al., 2002; Chen and Pui, 1995). In addition, the conical shape is intended to reduce the number of edges within the aerodynamic lens and associated recirculation of the airflow. Similarly, the exit nozzle was manufactured with a conical shape, which should further lead to an improved transmission of large particles. Based on the results of the aerosol lens calculator, the diameter of the exit nozzle was reduced from 3.0 to 2.8 mm in order to focus small particle sizes more effectively. With the reduced nozzle opening, the new lens can be operated at a maximum lens pressure of 2.6 hPa. A higher lens pressure is suitable to improve the transmission of supermicron particles and is accompanied by a higher sample flow into the instrument. With a lower lens pressure, however, a lower beam divergence can be achieved for small submicron particles (Zhang et al., 2002). In summary, the new aerodynamic lens system aims to improve transmission and particle beam properties of submicron and supermicron particles.
3.1.3 Alignment holder for the aerodynamic lens system
Compared to the previous version of the ALS alignment holder used in the ALABAMA, the new version (see Fig. 4) has several improvements. The new alignment holder provides two additional degrees of freedom, which allow the aerodynamic lens and thus also the particle beam to be shifted in the y and z direction by means of the lower adjusting screws. Due to the shift, design inaccuracies in the manufacturing can be compensated for. The maximum displacement is limited to ±0.5 mm. Tilting of the ALS is possible by means of the upper screws but was limited to a maximum of , which means a maximum displacement of the particle beam of ±4 mm at the ablation spot (under consideration of the skimmer orifice diameter). Tilting is controlled by two DC motors (Motor Mike – 18012 series; ORIEL INSTRUMENTS, 1991). This has the advantage that positions are reproducible and that an automated scan of the ALS can be conducted, as described below.
3.2 Delayed ion extraction and electric shielding
This section presents modifications that significantly influenced the ALABAMA hit rate (including ablation, ionization, and ion extraction efficiency). As already described in Sect. 2, the particles must be hit by the ablation laser beam to be ablated and to ionize the molecules. For the extraction of the ions an electric field is required that accelerates the cations and anions into the corresponding directions towards the detectors. In addition to the ions, however, the particles themselves can be charged and may thus be deflected on their way through the ion extraction field to the ablation spot, as illustrated in Fig. 5. If charged particles are deflected too far from their original flight direction, they will miss the ablation laser beam.

Figure 5Schematic illustration of charge-dependent particle deflections using a constant electric ion extraction field within the mass spectrometer. The blue arrow shows the particle flight path that is not influenced by the electric field, while the pink arrow indicates the charge-dependent deflection.
In order to prevent such undesired interactions, the ion extraction field can be switched on after the particles have reached the ablation spot. For this, the extraction field is triggered by the detection unit. This procedure is commonly termed delayed ion extraction (Vera et al., 2005; Van Breemen et al., 1983; Wiley and McLaren, 1955).
3.2.1 Particle deflection in the ion extraction field
In order to assess the influence of the constant ion extraction field on charged particles, their deflection in the y direction is first determined theoretically (see Eq. 1). According to the derivation shown in Sect. S3 in the Supplement, the following equation results for the deflection of the particles at the ablation spot:
where z is the charge number, e is the elementary charge constant, Uy is the voltage difference between the positive and the negative electrode, L is the flight distance in the electric field (in the x direction), ρp is the particle density, rp is the particle radius, dEx is the distance between the two electrodes, and v is the particle velocity in the x direction.
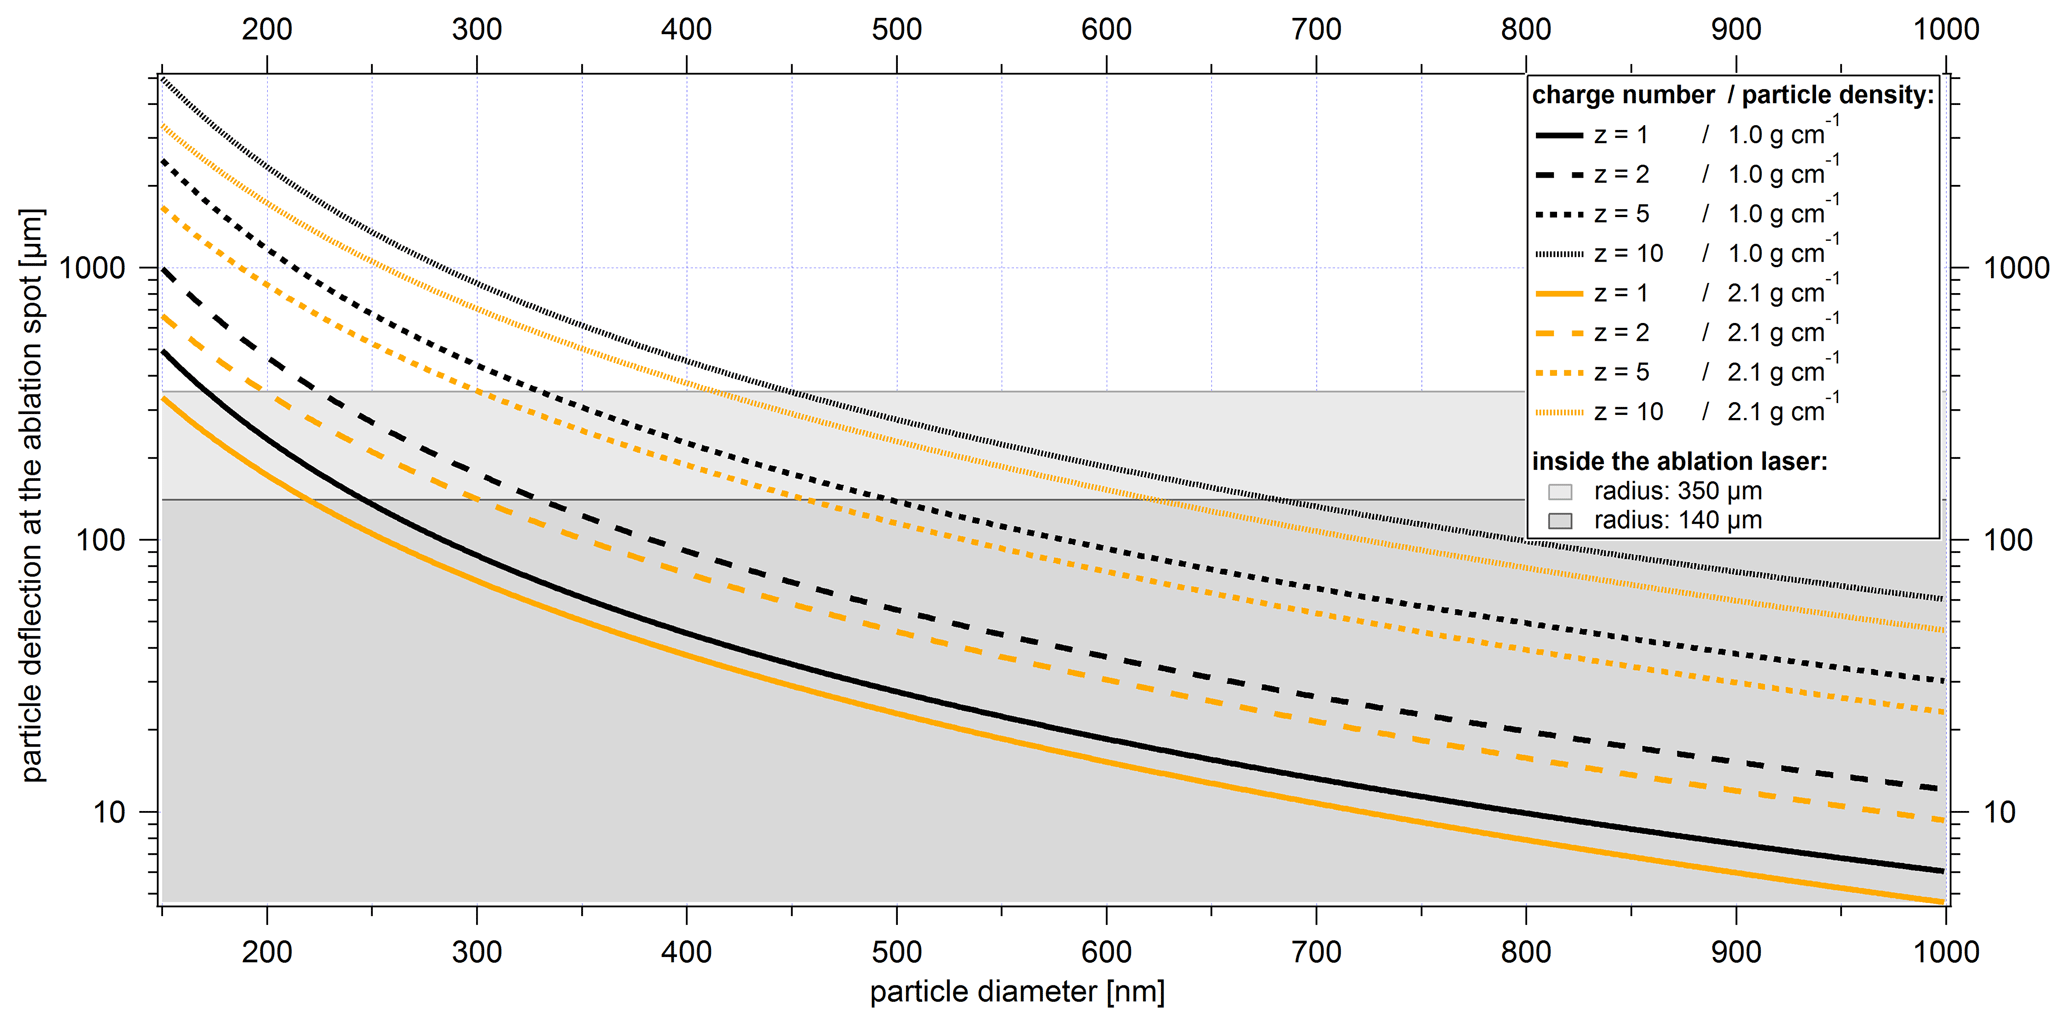
Figure 6Calculated particle deflection from the undisturbed flight path of the particles through the center of the ablation laser beam for different particle diameters (corresponding to particle velocities), particle charge numbers, and particle densities. Charge numbers and particle densities are represented by different styles and colors of the lines, respectively. The gray areas show the size range of half the ablation laser beam width (simplified assumption of an effective width of the ablation laser beam of either 280 or 700 µm as used in Brands et al., 2011, neglecting particle size and particle type). Particles outside the colored background are likely to miss the ablation laser beam. The particle densities used correspond approximately to those of PSL with ρ=1.05 g cm−3 and sodium chloride with ρ=2.17 g cm−3.
Using the extraction voltages applied in the ALABAMA ( V, V) and the measured particle velocities, we can calculate the deflections of particles from their undisturbed flight path. The flight distance L in the electric field is assumed to be half the length of the first electrodes in the x direction. The results for different particle diameters, charges, and densities are presented in Fig. 6.
The diameter of the laser beam at the ablation spot in the ALABAMA is in the range of several hundred micrometers (in this study, Roth, 2014, and Brands et al., 2011). However, it is shown below that the effective width of the ablation laser beam in the ALABAMA is size-dependent and decreases towards small particle sizes. Thus, a considerable influence on the ablation efficiency can be expected, especially for particles with diameters of a few hundred nanometers if they carry a sufficient number of charges.
In clouds considerably higher charge numbers can occur than those assumed in Fig. 6. Especially in mixed-phase clouds, different processes can occur that result in the presence of charged cloud particles and contribute to thunderstorm electrification (Saunders, 2008). Hallett and Saunders (1979), for example, investigated ice splinter charging during the Hallett–Mossop ice multiplication process and found that an ejected ice fragment had a negative charge of the order of C, which would correspond to a charge number z of about 600. Even though the Hallett–Mossop mechanism is an important source of ice particles in clouds, especially at temperatures between −3 and −8 ∘C (Saunders, 2008), the aforementioned charge number can only serve as a rough orientation for ice crystals containing ice nuclei. Determining the charge numbers of ice particle residuals is hardly possible due to the difficulty of measuring them and their low concentrations. Aircraft-based investigations of cloud droplet residuals from convective clouds (only water phase) resulted in charge numbers in the range of to (Stephan Mertes, personal communication, 2020). As a conclusion, preventing the deflection of charged particles in the ion extraction field should be of particular importance for measurements of cloud residuals.
3.2.2 Delayed ion extraction
Delayed ion extraction (DIE) is basically not a new method, but it has already been introduced to improve mass resolution (Hinz et al., 2011; Brands, 2009; Vera et al., 2005). The focus of this work is on the influence of DIE on the hit rate (including ablation, ionization, and ion extraction efficiency). DIE is a method to control the electric ion extraction field between both the first negative and first positive electrode (in this case pEx1 and nEx1; Fig. 2). This means that the high voltages applied to the electrodes can precisely be turned on and off such that in the ideal case the ion extraction field is only generated when the particles have already been hit by the ablation laser beam. Compared to the previously used permanent electric field, DIE can generate an almost field-free space for the flight path of the particles to the ablation spot.
Here, DIE is realized by fast high-voltage transistor switches (HTS 50; Behlke Power Electronics GmbH, 2019) to trigger the high voltages within the ALABAMA mass spectrometer. The HTSs are installed in an external box between the high-voltage-generating modules and the connections of the electrodes on the mass spectrometer and connected to both by high-voltage cables. Only the electrodes pEx1 and nEx1 are controlled by DIE, since the electric field in the extraction region is predominantly influenced by their voltages. The following electrodes, nEx2 and pEx2, have only a minor influence on the extraction region between nEx1 and pEx1 because they are shielded by thin grids wrapped around nEx1 and pEx1. The HTS trigger signals are generated by the ALABAMA control electronics. Taking into account the particle velocities, the control electronics trigger the flash lamp and the Q-switch in the ablation laser as well as the signal for the HTS (DIE trigger) in a precise chronological sequence as shown in Fig. 7. Thus, the laser pulse and the time of switching on the ion extraction field can be synchronized.
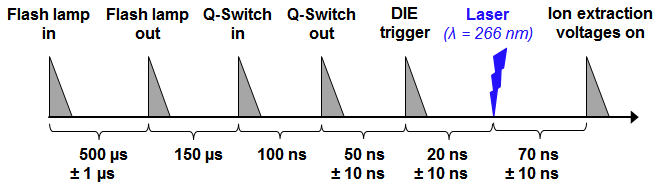
Figure 7Time diagram of the trigger signals of the ablation laser, the laser pulse, and the time-controlled switching process of the high voltages at the first electrodes (modified after Brands, 2009). Flash lamp in: trigger signal for the flash lamp in the laser; flash lamp out: actual triggering of the flash lamp; Q-switch in: trigger signal for the Q-switch of the laser; Q-switch out: actual triggering of the Q-switch; DIE trigger: trigger signal for the HTS. The triangles shown in the figure were only used for better visualization and do not represent the decay times of the signals. The uncertainty values correspond to the reading accuracy at the oscilloscope.
The time intervals between flash lamp in and flash lamp out, Q-switch in and Q-switch out, and Q-switch out and the laser pulse have been previously experimentally determined in our group (Brands et al., 2011; Brands, 2009). The DIE trigger signal can be varied between 2 µs before and 150 ns after the Q-switch out trigger signal, which also shifts the time of switching on the ion extraction field. This allows the HTS turn-on delay time of 50 ns and the HTS turn-on rise time of about 5 ns to be taken into account. The optimal time for the DIE trigger signal and the associated switching on of the ion extraction field was empirically determined by observing the width and height of the potassium ion signals at m∕z 39 and m∕z 41. Subsequently, the DIE-related time intervals were determined with respect to the Q-switch out signal. The DIE was measured at the connections of the high-voltage cables on the mass spectrometer housing by observing the triggered high-voltage signals using an oscilloscope. At this point, a time delay of 140±10 ns between the Q-switch out signal and the high-voltage signals was measured. Taking into account the time period of 70 ns between Q-switch out and the laser pulse as determined by Brands (2009), a DIE of about 70 ns can be expected for the measurements performed in this study. However, there may be an additional delay until the electric field has actually built up at the ion extraction region. Nevertheless, after a turn-on time of the HTS of 1 µs the high-voltage supply to pEx1 and nEx1 is interrupted again; after a further 6 µs a decrease in the voltage signals at pEx1 and nEx1 was observed. The total decay time of the high voltages is of the order of hundreds of microseconds and thus several orders of magnitude below the firing sequence of the ablation laser (max. 20 Hz). Considering the known particle velocities, no influence on charged particles due to the decaying electric field is expected.
3.2.3 Electric shielding
An additional electric shielding was installed in front of the electrodes (Fig. 8a) to shield an electric field generated by the remaining electrodes. The influence of such an electric field on the particles could be determined by the fact that despite the use of DIE, the hit rate of highly charged particles was lower than with an additional upstream neutralizer (see Sect. 4.5.1). Although the electric field strength in front of the electrodes can be assumed to be significantly weaker than in the space between the electrodes, it must be taken into account that the traveled path in the electric field is included quadratically in Eq. (1). The electric shielding was designed with openings to avoid pressure gradients (Fig. 8b). It was placed inside the instrument such that it is in contact with the housing of the mass spectrometer, which is used as the chassis ground.
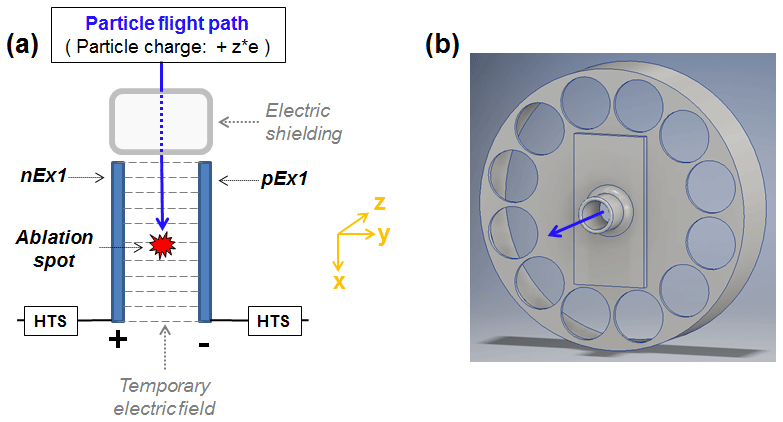
Figure 8(a) The blue arrow shows the flight path of charged particles when using an electric shielding and fast high-voltage transistor switches (see text for details). The electric shielding is installed upstream of the extraction electrodes. (b) 3D scheme of the electric shielding.
4.1 Experimental setup
4.1.1 Test particles
The majority of the measurements were performed using particle standards. During laboratory measurements at the Max Planck Institute, spherical PSL particles (ρ=1.05 g cm−3; Duke Scientific Corporation and Polyscience Inc.) were used for size-, shape-, and charge-dependent measurements. Sodium chloride particles (NaCl, ρ=2.17 g cm−3; Carl Roth GmbH + Co. KG) were used as widespread reference for particles of aspherical shape (Brands et al., 2011; Huffman et al., 2005). A comparison of our results with results from Zelenyuk et al. (2006) shows that the shape of the NaCl particles formed from the atomized saline water solution must be almost cubic under conditions measured by us (see Sects. S4 in the Supplement and 4.1.2). Thus, a spherical particle type that can be focused quite well with an aerodynamic lens can be compared to a cubic particle type that is rather difficult to focus (Brands et al., 2011). Mineral dust particles and ambient aerosol from the laboratory room air were used as other test particles in order to demonstrate the need for an electric shielding. In addition, INP measurements with (a) birch pollen washing water containing ice-active macromolecules (see Augustin et al., 2013, and von Blohn et al., 2005 for details), referred to as birch pollen herein, (b) externally mixed Snomax and NaCl particles, and (c) a mixture consisting of Na and K-feldspar particles (see Augustin-Bauditz et al., 2014, for details) were conducted under laboratory conditions at the Leibniz Institute for Tropospheric Research.
4.1.2 Laboratory setup for characterization measurements
Figure 9 gives an overview of the laboratory setup used for size-, shape-, and charge-dependent measurements of PSL and NaCl particles at the Max Planck Institute. The particle flow direction is marked by red arrows, starting from the atomizer and following the individual measurement instruments downstream. Before the differential mobility analyzer (DMA), the particle flow is routed via one of the three flow paths. (1) Monodisperse PSL particles were generally passed through the DMA because the atomization of PSL particles generates small water droplets whose residuals can be removed by the DMA. (2) PSL particles larger than 3.5 µm were bypassed, since the DMA is not able to size-select them. (3) If polydisperse particles such as NaCl are used, larger and multiply charged particles may also pass through the DMA when they have the same mobility diameter as the smaller singly charged particles. To avoid this, an additional impactor was used in front of the DMA to remove the larger multiply charged particles.
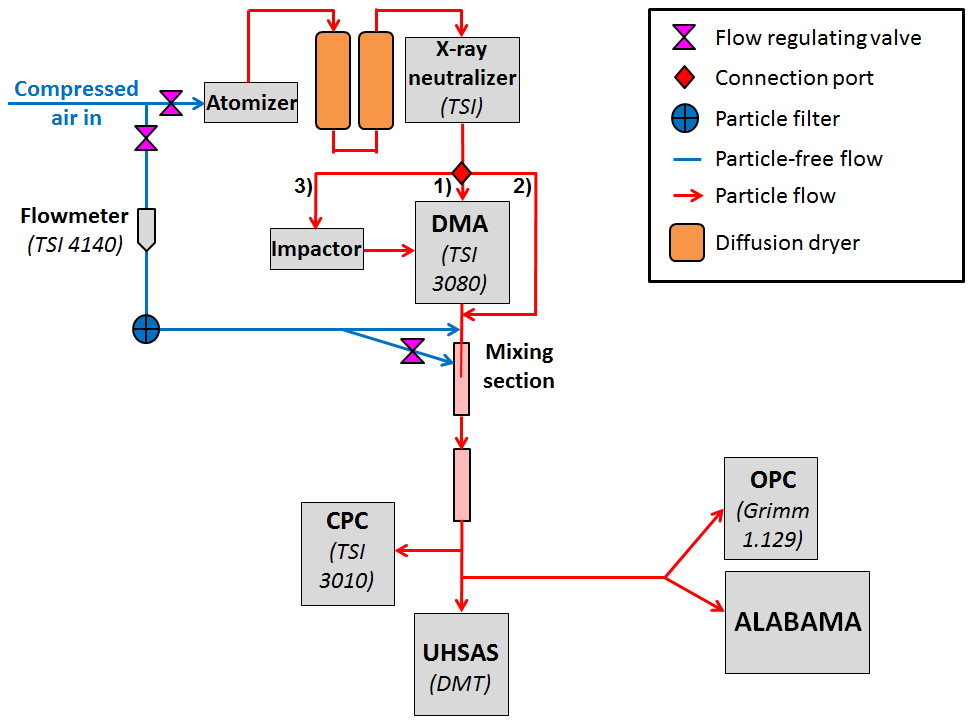
Figure 9Laboratory setup for the characterization measurements. Particles are produced by means of an atomizer. The particles are subsequently dried, charged, and size-selected by means of two diffusion dryers, an X-ray neutralizer, and a DMA, respectively. Downstream the particle flow is diluted and mixed with a particle-free flow prior to detection and measurement by the CPC, OPC, the UHSAS, and the ALABAMA. The detectable (50 %) particle size ranges specified by the manufacturer are between about 0.01 and 3 µm for the CPC, between 0.25 and 32 µm for the OPC, and between 0.055 and 1.0 µm for the UHSAS.
The particle-free flow was installed to control the flow through the DMA using valves. The transition from 1∕4 to 1∕8 to was installed between the two ports of the particle-free flow downstream of the DMA for more effective mixing of the particle flow with the particle-free flow. If not mentioned otherwise, results were obtained using the setup presented in Fig. 9.
4.1.3 Laboratory setup for INP measurements
The setup for the INP measurements at the Leibniz Institute for Tropospheric Research, shown in Fig. 10, was similar to that presented in Schenk et al. (2014). The INP counter FINCH (Frankfurt Ice Nucleus CHamber; Frank, 2017) was used to activate INPs at ∘C under ice-supersaturated conditions. Along their flight path through FINCH, the activated particles grow to super-micrometer ice crystals, but supercooled droplets can also form in FINCH when water-supersaturated conditions are applied. At the exit of FINCH a pumped counterflow virtual impactor (PCVI; Schenk et al., 2014; Boulter et al., 2006; Cziczo et al., 2003) was used to separate the grown ice crystals from water droplets and nonactivated aerosol particles. After passing the counterflow, ice crystals are evaporated by heating and drying the sample air such that only the ice crystal residuals are left over. These residuals were guided to the ALABAMA. Since the separation of ice crystals from supercooled droplets relies only on particle size, the possibility cannot fully be excluded that supercooled droplet residuals were also occasionally sampled.
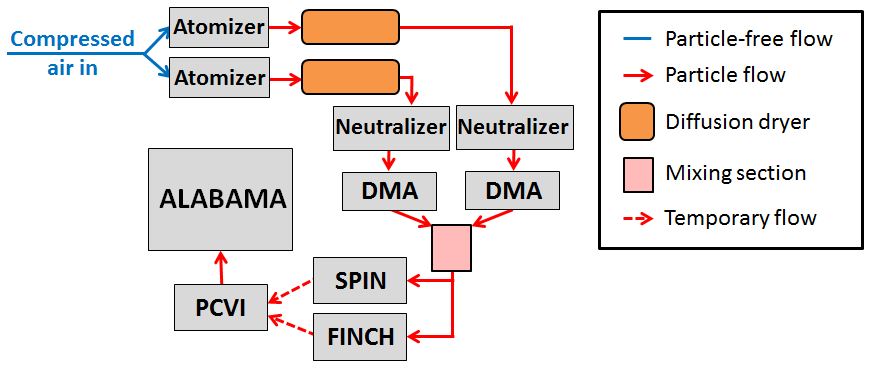
Figure 10Laboratory setup for the INP measurements presented in Sect. 5. Particles are produced by means of an atomizer. The particles are subsequently dried, charged, and size-selected by means of a dryer, a neutralizer, and a DMA, respectively. Since externally mixed particles were also investigated during the measurements, two branches of particle generation were required. The FINCH–SPIN and the PCVI were either used in the described ice activation mode for the analysis of INPs or in the no-ice activation mode for direct measurement of the particles without prior INP activation and separation. Temporary flow means that only one INP counter, either FINCH or SPIN, was coupled to the PCVI.
As an alternative to FINCH, the SPectrometer for Ice Nuclei (SPIN) was also used for ice nucleation (see, e.g., Garimella et al., 2016, for details). For ice nucleation in SPIN, the temperature was controlled to ∘C (birch pollen) or ∘C (feldspar) under water-supersaturated conditions. The PCVI was alternated between the two INP counters, either FINCH or SPIN.
4.2 Methods for characterization of the aerodynamic lens system (ALS)
4.2.1 Definition of particle detection efficiency
The particle detection efficiency (DE) in this paper is defined as the ratio of the particle concentration measured by the ALABAMA detection units (further details in Sect. S5 in the Supplement) to the particle concentration simultaneously measured with a reference instrument. For the detection efficiency, both the number of particles detected at the first or second detection unit can be taken into account. In addition, the detection efficiency can also be determined by using the sized particles, which means only those particles are taken into account that have been detected by both detection units within a defined time interval and for which a vacuum aerodynamic diameter can thus be determined. The reference instruments used are as follows.
-
For particle sizes smaller than 250 nm in mobility diameter (dmob), a TSI condensation particle counter (CPC; model 3010, Mertes et al., 1995) was used as the reference instrument.
-
In the range from 260 to 1700 nm (dmob), the results of the CPC were averaged with those of a Grimm optical particle counter (OPC; model 1.129, Bundke et al., 2015) and used as a reference. The average value from OPC and CPC was taken to compensate for minor variations between the two devices.
-
For particle sizes larger than 1700 nm (dmob), the OPC was used as the only reference instrument.
In addition, for measurements performed with PSL particles larger than 1800 nm and without the DMA, a size channel selection was applied. (1) For the ALABAMA, the time interval for recording the detection signals was adjusted and fixed such that only particles with the corresponding flight time (∼dva) were detected at both detection units. (2a) For the OPC, the size channels from 0.65 to 3.0 µm were summed up for particle sizes between 1.8 and 2.6 µm. (2b) For particle sizes greater than 2.6 µm, the size channels 1.3 to 32 µm were added up. In principle, a size selection was not necessary as long as a DMA was used, although this was not possible for all particle sizes (see Sect. 4.1.2). Without DMA, however, a second size mode was observed in the smallest size channels of the OPC. To avoid an influence of these unwanted small particles on our measurements, they were removed by selecting the appropriate size channels in the OPC.
The measurement procedure with the same settings was repeated up to four times. Data from the ALABAMA and the reference instruments were each averaged to obtain better counting statistics. The measurement time for the determination of detection efficiencies shown in Fig. 13 was typically between 3 and 6 min per particle size and lens pressure but was extended to about 30 min for particle concentrations below 1 particle cm−3.
Measurements with NaCl particles between 380 and 550 nm (dva) were corrected by parallel measurements with the Ultra-High Sensitivity Aerosol Spectrometer (UHSAS) from Droplet Measurement Technologies (Longmont, USA) because below 550 nm (dva) a small percentage of multiply charged particles passed through the DMA, forming a second size mode (see Sect. S10 in the Supplement). For particles larger than 550 nm, the multiply charged particles could be separated very efficiently with an impactor upstream of the DMA such that no second size mode was visible.
4.2.2 Particle beam scan through the detection lasers using the lens scan method
Measurements of the detection efficiency as a function of particle beam position along the laser cross sections allow for the optimization of the alignment of the ALS and the determination of the particle beam width and particle beam divergence. The method used here to characterize the properties of the particle and laser beams is to tilt the ALS stepwise in the y and z direction so that the particle beam is scanned orthogonally through the respective detection laser (Klimach, 2012), in the following also called a lens scan. At each position, a measurement series of a few seconds with a time resolution of 1 s was generated (parallel to the external reference instruments). Using the DC motors, automated 2D scans with a motor step size of 50–75 µm were performed. Calculations from the intercept geometry were used to convert the step size between two motor positions into the step size between two particle beam positions at the location of the respective laser (see Sect. S7 in the Supplement). For the measurements presented here, the particle beam was scanned through the cross section of each laser on seven adjacent paths at a distance of 50 to 75 µm from each other, as shown in Fig. 11.
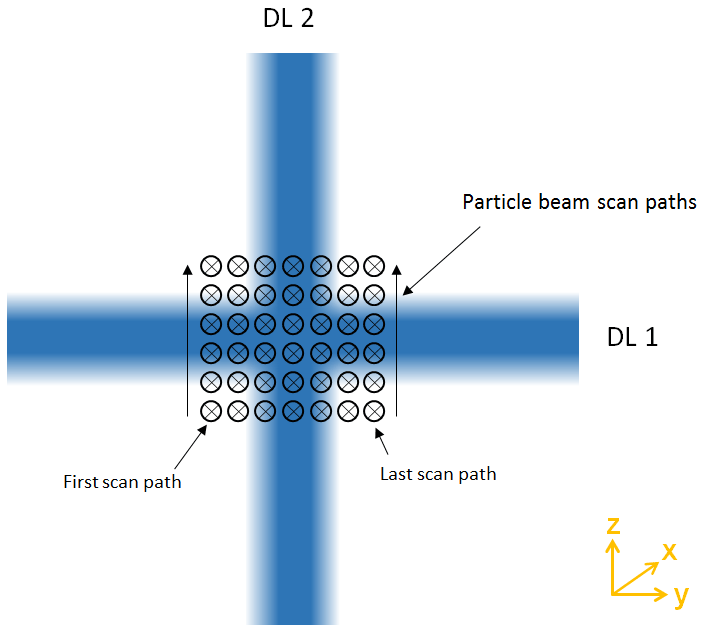
Figure 11Schematic representation of the seven particle beam paths used for the scan through the first detection laser (DL1), viewed from the ALS perspective. According to Fig. 1 the flight direction of the particles is in the x direction. Six measurement positions per scan path were chosen for illustration purposes only but represent significantly fewer measurement positions than were actually used in the lens scans (see Fig. 12). For a scan of the particle beam through the second detection laser (DL2), the particle beam paths would be correspondingly oriented in the y direction. During regular measurements, the ALS should ideally be aligned in a way that the particles fly through the center of the overlapping area of the two lasers.
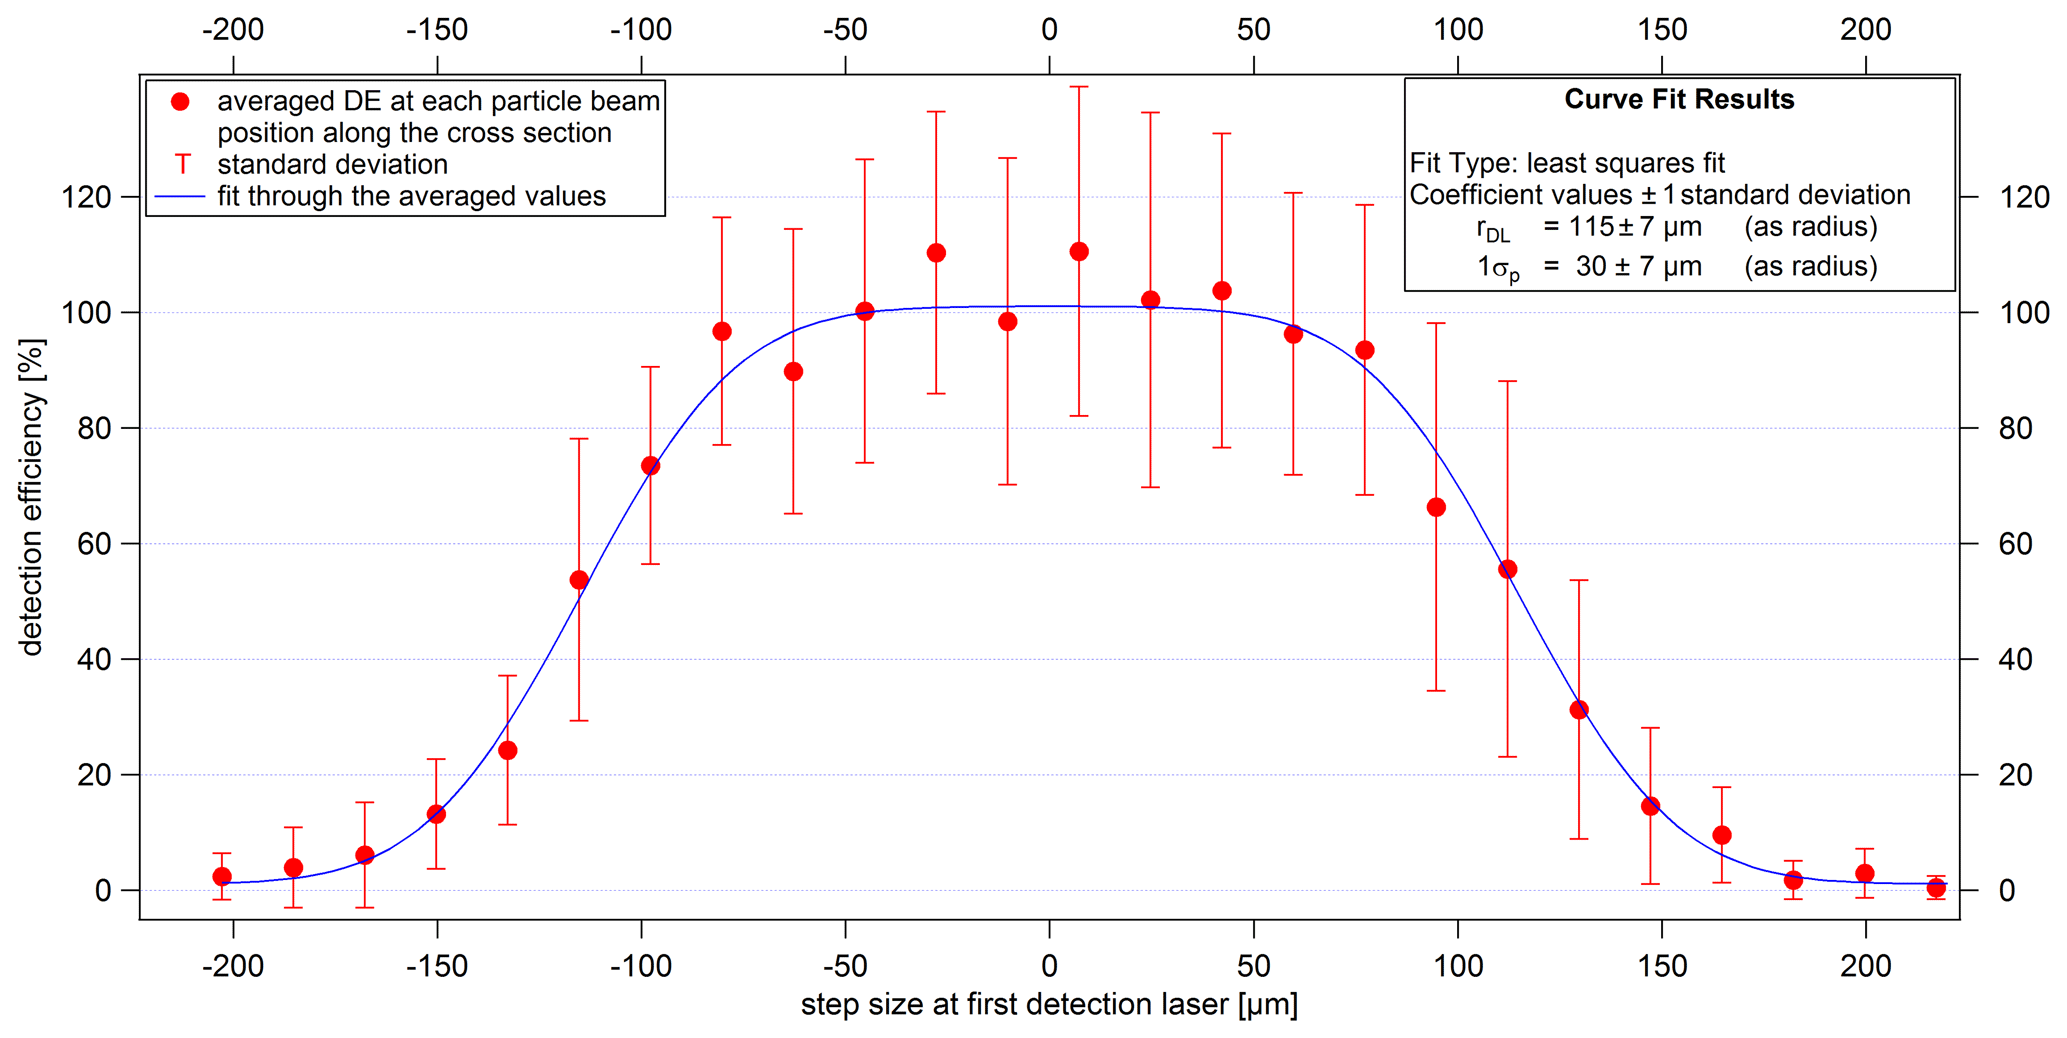
Figure 12Lens scan along the cross section of the first detection laser using the example of 460 nm (dva) PSL particles. The averaged values of the DE, as well as the associated standard deviations (given as the uncertainties), result from a measurement time of about 5–10 s per particle beam position and from seven adjacent paths. The zero position on the x axis corresponds to the laser beam center point in the z direction.
The starting particle beam positions for the paths were chosen so that they are located around the laser beam center position of the respective orthogonally aligned detection laser. It must be taken into account that due to a size-dependent particle beam shift when changing particle sizes, new start positions of both motors had to be set. After a lens scan was performed, the particle counts per second of each of the seven adjacent particle beam positions were averaged, converted into concentrations (see Sect. S5 in the Supplement), and normalized with the reference instruments. As an example, Fig. 12 shows the averaged and normalized measurement data for 460 nm (dva) PSL particles. It can be seen that the detection efficiency increases from 0 % outside the laser beam to a maximum around the laser beam center point. The detection efficiency as a function of particle beam position follows a 2D Gaussian distribution (Klimach, 2012; Huffman et al., 2005) by having the following three assumptions. First, the particle beam has a radial Gaussian profile. Second, all particles reach the detection region. Third, the scattered light of the laser can be measured within its effective width. In this study, the 1D case was used (further details in Klimach, 2012; Huffman et al., 2005). Accordingly, the probability density of a particle at location z (y for the second detection laser) is described by the following function:
with σ being the standard deviation of the Gaussian distribution. If Eq. (2) is integrated within the effective laser width (±rDL) in which particles generate a detectable scatter signal, a function for position-dependent detection efficiencies DE(zp) can be deduced.
The cumulative distribution function of the Gaussian distribution can be represented with the error function (erf), which results in the position-dependent function of the detection efficiency as follows (Klimach, 2012):
with σP being the particle beam width (as a radius in terms of 1σ), z0 the center position of the distribution, rDL the effective width of the detection laser (as a radius), and bg a value for the background, which indicates the difference between the baseline of the fit and the zero line. Thus, the distribution of the detection efficiency is fitted using Eq. (4) with σP, rDL, z0, and bg as fit parameters. According to Eq. (4), only two parameters are needed to determine the width and height of the distribution, since there is no reason why the particle beam width (σP) and the effective width of the detection laser (rDL) should be interdependent. Furthermore, these two parameters represent real physical parameters, which help to provide reasonable output values and to evaluate the results. In order to find the parameter values of Eq. (4) that best fit the measured data, the Levenberg–Marquardt least-squares method was selected as the method for fitting in the program IGOR Pro (Version 6.37; WaveMetrics, 2015). The coefficients and sigma values resulting from the fitting are estimates of what would result if the fitting were performed infinitely many times with the same data but with different noise and then calculating the mean and standard deviation for each coefficient (see IGOR Pro manual, WaveMetrics, 2015, for more details). For example, in Fig. 12 the fit function is shown by the blue line, resulting in a particle beam width (1σP) of 30±7 µm and an effective detection laser width (as diameter) of 230±14 µm. The plateau around the maximum is formed due to the fact that the particle beam is narrower than the effective laser beam width. In conclusion, with the lens scan it is possible to perform particle-size-dependent analyses of particle beam widths at both detection units.
Additionally, the lens scan method can be used to determine the particle beam divergence. The particle beam divergence is defined as the particle beam width normalized to the distance to a reference point. The location of the reference point depends on whether the particle beam width was measured at one position only or at different positions, so as shown in Sect. 4.3.4, the exit of the ALS or the first of two detection lasers can be used as the reference point. The particle beam divergence determined for the ALABAMA is calculated from the particle beam widths (1σP) at both detection units and their distance from each other. In addition to the particle beam width, the particle beam divergence serves as a further characterization feature for evaluating the particle beam focusing of an aerodynamic lens system.
4.3 Results of the aerodynamic lens system characterization
The characterization of the new aerodynamic lens system was carried out indirectly by measuring the size-resolved detection efficiency of the ALABAMA and directly by investigating the size-dependent properties of the formed particle beam. Particle beam width and particle beam divergence were determined by using the lens scan method (see Sect. 4.2.2). The size-resolved detection efficiency, however, was determined at a fixed ALS position. The fixed ALS position was set to the maximum detection efficiency and hit rate. The optimum ALS position was found as a compromise from three lens scans with PSL particles of sizes 150, 200, and 400 nm (dmob).
4.3.1 Size-resolved detection efficiencies at the optimum fixed ALS position
The size-resolved detection efficiency for PSL and NaCl particles is shown in Fig. 13. In this case, the detection efficiency was calculated using the sized particles. The results achieved with the new ALS are shown for different lens pressures between 1.5 and 2.6 hPa. The figure further includes earlier ALABAMA measurements taken with the previously used Liu-type aerodynamic lens and without the air diffusor (Köllner, 2020; Brands et al., 2011). Since Brands et al. (2011) several improvements have been made to the ALABAMA (Köllner, 2020; Roth, 2014). The ALABAMA setup used by Köllner (2020) is identical to the one used here, except for the ALS, but already contained a similar CPI with the same O-ring type, whereas Brands et al. (2011) worked with a fixed critical orifice. Investigations on the differences between the use of a critical orifice and a squeezed O-ring are presented in Molleker et al. (2020).
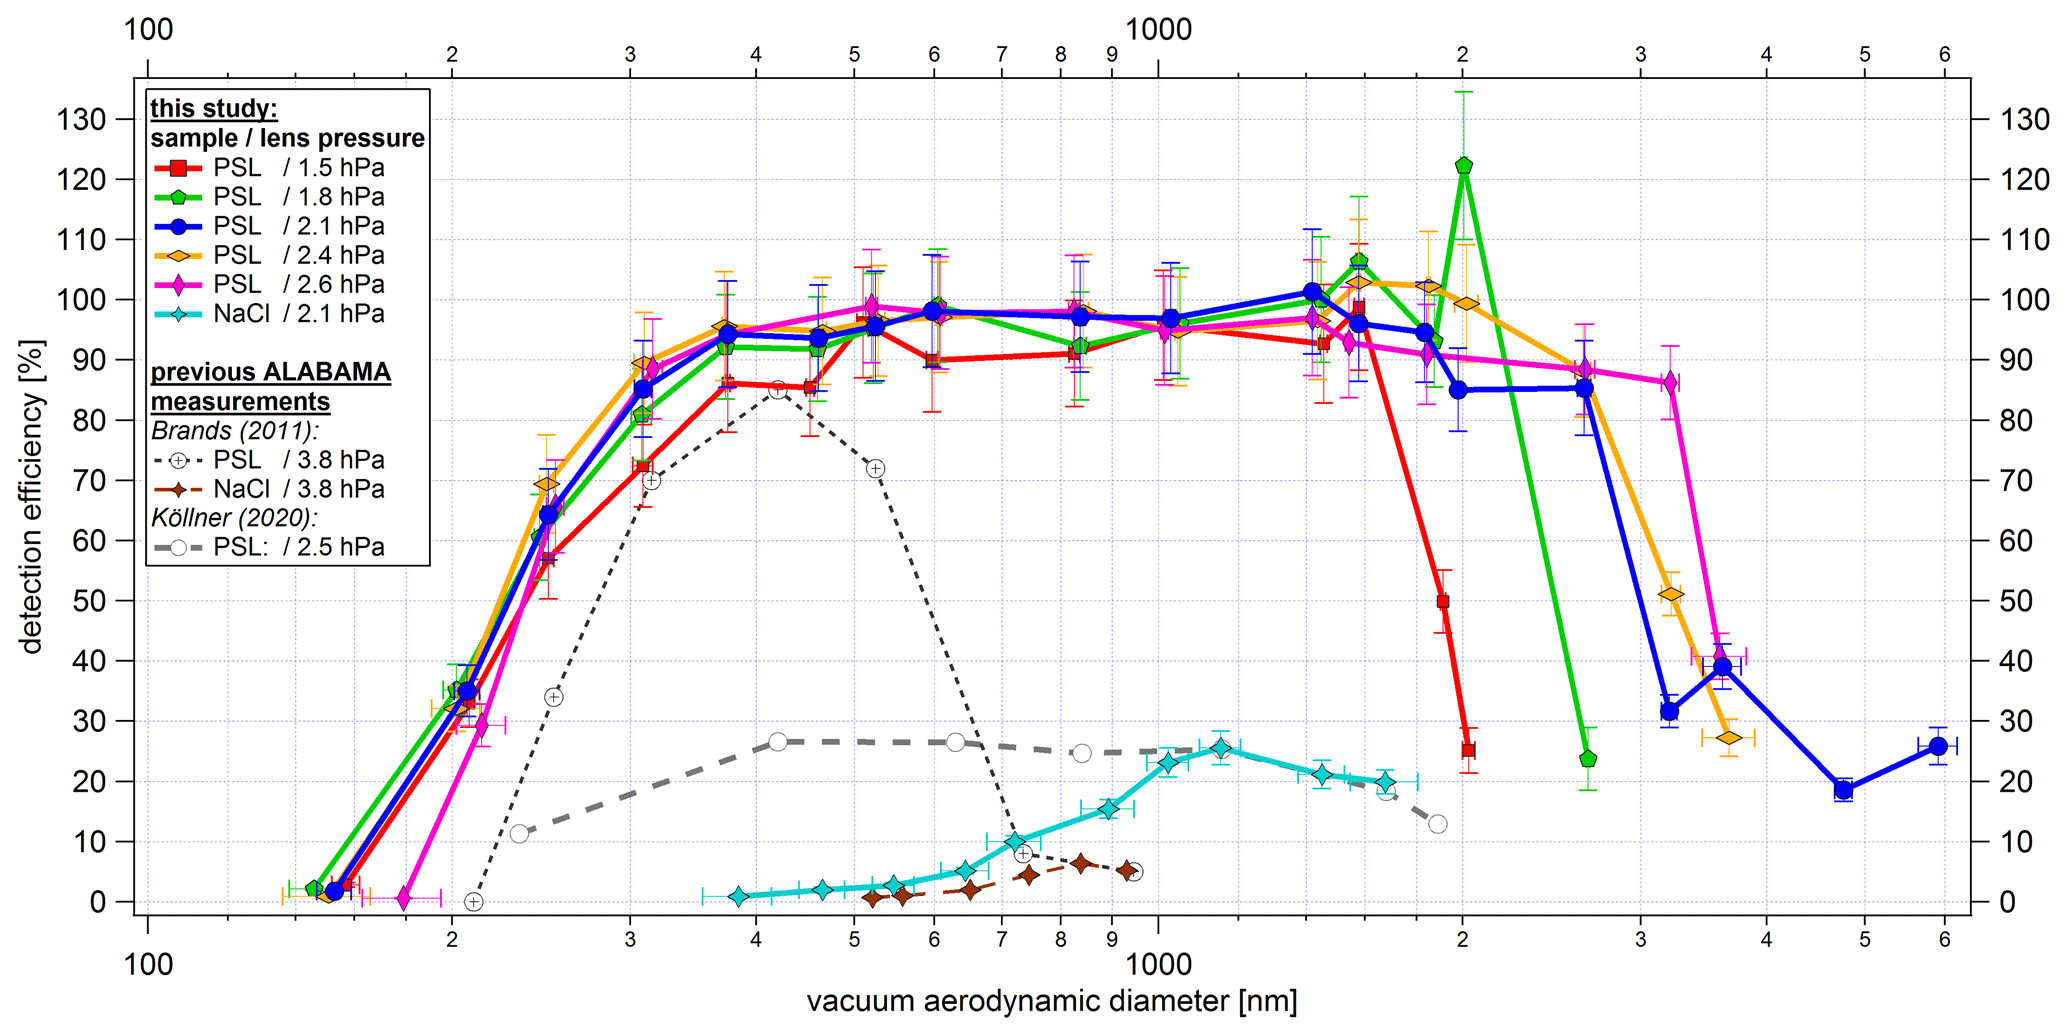
Figure 13Size-resolved detection efficiency of PSL and NaCl particles. The detection efficiency is relative to particles that led to sized particles. The results achieved with the new ALS are shown with solid lines. The colors represent the different lens pressures from 1.5 to 2.6 hPa, and the markers distinguish between PSL and NaCl particles. ALABAMA measurements taken with the previously used Liu-type aerodynamic lens (Kamphus et al., 2008) and without the air diffusor are shown as dashed lines. The y-uncertainty bars refer to the uncertainties of the components used (see Sect. S15.1 and S15.2 in the Supplement), and the x-uncertainty bars correspond to the standard deviation of the particle size distribution per particle size, particle type, and lens pressure measured with the ALABAMA, converted into dva according to Eq. (S1) (in the Supplement).
As can be seen from the PSL measurements in Fig. 13, particles between 350 and 1800 nm were detected with 90 %–100 % efficiency at 2.1 hPa lens pressure. Furthermore, by using the 50 % cutoff diameter in efficiency d50(sizedP), we obtain a detectable d50(sizedP) particle size range between 230 and 3000 nm (dva) for 2.1 hPa and 230 to 3240 nm (dva) for 2.4 hPa. The lower d50(sizedP) values are nearly identical for all lens pressures and do not show the expected shift to smaller particles for lower pressures (Zhang et al., 2002). Thus, it can be assumed that the limiting factor of the lower d50(sizedP) is not only the performance of the ALS, but also the scattered light intensity, which strongly decreases with decreasing particle diameter. As shown in Fig. 15, the decreasing scattered light intensity results in a significantly reduced effective width of the detection lasers. The upper d50(sizedP) shows a clear correlation with lens pressure. The upper d50(sizedP) increases from 1900 to 3500 nm by an increase of the lens pressure from 1.5 to 2.6 hPa, respectively. This result is supported by numerical simulations of the transmission efficiency for a single thin orifice (Zhang et al., 2002). However, the detection efficiency between 2 and 4 µm decreases sharply. An explanation for this could be the low value of the ratio between the diameter of the first single orifice and the diameter of the air diffusor directly in front of the orifice (as described in Sect. 3.1.1). The numerical calculations presented by Zhang et al. (2002) and the discussion in Sect. 3.1.1 suggest that the transmission drop should be rather steep for such a small ratio of 0.2.
The new ALS achieves an improved detectable particle size range, especially for supermicron particles, compared to the ALS previously used in the ALABAMA. For example, in Fig. 13 a clear shift of the upper d50(sizedP) towards large particle sizes can be observed compared to measurements with the previous ALS. In Brands et al. (2011) the interpolated PSL d50(sizedP) range was between 270 and 620 nm. The lens pressure of 3.8 hPa used in Brands et al. (2011) was higher than the pressure used in the new ALS. In principle, the upper d50(sizedP) should benefit from a higher lens pressure (Zhang et al., 2002), but this is not the case here. The measurements by Köllner (2020, Fig. A.4) have shown that when using the Liu-type lens with the CPI, the detection efficiency of supermicron PSL particles decreased for lens pressures >2.5 hPa. Nevertheless, the measurements of Köllner (2020) indicate an improved detection efficiency for supermicron particles compared to Brands et al. (2011), resulting in an interpolated PSL d50(sizedP) range from 260 to 1880 nm at a lens pressure of 2.5 hPa. On the other hand, the measurements of Köllner (2020) result in a significantly lower maximum detection efficiency in the PSL size range between 200 and 600 nm compared to Brands et al. (2011). Köllner (2020) considers clogging of the O-ring or nonoptimal ALS alignment as possible reasons for the lower maximum detection efficiency compared to Brands et al. (2011). In addition, Köllner (2020) points out that the device modifications made to the ALABAMA in the meantime may also have led to a reduction of the detection efficiency in the PSL size range between 200 and 600 nm. For example, the results shown in Brands et al. (2011) were obtained by using a diode-pumped continuous-wave laser with a wavelength of 532 nm. However, the exact cause for the different results could not be found.
To summarize, by comparing the d50(sizedP) range of the new ALS with the previously used one (Brands et al., 2011; Köllner, 2020), the new ALS facilitates an increase in the upper d50(sizedP) by more than 1300 nm. In addition to an improved upper d50(sizedP), the new ALS achieves a shift of the lower d50(sizedP) towards smaller particle sizes. However, the effect is rather small and is probably limited by the decreasing scattered light intensity with decreasing particle sizes.
Figure 13 further shows measurements with NaCl particles, which, with a maximum of 25.5 % around 1150 nm (dva), have a significantly lower detection efficiency than the spherical PSL particles. One reason for this could be that the scattered light intensity and distribution depend not only on the size, but also on the shape and refractive index of the particles (Kulkarni et al., 2011b). In addition, for nonspherical particles, aerodynamic forces during the expansion of the air at the nozzle exit of the ALS lead to a defocusing of the particle beam (Huffman et al., 2005; Liu et al., 1995a). Nevertheless, a higher detection efficiency for the cubically shaped NaCl particles can be achieved with the new ALS than with the ALABAMA setup used by Brands et al. (2011).
The detection efficiency of other SPMS instruments have been reported in the literature. Gemayel et al. (2016) present a maximum detection efficiency for the laser ablation aerosol particle time-of-flight mass spectrometer (LAAP-ToF-MS) of about 2.5 % for PSL particles with a particle diameter of about 450 nm. In Shen et al. (2018), measurements with PSL particles resulted in detection efficiencies between 1 % and 5 % for the LAAP-ToF-MS in the size range between 400 and 1000 nm (dmob), while for NaCl particles the detection efficiencies were below 5 % in the size range between 300 and 1000 nm (dmob). A modified version of the LAAP-ToF-MS achieved up to 17 % detection efficiency at the second detection laser for 800 nm PSL particles (Marsden et al., 2016). Another modified version of the LAAP-ToF-MS increases the detection efficiency to a maximum of about 4 % for 700 nm PSL particles but achieves a larger detectable particle size range compared to measurements of Gemayel et al. (2016) due to an improved light collection technique (Zawadowicz et al., 2020). For the single-particle laser ablation mass spectrometer (SPLAM) the maximum detection efficiency is about 65 % for 300 nm (dva) PSL particles (Gaie-Levrel et al., 2012). The single-particle laser ablation time-of-flight mass spectrometer (SPLAT) achieves a maximum detection efficiency of about 73 % for approximately 350 nm (dva) particles (Zelenyuk and Imre, 2005). The successor models SPLAT II and miniSPLAT achieve detection efficiencies of 100 % for spherical particles in the size range between 125 and 600 nm (Zelenyuk et al., 2015). Differences between the individual devices are diverse. This is partly due to the different geometries of the instruments but also due to the application of different detection methods. Further, the definition of the detection is not uniform and instruments use different aerodynamic lens systems.
However, when measuring in environments with low particle concentrations, a higher particle detection rate may be required despite improved detection efficiency. In this case an additional particle enrichment per time unit can be achieved by increasing the sample flow into the instrument. An increase in the lens pressure from 1.5 to 2.6 hPa corresponds to a doubling of the standard volume flow rate from 1.05 to about 2.1 cm3 s−1. As can be seen in Fig. 13, increasing the lens pressure to 2.6 hPa does not result in a decrease in detection efficiency for PSL particles larger than 200 nm. However, the current ALABAMA design limits the lens pressure to 2.6 hPa due to the vacuum requirements for the high voltages. An overview of the particle detection rate as a function of lens pressure is given in Sect. S8 in the Supplement.
4.3.2 Size-resolved particle beam width using the lens scan method
Figure 14 shows the particle beam width for PSL particles (150 to 3200 nm, dva) and for NaCl particles (460 to 1320 nm, dva). The particle beam width generally depends on particle size and particle types. For both particle types (PSL and NaCl), the curves show a comparable size dependence of the particle beam widths. The minimum particle beam width is observed around 1000 nm for NaCl and around 1600 nm for PSL particles. The particle beam width increases with decreasing particle size due to the fast expansion of the air at the exit of the ALS. The increase in particle beam width with increasing size and inertia of the particles is likely due to a poorer focusing of these particles within the ALS. These poorly focused particles are in turn accelerated more strongly in the y and z direction at the exit of the ALS, which can lead to larger particle beam divergence. The trend of the PSL curves in Fig. 14 resembles the particle beam contraction ratio, which was numerically determined for a single thin orifice lens (Zhang et al., 2002), assuming spherical particles and unit density. Below 1600 nm the PSL beam widths for 2.1 and 2.4 hPa lens pressure are similar and were therefore averaged in Fig. 14. Above 1600 nm there is a spread in the curves for 2.1 and 2.4 hPa. This finding fits quite well with the results of the different upper d50(sizedP) of 2.1 and 2.4 hPa (see Fig. 13). Figure 14 further shows that the particle beam for NaCl particles is about 1 order of magnitude broader compared to the PSL particles. As already mentioned in Sect. 4.3.1, this is explained by the aerodynamic lift forces on nonspherical particles (Huffman et al., 2005; Liu et al., 1995a).
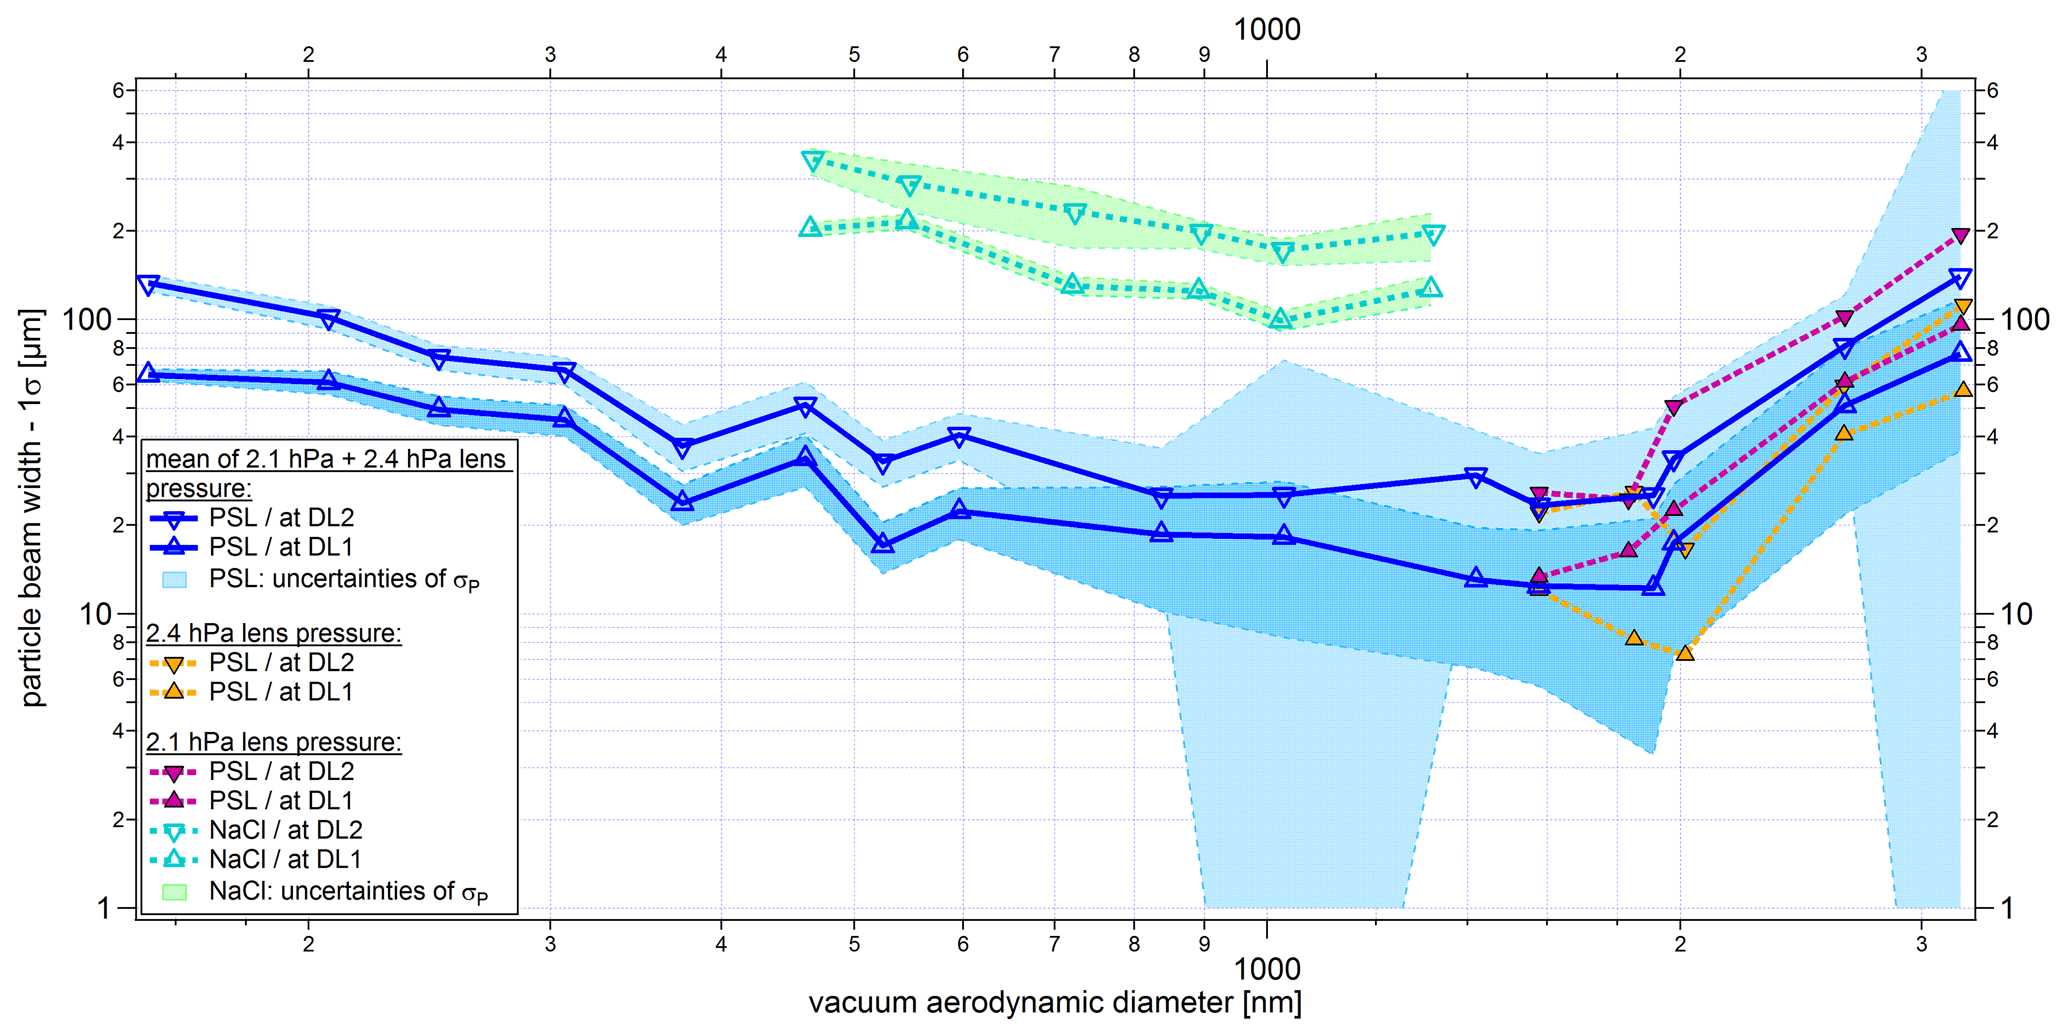
Figure 14Size-resolved particle beam widths (1σP), as defined in Eq. (4), at the two detection stages (DL1 and DL2) for PSL and NaCl particles. Below 1600 nm, the beam widths are averaged for 2.1 and 2.4 hPa lens pressure (PSL only). The y-uncertainty range is given by the uncertainty of the fit of each scan (see Sect. 4.2.2). The x-uncertainty bars correspond to the standard deviation of the particle size distribution per particle size, particle type, and lens pressure measured with the ALABAMA, converted into dva according to Eq. (S1) (in the Supplement).
Particle beam widths measured with the previously used ALS are not available because there was no automated lens scan for this ALABAMA setup. However, a qualitative comparison of the new and previous ALS shows improved particle beam characteristics for the overall size range with the new ALS (see Sect. S9 in the Supplement).
4.3.3 Size-resolved effective width of the detection lasers using the lens scan method
The effective width of the detection lasers (as defined in Eq. 4) is important for an assessment of the detection efficiency. For maximum detection efficiency, the particle beam needs to have a width smaller than the effective width of the detection laser. As expected, the effective laser width displayed in Fig. 15 tends to increase with increasing particle size. However, there is a significant change in the slope of the curves for sizes larger than 250 nm. As a result, smaller particles need to move more centrally through the laser beam than larger particles in order to generate sufficient scattered light for detection. This ultimately determines the lower detection limits of the ALABAMA. Whether there is a connection between Mie scattering and the partially inverse trends of the effective laser widths could not be clarified.
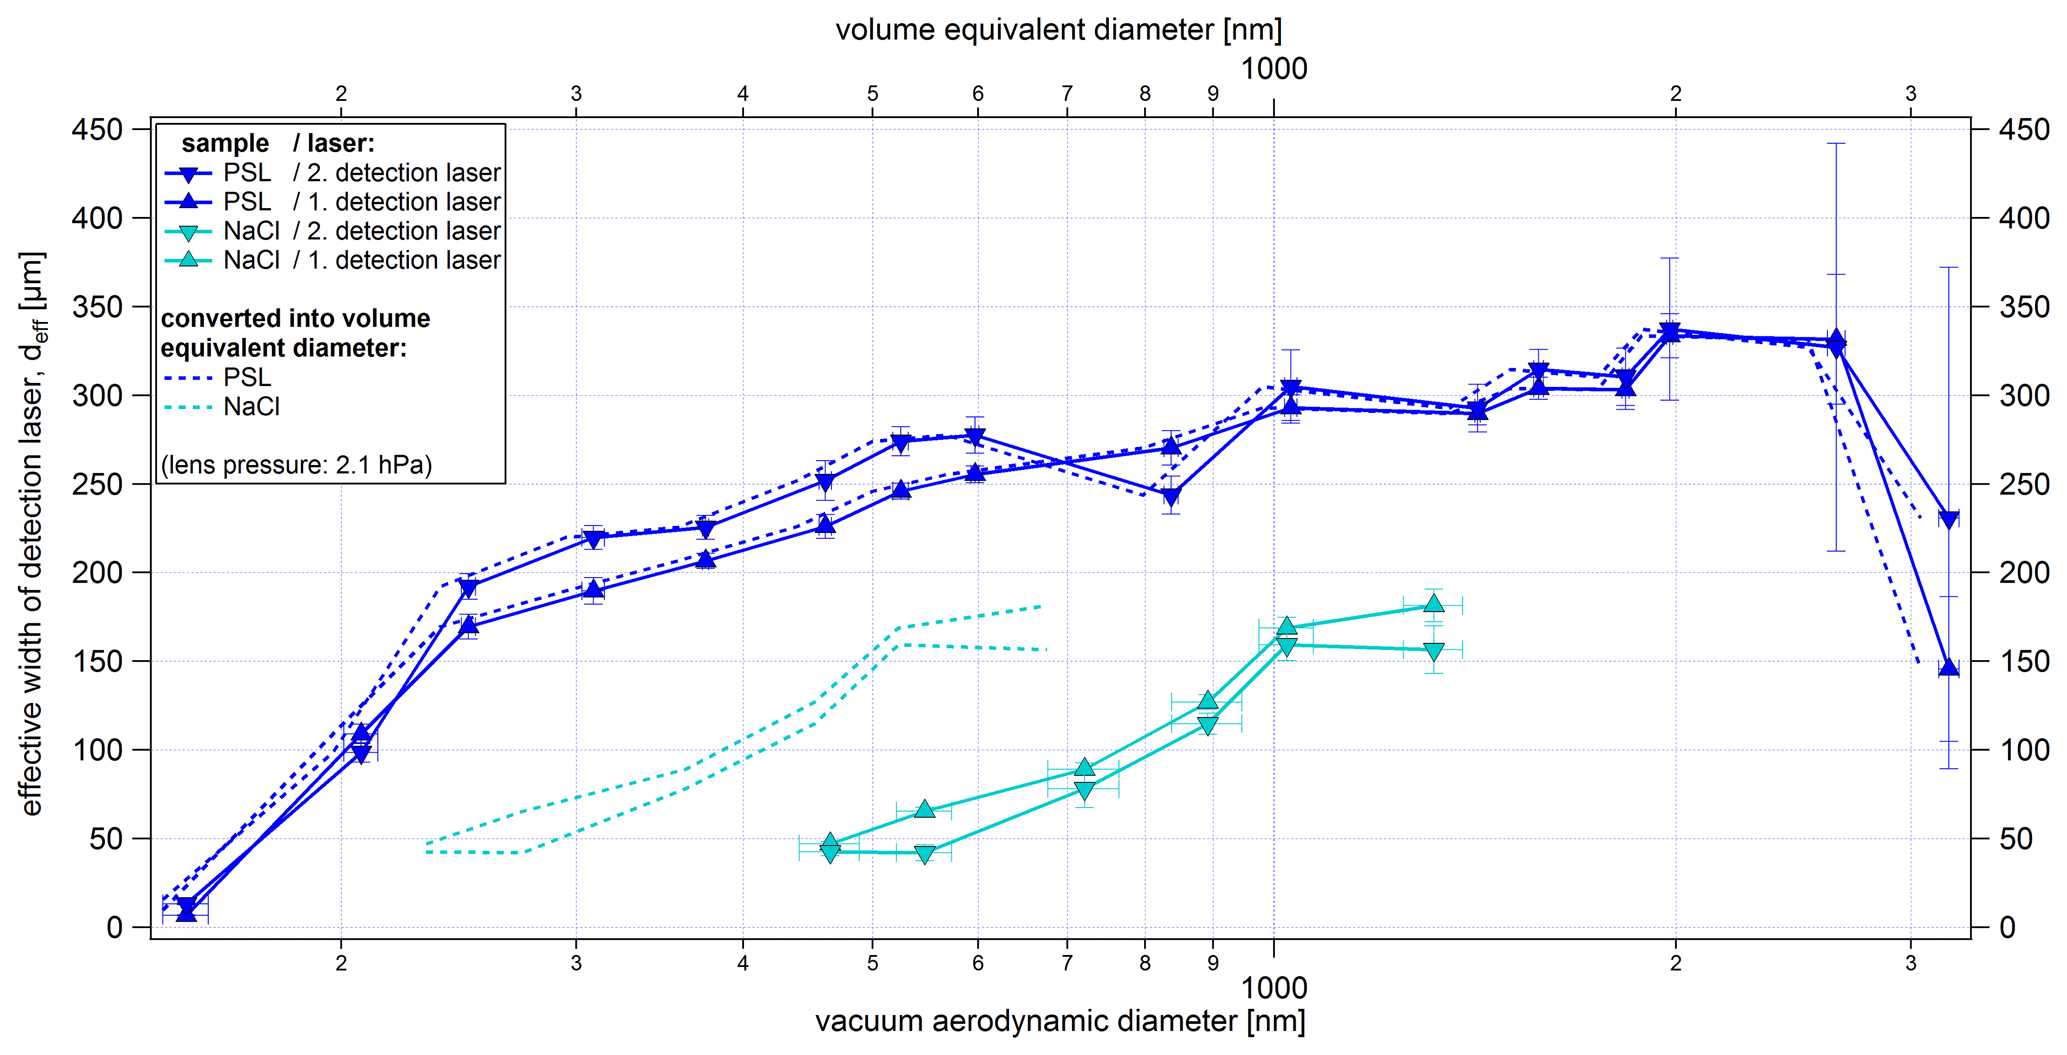
Figure 15Size-resolved effective widths of the first and second detection laser (λ=405 nm) for PSL particles and NaCl particles as a result of the lens scans. In addition to ALABAMA sizing in dva, the effective laser widths are also displayed as a function of the volume equivalent diameter (dashed lines). The y-uncertainty range is given by the uncertainty of the fit of each scan (see Sect. 4.2.2). The x-uncertainty bars correspond to the standard deviation of the particle size distribution per particle size, particle type, and lens pressure measured with the ALABAMA, converted into dva according to Eq. (S1) (in the Supplement).
The effective laser width also seems to be dependent on particle shape and/or refractive index effects. The cubic NaCl particles result in similar curves as the PSL particles but are shifted to larger sizes (solid lines). This is due to the fact that for the vacuum aerodynamic diameter the particle density and the shape factor must be taken into account (Hinds, 1999). Nevertheless, even after conversion of the vacuum aerodynamic diameter into volume equivalent diameter, smaller effective laser widths for the NaCl particles (dashed lines) are obtained than for PSL particles. Since both PSL and NaCl show a nonabsorbing behavior at the wavelength of 405 nm (He et al., 2018; Querry, 1987), the smaller effective widths can be explained mainly by the cubic shape of the NaCl particles and the shape-dependent distribution of the scattered light intensity (Kulkarni et al., 2011b). Thus, the smaller effective width of the detection laser, which results from the lower scattered light intensity of cubic particles, further contributes to a lower detection efficiency of NaCl particles, as is evident from Fig. 13.
The comparison between the effective laser width, the particle beam width, and the detection efficiency (see Figs. 15, 14, and 13, respectively) provides the following consistent picture. As an example, the 461 nm (dva) PSL particles at the second detection laser have a 4σ beam width (as diameter) of about 200 µm. With an effective width of the second detection laser of about 240 µm at this size almost all particles should be detected, and this is indeed confirmed by the results in Fig. 13.
4.3.4 Comparison of the particle beam divergences generated by different ALSs
To compare the performance of the new ALS from the ALABAMA with the ALS of other mass spectrometers, the particle beam divergence is used as described in Sect. 4.2.2. In Huffman et al. (2005) and Su et al. (2004), results of particle beam width measurements using Liu-type aerodynamic lenses (Liu et al., 2007) are presented. The aerodynamic lens type characterized by Liu et al. (2007) also corresponds to the aerodynamic lens previously used in the ALABAMA and is based on the design by Liu et al. (1995a, b). In Hünig (2020) and Molleker et al. (2020) results of the characterization measurements of ERICA (ERC Instrument for Chemical composition of Aerosols) are available. The detection units of the laser ablation part of ERICA are based on those used in the ALABAMA. Furthermore, the approach for determining particle beam widths (see Eq. 4) is similar to that used in Hünig (2020), except that a “transmission term” introduced there was not applied here. Nevertheless, the particle beam divergence determined in our study and by Hünig (2020) can be compared in the size range from about 240 to 2600 nm, since the maximum detection efficiency achieved in this size range was about 100 % in our study at 2.1 hPa lens pressure. In contrast to the ALABAMA, ERICA is equipped with the aerodynamic lens model IPL-013 (Aerodyne Inc.; Peck et al., 2016; Xu et al., 2017).
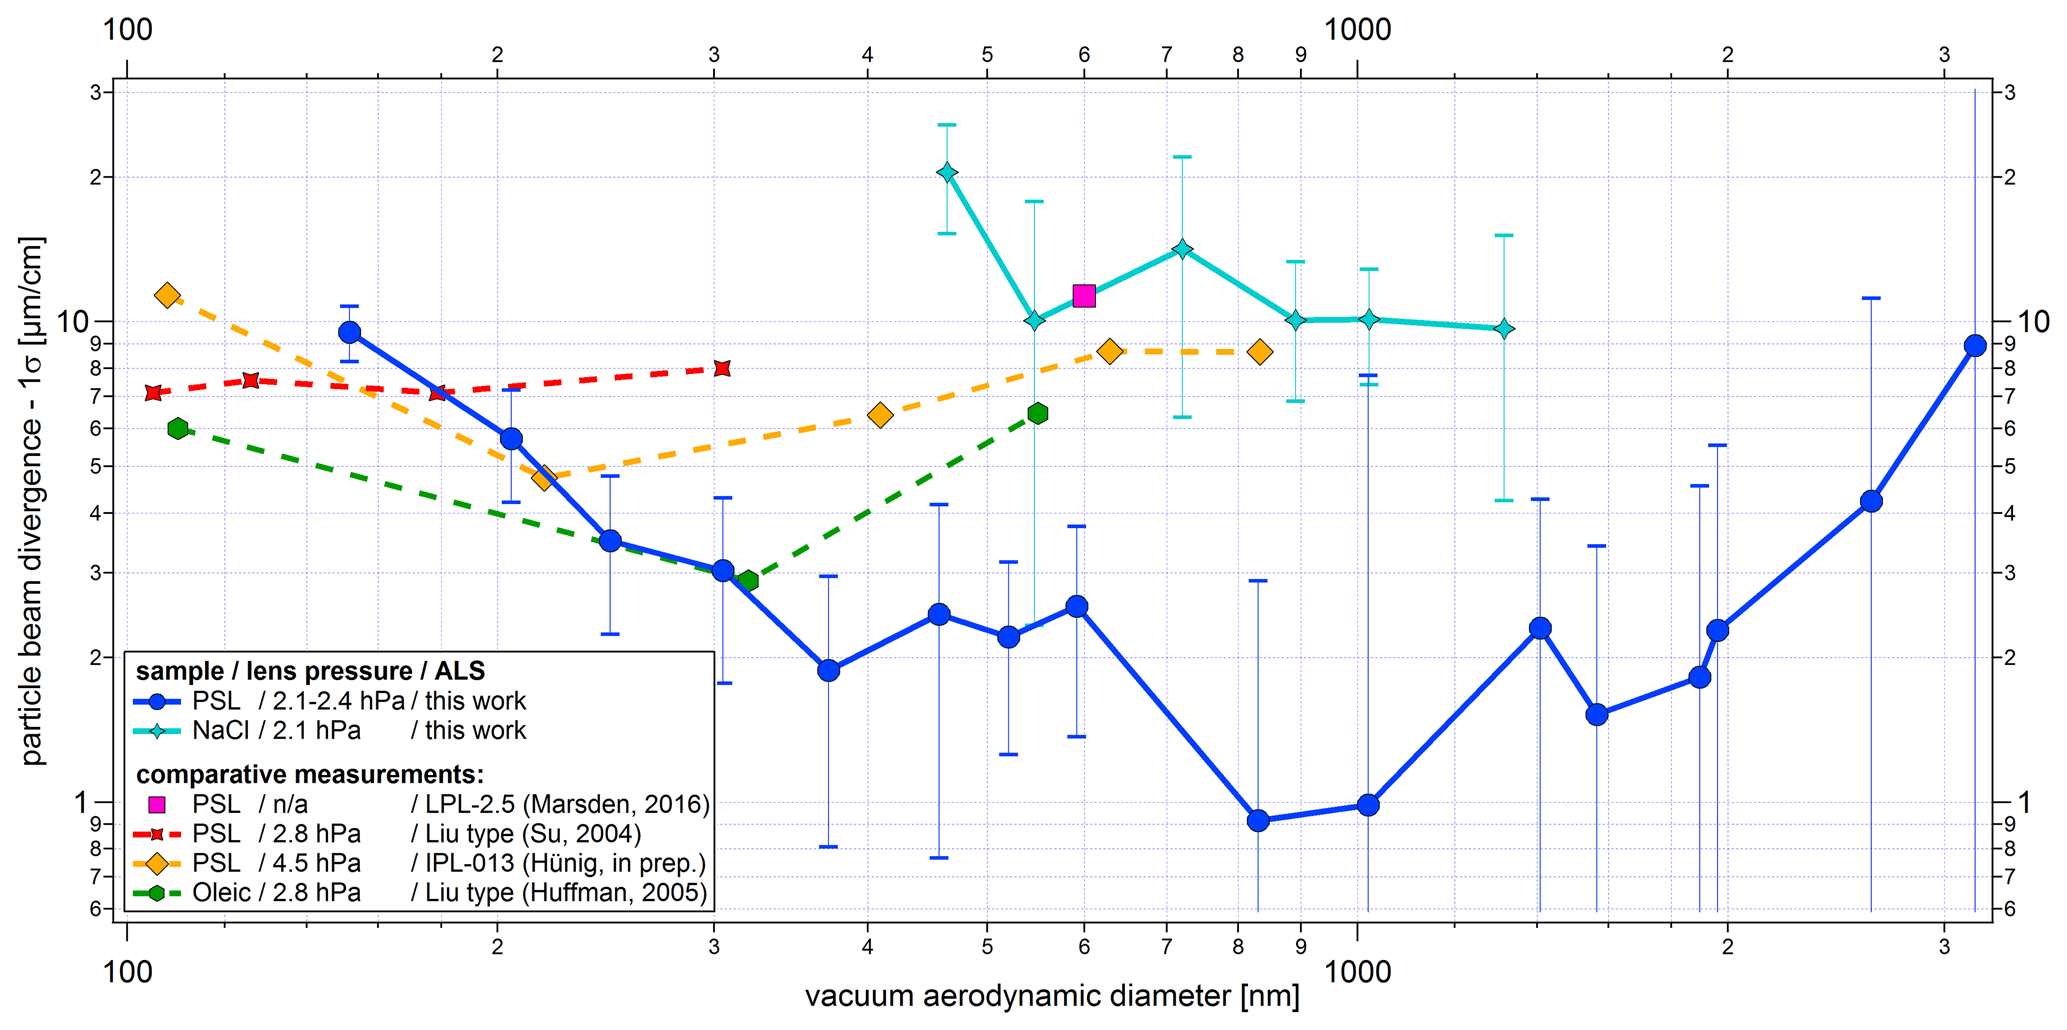
Figure 16Comparison of size-resolved particle beam divergences for different ALSs. The particle beam divergence for the ALABAMA was calculated from the particle beam width (1σP) at both detection units and their distance from each other. The same approach was used in Hünig (2020) and Marsden et al. (2016). For Huffman et al. (2005) and Su et al. (2004) the distance from the exit of the ALS to the vaporizer was used to determine the particle beam divergence, assuming that the particle beam has no broadening at the center point of the exit of the ALS. However, there is a finite radius of the particle beam at the exit of the ALS, as mentioned in Cziczo et al. (2006) and confirmed by our study. Sphericity is assumed for PSL and oleic acid particles, and a cubic shape is assumed for NaCl particles. The results of Su et al. (2004) are shown considering a particle density for PSL of 1.05 g cm−3. The y-uncertainty range is given by the uncertainty of the fit of each scan (see Sect. 4.2.2) and Gaussian error propagation. The x-uncertainty bars correspond to the standard deviation of the particle size distribution per particle size, particle type, and lens pressure measured with the ALABAMA, converted into dva according to Eq. (S1) (in the Supplement).
Figure 16 shows that the minimum particle beam divergence achievable with the new ALS is shifted towards larger particle sizes compared to measurements with the Liu-type and IPL-013 lenses. For spherical particles between 200 and 350 nm (dva) values of divergences are comparable with each other. For particles larger than 350 nm, a contrary behavior can be observed. With the new ALS, the divergence of the particle beam decreases further with a minimum value for 800 nm particle size, in contrast to the reference measurements. For spherical particles below 200 nm, the new ALS seems to be less efficient in particle focusing compared to the Liu aerodynamic lens type, which is particularly suitable for spherical particles below 400 nm (Liu et al., 2007). But in principle, the size-resolved PSL curve of the particle beam divergence from this work is similar to the curve determined from numerical calculations for a cylindrical nozzle (Zhang et al., 2002).
The measurements of NaCl particles show a particle beam divergence that is about 1 order of magnitude larger than that of PSL particles. Possible reasons for this difference have been discussed in Sect. 4.3.2. Similar to spherical particles, the beam divergence increases with decreasing particle size for cubic particles. An increase in the divergence of the NaCl particle beam towards larger particles cannot be demonstrated in this work.
4.4 Methods for characterizing the DIE and electric shielding
This section introduces the following three methods that have been used to characterize DIE in connection with the electric shielding: the hit rate, the lens scan through the cross section of the ablation laser's beam path, and the settings for the analysis of charging effects. The hit rate is defined as the ratio of laser pulses yielding detectable mass spectra to the total number of emitted laser pulses per time unit. To obtain particle mass spectra, a sufficient quantity of ions have to be detected, at least for one mass-to-charge ratio, to pass a predefined threshold. This threshold was set using background signals produced by laser shots on a particle-free air beam.
As described in Sect. 4.2.2, the lens scan method can also be used to scan the particle beam through the beam path of the ablation laser. The characteristic of the ablation laser beam is determined by means of the hit rate. However, the hit rate depends on the particle detection because the laser pulses on particles are only triggered if the particles have also previously triggered a signal at both detection units. Accordingly, a modified approach must be applied to find a suitable fit function. The fit function must represent the distribution of the hit rate along the cross section of the ablation laser beam. As an approach for such a hit rate imaging function, the portion of particles passing the ablation laser beam was set in relation to the portion of particles simultaneously passing the detection spot scaled up to the level of the ablation laser beam (according to Sect. S7 in the Supplement):
where rAL is the effective width of the ablation laser beam (as radius), y0(AL) is the y position of the maximum of the hit rate distribution, rDL(AL) is the effective detection width at the ablation laser beam level (as radius), σp(AL) is the particle beam width at the ablation laser beam level (as radius), describes a possible offset of the center position of the ablation (y0(AL)) to that of the detection spot (y0) determined at the second detection laser using Eq. (4), and bg is a value for the background. However, the effective detection width at the ablation spot (rDL(AL)) and the effective width of the ablation laser beam (rAL) depend on each other. To avoid this problem, the parameters for the particle beam width (σp), the effective detection width (rDL), and the center position of the detection spot (y0) were each determined first at the second detection laser using Eq. (4) before applying Eq. (5). Subsequently, the resulting particle beam width and the effective detection width were scaled up to the distance to the ablation laser in analogy to Sect. S7, resulting in rDL(AL) and σp(AL). Finally, the values of y0, σp(AL), and rDL(AL) were kept constant during the fit using Eq. (5). Therefore, only independent parameters were used for the fit. For the fit function additional assumptions had to be made: (1) the effective particle detection spot at the level of the ablation laser beam must be larger than the effective particle ablation spot of the ablation laser. (2) Negative background values for bg were not allowed. A parameter for the background (bg) was used due to the low number of laser pulses per scan position. Especially at the edges of the detection area, individual hits can significantly change the curve fit. (3) The edges of the hit rate curve were determined considering that either the number of sized particles for the respective scan position contained at least 5 % of the maximum number of sized particles per scan, or the number of hits was smaller than the number of laser pulses per scan position. The last point led to a slight distortion of the edges of the hit rate distributions. Otherwise, individual hits at the edges of the measuring range could have led to an increase in the distribution again so that no meaningful results could have been obtained from the fit process. Here we focus on the maximum position of the hit rate distributions and on the effective width of the ablation laser beam.
The calculations of the particle deflection in an electric field (see Fig. 6 and Eq. 1) showed that the charge and size of particles have an influence on their flight path through the mass spectrometer. To verify the charge effects, up to five different particle charges were used for each particle size. Using a DMA and monodisperse PSL particles enables a size-dependent charge selection. For the selection of differently charged particles of one size, the DMA voltage was calculated and set according to the manual of the DMA (TSI, 2009).
4.5 Results of the DIE and electric shielding characterization
4.5.1 Influence of particle charge on the hit rate without electric shielding using a fixed ALS position
A simple approach to examine the effect of particle charge on the hit rate is shown in Fig. 17. The experiments were conducted with polydisperse mineral dust particles suspended in water and nebulized by an atomizer with polydisperse particles sampled from laboratory air. In addition, two different measurement configurations were used: (1) suppressing the electric field using DIE as described above and (2) using an aerosol neutralizer to modify the charge distribution of the particles. During the measurement of these two particle samples the ALABAMA was not yet equipped with the electric shielding.
Figure 17Hit rate for two particle types (dust and laboratory air) with and without a particle neutralizer (NE) and either using the setup DIE(on) with delayed ion extraction or the setup DIE(off) with a constant ion extraction field. The results are presented as a box-and-whisker plot, with whiskers corresponding to the 10th and 90th percentile. The number of generated mass spectra for each experiment is given on top of the graph. Particle sizes of the samples are given as a median and interquartile range (Q75–Q25). (1) Dust: 575 and 115 nm, (2) laboratory air: 454 and 113 nm.
Figure 17a shows that the hit rate for dust particles is lowest when neither the neutralizer nor DIE is applied and highest when both devices are applied together. Thus, both delayed ion extraction and neutralizer applications increase the hit rate. This indicates that the deflection of charged particles from the straight flight path caused by the electric field is one of the reasons for the low hit rate. For laboratory air particles (Fig. 17b) the effect is similar, but no improvement is observed when the neutralizer is applied without DIE. This suggests that particles in ambient air are in a Boltzmann charge equilibrium (Wiedensohler, 1988; Wiedensohler et al., 1986) such that a neutralizer does not change the natural charge distribution. In contrast, particles produced by an atomizer such as the dust particles in Fig. 17a appear to carry more elementary charges. Hence, modifying the charge distribution to a Boltzmann distribution by a neutralizer reduces the deflection of the dust particles in the electric field. Thus, it could be concluded that the different hit rates from the dust particle measurement using a neutralizer and DIE compared to the measurement using only DIE are due to an electric field located outside the electrodes, which has an influence on the flight path of highly charged particles.
4.5.2 Influence of particle size and charge on the hit rate using a fixed ALS position
To measure the size-resolved hit rate, PSL particles from the atomizer were size-selected by the DMA. Not only singly charged particles were selected (as is the normal operation mode of the DMA), but also multiply charged particles as explained in Sect. 4.4. The influence of the particle charges on the hit rate was investigated using three different setups. The first setup, referred to as DIE(off), is the previous setup of the ALABAMA with a constant electric field between the first positive (nEx1) and negative (pEx1) ion extraction electrode (each 1100 V; according to Fig. 2). The second setup, referred to as DIE(off+), is similar to the previously mentioned one, but only the positive electrode is switched on and set to 1100 V. The idea behind this setup is to reduce the electric field within the ion extraction region. This should lead to a reduced deflection of charged particles. The third setup includes the newly installed delayed ion extraction, referred to as DIE(on). With the installed DIE no deflections of charged particles are expected. In the following, all three setups were used together with the electric shielding (see Fig. 8).

Figure 18Size-resolved hit rate for PSL particles using three different ion extraction field setups (line types) and differently charged particles (color code). The uncertainty of the hit rate is determined on the basis of binomial statistics related to the number of laser pulses from the ablation laser NShots and the number of successfully detected mass spectra NHits resulting from these laser pulses (see Sect. S15.3 in the Supplement). The x-uncertainty bars correspond to the standard deviation of the particle size distribution per particle size, particle type, and lens pressure measured with the ALABAMA, converted into dva according to Eq. (S1) (in the Supplement).
The size-resolved hit rate of the three setups differ significantly from each other, as shown in Fig. 18. Using the DIE(on) setup, a constant hit rate between 0.9 and 1.0 in the presented size range is achieved. Thus, we conclude that this setup eliminates the charge effects for all particle sizes. With the DIE(off+) setup, we also observe a large hit rate up to 1.0 in the size range from about 450 to 1600 nm (dva). But in contrast to the previous setup with DIE, a significant decrease in the hit rate is observed below about 450 nm, which is more pronounced for higher charged particles: for example, at 207 nm (dva), the hit rate decreases from 0.87 for z=1 to 0.38 for z=3. This observation confirms the expected effects of size and charge on the deflection of charged particles (see Fig. 6). For the experiments with the DIE(off) setup, the observed hit rates are generally lower than in the two other experiments. Also, the hit rate decreases with increasing charge numbers and decreasing particle size. Additionally, the hit rate decreases for particles larger than 1000 nm. However, the weaker charge dependence confirms Eq. (1) that the deflection in the electric field is weaker for large particles than for small particles. The decreasing trend above 1000 nm for this setup may be due to a size-dependent shift of the particle beam, which might be caused by mechanical imperfections of the ALS (e.g., Huffman et al., 2005). The reason for the assumption of a particle beam shift is that for this setup hit rates up to 1.0 could also be achieved for particles above 600 nm after changing the position of the aerodynamic lens.
4.5.3 Influence of particle size on the deflection of charged particles using the lens scan method
Using the automated lens scan, we determined the hit rate along the cross section of the ablation laser's beam path in relation to the detection efficiency along the cross section of the second detection laser. PSL particles with 308 and 1029 nm size were chosen for this experiment. Figure 19a demonstrates that with the DIE(on) setup almost no difference is observed between the curves for the differently charged 308 nm PSL particles. In contrast, scans with the DIE(off+) setup show a shift of the curves and their maximum positions with increasing charge number. Although the shape of the curves differs slightly, a shift of their maxima of about 65 µm per charge number can be inferred. A calculation of the particle deflection within the electric field after Eq. (1), using 1100 V for both electrodes, resulted in a shift of roughly 90 µm for 300 nm PSL particles. For the DIE(off) setup, the particle deflection is so strong that the shape of the curve seems to be deformed. Due to this deformation, the maximum of the distributions cannot be unambiguously determined. Nevertheless, the large deflection can be seen by the shift of the curves. For particles with higher charge numbers the curves deviate more from those of the DIE(on) setup.
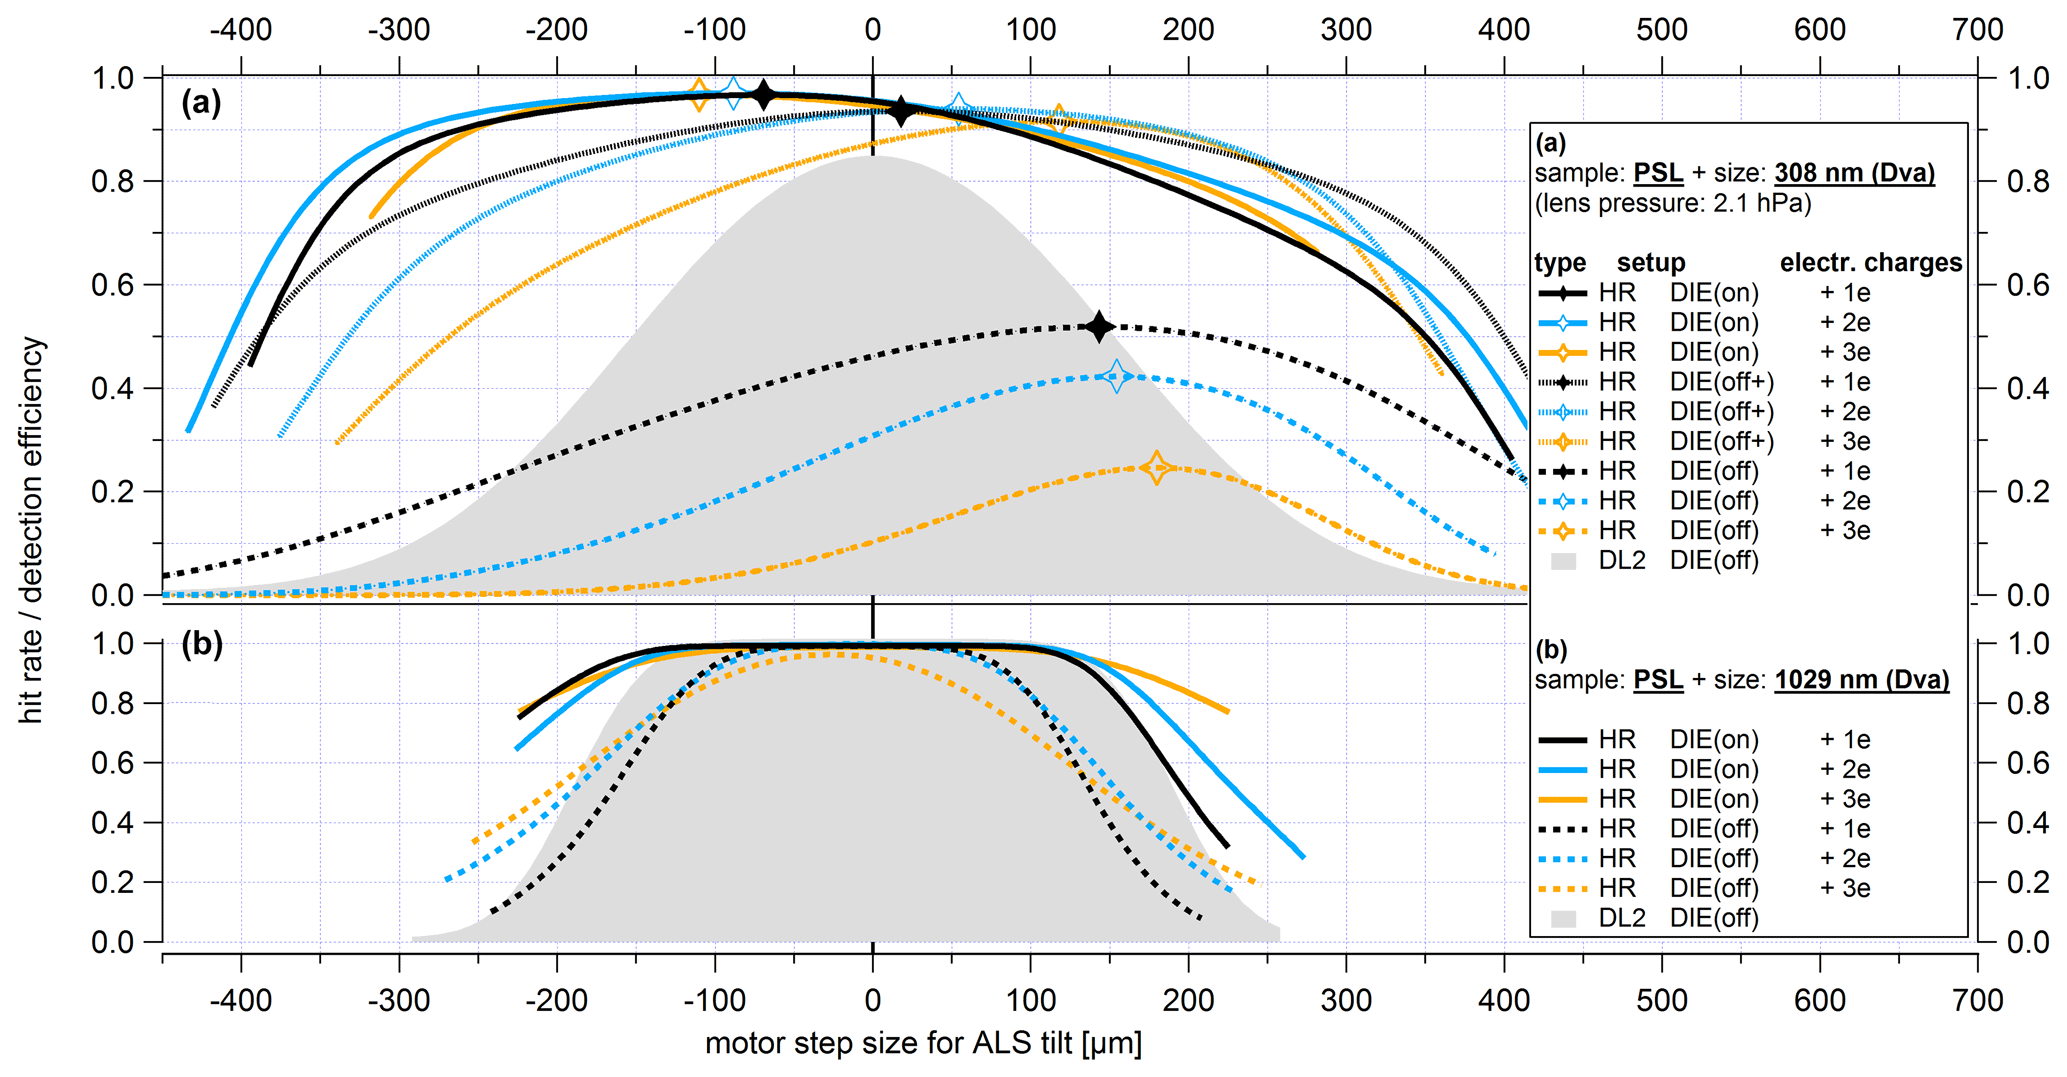
Figure 19Hit rate (HR) distribution along the cross section of the ablation laser's beam path using differently charged PSL particles of size (a) 308 nm and (b) 1029 nm for the three different ion extraction field setups. The curves are the fits through many data points, and the symbol marks the maximum of the curve. The bold solid (DIE(on)), dotted (DIE(off+)), and dashed lines (DIE(off)) correspond to fit curves with the hit rate resulting from the lens scans (according to Eq. 5). As a reference example, the detection efficiency at the second detection laser is shown by the gray shaded area. For this example, singly charged PSL particles in combination with the DIE(off) setup were chosen. All hit rate curves are related to the maximum values resulting from the curve fit at the second detection laser (DL2) for each scan (0 on the abscissa). The colors represent the different particle charges from z=1 (black) to z=3 (orange).
To test whether the deflection only affects small particle sizes (as calculated before; see Fig. 6), the experiments were repeated for 1029 nm PSL particles as shown in Fig. 19b. It can be seen that neither the scans with the DIE(on) setup nor those with the DIE(off) setup show charge-dependent shifts of the curves. Furthermore, the curves are almost symmetric around the center point of the detection efficiency scan at the second detection laser (marked as the zero line). This shows that the particle beam for 1029 nm PSL particles is not dependent on their charges. However, it becomes clear that using the newly installed DIE results in a much broader range of effective ablation, ionization, and ion extraction compared to the setup without DIE. Thus, an enhanced hit rate can also be achieved at the edge of the ablation laser beam. The asymmetric curves for 308 nm PSL particles using the DIE(on) setup result from the assumptions made in Sect. 4.4, which lead to a slight distortion of the edges of the hit rate distributions. Furthermore, the measurements revealed a slight offset between the beam center position of the second detection laser and the beam center position of the ablation laser, which also contributes to an asymmetry.
4.5.4 Influence of the ion extraction field setup on the effective width of the ablation laser beam using the lens scan method
The effective width of the ablation laser beam indicates the spatial extent to which the particles can still be ablated so effectively that they produce a sufficient quantity of ions to generate a mass spectrum. As described above, the effective width for the ablation, ionization, and ion extraction process is derived from the hit rate fit function (see Eq. 5). This was done for the three different ion extraction field setups as a function of particle size.

Figure 20Averaged effective width of the ablation laser beam for the different ion extraction field setups resulting from lens scans (see Sect. 4.4). The y-uncertainty range is given by the uncertainty of the fit of each scan (see Fig. 12) and Gaussian error propagation. The x-uncertainty bars correspond to the standard deviation of the particle size distribution per particle size, particle type, and lens pressure measured with the ALABAMA, converted into dva according to Eq. (S1) (in the Supplement).
It can be seen in Fig. 20 that the effective width of the ablation laser beam is much larger using the DIE(on) setup than with the DIE(off) setup for all particle sizes. This indicates that using DIE it is possible to generate mass spectra of particles that are further away from the center of the ablation laser's beam path compared to the DIE(off) setup. This is particularly important for aspherical particles because such particles are less well focused than spherical particles (see Fig. 14). A more detailed analysis of the influence of DIE on the ion yield is shown below. For the DIE(off+) setup similar effective widths of the ablation laser beam can be achieved as for the case of activated DIE. The reason for the larger discrepancy at about 600 nm could not explained. As already mentioned, the determination of the effective ablation laser beam width is dependent on the effective width of the detection lasers, which is also shown in Fig. 20, but extrapolated to the ablation point. Nevertheless, the results are useful to highlight the differences in the spatial extent of the effective ablation, ionization, and ion extraction process for the different setups.
4.5.5 Influence of the ion extraction field setup on the mass spectral signals using the lens scan method
To investigate how the different setups influence the quality of the mass spectra, two characteristic features of the spectra were investigated: along the scan path, the number of resulting m∕z signals per PSL mass spectrum and their cumulative intensity were averaged for each position perpendicular to the ablation laser beam (see Fig. 21). The evaluation of the m∕z signals is based on ion peak area of the spectral lines that were obtained using the software tool CRISP (Concise Retrieval of Information from Single Particles; Klimach, 2012). The ion peak area (in millivolts × samples; with samples as the number of oscilloscope sampling points within the ion peak area) of a certain mass-to-charge ratio is determined by integrating the raw spectra of the ion flight times (Klimach, 2012). In the resulting mass spectrum the ion signals are displayed as sticks, the height of which is proportional to the ion peak area (“stick spectrum”). In addition, a threshold value was defined for determining the number of m∕z signals. For this purpose, about 40 000 empty spectra of particle-free air were recorded and converted into stick spectra. Subsequently, all existing sticks were averaged () and their standard deviation (σ) was determined. Using , the absolute anion and cation threshold is 8.19 and 5.33 mV × samples, respectively. Thus, each m∕z signal of the PSL mass spectra above this threshold were counted as an actual signal. Using these counted signals, the number and sum of the m∕z signals per mass spectrum were determined and subsequently averaged over the total number of mass spectra detected per particle beam position.
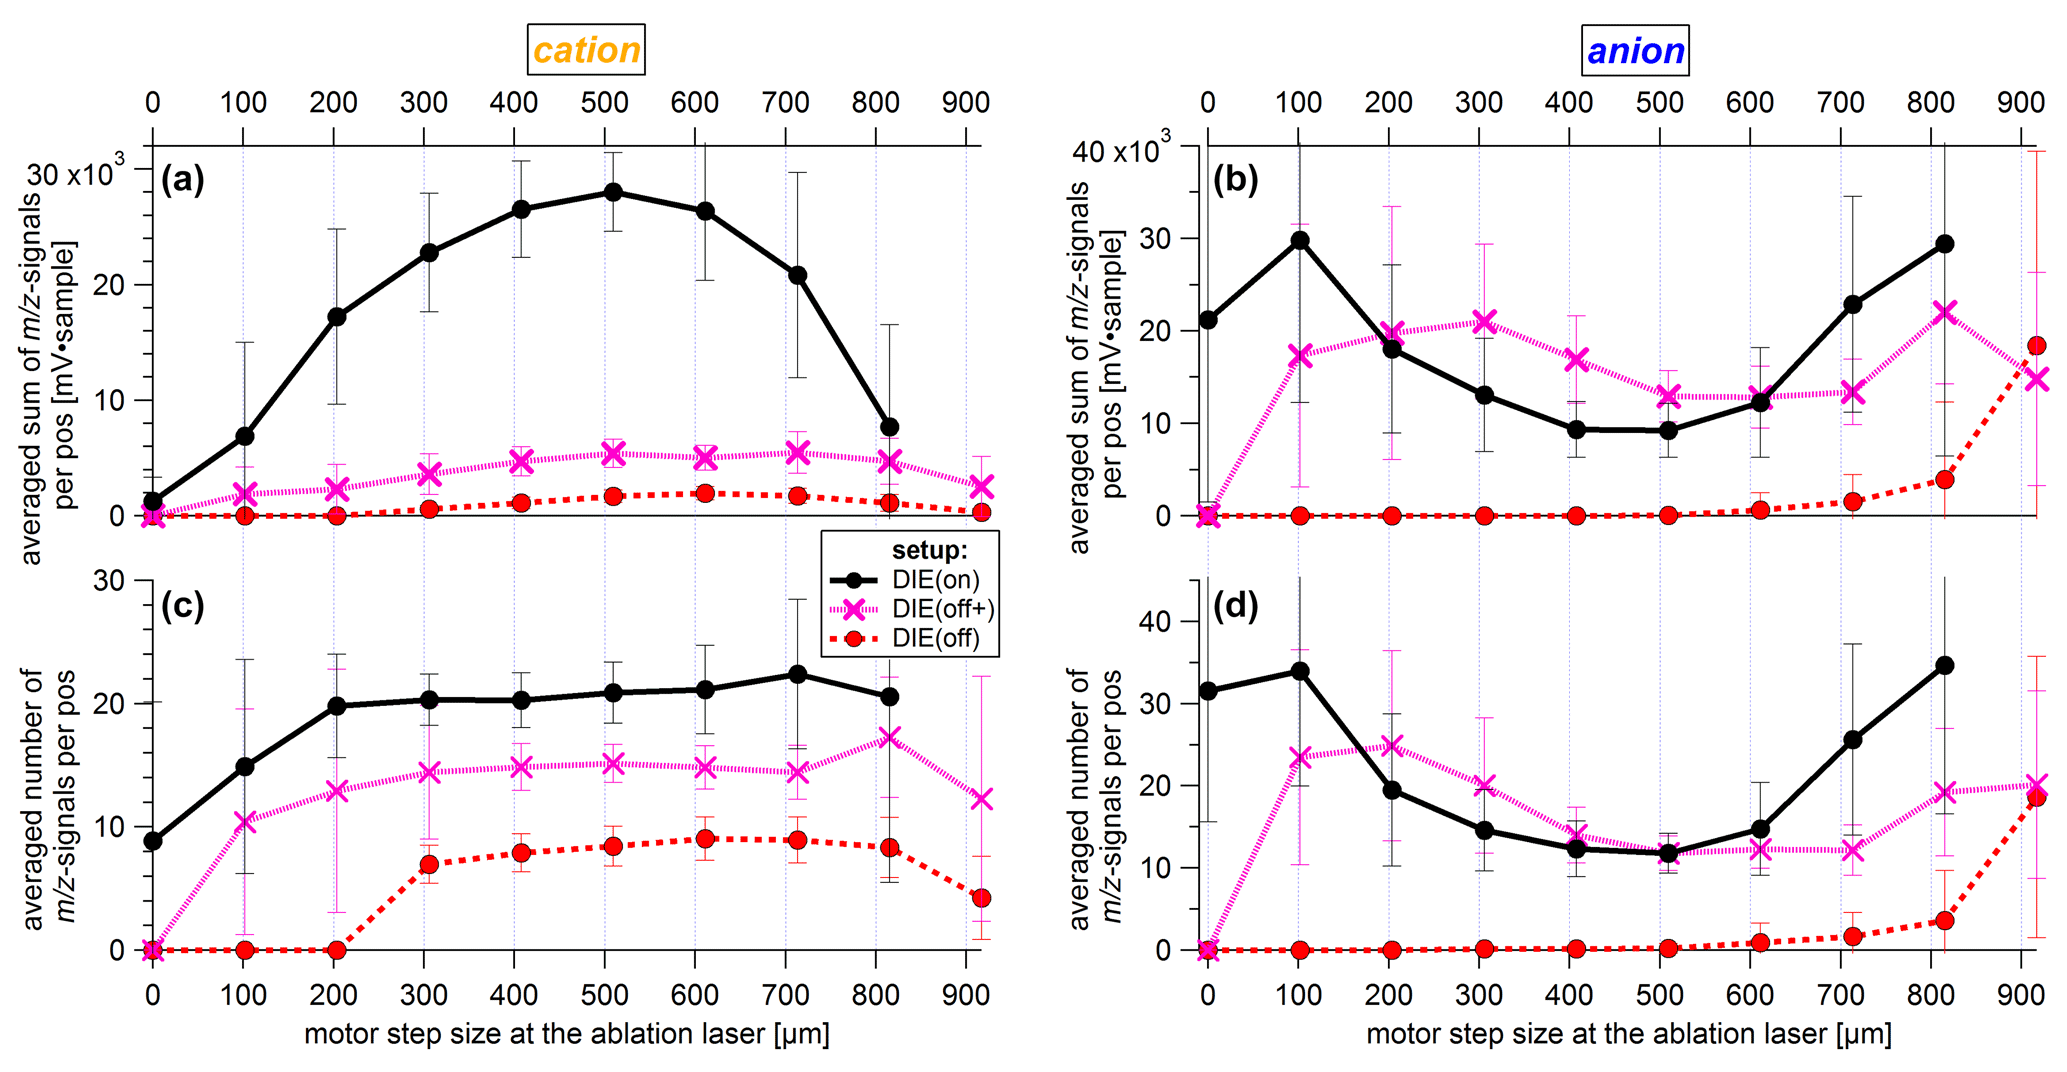
Figure 21Dependence of mass spectral information on particle beam position along the cross section of the ablation laser's beam path and the applied ion extraction field setup using 1029 nm (dva) PSL particles. (a, b) The averaged signal intensities of the mass spectra per scan position. (c, d) The averaged number of m∕z signals of the mass spectra per scan position. Measurements were performed with laser energies between 4.8 and 5.4 mJ and with the DMA that selected a particle charge number of z=1. PSL particles of 1029 nm (dva) result in a particle beam width as diameter of about 150 µm for 4σ (=95 % of particles) at the ablation point and in an effective ablation laser beam width of about 500 µm. The uncertainty bars correspond to the standard deviation of the number and sum of the m∕z signals of the mass spectra per position.
Figure 21 shows an example for a scan through the cross section of the ablation laser's beam path using 1029 nm (dva) PSL particles. Figure 21a clearly indicates the differences in m∕z signals between the three setups: with DIE(on) the sum of m∕z signals is higher compared to the other setups by more than a factor of 7. It is not surprising that the DIE(off+) setup with the negative electrode pEx1 switched off has a reduced cation signal intensity. This is because pEx1 has an influence on the flight path of the positive ions in the extraction region, which is important for the number of ions collected and their mass separation. Similar differences exist for the number of m∕z signals per cation spectrum (Fig. 21c). A significantly higher number of m∕z signals above the threshold is obtained when using DIE. Again, the ion yield is lowest with the DIE(off) setup. Furthermore, along a wide range through the ablation laser beam the number of cation signals is quite constant for all three setups. The number of m∕z signals is an essential component for the application of cluster algorithms to mass spectra, which is useful to analyze a large number of particle spectra. A different number of m∕z signals can result in a different particle classification. In addition, further chemical information can be obtained from additional m∕z signals, thereby allowing for a more accurate analysis of the particle composition. Moreover, an improved reproducibility of the cation mass spectra is observed when using DIE (see Sect. S13 in the Supplement).
In contrast to the cation signals, the anion signals result in similar values for the setups DIE(on) and DIE(off+) in both cases, the sum of the signal intensities (Fig. 21b), and the number of m∕z signals (Fig. 21d). However, the offset between the DIE(on) and the DIE(off+) curve is not fully understood yet. An even bigger difference is observed for the DIE(off) setup. It is also noteworthy that only a one-sided increase in the anion signals can be observed with the DIE(off) setup. For setups DIE(on) and DIE(off+), high anion signals are measured at both edges of the ablation laser beam, whereas anion signals using the DIE(off) setup are only observed when the particle beam is shifted towards the positive electrode (nEx1). One possible reason for this effect is that the path of the anions to the corresponding extraction grid is shorter in this case. However, the reasons for losing the anion signals at the other edge of the ablation laser beam are still unknown. Moreover, it affects all particle sizes above 461 nm (dva). Below 461 nm, no anion signals can be detected with the DIE(off) setup at all (see Figs. S8 and S9, Sect. S12 in the Supplement).
Interestingly, the cation and anion signals behave in an opposite manner in Fig. 21. With increasing laser intensity, more cations but fewer anions were detected. With decreasing laser intensity towards the edges of the ablation laser beam, however, more anions but fewer cations could be detected. This effect was observed in our experiments for all PSL particles larger than 290 nm (dva). Similar observations have been reported from studies of oleic acid particles using varying laser intensities and wavelengths (Thomson et al., 1997). In Thomson et al. (1997) it was found that the ion formation process has a nonlinear dependence on laser energy using laser wavelengths of 193 and 248 nm. Furthermore, they found that the ion formation threshold depended on particle sizes and ion polarity. The latter point resulted in a lower ion formation threshold for cations than for anions. As a possible reason for the decreasing ion yield of anions at higher laser energies, an increasing formation of free electrons was assumed, whereby the electrons absorb so much energy that they can leave the solid before they can transfer the energy to the lattice, resulting in a reduced number of negatively charged ions (Thomson et al., 1997; Varel et al., 1998; Vertes et al., 1988). A possible explanation for the different ion yields (for both cations and anions) in the different setups is the spatial distribution of the ions directly after particle ablation and ion-forming process, which is associated with the electric field within the extraction region. Using DIE, the ions can first move away from the ablation spot according to the momentum they have received from the ablation process. After about 70 ns the electric field is applied and the ions are extracted. If DIE is not used, the permanent electric field causes an immediate deflection of the ions. As cations and anions are accelerated in opposite directions, the probability of interactions or collisions between cations, anions, and neutral molecule fragments increases in a denser ablation and ion plume, resulting in a lower ion yield.
4.5.6 Comparison of the particle-size-dependent hit rate using a fixed ALS position
The particle-size-dependent hit rate of the ALABAMA with the newly installed components, compared to earlier data from Brands (2009) and Brands et al. (2011), is given in Fig. 22. The measurements of Brands et al. (2011) were conducted with an ALABAMA setup without delayed ion extraction and without electric shielding, together with the previously used Liu-type aerodynamic lens. In addition, the measurements of Brands et al. (2011) were carried out using a 100 µm pinhole as a critical nozzle and a pressure inside the aerodynamic lens of 3.8 hPa. The data with the new setup were taken at a lens pressure of 2.1 and 2.4 hPa. Both the newly installed delayed ion extraction and the electric shielding, together with the improved particle beam properties, have a significant influence on the size-resolved hit rate. The results presented here were obtained at the same fixed ALS position as that used for the detection efficiency measurements of the sized particles in Sect. 4.3.1 (see Fig. 13).
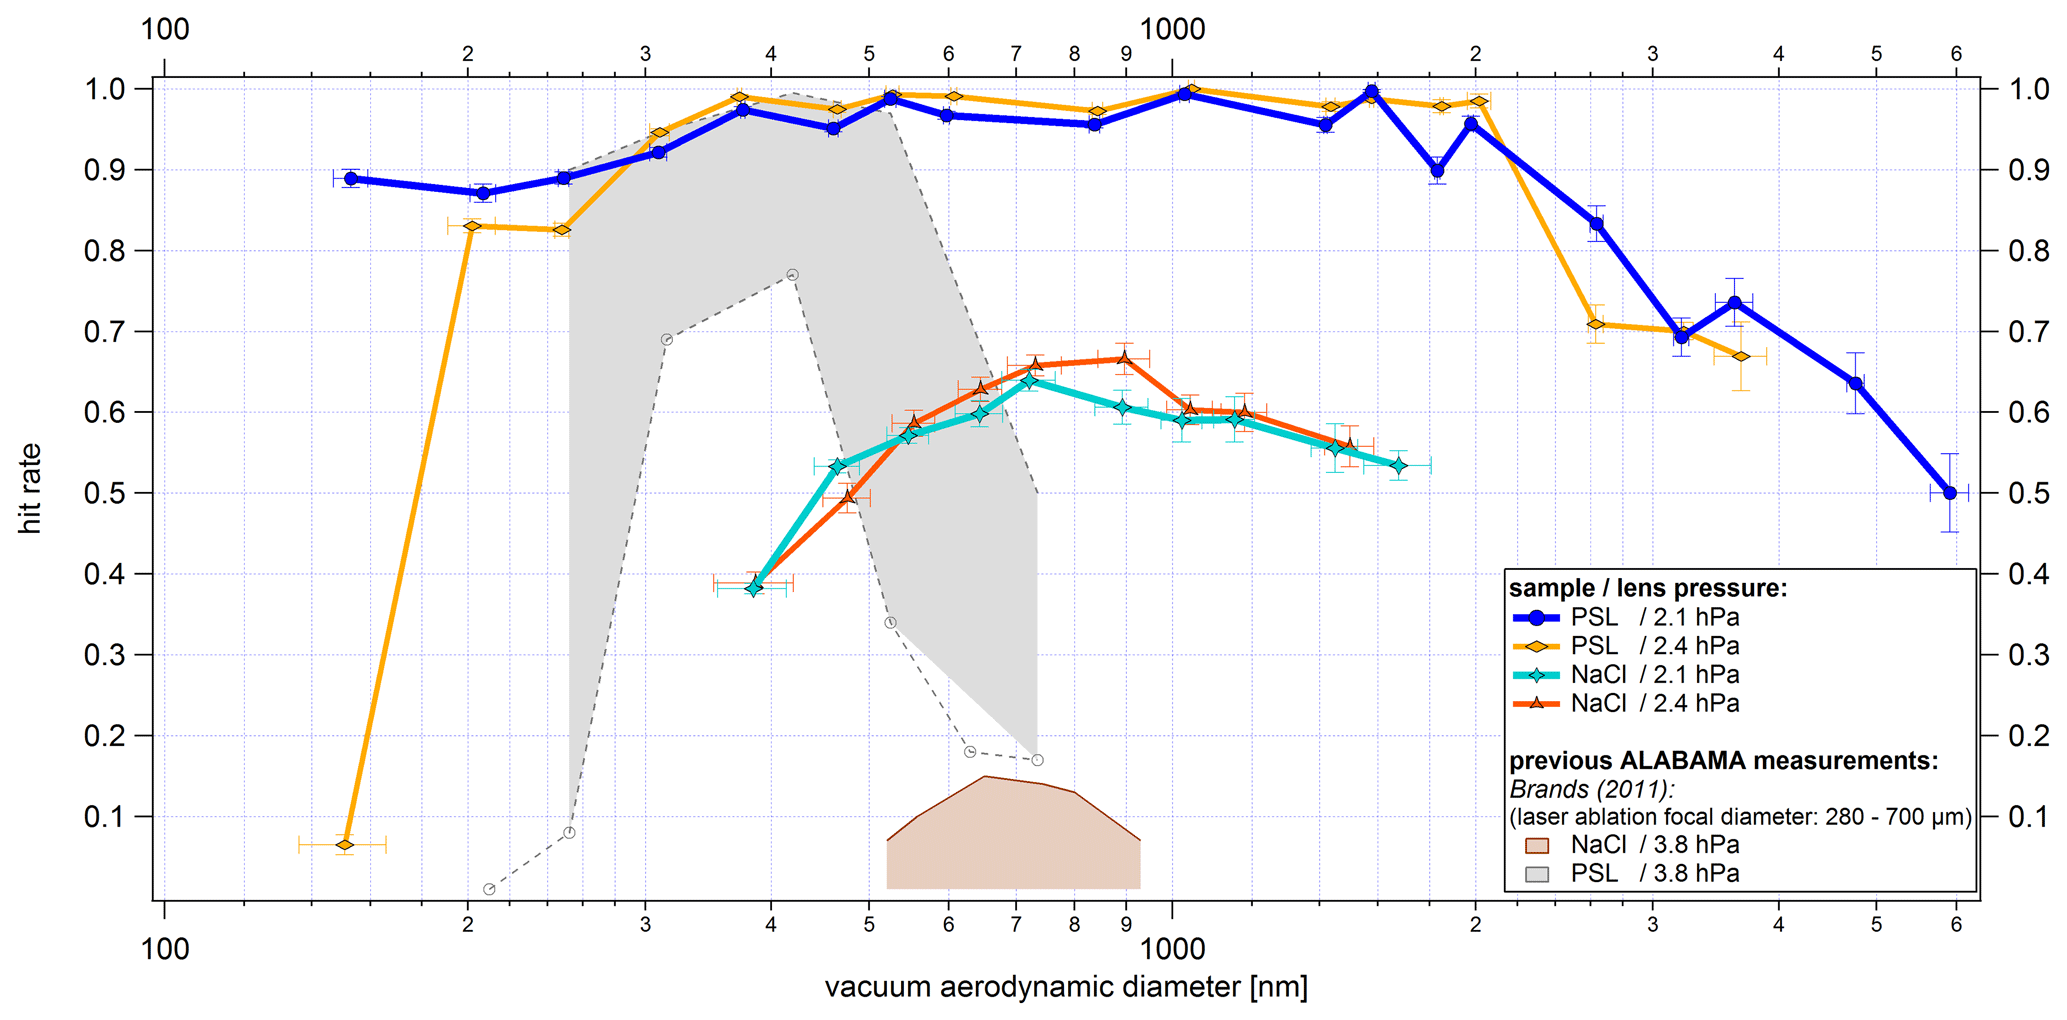
Figure 22Size-resolved hit rate for PSL and NaCl particles using a lens pressure of 2.1 and 2.4 hPa. ALABAMA measurements without the new features presented in this article are shown as colored areas. The colored areas (gray: PSL, red: NaCl) denote the hit rate achieved by Brands et al. (2011) by changing the diameter of the ablation laser beam focus from 280 to 700 µm. The uncertainty of the hit rate is determined on the basis of binomial statistics related to the number of laser pulses from the ablation laser NShots and the number of successfully detected mass spectra NHits resulting from these laser pulses (see Sect. S15.3 in the Supplement). The x-uncertainty bars correspond to the standard deviation of the particle size distribution per particle size, particle type, and lens pressure measured with the ALABAMA, converted into dva according to Eq. (S1) (in the Supplement).
Figure 22 shows that with the improvements of the ALABAMA a hit rate above 0.8 can be achieved for PSL particles between 150 and 2600 nm (dva) with an ALS pressure of 2.1 hPa. Similar values are reached with a lens pressure of 2.4 hPa, with the exception of 153 nm PSL particles, which are almost not hit at all. Possible reasons for this observation may be a stronger displacement of the particle beam axis or a significant change in the particle beam shape. The observed shift of the particle beam axis in the ablation region by roughly 300 µm between the particle size measurements from 153 to 1833 nm PSL using DIE and 2.1 hPa lens pressure (not shown here) suggests that the particle beam shift is a likely explanation.
In contrast to the determination of the effective width of the ablation laser beam presented in Sect. 4.5.4, the diameter of the ablation laser beam in Brands et al. (2011) was determined by means of a microscope after laser pulses had previously been shot on photographic paper. With a diameter of 700 µm, a hit rate of almost 100 % was achieved for PSL particles of about 400 nm, but at the same time no ion signals were detected for NaCl particles at this focal diameter in their study. This finding was explained by an energy density that is too low in the area of the laser focus such that NaCl particles were not ablated and/or not ionized (Brands et al., 2011). With a focus diameter of 280 µm, the hit rate for PSL was reduced to below 80 %, since more particles miss the ablation laser beam. However, with the 280 µm focal diameter the energy density was sufficient to generate and detect NaCl ions (Brands et al., 2011), resulting in hit rates up to 15 %. In comparison, using the newly installed components, hit rates of over 50 % in the size range from 460 to 1700 nm (dva) can be achieved for NaCl particles. However, no significant difference in the hit rate is observed when increasing the ALS pressure from 2.1 to 2.4 hPa.
The improved performance of the ALABAMA was further confirmed during aircraft-based measurements. In 2014, the ALABAMA was operated using the setup by Köllner (2020) during the ML-CIRRUS mission (Voigt et al., 2017), whereas in 2018, the ALABAMA was operated with all modifications presented here during the mission CAFE-Africa (Schneider et al., 2020). An increase in the hit rate of about 5 times was observed in both tropospheric and stratospheric aerosol particle analyses over the entire particle size range (Schneider et al., 2020).
With other single-particle mass spectrometers, e.g., the LAAP-ToF-MS, hit rates between 80 % and 100 % can also be achieved by using PSL particles over a wide size range (400 to 2000 nm) (Shen et al., 2018). The LAAP-ToF-MS is based on a different measuring principle compared to the ALABAMA: the ablation laser is already pulsed on particles when they trigger a scatter signal at the second detection unit. The ablation laser of the LAAP-ToF-MS is an excimer laser with a wavelength of 193 nm, which shoots in the opposite direction of the particle flight direction. On the one hand, this makes it possible to keep the device compact; on the other hand, it makes the ablation laser less susceptible to variations in the timing of the laser pulse (Marsden et al., 2016). The increased ablation efficiency of the LAAP-ToF-MS is achieved at the expense of a lower detection efficiency, since the elliptical mirrors must be omitted due to the design, and so far only maximum detection efficiencies of about 25 % at the first detection laser could be achieved using PSL (Marsden et al., 2016).
To verify that the hit rate of INPs can be improved by applying DIE, additional laboratory measurements at the Leibniz Institute for Tropospheric Research were conducted. The setup for these measurements has been described in Sect. 4.1.3 (see Fig. 10). The INP measurements were done with the new aerodynamic lens system, delayed ion extraction, and the installed electric shielding in the ALABAMA. Due to the complexity and expense of these measurements, only DIE could be tested for improvements.
Three different particle samples were used for the analysis: (a) birch pollen (dmob 500 nm), (b) Snomax (dmob 500 nm) and NaCl (dmob 300 nm) externally mixed, and (c) feldspar (dmob 500 nm). Birch pollen, Snomax, and feldspar particles become immersed in a water droplet and freeze heterogeneously upon cooling under the aforementioned conditions inside FINCH or SPIN. In contrast, NaCl particles activate to droplets but freeze homogeneously only below −38 ∘C. Since FINCH was operated at a temperature of about −24 ∘C and SPIN at about −25 and −36 ∘C in operating mode, only heterogeneous ice nucleation was investigated. The particle samples (a)–(c) were measured with four different configurations. First, the test particles were guided to the ALABAMA after ice activation in FINCH or SPIN and ice residual separation in the PCVI. Second, the particles were collected from the particle generator without prior ice nucleation and counterflow separation. Third and fourth, both setups were tested with activated and nonactivated DIE. Here we focus on the observed hit rate between the different setups.

Figure 23Hit rate for three particle samples. (a) Birch pollen (dmob 500 nm), (b) Snomax (dmob 500 nm) and NaCl (dmob 300 nm) externally mixed, and (c) feldspar (dmob 500 nm), along with the different ice nucleation setups: FINCH or SPIN together with PCVI in ice activation mode (labeled as ice), with prior ice activation and separation process; FINCH or SPIN together with PCVI in no-ice activation mode (labeled as no ice), without prior ice activation and separation process but still with the particle flow through FINCH or SPIN and PCVI. Each particle sample was tested using the DIE(on) and DIE(off) setup in ice activation and no-ice activation mode. For the birch pollen sample the SPIN measurements were only performed with the DIE(on) setup. The measurements marked DIE(off)* were performed with 450 and 1100 V at the electrodes pEx1 and nEx1. In contrast, the unmarked measurements were carried out with 1100 V each. The results are presented as a box-and-whisker plot, with whiskers corresponding to the 10th and 90th percentile. The number of generated mass spectra for each experiment is given on top of the graph.
In general, the hit rate is higher for experiments with DIE than for experiments without DIE (Fig. 23). For all analyzed types of ice residuals the hit rate (median) is higher by more than a factor of 2 with DIE than without DIE. Interestingly, for all test particle types the hit rate of the ice residuals is lower than for the particles without prior ice activation. Even if the difference in the case of the externally mixed sample may be explained by the missing NaCl particles in the heterogeneous ice activation mode, it is not expected for birch pollen or feldspar. This finding cannot be explained by particle charging effects because this should be compensated for by DIE. Since both the FINCH measurements and the SPIN measurements show a decrease in the hit rate in the ice activation mode, it also seems to be independent of the INP counter used. The reasons for the lower hit rate of the ice residuals compared to the untreated test particles is not known. One possible explanation might be a modification of the particle shape caused by the ice activation and evaporation processes as described in Adler et al. (2013). Although a certain amount of contamination particles was detected, we can rule out the possibility that this was the main reason for the observed decrease in the hit rate (see Sect. S14 in the Supplement). Nevertheless, the use of DIE achieves a significant improvement in the hit rate of INPs, which generally leads to improved statistics.
We demonstrated that the performance of the single-particle mass spectrometer ALABAMA was significantly improved by using a newly developed aerodynamic lens system, a delayed ion extraction, and better electric shielding. Improvements in detection efficiency were observed over a wide particle size range for both spherical and cubic particles. For PSL particles, detection efficiencies of 90 %–100 % in the particle size range of 350–1800 nm could be measured using the new ALS at a fixed position and at a lens pressure of 2.1 hPa. These high detection efficiencies were confirmed by measurements of the particle beam width and the effective width of the detection lasers. The particle beam width (4σP, including 95 % of all particles) in the size range from 350 to 1800 nm was smaller than 200 µm, whereas the effective width of the detection lasers was larger than 200 µm. With the new ALS it was further possible to extend the detectable particle size range, especially for large particles, compared to the Liu-type ALS, which was previously used in the ALABAMA. This led to an increase in the upper 50 % cutoff diameter of detection efficiency d50(sizedP) by more than 1300 nm with the new ALS, resulting in a d50(sizedP) size range of 230–3000 nm for PSL particles at a lens pressure of 2.1 hPa. However, whether the extended particle size range with the new ALS was due to reduced particle impaction losses in the ALS, more effective focusing of larger particles within the new ALS, and/or a smaller size-dependent shift of the particle beam could not be conclusively assessed. For cubic NaCl particles the modifications achieved up to 2 times higher detection efficiencies. Nevertheless, measurements with NaCl particles showed a significantly broader particle beam and smaller effective widths of the detection lasers compared to PSL particles, resulting in a maximum detection efficiency of about 25 %.
Further, the new components achieved an improved hit rate for particles of different shapes and compositions (e.g., PSL, NaCl, mineral dust, birch pollen washing water). On the one hand, the delayed ion extraction and electric shielding prevent the undesired deflection of charged particles in the ion extraction field, which is particularly important for small, light, and highly charged particles. On the other hand, the delayed ion extraction increases the ion yield from the ablation, ionization, and ion extraction process, which led to more and higher mass spectral signals of the measured PSL particles. The increased ion yield further resulted in a larger effective width of the ablation laser beam, which in turn led to PSL particle hit rates of more than 80 % in the size range from 150 to 3000 nm. The hit rate of NaCl particles was approximately quadrupled compared to previous measurements. Additionally, an improved reproducibility of the cation mass spectra was found when using DIE.
In summary, it can be stated that the previous design of the ALABAMA has been successfully modified, since both hit rates of up to 100 % and detection efficiencies of up to 100 % were achieved in a size range from 350 to 2000 nm. Thus, the new components of the ALABAMA generally result in significantly improved particle analysis and sample statistics. This is particularly important for measurements of low-number-density particles, such as ice-nucleating particles, and for aircraft-based measurements at high altitudes or where high temporal and spatial resolution is required. For future measurements in environments with low particle concentrations it would be conceivable to increase the sample statistics even further by increasing the sample flow into the ALABAMA. To achieve this, the skimmer opening could be reduced so that even with increasing sample flow, the maximum pressure for using high voltages in the mass spectrometer is not exceeded.
Data can be accessed by contacting the corresponding author, Johannes Schneider (johannes.schneider@mpic.de).
The supplement related to this article is available online at: https://doi.org/10.5194/amt-13-5923-2020-supplement.
HCC measured all the particle samples, produced all figures, and wrote the paper with the help of JS and FK. HCC and TK designed the aerodynamic lens. HCC designed the air diffusor. FH and FR designed the constant pressure inlet. FH designed the alignment holder for the ALS. FH, TK, and HCC implemented the DC motors and the motor control for automated tilting of the aerodynamic lens system. HCC, TK, and FH designed the electric shielding. HCC, FH, and TK implemented the DIE. HCC analyzed the data with the help of TK, JS, and FK. AH conducted and evaluated the ERICA measurements. JS, HW, SM, and FS coordinated and supported the TROPOS measurements. SM operated the pumped counterflow virtual impactor. RK and FF operated the FINCH. AW operated the SPIN. SB, JS, FK, SM, HW, FH, TK, AW, FS, and FF participated in the review of the analyses and paper preparation.
The authors declare that they have no competing interests.
The measurements were funded by the Deutsche Forschungsgemeinschaft (DFG, German Research Foundation) – project number 170852269 (grants SCHN1138/2-2 and STR 453/7-2; FOR1525 “INUIT” – RP2) and by the EU Horizon 2020 research and innovation program, grant no. 654109 (ACTRIS-2). We would like to acknowledge partial funding through the German Federal Ministry of Education and Research (BMBF, project number 01LK1601B). We would also like to thank Sarah Grawe, Udo Kästner, and Heinz Bingemer for their support during the laboratory campaign at the Leibniz Institute for Tropospheric Research. Special thanks go to Thomas Böttger for his help in the production of the aerodynamic lens and the air diffusor, as well as to the staff of the instrument development and electronics group and the workshop of the MPIC, especially Sebastian Best, Dirk Schoch, Michael Dieterich, and Ralf Wittkowski. We would also like to thank Sergej Molleker for providing us with the new in-house-manufactured O-ring type and Oliver Eppers for his help in installing the electric shielding.
This research has been supported by the Deutsche
Forschungsgemeinschaft (grant nos. SCHN1138/2-2 and STR 453/7-2) and
Horizon 2020 (ACTRIS-2, grant no. 654109).
The article processing charges for this open-access
publication were covered by the Max Planck Society.
This paper was edited by Pierre Herckes and reviewed by Giuseppe Petrucci and two anonymous referees.
Adler, G., Koop, T., Haspel, C., Taraniuk, I., Moise, T., Koren, I., Heiblum, R. H., and Rudich, Y.: Formation of Highly Porous Aerosol Particles by Atmospheric Freeze-Drying in Ice Clouds, P. Natl. Acad. Sci. USA, 110, 20414–20419, https://doi.org/10.1073/pnas.1317209110, 2013. a
Amoruso, S., Armenante, M., Berardi, V., Bruzzese, R., Velotta, R., and Wang, X.: High Fluence Visible and Ultraviolet Laser Ablation of Metallic Targets, Appl. Surf. Sci., 127–129, 1017–1022, https://doi.org/10.1016/S0169-4332(97)00786-1, 1998. a
Augustin, S., Wex, H., Niedermeier, D., Pummer, B., Grothe, H., Hartmann, S., Tomsche, L., Clauss, T., Voigtländer, J., Ignatius, K., and Stratmann, F.: Immersion freezing of birch pollen washing water, Atmos. Chem. Phys., 13, 10989–11003, https://doi.org/10.5194/acp-13-10989-2013, 2013. a
Augustin-Bauditz, S., Wex, H., Kanter, S., Ebert, M., Niedermeier, D., Stolz, F., Prager, A., and Stratmann, F.: The Immersion Mode Ice Nucleation Behavior of Mineral Dusts: A Comparison of Different Pure and Surface Modified Dusts, Geophys. Res. Lett., 41, 7375–7382, https://doi.org/10.1002/2014GL061317, 2014. a
Baustian, K. J., Cziczo, D. J., Wise, M. E., Pratt, K. A., Kulkarni, G., Hallar, A. G., and Tolbert, M. A.: Importance of Aerosol Composition, Mixing State, and Morphology for Heterogeneous Ice Nucleation: A Combined Field and Laboratory Approach, J. Geophys. Res.-Atmos., 117, D06217, https://doi.org/10.1029/2011JD016784, 2012. a
Behlke Power Electronics GmbH: Fast High Voltage Transistor Switches, Manual: HTS50, available at: https://www.behlke.com/pdf/80.pdf, last access: 11 December 2019. a
Boucher, O., Randall, D., Artaxo, P., Bretherton, C., Feingold, G., Forster, P., Kerminen, V.-M., Kondo, Y., Liao, H., and Lohmann, U.: Clouds and Aerosols, in: Climate Change 2013: The Physical Science Basis, Contribution of Working Group I to the Fifth Assessment Report of the Intergovernmental Panel on Climate Change, Cambridge University Press, Cambridge, UK and New York, NY, USA, 571–657, 2013. a, b, c
Boulter, J. E., Cziczo, D. J., Middlebrook, A. M., Thomson, D. S., and Murphy, D. M.: Design and Performance of a Pumped Counterflow Virtual Impactor, Aerosol Sci. Tech., 40, 969–976, https://doi.org/10.1080/02786820600840984, 2006. a, b
Brands, M.: Aufbau und Charakterisierung eines flugzeuggetragenen Einzelpartikel-Massenspektrometers, PhD Thesis, Johannes Gutenberg-Universität Mainz, Germany, 2009. a, b, c, d, e
Brands, M., Kamphus, M., Böttger, T., Schneider, J., Drewnick, F., Roth, A., Curtius, J., Voigt, C., Borbon, A., Beekmann, M., Bourdon, A., Perrin, T., and Borrmann, S.: Characterization of a Newly Developed Aircraft-Based Laser Ablation Aerosol Mass Spectrometer (ALABAMA) and First Field Deployment in Urban Pollution Plumes over Paris During MEGAPOLI 2009, Aerosol Sci. Tech., 45, 46–64, https://doi.org/10.1080/02786826.2010.517813, 2011. a, b, c, d, e, f, g, h, i, j, k, l, m, n, o, p, q, r, s, t, u, v, w, x, y, z, aa, ab
Bundke, U., Berg, M., Houben, N., Ibrahim, A., Fiebig, M., Tettich, F., Klaus, C., Franke, H., and Petzold, A.: The IAGOS-CORE Aerosol Package: Instrument Design, Operation and Performance for Continuous Measurement Aboard in-Service Aircraft, Tellus B, 67, 28339, https://doi.org/10.3402/tellusb.v67.28339, 2015. a
Cahill, J. F., Darlington, T. K., Wang, X., Mayer, J., Spencer, M. T., Holecek, J. C., Reed, B. E., and Prather, K. A.: Development of a High-Pressure Aerodynamic Lens for Focusing Large Particles (4–10 µm) into the Aerosol Time-of-Flight Mass Spectrometer, Aerosol Sci. Tech., 48, 948–956, https://doi.org/10.1080/02786826.2014.947400, 2014. a
Chen, D.-R. and Pui, D. Y.: Numerical and Experimental Studies of Particle Deposition in a Tube with a Conical Contraction – Laminar Flow Regime, J. Aerosol Sci., 26, 563–574, https://doi.org/10.1016/0021-8502(94)00127-K, 1995. a
Chen, S.-C., Tsai, C.-J., Wu, C.-H., Pui, D. Y. H., Onischuk, A. A., and Karasev, V. V.: Particle Loss in a Critical Orifice, J. Aerosol Sci., 38, 935–949, https://doi.org/10.1016/j.jaerosci.2007.06.010, 2007. a, b
Conzemius, R. and Capellen, J.: A Review of the Applications to Solids of the Laser Ion Source in Mass Spectrometry, Int. J. Mass Spectrom., 34, 197–271, https://doi.org/10.1016/0020-7381(80)85040-6, 1980. a
Corbin, J. C., Rehbein, P. J. G., Evans, G. J., and Abbatt, J. P. D.: Combustion Particles as Ice Nuclei in an Urban Environment: Evidence from Single-Particle Mass Spectrometry, Atmos. Environ., 51, 286–292, https://doi.org/10.1016/j.atmosenv.2012.01.007, 2012. a, b, c
Cornett, D. S., Peschke, M., LaiHing, K., Cheng, P. Y., Willey, K. F., and Duncan, M. A.: Reflectron Time-of-flight Mass Spectrometer for Laser Photodissociation, Rev. Sci. Instrum., 63, 2177–2186, https://doi.org/10.1063/1.1143135, 1992. a
Cziczo, D. J., DeMott, P. J., Brock, C., Hudson, P. K., Jesse, B., Kreidenweis, S. M., Prenni, A. J., Schreiner, J., Thomson, D. S., and Murphy, D. M.: A Method for Single Particle Mass Spectrometry of Ice Nuclei, Aerosol Sci. Tech., 37, 460–470, https://doi.org/10.1080/02786820300976, 2003. a, b, c
Cziczo, D. J., Thomson, D. S., Thompson, T. L., DeMott, P. J., and Murphy, D. M.: Particle Analysis by Laser Mass Spectrometry (PALMS) Studies of Ice Nuclei and Other Low Number Density Particles, Int. J. Mass Spectrom., 258, 21–29, https://doi.org/10.1016/j.ijms.2006.05.013, 2006. a
Cziczo, D. J., Ladino, L., Boose, Y., Kanji, Z. A., Kupiszewski, P., Lance, S., Mertes, S., and Wex, H.: Measurements of Ice Nucleating Particles and Ice Residuals, Meteor. Mon., 58, 8.1–8.13, https://doi.org/10.1175/AMSMONOGRAPHS-D-16-0008.1, 2017. a, b
DeCarlo, P. F., Slowik, J. G., Worsnop, D. R., Davidovits, P., and Jimenez, J. L.: Particle Morphology and Density Characterization by Combined Mobility and Aerodynamic Diameter Measurements. Part 1: Theory, Aerosol Sci. Tech., 38, 1185–1205, https://doi.org/10.1080/027868290903907, 2004. a
DeMott, P. J., Möhler, O., Stetzer, O., Vali, G., Levin, Z., Petters, M. D., Murakami, M., Leisner, T., Bundke, U., Klein, H., Kanji, Z. A., Cotton, R., Jones, H., Benz, S., Brinkmann, M., Rzesanke, D., Saathoff, H., Nicolet, M., Saito, A., Nillius, B., Bingemer, H., Abbatt, J., Ardon, K., Ganor, E., Georgakopoulos, D. G., and Saunders, C.: Resurgence in Ice Nuclei Measurement Research, B. Am. Meteorol. Soc., 92, 1623–1635, https://doi.org/10.1175/2011BAMS3119.1, 2011. a
Drewnick, F.: Entwicklung und Charakterisierung eines Laser-massenspektrometrischen Verfahrens: Ein Beitrag zur Aerosolanalytik, PhD Thesis, Universität Hohenheim, Germany, 2000. a, b
Frank, F.: Charakterisierung des Eiskeimzählers FINCH, PhD Thesis, Johann Wolfgang Goethe-Universität Frankfurt am Main, Germany, 2017. a
Gaie-Levrel, F., Perrier, S., Perraudin, E., Stoll, C., Grand, N., and Schwell, M.: Development and characterization of a single particle laser ablation mass spectrometer (SPLAM) for organic aerosol studies, Atmos. Meas. Tech., 5, 225–241, https://doi.org/10.5194/amt-5-225-2012, 2012. a
Garimella, S., Kristensen, T. B., Ignatius, K., Welti, A., Voigtländer, J., Kulkarni, G. R., Sagan, F., Kok, G. L., Dorsey, J., Nichman, L., Rothenberg, D. A., Rösch, M., Kirchgäßner, A. C. R., Ladkin, R., Wex, H., Wilson, T. W., Ladino, L. A., Abbatt, J. P. D., Stetzer, O., Lohmann, U., Stratmann, F., and Cziczo, D. J.: The SPectrometer for Ice Nuclei (SPIN): an instrument to investigate ice nucleation, Atmos. Meas. Tech., 9, 2781–2795, https://doi.org/10.5194/amt-9-2781-2016, 2016. a
Gemayel, R., Hellebust, S., Temime-Roussel, B., Hayeck, N., Van Elteren, J. T., Wortham, H., and Gligorovski, S.: The performance and the characterization of laser ablation aerosol particle time-of-flight mass spectrometry (LAAP-ToF-MS), Atmos. Meas. Tech., 9, 1947–1959, https://doi.org/10.5194/amt-9-1947-2016, 2016. a, b
Gettelman, A., Liu, X., Barahona, D., Lohmann, U., and Chen, C.: Climate Impacts of Ice Nucleation, J. Geophys. Res.-Atmos., 117, D20201, https://doi.org/10.1029/2012JD017950, 2012. a
Hallett, J. and Saunders, C. P. R.: Charge Separation Associated with Secondary Ice Crystal Production, J. Atmos. Sci., 36, 2230–2235, https://doi.org/10.1175/1520-0469(1979)036<2230:CSAWSI>2.0.CO;2, 1979. a
Haywood, J. and Boucher, O.: Estimates of the Direct and Indirect Radiative Forcing Due to Tropospheric Aerosols: A Review, Rev. Geophys., 38, 513–543, https://doi.org/10.1029/1999RG000078, 2000. a
He, Q., Bluvshtein, N., Segev, L., Meidan, D., Flores, J. M., Brown, S. S., Brune, W., and Rudich, Y.: Evolution of the Complex Refractive Index of Secondary Organic Aerosols during Atmospheric Aging, Environ. Sci. Technol., 52, 3456–3465, https://doi.org/10.1021/acs.est.7b05742, 2018. a
Heymsfield, A. and Willis, P.: Cloud Conditions Favoring Secondary Ice Particle Production in Tropical Maritime Convection, J. Atmos. Sci., 71, 4500–4526, https://doi.org/10.1175/JAS-D-14-0093.1, 2014. a
Hinds, W. C.: Aerosol Technology: Properties, Behavior, and Measurement of Airborne Particles, 2nd edn., Wiley, Hoboken, NJ, USA, 1999. a
Hinz, K.-P., Gelhausen, E., Schäfer, K.-C., Takats, Z., and Spengler, B.: Characterization of Surgical Aerosols by the Compact Single-Particle Mass Spectrometer LAMPAS 3, Anal. Bioanal. Chem., 401, 3165–3172, https://doi.org/10.1007/s00216-011-5465-6, 2011. a
Hiranuma, N., Möhler, O., Kulkarni, G., Schnaiter, M., Vogt, S., Vochezer, P., Järvinen, E., Wagner, R., Bell, D. M., Wilson, J., Zelenyuk, A., and Cziczo, D. J.: Development and characterization of an ice-selecting pumped counterflow virtual impactor (IS-PCVI) to study ice crystal residuals, Atmos. Meas. Tech., 9, 3817–3836, https://doi.org/10.5194/amt-9-3817-2016, 2016. a
Huffman, J. A., Jayne, J. T., Drewnick, F., Aiken, A. C., Onasch, T., Worsnop, D. R., and Jimenez, J. L.: Design, Modeling, Optimization, and Experimental Tests of a Particle Beam Width Probe for the Aerodyne Aerosol Mass Spectrometer, Aerosol Sci. Tech., 39, 1143–1163, https://doi.org/10.1080/02786820500423782, 2005. a, b, c, d, e, f, g, h
Hünig, A.: Development, characterization and first field deployments of a novel aerosol mass spectrometer combining laser ablation and flash vaporization techniques for aircraft application at high altitudes, PhD Thesis, Johannes Gutenberg-Universität Mainz, Germany, in preparation, 2020. a, b, c, d
Hwang, T.-H., Kim, S.-H., Kim, S. H., and Lee, D.: Reducing Particle Loss in a Critical Orifice and an Aerodynamic Lens for Focusing Aerosol Particles in a Wide Size Range of 30 Nm–10 µm, J. Mech. Sci. Technol., 29, 317–323, https://doi.org/10.1007/s12206-014-1238-4, 2015. a, b, c, d, e, f, g, h
IPCC: Anthropogenic and Natural Radiative Forc-Ing, in: Climate Change 2013: The Physical Science Basis. Contribution of Working Group I to the Fifth Assessment Report of the Intergovernmental Panel on Climate Change, edited by: Stocker, T. F., Qin, D., Plattner, G.-K., Tignor, M., Allen, S. K., Boschung, J., Nauels, A., Xia, Y., Bex, V., and Midgley, P. M., Camb. Univ. Press Camb., UK, NY, USA, 659–740, https://doi.org/10.1017/CBO9781107415324.018, 2014. a
Kamphus, M., Ettner-Mahl, M., Brands, M., Curtius, J., Drewnick, F., and Borrmann, S.: Comparison of Two Aerodynamic Lenses as an Inlet for a Single Particle Laser Ablation Mass Spectrometer, Aerosol Sci. Tech., 42, 970–980, https://doi.org/10.1080/02786820802372158, 2008. a, b
Kanji, Z. A., Ladino, L. A., Wex, H., Boose, Y., Burkert-Kohn, M., Cziczo, D. J., and Krämer, M.: Overview of Ice Nucleating Particles, Meteor. Mon., 58, 1.1–1.33, https://doi.org/10.1175/AMSMONOGRAPHS-D-16-0006.1, 2017. a, b
Klimach, T.: Chemische Zusammensetzung der Aerosole : Design und Datenauswertung eines Einzelpartikel-Laserablationsmassenspektrometers, PhD Thesis, Johannes Gutenberg-Universität Mainz, Germany, 2012. a, b, c, d, e, f, g
Köllner, F.: Aerosol particles in the summertime arctic lower troposphere: chemical composition, sources, and formation, PhD Thesis, Johannes Gutenberg-Universität Mainz, Germany, 2020. a, b, c, d, e, f, g, h, i, j, k, l, m
Köllner, F., Schneider, J., Willis, M. D., Klimach, T., Helleis, F., Bozem, H., Kunkel, D., Hoor, P., Burkart, J., Leaitch, W. R., Aliabadi, A. A., Abbatt, J. P. D., Herber, A. B., and Borrmann, S.: Particulate trimethylamine in the summertime Canadian high Arctic lower troposphere, Atmos. Chem. Phys., 17, 13747–13766, https://doi.org/10.5194/acp-17-13747-2017, 2017. a
Kulkarni, G., Pekour, M., Afchine, A., Murphy, D. M., and Cziczo, D. J.: Comparison of Experimental and Numerical Studies of the Performance Characteristics of a Pumped Counterflow Virtual Impactor, Aerosol Sci. Tech., 45, 382–392, https://doi.org/10.1080/02786826.2010.539291, 2011a. a
Kulkarni, P., Baron, P. A., and Willeke, K. (Eds.): Aerosol Measurement: Principles, Techniques, and Applications, John Wiley and Sons, Inc., Hoboken, NJ, USA, https://doi.org/10.1002/9781118001684, 2011b. a, b
Liu, P., Ziemann, P. J., Kittelson, D. B., and McMurry, P. H.: Generating Particle Beams of Controlled Dimensions and Divergence: I. Theory of Particle Motion in Aerodynamic Lenses and Nozzle Expansions, Aerosol Sci. Tech., 22, 293–313, https://doi.org/10.1080/02786829408959748, 1995a. a, b, c, d
Liu, P., Ziemann, P. J., Kittelson, D. B., and McMurry, P. H.: Generating Particle Beams of Controlled Dimensions and Divergence: II. Experimental Evaluation of Particle Motion in Aerodynamic Lenses and Nozzle Expansions, Aerosol Sci. Tech., 22, 314–324, https://doi.org/10.1080/02786829408959749, 1995b. a
Liu, P. S. K., Deng, R., Smith, K. A., Williams, L. R., Jayne, J. T., Canagaratna, M. R., Moore, K., Onasch, T. B., Worsnop, D. R., and Deshler, T.: Transmission Efficiency of an Aerodynamic Focusing Lens System: Comparison of Model Calculations and Laboratory Measurements for the Aerodyne Aerosol Mass Spectrometer, Aerosol Sci. Tech., 41, 721–733, https://doi.org/10.1080/02786820701422278, 2007. a, b, c
Mamyrin, B. A., Karataev, V. I., Shmikk, D. V., and Zagulin, V. A.: The Mass-Reflectron, a New Nonmagnetic Time-of-Flight Mass Spectrometer with High Resolution, Zh. Eksp. Teor. Fiz., 64, 82–89, 1973. a
Marsden, N., Flynn, M. J., Taylor, J. W., Allan, J. D., and Coe, H.: Evaluating the influence of laser wavelength and detection stage geometry on optical detection efficiency in a single-particle mass spectrometer, Atmos. Meas. Tech., 9, 6051–6068, https://doi.org/10.5194/amt-9-6051-2016, 2016. a, b, c, d
Mertes, S., Schröder, F., and Wiedensohler, A.: The Particle Detection Efficiency Curve of the TSI-3010 CPC as a Function of the Temperature Difference between Saturator and Condenser, Aerosol Sci. Tech., 23, 257–261, https://doi.org/10.1080/02786829508965310, 1995. a
Miller, J. C.: History, Scope, and the Future of Laser Ablation, in: Laser Ablation: Principles and Applications, edited by: Miller, J. C., Springer Series in Materials Science, Springer Berlin Heidelberg, 1–10, https://doi.org/10.1007/978-3-642-78720-1_1, 1994. a, b
Molleker, S., Helleis, F., Klimach, T., Appel, O., Clemen, H.-C., Dragoneas, A., Gurk, C., Hünig, A., Köllner, F., Rubach, F., Schulz, C., Schneider, J., and Borrmann, S.: Application of an O-ring pinch device as a constant-pressure inlet (CPI) for airborne sampling, Atmos. Meas. Tech., 13, 3651–3660, https://doi.org/10.5194/amt-13-3651-2020, 2020. a, b, c, d, e, f, g
ORIEL INSTRUMENTS: Motor Mike 18012 Series Manual, 1991. a
Peck, J., Gonzalez, L. A., Williams, L. R., Xu, W., Croteau, P. L., Timko, M. T., Jayne, J. T., Worsnop, D. R., Miake-Lye, R. C., and Smith, K. A.: Development of an Aerosol Mass Spectrometer Lens System for PM2.5, Aerosol Sci. Tech., 50, 781–789, https://doi.org/10.1080/02786826.2016.1190444, 2016. a
Prospero, J. M., Landing, W. M., and Schulz, M.: African Dust Deposition to Florida: Temporal and Spatial Variability and Comparisons to Models, J. Geophys. Res.-Atmos., 115, D13304, https://doi.org/10.1029/2009JD012773, 2010. a
Quantel Laser: Ultra (50–100 mJ) – Quantel: ICE450 Power Supply Manual(2008), available at: https://www.quantel-laser.com/en/products/item/ultra-50-100-mj--134.html, last access: 9 December 2019. a
Querry, M.: Optical Constants of Minerals and Other Materials from the Millimeter to the Ultraviolet, Tech. Rep. CRDEC-CR-88009, Chemical Research, Development and Engineering Center Aberdeen Proving Ground, 1987. a
Roth, A.: Untersuchungen von Aerosolpartikeln und Wolkenresidualpartikeln mittels Einzelpartikel-Massenspektrometrie und optischen Methoden, PhD Thesis, Johannes Gutenberg-Universität Mainz, Germany, 2014. a, b
Saunders, C.: Charge Separation Mechanisms in Clouds, Space Sci. Rev., 137, 335–353, https://doi.org/10.1007/s11214-008-9345-0, 2008. a, b
Schenk, L. P., Mertes, S., Kästner, U., Frank, F., Nillius, B., Bundke, U., Rose, D., Schmidt, S., Schneider, J., Worringen, A., Kandler, K., Bukowiecki, N., Ebert, M., Curtius, J., and Stratmann, F.: Characterization and first results of an ice nucleating particle measurement system based on counterflow virtual impactor technique, Atmos. Meas. Tech. Discuss., 7, 10585–10617, https://doi.org/10.5194/amtd-7-10585-2014, 2014. a, b, c, d
Schneider, J., Weigel, R., Klimach, T., Dragoneas, A., Appel, O., Hünig, A., Molleker, S., Köllner, F., Clemen, H.-C., Eppers, O., Hoppe, P., Hoor, P., Mahnke, C., Krämer, M., Rolf, C., Grooß, J.-U., Zahn, A., Obersteiner, F., Ravegnani, F., Ulanovsky, A., Schlager, H., Scheibe, M., Diskin, G. S., DiGangi, J. P., Nowak, J. B., Zöger, M., and Borrmann, S.: Aircraft-based observation of meteoric material in lower stratospheric aerosol particles between 15 and 68∘ N, Atmos. Chem. Phys. Discuss., https://doi.org/10.5194/acp-2020-660, in review, 2020. a, b, c, d
Shen, X., Ramisetty, R., Mohr, C., Huang, W., Leisner, T., and Saathoff, H.: Laser ablation aerosol particle time-of-flight mass spectrometer (LAAPTOF): performance, reference spectra and classification of atmospheric samples, Atmos. Meas. Tech., 11, 2325–2343, https://doi.org/10.5194/amt-11-2325-2018, 2018. a, b
Stocker, T. F., Qin, D., Plattner, G.-K., Tignor, M., Allen, S. K., Boschung, J., Nauels, A., Xia, Y., Bex, V., and Midgley, P. M.: Technical Summary, in: Climate Change 2013: The Physical Science Basis. Contribution of Working Group I to the Fifth Assessment Report of the Intergovernmental Panel on Climate Change, Cambridge University Press, Cambridge, UK and New York, NY, USA, 2013. a, b
Su, Y., Sipin, M. F., Furutani, H., and Prather, K. A.: Development and Characterization of an Aerosol Time-of-Flight Mass Spectrometer with Increased Detection Efficiency, Anal. Chem., 76, 712–719, https://doi.org/10.1021/ac034797z, 2004. a, b, c
Thomson, D. S., Middlebrook, A. M., and Murphy, D. M.: Thresholds for Laser-Induced Ion Formation from Aerosols in a Vacuum Using Ultraviolet and Vacuum-Ultraviolet Laser Wavelengths, Aerosol Sci. Tech., 26, 544–559, https://doi.org/10.1080/02786829708965452, 1997. a, b, c
TSI: Electrostatic Classifier 3080L: Manual Revision J (March 2009), P/N 1933792, available at: https://tsi.com//Discontinued-Products/Electrostatic-Classifier-3080L (last access: 21 November 2019), 2009. a
Van Breemen, R. B., Snow, M., and Cotter, R. J.: Time-Resolved Laser Desorption Mass Spectrometry. I. Desorption of Preformed Ions, Int. J. Mass Spectrom., 49, 35–50, https://doi.org/10.1016/0020-7381(83)85074-8, 1983. a, b
Varel, H., Wähmer, M., Rosenfeld, A., Ashkenasi, D., and Campbell, E. E. B.: Femtosecond Laser Ablation of Sapphire: Time-of-Flight Analysis of Ablation Plume, Appl. Surf. Sci., 127–129, 128–133, https://doi.org/10.1016/S0169-4332(97)00622-3, 1998. a
Vera, C. C., Trimborn, A., Hinz, K.-P., and Spengler, B.: Initial Velocity Distributions of Ions Generated by In-Flight Laser Desorption/Ionization of Individual Polystyrene Latex Microparticles as Studied by the Delayed Ion Extraction Method, Rapid Commun. Mass Sp., 19, 133–146, https://doi.org/10.1002/rcm.1753, 2005. a, b
Vertes, A., Juhasz, P., Jani, P., and Czitrovszky, A.: Kinetic Energy Distribution of Ions Generated by Laser Ionization Sources, Int. J. Mass Spectrom., 83, 45–70, https://doi.org/10.1016/0168-1176(88)80087-9, 1988. a
Voigt, C., Schumann, U., Minikin, A., Abdelmonem, A., Afchine, A., Borrmann, S., Boettcher, M., Buchholz, B., Bugliaro, L., Costa, A., Curtius, J., Dollner, M., Dörnbrack, A., Dreiling, V., Ebert, V., Ehrlich, A., Fix, A., Forster, L., Frank, F., Fütterer, D., Giez, A., Graf, K., Grooß, J.-U., Groß, S., Heimerl, K., Heinold, B., Hüneke, T., Järvinen, E., Jurkat, T., Kaufmann, S., Kenntner, M., Klingebiel, M., Klimach, T., Kohl, R., Krämer, M., Krisna, T. C., Luebke, A., Mayer, B., Mertes, S., Molleker, S., Petzold, A., Pfeilsticker, K., Port, M., Rapp, M., Reutter, P., Rolf, C., Rose, D., Sauer, D., Schäfler, A., Schlage, R., Schnaiter, M., Schneider, J., Spelten, N., Spichtinger, P., Stock, P., Walser, A., Weigel, R., Weinzierl, B., Wendisch, M., Werner, F., Wernli, H., Wirth, M., Zahn, A., Ziereis, H., and Zöger, M.: ML-CIRRUS: The Airborne Experiment on Natural Cirrus and Contrail Cirrus with the High-Altitude Long-Range Research Aircraft HALO, B. Am. Meteorol. Soc., 98, 271–288, https://doi.org/10.1175/BAMS-D-15-00213.1, 2017. a
von Blohn, N., Mitra, S. K., Diehl, K., and Borrmann, S.: The Ice Nucleating Ability of Pollen, Atmos. Res., 78, 182–189, https://doi.org/10.1016/j.atmosres.2005.03.008, 2005. a
Wang, X. and McMurry, P. H.: A Design Tool for Aerodynamic Lens Systems, Aerosol Sci. Tech., 40, 320–334, https://doi.org/10.1080/02786820600615063, 2006. a
WaveMetrics: IGOR Pro Version 6.37, WaveMetrics, Inc. (Lake Oswego, OR, USA), available at: http://www.wavemetrics.com/ (last access: 27 April 2020), 2015. a, b
Wendisch, M., Macke, A., Ehrlich, A., Lüpkes, C., Mech, M., Chechin, D., Dethloff, K., Velasco, C. B., Bozem, H., Brückner, M., Clemen, H.-C., Crewell, S., Donth, T., Dupuy, R., Ebell, K., Egerer, U., Engelmann, R., Engler, C., Eppers, O., Gehrmann, M., Gong, X., Gottschalk, M., Gourbeyre, C., Griesche, H., Hartmann, J., Hartmann, M., Heinold, B., Herber, A., Herrmann, H., Heygster, G., Hoor, P., Jafariserajehlou, S., Jäkel, E., Järvinen, E., Jourdan, O., Kästner, U., Kecorius, S., Knudsen, E. M., Köllner, F., Kretzschmar, J., Lelli, L., Leroy, D., Maturilli, M., Mei, L., Mertes, S., Mioche, G., Neuber, R., Nicolaus, M., Nomokonova, T., Notholt, J., Palm, M., van Pinxteren, M., Quaas, J., Richter, P., Ruiz-Donoso, E., Schäfer, M., Schmieder, K., Schnaiter, M., Schneider, J., Schwarzenböck, A., Seifert, P., Shupe, M. D., Siebert, H., Spreen, G., Stapf, J., Stratmann, F., Vogl, T., Welti, A., Wex, H., Wiedensohler, A., Zanatta, M., and Zeppenfeld, S.: The Arctic Cloud Puzzle: Using ACLOUD/PASCAL Multiplatform Observations to Unravel the Role of Clouds and Aerosol Particles in Arctic Amplification, B. Am. Meteorol. Soc., 100, 841–871, https://doi.org/10.1175/BAMS-D-18-0072.1, 2019. a
Wiedensohler, A.: An Approximation of the Bipolar Charge Distribution for Particles in the Submicron Size Range, J. Aerosol Sci., 19, 387–389, https://doi.org/10.1016/0021-8502(88)90278-9, 1988. a
Wiedensohler, A., Lütkemeier, E., Feldpausch, M., and Helsper, C.: Investigation of the Bipolar Charge Distribution at Various Gas Conditions, J. Aerosol Sci., 17, 413–416, https://doi.org/10.1016/0021-8502(86)90118-7, 1986. a
Wiley, W. C. and McLaren, I. H.: Time-of-Flight Mass Spectrometer with Improved Resolution, Rev. Sci. Instrum., 26, 1150–1157, https://doi.org/10.1063/1.1715212, 1955. a
Williams, L. R., Gonzalez, L. A., Peck, J., Trimborn, D., McInnis, J., Farrar, M. R., Moore, K. D., Jayne, J. T., Robinson, W. A., Lewis, D. K., Onasch, T. B., Canagaratna, M. R., Trimborn, A., Timko, M. T., Magoon, G., Deng, R., Tang, D., de la Rosa Blanco, E., Prévôt, A. S. H., Smith, K. A., and Worsnop, D. R.: Characterization of an aerodynamic lens for transmitting particles greater than 1 micrometer in diameter into the Aerodyne aerosol mass spectrometer, Atmos. Meas. Tech., 6, 3271–3280, https://doi.org/10.5194/amt-6-3271-2013, 2013. a
Xu, W., Croteau, P., Williams, L., Canagaratna, M., Onasch, T., Cross, E., Zhang, X., Robinson, W., Worsnop, D., and Jayne, J.: Laboratory Characterization of an Aerosol Chemical Speciation Monitor with PM2.5 Measurement Capability, Aerosol Sci. Tech., 51, 69–83, https://doi.org/10.1080/02786826.2016.1241859, 2017. a
Zawadowicz, M. A., Lance, S., Jayne, J. T., Croteau, P., Worsnop, D. R., Mahrt, F., Leisner, T., and Cziczo, D. J.: Quantifying and Improving the Optical Performance of the Laser Ablation Aerosol Particle Time of Flight Mass Spectrometer (LAAPToF) Instrument, Aerosol Sci. Tech., 54, 761–771, https://doi.org/10.1080/02786826.2020.1724867, 2020. a
Zelenyuk, A. and Imre, D.: Single Particle Laser Ablation Time-of-Flight Mass Spectrometer: An Introduction to SPLAT, Aerosol Sci. Tech., 39, 554–568, https://doi.org/10.1080/027868291009242, 2005. a
Zelenyuk, A., Cai, Y., and Imre, D.: From Agglomerates of Spheres to Irregularly Shaped Particles: Determination of Dynamic Shape Factors from Measurements of Mobility and Vacuum Aerodynamic Diameters, Aerosol Sci. Tech., 40, 197–217, https://doi.org/10.1080/02786820500529406, 2006. a
Zelenyuk, A., Imre, D., Wilson, J., Zhang, Z., Wang, J., and Mueller, K.: Airborne Single Particle Mass Spectrometers (SPLAT II & miniSPLAT) and New Software for Data Visualization and Analysis in a Geo-Spatial Context, J. Am. Soc. Mass Spectr., 26, 257–270, https://doi.org/10.1007/s13361-014-1043-4, 2015. a
Zhang, X., Smith, K. A., Worsnop, D. R., Jimenez, J., Jayne, J. T., and Kolb, C. E.: A Numerical Characterization of Particle Beam Collimation by an Aerodynamic Lens-Nozzle System: Part I. An Individual Lens or Nozzle, Aerosol Sci. Tech., 36, 617–631, https://doi.org/10.1080/02786820252883856, 2002. a, b, c, d, e, f, g, h, i, j, k, l
- Abstract
- Introduction
- General description of the ALABAMA single-particle aerosol mass spectrometer
- Modifications within the ALABAMA setup
- Experimental characterization of the modified components
- Application example: ice-nucleating particles
- Summary and conclusions
- Data availability
- Author contributions
- Competing interests
- Acknowledgements
- Financial support
- Review statement
- References
- Supplement