the Creative Commons Attribution 4.0 License.
the Creative Commons Attribution 4.0 License.
 | 11 Mar 2021
Intercomparison of arctic XH2O observations from three ground-based Fourier transform infrared networks and application for satellite validation
Frank Hase
Thomas Blumenstock
Matthias Schneider
Andreas Schneider
Rigel Kivi
Pauli Heikkinen
Benjamin Ertl
Christopher Diekmann
Farahnaz Khosrawi
Michael Sommer
Tobias Borsdorff
Uwe Raffalski
In this paper, we compare column-averaged dry-air mole fractions of water vapor (XH2O) retrievals from the COllaborative Carbon Column Observing Network (COCCON) with retrievals from two co-located high-resolution Fourier transform infrared (FTIR) spectrometers as references at two boreal sites, Kiruna, Sweden, and Sodankylä, Finland, from 6 March 2017 to 20 September 2019. In the framework of the Network for the Detection of Atmospheric Composition Change (NDACC), an FTIR spectrometer is operated at Kiruna. The H2O product derived from these observations has been generated with the MUlti-platform remote Sensing of Isotopologues for investigating the Cycle of Atmospheric water (MUSICA) processor. In Sodankylä, a Total Carbon Column Observing Network (TCCON) spectrometer is operated, and the official XH2O data as provided by TCCON are used for this study. The datasets are in good overall agreement, with COCCON data showing a wet bias of (49.20±58.61) ppm ((3.33±3.37) %, R2=0.9992) compared with MUSICA NDACC and (56.32±45.63) ppm ((3.44±1.77) %, R2=0.9997) compared with TCCON.
Furthermore, the a priori H2O volume mixing ratio (VMR) profiles (MAP) used as a priori information in the TCCON retrievals (also adopted for COCCON retrievals) are evaluated with respect to radiosonde (Vaisala RS41) profiles at Sodankylä. The MAP and radiosonde profiles show similar shapes and a good linear correlation of integrated XH2O, indicating that MAP is a reasonable approximation of the true atmospheric state and an appropriate choice for the scaling retrieval methods as applied by COCCON and TCCON. COCCON shows a reduced dry bias (−14.96 %) in comparison with TCCON (−19.08 %) with respect to radiosonde XH2O.
Finally, we investigate the quality of satellite data at high latitudes. For this purpose, the COCCON XH2O is compared with retrievals from the Infrared Atmospheric Sounding Interferometer (IASI) generated with the MUSICA processor (MUSICA IASI) and with retrievals from the TROPOspheric Monitoring Instrument (TROPOMI). Both paired datasets generally show good agreement and similar correlations at the two sites. COCCON measures 4.64 % less XH2O at Kiruna and 3.36 % less at Sodankylä with respect to MUSICA IASI, whereas COCCON measures 9.71 % more XH2O at Kiruna and 7.75 % more at Sodankylä compared with TROPOMI.
Our study supports the assumption that COCCON also delivers a well-characterized XH2O data product. This emphasizes that this approach might complement the TCCON network with respect to satellite validation efforts. This is the first published study where COCCON XH2O has been compared with MUSICA NDACC and TCCON retrievals and has been used for MUSICA IASI and TROPOMI validation.
- Article
(5905 KB) - Full-text XML
- BibTeX
- EndNote


Water vapor (H2O) is among the most abundant gases in the atmosphere, and nearly 99 % of water vapor exists in the troposphere. It has a residence time of about 9 d in the atmosphere (Trenberth, 1998), and it absorbs approximately 57 % of longwave radiation and 72 % of shortwave radiation under clear-sky conditions (Kiehl and Trenberth, 1997). Due to its high absorption, atmospheric water vapor also acts as an important greenhouse gas (GHG). It plays a key role in the Earth's energy budget and the large-scale circulation and, thus, in the climate of our planet (Allan, 2012). Because the equilibrium water vapor pressure increases rapidly with temperature, the increasing atmospheric concentration of water vapor further amplifies warming due to its added radiative absorption (Soden et al., 2002). Therefore, assessing and quantifying atmospheric water vapor is essential to constrain weather and climate models.
The distribution of water vapor in the atmosphere is characterized by very high spatial and temporal variability relevant to weather and climate (Vogelmann et al., 2015). Satellite-borne instruments have the advantage of global coverage, but they lack vertical or long-term information (Dupuy et al., 2016). Additionally, satellite water vapor data contain inherent uncertainties and must be validated before use (Loew et al., 2017). Conversely, independent ground-based remote sensing instruments and in situ sensors do not give access to the global scale, but they can provide very accurate and long-term data that can be used for satellite validation. Many studies have investigated water vapor comparisons among satellite and ground-based instruments (Schneider and Hase, 2011; Dupuy et al., 2016; Borger et al., 2018; Trieu et al., 2019), but there are only few studies that focus on the Arctic region (Pałm et al., 2010; Buehler et al., 2012; Alraddawi et al., 2018).
In this work, we present a comparison of column-averaged dry-air mole fractions of water vapor (XH2O) retrievals from three ground-based networks and two space-borne satellites as well as vertical profiles from in situ radiosondes near the Arctic region. This paper is organized as follows: Sect. 2 gives a description of the campaign sites and lists the details of the instruments. The datasets used in this study and coincidence criteria will be presented in Sect. 3. Results are discussed in Sects. 4 and 5, followed by conclusions in Sect. 6.
2.1 TCCON network
The Total Carbon Column Observing Network (TCCON) is a worldwide network of ground-based Fourier transform infrared (FTIR) spectrometers that measure solar absorption spectra in the near-infrared region. The TCCON network is designed to provide accurate and long-term time series of column-averaged dry-air mole fractions of greenhouse gases and other atmospheric constituents for carbon cycle studies and satellite validation (Wunch et al., 2011). The TCCON measurements have very high precision due to the minimal effect from surface properties and aerosols (Wunch et al., 2017). The TCCON sites are distributed globally but have a higher density in Europe, northern America, and eastern Asia. Its costs and high demand for qualified personnel and infrastructure hinder its expansion. Remote sites or regions with high or low surface albedo, which are also interesting for satellite and model validation are generally poorly covered by the TCCON stations.
TCCON data are retrieved by the nonlinear least squares fitting algorithm (GFIT). The GFIT algorithm scales a priori water vapor profiles from the National Centers for Environmental Prediction reanalysis data (https://www.ncdc.noaa.gov/data-access/model-data/model-datasets/reanalysis-1-reanalysis-2, last access: 14 February 2021) to obtain a best-fit synthetic spectrum for the measured spectrum (Wunch et al., 2011). Some retrieval information for TCCON and other products used in this study are listed in Table A1.
2.2 COCCON network and FRM4GHG campaign
Recently, a cheaper, robust, and portable ground-based FTIR spectrometer (EM27/SUN) has been developed by the Karlsruhe Institute of Technology (KIT) in cooperation with the company Bruker (Gisi et al., 2012; Frey et al., 2015; Hase et al., 2015, 2016). The EM27/SUN instruments have been characterized as good quality, robust, and reliable in several successful field campaigns (Frey et al., 2015; Klappenbach et al., 2015; Chen et al., 2016; Butz et al., 2017; Vogel et al., 2019; Sha et al., 2019; Tu et al., 2020; Jacobs et al., 2020), and their excellent level of performance provides the opportunity to support the TCCON network. The spectrometers have been commercially available since spring 2014, and today about 60 spectrometers are in operation around the world. KIT initiated the COllaborative Carbon Column Observing Network (COCCON; https://www.imk-asf.kit.edu/english/COCCON.php, last access: 14 February 2021) as a framework for proper operation of the EM27/SUN spectrometer (Frey et al., 2019) and to ensure common standards for data analysis. Each COCCON spectrometer (including the spectrometers operated in Kiruna and Sodankylä, as used in this study) is checked and calibrated at the calibration facility operated in Karlsruhe (using a TCCON spectrometer and the primary EM27/SUN spectrometer unit) before shipment to the observation site. For the purpose of COCCON data processing, a preprocessing tool and the PROFFAST nonlinear least squares fitting algorithm have been created with the support of the European Space Agency (ESA; COCCON-PROCEEDS and COCCON-PROCEEDS II projects). The EM27/SUN spectrometer offers a low spectral resolution of 0.5 cm−1 and consequently has little vertical resolution capability. Therefore, a simple least squares fit performing a scaling retrieval of the a priori profile is generally appropriate and sufficient.
In this work, two COCCON instruments were operated at the Swedish Institute of Space Physics (IRF), Kiruna, Sweden (67.84∘ N, 20.41∘ E; 419 m a.s.l.), and at the Finnish Meteorological Institute (FMI), Sodankylä, Finland (67.37∘ N, 26.63∘ E; 181 m a.s.l.), from March 2017. The COCCON measurements in Finland are made in the framework of the FRM4GHG (Fiducial Reference Measurements for Ground-Based Infrared Greenhouse Gas Observations; http://frm4ghg.aeronomie.be/, last access: 19 February 2021) campaign, funded by ESA. This campaign aims at characterizing the performance of several low-cost and portable instruments for performing GHG measurements simultaneously in comparison with the TCCON retrievals at FMI, Finland (Sha et al., 2019). The dataset from this campaign will also serve for TROPOspheric Monitoring Instrument (TROPOMI) validation, and the campaign provides a guideline for establishing portable low-resolution FTIR spectrometers for complementing the TCCON network.
2.3 MUSICA NDACC products
The quality assessment study is also complemented by the MUSICA (MUlti-platform remote Sensing of Isotopologues for investigating the Cycle of Atmospheric water) dataset, including ground-based remote sensing, space-based remote sensing, and in situ measurements (Schneider et al., 2012, 2016). In this study, we focus on the first dataset.
Currently, there are 12 NDACC (Network for the Detection of Atmospheric Composition Change, https://www-air.larc.nasa.gov/pub/NDACC/PUBLIC/MUSICA/ last access: 14 February 2021, Kurylo and Zander, 2000; De Mazière et al., 2018) stations for which MUSICA NDACC datasets have been created (Barthlott et al., 2017). The MUSICA NDACC retrievals are made by fitting nine different spectral microwindows with water vapor signatures in the spectral region between 2655 and 3055 cm−1 using the PROFFIT retrieval code (PROFile FIT; Hase et al., 2004). The retrieval consists of an optimal estimation of the vertical distribution of H2O as well as the ratios of different water vapor isotopologues. For all of the retrievals, a constant unique a priori profile is used, which is a global mean water vapor state, i.e., there is no variability in the a priori information. This has the advantage that all detected variability is induced by the observation, but it is at the cost that the a priori profile can be rather off from the actual atmospheric state, which is a minor issue given the vertical sensitivity as revealed by the profile averaging kernels (Barthlott et al., 2017). Here, we use MUSICA NDACC from the NDACC database and perform a simple bias correction. This correction consists of adding A×c to the original data, where A is the averaging kernel on a logarithmic scale, and c is a profile vector with the entry −0.12 for all altitudes. This means that we consider a bias of +12 % in the original MUSICA H2O data.
The PROFFIT code has been successfully used for many years in the ground-based FTIR community for evaluating high-resolution solar absorption spectra (Hase et al., 2004; Schneider and Hase, 2011). NDACC enables the monitoring of the distribution of a large variety of atmospheric trace gases in the mid-infrared region with Bruker HR120/5 FTIR spectrometers, including water vapor at a very high precision (Schneider et al., 2006; Schneider and Hase, 2009; Schneider et al., 2010a). The Kiruna NDACC observations are representative of high latitudes, and the MUSICA NDACC Kiruna data are available for the whole period from 1996 to present (Blumenstock et al., 2006).
2.4 MUSICA IASI products
The Infrared Atmospheric Sounding Interferometer (IASI) is the primary payload carried on the EUMETSAT's MetOp series of polar-orbiting satellites (Clerbaux, 2009), which provides a near-global distribution of observations with high resolution and accuracy twice a day. There are currently three IASI instruments in operation, which were launched in 2006, 2012, and 2018, respectively. The primary intent of IASI is to provide information on atmospheric temperature and water vapor, although several additional trace gases are accessible in the spectra.
The MUSICA NDACC retrievals are based on the PROFFIT retrieval code, whereas the MUSICA IASI retrievals are based on a nadir version of PROFFIT (Schneider and Hase, 2009). The retrieval uses a single broad spectral window between 1190 and 1400 cm−1 and consists of a simultaneous optimal estimation of the vertical distribution of H2O, the ratio of different water vapor isotopologues, N2O, CH4, and HNO3. Atmospheric temperature is also fitted but constrained strongly to the EUMETSAT IASI Level 2 temperature product. For more details on the MUSICA IASI retrievals and the validation of the MUSICA IASI H2O product, please refer to Schneider et al. (2016) and Borger et al. (2018). The version presented here is an update as described by Borger et al. (2018) using a priori profiles for the gases under consideration, which depend on season and latitude. This dependency is determined from WACCM (Whole Atmosphere Community Climate Model) simulations (a more detailed description of the new MUSICA IASI retrieval version is currently in preparation for ESSD (Earth System Science Data).
2.5 TROPOspheric Monitoring Instrument
The TROPOspheric Monitoring Instrument (TROPOMI) is the single payload onboard the Sentinel-5 Precursor (S5P) satellite and was launched in October 2017 (Veefkind et al., 2012). It is a nadir-viewing grating spectrometer, covering the ultraviolet to shortwave infrared (SWIR) band. The SWIR module on TROPOMI has a spectral range of 4190–4340 cm−1, a spectral resolution of 0.45 cm−1, and an unprecedented spatial resolution of 7 km×7 km (5.5 km×7 km after August 2019). A study from Schneider et al. (2020) shows a good agreement between the corrected TCCON H2O column and co-located TROPOMI H2O column, with a mean bias of () ×1021 molec. cm−2 ((1.1±7.2) %).
2.6 In situ radiosonde
Atmospheric profiles are regularly measured by meteorological radiosondes. Between January and March 2017, Vaisala RS92 radiosondes (Dirksen et al., 2014) were launched at Sodankylä. The radiosonde system was upgraded in March 2017, and Vaisala RS41 radiosondes have been launched at 23:30 and 11:30 UTC daily since late March 2017. During special observing periods, additional radiosondes have been launched at 05:30 and 17:30 UTC. The regular radiosondes at Sodankylä have been launched using an automated launching system by Vaisala Oyj since early 2006 (Madonna et al., 2020). The Vaisala RS41 radiosonde contributes to improvements in accuracy and data consistency, and its specifications for combined measurement uncertainties are 0.3 ∘C for temperature below 16 km and 0.4 ∘C above, 4 % RH for relative humidity, 1.0 hPa for pressure larger than 100 hPa, and 10 m for geopotential height (https://www.vaisala.com/sites/default/files/documents/RS-Comparison-White-Paper-B211317EN.pdf, last access: 14 February 2021).
3.1 Ground-based datasets
In the present study, all datasets were obtained during the period from 2017 to 2019. We used the MUSICA NDACC XH2O data from Kiruna (Barthlott et al., 2017) and the latest version of GGG2014 TCCON XH2O data from Sodankylä (Kivi and Heikkinen, 2016; Kivi et al., 2017) as references.
The COCCON and TCCON XH2O are computed as the ratio of the co-retrieved total column of O2 to an assumed dry-air mole fraction of O2 equal to 0.2095 (Wunch et al., 2015):
The total column of O2 is not available from the NDACC network. Therefore, the XH2O is calculated by dividing the total column of H2O by the total column of dry air, and the latter is computed from the surface pressure (Ps) recorded at a local weather station:
where Ps is the surface pressure at Kiruna ground level; mdryair and are the molecular masses of dry air (∼28.96 g mol−1) and water vapor (∼18 g mol−1), respectively; TCdryair and are the total column amount of dry air and water vapor, respectively; and g(φ) is the latitude-dependent surface acceleration due to gravity.
The hourly means of the co-located COCCON measurements from Kiruna and Sodankylä are coincident with the hourly means of the NDACC and TCCON measurements, respectively. Due to the high measurement frequency, the TCCON and COCCON measurements offer opportunities to estimate the water vapor intraday variability. To reduce the residual uncertainties introduced by air mass dependence, empirical corrections are applied by TCCON (Wunch et al., 2015) and COCCON. The solar zenith angle (SZA) range has been limited to 80∘. This also reduces the collocation error with the satellite borne thermal nadir sounder IASI, whose typical nadir angle range is 0–48.3∘.
3.2 Space-borne datasets
For space-borne data, a similar geophysical collocation criterion is used in this study to that used in Schneider et al. (2020). The MUSICA IASI and TROPOMI data are collected within a radius of 30 km of the COCCON sites in Kiruna and Sodankylä with an acceptance cone of 45∘ width in the FTIR viewing direction and all ground-based measurements acquired within 30 min of each satellite overpass (before or after). To reduce the altitude effect, the satellite data are filtered for ground pixels with altitudes between 350 and 500 m a.s.l. for Kiruna and between 100 and 250 m a.s.l. for Sodankylä (Kiruna and Sodankylä stations are located at 420 and 189 m a.s.l., respectively). For the TROPOMI data, we also applied additional filters to reduce the effects of clouds and high aerosol loads. The cloud cover is limited to 1 % for both the inner and outer fields of view (Schneider et al., 2020). The soundings with high aerosol loads are filtered out with a two-band methane filter when the difference between the retrieved methane in weak and strong absorption is larger than 6 % (Scheepmaker et al., 2016; Hu et al., 2018).
It is noted that the seasonal variation in atmospheric water vapor is large; therefore, we report the bias as well as the relative bias (in percent) for one pair of XH2O datasets. The relative bias is calculated as follows:
3.3 Volume mixing ratio of H2O derived from radiosonde measurements
The relative humidity (RH) measured by the in situ radiosondes is equivalent to the partial pressure of H2O divided by the saturation vapor pressure of H2O:
where is the partial pressure of H2O, and es(T) is the saturation vapor pressure, which only depends on temperature. Here we use the empirical equation from Hyland and Wexler (1983) to present es:
where T denotes the temperature in Kelvin.
The volume mixing ratio (VMR) of H2O () is defined as the ratio of partial pressure of H2O () relative to the total pressure (P):
Combing Eqs. (5)–(7) allows the VMR of H2O to be computed from radiosonde measurements of relative humidity, temperature, and pressure:
where RH denotes the relative humidity, es denotes the saturation vapor pressure, and P denotes the total pressure.
We determine the precision by an intercomparison between COCCON and ground-based FTIR datasets. The XH2O observed by the COCCON instruments at two sites is first compared with co-located ground-based MUSICA NDACC retrievals for Kiruna and with TCCON retrievals for Sodankylä, respectively. Furthermore, in situ radiosonde profiles at Sodankylä are used to investigate the a priori profile shape as well as to evaluate TCCON and COCCON XH2O data.
4.1 Seasonal variations in XH2O
Time series of different datasets from 2017 (TROPOMI starting from 2018) to 2019 are depicted in Fig. 1 for Kiruna and Sodankylä. COCCON measurements observe seasonal variations in XH2O similar to the NDACC and TCCON measurements at each site. Here, we also use IASI and TROPOMI in the comparison, and these datasets will be further discussed in Sect. 5. Multiple gaps exist in the ground-based FTIR datasets due to poor weather and high SZA conditions, whereas the FTIR measurements are performed under clear-sky conditions or during breaks in cloud cover. The number of MUSICA NDACC data is lower than the number of COCCON measurements due to the longer measuring time for NDACC compared with that of COCCON spectra and due to the use of optical filters by NDACC, which are recorded in sequence. The MUSICA NDACC data analyses use measurements recorded with one of six optical filters used in the NDACC measurements.
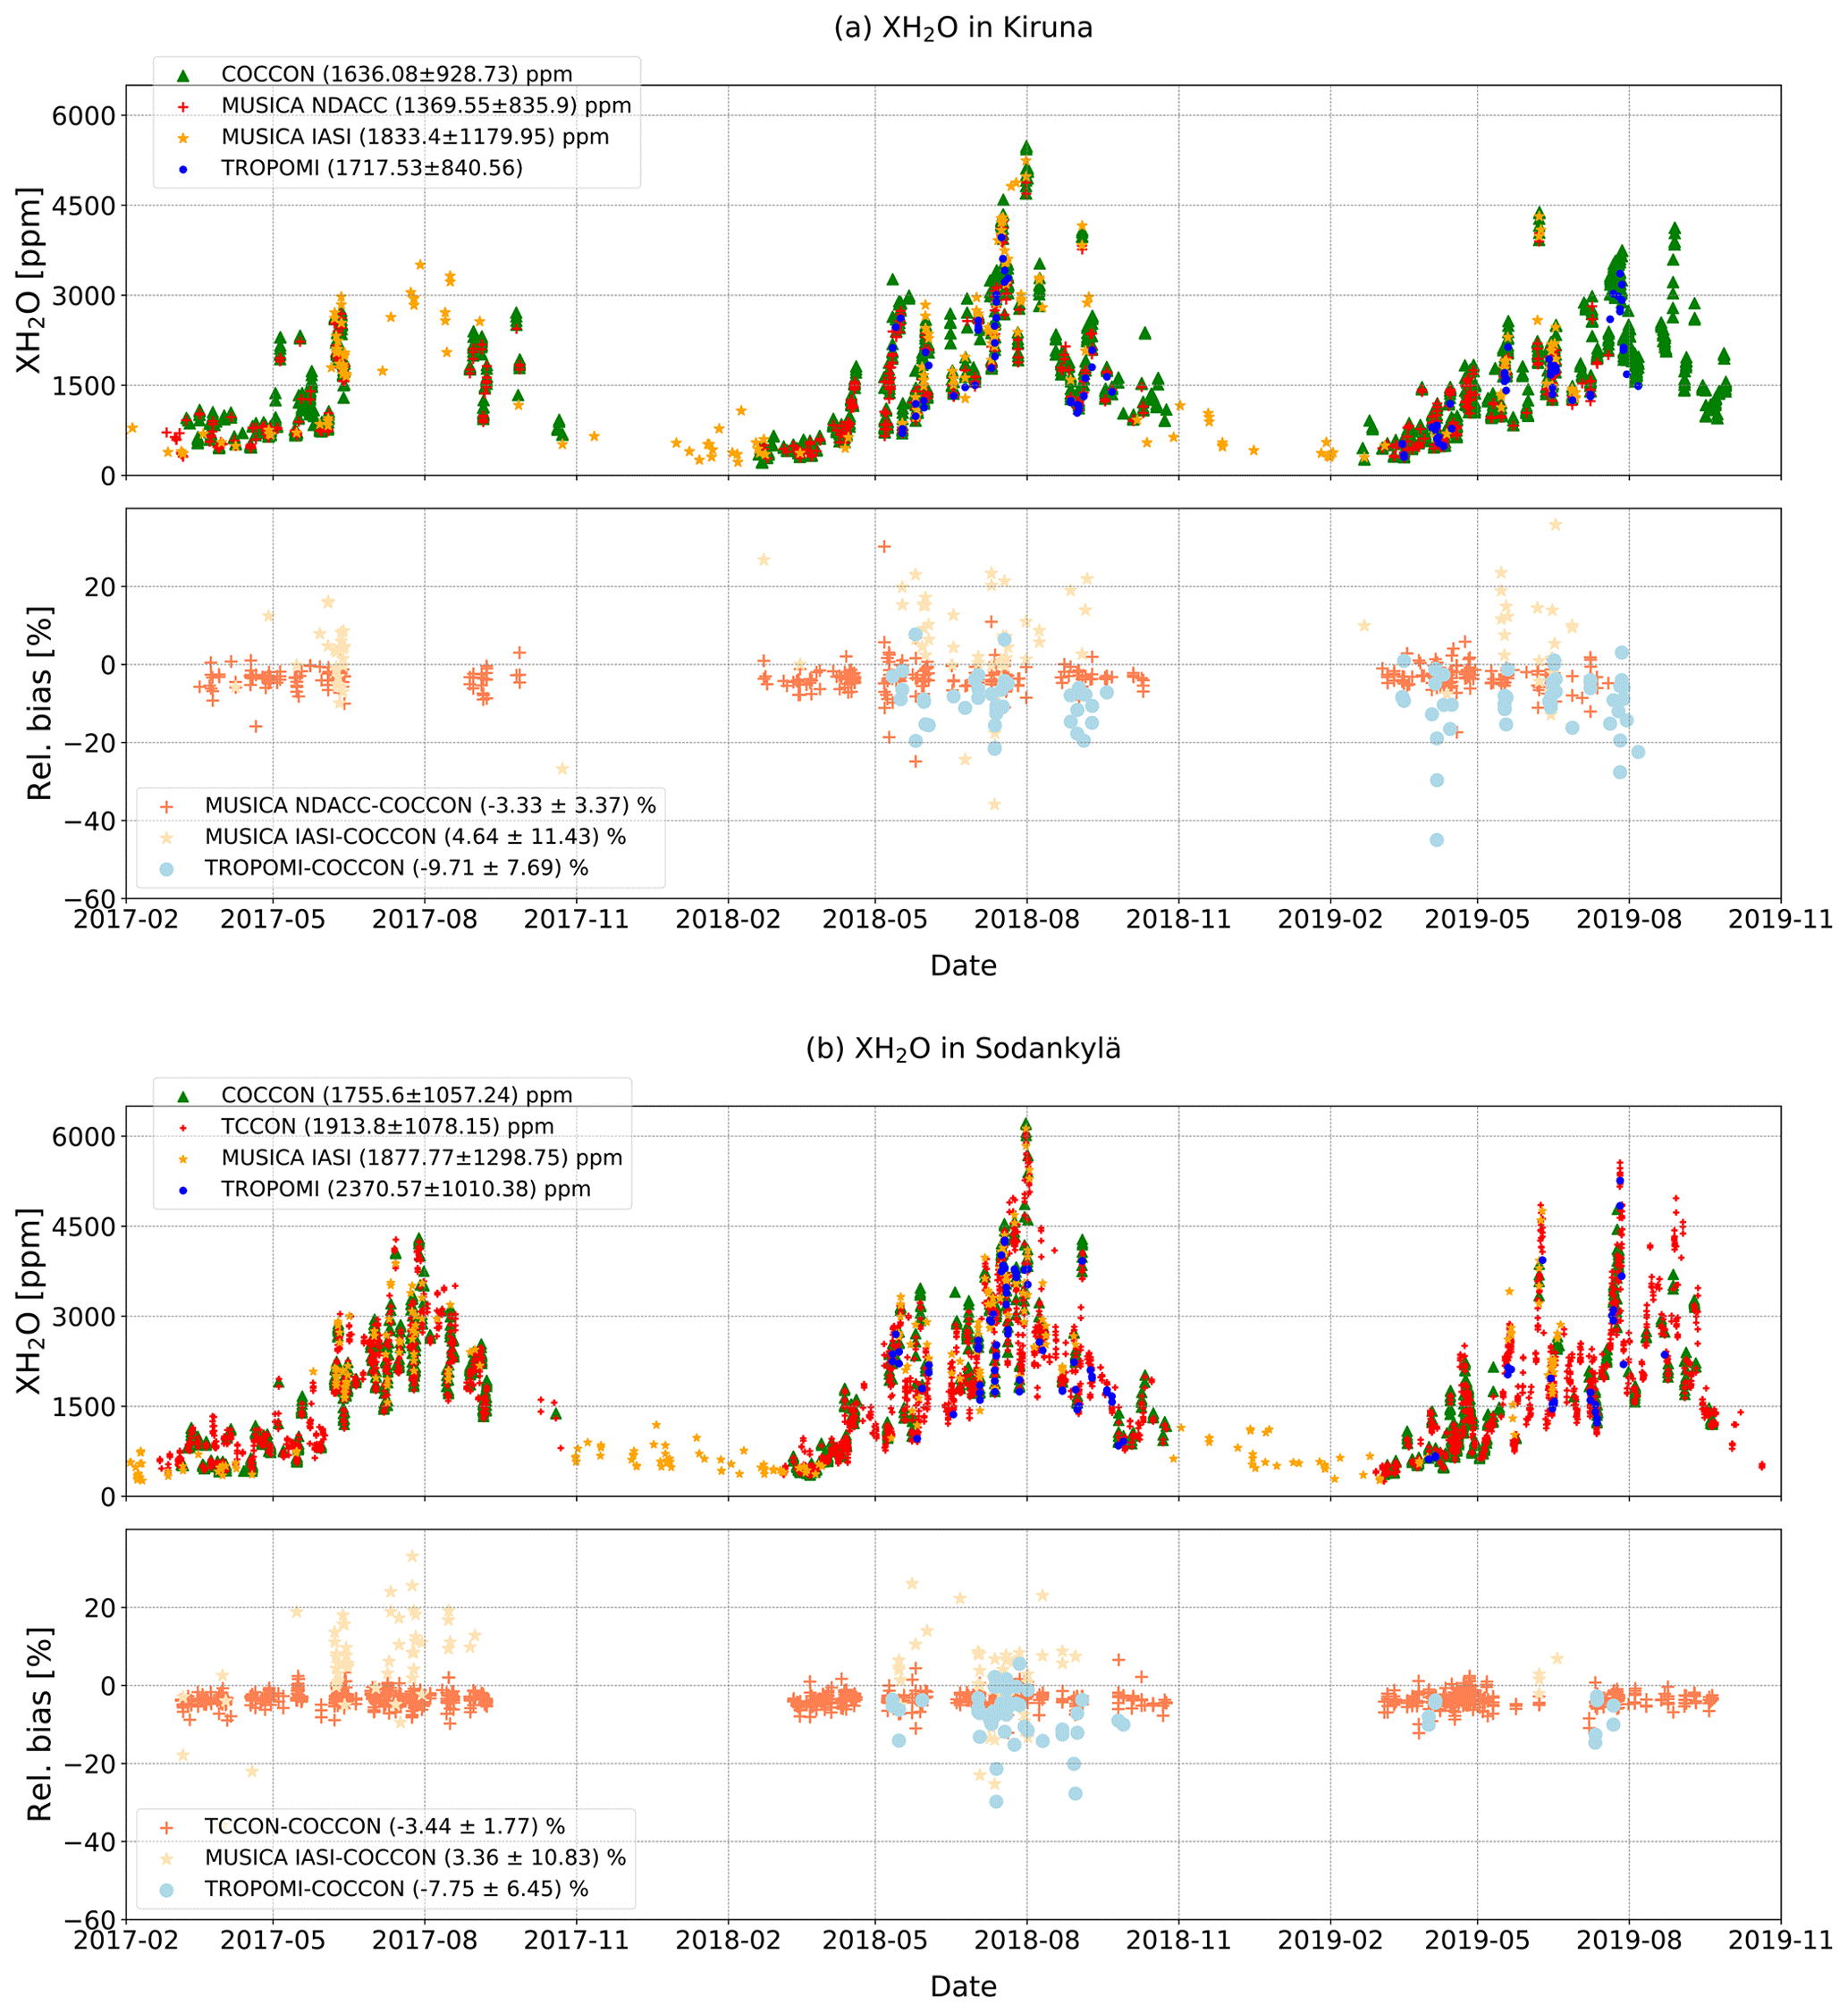
Figure 1Time series of XH2O derived from MUSICA IASI, TROPOMI, and ground-based FTIR instruments at (a) Kiruna and (b) Sodankylä. The corresponding relative biases are presented in the bottom panel for coincident pairs in each subfigure.
In general, there are higher amounts of atmospheric XH2O in summer then in spring and winter. For Kiruna, the amounts of XH2O reach up to ∼4000 ppm in each August in 2017 and 2019 and even up to ∼5500 ppm in August in 2018, whereas only ∼600 ppm XH2O is reported in each early spring and winter. Specific humidity shows a strong positive correlation with temperature (Issac and Wijngaarden, 2012). Meanwhile, the higher precipitation in summer intensifies the higher atmospheric water vapor concentration. The evaporation from the snow-covered continent and frozen water surface is still much less, limiting the transport of water vapor into the atmosphere. This effect lasts until spring due to the slow warming of the surface (Wypych et al., 2018). The XH2O concentration is slightly higher at Sodankylä than at Kiruna, especially in summer. This is because the Sodankylä site (181 m a.s.l) has a lower altitude than the Kiruna site (419 m a.s.l), and the XH2O concentration is associated with enhanced contributions from humid atmospheric layers near the ground.
4.2 Comparison between COCCON and co-located ground-based FTIR instruments
Figure 2 gives the correlation of XH2O measured by the COCCON instrument against coincident MUSICA NDACC retrievals for the Kiruna site (Fig. 2a) and against coincident TCCON retrievals for the Sodankylä site (Fig. 2b). In general, the two datasets at each site show quite good agreement and overall consistency, with R2 values of 0.9992 for Kiruna and 0.9997 for Sodankylä. The second and seventh columns in Table 1 list the statistics for the coincident data between the COCCON and MUSICA NDACC XH2O at the Kiruna site and between the COCCON and TCCON XH2O at the Sodankylä site, respectively. Figure 3 shows the differences between the COCCON and the MUSICA NDACC retrievals at the Kiruna site and the differences between COCCON and TCCON retrievals at the Sodankylä site as a function of XH2O amounts. There is no detectable dependence at either site.
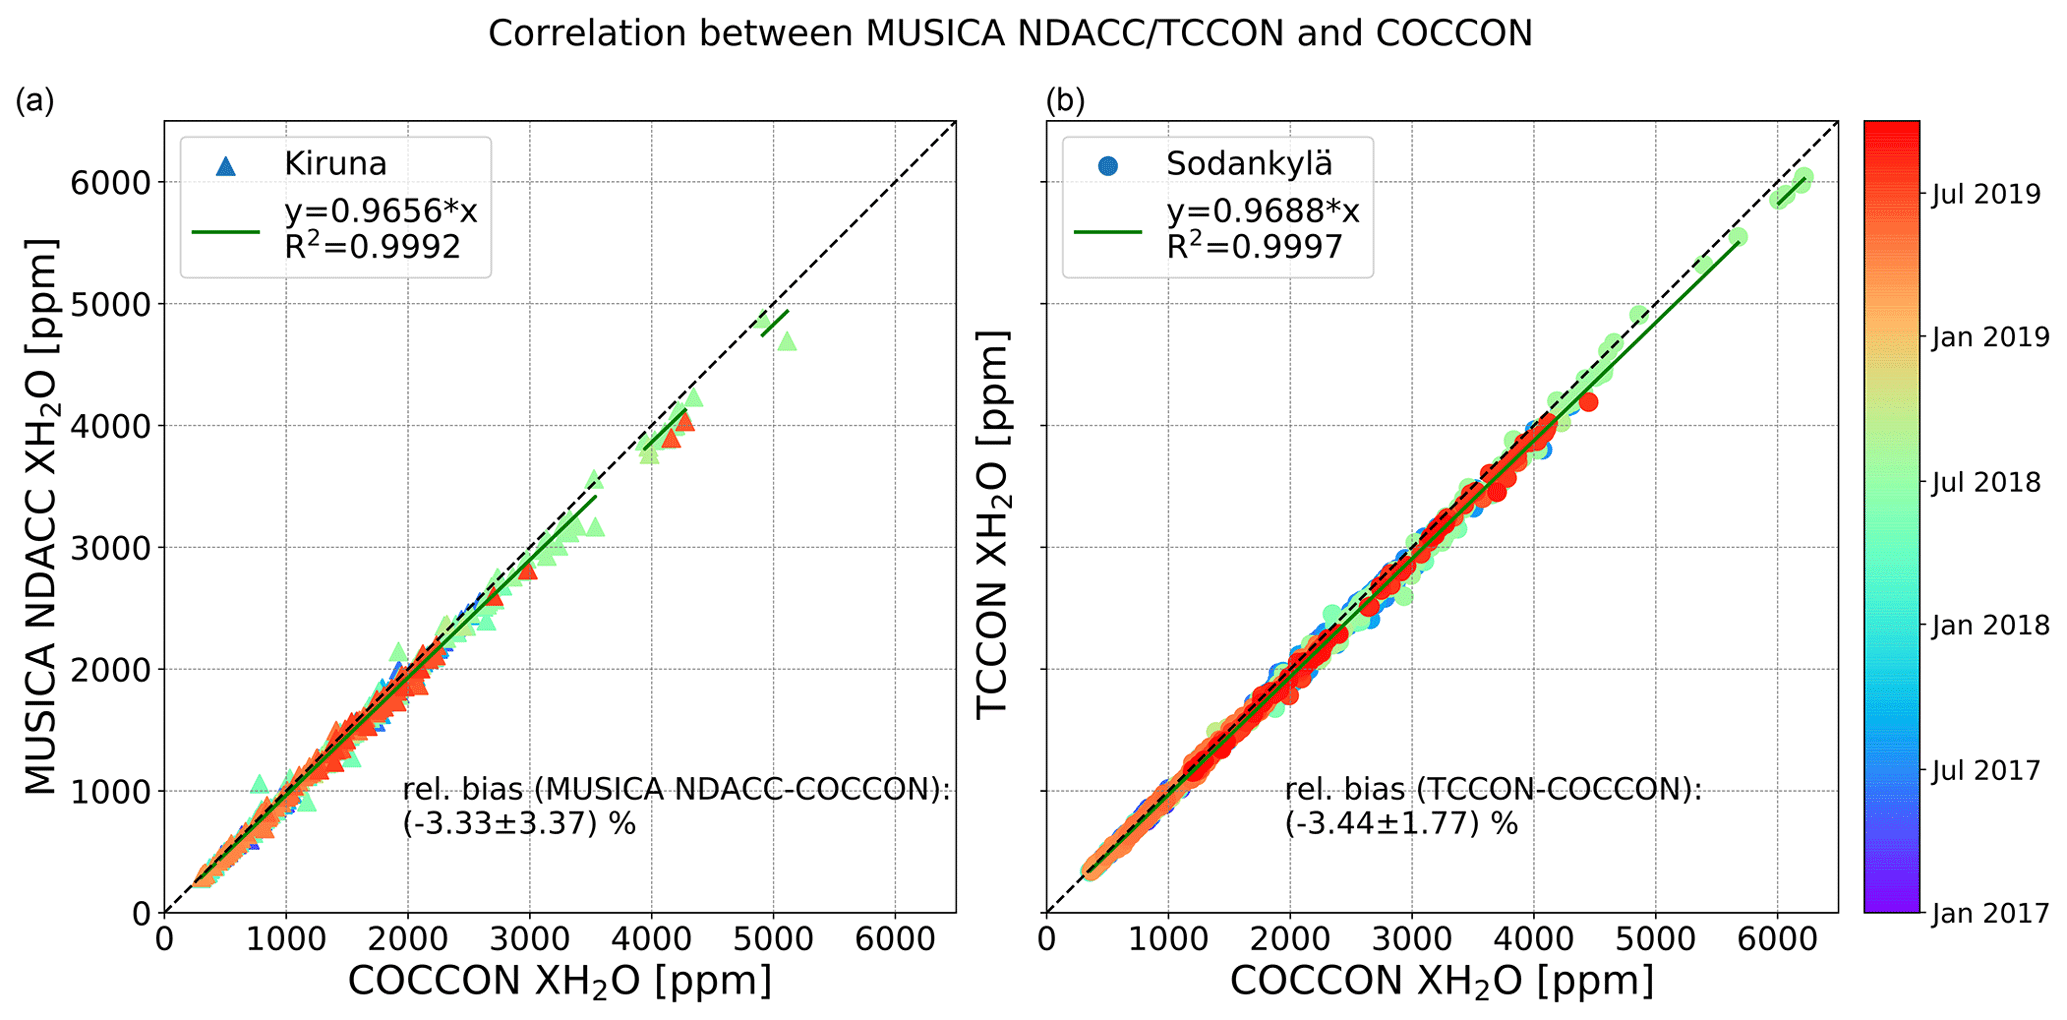
Figure 2(a) The correlation of COCCON XH2O and coincident MUSICA NDACC retrievals for Kiruna, and (b) the correlation of COCCON and coincident TCCON retrievals for Sodankylä. The solid green and dashed lines denote the linear fit and one-to-one lines, respectively. The color code (from purple to red) represents the order of the measurement time from January 2017 to October 2019.
Table 1Statistical comparison between COCCON XH2O and other instruments at each site. The total number of coincident data (No.) is listed. The biases and relative biases are presented in terms of the mean value and standard deviation.
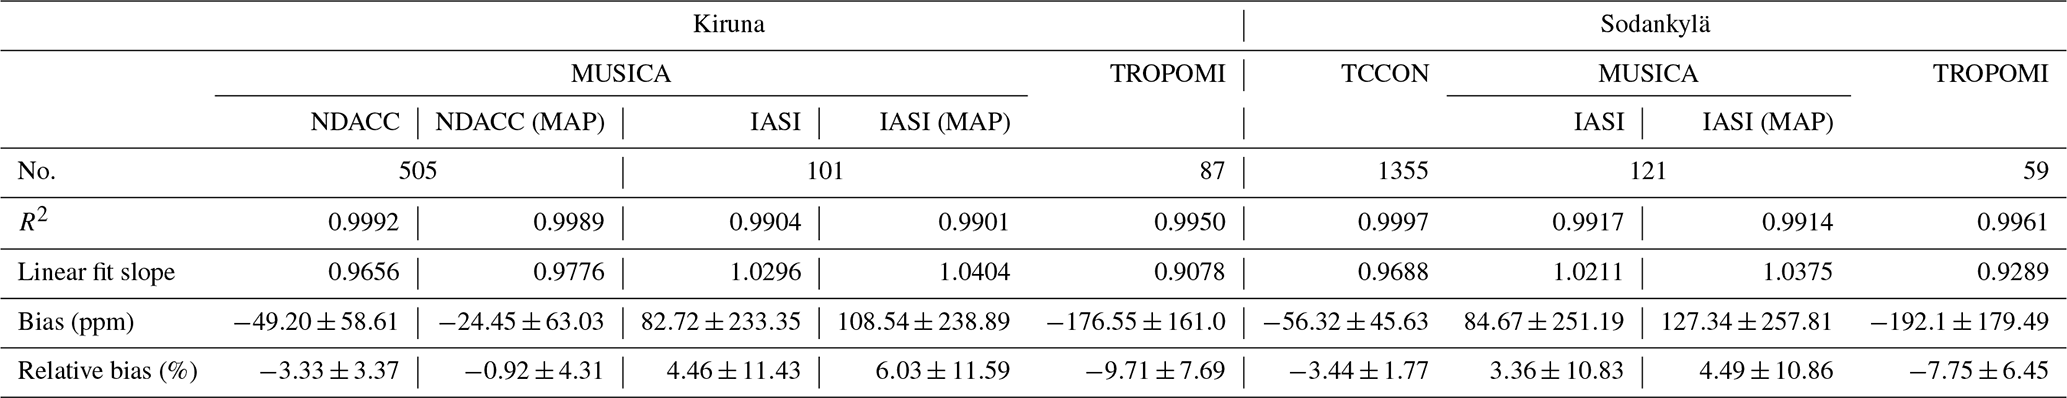
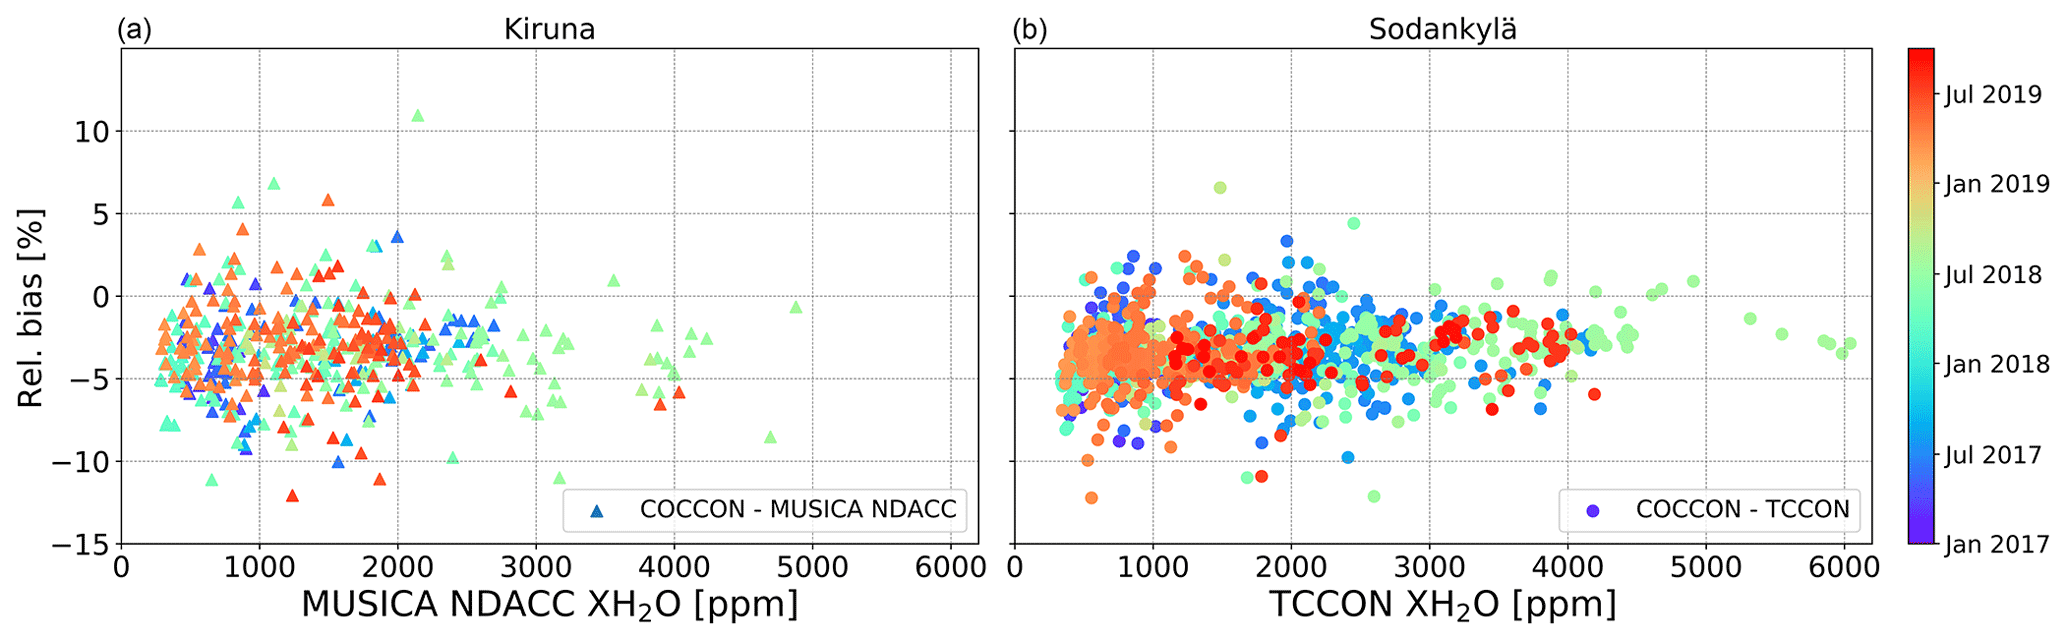
Figure 3(a) The XH2O difference (COCCON − MUSICA NDACC) for Kiruna versus XH2O amounts, and (b) the XH2O difference (COCCON − TCCON) for Sodankylä versus XH2O amounts. The color code (from purple to red) represents the order of the measurement time from January 2017 to October 2019.
Figure 4 shows the XH2O relative bias of MUSICA NDACC and TCCON compared with COCCON with respect to the SZA over the whole period studied at the two stations. The absolute values of the relative bias between COCCON and MUSICA NDACC at Kiruna (Fig. 4a) show no obvious sensitivity to the SZA. However, the absolute value of the relative bias between COCCON and TCCON at Sodankylä (Fig. 4b) becomes slightly larger with increasing SZA. This is because the TCCON and COCCON instruments have different spectral resolutions, which results in different absorption strengths and column averaging kernels (AVKs) (Hedelius et al., 2016). Furthermore, the AVK also shows different sensitivity to the SZA of the measurement (Wunch et al., 2011). The AVK describes the sensitivity of the H2O retrieval to a perturbation in the H2O column at a given altitude. An AVK close to unity indicates maximum retrieval accuracy, and an AVK larger or smaller than one indicates overestimation and underestimation of the true H2O column amount, respectively.
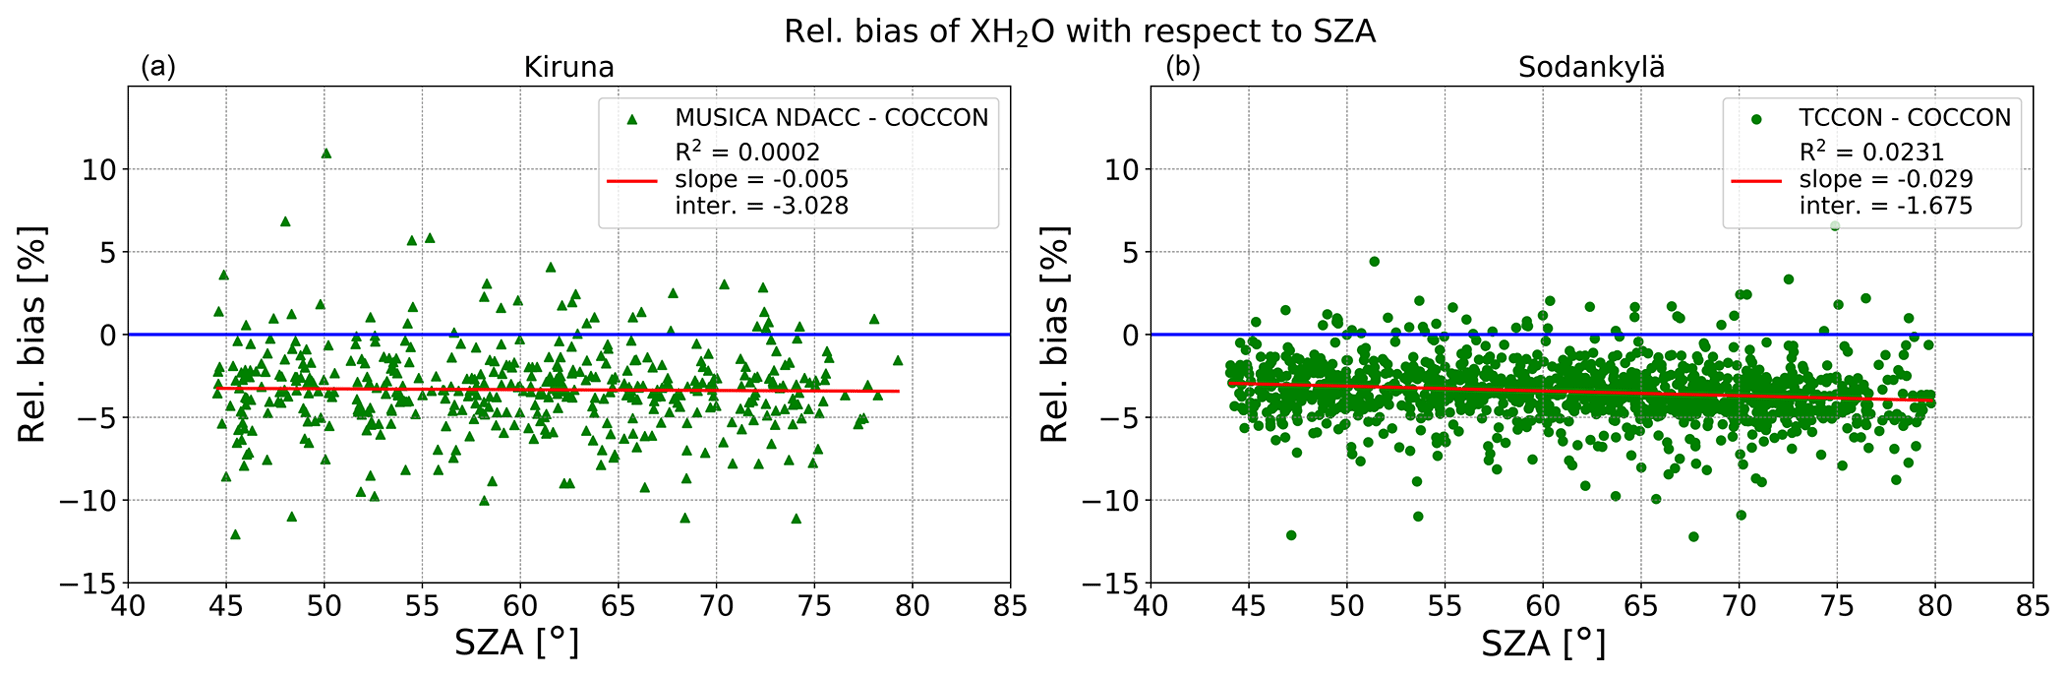
Figure 4Dependence of the XH2O difference (MUSICA NDACC − COCCON) at the Kiruna site (a) and the difference (TCCON − COCCON) at the Sodankylä site (b) on the SZA. The solid red line represents the fitting line.
Figure 5 depicts examples of AVKs for H2O under different SZAs on 2 July 2018. It reveals a sensitivity of very close to 100 % for the lowermost altitudes, where most water vapor resides. The AVKs for MUSICA NDACC H2O retrievals show no obvious sensitivity to the SZA and altitude, and are very close to unity below 5 km. However, TCCON and COCCON AVKs vary with SZA and altitude. The TCCON AVKs are smaller than one and increase with increasing SZA below 1.5 km, and they are larger than one and decrease with increasing SZA upwards. This change indicates that the TCCON H2O total column underestimates a deviation near the surface and overestimates a deviation at higher levels from the a priori profiles. The COCCON AVKs show an inverse behavior, with overestimations and an increasing value with larger SZAs below 2 km and underestimations and a decreasing value with larger SZAs upwards. The overall column sensitivities of TCCON increase with increasing altitude, whereas the column sensitivities of COCCON decrease with increasing altitude. TROPOMI AVKs show a decreasing trend as the altitude increases, which is similar to the COCCON AVKs. However, no obvious SZA dependence is observed in TROPOMI AKVs. Here, an example of row AVKs at SZA =45∘ and degrees of freedom (DOFS) =5.09 is presented for IASI (Fig. 5e), and the DOFS show a positive correlation with the SZA (Fig. 5f).
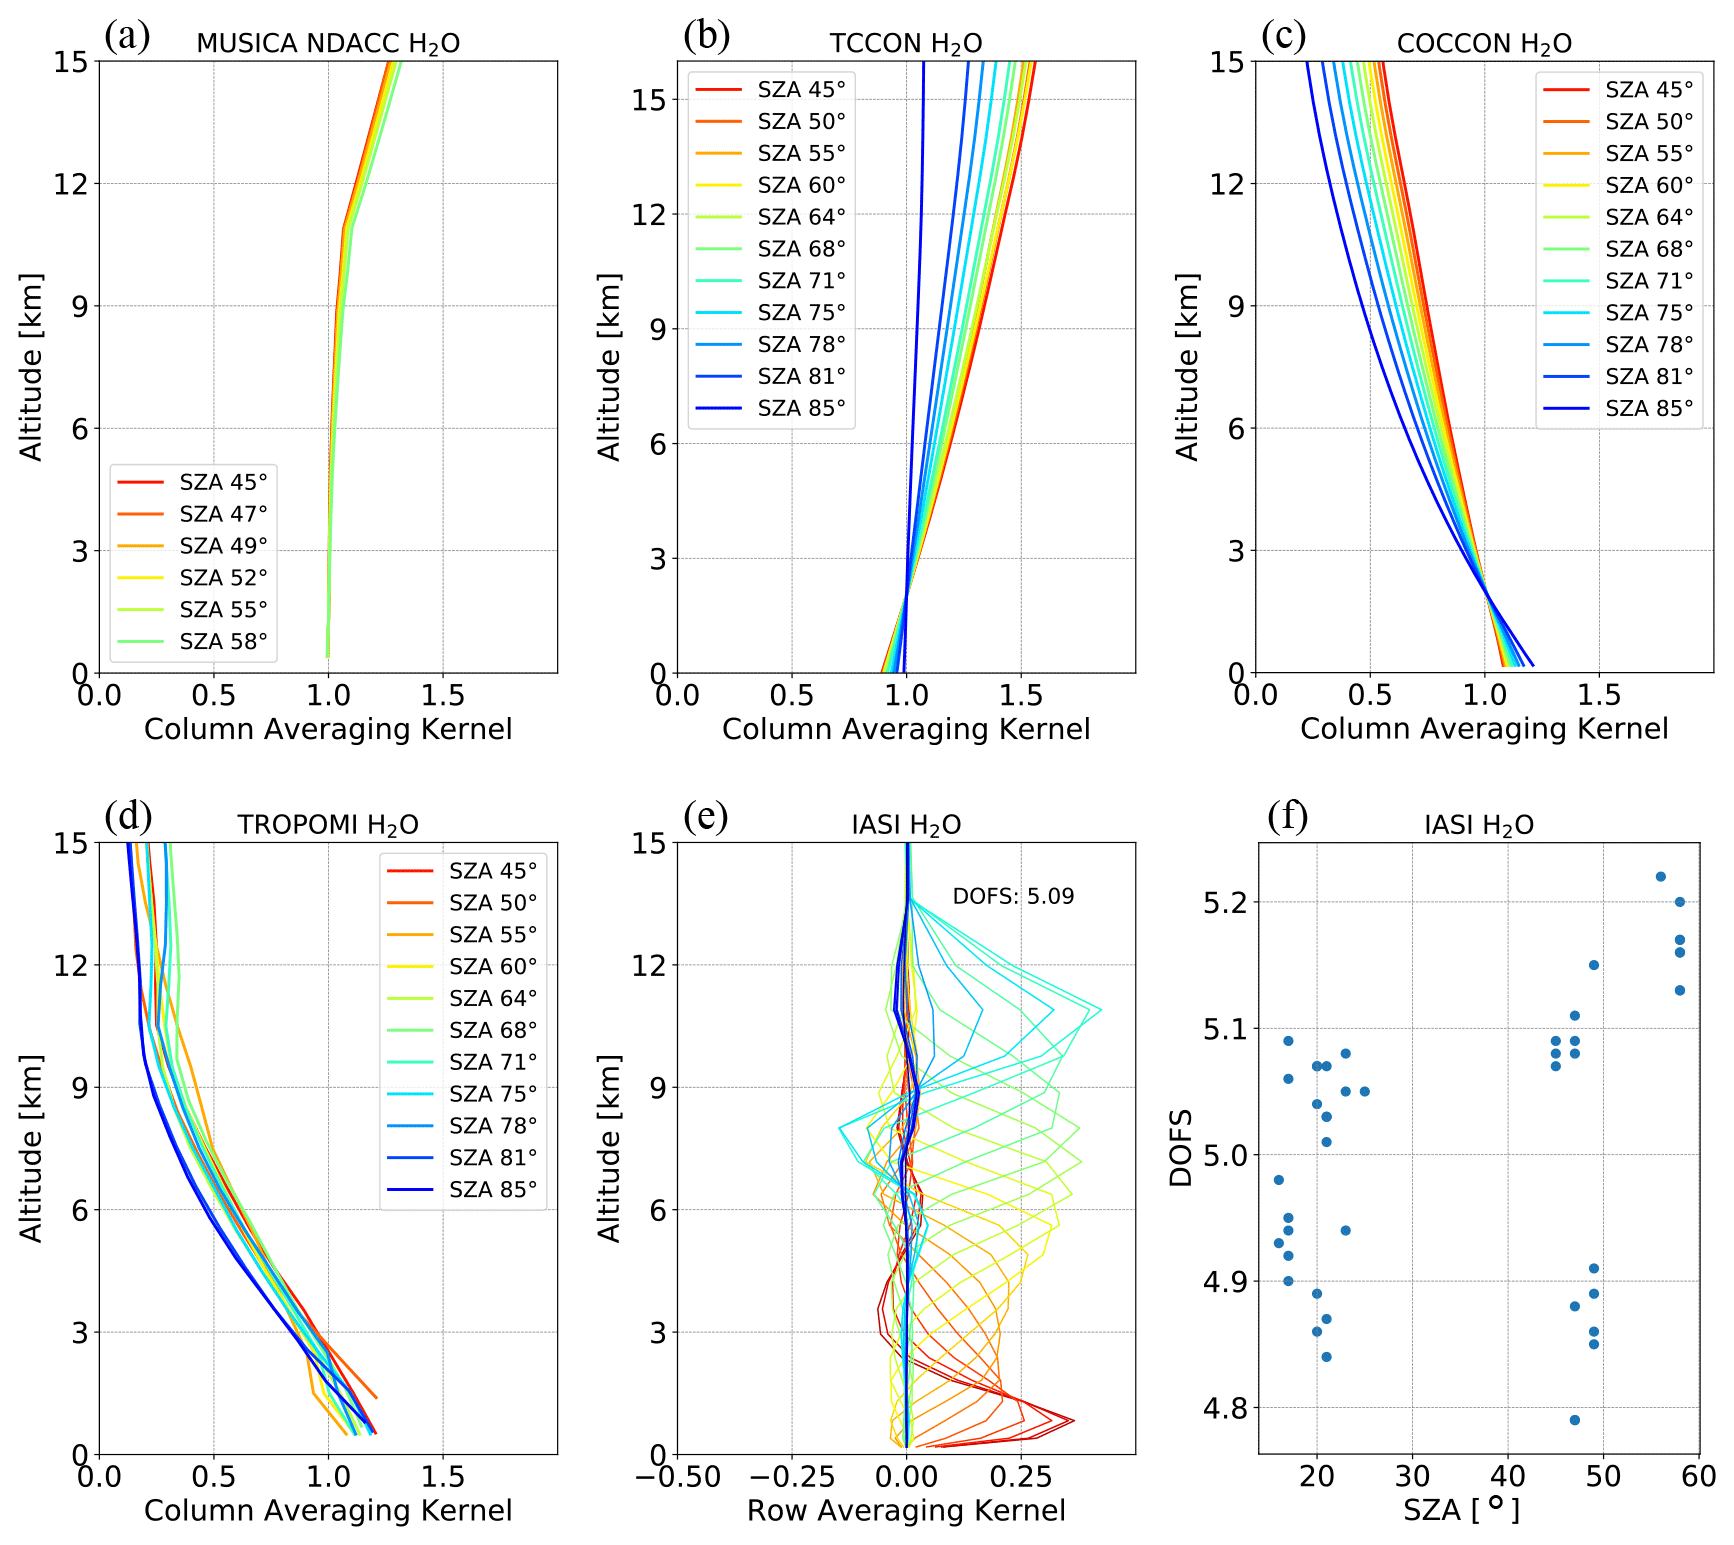
Figure 5Examples of column averaging kernels for H2O from (a) MUSICA NDACC, (b) TCCON, (c) COCCON, and (d) TROPOMI for different SZAs; (e) examples of row averaging kernels from IASI at DOFS =5.09; and (f) the correlation between SZAs and DOFS for IASI on 2 July 2018.
When directly comparing the measurements from different remote sensing instruments, the differing observing system characteristics, particularly vertical sensitivity and a priori profiles should be considered (Rodgers and Connor, 2003). The COCCON instrument uses the same a priori H2O VMR profiles as used in the TCCON network, derived from the National Centers for Environmental Prediction/National Center for Atmospheric Research (NCEP/NCAR) 6-hourly reanalysis data. A daily profile has been generated from the NCEP/NCAR data, interpolated to latitude, longitude, and local solar noon time at the site. We refer to the TCCON a priori profiles as “MAP” files, following the naming convention used for the TCCON processing. MUSICA NDACC uses a single global climatology profile as a priori information, which has no seasonal variations.
To assess the impact of the a priori profiles on the retrievals, the MAP a priori profiles used in TCCON and COCCON are applied to the MUSICA NDACC retrievals and IASI retrievals. We use MUSICA NDACC (MAP) and IASI (MAP) to represent the corresponding XH2O to distinguish the official MUSICA NDACC and MUSICA IASI data. The MUSICA IASI (MAP) will be discussed in Sect. 5.1.
The correlation between MUSICA NDACC and MUSICA NDACC (MAP) and the time series of their relative biases are presented in Fig. 6a and b, respectively. The MUSICA NDACC (MAP) XH2O shows an excellent agreement with the MUSICA NDACC, with an R2 value of 0.9998. When using the MAP profiles, the XH2O retrievals are 2.57 % (standard deviation: 2.85 %) wetter than the MUSICA NDACC retrievals, and higher relative biases are found early in the year when the atmosphere is dryer. This a priori choice slightly increases the correlation between MUSICA NDACC (MAP) and COCCON retrievals (with an R2 value of 0.9989) and, consequently, the relative difference decreases to −0.92 % (standard deviation: 4.31 %). This small change indicates that MUSICA NDACC XH2O has little sensitivity to the a priori information, and the bias between MUSICA NDACC and COCCON is mainly due to the choices for the calibration of the XH2O data product by either network.
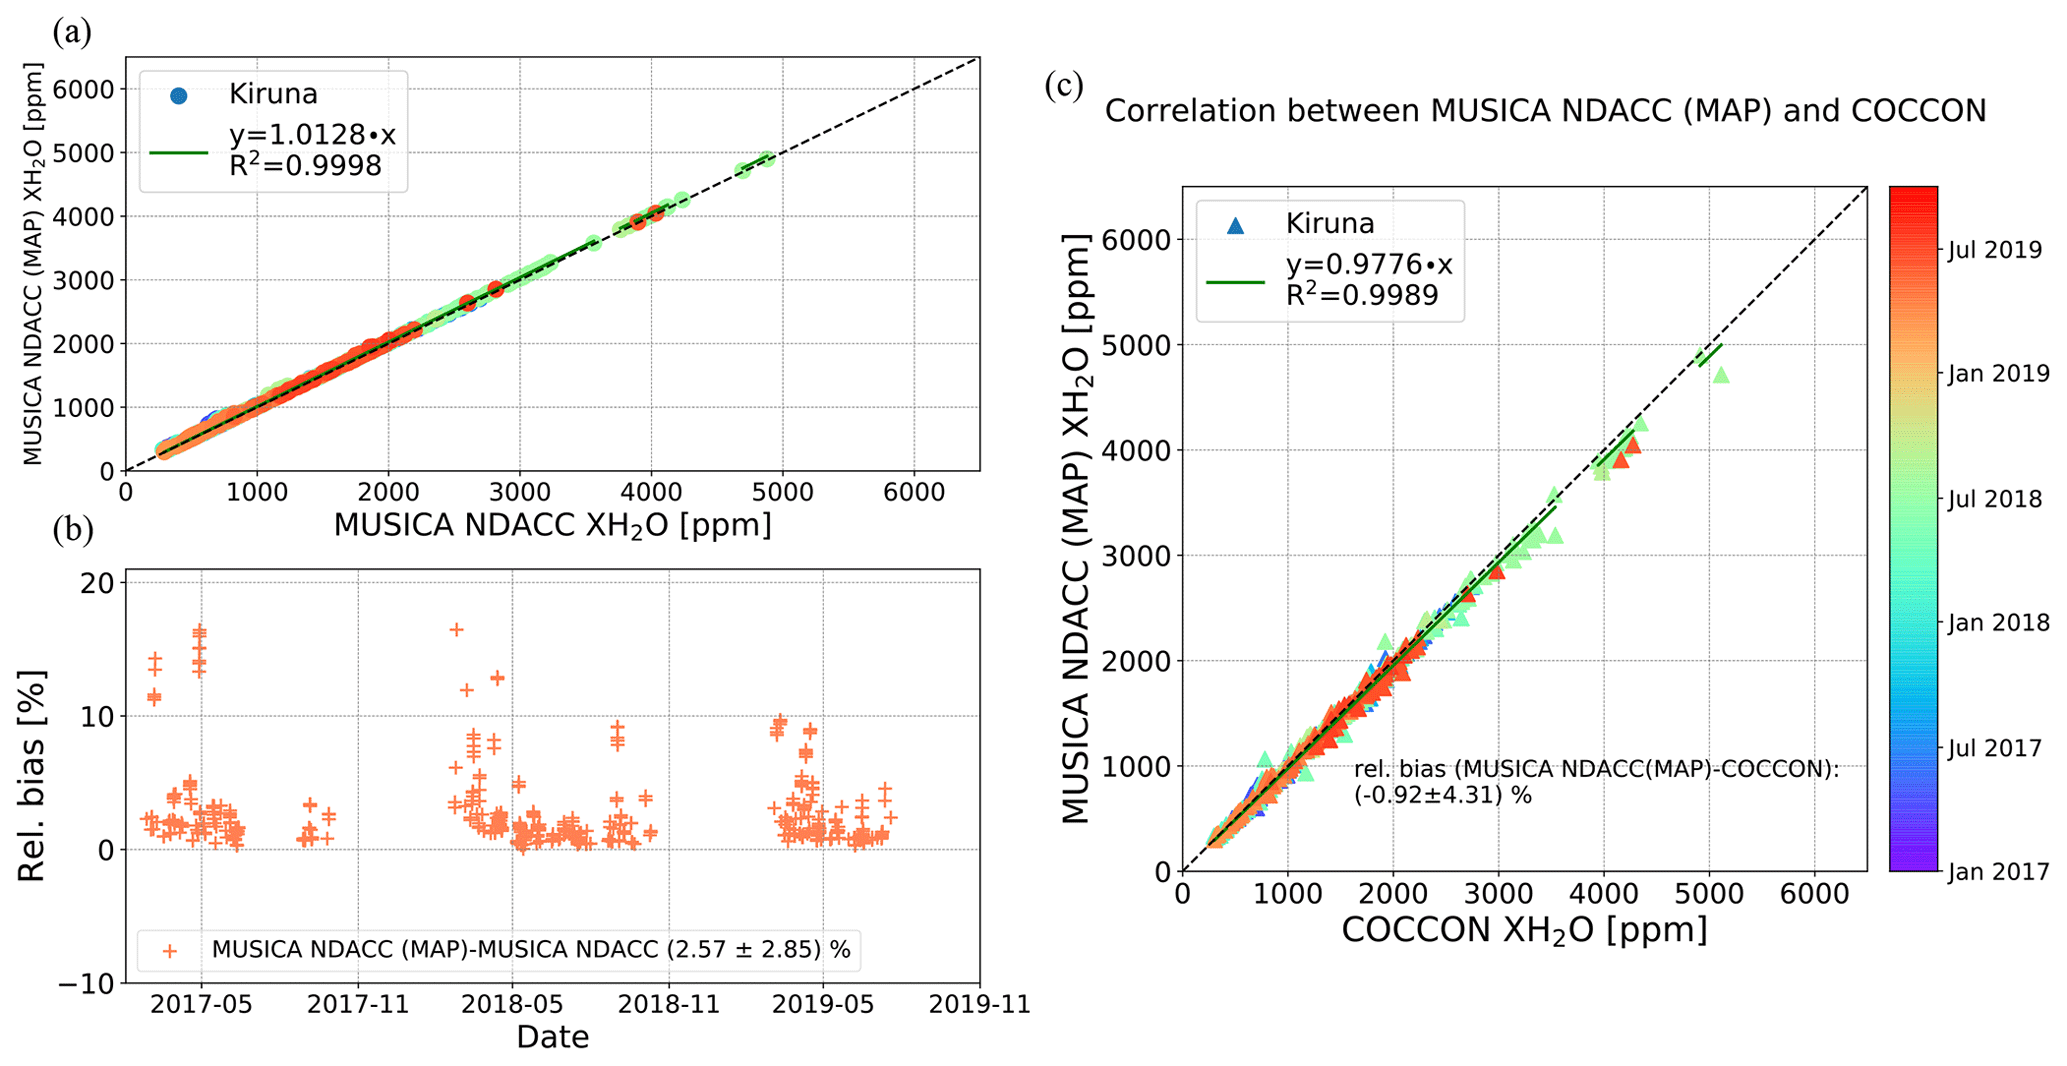
Figure 6(a) Correlation plot of MUSICA NDACC XH2O and MUSICA NDACC (MAP), (b) time series of their relative bias, and (c) correlation plot of COCCON XH2O and coincident MUSICA NDACC (MAP) retrievals at the Kiruna site. The annotations follow those in Fig. 2.
4.3 H2O VMR profiles from in situ radiosonde at the Sodankylä site
The comparison of the a priori H2O profile used for the different instruments with in situ climatological knowledge of H2O vertical variability yields a precision estimate for the retrievals. In this section, the MAP a priori profiles used in TCCON and COCCON are discussed using Vaisala RS41 radiosonde profiles as a reference.
The radiosondes are launched daily, and the coincident MAP and radiosonde profiles cover nearly the whole year. As most of the H2O is located in the troposphere, we present the profiles below 10 km here. Figure 7 depicts the yearly averaged H2O VMR profiles derived from the MAP and Vaisala RS41 radiosonde (Fig. 7a) and the monthly averaged relative biases between MAP and radiosonde profiles (Fig. 7b) for 2018. The ensemble of radiosonde profiles has a higher vertical resolution and is regridded to the lower vertical resolution of the MAP profiles. The statistics of yearly averaged MAP and radiosonde profiles at each level in 2018 are listed in Table 2.
Table 2Yearly mean and standard deviation for a priori MAP and radiosonde profiles at each level in 2018 and for their corresponding relative biases.

The vertical H2O VMR profiles of MAP are overestimated by 16.4 % at an altitude of 0.2 km with respect to the radiosonde profiles. The MAP profiles are generally closer to the radiosonde profiles between 1 and 4 km with a relative bias in the range of 1.1 %–4.4 %. For the upper layers (above 4 km), MAP shows overall higher overestimations of H2O (up to 19.4 %) than in the lower layers.
The time series of XH2O from integrating the a priori MAP profiles and radiosonde profiles between 0.2 and 15 km is presented in Fig. 8. These profile-integrated XH2O values show similar seasonal variability to that observed by COCCON and TCCON at Sodankylä. Good agreement is found for the integrated XH2O between MAP and the radiosonde profiles, with a relative bias of 3.95 % and an R2 value of 0.9904 (Fig. 9a), indicating that the modeled MAP profiles can effectively represent the vertical variability of H2O in the real atmosphere. TCCON measures 19.08 % drier XH2O than the radiosonde with an R2 value of 0.9952. There is a smaller dry bias in the COCCON XH2O with respect to radiosonde values that amounts to 14.96 % (R2=0.9957). This high bias is mainly because COCCON and TCCON measure the total column of H2O, whereas the radiosonde XH2O is integrated up to 15 km and there is remaining H2O above this level.
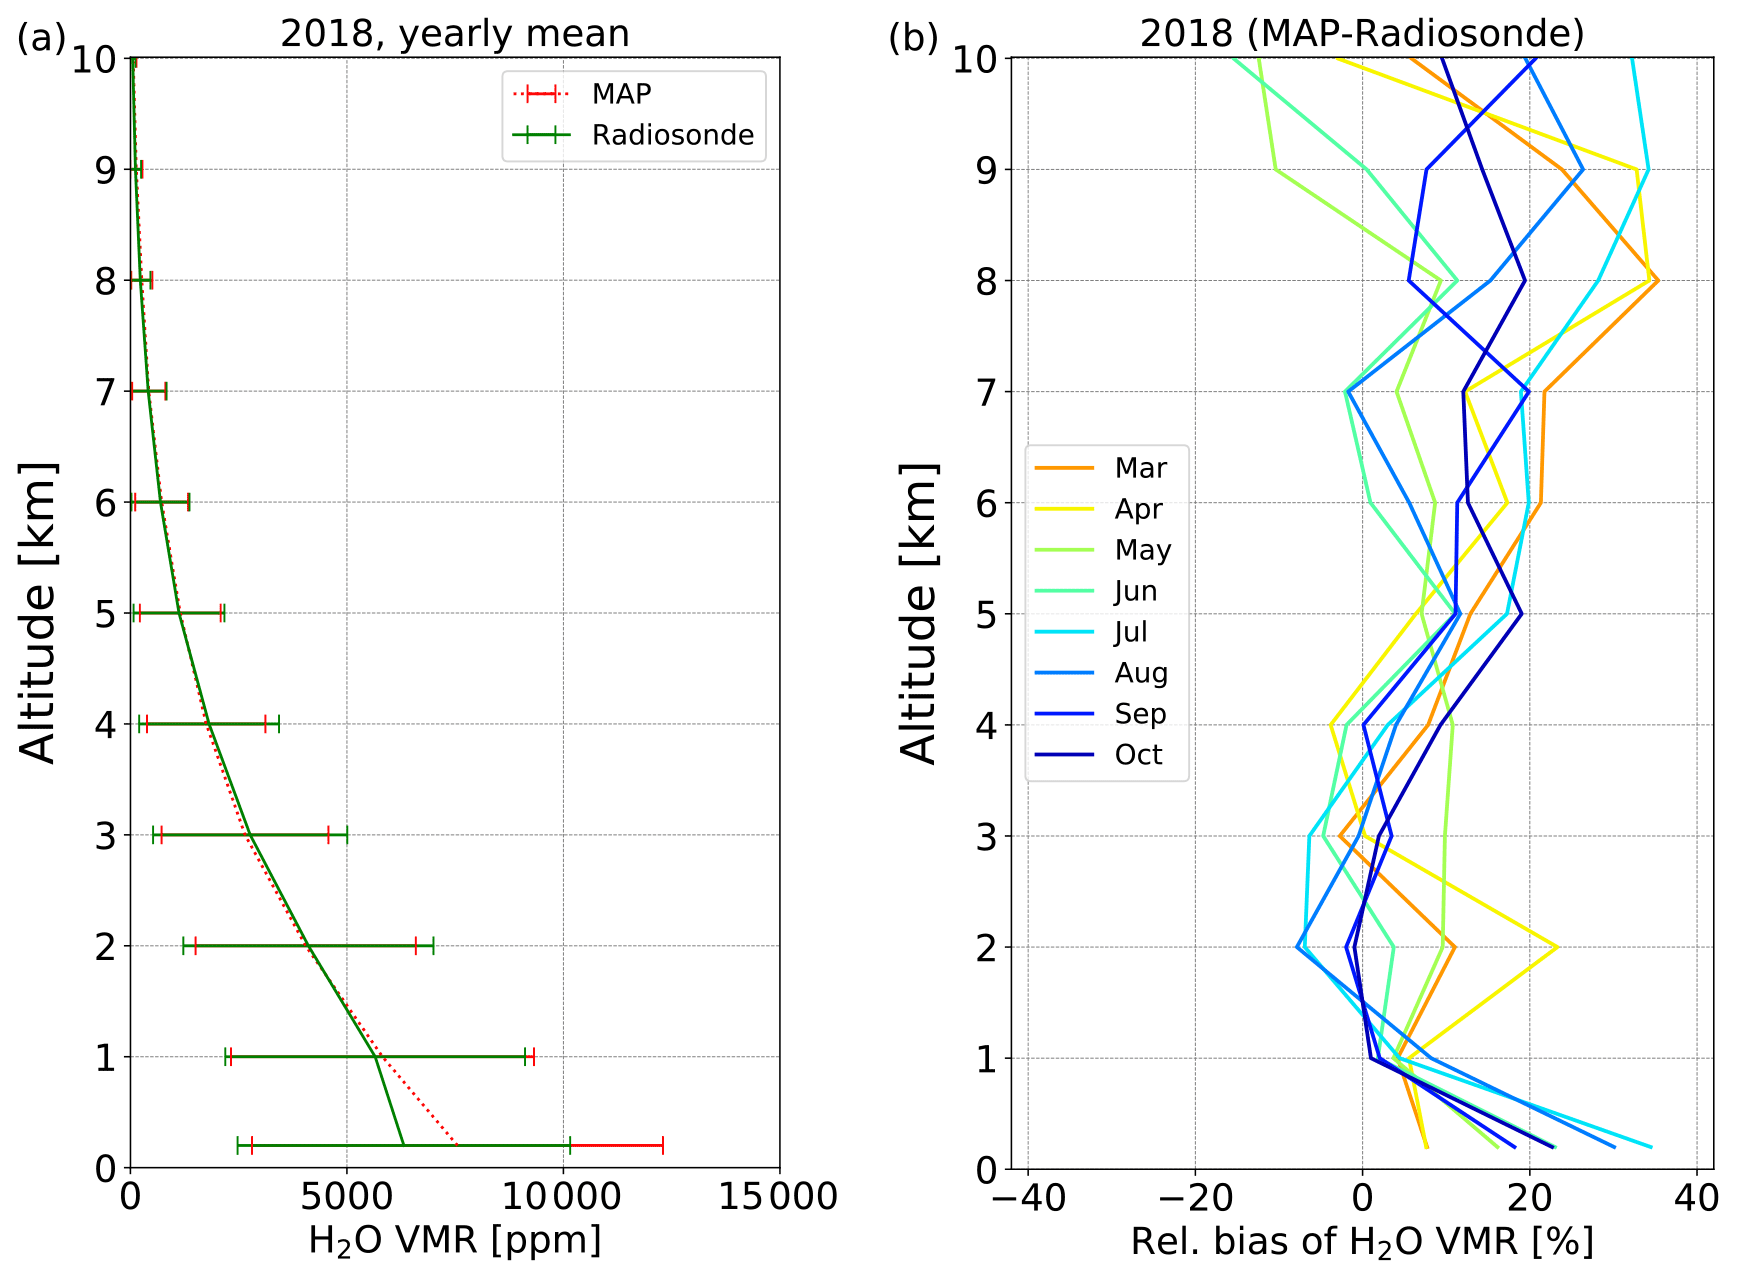
Figure 7(a) Yearly averaged H2O VMR profiles as a function of altitude retrieved from MAP (in red) and the Vaisala RS41 radiosondes (in green) around noon at the Sodankylä site in 2018 (the error bar denotes the standard deviation). (b) The corresponding monthly averaged relative bias between MAP and radiosonde profiles. Vaisala RS41 radiosonde profiles are regridded to the vertical resolution of MAP profiles.
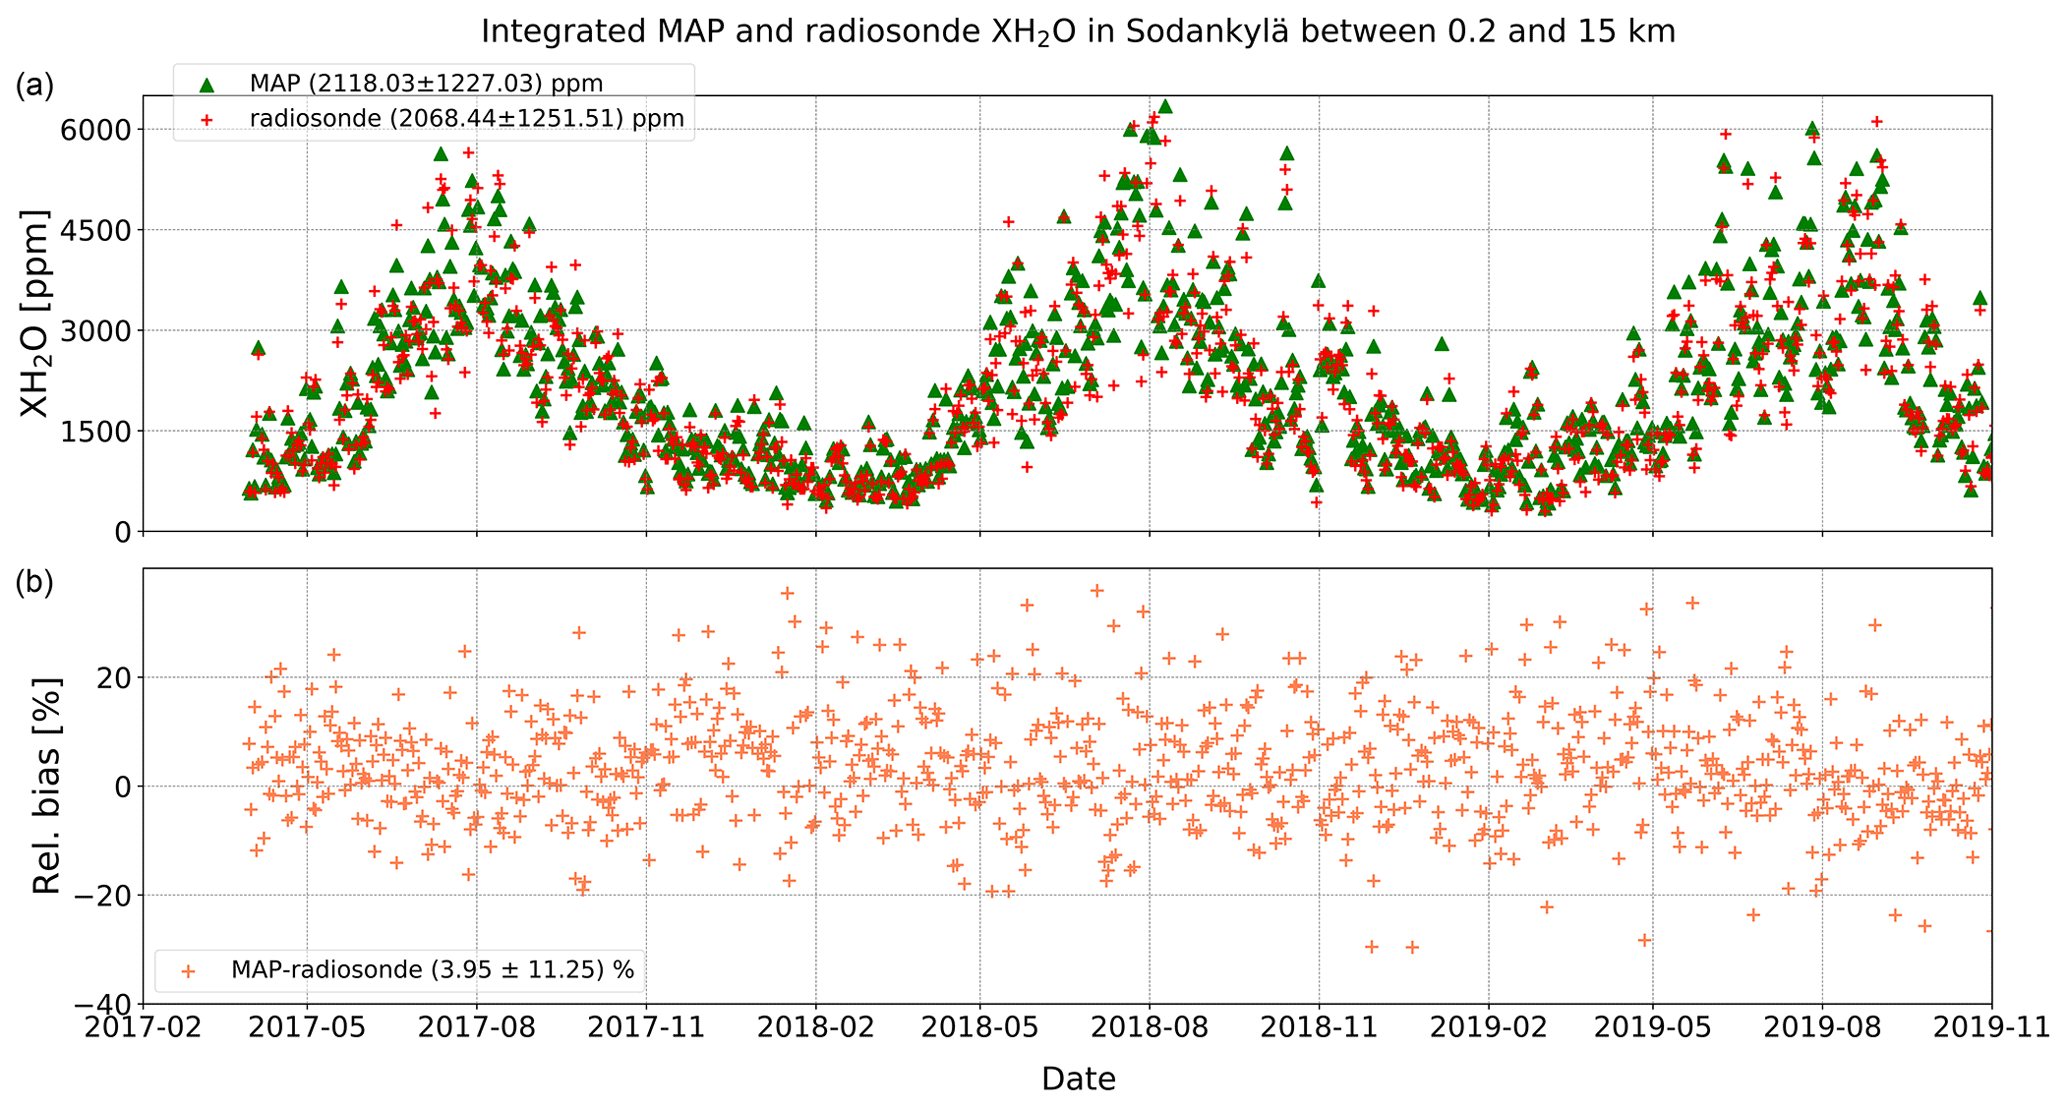
Figure 8(a) Time series of integrated XH2O derived from MAP and radiosonde H2O VMR profiles between 0.2 and 15 km. The corresponding relative biases are presented in panel (b).
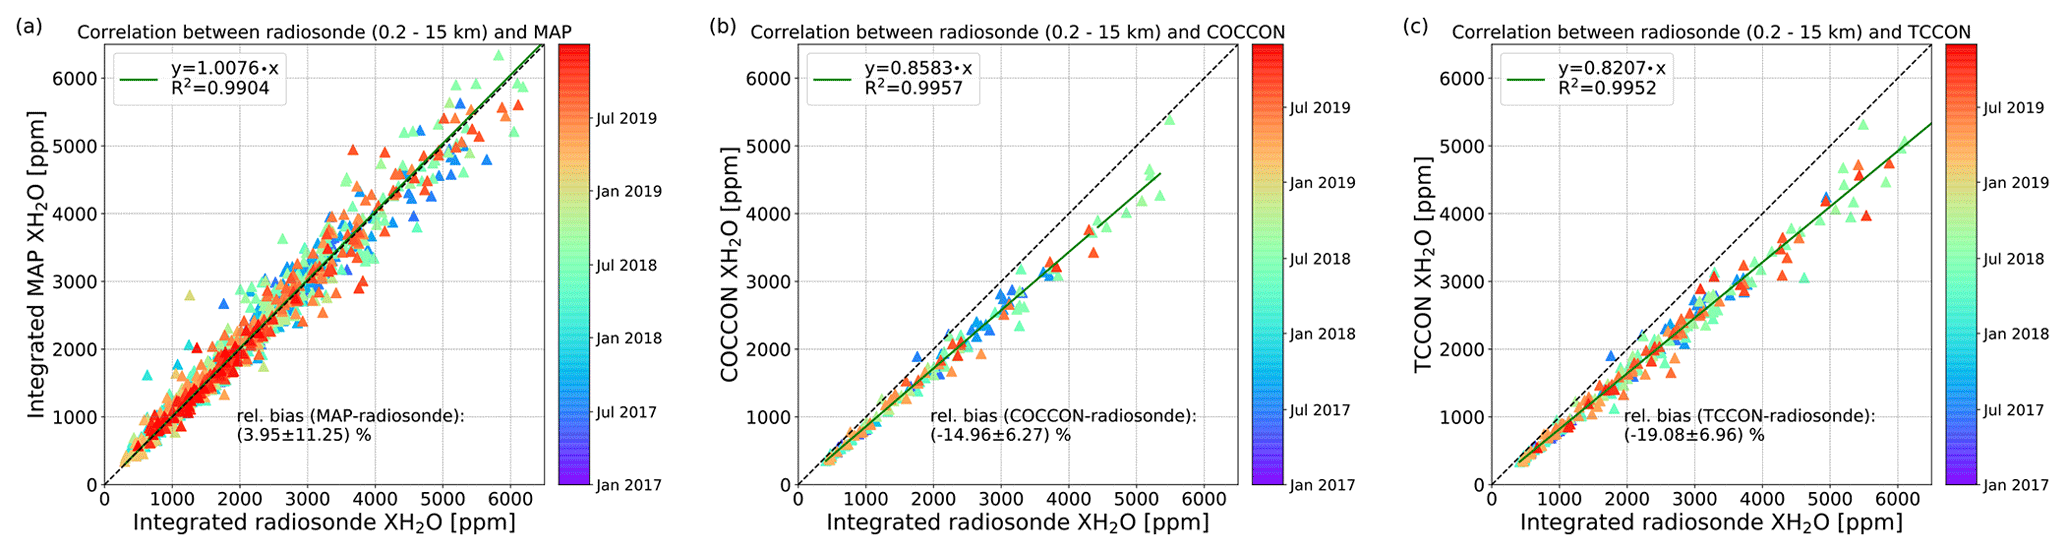
Figure 9Correlation plots of the XH2O derived from (a) MAP VMR profiles, (b) COCCON, and (c) TCCON with respect to the XH2O derived from coincident radiosonde profiles between 0.2 and 15 km at the Sodankylä site. The annotations follow those in Fig. 2.
5.1 Comparison between COCCON and MUSICA IASI
The agreement between the IASI and COCCON retrievals at the two sites are presented in Fig. 10. COCCON XH2O shows very good agreement overall with the MUSICA IASI data at both sites. For the Kiruna site, COCCON measures a drier XH2O than MUSICA IASI with a mean bias of 82.72 ppm (4.64 %) and a standard deviation of 233.35 ppm (11.43 %). COCCON measures a drier XH2O at Sodankylä with a mean bias of 84.67 ppm (3.36 %) and a standard deviation of 251.19 ppm (10.83 %) with respect to MUSICA IASI. The coincident data between COCCON and MUSICA IASI show higher variations (standard deviation) than the coincident data between COCCON and ground-based MUSICA NDACC and TCCON. This is mainly because the IASI data are collected from a wide area around the ground-based FTIR stations, and the varying altitudes also introduce additional biases. Partly cloudy conditions introduce biases to the IASI measurements, even if the cloud filter is applied. The fourth and eighth columns in Table 1 list the statistics between the coincident MUSICA IASI and COCCON XH2O data at the two sites.
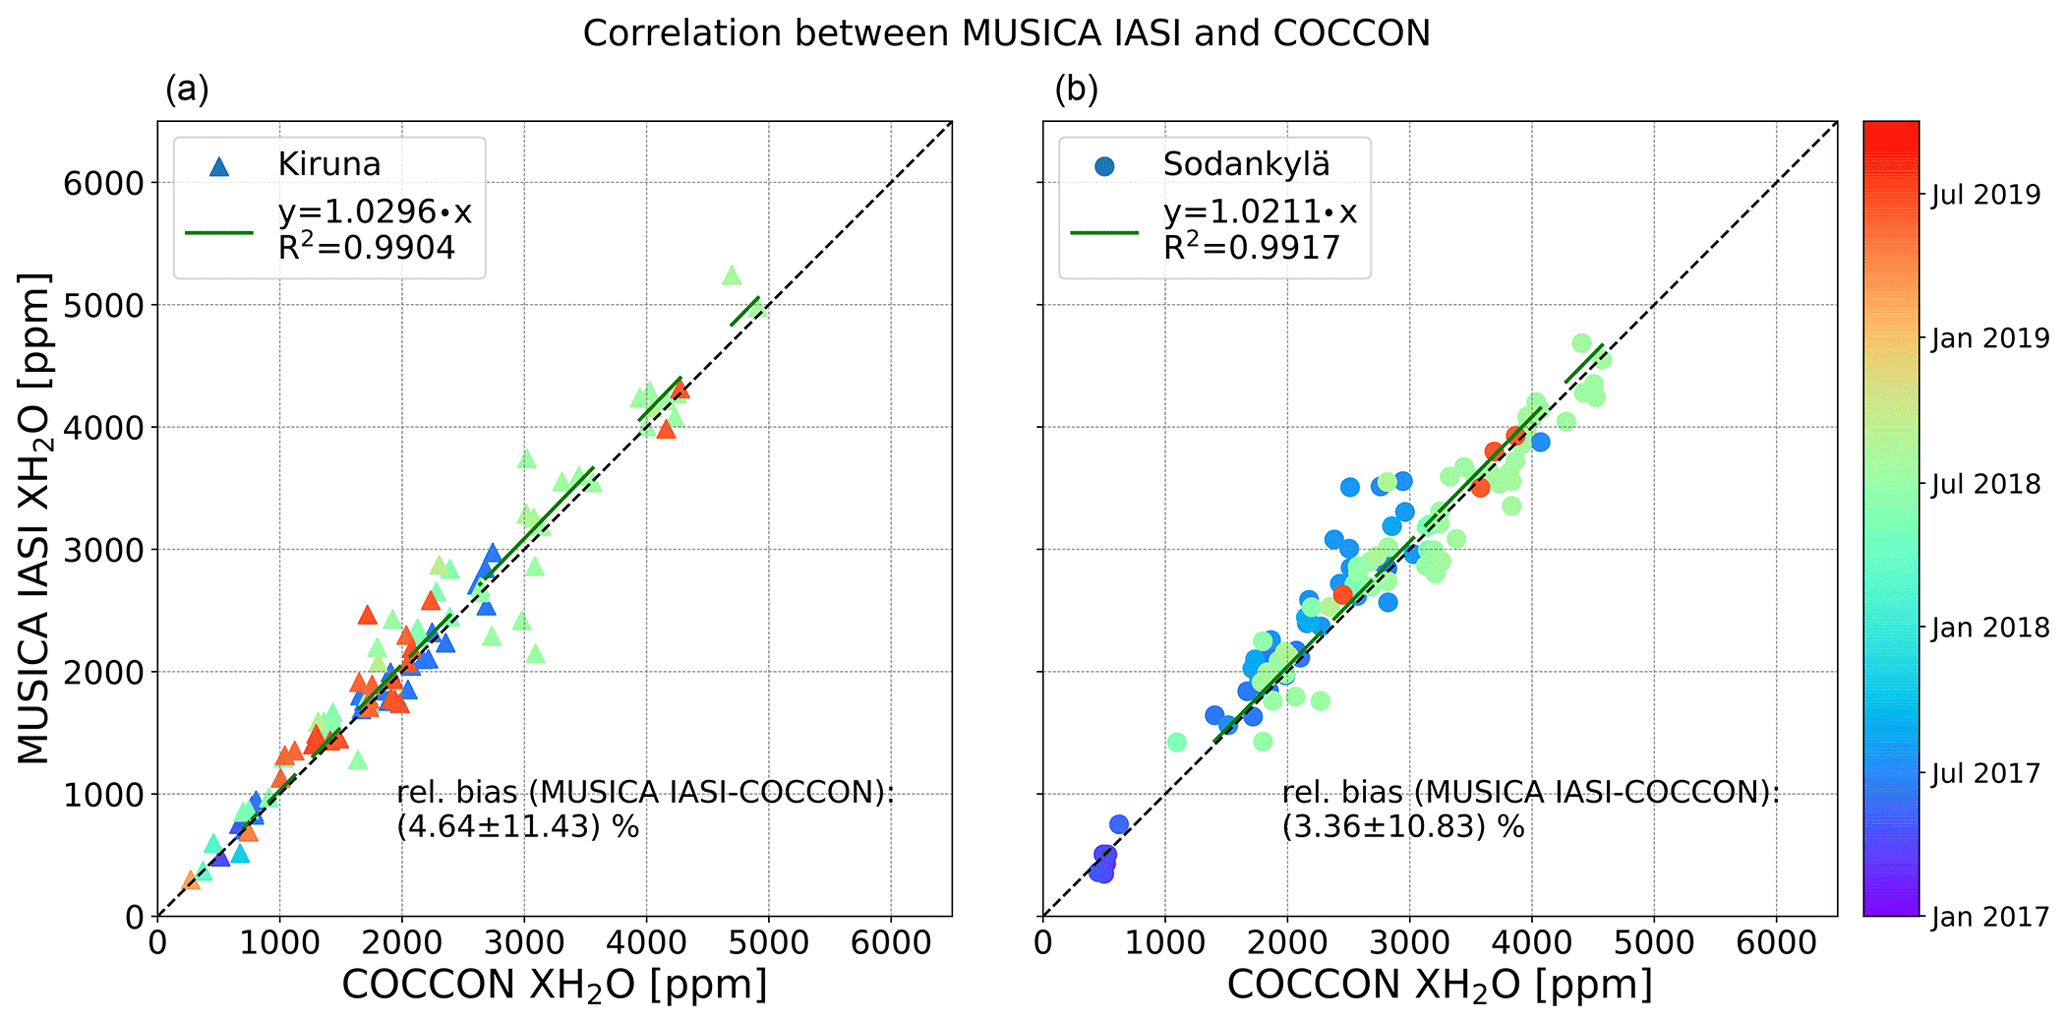
Figure 10Scatterplot of the COCCON XH2O compared with coincident MUSICA IASI retrievals at the Kiruna site (a) and the Sodankylä site (b). The annotations follow those in Fig. 2.
Similar to the MUSICA NDACC (MAP) XH2O, the application of MAP as a priori profiles does not impact the MUSICA IASI (MAP) too much. Figure 11a and b illustrate the correlations between the MUSICA IASI (MAP) and MUSICA IASI and the time series of their relative biases at Kiruna and Sodankylä. The two datasets at each site show an excellent agreement, with the same R2 value of 0.9999. The MUSICA IASI (MAP) XH2O is larger by 1.34 % and 0.96 % compared with MUSICA IASI retrievals at Kiruna and Sodankylä, respectively. These wetter retrievals result in increases in the relative biases between MUSICA IASI (MAP) and COCCON to 6.03 % at Kiruna and to 4.94 % at Sodankylä. In general, MUSICA IASI (MAP) also agrees very well with COCCON (see Fig. 11c), similar to the correlation between MUSICA IASI and COCCON, which reveals that the a priori profiles have a small impact on the MUSICA IASI XH2O and the bias between MUSICA IASI and COCCON is mainly due to the choices for the calibration of the XH2O data product by either dataset.
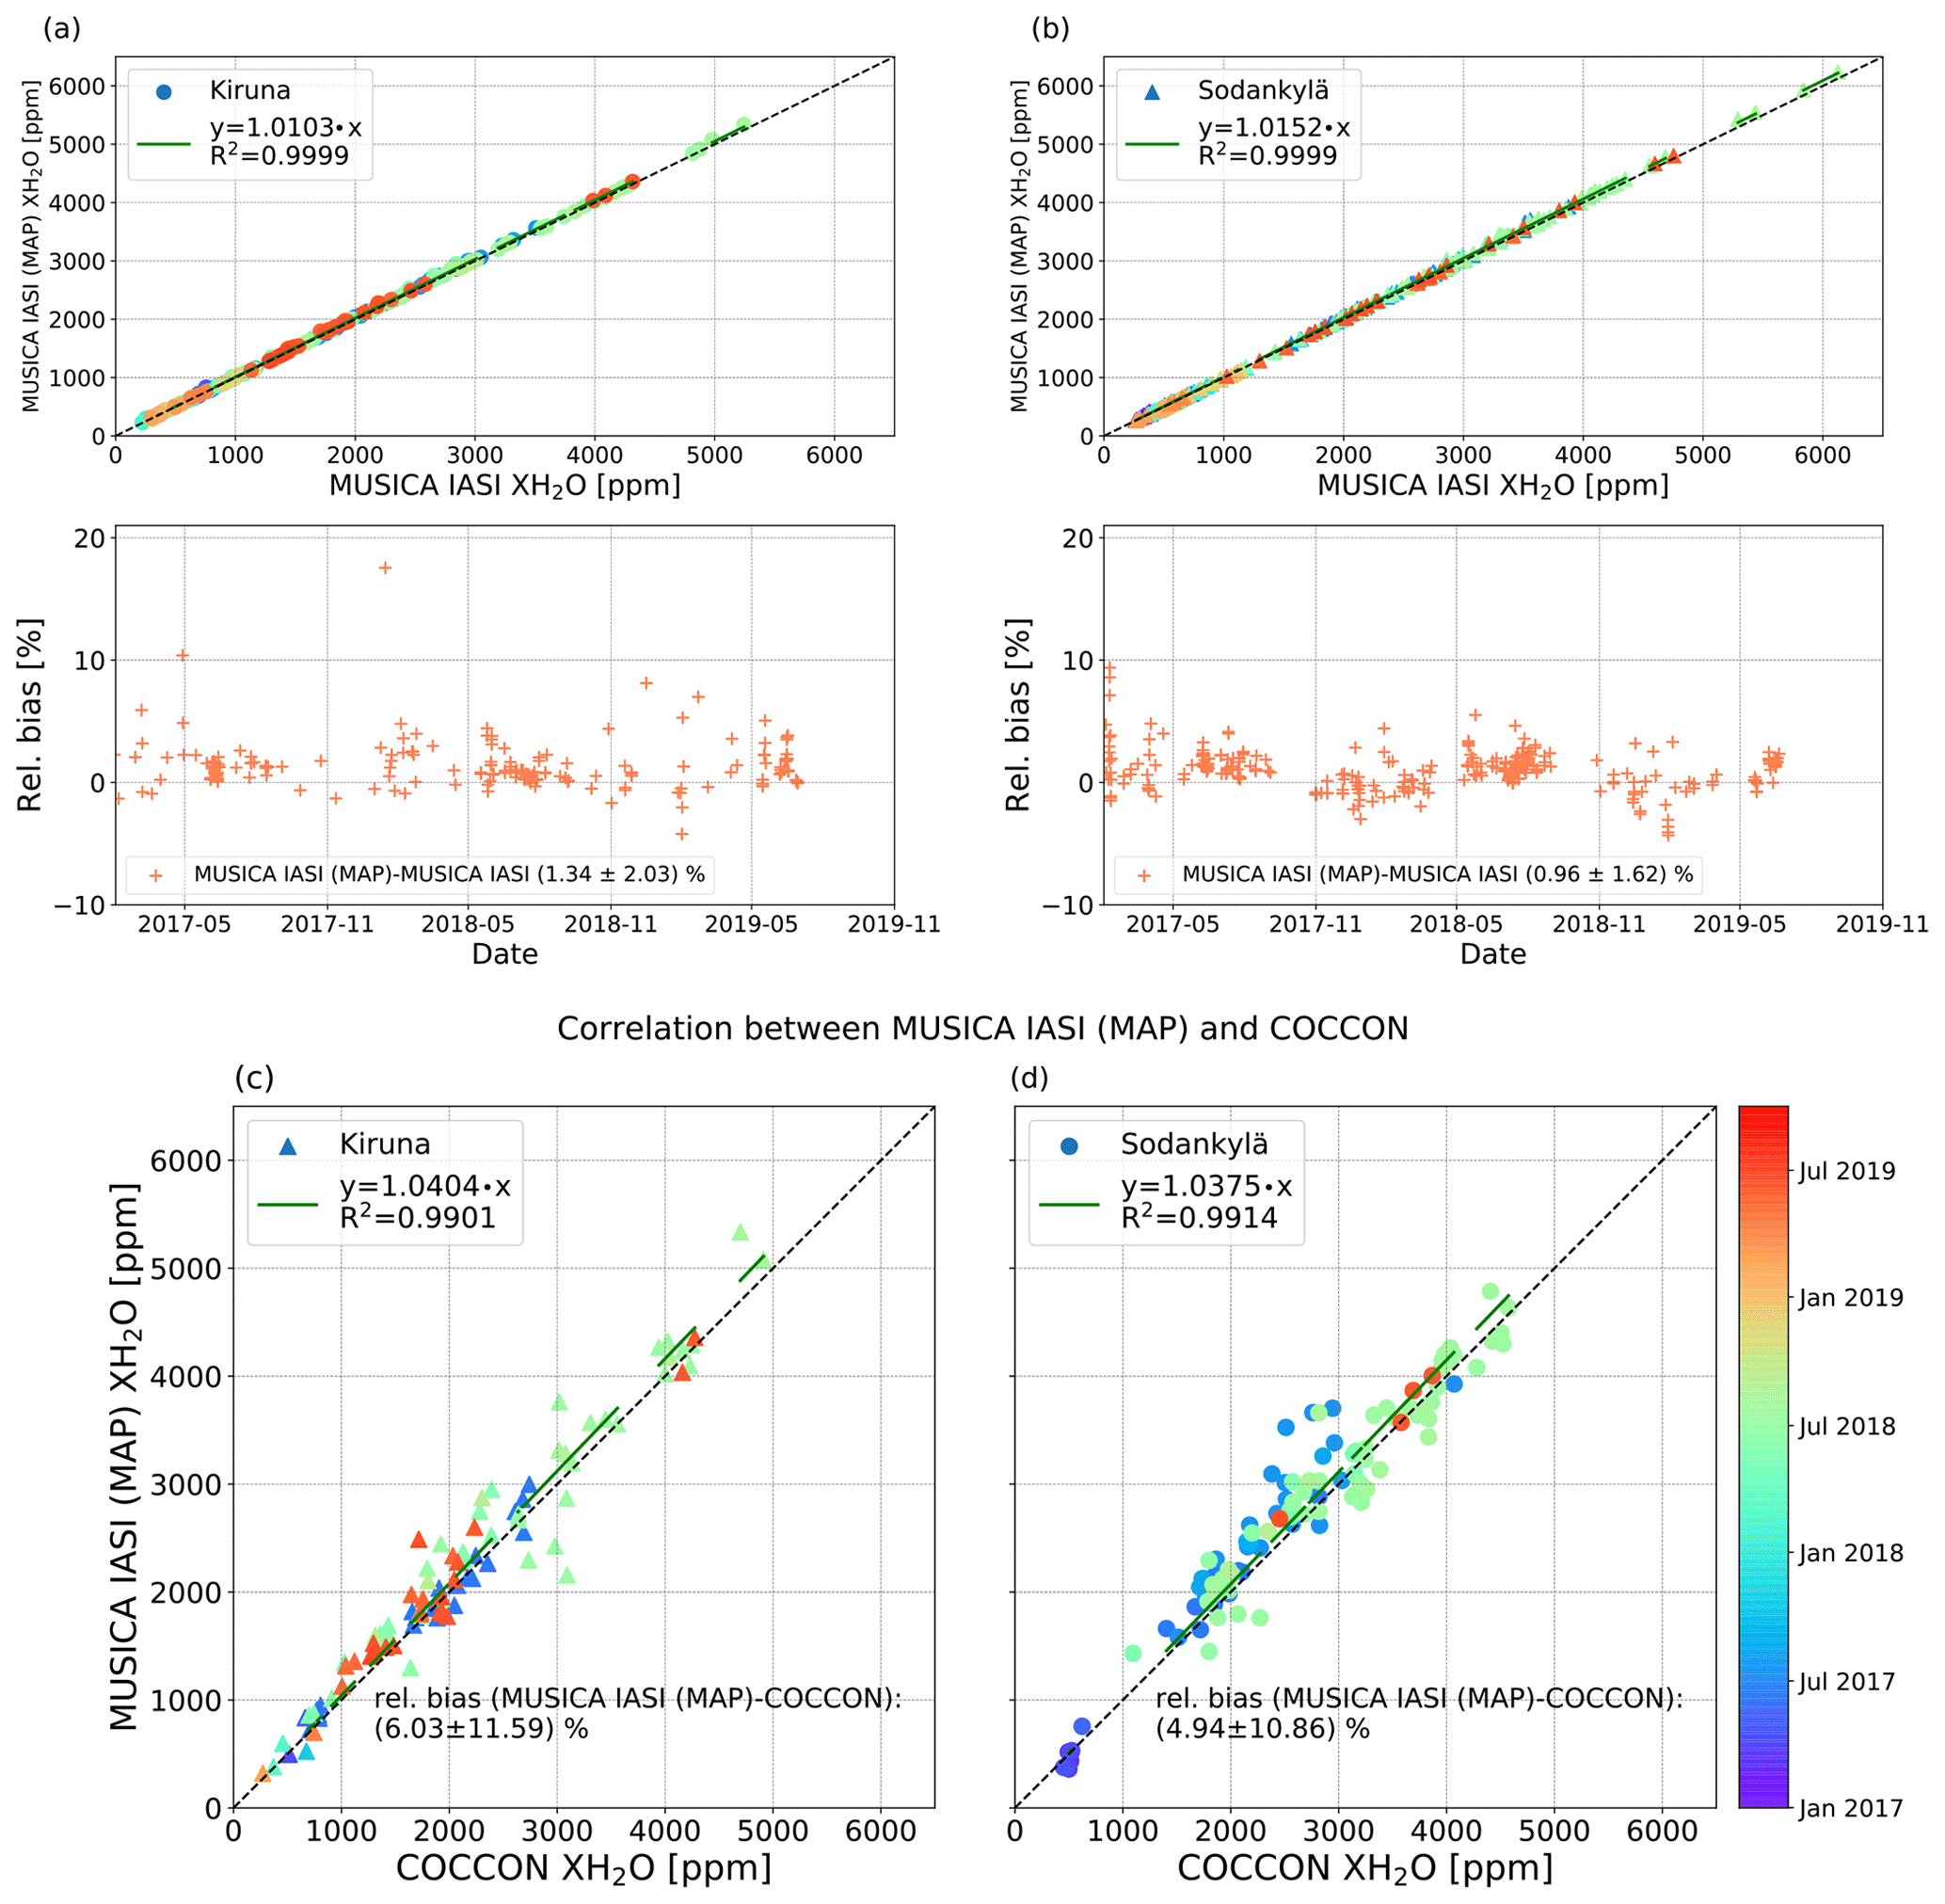
Figure 11Correlation plots of MUSICA IASI XH2O and MUSICA IASI (MAP) and time series of their relative difference at the Kiruna site (a) and the Sodankylä site (b), and correlation plots of COCCON XH2O and coincident MUSICA IASI (MAP) retrievals at the Kiruna site (c) and the Sodankylä site (d). The annotations follow those in Fig. 2.
5.2 Comparison between COCCON and TROPOMI
The correlation plots between TROPOMI and COCCON XH2O data at Kiruna and Sodankylä sites are presented in Fig. 12, and the sixth and tenth columns in Table 1 list the statistics for each site. The TROPOMI XH2O shows generally good agreement with COCCON data, and the correlations at both sites are similar. The slope demonstrates an underestimation of the TROPOMI retrievals versus COCCON retrievals, with a factor of 0.9078 at Kiruna and 0.9289 at Sodankylä. The total bias is −176.55 ppm (−9.71 %) with a standard deviation of 161.0 ppm (7.69 %), and the correlation coefficient is 0.9950 at Kiruna. The correlation at Sodankylä is slightly better, with a correlation coefficient of 0.9961, a mean bias of −192.1 ppm (−7.75 %), and a standard deviation of 179.49 ppm (6.45 %).
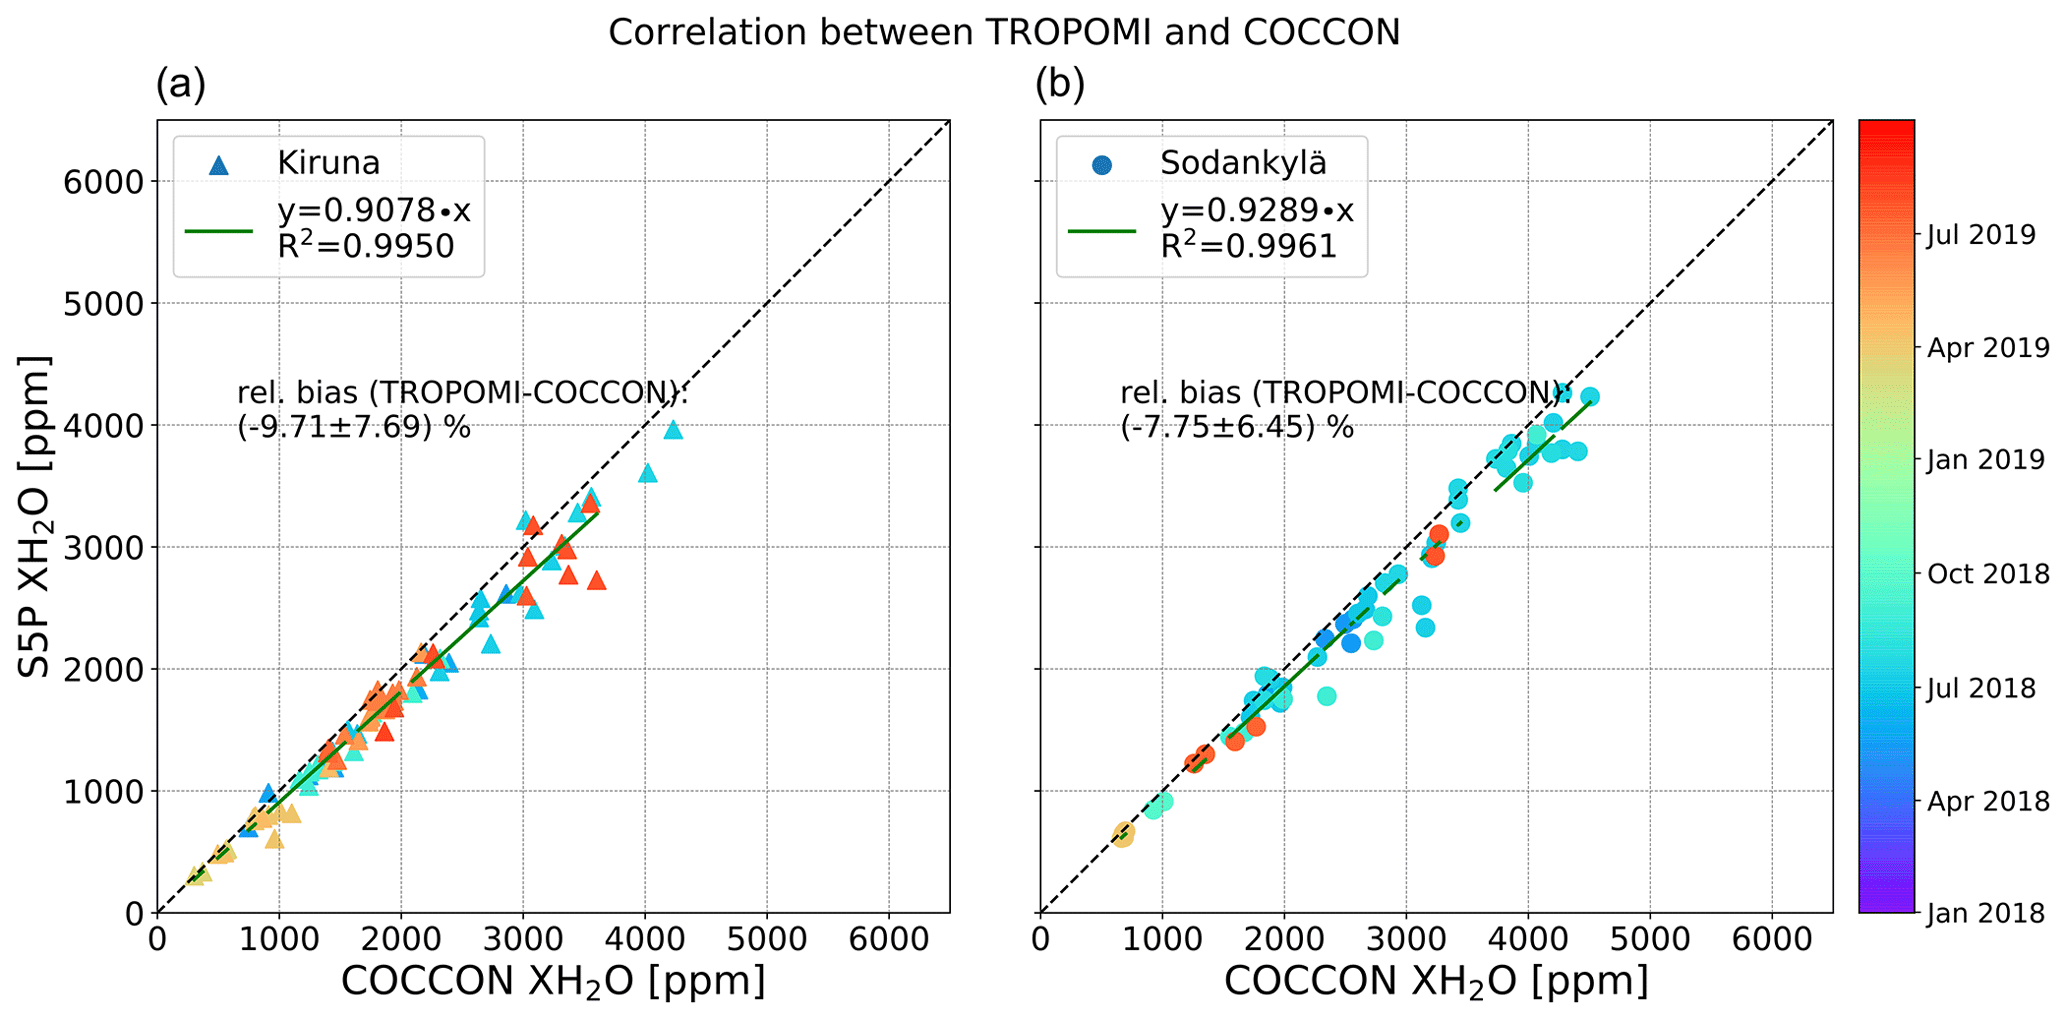
Figure 12Correlation plots of TROPOMI and COCCON XH2O at the Kiruna site (a) and the Sodankylä site (b). The annotations follow those in Fig. 2. Note that the color bar is from January 2018 to October 2019.
In this paper, we compare the column-averaged dry-air mole fractions of water vapor (XH2O) retrievals from COCCON and MUSICA NDACC at Kiruna and from COCCON and TCCON at Sodankylä during the period from March 2017 to September 2019. Additionally, we evaluate the vertical water vapor VMR profiles (MAP) as a priori information used in COCCON and TCCON retrievals with in situ profiles retrieved from the Vaisala RS41 radiosonde.
We found a very good agreement between the COCCON and the MUSICA NDACC data at Kiruna and between the COCCON and the TCCON data at Sodankylä. The COCCON retrievals have a tendency toward a wet bias of () ppm ( %) at Kiruna and () ppm ( %) at Sodankylä. The relative bias between COCCON and MUSICA shows no obvious sensitivity to the SZA, whereas the absolute value of the relative bias between COCCON and TCCON becomes slightly larger with increasing SZAs over 70∘. This is because the TCCON and COCCON instruments have different spectral resolutions, which results in different absorption strengths and also averaging kernels (Hedelius et al., 2016).
The a priori profiles play an important role in the retrievals. The in situ vertical H2O VMR profiles measured at Sodankylä provide the possibility to evaluate the a priori profiles (MAP) used in both the COCCON and TCCON datasets. As the shapes of profiles are similar over the years, we investigate the profiles in 2018 as an example. The difference between the MAP and radiosonde profiles varies with season and height, and higher differences are found near the surface in summer. The XH2O amounts integrated from MAP and radiosonde profiles between 0.2 and 15 km show a very good agreement (R2=0.9904), indicating that MAP profiles are reasonably modeled and represent the vertical variability well. Compared with radiosonde values, both COCCON and TCCON measure drier XH2O with mean biases of 14.96 % and 19.08 %, respectively. These high biases are mainly because COCCON and TCCON measure the total column of H2O, whereas the radiosonde XH2O is only integrated up to 15 km and there is remaining H2O above this level.
Furthermore, comparisons between the COCCON and MUSICA IASI datasets at Kiruna and Sodankylä are also carried out, and they show good agreement overall. COCCON measures a drier XH2O against MUSICA IASI with a mean bias of 82.72 ppm (4.46 %) at Kiruna and with a mean bias of 84.67 ppm (3.36 %) at Sodankylä. However, COCCON measures a wetter XH2O against TROPOMI data with a mean bias of −176.55 ppm (−9.71 %) at Kiruna and with a mean bias of −192.1 ppm (−7.75 %) at Sodankylä. The higher biases between COCCON and satellites is mainly because the satellite data are collected from a wide area around the ground-based FTIR stations, and the varying altitudes also add a bias.
To assess the effect of the a priori profile, we also use the MAP profiles as a priori profiles for retrieving the MUSICA NDACC and MUSICA IASI XH2O. The MUSICA NDACC (MAP) and MUSICA IASI (MAP) XH2O agree very well with their original dataset (R2≥0.9998), with no significant seasonal variations. When applying the MAP a priori profiles, we observe an overall increase of 2.57 % in MUSICA NDACC (MAP) in Kiruna, an overall increase of 1.34 % in MUSICA IASI (MAP) in Kiruna, and an overall increase of 0.96 % in MUSICA IASI (MAP) Sodankylä. Therefore, MUSICA NDACC and MUSICA IASI XH2O show low sensitivity to the a priori profiles. The small biases between MUSICA NDACC and COCCON and between MUSICA IASI and COCCON are mainly from the calibration choices of the XH2O data product.
During this field campaign, the low-cost, portable COCCON instrument shows the advantage of being robust, stabile, and reliable, and provides the potential to complement the TCCON network and to be used for satellite validation. This is the first published study where COCCON XH2O is compared with MUSICA NDACC and TCCON retrievals and is used for MUSICA IASI and TROPOMI validation. Therefore, COCCON instrumentation may serve as a validation tool for space-borne XH2O measurements, as well as for XCO2 and XCH4.
Table A1Parameters of different instruments used in this study.

1 National Centers for Environmental Prediction/National Center for Atmospheric Research. 2 Whole Atmosphere Community Climate Model. 3 European Centre for Medium-Range Weather Forecasts.
The TCCON GGG2014 data are publicly available from the TCCON Data Archive (https://doi.org/10.14291/tccon.ggg2014.sodankyla01.r0/1149280, Kivi et al., 2014). The MUSICA IASI data are publicly available from the RADAR4KIT repository (https://doi.org/10.35097/408, Schneider et al., 2021). The MUSICA NDACC data are freely available via the NDACC database (https://www-air.larc.nasa.gov/pub/NDACC/PUBLIC/MUSICA/, last access: 14 February 2021, https://doi.org/10.5281/zenodo.48902, Barthlott et al., 2016). The S5P dataset is available at https://ftp.sron.nl/open-access-data-2/TROPOMI/tropomi/hdo/9_1/ last access: 14 February 2021).
FH, MS, and QT developed the research question. QT wrote the paper and performed the data analysis with support from FH, TB, MS, AS, RK, PH, and MS. QT, TB, PH, RK, and UR played an active role in the field campaign by operating the COCCON spectrometers and collecting data. RK and PH also operate the TCCON station at the Sodankylä site and provided data. AS and TB provided the TROPOMI satellite data as well as technical support for the analysis. MS, BE, CD, and FK provided the MUSICA data. All authors discussed the results and contributed to the final article.
The authors declare that they have no conflict of interest.
The work presented here overlaps with the Fiducial Reference Measurements for Ground-Based Infrared Greenhouse Gas Observations (FRM4GHG) project funded by European Space Agency (grant no. ESA-IPL-POE-LG-cl-LE-2015-1129). The MUSICA NDACC retrievals at Kiruna for the 2015–2019 time period were made in the framework of the ESA S5P+I – H2O-ISO project (ESA/contract no. 4000127561/19/I-NS). We also acknowledge ESA support through the COCCON-PROCEEDS and COCCON-PROCEEDS II projects. Funding from the Deutsche Forschungsgemeinschaft via the MOTIV and TEDDY (ID/Geschäftszeichen 290612604/GZ:SCHN1126/2-1 and 416767181/GZ:SCHN1126/5-1, respectively) projects enabled us to optimize the MUSICA IASI retrieval processing chain. The MUSICA IASI retrievals were performed on the ForHLR supercomputer, funded by the Ministry of Science, Research and the Arts Baden-Württemberg and by the Federal Ministry of Education and Research.
This research has been supported by the European Space Agency (grant agreement no. ESA-IPL-POE-LG-cl-LE-2015-1129; ESA/contract no. 4000127561/19/INS; ESA/contract no. 4000121212/17/I-EF, project COCCON-PROCEEDS; and ESA/contract no. 4000121212/17/I-EF CCN1, project COCCON-PROCEEDS II), the Deutsche Forschungsgemeinschaft (grant agreement no. 290612604, project MOTIV, and grant agreement no. 416767181, project TEDDY), the Ministry of Science, Research and the Arts Baden-Württemberg (ForHLR supercomputer funding), and the Federal Ministry of Education and Research (ForHLR supercomputer funding).
The article processing charges for this open-access publication were covered by a Research Centre of the Helmholtz Association.
This paper was edited by Cheng Liu and reviewed by two anonymous referees.
Allan, R. P.: The Role of Water Vapour in Earth's Energy Flows, Surv. Geophys., 33, 557–564, https://doi.org/10.1007/s10712-011-9157-8, 2012.
Alraddawi, D., Sarkissian, A., Keckhut, P., Bock, O., Noël, S., Bekki, S., Irbah, A., Meftah, M., and Claud, C.: Comparison of total water vapour content in the Arctic derived from GNSS, AIRS, MODIS and SCIAMACHY, Atmos. Meas. Tech., 11, 2949–2965, https://doi.org/10.5194/amt-11-2949-2018, 2018.
Barthlott, S., Schneider, M., Hase, F., Blumenstock, T., Mengistu Tsidu, G., Grutter de la Mora, M., Strong, K., Notholt, J., Mahieu, E., Jones, N., and Smale, D.: The ground-based MUSICA dataset: Tropospheric water vapour isotopologues (H216O, H218O and HD16O) as obtained from NDACC/FTIR solar absorption spectra, Data set, Zenodo, https://doi.org/10.5281/zenodo.48902, 2016 (data available at: https://www-air.larc.nasa.gov/pub/NDACC/PUBLIC/MUSICA/, last access: 14 February 2021).
Barthlott, S., Schneider, M., Hase, F., Blumenstock, T., Kiel, M., Dubravica, D., García, O. E., Sepúlveda, E., Mengistu Tsidu, G., Takele Kenea, S., Grutter, M., Plaza-Medina, E. F., Stremme, W., Strong, K., Weaver, D., Palm, M., Warneke, T., Notholt, J., Mahieu, E., Servais, C., Jones, N., Griffith, D. W. T., Smale, D., and Robinson, J.: Tropospheric water vapour isotopologue data (, , and HD16O) as obtained from NDACC/FTIR solar absorption spectra, Earth Syst. Sci. Data, 9, 15–29, https://doi.org/10.5194/essd-9-15-2017, 2017.
Blumenstock, T., Kopp, G., Hase, F., Hochschild, G., Mikuteit, S., Raffalski, U., and Ruhnke, R.: Observation of unusual chlorine activation by ground-based infrared and microwave spectroscopy in the late Arctic winter 2000/01, Atmos. Chem. Phys., 6, 897–905, https://doi.org/10.5194/acp-6-897-2006, 2006.
Borger, C., Schneider, M., Ertl, B., Hase, F., García, O. E., Sommer, M., Höpfner, M., Tjemkes, S. A., and Calbet, X.: Evaluation of MUSICA IASI tropospheric water vapour profiles using theoretical error assessments and comparisons to GRUAN Vaisala RS92 measurements, Atmos. Meas. Tech., 11, 4981–5006, https://doi.org/10.5194/amt-11-4981-2018, 2018.
Buehler, S. A., Östman, S., Melsheimer, C., Holl, G., Eliasson, S., John, V. O., Blumenstock, T., Hase, F., Elgered, G., Raffalski, U., Nasuno, T., Satoh, M., Milz, M., and Mendrok, J.: A multi-instrument comparison of integrated water vapour measurements at a high latitude site, Atmos. Chem. Phys., 12, 10925–10943, https://doi.org/10.5194/acp-12-10925-2012, 2012.
Butz, A., Dinger, A. S., Bobrowski, N., Kostinek, J., Fieber, L., Fischerkeller, C., Giuffrida, G. B., Hase, F., Klappenbach, F., Kuhn, J., Lübcke, P., Tirpitz, L., and Tu, Q.: Remote sensing of volcanic CO2, HF, HCl, SO2, and BrO in the downwind plume of Mt. Etna, Atmos. Meas. Tech., 10, 1–14, https://doi.org/10.5194/amt-10-1-2017, 2017.
Chazette, P., Marnas, F., Totems, J., and Shang, X.: Comparison of IASI water vapor retrieval with H2O-Raman lidar in the framework of the Mediterranean HyMeX and ChArMEx programs, Atmos. Chem. Phys., 14, 9583–9596, https://doi.org/10.5194/acp-14-9583-2014, 2014.
Chen, J., Viatte, C., Hedelius, J. K., Jones, T., Franklin, J. E., Parker, H., Gottlieb, E. W., Wennberg, P. O., Dubey, M. K., and Wofsy, S. C.: Differential column measurements using compact solar-tracking spectrometers, Atmos. Chem. Phys., 16, 8479–8498, https://doi.org/10.5194/acp-16-8479-2016, 2016.
Clerbaux, C., Boynard, A., Clarisse, L., George, M., Hadji-Lazaro, J., Herbin, H., Hurtmans, D., Pommier, M., Razavi, A., Turquety, S., Wespes, C., and Coheur, P.-F.: Monitoring of atmospheric composition using the thermal infrared IASI/MetOp sounder, Atmos. Chem. Phys., 9, 6041–6054, https://doi.org/10.5194/acp-9-6041-2009, 2009.
De Mazière, M., Thompson, A. M., Kurylo, M. J., Wild, J. D., Bernhard, G., Blumenstock, T., Braathen, G. O., Hannigan, J. W., Lambert, J.-C., Leblanc, T., McGee, T. J., Nedoluha, G., Petropavlovskikh, I., Seckmeyer, G., Simon, P. C., Steinbrecht, W., and Strahan, S. E.: The Network for the Detection of Atmospheric Composition Change (NDACC): history, status and perspectives, Atmos. Chem. Phys., 18, 4935–4964, https://doi.org/10.5194/acp-18-4935-2018, 2018.
Delamere, J. S., Clough, S. A., Payne, V. H., Mlawer, E. J., Turner, D. D., and Gamache, R. R.: A far-infrared radiative closure study in the Arctic: application to water vapor, J. Geophys. Res., 115, D17106, https://doi.org/10.1029/2009JD012968, 2010.
Dirksen, R. J., Sommer, M., Immler, F. J., Hurst, D. F., Kivi, R., and Vömel, H.: Reference quality upper-air measurements: GRUAN data processing for the Vaisala RS92 radiosonde, Atmos. Meas. Tech., 7, 4463–4490, https://doi.org/10.5194/amt-7-4463-2014, 2014.
Dupuy, E., Morino, I., Deutscher, N. M., Yoshida, Y., Uchino, O., Connor, B. J., De Mazière, M., Griffith, D. W. T., Hase, F., Heikkinen, P., Hillyard, P. W., Iraci, L. T., Kawakami, S., Kivi, R., Matsunaga, T., Notholt, J., Petri, C., Podolske, J. R., Pollard, D. F., Rettinger, M., Roehl, C. M., Sherlock, V., Sussmann, R., Toon, G. C., Velazco, V. A., Warneke, T., Wennberg, P. O., Wunch, D., and Yokota, T.: Comparison of XH2O Retrieved from GOSAT Short-Wavelength Infrared Spectra with Observations from the TCCON Network, Remote Sens.-Basel, 8, 414, https://doi.org/10.3390/rs8050414, 2016.
Frey, M., Hase, F., Blumenstock, T., Groß, J., Kiel, M., Mengistu Tsidu, G., Schäfer, K., Sha, M. K., and Orphal, J.: Calibration and instrumental line shape characterization of a set of portable FTIR spectrometers for detecting greenhouse gas emissions, Atmos. Meas. Tech., 8, 3047–3057, https://doi.org/10.5194/amt-8-3047-2015, 2015.
Frey, M., Sha, M. K., Hase, F., Kiel, M., Blumenstock, T., Harig, R., Surawicz, G., Deutscher, N. M., Shiomi, K., Franklin, J. E., Bösch, H., Chen, J., Grutter, M., Ohyama, H., Sun, Y., Butz, A., Mengistu Tsidu, G., Ene, D., Wunch, D., Cao, Z., Garcia, O., Ramonet, M., Vogel, F., and Orphal, J.: Building the COllaborative Carbon Column Observing Network (COCCON): long-term stability and ensemble performance of the EM27/SUN Fourier transform spectrometer, Atmos. Meas. Tech., 12, 1513–1530, https://doi.org/10.5194/amt-12-1513-2019, 2019.
Gisi, M., Hase, F., Dohe, S., Blumenstock, T., Simon, A., and Keens, A.: XCO2-measurements with a tabletop FTS using solar absorption spectroscopy, Atmos. Meas. Tech., 5, 2969–2980, https://doi.org/10.5194/amt-5-2969-2012, 2012.
Hase, F., Hanningan, J. W., Coffey, M. T., Goldman, A., Höpfner, M., Jones, N. B., Rinsland, C. P., and Wood, S. W.: Intercomparison of retrieval codes used for the analysis of highresolution ground-based FTIR measurements, J. Quant. Spectrosc. Ra., 87, 25–52, 2004.
Hase, F., Frey, M., Blumenstock, T., Groß, J., Kiel, M., Kohlhepp, R., Mengistu Tsidu, G., Schäfer, K., Sha, M. K., and Orphal, J.: Application of portable FTIR spectrometers for detecting greenhouse gas emissions of the major city Berlin, Atmos. Meas. Tech., 8, 3059–3068, https://doi.org/10.5194/amt-8-3059-2015, 2015.
Hase, F., Frey, M., Kiel, M., Blumenstock, T., Harig, R., Keens, A., and Orphal, J.: Addition of a channel for XCO observations to a portable FTIR spectrometer for greenhouse gas measurements, Atmos. Meas. Tech., 9, 2303–2313, https://doi.org/10.5194/amt-9-2303-2016, 2016.
Hedelius, J. K., Viatte, C., Wunch, D., Roehl, C. M., Toon, G. C., Chen, J., Jones, T., Wofsy, S. C., Franklin, J. E., Parker, H., Dubey, M. K., and Wennberg, P. O.: Assessment of errors and biases in retrievals of , , XCO, and from a 0.5 cm−1 resolution solar-viewing spectrometer, Atmos. Meas. Tech., 9, 3527–3546, https://doi.org/10.5194/amt-9-3527-2016, 2016.
Hu, H., Landgraf, J., Detmers, R., Borsdorff, T., aan de Brugh, J., Aben, I., Butz, A., and Hasekamp O.: Toward global mapping of methane with TROPOMI: First results and intersatellite comparison to GOSAT, Geophys. Res. Lett., 45, 3682–3689, https://doi.org/10.1002/2018GL077259, 2018.
Hyland, R. W. and Wexler, A.: Formulations for the Thermodynamic Properties of the saturated Phases of H2O from 173.15 to 473.15 K, ASHRAE Tran., 89, 500–519, 1983.
Isaac, V. and van Wijngaarden, W. A.: Surface Water Vapor Pressure and Temperature Trends in North America during 1948–2010, J. Climate, 25, 3599–3609, https://doi.org/10.1175/JCLI-D-11-00003.1, 2012.
Jacobs, N., Simpson, W. R., Wunch, D., O'Dell, C. W., Osterman, G. B., Hase, F., Blumenstock, T., Tu, Q., Frey, M., Dubey, M. K., Parker, H. A., Kivi, R., and Heikkinen, P.: Quality controls, bias, and seasonality of CO2 columns in the boreal forest with Orbiting Carbon Observatory-2, Total Carbon Column Observing Network, and EM27/SUN measurements, Atmos. Meas. Tech., 13, 5033–5063, https://doi.org/10.5194/amt-13-5033-2020, 2020.
Kiehl, J. T. and Trenberth, K. E.: Earth's Annual Global Mean Energy Budget, B. Am. Meteorol. Soc., 78, 197–208, 1997.
Kivi, R. and Heikkinen, P.: Fourier transform spectrometer measurements of column CO2 at Sodankylä, Finland, Geosci. Instrum. Method. Data Syst., 5, 271–279, https://doi.org/10.5194/gi-5-271-2016, 2016.
Kivi, R., Heikkinen, P., and Kyrö, E.: TCCON data from Sodankylä (FI), Release GGG2014.R0, Version GGG2014.R0, Data set, CaltechDATA, https://doi.org/10.14291/TCCON.GGG2014.SODANKYLA01.R0/1149280, 2014.
Klappenbach, F., Bertleff, M., Kostinek, J., Hase, F., Blumenstock, T., Agusti-Panareda, A., Razinger, M., and Butz, A.: Accurate mobile remote sensing of XCO2 and XCH4 latitudinal transects from aboard a research vessel, Atmos. Meas. Tech., 8, 5023–5038, https://doi.org/10.5194/amt-8-5023-2015, 2015.
Kurylo, M. and Zander, R.: The NDSC – Its status after 10 years of operation, Proceedings of the XIX Quadrennial Ozone Symposium, Hokkaido University, Sapporo, Japan, 3–8 July 2000, 167–168, 2000.
Loew, A., Bell, W., Brocca, L., Bulgin, C. E., Burdanowitz, J., Calbet, X., Donner, R. V., Ghent, D., Gruber, A., Kaminski, T., Kinzel, J., Klepp, C., Lambert, J., Schäpman-Strub, G., Schröder, M., and Verhoelst, T.: Validation practices for satellite-based Earth observation data across communities, Rev. Geophys., 55, 779–817, https://doi.org/10.1002/2017RG000562, 2017.
Madonna, F., Kivi, R., Dupont, J.-C., Ingleby, B., Fujiwara, M., Romanens, G., Hernandez, M., Calbet, X., Rosoldi, M., Giunta, A., Karppinen, T., Iwabuchi, M., Hoshino, S., von Rohden, C., and Thorne, P. W.: Use of automatic radiosonde launchers to measure temperature and humidity profiles from the GRUAN perspective, Atmos. Meas. Tech., 13, 3621–3649, https://doi.org/10.5194/amt-13-3621-2020, 2020.
Mlawer, E. J., Payne, V. H., Moncet, J.-L., Delamere, J. S., Alvarado, M. J., and Tobin, D. C.: Development and recent evaluation of the MT_CKD model of continuum absorption, Philos. T. Roy. Soc. A, 370, 2520–2556, https://doi.org/10.1098/rsta.2011.0295, 2012.
Pałm, M., Melsheimer, C., Noël, S., Heise, S., Notholt, J., Burrows, J., and Schrems, O.: Integrated water vapor above Ny Ålesund, Spitsbergen: a multi-sensor intercomparison, Atmos. Chem. Phys., 10, 1215–1226, https://doi.org/10.5194/acp-10-1215-2010, 2010.
Payne, V. H., Mlawer, E. J., Cady-Pereira, K. E., and Moncet, J.: Water Vapor Continuum Absorption in the Microwave, IEEE T. Geosci. Remote, 49, 2194–2208, https://doi.org/10.1109/TGRS.2010.2091416, 2011.
Rodgers, C. D. and Connor, B. J.: Intercomparison of Remote Sounding Instruments, J. Geophys. Res., 108, 4116, https://doi.org/10.1029/2002JD002299, 2003.
Scheepmaker, R. A., aan de Brugh, J., Hu, H., Borsdorff, T., Frankenberg, C., Risi, C., Hasekamp, O., Aben, I., and Landgraf, J.: HDO and H2O total column retrievals from TROPOMI shortwave infrared measurements, Atmos. Meas. Tech., 9, 3921–3937, https://doi.org/10.5194/amt-9-3921-2016, 2016.
Schneider, A., Borsdorff, T., aan de Brugh, J., Aemisegger, F., Feist, D. G., Kivi, R., Hase, F., Schneider, M., and Landgraf, J.: First data set of H2O/HDO columns from the Tropospheric Monitoring Instrument (TROPOMI), Atmos. Meas. Tech., 13, 85–100, https://doi.org/10.5194/amt-13-85-2020, 2020.
Schneider, M. and Hase, F.: Ground-based FTIR water vapour profile analyses, Atmos. Meas. Tech., 2, 609–619, https://doi.org/10.5194/amt-2-609-2009, 2009.
Schneider, M. and Hase, F.: Optimal estimation of tropospheric H2O and δD with IASI/METOP, Atmos. Chem. Phys., 11, 11207–11220, https://doi.org/10.5194/acp-11-11207-2011, 2011.
Schneider, M., Hase, F., and Blumenstock, T.: Water vapour profiles by ground-based FTIR spectroscopy: study for an optimised retrieval and its validation, Atmos. Chem. Phys., 6, 811–830, https://doi.org/10.5194/acp-6-811-2006, 2006.
Schneider, M., Romero, P. M., Hase, F., Blumenstock, T., Cuevas, E., and Ramos, R.: Continuous quality assessment of atmospheric water vapour measurement techniques: FTIR, Cimel, MFRSR, GPS, and Vaisala RS92, Atmos. Meas. Tech., 3, 323–338, https://doi.org/10.5194/amt-3-323-2010, 2010a.
Schneider, M., Yoshimura, K., Hase, F., and Blumenstock, T.: The ground-based FTIR network's potential for investigating the atmospheric water cycle, Atmos. Chem. Phys., 10, 3427-442, https://doi.org/10.5194/acp-10-3427-2010, 2010b.
Schneider, M., Barthlott, S., Hase, F., González, Y., Yoshimura, K., García, O. E., Sepúlveda, E., Gomez-Pelaez, A., Gisi, M., Kohlhepp, R., Dohe, S., Blumenstock, T., Wiegele, A., Christner, E., Strong, K., Weaver, D., Palm, M., Deutscher, N. M., Warneke, T., Notholt, J., Lejeune, B., Demoulin, P., Jones, N., Griffith, D. W. T., Smale, D., and Robinson, J.: Ground-based remote sensing of tropospheric water vapour isotopologues within the project MUSICA, Atmos. Meas. Tech., 5, 3007–3027, https://doi.org/10.5194/amt-5-3007-2012, 2012.
Schneider, M., Wiegele, A., Barthlott, S., González, Y., Christner, E., Dyroff, C., García, O. E., Hase, F., Blumenstock, T., Sepúlveda, E., Mengistu Tsidu, G., Takele Kenea, S., Rodríguez, S., and Andrey, J.: Accomplishments of the MUSICA project to provide accurate, long-term, global and high-resolution observations of tropospheric {H2O,δD} pairs – a review, Atmos. Meas. Tech., 9, 2845–2875, https://doi.org/10.5194/amt-9-2845-2016, 2016.
Schneider, M., Ertl, B., and Diekmann, C.: MUSICA IASI full retrieval product standard output (processing version 3.2.1), Institute of Meteorology and Climate Reasearch, Atmospheric Trace Gases and Remote Sensing (IMK-ASF), Karlsruhe Institute of Technology (KIT), https://doi.org/10.35097/408, 2021.
Sha, M. K., De Mazière, M., Notholt, J., Blumenstock, T., Chen, H., Dehn, A., Griffith, D. W. T., Hase, F., Heikkinen, P., Hermans, C., Hoffmann, A., Huebner, M., Jones, N., Kivi, R., Langerock, B., Petri, C., Scolas, F., Tu, Q., and Weidmann, D.: Intercomparison of low- and high-resolution infrared spectrometers for ground-based solar remote sensing measurements of total column concentrations of CO2, CH4, and CO, Atmos. Meas. Tech., 13, 4791–4839, https://doi.org/10.5194/amt-13-4791-2020, 2020.
Soden, B. J., Wetherald, R. T., Stenchikov, G. L., and Robock, A.: Global cooling after the eruption of Mount Pinatubo: A test of climate feedback by water vapor, Science, 296, 727–730, https://doi.org/10.1126/science.296.5568.727, 2002.
Trenberth, K. E.: Atmospheric moisture residence times and cycling: Implications for rainfall rates and climate change, Climatic Change, 39, 667–694, https://doi.org/10.1023/A:1005319109110, 1998.
Trieu, T. T. N., Morino, I., Ohyama, H., Uchino, O., Sussmann, R., Warneke, T., Petri, C., Kivi, R., Hase, F., Pollard, D. F., Deutscher, N. M., Velazco, V. A., Iraci, L. T., Podolske, J. R., and Dubey, M. K.: Evaluation of Bias Correction Methods for GOSAT SWIR XH2O Using TCCON data, Remote Sens.-Basel, 11, 290, https://doi.org/10.3390/rs11030290, 2019.
Tu, Q., Hase, F., Blumenstock, T., Kivi, R., Heikkinen, P., Sha, M. K., Raffalski, U., Landgraf, J., Lorente, A., Borsdorff, T., Chen, H., Dietrich, F., and Chen, J.: Intercomparison of atmospheric CO2 and CH4 abundances on regional scales in boreal areas using Copernicus Atmosphere Monitoring Service (CAMS) analysis, COllaborative Carbon Column Observing Network (COCCON) spectrometers, and Sentinel-5 Precursor satellite observations, Atmos. Meas. Tech., 13, 4751–4771, https://doi.org/10.5194/amt-13-4751-2020, 2020.
Veefkind, J., Aben, I., McMullan, K., örster, H., de Vries, J., Otter, G., Claas, J., Eskes, H., de Haan, J., Kleipool, Q., van Weele, M., Hasekamp, O., Hoogeveen, R., Landgraf, J., Snel, R., Tol, P., Ingmann, P., Kruizinga, P., Vink, R., Visser, H., and Levelt, P. F.: TROPOMI on the ESA Sentinel-5 Precursor: A GMES mission for global observations of the atmospheric composition for climate, air quality and ozone layer applications, Remote Sens. Environ., 120, 70–83, https://doi.org/10.1016/j.rse.2011.09.027, 2012.
Vogel, F. R., Frey, M., Staufer, J., Hase, F., Broquet, G., Xueref-Remy, I., Chevallier, F., Ciais, P., Sha, M. K., Chelin, P., Jeseck, P., Janssen, C., Té, Y., Groß, J., Blumenstock, T., Tu, Q., and Orphal, J.: XCO2 in an emission hot-spot region: the COCCON Paris campaign 2015, Atmos. Chem. Phys., 19, 3271–3285, https://doi.org/10.5194/acp-19-3271-2019, 2019.
Vogelmann, H., Sussmann, R., Trickl, T., and Reichert, A.: Spatiotemporal variability of water vapor investigated using lidar and FTIR vertical soundings above the Zugspitze, Atmos. Chem. Phys., 15, 3135–3148, https://doi.org/10.5194/acp-15-3135-2015, 2015.
Wunch, D., Toon, G. C., Blavier, J.-F. L., Washenfelder, R. A., Notholt, J., Connor, B. J., Griffith, D. W. T., Sherlock, V., and Wennberg, P. O.: The total carbon column observing network, Philos. T. R. Soc. A, 369, 2087–2112, https://doi.org/10.1098/rsta.2010.0240, 2011.
Wunch, D., Toon, G. C., Sherlock, V., Deutscher, N. M., Liu, C., Feist, D. G., and Wennberg, P. O.: The Total CarbonColumn Observing Network's GGG2014 Data Version, Tech. Rep., California Institute of Technology, Carbon Dioxide In-formation Analysis Center, Oak Ridge National Laboratory, Oak Ridge, Tennessee, USA, https://doi.org/10.14291/tccon.ggg2014.documentation.R0/1221662, 2015.
Wunch, D., Wennberg, P. O., Osterman, G., Fisher, B., Naylor, B., Roehl, C. M., O'Dell, C., Mandrake, L., Viatte, C., Kiel, M., Griffith, D. W. T., Deutscher, N. M., Velazco, V. A., Notholt, J., Warneke, T., Petri, C., De Maziere, M., Sha, M. K., Sussmann, R., Rettinger, M., Pollard, D., Robinson, J., Morino, I., Uchino, O., Hase, F., Blumenstock, T., Feist, D. G., Arnold, S. G., Strong, K., Mendonca, J., Kivi, R., Heikkinen, P., Iraci, L., Podolske, J., Hillyard, P. W., Kawakami, S., Dubey, M. K., Parker, H. A., Sepulveda, E., García, O. E., Te, Y., Jeseck, P., Gunson, M. R., Crisp, D., and Eldering, A.: Comparisons of the Orbiting Carbon Observatory-2 (OCO-2) measurements with TCCON, Atmos. Meas. Tech., 10, 2209–2238, https://doi.org/10.5194/amt-10-2209-2017, 2017.
Wypych, A., Bochenek, B., and Różycki, M.: Atmospheric Moisture Content over Europe and the Northern Atlantic, Atmosphere, 9, 18, https://doi.org/10.3390/atmos9010018, 2018.
- Abstract
- Introduction
- Ground-based and space-borne instrumentation
- Datasets used and coincidence criteria
- Comparison of arctic COCCON XH2O
- Validation of satellite XH2O data using COCCON as the reference
- Summary and conclusions
- Appendix A
- Data availability
- Author contributions
- Competing interests
- Acknowledgements
- Financial support
- Review statement
- References