the Creative Commons Attribution 4.0 License.
the Creative Commons Attribution 4.0 License.
 | 15 Apr 2021
A dedicated robust instrument for water vapor generation at low humidity for use with a laser water isotope analyzer in cold and dry polar regions
Christophe Leroy-Dos Santos
Mathieu Casado
Frédéric Prié
Olivier Jossoud
Erik Kerstel
Morgane Farradèche
Samir Kassi
Elise Fourré
Amaëlle Landais
Obtaining precise continuous measurements of water vapor isotopic composition in dry places (polar or high-altitude regions) is an important challenge. The current limitation is the strong influence of humidity on the measured water isotopic composition by laser spectroscopy instruments for low humidity levels (below 3000 ppmv). This problem is addressed by determining the relationships between humidity and measured δ18O and δD of known water standards. Here, we present the development of a robust field instrument able to generate water vapor, down to 70 ppmv, at very stable humidity levels (average 1σ lower than 10 ppmv). This instrument, operated by a Raspberry interface, can be coupled to a commercial laser spectroscopy instrument. We checked the stability of the system as well as its accuracy when expressing the measured isotopic composition of water vapor on the VSMOW–SLAP (Vienna Standard Mean Ocean Water – Standard Light Antarctic Precipitation) scale. It proved to be highly stable during autonomous operation over more than 1 year at the East Antarctic Concordia and Dumont d'Urville stations.
- Article
(5629 KB) - Full-text XML
- Companion paper
-
Supplement
(555 KB) - BibTeX
- EndNote


The recent development of laser spectroscopy instruments now enables the continuous measurement of the isotopic composition of water vapor at many observation stations all around the world (Bailey et al., 2015; Bastrikov et al., 2014; Schmidt et al., 2010; Sodemann et al., 2017; Tremoy et al., 2011). In particular, the isotopic composition of water vapor has proven to be a very useful tool to document moist synoptic events at many locations (Bonne et al., 2014; Guilpart et al., 2017). In polar regions, the water vapor isotopic signal is not only useful for detecting the origin of moist air (Bréant et al., 2019; Kopec et al., 2014) but also for improving the interpretation of the isotopic composition of water in surface snow and ice core archives (Steen-Larsen et al., 2014). Indeed, exchanges occur after deposition between the surface snow and the water vapor, leading to modifications to the isotopic composition of the former and, hence, of the archived ice (Casado et al., 2016, 2018; Ritter et al., 2016).
Obtaining continuous and accurate measurements of the water vapor isotopic composition expressed on the VSMOW–SLAP (Vienna Standard Mean Ocean Water – Standard Light Antarctic Precipitation) scale measurements of the water vapor isotopic composition at Concordia station in central Antarctica is a key scientific challenge, as the deep ice core drilled there, EPICA Dome C, provides the oldest continuous water isotopic record expressed on the VSMOW–SLAP scale to date (Jouzel et al., 2007). Thus,it is a key reference for the study of past climate, and a correct interpretation of the isotopic record relies on the quantification of the transfer function between climate parameters and water isotopic composition in ice, which is itself influenced by exchanges with water vapor in the upper layers of the firn (Casado et al., 2018). Such knowledge is also of the uttermost importance for the interpretation of water isotope records from the new deep drilling project “Beyond EPICA – Oldest Ice” (https://www.beyondepica.eu/en/, last access: 5 April 2021), the aim of which is to drill a 1.5 million-year-old ice core at the Little Dome C site located 40 km from Concordia station and, hence, with similar low temperature and humidity conditions.
One of the main limitations of the current commercial instruments when deployed in polar regions is their relatively poor performance at low water vapor concentration. Generally, the precision of the measured isotopic ratios, δ18O and δD, rapidly worsens when the water mixing ratio decreases to humidity levels below 3000–5000 ppmv (parts per million by volume) (Bonne et al., 2014; Weng et al., 2020). However, in remote continental areas in Greenland and Antarctica, temperatures in winter can drop to very low values, leading to humidity levels down to 10 ppmv (Genthon et al., 2017). Arguably one of the most extreme experiments for continuous measurement of the water vapor isotopic composition was the deployment of a commercial Picarro L2130-i instrument at the East Antarctic French–Italian station of Concordia where the mean annual temperature is around −54 ∘C and the humidity barely exceeds 1000 ppmv during the warmest summer days (Casado et al., 2016). For such applications, there are two major impacts of low humidity on the raw isotopic signal: first, we generally observe an apparent increase in δ18O and δD with decreasing humidity level; second, the standard deviation associated with the continuous measurements of δ18O and δD of the water vapor increases. This can lead to overall uncertainties of several per mil for δ18O and tens of per mil for δD. Therefore, it is of uttermost importance to have a correct determination of the humidity dependency of the water vapor isotopic ratios.
Commercial instruments from Picarro Inc. are usually associated with a Picarro standards delivery module (SDM) designed to generate humidity at stable levels between 5000 and 30 000 ppmv. Using such a setup for humidity levels below 5000 ppmv leads to large uncertainties in the determination of the humidity influence on the water vapor isotopic composition (e.g., Guilpart et al., 2017). These uncertainties are due both to the instability of the water vapor generation using the SDM (in terms of water concentration – humidity – and/or isotopic composition) and to the analytical noise in the spectroscopy measurements when the absorption signals are weak. An alternative commercial device is the LGR (Los Gatos Research) calibration system (Water Vapor Isotope Standard Source, WVISS), which uses a nebulizer to instantaneously evaporate microdroplets of liquid water from a standard reservoir into a large (1 L) vaporizing chamber (Dong and Baer, 2010). This system is very stable and well adapted for a humidity range between 2500 and 25 000 ppmv (Aemisegger et al., 2012).
Several homemade water vapor injection systems have been developed with the specific aim of achieving better generated humidity stability at low humidity levels. A first approach is to use a dew point generator that injects small amounts of water into dry air (Lee et al., 2005; Wang et al., 2009). This approach is time-consuming, as it takes a long time to reach equilibrium and relies on a very precise knowledge of the temperature to quantify the isotopic fractionation. A method using a piezoelectric microdroplet generator into a dry-air stream could generate water mixing ratios between 12 and 3500 ppmv (Iannone et al., 2009; Sturm and Knohl, 2009; Sayres et al., 2009). However, adjustment of the humidity level and long-term stability are difficult to obtain with such devices. Systems relying on the use of syringe pumps have also been built by Gkinis et al. (2010) and Tremoy et al. (2011): a small fraction of the input stream of liquid water is introduced into a hot oven where water is vaporized in the presence of a dry-air flow. These systems cover a humidity range between 2000 and 30 000 ppmv. Finally, bubbler systems, in which dry air flows through a large volume of water to create saturated vapor, are very robust but can only produce water vapor at high humidity levels (Ellehoj et al., 2013). The aforementioned devices are unfortunately not well suited for automatic long-term operation at low humidity levels. During the 2014–2015 summer field season at Concordia station in Antarctica, a homemade humidity generator specifically designed for low humidity levels (Landsberg, 2014) was deployed (Casado et al., 2016). The device used dual high-precision, low-volume, syringe pumps to generate stable humidity levels at two different isotopic compositions over the range from 100 to 800 ppmv (Casado et al., 2016). Unfortunately, we observed quite a large scattering among the isotopic values measured at similar humidity levels as well as a large discrepancy between the humidity dependency of the water isotopic ratios measured in the field and that measured in the laboratory. Upon return to the laboratory, these defaults were traced primarily to tiny leaks in the water supply lines to the syringes.
Therefore, we reengineered the prototype by Landsberg (2014) in order to develop a robust and autonomous device for stable low-level humidity generation for the purpose of precise humidity calibration of spectroscopic instruments. Such devices have now been operating with minimum manual intervention for more than 1 year at two polar stations in Antarctica, Dumont d'Urville and Concordia, coupled to Picarro laser spectroscopy instruments. Here, we detail the technical description of the instrument and show key performance characteristics, enabling, for instance, a discussion of small-amplitude signals such as the diurnal variability of the water vapor isotopic composition in remote dry sites in East Antarctica.
The low humidity level generator (LHLG) developed here relies on the same principle as the one developed by Landsberg (2014), i.e., a steady, undersaturated evaporation of a liquid water droplet at the tip of a needle into a dry-air stream inside a small evaporation chamber. Based on this first prototype, the instrument has been remodeled including a specific hardware and software design.
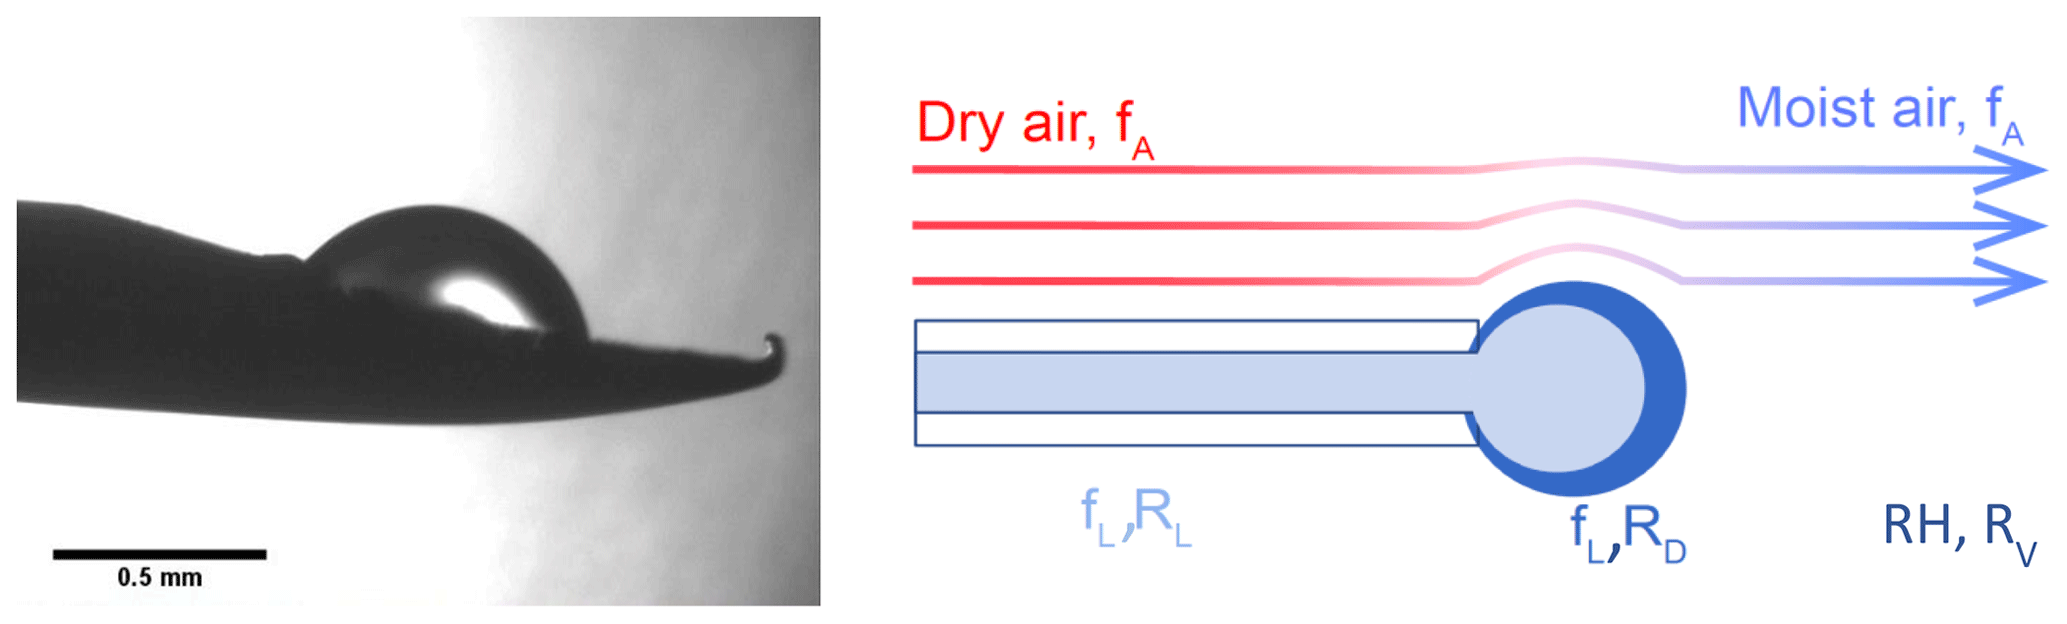
Figure 1Evaporation of a droplet in the humidity generator chamber: the left panel shows a picture from the prototype from Landsberg (2014), and the right panel displays schematics of the water molecules being transferred to the air flow (Casado, 2016).
2.1 Physical principle
The LHLG is based on the undersaturated evaporation of a small droplet at the tip of a needle (Fig. 1). Liquid water is pushed through a needle around which dry air is flowing. Dry air is obtained from a bottle of high-purity synthetic air with pressure regulation through two manometers connected in series. The mass flux of water (fL) is kept low compared with the air mass flow (fA) so that the relative humidity (RH) of the downstream moist air flow remains low (RH < 0.1). Therefore, the air stays largely undersaturated, and its humidity is controlled only by the flow of liquid water in the needle and that of the dry air upstream of it. The mixing ratio (or humidity) of the air as classically provided by a Picarro instrument is given by
where kg m−3 is the density of water, R=8.314 J mol−1 K−1 is the universal gas constant, Tst=293.15 K and Pst=1013.25 hPa are standard conditions of temperature and pressure, and kg mol−1.

Figure 2Humidity generator schematic diagram (see Table S1 in the Supplement for details on the different elements).
Physically, when the flux of water or air is changed, there is first a transient regime during which the radius of the droplet changes, modifying the evaporative surface and, therefore, the humidity of the outgoing air. Once a stationary regime is reached, the radius of the droplet is stabilized and the humidity is given by Eq. (1). In this regime, there is no accumulation of water molecules in the system; therefore the isotopic composition of the vapor produced is equal to the isotopic composition of the liquid water injected in the needle: RV=RL (note that because of the fractionation during the transition phase, the isotopic composition of the droplet RD is different from RL and RV; see Kerstel, 2020). When changing the flux of evaporating water, we modify the size of the evaporating surface and, therefore, the radius of the drop. The evolution of the radius of the drop can be obtained from the resolution of a nonlinear differential equation of the volume (V) of the drop:
where is the evaporation flux depending on ke (the evaporation rate) and S (the surface area of the drop exposed to the dry air). A good approximation is to consider the shape of the drop as a fraction of a sphere of variable radius intercepted by the surface of a disk of constant radius (the syringe tip). By numerically solving differential Eq. (2), it is possible to faithfully simulate the behavior of the device under changing conditions (Kerstel, 2020). This numerical approach validates the theoretical explanation of the undersaturated evaporation of the droplet. Importantly, it is noted that in steady state, as is the case for our application, the isotopic composition of the generated humid air is identical to that of the injected water stream and, therefore, does not depend on the infusion rate nor the specific humidity.
2.2 Instrument conception
2.2.1 Technical realization
As the LHLG relies on operating in a stationary regime, it is important that the dry-air input and the water input are steady. Thus, the air and water fluxes as well as the air pressure in the evaporation chamber are controlled by electronic PID (proportional–integral–derivative) regulators. Temperature intervenes through its effect on fractionation and the evaporation rate (apart from a negligible effect on the flow controller stability), which could lead to a departure from steady-state operation. For these reasons, the temperature of the evaporation chambers was maintained at 20 ∘C (within 1 ∘C over 24 h).
The dry-air flux is regulated by a high-precision mass flow controller (Vögtlin GSC-A9TS-DD22), which has an operating range from 6 to 600 sccm (standard cubic centimeters; SD cm3 min−1) and an accuracy of 3.3 sccm. The water flux is regulated by a high-precision syringe pump (Harvard Apparatus Pump 11 Pico Plus Elite Dual), which can produce a water flow down to 10.8 pL min−1 with an accuracy of 0.35 % using syringes with a volume ranging from 10 to 250 µL. We operate in the routine mode with a dry-air flow of 300 sccm and a water flow between 0.02 and 0.5 µL min−1 using mainly 50 or 100 µL syringes. The syringe pump is equipped with two syringes that provide two water flows into two evaporation chambers in parallel (Fig. 2). Each syringe is connected to a water reservoir and to an evaporation chamber by a double three-way liquid valve (Rheodyne MXX777603) switching from an “infuse” mode to a “withdraw” mode to refill the syringes. The water in the water reservoirs is sampled every month to check its isotopic composition and is renewed when the level of water is below half the maximum level. A maximum evolution of the isotopic composition of the lab standard filling the water reservoirs has been observed as 0.05 ‰ and 0.5 ‰, respectively, for δ18O and δD over a 2-month period.
A major change to the instrument designed by Landsberg (2014) is the introduction of the double three-way valve with leak-tight connections and an internal volume of 1.9 µL. This modification is an important improvement as it enables automatic handling of the lab standards from a reservoir to the evaporation chamber with a robust connection, avoiding in particular potential air bubbles in the water flow. Indeed, the compressibility of air bubbles trapped in the water flow can lead to flow irregularities via the amplification of small nonlinearities in the progression of the syringe plunger. This would lead to non-steady-state operation, which, in turn, would create artifacts in the humidity and isotopic composition, reducing the performance of the calibration device (see Kerstel, 2020). In addition, the three-way valve provides the opportunity for a “withdrawn” mode in which the syringes draw lab-standard water from a reservoir. When equipped with 100 µL syringes, the instrument can operate for several hours up to 1 day between refills. With the addition of the auto-refill option and the effective suppression of bubbles, the instrument can be used unattended for many months, as required for an Antarctic winter field campaign.
The evaporation chambers are stainless-steel cylinders equipped with specific connectors (Swagelok Ultra-Torr SS-4CD-TW-25) holding silicon rubber septa through which needles are inserted toward the middle of the chamber. The pressure in both chambers is regulated by a pressure controller (Bronkhorst P-702CV-1K1A-AAD-22-V) with a precision of 3 mbar in a range from 0 to 1000 mbar. This pressurization of the two chambers combined with the relatively high flow (higher than required by the infrared spectrometers) enables a steady state to be maintained irrespective of whether or not the infrared spectrometer is connected and also increases the time efficiency of calibration procedures. The spectrometer is not sensitive to the inlet pressure, and the precision of the pressure controller is not an essential aspect. On the contrary, the precision of the flow controller is key for the precision of the humidity level produced by the instrument: it is 1 % for the air flow, which is comparable to the precision of the measurement of the humidity level with the optical spectrometer. When the instrument is connected to the infrared spectrometer, the excess humid air flow is exhausted to the room through the pressure pump, and the spectrometer only pumps what is required (Fig. 2).
The control of the instrument is ensured by a Raspberry Pi that can be interfaced to a Picarro water analyzer (L2130-i in our case) in sequencer mode (see below). The hardware was designed to meet the specifications dictated by field conditions: (1) all components are fixed in a transportable case (except the dry-air bottle), isolated from vibration by an anti-vibration foam; (2) a panel of connectors (e.g., HDMI, USB and Ethernet) ensures the accessibility to the instrument when it is closed; (3) the electrical and electronic parts (e.g., power supply and Raspberry Pi) are separated from the rest of the instrument (e.g., sensors and gauges). Both the electrical and electronic parts are fully and easily accessible in case of failure.
2.2.2 Software details
The control software has been developed using open-source Python libraries and homemade drivers, including a user interface displaying the state of relevant components and the value of the different sensors. The software (HumGen) can be downloaded online (https://github.com/ojsd/humgen, last access: 4 April 2021; https://zenodo.org/record/4003465#.YF82sz8o-Uk, last access: 4 April 2021).
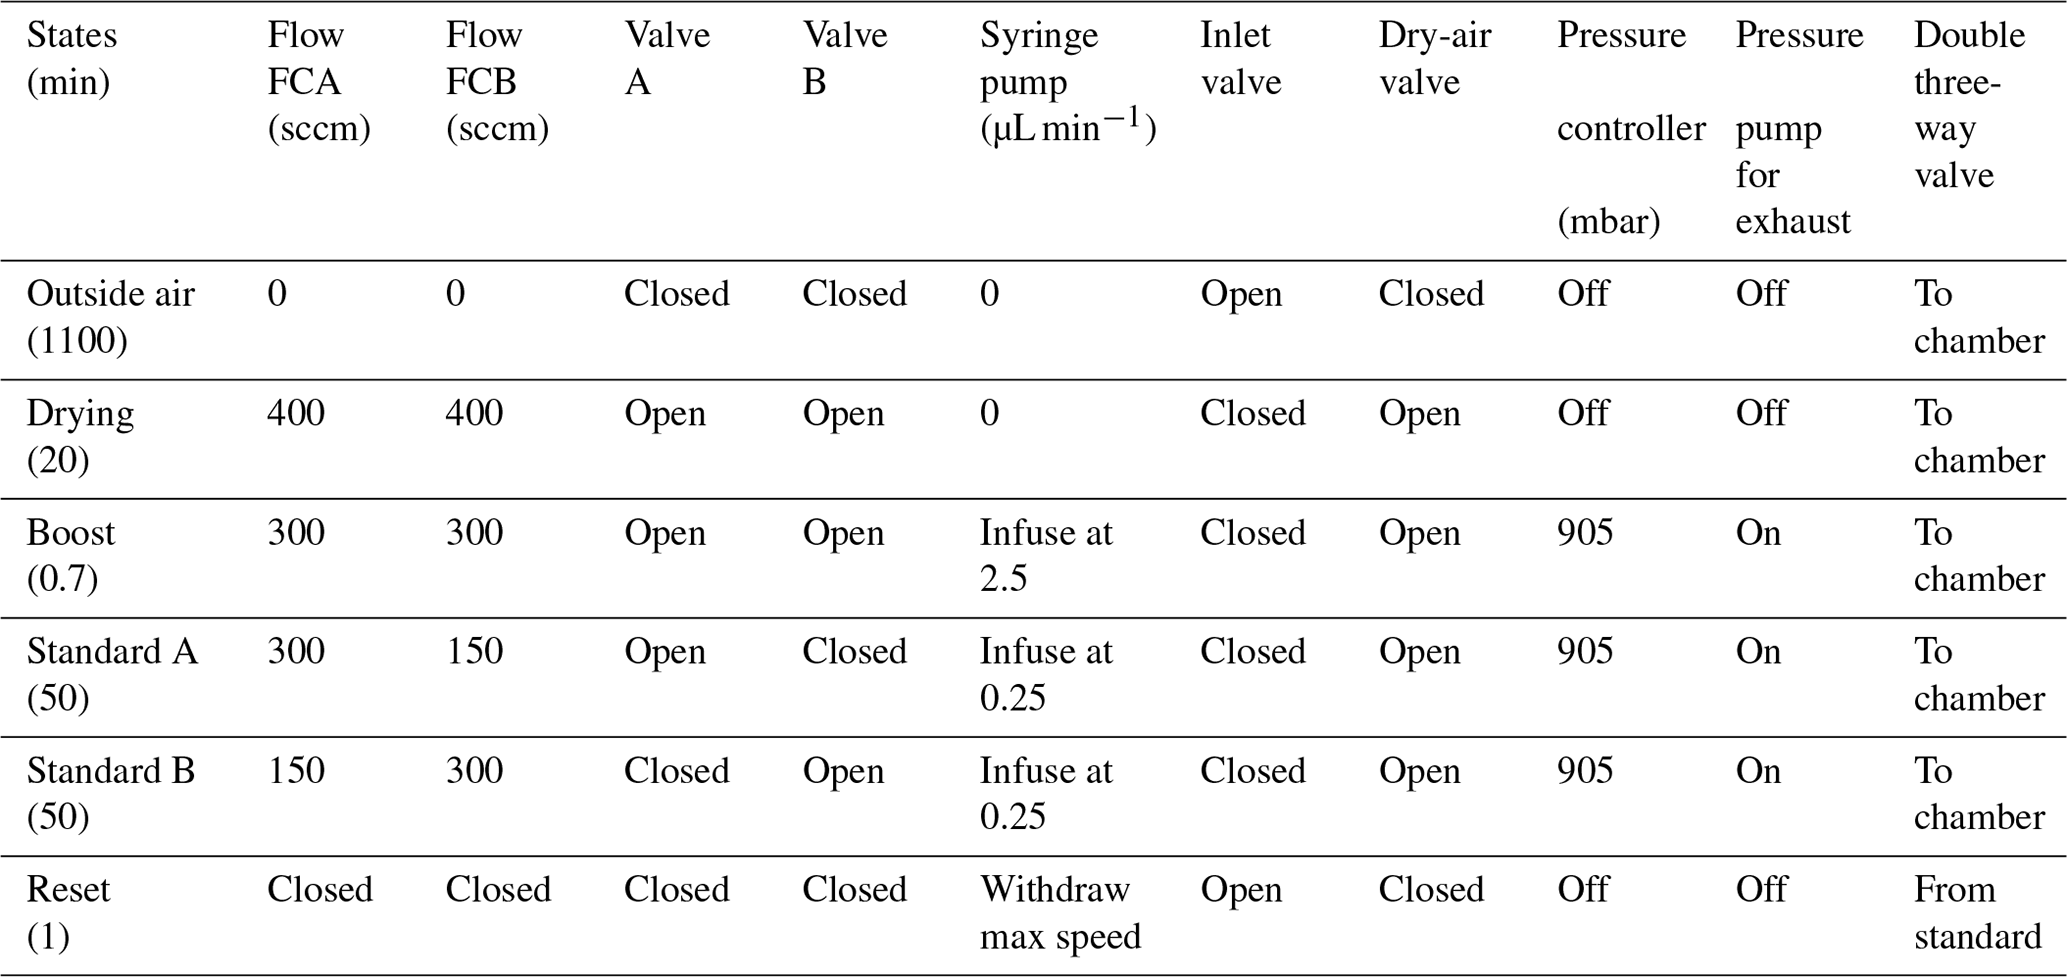
The LHLG can operate in eight different states, with each state representing a specific setup for each element (valve position, syringe pump infusion rate, dry-air flow rate and pressure). These eight states can be divided into three categories: a routine mode, an expert mode and a humidity-isotopes calibration mode. The simple mode is composed of six predefined states referring to the classic isotopic calibration in everyday routine operation (Table 1): (1) measurement of the outside air water vapor isotopic composition; (2) drying of the cavities; (3) “humidity boost”, in order to more quickly reach the desired humidity level in the cavities; (4) injection of Standard A in the corresponding evaporation chamber at a set humidity level; (5) injection of Standard B in the corresponding evaporation chamber; (6) refill of the syringes. The expert mode is useful to adjust each parameter manually: flow rates on controllers FCA and FCB, opening of electrovalves A and B, mode (infuse or withdraw) and infused rate for the syringe pump, pressure regulation, state of the double three-way valve, activation of the pressure pump at the exhaust, and opening of external electrovalves from the dry-air tank and to the inlet (Fig. 2). The humidity-isotopes calibration mode produces a scale of increasing humidity steps in the evaporation chambers (e.g., from 100 to 1000 ppmv, through steps of 100 ppmv for 50 min for each standard). The details of the sequence (standard type, humidity level and duration of each step) is defined in a text file by the operator from the Raspberry interface, with the Raspberry itself being connected to Ethernet for remote access.
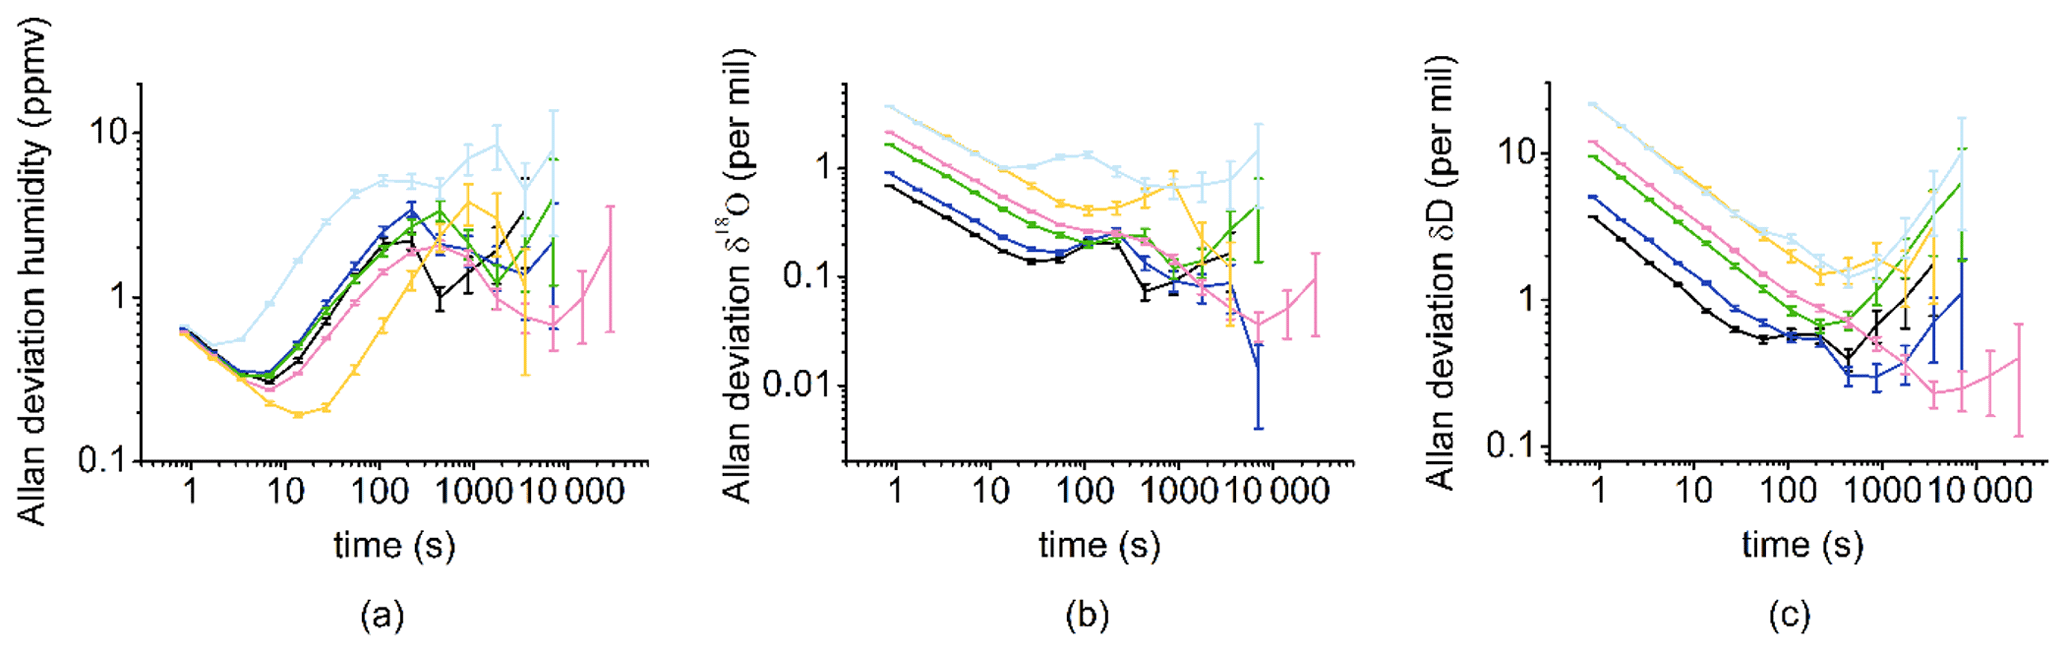
Figure 3Allan deviation over 4 h for different humidity levels (black, 1080 ppmv; dark blue, 770 ppmv; green, 400 ppmv; pink, 320 ppmv; yellow and light blue, 170 ppmv) for humidity (a), δ18O (b) and δD (c).
The Picarro L2130-i analyzer has an external valve sequencer, which is able to turn up to six electrovalves on or off and create loop sequences with defined durations for each step of the sequence. This tool can be diverted from its original purpose by using it as a six-digit code: each of the humidity generator states is associated with a code. When the Picarro valve sequencer matches one of the state codes, this state is triggered on the humidity generator. This eases both the operator's activities and the data post-treatment, because the current valve status – thus the calibration instrument state – is saved in the analyzer output data file, in the “ValveMask” column. The Raspberry inside the LHLG reads the valve sequencer state code using the Picarro's remote control interface (a RS232 serial connection through one of the rear-facing DB9 connectors).
Table 1Typical routine sequence of measurements and calibration for two standards A and B at 1000 ppmv for a measurement site located at sea level. No mixing occurs between standards A and B during steps “Standard A” and “Standard B” (see Supplement). Note that the humidity-isotopes mode and the expert mode can also be included in the valve sequencer but are not used in a daily calibration routine.
A set of tools has been developed to quickly check daily calibration. In the field, analyzer and LHLG data are archived daily and sent to the laboratory, i.e., at Laboratoire des Sciences du Climat et de l'Environnement (LSCE), Gif-sur-Yvette. They are checked semiautomatically once a week to warn maintenance personnel in the event of a malfunction.
The stability of the instrument has been tested over a large range of parameters. We show an example in Table 2. We modified the air flow associated with Standard A (the same results can be obtained with Standard B) between 200 and 400 sccm with an air flow on channel B of half the value of channel A. The infusion rate was varied between 0.03 and 0.14 µL min−1 in order to produce humidity levels of 400 and 800 ppmv. The 1σ standard deviations observed over 10 min plateaus are comparable to the standard deviation obtained when the air flow is set to 300 sccm.
Table 2Evolution and stability of humidity and δ18O (same water used for the different tests) for different syringe infusion rates and dry-air flows.

For routine measurement, the air flow and infusion rate have been adjusted to optimize the stability of the generated vapor while minimizing the dry-air consumption. Thus, the LHLG is able to generate stable levels of humidity (drift lower than 20 ppmv over 1 h and 1σ below 10 ppmv over 10 min) from 70 to 2400 ppmv following the optimal set points shown in Table 3.
Table 3Set points for the water infusion rate and dry-air flow at a temperature of 20 ∘C.
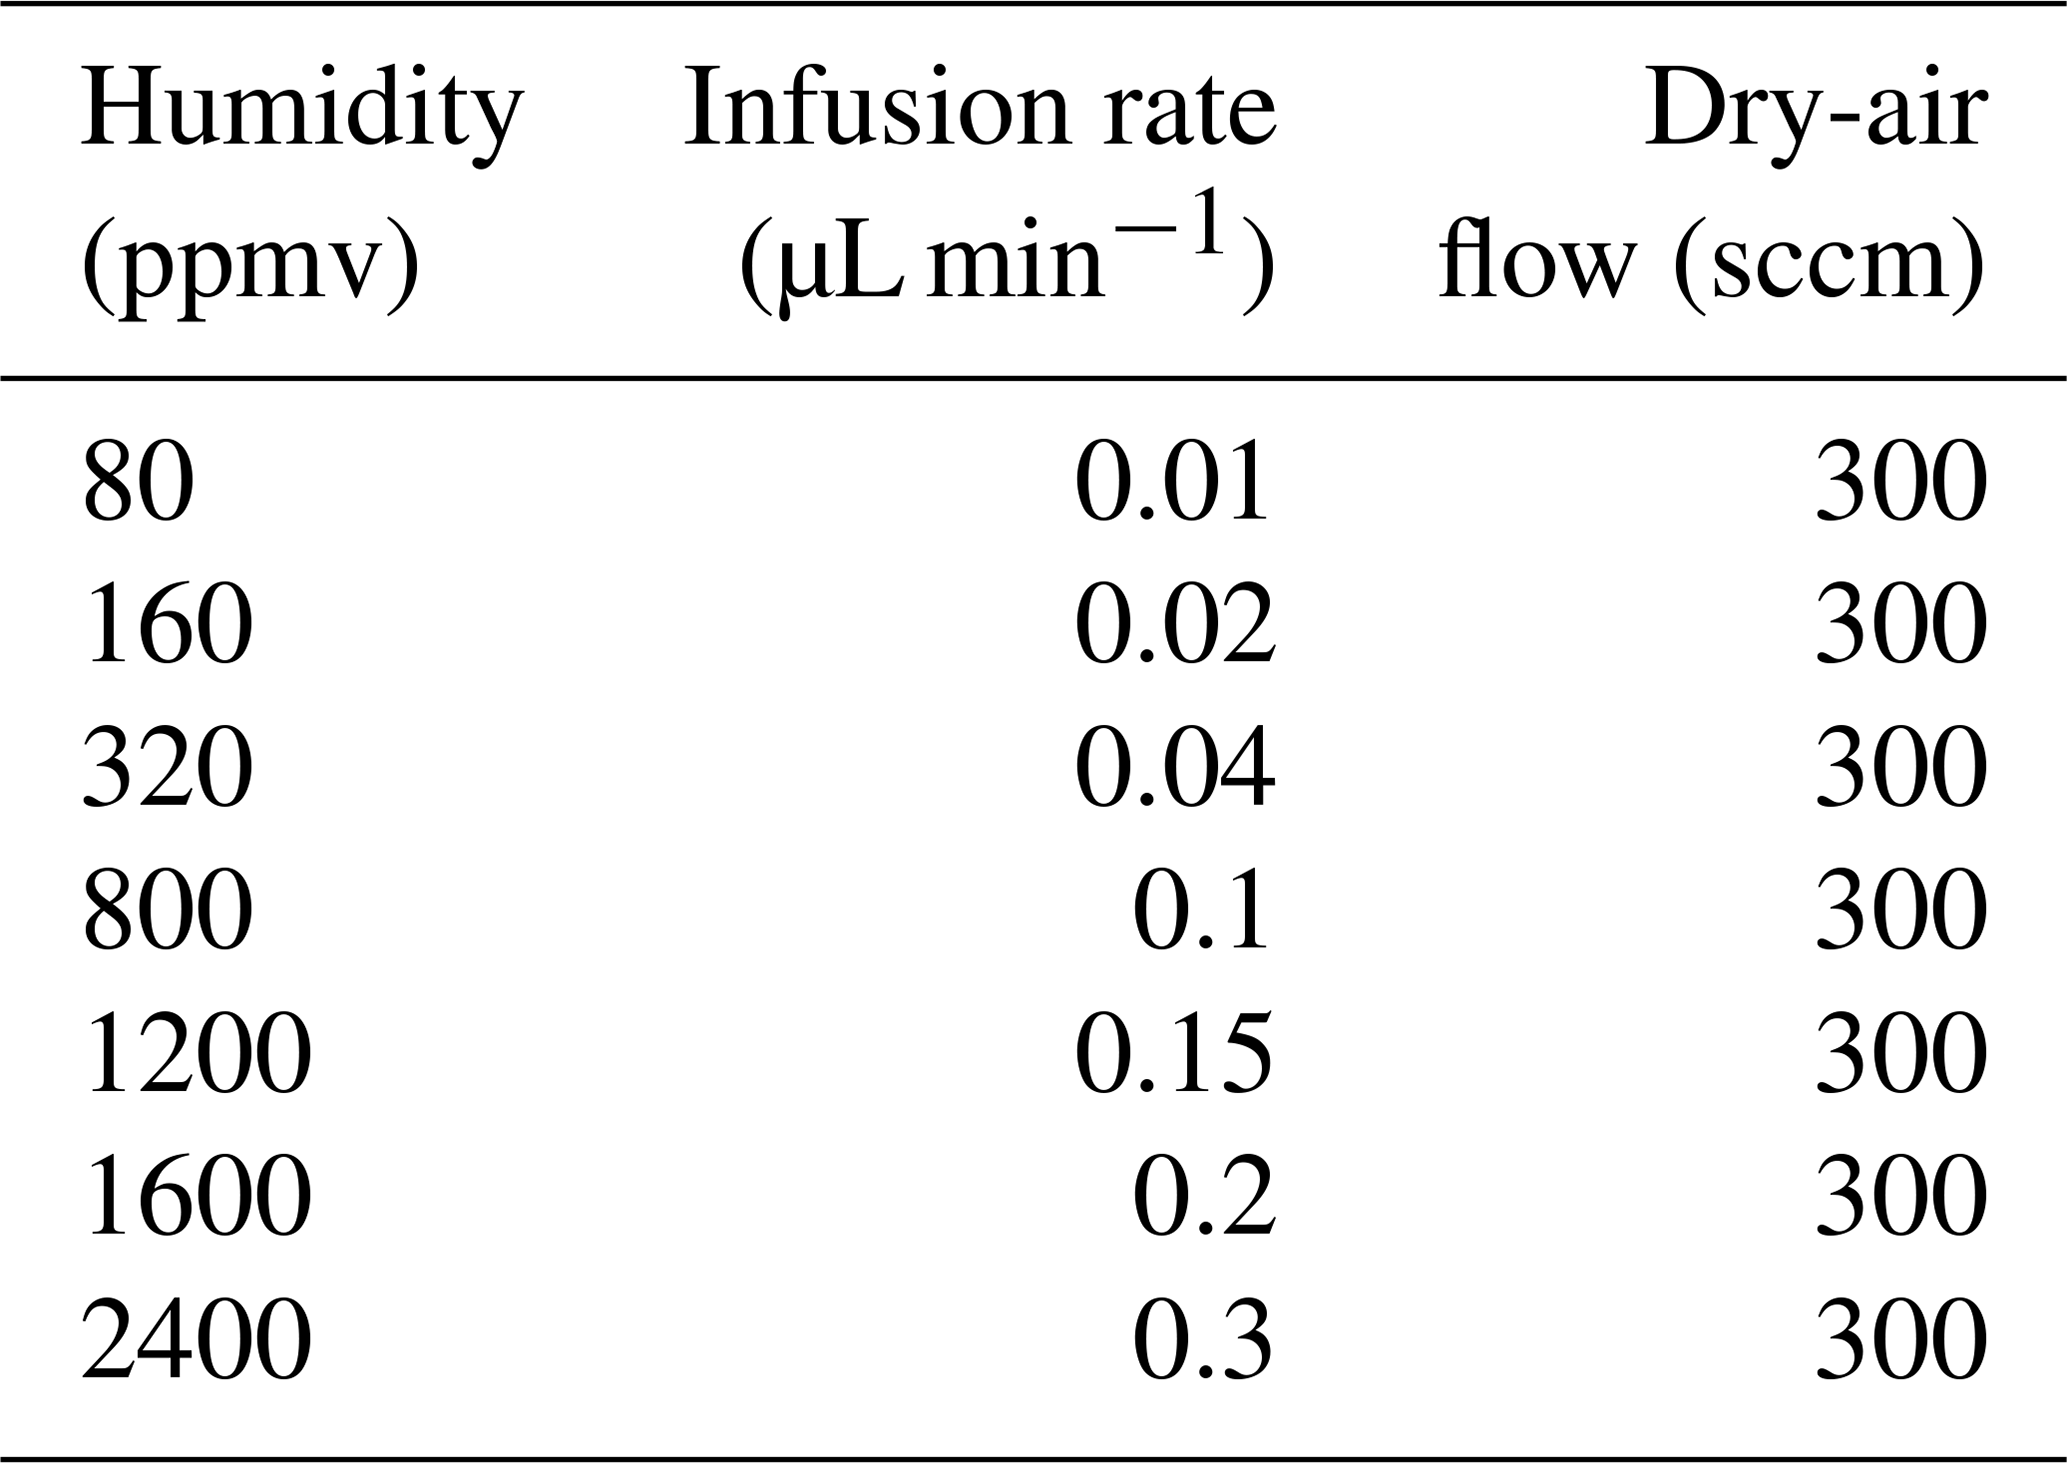
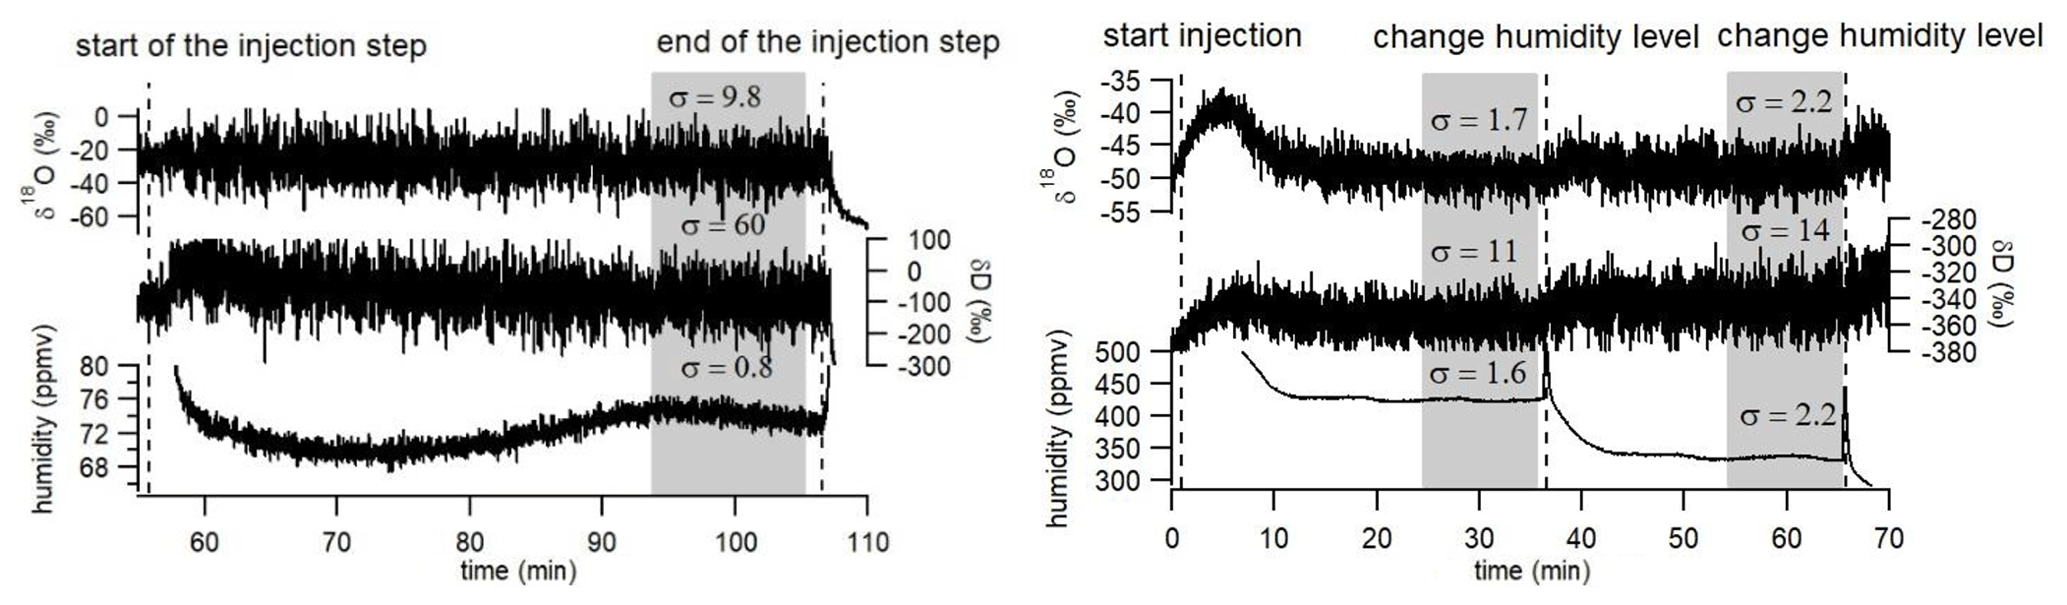
Figure 4Records of δ18O, δD and humidity over three humidity plateaus (72 ppmv on the left, 425 and 335 ppmv on the right) obtained with the LHLG. The gray rectangles indicate the period (10 min) over which the average values are kept for calibrating the data generated by the L2130-i analyzer.
3.1 No fractionation during water vaporization in the cavity
We checked that there was no fractionation of the water during its transfer from the bottles to the syringe pump and then from the syringe to the moist air generated in the vaporization chamber through the following tests.
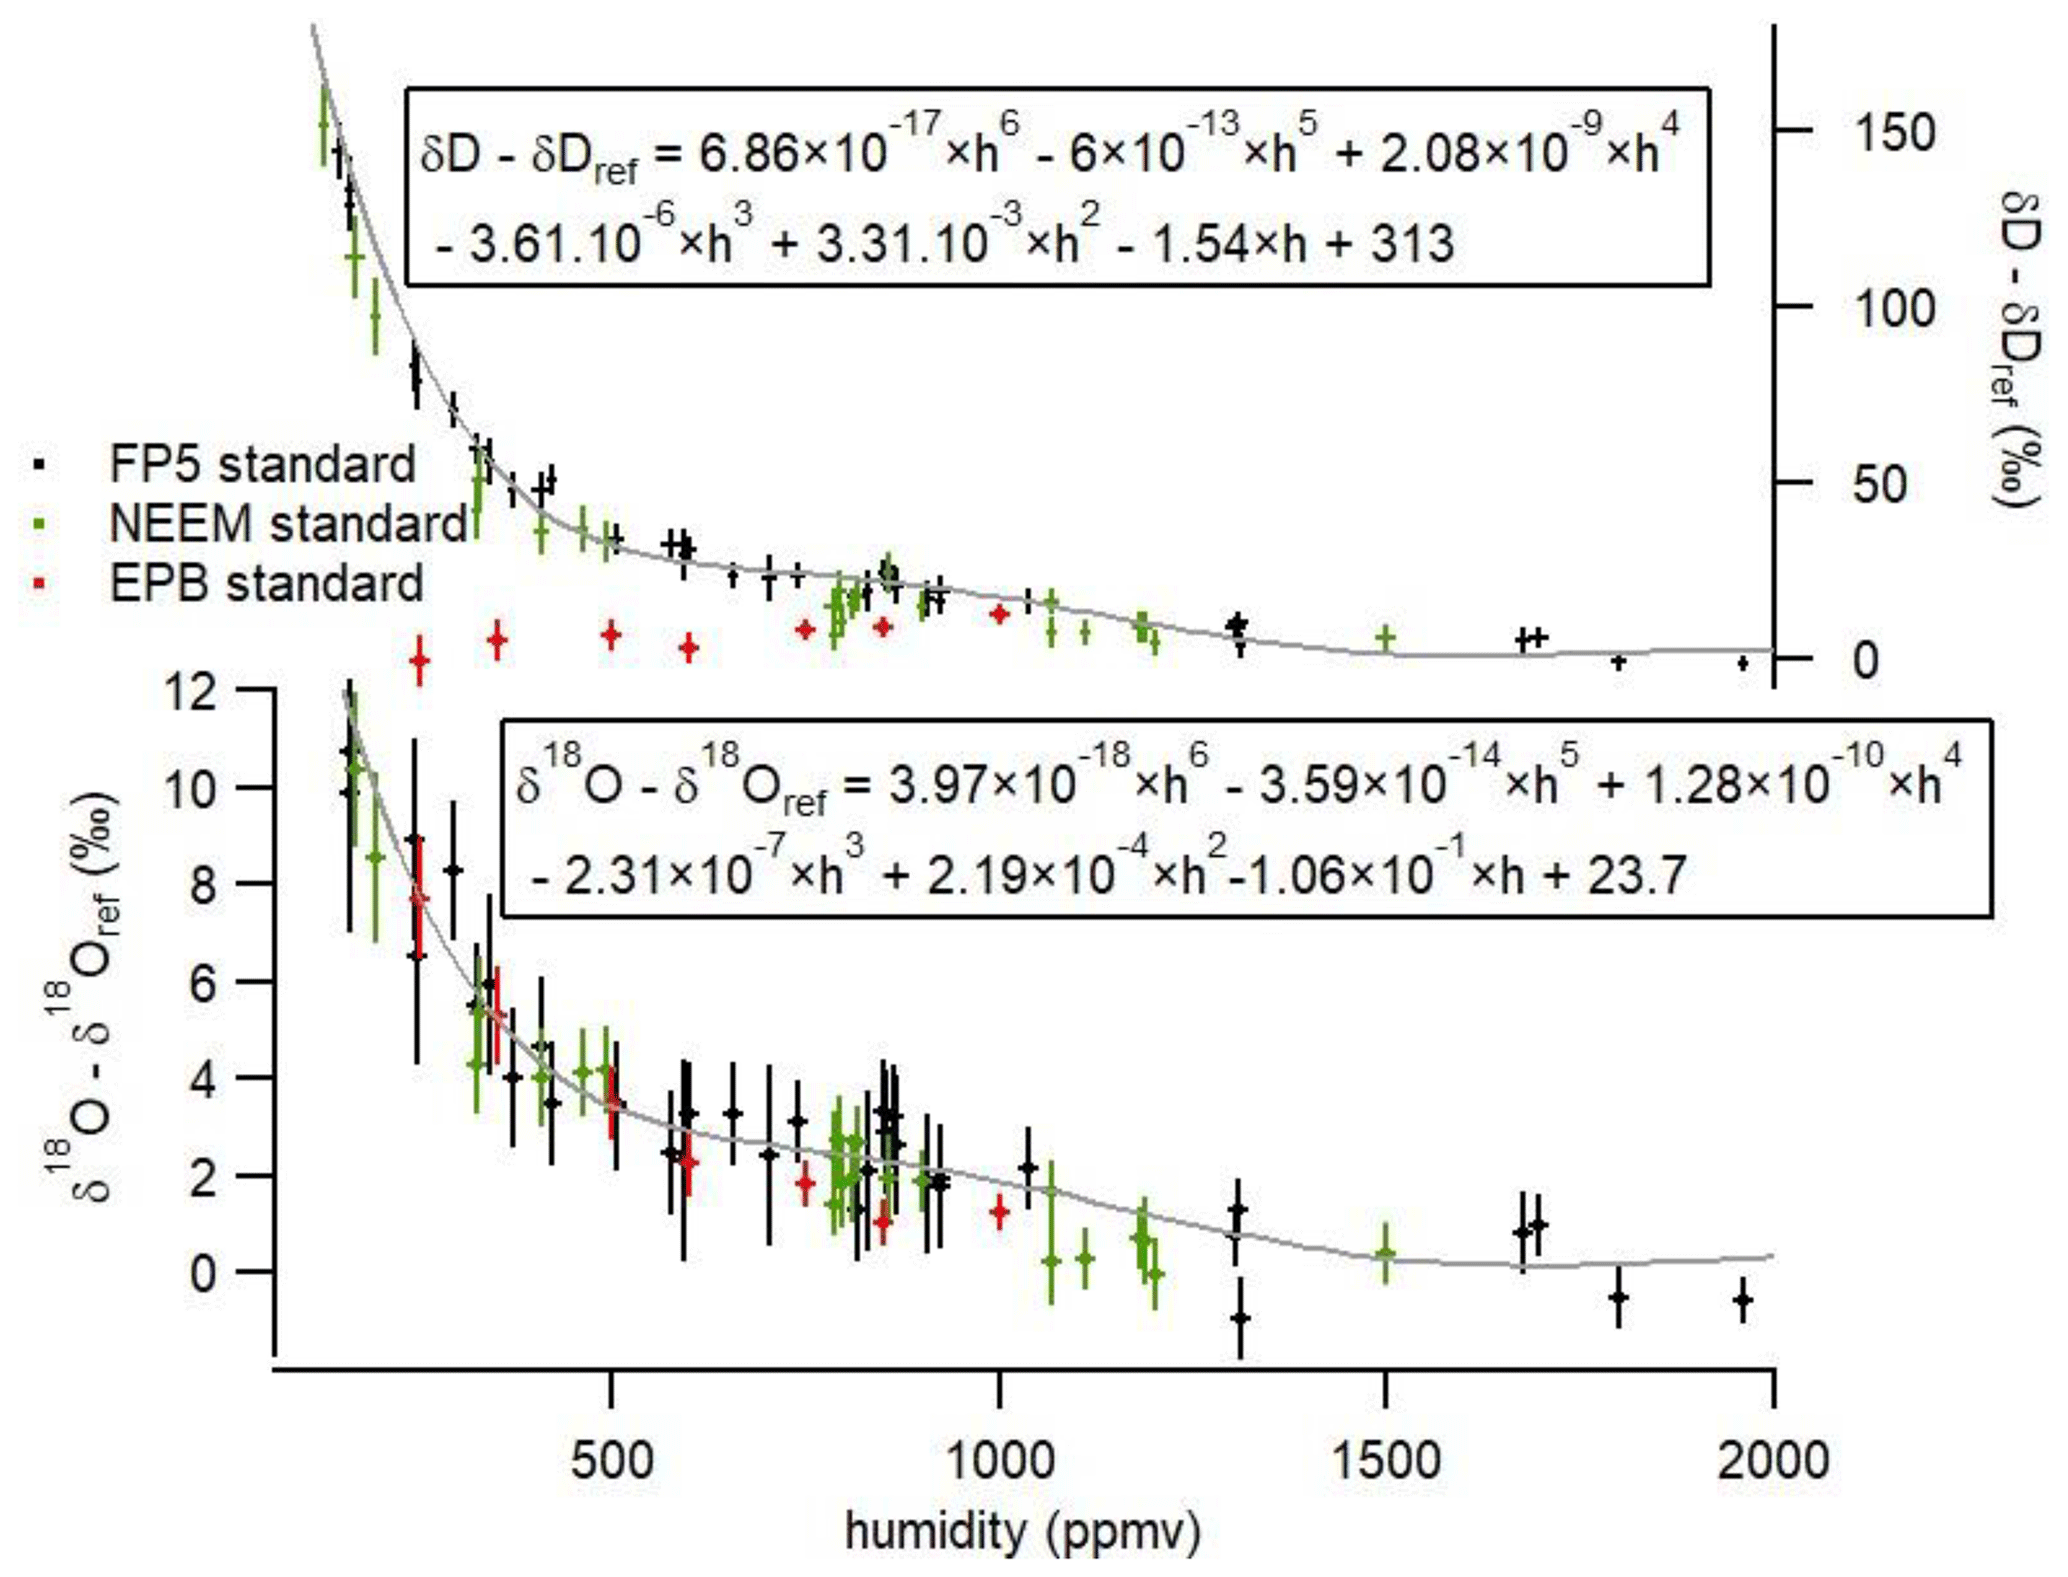
Figure 5Influence of humidity on the isotopic composition (δ18O and δD) of the vapor obtained with the LHLG with three water lab standards. The error bars are calculated as the standard deviation (1σ) over the generated values by the L2130-i instrument during 10 min at 1 s resolution (i.e., without any pre-averaging of the raw data series). The δ18O and δDref are the values of the injected water standards at 2000 ppmv. The gray lines represent the polynomial fits for the influence of humidity on the water isotopic composition (Eqs. 4 and 5 are also given on the graph).
First, the isotopic compositions of three different lab standards calibrated against VSMOW at LSCE (H2O–CO2 equilibration followed by isotope ratio mass spectrometry for δ18O; cavity ring-down spectroscopy for δD; calibrated every 3 years using VSMOW and SLAP provided by the International Atomic Energy Agency) were compared, after their generation by the present LHLG and by the commercial SDM, both at a humidity of 2000 ppmv over 50 min time spans. The measured δ18O and δD values agreed to within 0.5 ‰ and 2 ‰, respectively, for the three lab-standard waters calibrated against VSMOW: EPB (δ18O = −6.24 ‰; δD = −43.6 ‰), NEEM (δ18O = −33.50 ‰; δD = −257.2 ‰) and FP5 (δ18O = −48.33 ‰; δD = −383.5 ‰). Second, the measured isotopic composition of the same standard (FP5) generated at different humidity levels between 1000 and 2400 ppmv by the SDM and the LHLG show the same δ18O (δD) evolution with humidity within the respective uncertainties (Fig. S1 in the Supplement).
3.2 Stability of the water vapor delivery and associated water isotopic composition
A proper approach to quantify the stability of our system is to use the Allan variance, which is defined as
where yn are the successive measurements over a period t.
An Allan variance plot as a function of averaging time is indeed useful to determine the optimal time over which the sample humidity and the isotopic composition should be averaged to obtain a precise determination (low standard deviation) and avoid drift. Figure 3 displays the Allan deviation (square root of the Allan variance) in δ18O, δD and humidity obtained by running a long plateau of Standard A or Standard B in the “infuse” mode over 4 h for different humidity levels. The humidity variance always stays below 10 ppmv over the 4 h test, and the δ18O and δD Allan deviations display minimum values below 1 ‰ and 7 ‰, respectively. The minimum value for the δ18O and δD Allan deviation is generally obtained for about 15 min of measurement. While the Allan deviation of δ18O and δD is dependent on the analyzer used, we observe that the Allan deviation at 1000 s (17 min) for δ18O and δD also depends to some extent on the humidity level: the lowest levels are obtained for humidity levels of 770–1080 ppmv, and the highest levels are obtained for humidity level of 170 ppmv.
In the routine mode (Fig. 4), we perform plateaus of 30 to 50 min (50 min when the instrument is unattended as the time to reach the plateau varies between a few minutes and 30 min). We then select the last 10 min before the following switch of the instrument to measure the average level of humidity and the isotopic ratios, δ18O and δD. We also calculate the associated standard deviations and reject the values if the humidity standard deviation exceeds 30 ppmv over these last 10 min. In Fig. 4, one observes that the standard deviations for humidities generated in the routine mode are actually much lower. The corresponding standard deviations for the isotopic ratios (δ18O and δD; see values indicated in Fig. 4) increase with decreasing humidity, reflecting the decrease in the molecular absorption signal recorded by the L2130-i laser analyzers. This has an obvious impact on the determination of the relationship between humidity and water vapor isotopic composition.
The performance of the present LHLG can be compared to the performance of the SDM (see Supplement Figs. S1 and S2). First, as seen in Fig. S2, a comparison has been performed at a humidity level of 800 ppmv, for which we have numerous daily calibrations performed with a SDM from a 4.5-year field deployment in Svalbard (Leroy-Dos Santos et al., 2020). The best SDM performance displays a standard deviation 1σ of 31 ppmv, which is significantly worse than the performance of the LHLG (standard deviation 1σ lower than 10 ppmv on average and down to 2 ppmv for 30 % of the generated humidity plateaus). Second, as seen from Fig. S1, while we measure the same influence of humidity on measured δ18O and δD either with the SDM or with the LHLG, the 1σ values on humidity levels are much larger for the SDM than for the LHLG.
3.3 Determination of the influence of humidity on water vapor isotopic composition
Contrary to the commercial SDM, which hardly produces stable and reproducible humidity levels below 500 ppmv, the LHLG was able to produce stable 10 min humidity plateaus daily over the range from 70 to 2400 ppmv with an associated standard deviation of the order of 10 ppmv over more than 1 year at the Concordia and Dumont d'Urville stations (installation in December 2018). The stability of the LHLG allows a robust quantification of the L2130-i analyzer drift thanks to a daily measurement of the same water isotopic standard reference (see Table S2 which shows no measurable drift over a 3-week period). It also permits the characterization of the measurement nonlinearities observed at low humidity (Fig. 5). The more than 1-year-long Concordia and Dumont d'Urville datasets showed that the humidity dependence of δ18O and δD did not vary measurably. The uncertainty of the obtained calibration curve can be attributed entirely to the L2130-i δ18O and δD measurements. In other words, the uncertainty bars on the horizontal (x) axis in Fig. 5, associated with the LHLG, are negligible.
Our data show a result already observed in Weng et al. (2020): while the dependency of δ18O and δD on humidity is similar for low δ18O and δD lab standards (NEEM and FP5), we observe a different behavior for the δD vs. humidity relationship for the high δ18O and δD lab standard (EPB). This result strengthens the recommendation of Weng et al. (2020) to use two water standards in the range of the measured water vapor isotopic composition to best calibrate our final data. In our case, our applications were in Antarctica; thus, we used our two lowest lab standards (NEEM and FP5). For the two standards and for this particular Picarro L2130-i (results are expected to depend on the instrument), the same dependency of isotopic composition vs. humidity is observed. We express this dependency as the relationship between the difference in δD or δ18O between the measured value at the given humidity and the value of the same standard measured at a humidity of 2000 ppmv. The experimental data for NEEM and FP5 from Fig. 5 are fitted through polynomial functions with respect to humidity h (in ppmv):
These curves are valid only for a given Picarro analyzer and for humidity higher than 70 ppmv and lower than 2000 ppmv. Outside of this calibration range, the extrapolation of the polynomial function may lead to anomalous corrections.
After this correction, the measured values corrected from humidity dependence are corrected using the comparison of the measured values of the two standards at 2000 ppmv to their VSMOW-calibrated values as explained in Sect. 3.5 below.
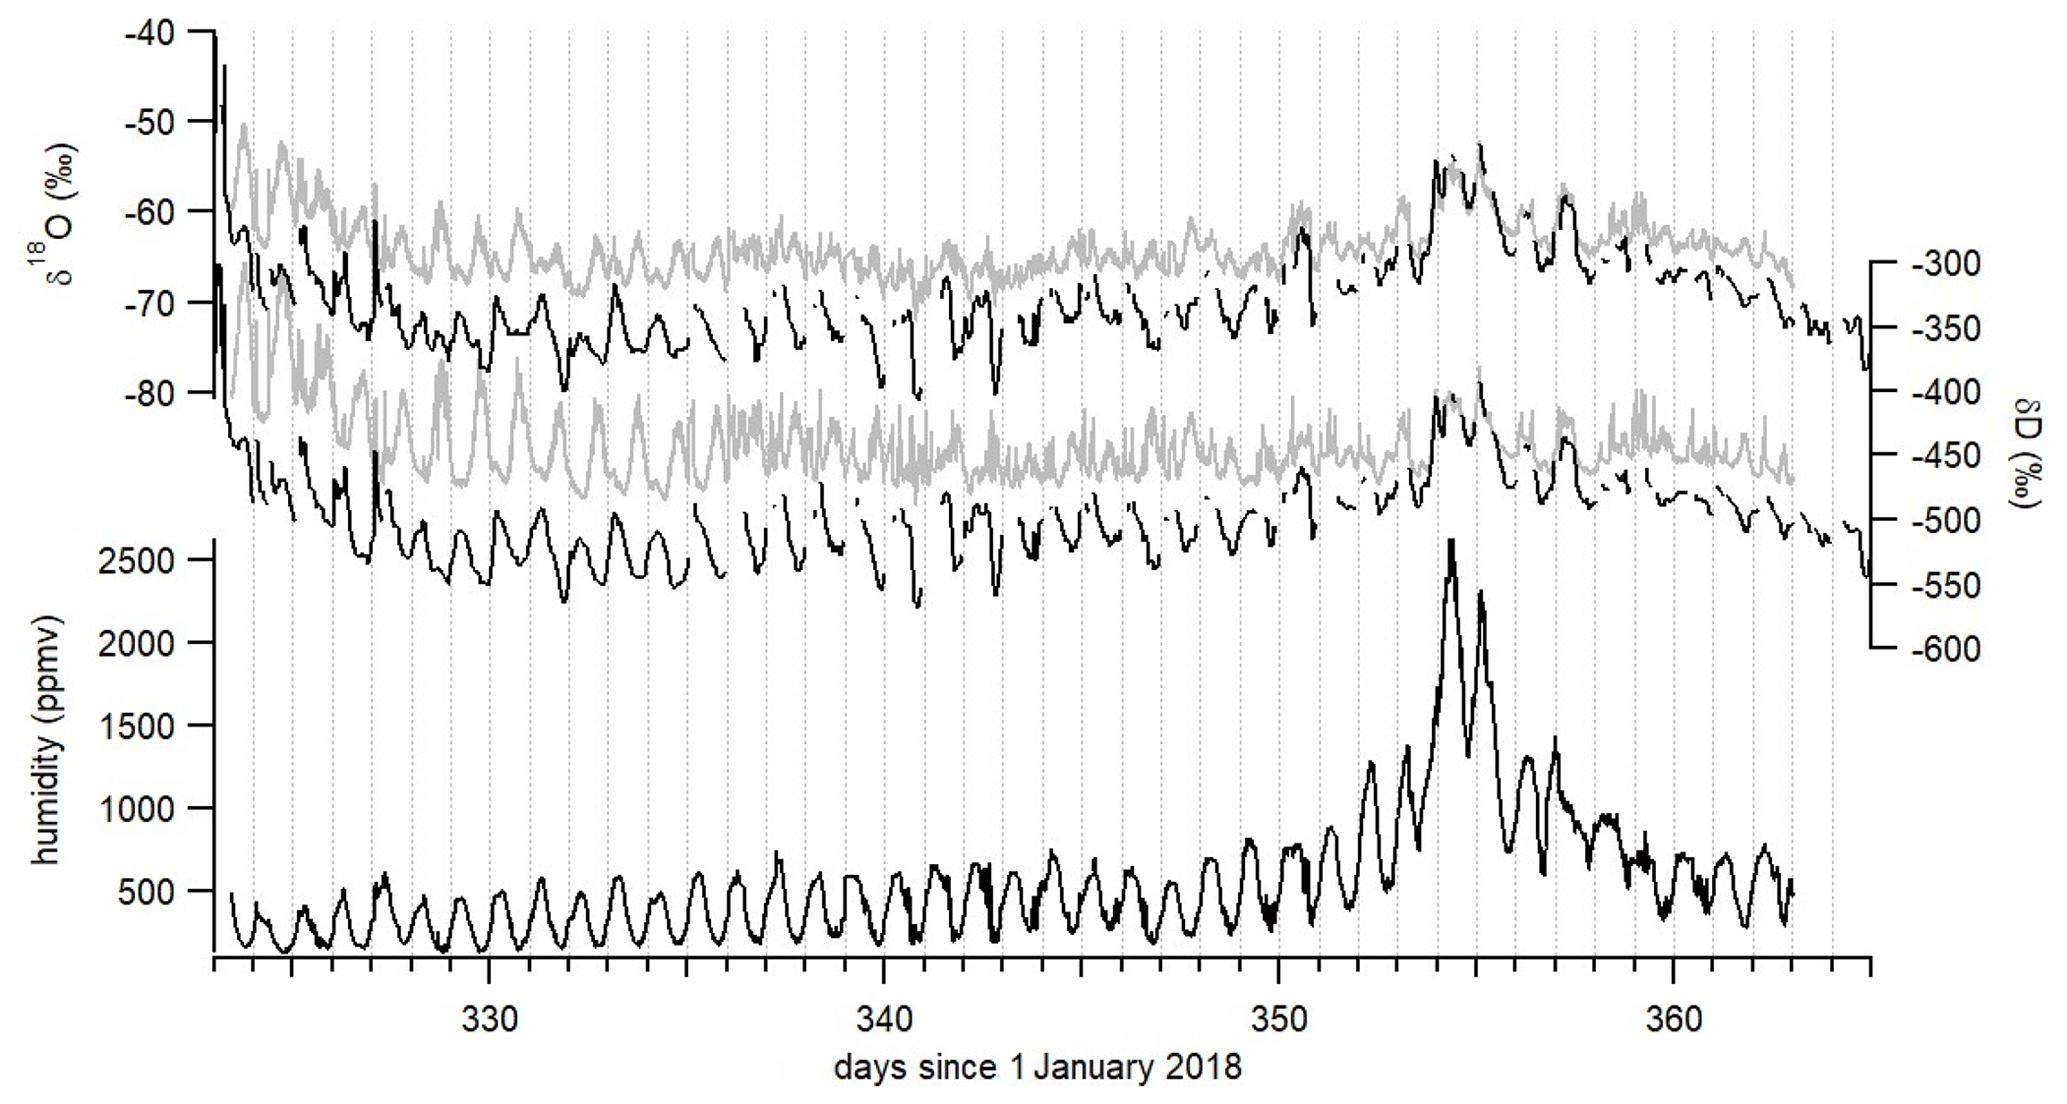
Figure 6δ18O, δD and humidity records over December 2018 and the beginning of January 2019. Raw isotopic values are shown in gray. Corrected isotopic values at an hourly resolution are shown in black after the correction of the influence of humidity on the water isotopic ratios and the adjustment of δ18O and δD values on the VSMOW–SLAP scale using relationships between measured lab-standard values and known VSMOW-calibrated lab-standard values.
3.4 Accuracy of the system and calibration on the VSMOW–SLAP scale
The accuracy of the system has been addressed performing a two-standard calibration and measuring a third standard treated as an unknown. We used two lab standards calibrated vs. VSMOW on the VSMOW–SLAP scale with large δ18O and δD differences (EPB and FP5) as well as the lab standard NEEM, which was independently calibrated against VSMOW. The three lab standards were vaporized at 800 ppmv and measured by the same L2130-i analyzer.
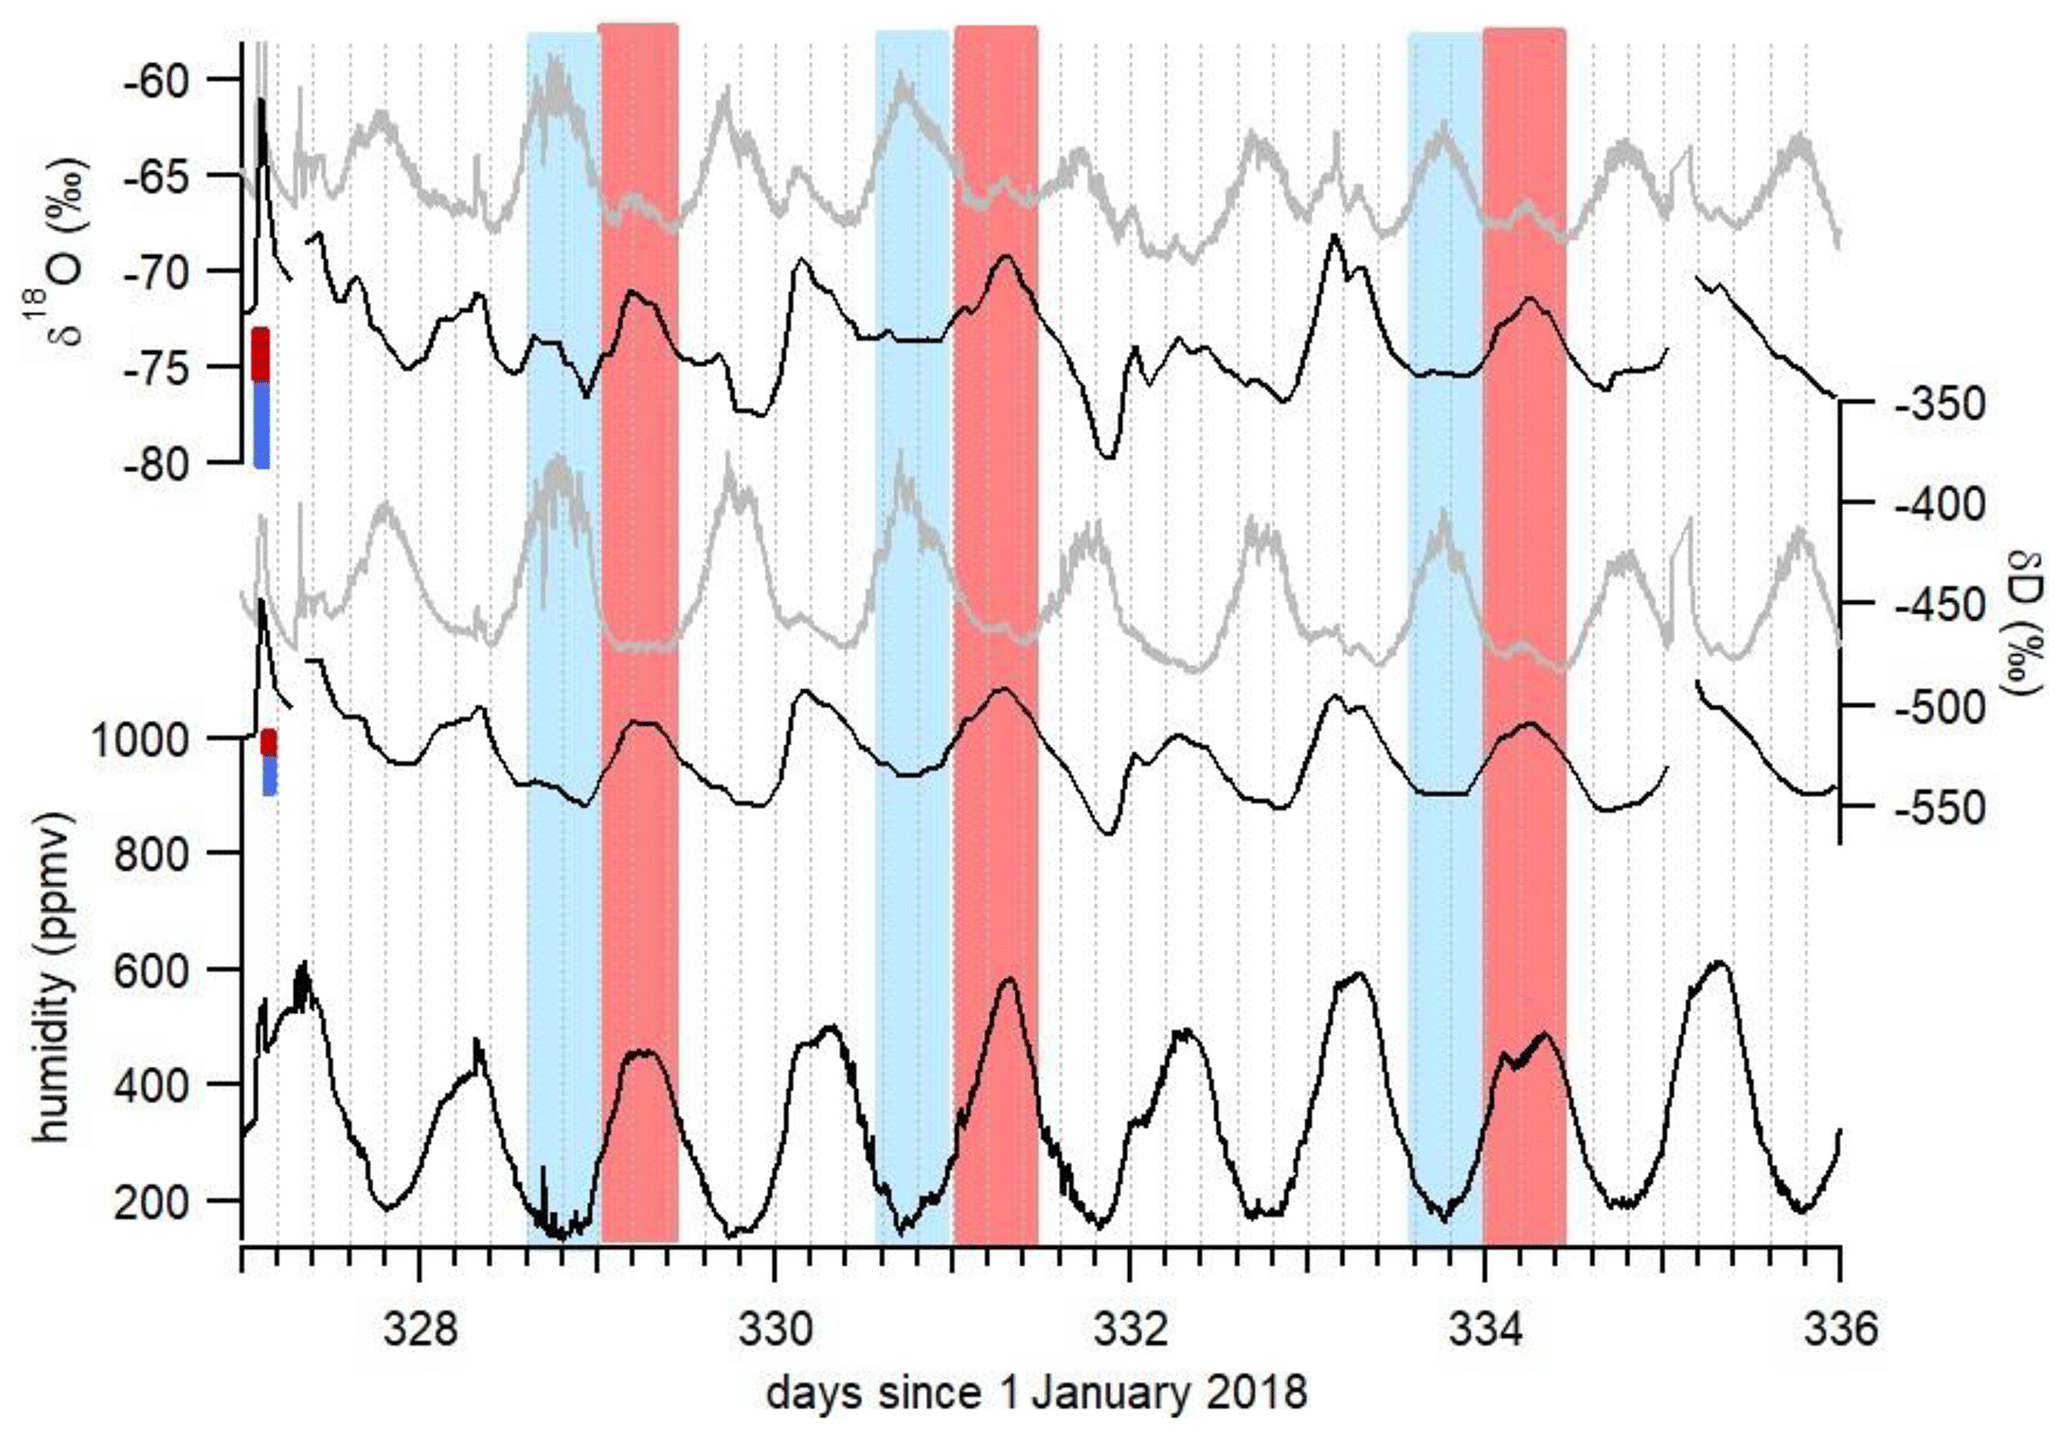
Figure 7Focus on diurnal variability of δ18O, δD and humidity recorded at Concordia. Gray curves show the raw measurements, and black curves show the corrected records. The red (blue) bars indicate the calculated uncertainty due to the isotopic ratio vs. humidity dependence (Fig. 5) on the corrected δ18O and δD values during periods with maximum (minimum) humidity. The red (blue) rectangles indicate a half-day with maximum (minimum) humidity.
Table 4Comparison of measured vs. VSMOW-calibrated δ18O values for three standards measured with a Picarro analyzer after the generation of water vapor using the LHLG.
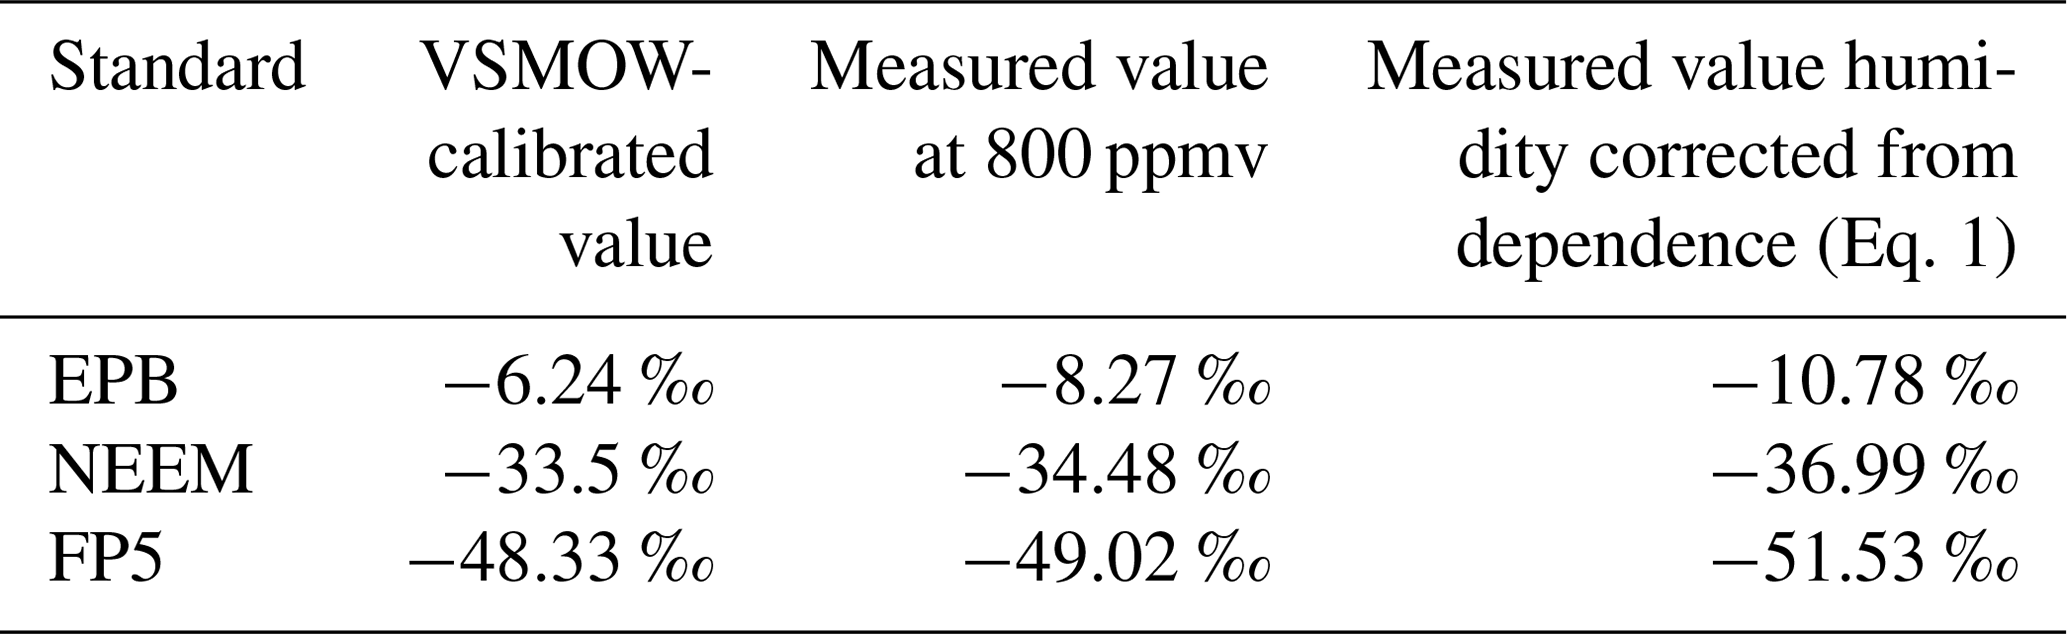
We used the measured and true values of EPB and FP5 to estimate the δ18O value of the NEEM standard from its measured value (Table 4). Using the linear relationship obtained from VSMOW-calibrated EPB and FP5 δ18O vs. measured EPB and FP5 δ18O values (Fig. S3), following the recommendations of the National Institute of Standards and Technology (NIST, reference material 8535a), leads to an estimated NEEM δ18O of −33.31 ‰ to be compared to the independently VSMOW-calibrated value of −33.5 ‰. Given the uncertainty of about 0.8 ‰–1 ‰ when measuring δ18O around 800 ppmv, we can conclude that the system is accurate.
The main application of this device is the interpretation of water isotopic profiles at dry sites, in particular in polar regions. As shown in Fig. 5, the influence of humidity on the measurement of the water vapor isotopic composition with the L2130-i analyzer is large when humidity is below 1000 ppm and increases when humidity decreases. Even though the precise isotope ratio–humidity calibration curve is likely to be different from one analyzer to another, all laser-based water isotope analyzers investigated to date have shown a strongly nonlinear response at low humidity levels (Guilpart et al., 2017; Leroy-Dos Santos, 2020; Weng et al., 2020). At Concordia station, even in summer, humidity is generally below 1000 ppmv (Fig. 6); thus, the interpretation of the diurnal variability of the water vapor isotopic composition is strongly affected by the dependency of the measured δ18O and δD signals on humidity at this site. Figure 6 displays such diurnal variabilities during austral summer 2018–2019 at Concordia and the consequently large correction of the isotopic records (uncorrected in gray and corrected in black).
The data clearly demonstrate the importance of the humidity correction which generally shifts the curves to lower isotopic ratio values. However, the difference between uncorrected and corrected data is particularly important in the observation of the diurnal variability; this is better illustrated by zooming in on a section of the data, as in Fig. 7. When looking at the diurnal variability in the raw δ18O and δD isotope data in detail, some periods stand out with two identified daily peaks: one in phase with the humidity peak (marked in red in Fig. 7) and one occurring during the period of minimum humidity (marked in blue in Fig. 7). The strong nonlinearity of the calibration curve in Fig. 5 suggests that artificial peaks in δ18O and δD could be due to changing humidity levels. Indeed, after correcting the data for the humidity dependence of the analyzer (black curve in Fig. 7), the isotopic peaks occurring during humidity minima are diminished or disappear altogether, whereas the peaks occurring during humidity maxima are amplified. More strikingly, the phase of the signal changes by practically 180∘ over some periods. Whereas the raw isotope signal peaks during the night, the corrected record shows higher isotope ratios during daytime. The diurnal variability recorded on both raw and corrected isotopic values during a period with a higher humidity level – hence when the isotope ratio–humidity correction is smaller (around day 355 in Fig. 6) – also shows that the δ18O (δD) diurnal cycles are indeed in-phase with the humidity cycle. This result confirms the correlation between humidity cycles and δ18O and δD of the water vapor at the daily scale at Concordia, as reported by Casado et al. (2016). Thus, we conclude that the anticorrelation of δ18O and δD with humidity in the raw data (highlighted in blue in Fig. 7) during periods of low humidity is an artifact due to the influence of the humidity level on the vapor isotopic measurements by the L2130-i analyzer.
We have developed an autonomous instrument for low humidity generation (70 to 2400 ppmv) with controlled water vapor isotopic composition that is specifically aimed at carrying out continuous measurements of the water vapor isotopic composition using a laser-based spectrometer in regions characterized by very low humidity, such as polar regions. If needed, an interface permits the user to conveniently connect the new LHLG to the valve sequencer port of commercial Picarro instruments. After more than 1 year of routine operation at two Antarctic sites (Dumont d'Urville and Concordia), this instrument has proven to be very reliable and robust. It consistently generates stable humidity levels with a 1σ variability lower than 10 ppmv over more than 10 min. Moreover, its performance is significantly better than that of the Picarro SDM at low humidity.
We used this instrument for the calibration of our water isotopic data with a special focus on accurately quantifying the influence of humidity on the measured isotopic composition of the water vapor. This effect is huge at low humidity. We showed that this has an important impact on the interpretation of the diurnal cycles of δ18O and δD in the water vapor at Concordia station at humidity below 1500 ppmv. We were able to confirm that, at this site, the diurnal δ18O and δD variability is actually correlated with humidity variability, which would not have been possible without the new LHLG instrument.
Finally, the development of such an instrument is an important step forward to a better understanding of the transfer function between climate parameters and the isotopic composition of deep ice cores from the remote East Antarctic plateau, especially in the context of the new program “Beyond EPICA – Oldest Ice”. It should be completed by ongoing development of laser spectrometers better adapted to low humidity levels, such as those based on the technique of optical feedback cavity-enhanced absorption spectroscopy (OFCEAS) (Casado et al., 2016; Landsberg, 2014; Landsberg et al., 2014).
The software (HumGen) can be downloaded online from https://zenodo.org/record/4003465/#.YHMSmD-xWUn, (Jossoud and Leroy Dos Santos, 2020, last access: 6 April 2021).
The data used in this paper are provided in the Supplement.
The supplement related to this article is available online at: https://doi.org/10.5194/amt-14-2907-2021-supplement.
CLDS, MC, FP and EK designed and built the instrument. OJ realized the software interface development. CLDS, MC and AL installed the instrument in Antarctica and tested it extensively. EK, SK, MF, AL and EF tested the instrument in the laboratory. AL wrote the paper with input from all co-authors.
The authors declare that they have no conflict of interest.
The development presented in this paper was largely inspired by the initial PhD work of Janek Landsberg, which we gratefully acknowledge here. The research leading to these results has received funding from the Prince Albert II of Monaco Foundation “ANTARCTIC-SNOW” program, the ANR “EAIIST” project and the ADELISE “CNRS-LEFE” program. The deployment of this instrument in the field was made possible by the logistic support from the “NIVO2” and ADELISE “IPEV” programs. We thank the two reviewers for their useful comments which greatly improved the article.
This research has been supported by the Prince Albert II of Monaco Foundation (grant no. 2487), the ANR (project EAIIST), CNRS-LEFE (project ADELISE) as well as by IPEV (grant no. 1110 and 1205).
This paper was edited by Marc von Hobe and reviewed by two anonymous referees.
Aemisegger, F., Sturm, P., Graf, P., Sodemann, H., Pfahl, S., Knohl, A., and Wernli, H.: Measuring variations of δ18O and δ2H in atmospheric water vapour using two commercial laser-based spectrometers: an instrument characterisation study, Atmos. Meas. Tech., 5, 1491–1511, https://doi.org/10.5194/amt-5-1491-2012, 2012.
Bailey, H. L., Kaufman, D. S., Henderson, A. C. G., and Leng, M. J.: Synoptic scale controls on the δ18O in precipitation across Beringia, Geophys. Res. Lett., 42), 4608–4616, https://doi.org/10.1002/2015GL063983, 2015.
Bastrikov, V., Steen-Larsen, H. C., Masson-Delmotte, V., Gribanov, K., Cattani, O., Jouzel, J., and Zakharov, V.: Continuous measurements of atmospheric water vapour isotopes in western Siberia (Kourovka), Atmos. Meas. Tech., 7, 1763–1776, https://doi.org/10.5194/amt-7-1763-2014, 2014.
Bonne, J.-L., Masson-Delmotte, V., Cattani, O., Delmotte, M., Risi, C., Sodemann, H., and Steen-Larsen, H. C.: The isotopic composition of water vapour and precipitation in Ivittuut, southern Greenland, Atmos. Chem. Phys., 14, 4419–4439, https://doi.org/10.5194/acp-14-4419-2014, 2014.
Bréant, C., Leroy-Dos Santos, C., Agosta, C., Casado, M., Fourré, E., Goursaud, S., Masson-Delmotte, V., Favier, V., Cattani, O., Prié, F., Golly, B., Orsi, A., Martinerie, P., and Landais, A.: Coastal water vapor isotopic composition driven by katabatic wind variability in summer at Dumont d'Urville, coastal East Antarctica, Earth Planet. Sc. Lett., 514, 37–47, https://doi.org/10.1016/j.epsl.2019.03.004, 2019.
Casado, M.: Water stable isotopic composition on the East Antarctic Plateau: measurements at low temperature of the vapour composition, use as an atmospheric tracer and implication for paleoclimate studies (Doctoral dissertation, Université Paris Saclay; Université Versailles Saint-Quentin-En-Yvelines (UVSQ), 2016.
Casado, M., Landais, A., Masson-Delmotte, V., Genthon, C., Kerstel, E., Kassi, S., Arnaud, L., Picard, G., Prie, F., Cattani, O., Steen-Larsen, H.-C., Vignon, E., and Cermak, P.: Continuous measurements of isotopic composition of water vapour on the East Antarctic Plateau, Atmos. Chem. Phys., 16, 8521–8538, https://doi.org/10.5194/acp-16-8521-2016, 2016.
Casado, M., Landais, A., Picard, G., Münch, T., Laepple, T., Stenni, B., Dreossi, G., Ekaykin, A., Arnaud, L., Genthon, C., Touzeau, A., Masson-Delmotte, V., and Jouzel, J.: Archival processes of the water stable isotope signal in East Antarctic ice cores, The Cryosphere, 12, 1745–1766, https://doi.org/10.5194/tc-12-1745-2018, 2018.
Dong, F. and Baer, D.: Development and Deployment of a Portable Water Isotope Analyzer for Accurate, Continuous and High-Frequency Oxygen and Hydrogen Isotope Measurements in Water Vapor and Liquid Water, in: Geophysical Research Abstracts, 12, EGU2010-5571, 2010.
Ellehoj, M. D., Steen-Larsen, H. C., Johnsen, S. J. and Madsen, M. B.: Ice-vapor equilibrium fractionation factor of hydrogen and oxygen isotopes: Experimental investigations and implications for stable water isotope studies, Rapid Commun. Mass Sp., 27, 2149–2158, https://doi.org/10.1002/rcm.6668, 2013.
Genthon, C., Piard, L., Vignon, E., Madeleine, J.-B., Casado, M., and Gallée, H.: Atmospheric moisture supersaturation in the near-surface atmosphere at Dome C, Antarctic Plateau, Atmos. Chem. Phys., 17, 691–704, https://doi.org/10.5194/acp-17-691-2017, 2017.
Gkinis, V., Popp, T. J., Johnsen, S. J., and Blunier, T.: A continuous stream flash evaporator for the calibration of an IR cavity ring-down spectrometer for the isotopic analysis of water, Isotopes Environ. Health Stud., 46, 463–475, https://doi.org/10.1080/10256016.2010.538052, 2010.
Guilpart, E., Vimeux, F., Evan, S., Brioude, J., Metzger, J., Barthe, C., Risi, C., and Cattani, O.: The isotopic composition of near-surface water vapor at the Maïdo observatory (Reunion Island, southwestern Indian Ocean) documents the controls of the humidity of the subtropical troposphere, J. Geophys. Res.-Atmos., 122, 9628–9650, https://doi.org/10.1002/2017JD026791, 2017.
Iannone, R., Romanini, D., Kassi, S., Meijer, H. A. J., and Kerstel, E.: A Microdrop Generator for the Calibration of a Water Vapor Isotope Ratio Spectrometer, J. Atmos. Ocean. Tech., 26, 1275–1288, https://doi.org/10.1175/2008JTECHA1218.1, 2009.
Jouzel, J., Masson-Delmotte, V., Cattani, O., Dreyfus, G., Falourd, S., Hoffmann, G., Minster, B., Nouet, J., Barnola, J. M., Chappellaz, J., Fischer, H., Gallet, J. C., Johnsen, S., Leuenberger, M., Loulergue, L., Luethi, D., Oerter, H., Parrenin, F., Raisbeck, G., Raynaud, D., Schilt, a, Schwander, J., Selmo, E., Souchez, R., Spahni, R., Stauffer, B., Steffensen, J. P., Stenni, B., Stocker, T. F., Tison, J. L., Werner, M., and Wolff, E. W.: Orbital and millennial Antarctic climate variability over the past 800,000 years, Science, 317, 793–796, https://doi.org/10.1126/science.1141038, 2007.
Jossoud, O. and Leroy Dos Santos, C.: Source code for Humidity Generator's control software, available at: https://zenodo.org/record/4003465#.YGv_JT8682x (last access: 6 April 2021), 2020.
Kerstel, E.: Modeling the dynamic behavior of a droplet evaporation device for the delivery of isotopically calibrated low-humidity water vapor, Atmos. Meas. Tech. Discuss. [preprint], https://doi.org/10.5194/amt-2020-428, in review, 2020.
Kopec, B., Lauder, A., Posmentier, E., and Feng, X.: The diel cycle of water vapor in west Greenland, J. Geophys. Res.-Atmos., 119, 9386–9399, 2014.
Landsberg, J.: Développement d'un spectromètre laser OF-CEAS pour les mesures des isotopes de la vapeur d'eau aux concentrations de l'eau basses, available at: https://tel.archives-ouvertes.fr/tel-01369376, 2014.
Landsberg, J., Romanini, D., and Kerstel, E.: Very high finesse optical-feedback cavity-enhanced absorption spectrometer for low concentration water vapor isotope analyses, Opt. Lett., 39, 1795–1798, https://doi.org/10.1364/OL.39.001795, 2014.
Lee, X., Sargent, S., Smith, R., and Tanner, B.: In Situ Measurement of the Water Vapor 18O/16O Isotope Ratio for Atmospheric and Ecological Applications, J. Atmos. Ocean. Tech., 22, 555–565, https://doi.org/10.1175/JTECH1719.1, 2005.
Leroy-Dos Santos, C., Masson-Delmotte, V., Casado, M., Fourré, E., Steen-Larsen, H.-C., Maturilli, M., Orsi, A., Berchet, A., Cattani, O., Minster, B., Gherardi, J., and Landais, A., A 4.5 year-long record of Svalbard water vapor isotopic composition documents winter air mass origin, J. Geophys. Res., 125, 23, https://doi.org/10.1029/2020JD032681), 2020.
Ritter, F., Steen-larsen, H. C., Werner, M., Masson-Delmotte, V., Orsi, A., Behrens, M., Birnbaum, G., Freitag, J., Risi, C., and Kipfstuhl, S.: Isotopic exchange on the diurnal scale between near-surface snow and lower atmospheric water vapor at Kohnen station, East Antarctica, J. Geophys. Res., 10, 1–35, https://doi.org/10.5194/tc-2016-4, 2016.
Sayres, D. S., Moyer, E. J., Hanisco, T. F., St. Clair, T. M., Keutsch, F. N., O'Brien, A., Allen, N. T., Lapson, Demusz, J. N., Rivero, M., Martin, T., Greenberg, M., Tuozzolo, C., Engel, G. S., Kroll, J. H., Paul, J. B., and Anderson, J. G.: A New Cavity Based Absorption Instrument for Detection of Water Isotopologues in the Upper Troposphere and Lower Stratosphere, Rev. Sci. Inst., 80, 44102–44114, 2009.
Schmidt, M., Maseyk, K., Lett, C., Biron, P., Richard, P., Bariac, T. and Seibt, U.: Concentration effects on laser-based δ18O and δ2H measurements and implications for the calibration of vapour measurements with liquid standards, Rapid Commun. Mass Sp., 24, 3553–3561, https://doi.org/10.1002/rcm.4813, 2010.
Sodemann, H., Aemisegger, F., Pfahl, S., Bitter, M., Corsmeier, U., Feuerle, T., Graf, P., Hankers, R., Hsiao, G., Schulz, H., Wieser, A., and Wernli, H.: The stable isotopic composition of water vapour above Corsica during the HyMeX SOP1 campaign: insight into vertical mixing processes from lower-tropospheric survey flights, Atmos. Chem. Phys., 17, 6125–6151, https://doi.org/10.5194/acp-17-6125-2017, 2017.
Steen-Larsen, H. C., Masson-Delmotte, V., Hirabayashi, M., Winkler, R., Satow, K., Prié, F., Bayou, N., Brun, E., Cuffey, K. M., Dahl-Jensen, D., Dumont, M., Guillevic, M., Kipfstuhl, S., Landais, A., Popp, T., Risi, C., Steffen, K., Stenni, B., and Sveinbjörnsdottír, A. E.: What controls the isotopic composition of Greenland surface snow?, Clim. Past, 10, 377–392, https://doi.org/10.5194/cp-10-377-2014, 2014.
Sturm, P. and Knohl, A.: Water vapor δ2H and δ18O measurements using off-axis integrated cavity output spectroscopy, Atmos. Meas. Tech., 3, 67–77, https://doi.org/10.5194/amt-3-67-2010, 2010.
Tremoy, G., Vimeux, F., Cattani, O., Mayaki, S., Souley, I., and Favreau, G.: Measurements of water vapor isotope ratios with wavelength-scanned cavity ring-down spectroscopy technology: new insights and important caveats for deuterium excess measurements in tropical areas in comparison with isotope-ratio mass spectrometry, Rapid Commun. Mass Sp., 25, 3469–3480, https://doi.org/10.1002/rcm.5252, 2011.
Wang, L., Caylor, K., and Dragoni, D.: On the calibration of continuous, high-precision δ18O and δ2H measurements using an off-axis integrated cavity output spectrometer, Rapid Commun. Mass Sp., 23, 530–536, https://doi.org/10.1002/rcm.3905, 2009.
Weng, Y., Touzeau, A., and Sodemann, H.: Correcting the impact of the isotope composition on the mixing ratio dependency of water vapour isotope measurements with cavity ring-down spectrometers, Atmos. Meas. Tech., 13, 3167–3190, https://doi.org/10.5194/amt-13-3167-2020, 2020.