the Creative Commons Attribution 4.0 License.
the Creative Commons Attribution 4.0 License.
 | 16 Apr 2021
Determination of Aethalometer multiple-scattering enhancement parameters and impact on source apportionment during the winter 2017/18 EMEP/ACTRIS/COLOSSAL campaign in Milan
Luca Ferrero
Ezio Bolzacchini
Alice Corina Forello
Asta Gregorič
Dario Massabò
Griša Močnik
Paolo Prati
Martin Rigler
Luca Santagostini
Francesca Soldan
Sara Valentini
Gianluigi Valli
Roberta Vecchi
In the frame of the EMEP/ACTRIS/COLOSSAL campaign in Milan during winter 2018, equivalent black carbon measurements using the Aethalometer 31 (AE31), the Aethalometer 33 (AE33), and a Multi-Angle Absorption Photometer (MAAP) were carried out together with levoglucosan analyses on 12 h resolved PM2.5 samples collected in parallel.
From AE31 and AE33 data, the loading-corrected aerosol attenuation coefficients (bATN) were calculated at seven wavelengths (λ, where λ values are 370, 470, 520, 590, 660, 880, and 950 nm). The aerosol absorption coefficient at 637 nm (babs_MAAP) was determined by MAAP measurements. Furthermore, babs was also measured at four wavelengths (405, 532, 635, 780 nm) on the 12 h resolved PM2.5 samples by a polar photometer (PP_UniMI).
After comparing PP_UniMI and MAAP results, we exploited PP_UniMI data to evaluate the filter multiple-scattering enhancement parameter at different wavelengths for AE31 and AE33. We obtained instrument- and wavelength-dependent multiple-scattering enhancement parameters by linear regression of the Aethalometer bATN against the babs measured by PP_UniMI. We found significant dependence of the multiple-scattering enhancement parameter on filter material, hence on the instrument, with a difference of up to 30 % between the AE31 and the AE33 tapes. The wavelength dependence and day–night variations were small – the difference between the smallest and largest value was up to 6 %.
Data from the different instruments were used as input to the so-called “Aethalometer model” for optical source apportionment, and instrument dependence of the results was investigated. Inconsistencies among the source apportionment were found fixing the AE31 and AE33 multiple-scattering enhancement parameters to their usual values. In contrast, optimised multiple-scattering enhancement parameters led to a 5 % agreement among the approaches.
Also, the component apportionment “MWAA model” (Multi-Wavelength Absorption Analyzer model) was applied to the dataset. It was less sensitive to the instrument and the number of wavelengths, whereas significant differences in the determination of the absorption Ångström exponent for brown carbon were found (up to 22 %).
- Article
(2000 KB) - Full-text XML
- BibTeX
- EndNote


Light-absorbing aerosols are of great interest because of their effects: they provide a positive radiative forcing at a global scale (IPCC, 2013) and can affect visibility at a local scale (see e.g. Valentini et al., 2018, for estimates in Milan).
Black carbon (BC) and brown carbon (BrC) are major light-absorbing aerosol species. They differ both in the extent of light absorption per mass and its wavelength dependence (Bond et al., 2013; Laskin et al., 2015). Furthermore, BC is a primary component and it is emitted in every incomplete combustion process. An important primary source of BrC is wood burning (e.g. Lack et al., 2013; Lu et al., 2015; Saleh et al., 2014; Washenfelder et al., 2015); recently, other possible sources of BrC have also been reported, e.g. BrC formation by secondary processes (Liu et al., 2015; Kumar et al., 2018). Mineral dust is another light absorber. At mid-latitudes, its contribution is generally episodic and related to desert dust transport episodes (e.g. Fialho et al., 2005).
Thus, aerosol absorption properties at different wavelengths are of interest not only to better characterise the interaction with solar radiation but also as inputs to models for optical source apportionment using the Aethalometer model (Sandradewi et al., 2008a) and for the identification of BC and BrC contribution to the absorption coefficient (component apportionment) using e.g. the Multi-Wavelength Absorption Analyzer model (MWAA model; Massabò et al., 2015). Nevertheless, it must be recalled that particle absorption properties depend on particle size, composition, and the mixing state. It is noteworthy that neither reference instruments (Bond et al., 2013; Moosmüller et al., 2009; Petzold et al., 2013) nor reference materials (Baumgardner et al., 2012) exist for the measurement of the aerosol absorption coefficient (babs). Thus, babs measurement and apportionment are still burning open issues in aerosol science.
Among the approaches for babs determination, filter-based measurements are widely used; indeed, filter-based automatic instruments (able to operate for months with no need for maintenance) provide babs information with a high temporal resolution with the advantage of obtaining long-term data series of babs. Besides on-line devices, two off-line multi-wavelength instruments based on polar photometry have also been developed in the last decade: the polar photometer, PP_UniMI (Bernardoni et al., 2017b; Vecchi et al., 2014), and the Multi-Wavelength Absorption Analyzer, MWAA (Massabò et al., 2013, 2015). All filter-based measurements are affected by multiple-scattering effects as the aerosol is collected on fibre filters and by loading effects – i.e. non-linearities in light attenuation during filter loading (Liousse et al., 1993; Petzold et al., 1997; Bond et al., 1999; Moosmüller et al., 2009). Different approaches are used for the correction of loading and multiple-scattering effects in filter-based instruments (e.g. Drinovec et al., 2015; Petzold and Schönlinner, 2004; Virkkula et al., 2007; Virkkula, 2010; Weingartner et al., 2003), and the details of those considered in this work will be explained in Sect. 2.2. Notwithstanding such corrections, inter-comparability of different instruments for the determination of the aerosol absorption properties is still an open methodological issue especially for ambient aerosol measurements. Among filter-based instruments, the Multi-Angle Absorption Photometer (MAAP) is generally considered a reference (Ammerlaan et al., 2017; Müller et al., 2011), and off-line measurements carried out with an analogous principle will be used in this work to provide a contribution to the debate on the treatment of multiple-scattering effects for Aethalometers (Backman et al., 2017; Collaud-Coen et al., 2010; Di Biagio et al., 2017; Kim et al., 2019; Laing et al., 2020; Müller et al., 2011; Saturno et al., 2017; Schmid et al., 2006; Segura et al., 2014; Valentini et al., 2020; Weingartner et al., 2003; Zhao et al., 2020).
As previously mentioned, despite the problems concerning babs measurement harmonisation, these data are used as input for optical source apportionment and component apportionment models. The most widespread among these models is the Aethalometer model (Sandradewi et al., 2008a), which aims to apportion fossil fuel combustion (FF) and wood burning (WB) contributions to babs. For both sources, the representative absorption Ångström exponents (αFF and αWB, respectively) are free parameters of the model and have to be chosen a priori. Plenty of the literature has addressed difficulties related to the choice of these parameters (e.g. Harrison et al., 2013; Fuller et al., 2014; Helin et al., 2018; Martinsson et al., 2017; Zotter et al., 2017). On the contrary, much less attention has been dedicated to the effect of the instrument providing the input data on the output of the Aethalometer model. Similarly, no investigation into the role of the instrument providing input data to the MWAA model for component apportionment is present in the literature.
This work tries to expand these fields and will show the results of the winter EMEP/ACTRIS/COLOSSAL campaign carried out in Milan in January and February 2018. Different filter-based on-line instruments were deployed (MAAP and Aethalometers model AE31 and model AE33), and sampling was carried out in parallel with a 12 h resolution on quartz fibre filters for the analysis by PP_UniMI. The work will show results about the following:
-
the assessment of multiple-scattering enhancement parameters at different wavelengths for AE31 and AE33 by comparison with off-line measurements by PP_UniMI, including possible wavelength dependence and daytime vs. night-time differences;
-
the role of input data provided by different instruments in the output of the Aethalometer model and MWAA model.
2.1 Sampling campaign
The sampling campaign was carried out at an urban background station in Milan, on the roof of the U9 building of the University of Milano-Bicocca ( N, E; 10 m a.g.l.) in the frame of the EMEP/ACTRIS/COLOSSAL winter campaign. All the instruments and samplers were equipped with PM2.5 size-selective inlets. Aethalometers model AE31 and model AE33 (in the following named AE31 and AE33, respectively; Magee Scientific, Aerosol) sampled continuously from 16 January to 20 February 2018 with a 5 and 1 min temporal resolution, respectively. In addition, from 17 January to 16 February, a Multi-Angle Absorption Photometer (MAAP; Thermo Fisher Scientific) was operated in parallel with a 5 min temporal resolution. Moreover, fifty-seven 12 h resolved PM2.5 samples (06:00–18:00 and 18:00–06:00 LT, local time) were collected using a sequential low-volume sampler (TCR Tecora, Italy) at 1 m3 h−1 on pre-fired (700 ∘C, 1 h) 47 mm quartz fibre filters (QAO-UP, Pall) for absorption coefficient off-line analyses.
2.2 Optical measurements
2.2.1 Aethalometers AE31 and AE33
The Aethalometers AE31 and AE33 perform on-line light-transmission measurements through a filter tape at seven wavelengths (370, 470, 520, 590, 660, 880, and 950 nm). The output of both instruments at each wavelength (λ) is expressed as the concentration of equivalent black carbon (eBC(λ)) (Hansen et al., 1982; Petzold et al., 2013), as it is considered the only absorber. Among these data, the information on eBC (880 nm) is generally considered for black carbon quantification. Being based on light-transmission measurements only, the multiple-scattering effect (optical path enhancement induced by both the filter and the sample, making accounting for both complicated) and filter-loading effects (non-linear optical path reduction induced by absorbing particles accumulating on the filter) (Weingartner et al., 2003; Arnott et al., 2005; Collaud-Coen et al., 2010) have to be accounted for to retrieve information on aerosol light absorption.
For both AE31 and AE33, a linear relationship as in Eq. (1) is assumed between the loading-corrected attenuation coefficient bATN and the absorption coefficient babs at a considered wavelength in the following form:
where C is the multiple-scattering enhancement parameter (see the following Aethalometer AE31 and Aethalometer AE33 pseudo-sections). The following paragraphs provide details of the operation principles of both AE31 and AE33.
Aethalometer AE31
The Aethalometer AE31 collects ambient aerosols on a spot on a quartz fibre filter tape (Pall Q250 quartz) and measures the attenuation (ATN) at all available wavelengths:
where I0 is the intensity of light transmitted through the blank filter spot and I is the intensity measured at a specific moment through the sampled spot.
To avoid the measurement of a heavily loaded spot, the tape moves automatically to a fresh spot when ATN(370 nm) is 120.
For AE31, the loading effect can be compensated for by using different off-line algorithms, as proposed in the literature (see e.g. Arnott et al., 2005; Collaud Coen et al., 2010; Schmid et al., 2006; Virkkula et al., 2007; Weingartner et al., 2003). In this work, the loading effect was corrected by applying the Weingartner et al. (2003) procedure. Therefore, using the measurements of the eBC provided by the AE31 at different wavelengths (eBCAE31(λ)) and considering the default λ-dependent mass attenuation cross sections in use for the AE31 (σAE31(λ)), the loading-corrected attenuation coefficient (bATN_AE31(λ)) was obtained as
where the loading term R(ATNAE31) was dynamically determined following the Weingartner et al. (2003) algorithm as implemented in Sandradewi et al. (2008b) and already used in previous heating-rate studies at the same site (Ferrero et al., 2018).
As for the multiple-scattering enhancement parameter in Eq. (1), for AE31 CAE31_0=2.14 was originally proposed by Weingartner et al., (2003). This value was already evidenced to be underestimated by comparison of bATN,AE31 with different reference instruments (e.g. MAAP, photoacoustic spectrometers, extinction-minus-scattering technique): depending on the sampling site and methodology, values in the range of 3–8 were reported (e.g. Backman et al., 2017; Collaud-Coen, 2010; Di Biagio et al., 2017; Kim et al., 2019; Müller et al., 2011; Saturno et al., 2017; Segura et al., 2014). Based on the previous literature, possible wavelength dependence of the multiple-scattering enhancement parameters is another open issue. Currently, guidelines from the Global Atmosphere Watch Programme suggest the use of (GAW, 2016).
For these reasons, one of the objectives of this work is the CAE31 experimental assessment exploiting PP_UniMI measurements as explained in Sect. 2.5. Considering that eBCAE31(λ) concentration is reported by the instrument at standard volumetric flow (20 ∘C and 1013 hPa), to allow comparison with PP_UniMI data (reported at ambient conditions and 12 h resolution), eBCAE31(λ) was firstly recalculated to the ambient flow conditions and then used to retrieve bATN_AE31(λ).
Aethalometer AE33
AE33 is the latest version of the Aethalometer. It collects ambient aerosol on a filter tape in parallel on two spots of the same area at different flow rates. Similarly to AE31, the tape is automatically moved to the fresh area of the tape to avoid heavily loaded spots. Highly time-resolved information on the light transmitted through the two spots at seven different wavelengths is used to determine the loading-corrected attenuation coefficient (bATN_AE33(λ)) in real time using the “dual-spot” algorithm described in Drinovec et al. (2015). In this work, the TFE-coated glass fibre filter tape T60A20 was used; it was the tape in use when AE33 was initially described (Drinovec et al., 2015). Due to discontinued production and supply of this filter tape, it should have been replaced by M8060. Nevertheless, there was considerable variation in the adoption of the last tape (M8060) by Aethalometer users, as seen from several instrumental comparisons and calibration workshops of absorption photometers carried out in the frame of ACTRIS (European Research Infrastructure for the observation of Aerosol, Clouds and Trace Gases) and the COST Action COLOSSAL (Cuesta-Mosquera et al., 2020). To ensure an accurate approach for the aerosol absorption measurements and a reliable historical trend of such data, the filter tape characteristics need to be carefully investigated for all filter tapes used. While the filter tape used in the Aethalometer model AE31 is well characterised in the scientific literature, there is a lack of published research for the T60A20 filter tape. It is noteworthy that in a very recent paper on the analysis of data collected at the Global Atmosphere Watch (GAW) near-surface observatories, AE33 data were not analysed due to the lack of a unique value for converting the measured attenuation coefficient to the particle light absorption coefficient (Laj et al., 2020). Thus, investigation into the T60A20 filter tape will ensure continuity towards better harmonisation in the time series of measurements by AE33. Furthermore, the methodology presented in this paper can be similarly applied to any other dataset and thus can provide an important contribution to the currently open scientific debate on the determination of aerosol absorption properties.
Also for AE33, the output of the instrument is equivalent black carbon concentration at different wavelengths (eBCAE33(λ)), but in this case two steps are needed to reconstruct the measured bATN_AE33(λ).
-
The instrument implements wavelength-dependent mass absorption cross sections (MAC(λ)) which relate the eBCAE33(λ) to the aerosol absorption coefficient babs_AE33(λ) as in Eq. (4):
-
babs_AE33(λ) is related to bATN_AE33(λ) as in Eq. (1), where CAE33_0=1.57 was suggested by the manufacturer for the filter tape in use for harmonisation with AE31 data.
As eBCAE33(λ) data are reported by the instrument at standard volumetric flow (21.1 ∘C and 1013.25 hPa), bATN_AE33(λ) values were referred to ambient pressure and temperature (12 h average) to allow comparison with PP_UniMI data.
As carried out for AE31, experimental investigation into the suitability of CAE33_0 was performed as explained in Sect. 2.5. Indeed, literature works point to CAE33_0=1.57 as underestimated. As examples, Valentini et al. (2020) identified CAE33=2.66 as suitable in Rome by comparison of bATN_AE33 vs. babs,MAAP and Laing et al. (2020) reported CAE33=4.37 by comparison with suitably corrected tri-colour absorption photometer (TAP) babs,TAP measurements.
2.2.2 MAAP
The MAAP (637 nm; Müller et al., 2011) collects aerosol on a spot on a filter tape, and, as with the Aethalometers, the filter tape is suitably moved to avoid heavy loading when transmittance reaches a value that can be set by the user; in this work, the default value (20 %) was used. The MAAP measures the light transmitted and scattered at fixed angles. Optimised analytical functions are used to retrieve the total light in the front and back hemispheres by solid-angle integration (Petzold and Schönlinner, 2004). The MAAP algorithm implements a suitable radiative transfer model accounting for particle-filter matrix interactions (Hänel, 1987, 1994). Results obtained using this method directly correct for multiple-scattering effects, and no issue related to filter loading was observed (Petzold et al., 2005).
As reported in Petzold and Schönlinner (2004), the input to this model comprises
-
the ratios between the loaded- and the blank-spot analytical-function integrals, determined for the front and backward hemispheres separately;
-
the backward-to-total light integral ratio for the blank filter matrix BM=0.7;
-
the asymmetry parameter g=0.75.
The raw outputs of the model are the optical depth (τ) and the single-scattering albedo (ω) of the filter layer containing the particles. The aerosol absorption coefficient (babs, expressed in Mm−1) in the atmosphere during the sampling is determined considering the deposit area (A in cm2) and the sampled volume (V in m3) as in Eq. (5):
Overall, a 12 % uncertainty was reported (Petzold and Schönlinner, 2004). Assuming a constant mass absorption cross section (6.6 m2 g−1), the output of the MAAP is the equivalent black carbon concentration in air (eBCMAAP), expressed in micrograms per cubic metre. Further details on the instrument are reported in Müller et al. (2011).
2.2.3 PP_UniMI analyses
The aerosol absorption coefficient at four wavelengths (405, 532, 635, 780 nm) was determined on the collected PM2.5 samples using the polar photometer PP_UniMI at the University of Milan (Vecchi et al., 2014; Bernardoni et al., 2017b). In PP_UniMI, the chosen laser beam hits the filter (either blank or loaded) perpendicularly. The filter transmits and scatters light in the front and back hemispheres. A photodiode mounted on a rotating arm scans the scattering plane (0–173∘ with about a 0.4∘ resolution) allowing the determination of the total amount of light diffused into the two hemispheres by solid-angle integration.
In usual PP_UniMI operation – hereinafter named the “PP approach” (or PP) – the same radiative transfer model as the one used in the MAAP is applied, but the following differences in input data evaluation have to be highlighted:
-
Front- and backward-hemisphere integrals are determined by solid-angle integration of the high-angular-resolution phase function measurements and not by analytical-function integrals.
-
No assumption about BM is made, as it is directly obtained by the measurements of the blank filter.
As well as for the MAAP, the outputs of the models are ω and τ. The minimum detection limits on the absorbance () of the particle-containing layer of the samples are in the range of 0.03–0.07 depending on the wavelength. It is also noteworthy that samples with ABS>0.9 were excluded by the database to avoid possible non-linearities due to sample overloading. Uncertainties were estimated at ±0.01 for ABS<0.1 and 10 % for ABS≥0.1 (Bernardoni et al., 2017b)
It is noteworthy that exploiting information at suitable angles, the same approximations as those used in the MAAP calculation can be implemented; i.e. the total amount of light in the two hemispheres by analytical functions can be obtained and BM=0.7 can be imposed, for the sake of comparison. This approach will be referred to as “PP_UniMI as MAAP” (PaM) approach in the following.
In both approaches (PP and PaM), the aerosol absorption coefficient at all PP_UniMI measurement wavelengths (babs,PP(λ) and babs,PaM(λ) for PP and PaM, respectively) can be obtained from ω and τ, considering the deposit area A=11.9 cm2 and the total sampled volume using Eq. (5). The comparison between the two approaches will be carried out through Deming linear regressions, as explained in Sect. 2.8.
2.3 Levoglucosan measurements
After being analysed by PP_UniMI, one punch (1.5 cm2) of each 12 h sample was devoted to the measurement of levoglucosan concentration. Each punch was extracted by sonication (1 h) using 5 mL ultrapure (Milli-Q) water. The analysis was carried out by high-performance anion liquid chromatography coupled with pulsed amperometric detection (HPAEC-PAD) at the University of Genoa following the procedure described in Piazzalunga et al. (2010). The minimum detection limit for levoglucosan is about 2 ng mL−1 (i.e. 6.6 ng m−3 considering the filter area and sampling volume), and uncertainties are ∼11 %.
2.4 Experimental absorption Ångström exponent
The experimental absorption Ångström exponent (αexp) was determined for each 12 h time slot from all instruments fitting the parameters Kexp and αexp in Eq. (6):
It is noteworthy that light-absorbing components (e.g. BC vs. BrC) have different wavelength dependencies and they both contribute to αexp. Thus, it is not expected that Eq. (6) represents exactly the wavelength dependence of the measurements (i.e. αexp is expected – and known – to be dependent on the range of wavelengths considered in the calculation). Anyway, it is a good approximation and it can be exploited to gain information at wavelengths different from the measured ones (see e.g. application in Sect. 2.5).
2.5 Optimisation of multiple-scattering enhancement parameters
Optimised multiple-scattering enhancement parameters at four different wavelengths for AE31 and AE33 (CAE31(λ), CAE33(λ), respectively) were retrieved by comparing loading-corrected attenuation coefficients bATN_AE33(λ) with the absorption coefficient measured by PP_UniMI, with both PP and PaM approaches (Sect. 2.2), through a Deming linear regression analysis explained in Sect. 2.8. When the intercept of the regression was comparable to zero, the slope of the regression line directly represented the best estimate for the corresponding multiple-scattering enhancement parameter.
To allow such comparison, PP_UniMI data were interpolated and extrapolated to Aethalometer wavelengths exploiting αexp calculated as explained in Sect. 2.4 through the following relationships:
It was already demonstrated for Aethalometer data that exploiting information at 370 or 470 nm for the evaluation of the absorption Ångström exponent has an important impact on the result whereas information at longer wavelengths plays a minor role (Zotter et al., 2017). For these reasons, no extrapolation of PP_UniMI data at wavelengths shorter than 405 nm was performed; in contrast, extrapolation was attempted at least at the nearer longer Aethalometer wavelength (i.e. 880 nm), as on that side the curve is less steep and possible biases are expected to be smaller.
To ensure consistent comparison of the results at different wavelengths, only samples for which PP_UniMI information was available at all wavelengths were considered (i.e. samples in which measurements at all wavelengths were higher than the minimum detection limit and with ABS<90).
2.6 Aethalometer model
The Aethalometer model was introduced by Sandradewi et al. (2008a). Generally, the model is used to apportion the contribution of fossil fuel combustion (FF) and wood burning (WB) to both the aerosol absorption coefficient (babs) and carbonaceous fractions. In this work, we will focus on the babs source apportionment only. Please note that in this paragraph we will use babs with no explicit reference to the instrument used for its determination as it does not affect the explanation of the Aethalometer model itself.
The Aethalometer model exploits two-wavelength babs measurements as input data, and it is based on the following assumptions.
-
At both wavelengths, FF and WB are the only sources contributing to the measured babs, as expressed in Eq. (7):
-
For fossil fuel combustion
where λ1 indicates a short wavelength; λ2 a long wavelength; and αFF is a parameter assumed a priori, representing the absorption Ångström exponent for the fossil fuel combustion source.
-
For wood burning, similarly,
where αWB is another parameter assumed a priori representing the absorption Ångström exponent for wood burning.
The identification of suitable αFF and αWB values for the considered campaign/sampling site is recognised as the critical step in the modelling procedure, and different approaches have been proposed (e.g. Harrison et al., 2013; Fuller et al., 2014; Helin et al., 2018; Martinsson et al., 2017; Zotter et al., 2017; Forello et al., 2019, 2020); in contrast, less attention has been paid to the role of using data from different instruments as input to the model.
However, once λ1, λ2, αFF and αWB are chosen, the babs source apportionment at λ1 and λ2 is carried out combining Eq. (7) at λ1 and λ2 and Eqs. (8) and (9). Traditionally, the Aethalometer model is applied just considering the 470–950 nm wavelength pair. However, due to the purpose of the present work,
-
for AE33 and AE31, the wavelength pairs 470–880, 370–950, 370–880, and 470–950 nm were considered;
-
for PP_UniMI (with both PP and PaM approaches), only one test was performed using extreme values, i.e. 405–780 nm.
It is noteworthy that AE31 and AE33 provide seven-wavelength information, but the Aethalometer model represented by Eqs. (7), (8), and (9) exploits information only at two chosen wavelengths (from now on named the “two-wavelength approach”). In this work, to exploit all the information provided by AE31 and AE33, we also propose an alternative approach, in the following named “multi-wavelength fit”. The multi-wavelength fit (regardless of the instrument) is based on Eq. (7) and keeps the and dependencies reported in Eqs. (8) and (9) for fossil fuel combustion and wood burning contributions, but these dependencies are extended to all wavelengths, thus
A multi-wavelength fit of Eq. (10) is performed to retrieve the coefficients A′ and B′ for each sample, provided that values for αFF and αWB are defined a priori. So, once A′ and B′ are determined for each sample and wavelength, represents the contribution of FF combustion to babs(λ) and represents the WB one.
Of course, the available wavelengths depend on the considered instrument, and it is also possible to test the method using wavelength subsets. In this work, for PP_UniMI the whole available dataset (i.e. four wavelengths – 405, 532, 635, and 780 nm) was used as input (in both PP and PaM approaches), whereas for the Aethalometers the use both of all the seven available wavelengths and of the four wavelengths for which multiple-scattering enhancement parameters were determined (i.e. 470, 520, 660, 880 nm) was tested, to analyse the role of extreme wavelengths. It is noteworthy that using our multi-wavelength fit approach, it is possible to also obtain the apportionment at wavelengths different from the ones used as input (e.g. apportionment at Aethalometer wavelengths using as input the data by PP_UniMI) thus allowing comparison among results by instruments operating at different wavelengths.
Focusing on Aethalometers, for all the two-wavelength and multi-wavelength fit approaches tested, input babs values were obtained from Eq. (1) using both instrument-dependent C0 and optimised multiple-scattering enhancement parameters presented in Sect. 3.3 and obtained as reported in Sect. 2.5.
A summary of all the performed tests, for each instrument and babs measurement methodology, in terms of input wavelengths and of the wavelengths of analysed output data for both two-wavelength and multi-wavelength fit Aethalometer model approaches can be found in Table 1. In all tests, besides relative babs(λ) source apportionment between FF and WB, correlation of babs,WB with levoglucosan (in terms of the Pearson correlation coefficient rWB) was tested. Since no tracer in atmospheric aerosol for fossil fuel combustion was available, data on carbon monoxide (CO), nitrogen oxides (NOx), and benzene concentrations from the Regional Environmental Protection Agency database were tested as possible tracers for traffic emissions, which dominate fossil fuel babs contribution in Milan (Forello et al., 2019). Data were available at a traffic monitoring station at a distance of about 2 km from our sampling site. Results of tests pointed to the benzene measurements at the traffic site as the best tracer for traffic, as it showed the highest correlation with babs,FF calculated for all instruments and calculation approaches (in terms of the Pearson correlation coefficient rFF). Thus, correlation between benzene and babs,FF will be shown. It is noteworthy that, thanks to the features of the model, rFF and rWB do not depend on the choice of the considered wavelength for babs,FF and babs,WB, respectively.
Table 1Summary of the tests available for the Aethalometer model. For each instrument and approach to retrieve babs and for each approach to the Aethalometer model, wavelengths (in nm) in input to model and reference wavelengths (in nm) for source apportionment used as output are reported.
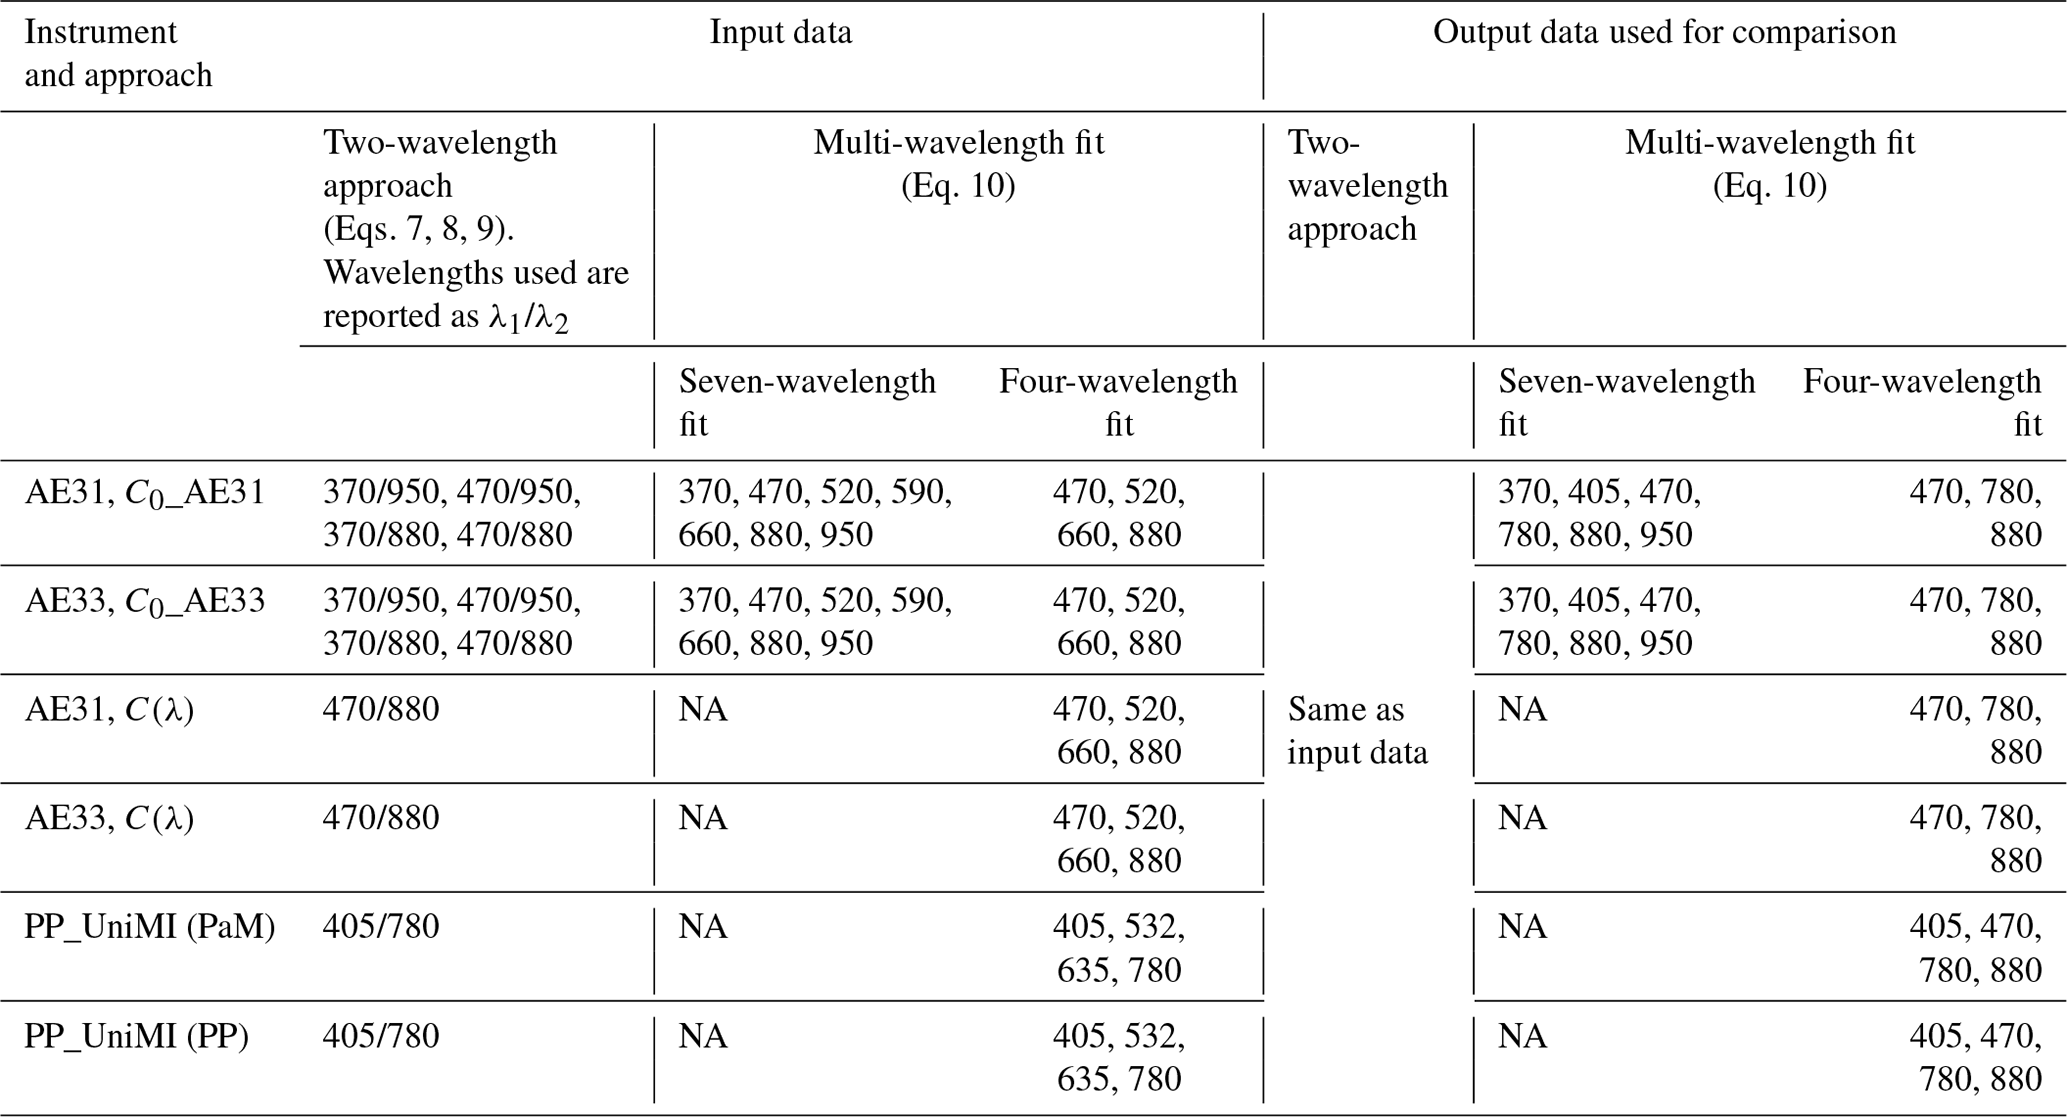
NA – not available.
2.7 MWAA model
The MWAA model (Massabò et al., 2015; Bernardoni et al., 2017a) allows us to assess the contributions of BC and BrC to the total measured babs(λ) (component apportionment) and to provide information on the absorption Ångström exponent for BrC (αBrC) exploiting Eq. (11):
The coefficients A, B, and αBrC in Eq. (11) are obtained by a multi-wavelength fit of babs(λ) for each sample, provided that a value for αBC is assumed a priori. In this case, αBC=1 was chosen as already used in previous applications (Bernardoni et al., 2017a; Massabò et al., 2015).
Mathematically, at least four-wavelength measurements are needed to fit three parameters. Nevertheless, tests showed issues with numerical calculation when using only four-wavelength information (i.e. lack of convergence and/or fit parameter instability) and a minimum of five wavelengths is necessary to ensure model stability (Bernardoni et al., 2017a). Thus, in this work the MWAA model was run only using Aethalometer data as input (PP_UniMI is a four-wavelength instrument). The fit of Eq. (11) was performed both considering all of the datasets (seven wavelengths) and excluding extreme values (i.e. five wavelengths – 470, 520, 590, 660, and 880 nm) to gain insight into the role of the absorption information at extreme wavelengths in the results. Fixed multiple-scattering enhancement parameters were considered, as the optimised ones were determined at 4-wavelengths only.
In Sect. 3.3, the relative apportionment of the contributions from BC and BrC to babs(λ) was shown. As the main contributor to BrC is expected to be wood burning, the Pearson correlation coefficient (rBrC) between the apportioned absorption coefficient for BrC (babs,BrC) and levoglucosan was also calculated. It is noteworthy that, as αBrC is different for each sample, rBrC depends on the considered wavelength. As BrC is expected to provide a higher relative contribution at decreasing wavelengths, rBrC was presented at the shortest wavelength available in all tests – i.e. babs,BrC(470 nm) was used in rBrC evaluation.
2.8 Deming regression
In the results and discussion section (Sect. 3), linear correlations between the data considered in the different comparisons were evaluated through the correlation coefficient r.
Linear regressions were performed using Deming regression (Deming, 1943; Ripley and Thompson, 1987). This approach is suitable when both data series are affected by non-negligible uncertainties (i.e. none of the series can be assumed error-free). The uncertainties associated with the data in the different cases will be described for each comparison.
The output of the Deming regression analysis will be represented in terms of slope, intercept, and their standard errors (SEs). When the intercept of the Deming regression line was comparable to zero within 3 times the standard error (3×SE), it was forced through zero: in the text it will be reported “the intercept was comparable to zero” and only the slope of the intercept-forced regression will be presented. In the text and captions, a “y vs. x” convention will be used (e.g. “PP vs. MAAP” means that in the regression PP_UniMI data obtained with the PP approach were displayed on the y axis and MAAP data on the x axis).
3.1 Comparison between MAAP and PP_UniMI results
The radiative transfer model used to account for multiple scattering in the filter used for babs determination by PP_UniMI (see Sect. 2.2.3) was run using as input both PP and PaM approaches. It is noteworthy that, while the PP approach fully exploits highly angular-resolved measurements, PaM calculation introduces the same approximations as the ones used in the MAAP – i.e. reconstruction by analytical functions from measurements at three angles and the fixed value between backward and total diffused radiation for blank filter BM=0.7 (Sect. 2.2.2).
For each 12 h sample, babs,PP(635 nm) and babs,PaM(635 nm) were compared to the average 12 h babs,MAAP (Fig. 1). In both cases, high correlation is found (r>0.991), and Deming regressions were performed with a variance ratio equal to 1 (i.e. orthogonal regression) as data had comparable uncertainties (see Sect. 2.2.2 and 2.2.3).
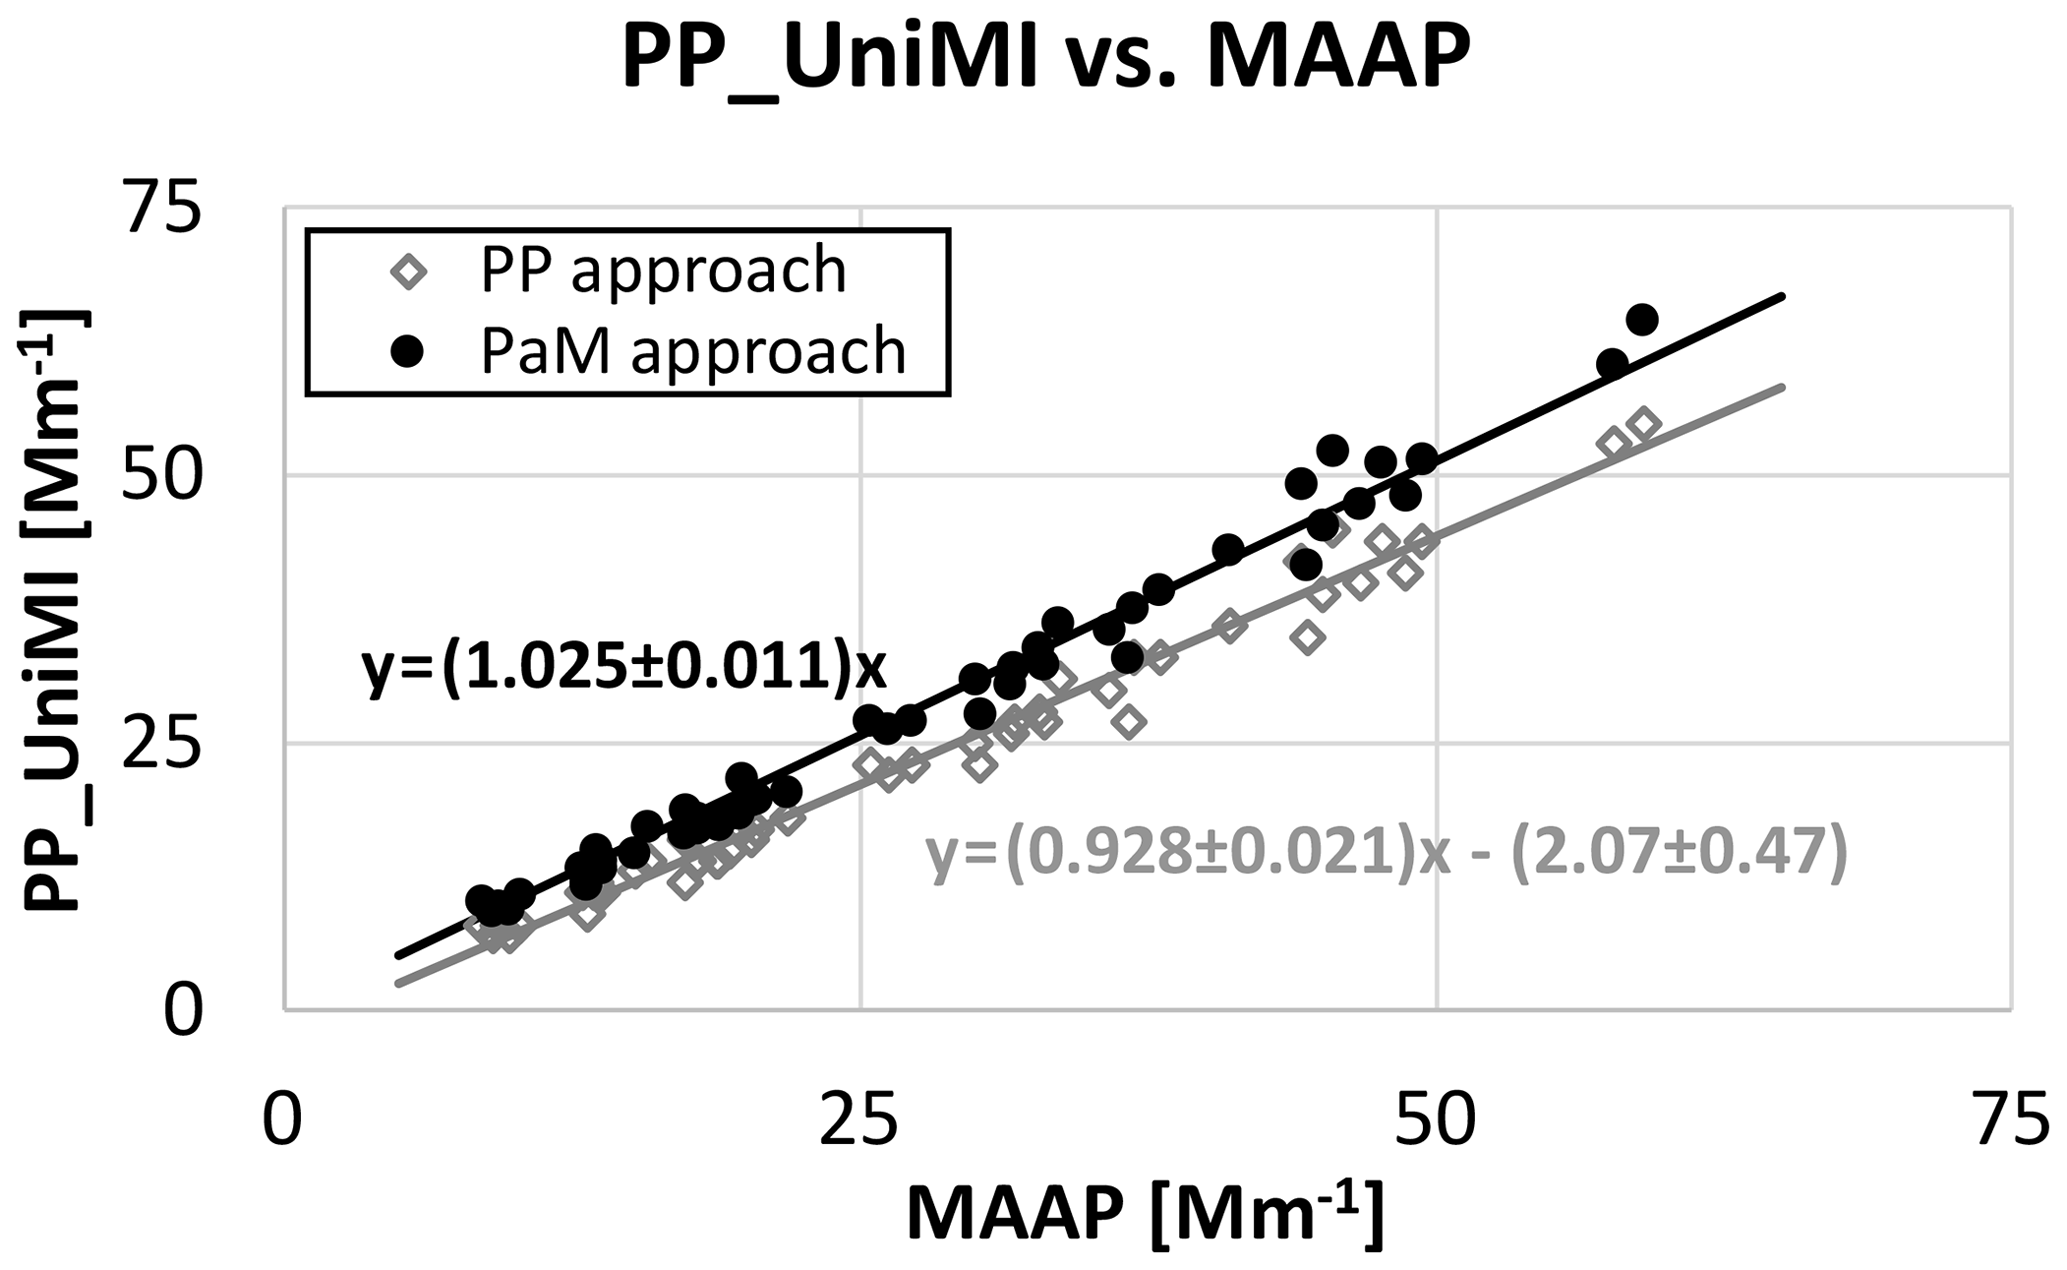
When exploiting all the available angular-resolved information in the PP approach, the intercept was not comparable to zero ( Mm−1) and the slope was 0.928±0.021. Nevertheless, comparing babs,PaM(635 nm) to the 12 h averaged babs,MAAP, the intercept was comparable to zero and the slope was 1.025±0.011. The latter result confirms that PP_UniMI is equivalent to the MAAP when the same approximations are applied to the calculation as used in the PaM approach (Sect. 2.2.3).
The previous comparisons also evidenced that the approximations implemented by the MAAP have a non-negligible impact on the measured babs,MAAP. The individual role of the phase function reconstruction and imposition of BM=0.7 is beyond the aim of the present work, and it will be reported elsewhere (Valentini et al., 2021), but first results indicate that the assumption about BM is the main responsible for the discrepancies. As for the presence of the intercept, this needs to be further investigated: scattering (Müller et al., 2011) or different penetrations of the absorbers in the filter have been demonstrated to produce spurious absorption signals (Arnott et al., 2005) at least for Aethalometers.
Table 2Deming regression parameters of PP vs. PaM calculations at different wavelengths.
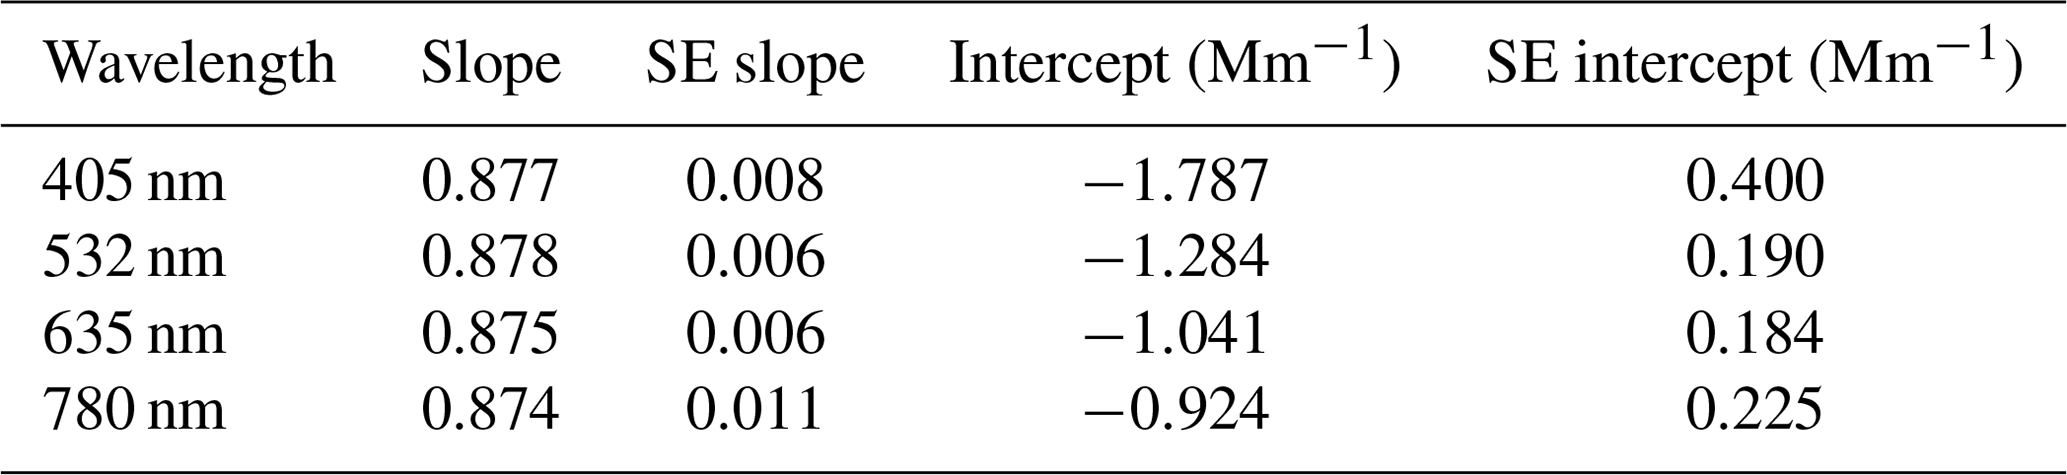
3.2 Comparison between PP and PaM approaches at all wavelengths
At wavelengths other than 635 nm, no comparison with the MAAP is possible; thus only the comparison between the babs,PP(λ) and babs,PaM(λ) was performed. At all wavelengths, the results obtained were highly correlated (correlation coefficient r>0.993), but significant deviation from the 1:1 relation was found, with PP results generally lower than PaM ones. Focusing on Deming regression line parameters (with variance ratio equal to 1), negative intercept was always found, whose absolute value reduced with increasing wavelengths (see Table 2). In all cases, the slope is not comparable to 1 within 3×SE.
3.3 Evaluation of multiple-scattering enhancement parameters for AE33 and AE31 during the campaign
PP_UniMI data were reported to Aethalometer wavelengths and used to gain information on multiple-scattering enhancement parameters for AE33 and AE31 at different wavelengths (CAE33(λ), CAE31(λ), respectively) as explained in Sect. 2.5. In the following, results will be presented by comparing loading-corrected 12 h averaged bATN(λ) from each Aethalometer to both babs,PP(λ) and babs,PaM(λ). This was done because PP results are obtained with less assumptions than those required by the PaM approach. Nevertheless, PaM results were already demonstrated to be comparable to MAAP ones (Sect. 3.1), thus C values obtained with this approach are more directly comparable to data commonly obtained by research groups working with Aethalometers and the MAAP in parallel for ambient measurements at urban or background stations. The need to show both results highlights the importance of identifying a suitable reference material and reference instrumentation.
Very high correlation (r>0.98) was found at all wavelengths between Aethalometers bATN and both babs,PP and babs,PaM. Deming regression was performed considering the following uncertainties: a constant 1 Mm−1 uncertainty was considered for all instruments, summed to 10 % uncertainty for PP_UniMI and increased to 15 % for Aethalometers (as the effect of variable aerosol scattering coefficient on the measurements is not considered).
In Fig. 2, scatterplots of the AE33 data against both PP (left panels) and PaM (right panels) approaches were shown at the four wavelengths considered for comparison. In each scatterplot, lighter dots refer to daytime data, whereas the darker dots refer to night-time data. Deming regression line on the whole dataset (day and night data) was also shown. Intercept of the regression line was comparable to 0 at all wavelengths when calculated using the PaM approach data. In this case, the slope of the regression line represented an average value for CAE33_PaM and resulted in the range of . These values are about 10 % higher than CAE33=2.66 reported for Rome by Valentini et al. (2020) by comparison between AE33 and the MAAP (with no wavelength adjustment). Considering the PP calculation approach, the intercept was not comparable to zero at 470 and 880 nm. Thus, we could provide CAE33_PP(λ) from the regression slope only at 520 and 660 nm: we found and . The intercepts at 470 and 880 nm can be related to different effects (or combination of them). It has to be considered that few reciprocal megametres represent the limit of detection for PP_UniMI; thus it may have a role on the intercept. Furthermore, Valentini et al., (2021) performed sensitivity tests about the role of asymmetry parameter on results by PP and PaM approaches. These tests showed few percent variation in the results moving from g=0.50 to g=0.75 and intercepts about 0.010±0.001 in units of absorbance . Finally, the approach presented in Eq. (1) neglects a possible additive contribution from scattering (i.e. is best at low single-scattering albedo – SSA). Bias of such an approximation – possibly depending on the wavelength – can contribute to the observed intercepts.
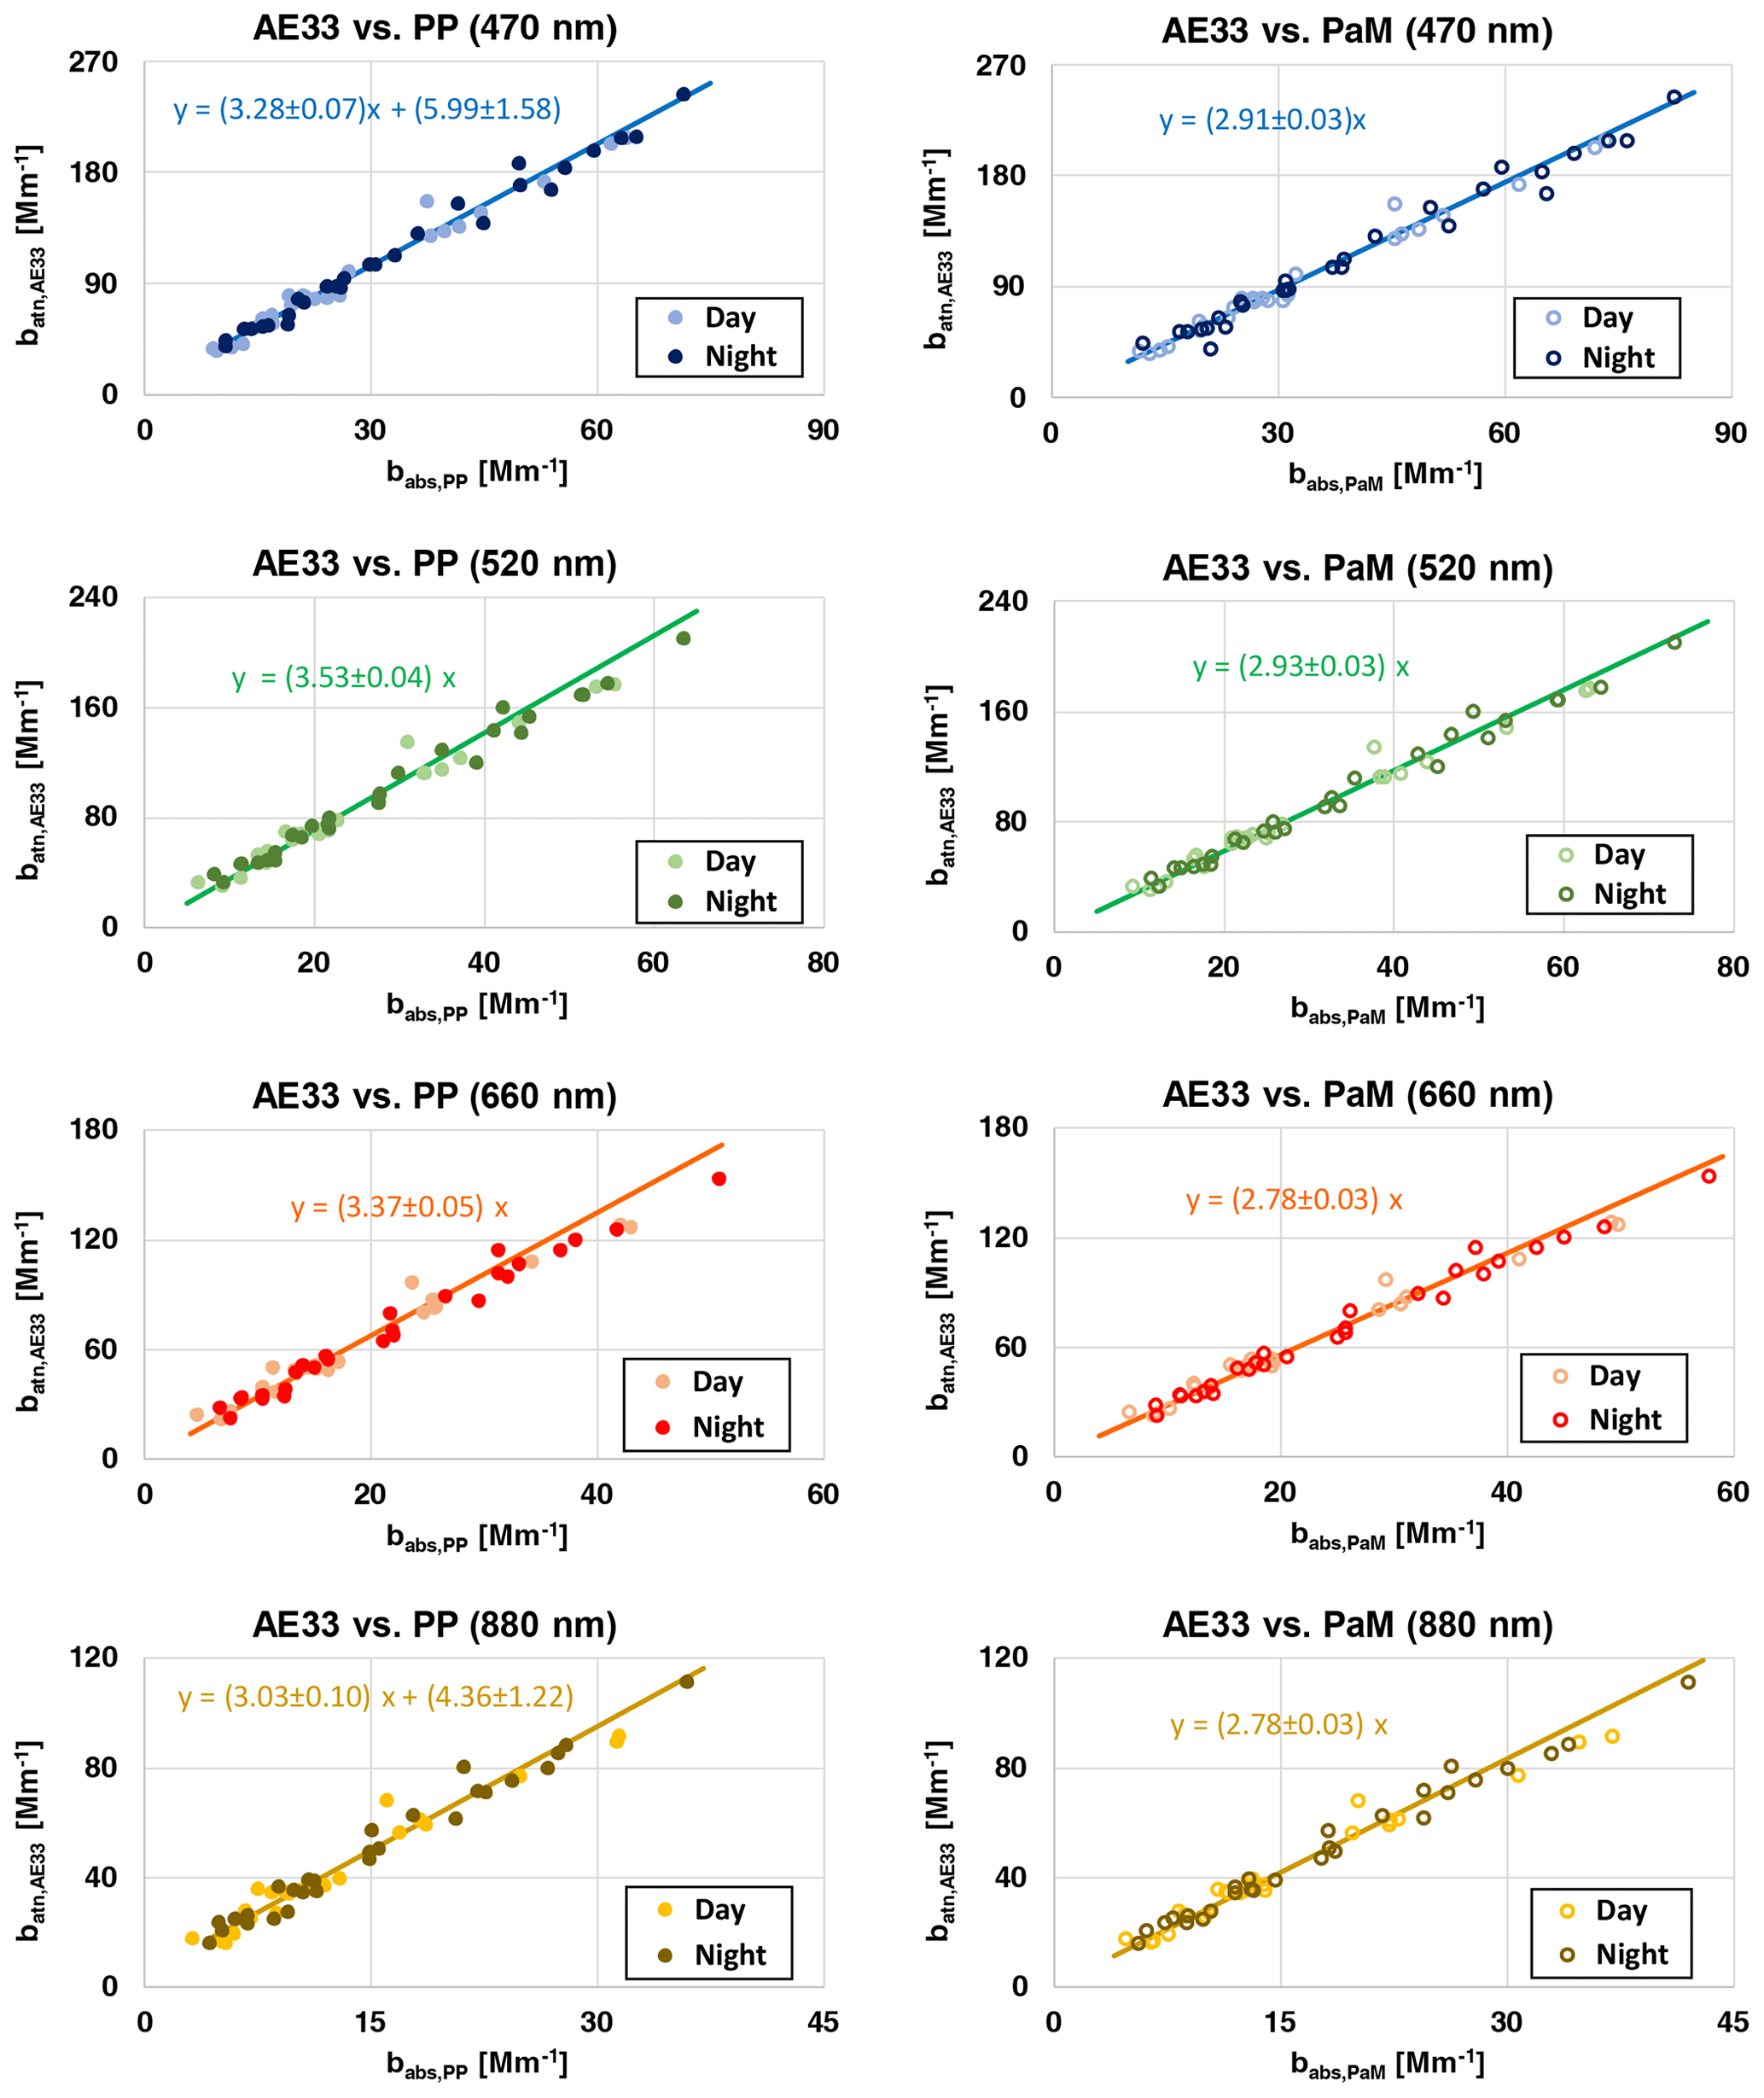
Figure 2Scatterplot of bATN_AE33(λ) vs. babs_PP(λ) (left charts) and babs_PaM(λ) (right charts) at 470, 520, 660, and 880 nm (from top to bottom).
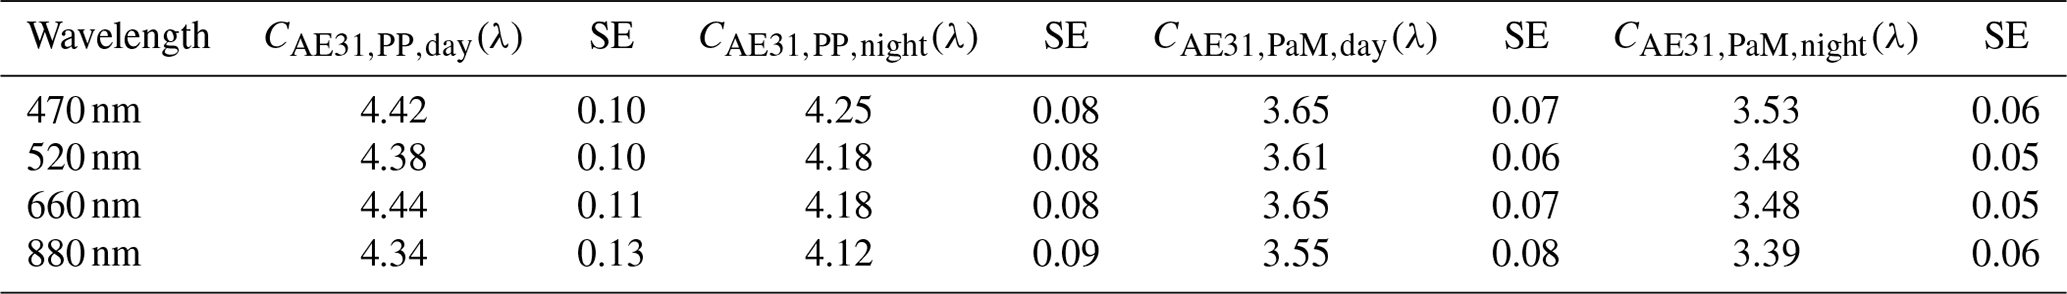
Deming regression results were presented separately for daytime and night-time data in Table 3 for AE33. For these data, the intercept of the regression line was comparable to zero. Exceptions were PP night-time results at 470 and 880 nm for which the intercept exceeded 3×SE for less than 10 % and they were forced the same. Daytime CAE33(λ) values were higher than the corresponding night-time ones, even if they were comparable within the SE for both PP and PaM calculation approaches. In more detail, multiple-scattering enhancement parameters calculated with PP approach were in the range of for daytime dataset and for night-time dataset; calculations with the PaM approach gave for daytime dataset and for the night-time dataset. It is noteworthy that values at 470 and 520 nm were comparable within the SE and the same occurs for the values at 660 and 880 nm for both PP and PaM approaches pointing to a weak wavelength dependence. Nevertheless, if 3×SE is considered for statistically significant differences, all the values were comparable, and no wavelength dependence can be claimed.
Table 3Multiple-scattering enhancement parameter and standard error (SE) for AE33 at different wavelengths calculated separately for the day and night datasets using PP (CAE33_PP_day and CAE33_PP_night, respectively) and PaM (CAE33_PaM_day and CAE33_PaM_night, respectively) approaches.

a Original regression line intercept was 6.62±2.15. b Original regression line intercept was 4.48±1.40.
Figure 3 provides the same representation already explained in Fig. 2, considering in this case the AE31 dataset. All intercepts of the Deming regression carried out on all the AE31 data were comparable to zero. As for the PaM approach, it resulted and these values were fully comparable to the suggested value of (GAW, 2016; Müller, 2015). Considering the PP approach, was found. It is noteworthy that for both CAE31_PP(λ) and CAE31_PaM(λ), the values at different wavelengths were comparable within the SE; thus no statistically significant wavelength dependence was observed.

Figure 3Scatterplot of bATN_AE31(λ) vs. babs_PP(λ) (left charts) and vs. babs_PaM(λ) (right charts) at 470, 520, 660, and 880 nm (from top to bottom).
Focusing on daytime and night-time datasets, separately, for AE31 daytime CAE31(λ) values were also higher than the corresponding night-time ones even if they were comparable within the SE, considering both PP and PaM calculation approaches (see Table 4). In more detail, multiple-scattering enhancement parameters calculated with the PP approach were in the range of for the daytime dataset and for the night-time dataset; calculations with the PaM approach gave for the daytime dataset and for the night-time dataset. For AE31, values at the different wavelengths were all comparable within the SE for each approach, evidencing negligible wavelength dependence.
Table 4Multiple-scattering enhancement parameter and standard error (SE) for AE31 at different wavelengths calculated separately for the day and night datasets using PP (CAE31_PP_day and CAE31_PP_night, respectively) and PaM (CAE31_PaM_day and CAE31_PaM_night, respectively) approaches.
Possible reasons for higher daytime values compared to night-time ones could be differences in particle SSA. Also, different size distributions can play a role. As an example, a higher fraction of bigger particles – e.g. related to resuspension – can enhance forward scattering, thus increasing the fraction of light impinging on the filter. Nevertheless, the first hypothesis would have required parallel scattering measurements to be supported and the second should give a limited effect related to the size cut (PM2.5) used in this campaign. Anyway, further experimental information should be collected in future similar campaigns to clarify this aspect.
It is noteworthy that all the CAE31(λ) values found comparing AE31 data with results by both PP and PaM approaches were higher than the corresponding values for AE33. This was expected, due to the different tape in use (recall CAE31_0=2.14 and CAE33_0=1.57 for the tapes in use).
Furthermore, multiple-scattering enhancement parameters calculated using babs,PP(λ) as the reference measurement for the absorption coefficient were always higher than those obtained using babs,PaM(λ) as the reference. This is due to the difference in the results by the two approaches evidenced in Sect. 3.2, related to the approximations performed by the MAAP in the evaluation of the input to the radiative transfer model (see Sect. 2.2.2 and 2.2.3).
Last, it is noteworthy that for both AE33 data in Table 3 and AE31 data in Table 4, PaM values are 17 %–18 % lower than the corresponding PP values. This seems higher than the slope reported in Table 2 (about 0.87–0.88), but a non-negligible negative intercept is also present; thus the global difference between the approaches is indeed higher than the value given by the slope.
3.4 Insights into αexp
For each 12 h time slot, Eq. (6) was exploited to calculate αexp using as input babs(λ) at all available wavelengths from AE31, AE33, and PP_UniMI with both PP and PaM approaches. In Fig. 4, the frequency distribution of the calculated αexp considering wavelength-independent C values (CAE31_0=2.14 and CAE33_0=1.57 for AE31 and AE33, respectively) to obtain babs(λ) from bATN(λ) using Eq. (1) is shown. This figure should be considered a reference for the results obtained by a routine analysis.
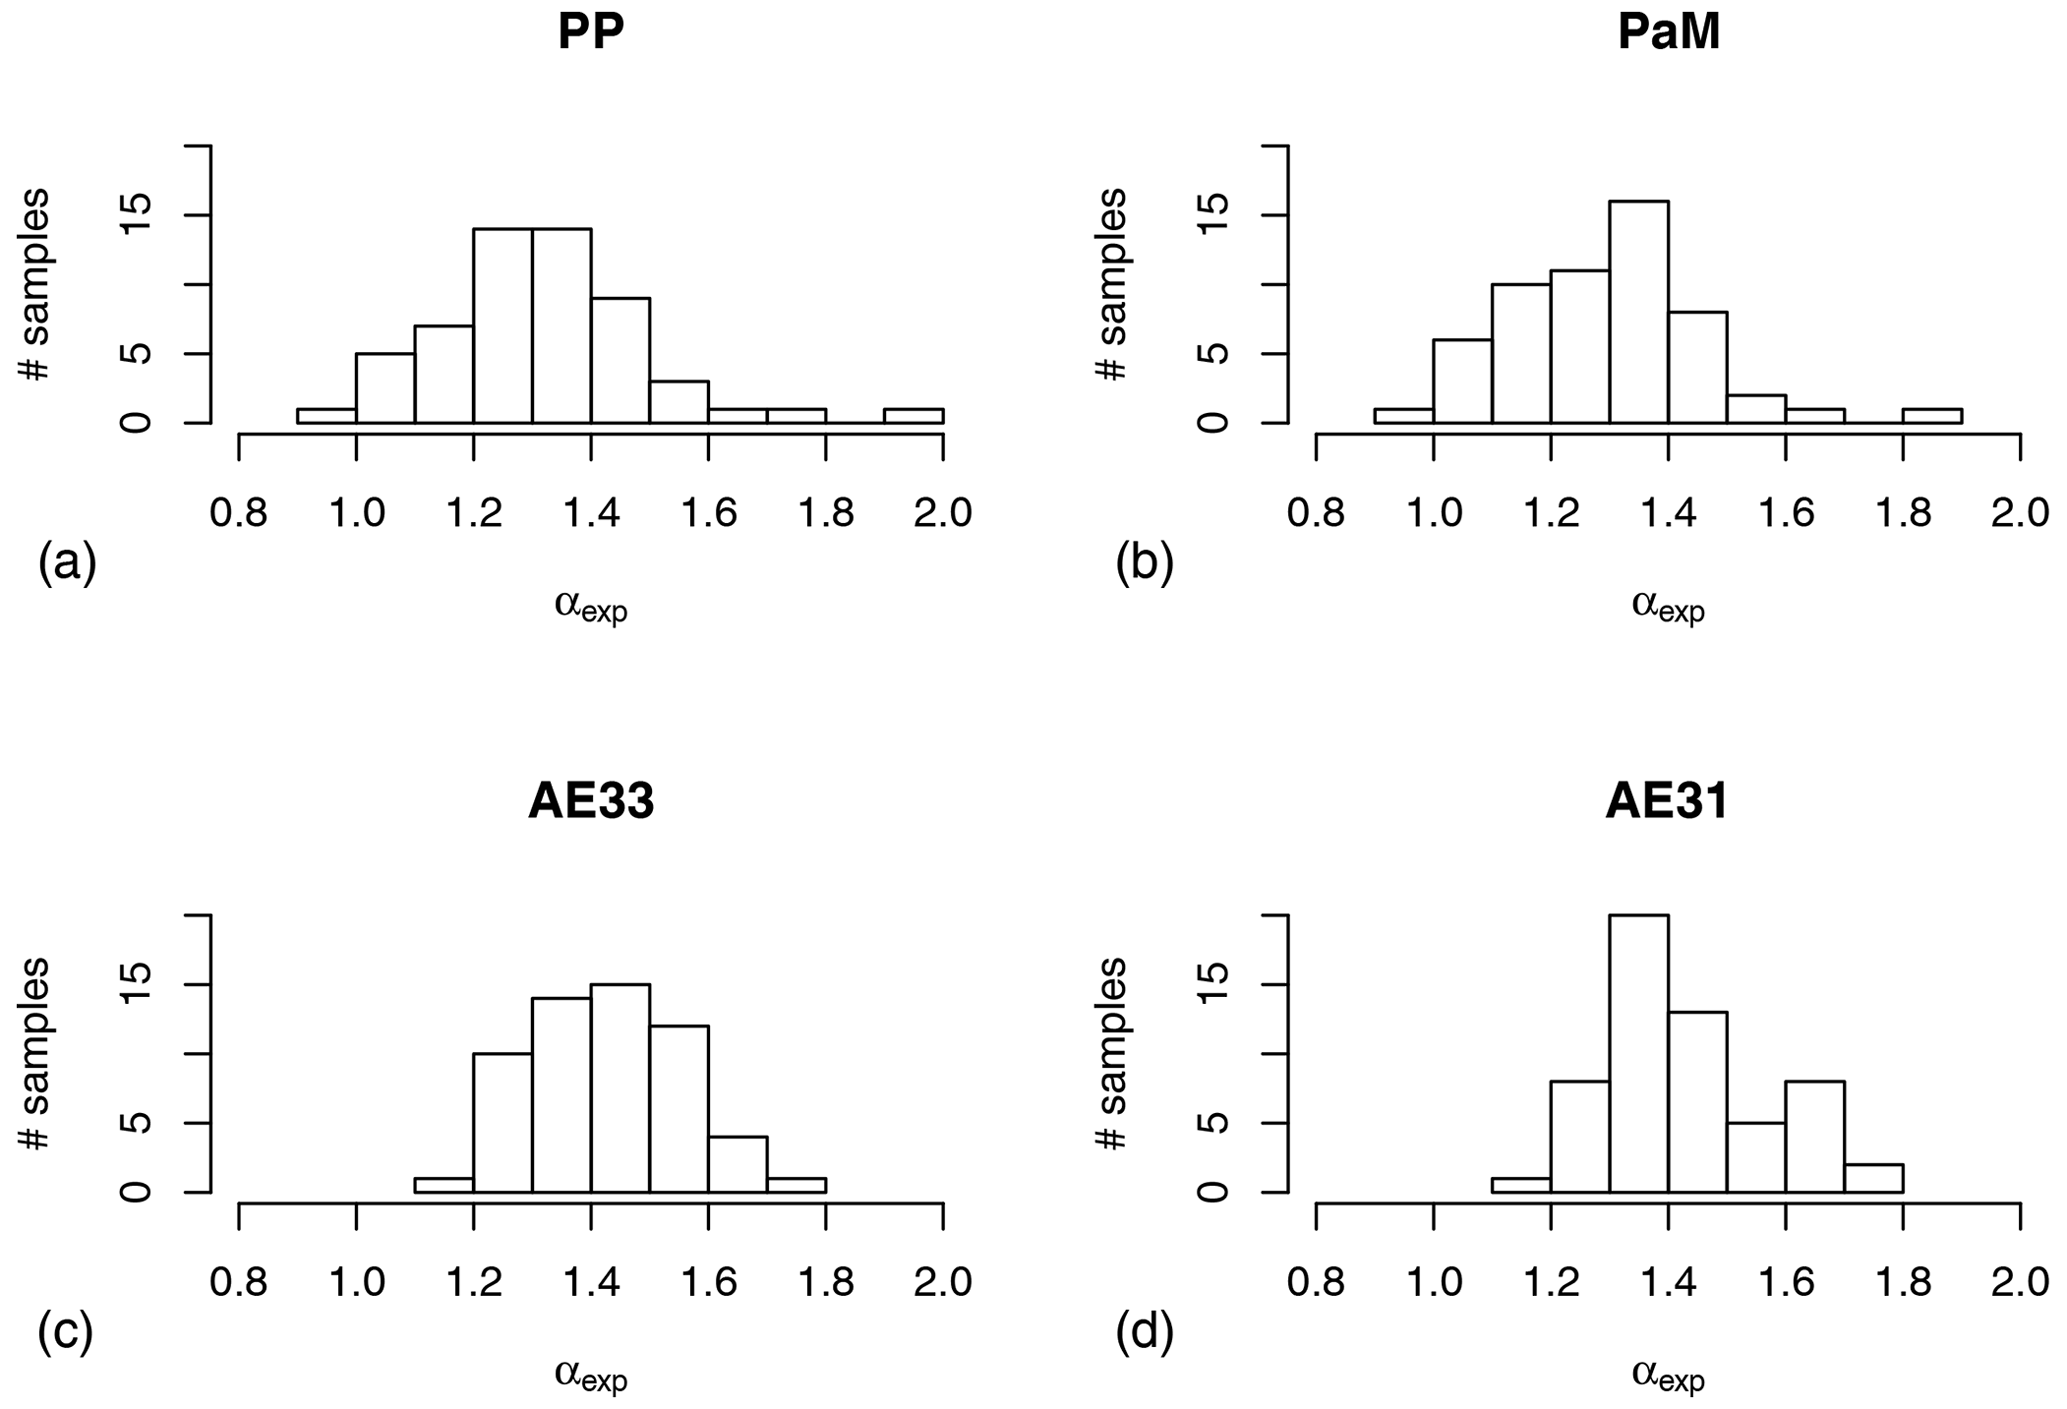
Figure 4Frequency distribution in terms of the number (#) of samples of the experimental absorption Ångström exponent (αexp) calculated using Eq. (6) for the different instruments. PP (a) and PaM (b) are calculated from four-wavelength babs(λ) information in the range of 405–780 nm, whereas AE33 (c) and AE31 (d) results are calculated from seven-wavelength babs(λ) obtained using CAE31_0 and CAE33_0 in the range of 370–950 nm.
Figure 4 showed that αexp frequency distribution was narrower for Aethalometers datasets () than for PP_UniMI datasets in both PP and PaM approaches (). Focusing on Aethalometers, the AE31 distribution is more skewed towards lower values (with a sharp maximum bin in the 1.3–1.4 range) than the AE33 distribution which is more symmetric.
It is also of interest to gain insights into the effect of applying different multiple-scattering enhancement parameters to the data from AE31 and AE33 on the measured αexp. It should be recalled that in Sect. 3.3 optimised multiple-scattering enhancement parameters were obtained at 470, 520, 660, and 880 nm only. So, αexp from AE31 and AE33 data were recalculated after evaluating babs(λ) from Eq. (1) only at 470, 520, 660, and 880 nm, with the following choices for the multiple-scattering enhancement parameters:
-
At all wavelengths C0_AE31=2.14 and C0_ AE33=1.57 were considered.
-
Daytime and night-time wavelength-dependent multiple-scattering enhancement parameters C, reported in Table 3 for AE33 and in Table 4 for AE31, were used. Both PP- and PaM-derived multiple-scattering enhancement parameters were considered. These values will be named “optimised multiple-scattering enhancement parameters” in the following.
Results of the αexp frequency distributions obtained from these tests are shown in Fig. 5.
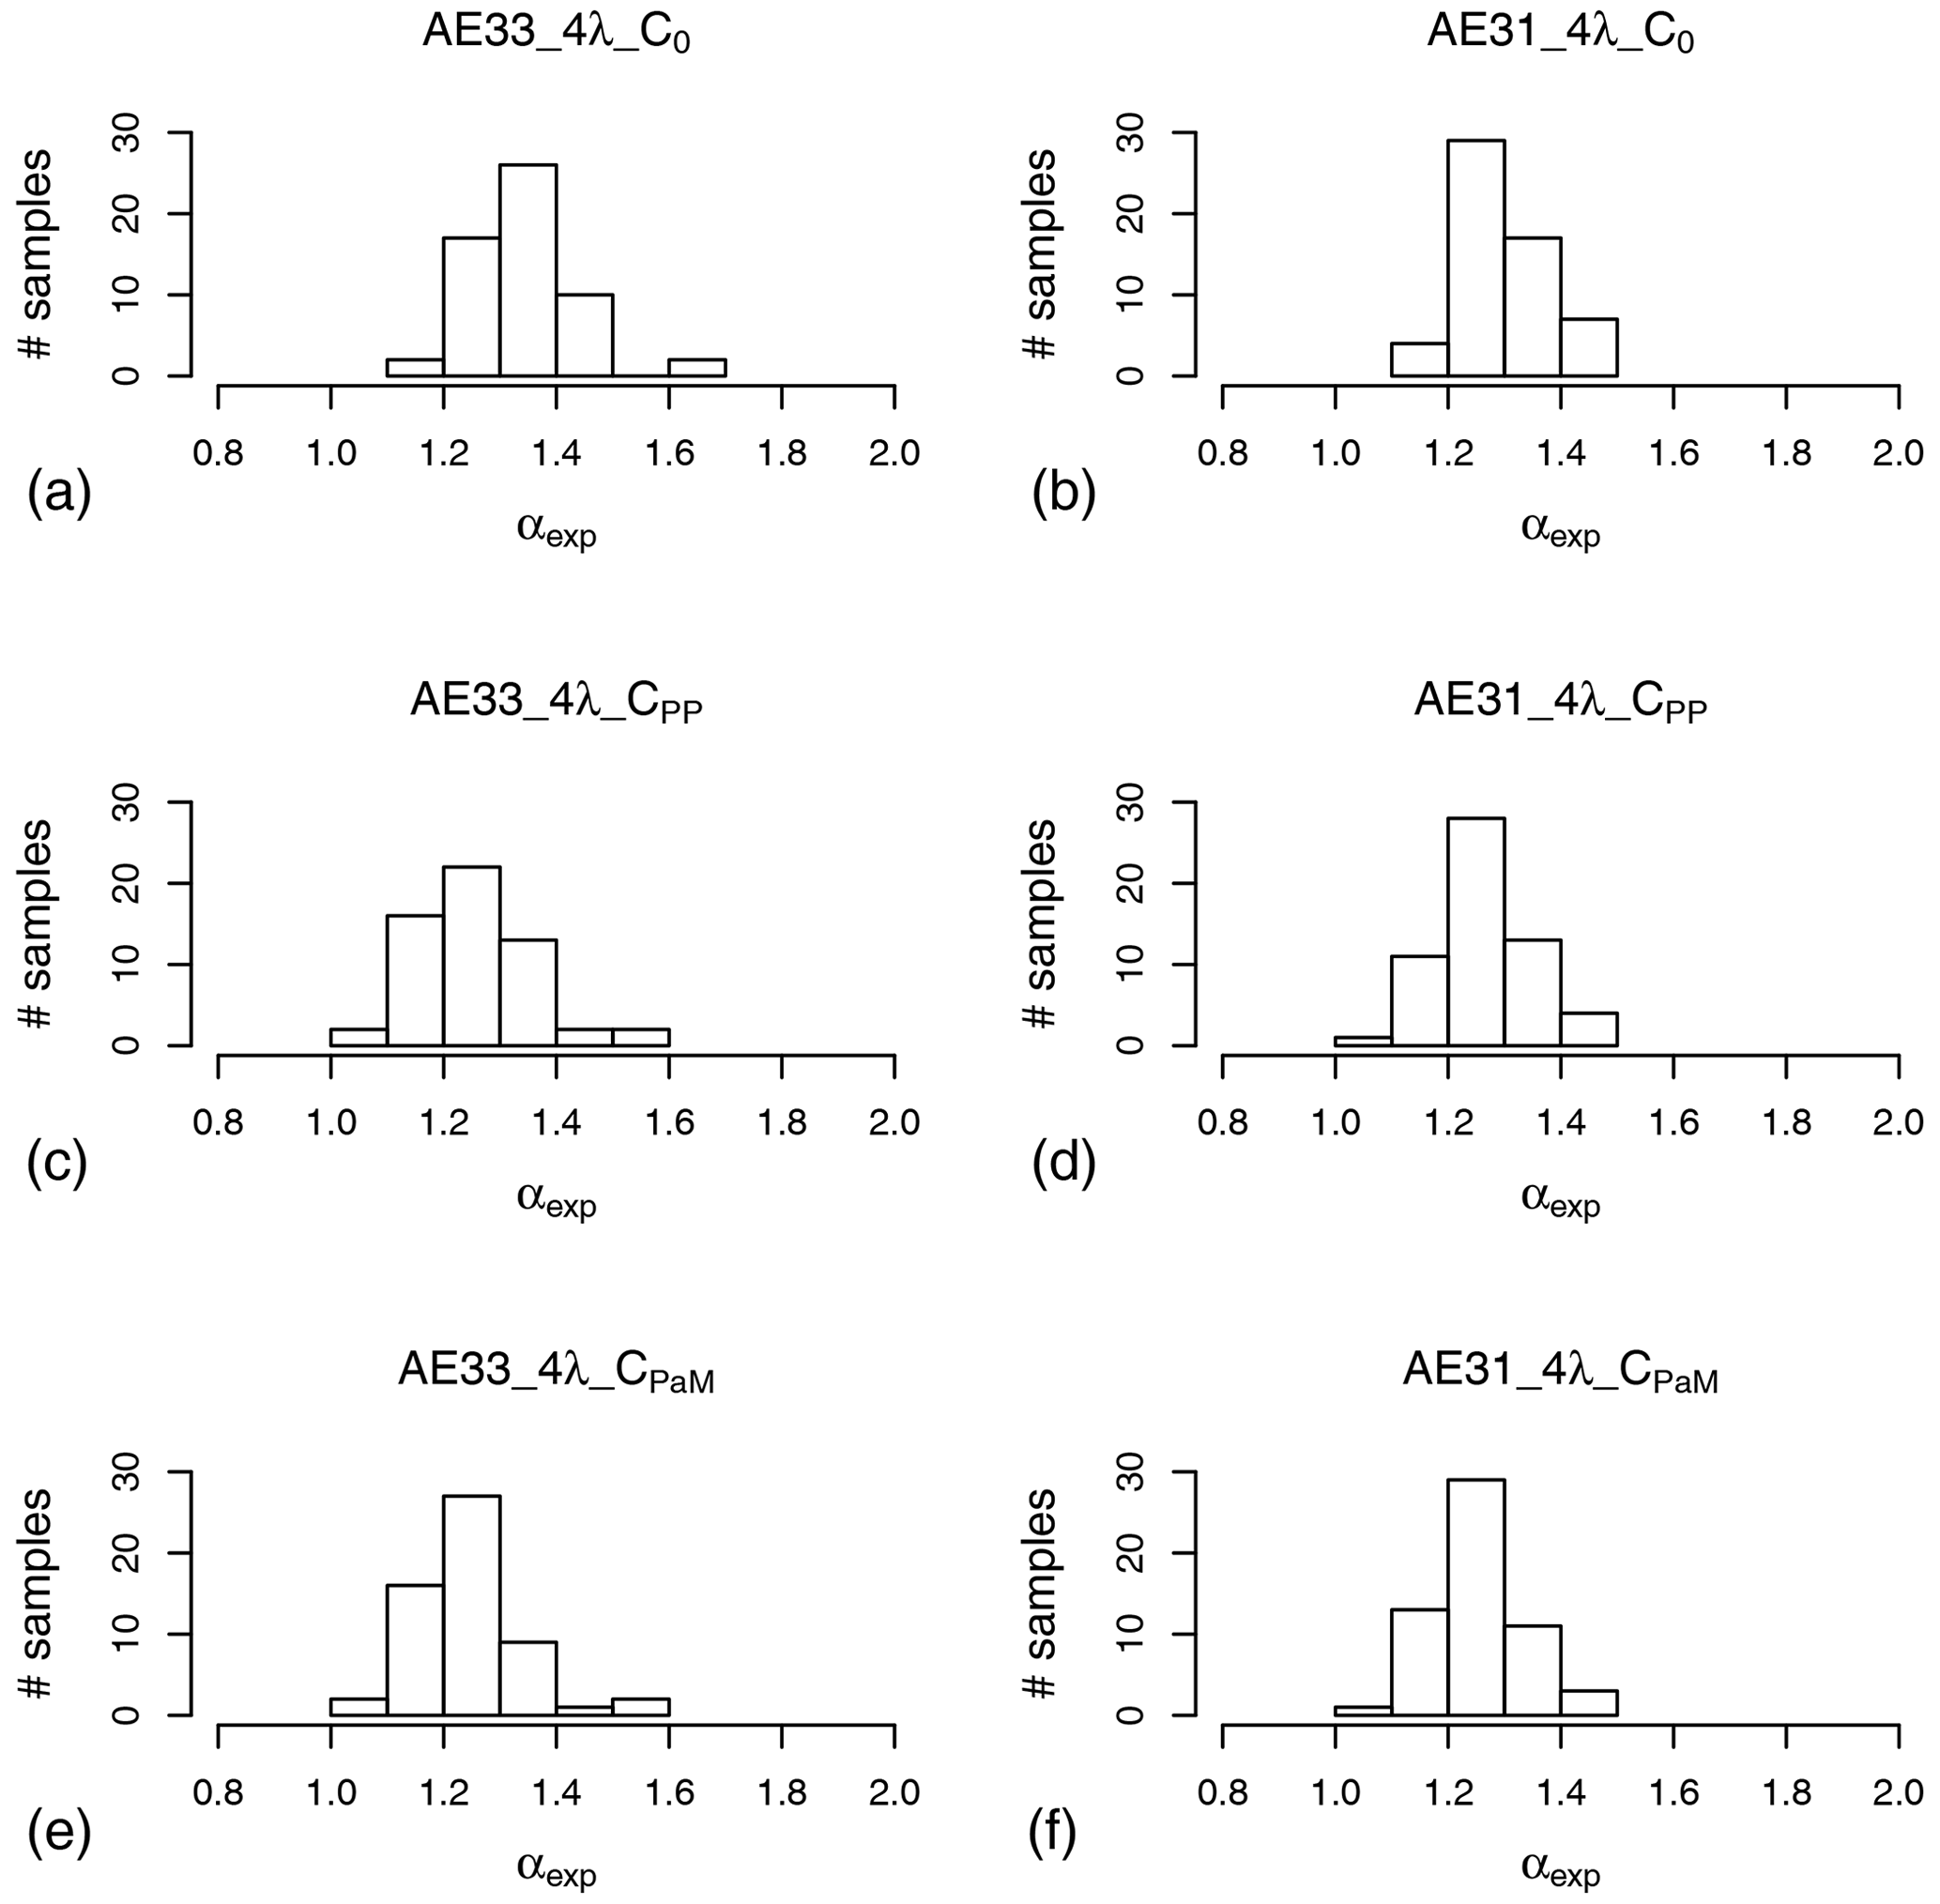
Figure 5Frequency distribution of αexp calculated from babs(λ) at 470, 520, 660, and 880 nm for AE33 (a, c, e) and AE31 (b, d, f). The babs(λ) values to be fitted were obtained from Eq. (1) with the following choices for the multiple-scattering enhancement parameters: C0_AE33 and C0_AE31 in (a, b), data in Table 3 for (c, e), and data in Table 4 for (d, f).
It is noteworthy that Figs. 5a and 4c as well as Figs. 5b and 4d differ only in the number of wavelengths used for αexp calculation. The comparison confirms the role of the chosen wavelengths in αexp calculation, as already mentioned in Sect. 2.4. In more detail, considering a narrower range of wavelengths, αexp distributions were narrower and peaked at lower values.
A comparison of Fig. 5c and d to Fig. 4a as well as of Fig. 5e and f to Fig. 4b showed that the use of optimised multiple-scattering enhancement parameters was not enough to harmonise the results of αexp from different instruments. There are different reasons for this. First of all, the measured absorption coefficients are the sum of (at least) two contributions (traffic, biomass burning) featuring different absorption Ångström exponents; thus the analytical dependence of their sum is not expected to be exactly exponential. Second, cross-sensitivity to scattering is expected to be an additive term, which is neglected in the approach presented in Eq. (1), which approximates the relationship between absorption and extinction by the use of a single multiplicative factor. Third, we are considering average factors and applying them to the whole dataset, whereas sample-by-sample differences are expected, e.g. in the scattering properties of the particles. Finally, it should be recalled that PP_UniMI wavelengths were 405, 532, 635, and 780 nm, whereas the wavelengths considered for Aethalometer four-wavelength calculations were 470, 520, 660, and 880 nm.
3.5 Aethalometer model results
As mentioned in Sect. 2.6, multi-wavelength information on the aerosol absorption coefficient can be used as input to the Aethalometer model for source apportionment. Section 3.4 showed differences in the wavelength dependencies of data from different instruments, as well as the impact of considering fixed or optimised multiple-scattering enhancement parameters. These observations point to the need for investigating the role of such differences in source apportionment results. So, the following will be investigated:
-
the role of applying the Aethalometer model using data from different instruments
-
the impact of applying wavelength-dependent multiple-scattering enhancement parameters on the Aethalometer model source apportionment results.
In this work, the Aethalometer model was run applying αFF=1 and αWB=2. These values were previously used in Bernardoni et al. (2017a) for the Milan area during an application using a dataset with available wavelength information in the range of 375–850 nm.
In the following, we will show results of the Aethalometer model run using as input data babs,PP(λ), babs,PaM(λ), and babs,AE31(λ) and babs,AE33(λ) obtained using both fixed multiple-scattering enhancement parameters and the optimised parameters presented in Sect. 3.3. Both the two-wavelength and the multi-wavelength fit approaches (with all the possible combinations explained in Sect. 2.6) were tested. A summary of the average apportionment, correlation coefficients between the apportioned wood burning babs,WB and levoglucosan measurements (rWB), and correlation coefficients between the apportioned fossil fuel combustion babs,FF and benzene measurements (rFF) obtained with all the approaches is reported in Table 5.
Table 5Absorption coefficient relative source apportionment using the Aethalometer model fixing αFF as 1 and αWB as 2. The model was applied to all available data using different data processing as presented in Sect. 2.6. Values at 880 nm for PP and PaM results were extrapolated. In the table, the notation refers to the wavelength used in the different two-wavelength approach tests.
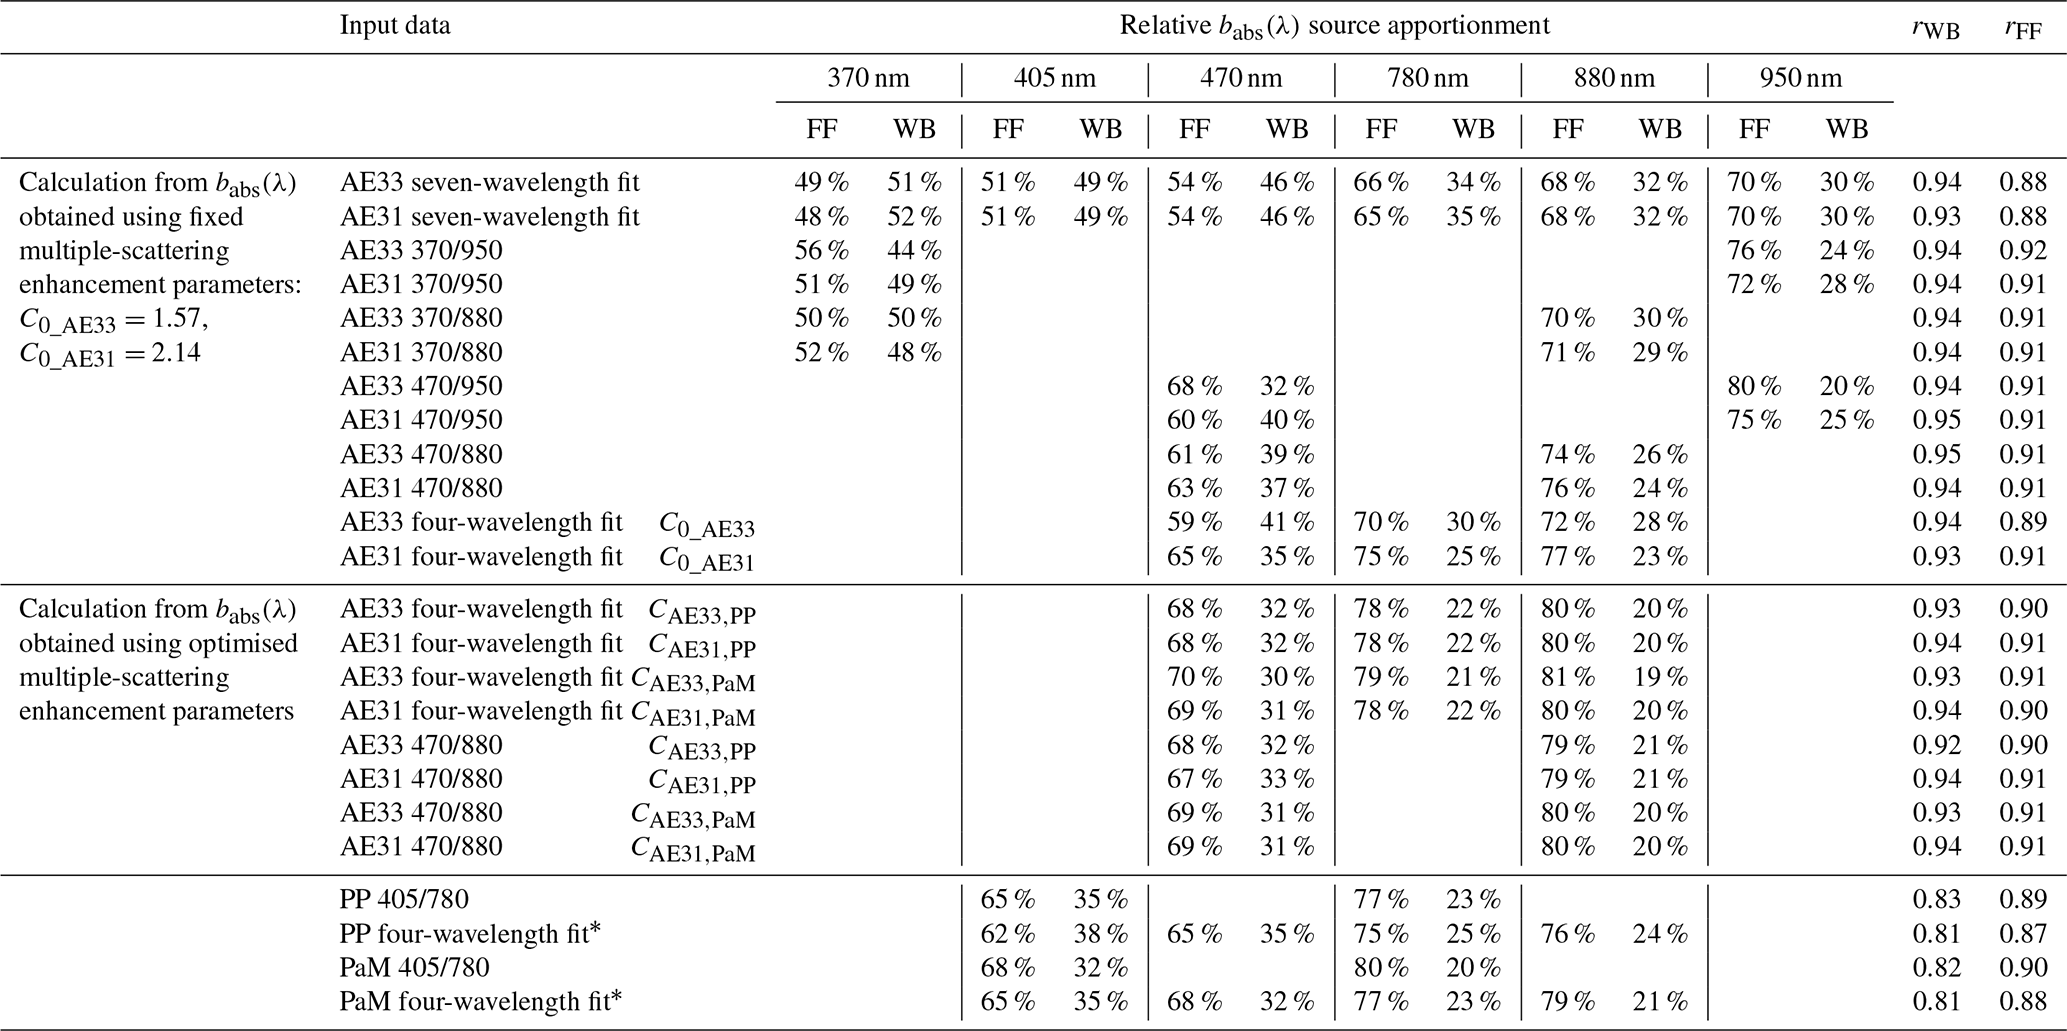
* The four-wavelength fit for PP and PaM data considers λ=405, 532, 635, and 780 nm.
From Table 5 and considering fixed multiple-scattering enhancement parameters for Aethalometers, the following can be noted:
-
The average apportionment percentage for AE31 and AE33 agreed within 7 %, provided that the same short wavelength was used as a reference (either 370 or 470 nm), regardless of the data-processing approach. Considering the same instrument, an average apportionment difference of up to 12 % was found at 470 nm for AE33 using the seven-wavelength approach compared to the two-wavelength one, using as input 470 and 950 nm. In any case, seven-wavelength apportionment is never in the range of variability found considering 470 nm as the lowest wavelength using the two-wavelength approach, still evidencing the impact of near-UV measurements on the source apportionment results.
-
Average PP_UniMI apportionment was within 6 % considering all approaches and within 3 % considering results from the four-wavelength fit. Thus, it should be mentioned that – even if we evidenced significant differences in absolute values for PP and PaM measurements in Sect. 3.2 – such differences do not impact significantly PP_UniMI relative source apportionment.
-
Correlation coefficients (rWB) between babs,WB and levoglucosan showed high correlation (rWB≥0.92) for AE33 and AE31 results, independently of the approach; in contrast, lower correlation was found with all the PP_UniMI approaches (rWB≤0.83). Further investigation is needed to understand the reasons for this. This effect was possibly related to the wider αexp frequency distribution found in Sect. 3.4 for PP_UniMI data. Indeed, due to the fewer assumptions in babs retrieval, PP_UniMI seems more sensitive than Aethalometers to sample-by-sample variability. Consequently, the approach of the Aethalometer model based on fixing unique values of αFF and αWB for the whole dataset can make it less suitable to its application to such data. Nevertheless, this needs further investigation, e.g. using multi-wavelength nephelometers in parallel to Aethalometers to perform more accurate corrections of Aethalometer data. The role of a single point affecting the correlation should also be evidenced. It does not result as an outlier looking at wavelength babs distribution, but its removal from the population increases rWB to 0.85–0.86, depending on the considered approach.
-
Correlation coefficients (rFF) between babs,FF and benzene are in the range of 0.87–0.92 (being slightly higher for Aethalometers), showing lower dependence on the instrument and/or approach than rWB.
Table 5 also allowed us to perform a comparison between Aethalometer apportionment obtained using fixed or optimised multiple-scattering enhancement parameters. As an example, considering input data in the range of 470–880 nm, AE31 and AE33 babs,FF relative contributions at 470 nm were in the range of 59 %–65 % considering fixed multiple-scattering enhancement parameters and 67 %–70 % in the case of optimised ones; similarly, also considering other wavelengths for comparison, the ranges do not overlap. Thus, even if wavelength variabilities of multiple-scattering enhancement parameters were mostly within the SE, they resulted in a significant impact on the average source apportionment results. Furthermore, PP_UniMI apportionments showed higher FF contributions than those obtained by AE31 and AE33 using fixed multiple-scattering enhancement parameters (up to 7 % when considering 470 nm as the lowest wavelength for Aethalometers and up to 17 % when comparing the seven-wavelength fit on AE33, again evidencing the important impact of the shortest wavelength on the source apportionment); in contrast, relative apportionment agreed within 5 % at most (and, in more detail, PP_UniMI source apportionment results were always within the variability in Aethalometer results by different approaches) when optimised multiple-scattering enhancement parameters were considered for Aethalometers.
This is an interesting result. Indeed, Sect. 3.4 showed that the application of optimised multiple-scattering enhancement parameters did not lead to fully harmonised αexp frequency distributions. Nevertheless, here we showed that the use of optimised multiple-scattering enhancement parameters can lead to the harmonisation at least of the average relative source apportionment.
3.6 MWAA model results
As explained in Sect. 2.7, the MWAA model for component apportionment was run using as input both seven-wavelength and five-wavelength AE31 and AE33 data. In Table 6, relative contributions of BC and BrC to babs(λ) obtained from the different tests are shown, together with αBrC (average±standard deviation) and rBrC. Only Aethalometer wavelengths also present in Table 5 are reported.
Table 6Absorption coefficient relative component apportionment using the Aethalometer model fixing αBC as 1. The model was applied to AE31 and AE33 data using different data processing as presented in Sect. 2.7. The presented rBrC refers to 470 nm in all cases.
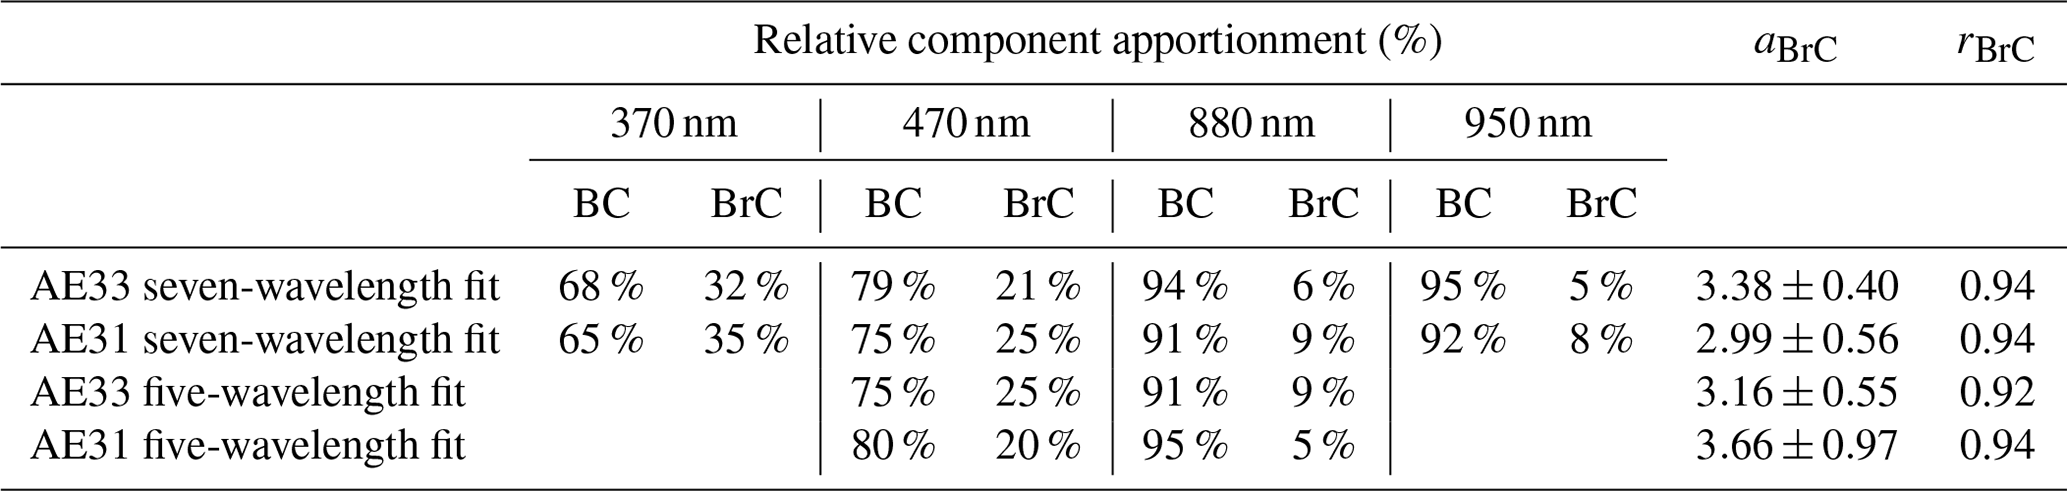
Table 6 shows that the component apportionment performed by the MWAA model is less sensitive to extreme wavelengths than the source apportionment performed by the Aethalometer model. Indeed, the highest discrepancy of 5 % in component apportionment and rBrC≥0.91 were found at 470 nm in all cases. This was probably related to the ability of the model to self-evaluate the most suitable value for αBrC as a function of input data. This was supported by the investigation of the impact of different input data (in terms of instrument and wavelength range) on the computed αBrC. In Fig. 6, frequency distributions of αBrC obtained in the different tests are shown: narrower distributions were obtained for AE33 than for AE31. This observation held for distributions obtained both at seven wavelengths (Fig. 6a and b) and at five wavelengths (Fig. 6c and d) and was confirmed considering that standard deviations of αBrC values (Table 6) are 1.4 and 1.8 times higher for AE31 than for AE33. As for average αBrC values, the role of the considered instrument or number of wavelengths is unclear. Indeed, the average αBrC obtained by AE33 data was 13 % higher and 14 % lower than those values obtained by AE31 considering seven wavelengths and five wavelengths, respectively. Furthermore, αBrC computed at seven wavelengths was 18 % lower and 7 % higher than the one computed at five wavelengths for AE31 and AE33, respectively.
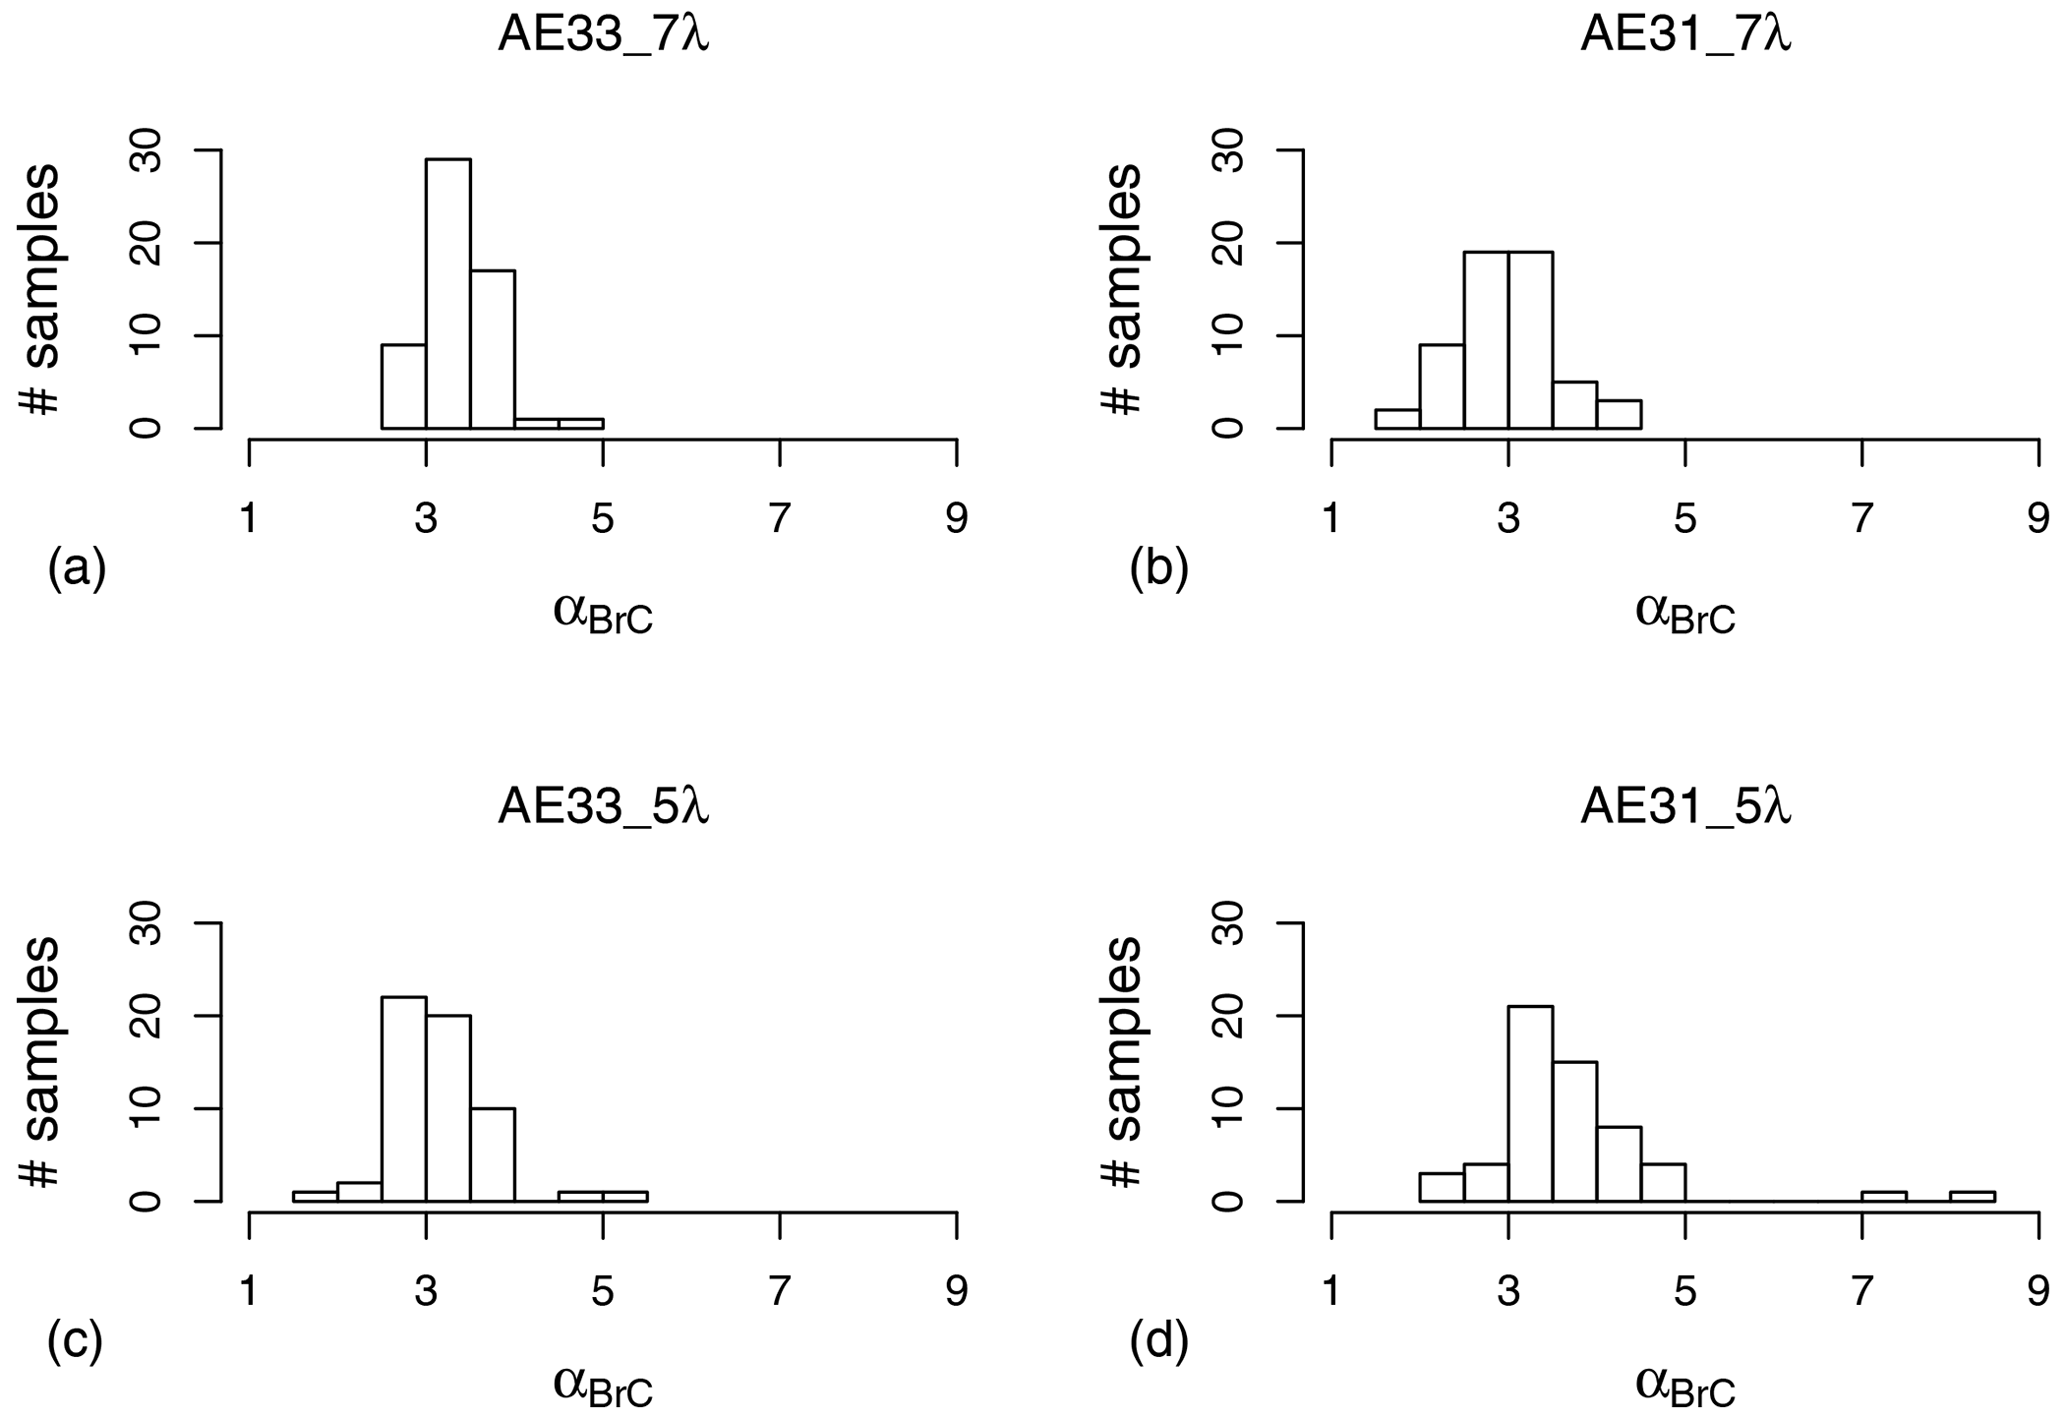
Figure 6Frequency distribution of αBrC computed by MWAA model for AE33 (a, c) and AE31 (b, d). A seven-wavelength babs fit was performed in (a, b), and a five-wavelength fit was performed in (b, d).
In this work, results from the EMEP/ACTRIS/COLOSSAL campaign carried out in Milan in winter 2018 were presented. The work explored some open issues in the measurements of the aerosol absorption coefficient by filter-based instrumentation and their impact on source (fossil fuel combustion/wood burning) and component (BC/BrC) apportionment.
Thanks to the comparison with off-line measurements carried out by the polar photometer PP_UniMI which performs high-angular-resolved measurement of the sample phase function (PP approach), we showed that the approximation introduced by the MAAP in the calculation can have a non-negligible impact on the results. Nevertheless, PP_UniMI provided results comparable to the MAAP when PP_UniMI was used applying the same approximations as the MAAP ones (PaM approach).
Furthermore, we exploited four-wavelength babs(λ) measurements carried out off-line by PP_UniMI to determine optimised multiple-scattering enhancement parameters at different wavelengths for Aethalometers AE31 and AE33 – CAE31(λ) and CAE33(λ), respectively – by comparison with loading-corrected bATN,AE31(λ) and bATN,AE33(λ). CAE31(λ) and CAE33(λ) were calculated using PP_UniMI data obtained by both considering all the high-angular-resolved information – babs,PP(λ) – and using the approximations set in the MAAP – babs,PaM(λ). We provided both results as the MAAP is often used as a reference instrument, and multiple-scattering enhancement parameters obtained exploiting babs,PaM(λ) can be directly compared to others present in the literature. Nevertheless, PP_UniMI performs a more detailed analysis by measuring the phase function in the scattering plane, in principle improving the accuracy of the measurements.
Considering all AE31 samples compared to the PaM approach, CAE31,PaM(λ) results were in the range of 3.47–3.58 and were comparable to the values prescribed by WMO GAW (3.5±25 %). As for AE33, depending on the wavelength was found from the PaM approach. Nevertheless, the PP approach indicated that higher values (up to and ) can be more suitable, highlighting the impact of MAAP approximations on the measured babs, but intercepts not comparable to zero were found in few cases, preventing the determination of an average value at 405 and 780 nm for AE33. This problem was overcome considering daytime and night-time data separately. In this case, daytime values of optimised multiple-scattering enhancement parameters were slightly higher than the night ones but within the standard error (SE), for both AE31 and AE33 as well as using PP and PaM approaches. Furthermore, also considering separately daytime and night-time data, values at different wavelengths were within the SE for the same calculation approach. Separated daytime and night-time optimised multiple-scattering enhancement parameters were used for further investigation.
Comparing CAE31(λ) at different wavelengths with all approaches for daytime and night-time data, they were all within the SE for AE31 and no statistically significant wavelength dependence was found in our work. For AE33, results at 470 and 520 nm are not comparable to those obtained at 660 and 880 nm within the SE; this suggests a weak wavelength dependence. Nevertheless, if 3×SE is considered the limit for statistically significant differences, then also for AE33 no statistically significant wavelength dependence can be claimed.
The analysis of the experimental absorption Ångström exponents (αexp) evidenced that significantly different values were obtained depending both on the instrument and on the chosen wavelength ranges from the same instruments. Wavelength-dependent multiple-scattering enhancement parameters determined in this work were also applied to data from AE31 and AE33, but they were not enough to harmonise frequency distributions from different instruments.
This work investigated the impact of such differences on the results of source apportionment by the Aethalometer model (by fixing a value of αFF=1 and αWB=2 already used in previous works in the area) and of the component apportionment by the MWAA model (fixing αBC as 1). The Aethalometer model was applied using as input babs data determined by PP_UniMI, AE31, and AE33. As for AE31 and AE33, babs(λ) values obtained using both fixed and optimised multiple-scattering enhancement parameters were used as input. The role of different choices for the considered wavelengths was also investigated, as well as of different calculation approaches. Inconsistencies in relative source apportionment were also found considering a single instrument, evidencing not only the role of the chosen wavelength range (already found in the literature) but also that small differences (within uncertainties) in the wavelength dependencies of multiple-scattering enhancement parameters affect significantly the output of the Aethalometer model. Significant differences were found between the apportionment results from PP_UniMI data and those obtained by AE31 and AE33 with fixed values for the multiple-scattering enhancement parameters. However, relative apportionment agreed within 5 % at most (and, in more detail, PP_UniMI source apportionment results were always within the variability in Aethalometer results by different approaches) when optimised multiple-scattering enhancement parameters were considered for Aethalometers. It is noteworthy that the application of optimised multiple-scattering enhancement parameters did not harmonise αexp frequency distributions among different instruments, but it led to consistent source apportionment results.
Focusing on the MWAA model, due to the features of the model our tests were limited to the assessment of the impact of extreme wavelengths on the model results for AE31 and AE33. The average apportionment of the relative contributions of BC and BrC from AE31 and AE33 showed little influence on the considered wavelength range (5 % maximum, to be compared to 11 % limiting Aethalometer model analysis to the tests comparable to those performed by the MWAA model). Nevertheless, open issues remain concerning the estimates of αBrC, whose average value was in the range of 2.99–3.66 depending on the instrument and the wavelength range input considered.
Code is available on request to the corresponding author. It was developed for personal use and no user-friendly interface is currently available.
Data are available on request to the corresponding author.
VB, LF, EB, GV, and RV designed and organised the sampling campaign to meet the final goals. VB developed the data analysis strategy for optimised multiple-scattering enhancement parameter retrieval and developed the multi-wavelength fit approach for the Aethalometer model. VB and LF validated and assembled the final database. VB, LF, ACF, GM, LS, SV, and GV collaborated on data analysis and reduction. VB, LF, GV, and RV realised the sampling campaign. AG, MR, and GM gave support for Aethalometer set-up. FS, SV, and ACF performed PP_UniMI measurements. DM and PP performed levoglucosan measurements. VB developed the software for multi-wavelength fit implementation of the Aethalometer model. RV supervised all the scientific activity. VB wrote the original draft. All co-authors commented and contributed to the final version of the paper.
The authors declare that they have no conflict of interest. Griša Močnik was employed at the manufacturer of the AE33 before the start of this work. At the time of the research, Asta Gregorič and Martin Rigler were employed by the manufacturer of the Aethalometer instruments.
The authors are grateful to Aerosol d.o.o. for the availability of the AE33 and to the Environmental Protection Agency of the Lombardy region (ARPA Lombardia) for the availability of benzene data.
This work was carried out with the GEMMA centre support in the framework of Project MIUR “Dipartimenti di Eccellenza 2018–2022”.
This research has been supported by the Istituto Nazionale di Fisica Nucleare (INFN) (Esperimento TRACCIA); the Ministero dell'Istruzione, dell'Università e della Ricerca (through the GEMMA centre, supported in the framework of Project “Dipartimenti di Eccellenza 2018–2022”); the European Cooperation in Science and Technology (COST) (COST Action CA16109 Chemical On-Line cOmpoSition and Source Apportionment of fine aerosoL, COLOSSAL); and the Slovenian Research Agency program P1-0385 “Remote sensing of atmospheric properties”.
This paper was edited by Hiren Jethva and reviewed by three anonymous referees.
Ammerlaan, B. A. J., Holzinger, R., Jedynska, A. D., and Henzing, J. S.: Technical note: Aerosol light absorption measurements with a carbon analyser – Calibration and precision estimates, Atmos. Environ., 164, 1–7, https://doi.org/10.1016/j.atmosenv.2017.05.031, 2017.
Arnott, W. P., Hamasha, K., Moosmüller, H., Sheridan, P. J., and Ogren, J. A.: Towards Aerosol Light-Absorption Measurements with a 7-Wavelength Aethalometer: Evaluation with a Photoacoustic Instrument and 3-Wavelength Nephelometer, Aerosol Sci. Tech., 39, 17–29, https://doi.org/10.1080/027868290901972, 2005.
Backman, J., Schmeisser, L., Virkkula, A., Ogren, J. A., Asmi, E., Starkweather, S., Sharma, S., Eleftheriadis, K., Uttal, T., Jefferson, A., Bergin, M., Makshtas, A., Tunved, P., and Fiebig, M.: On Aethalometer measurement uncertainties and an instrument correction factor for the Arctic, Atmos. Meas. Tech., 10, 5039–5062, https://doi.org/10.5194/amt-10-5039-2017, 2017.
Baumgardner, D., Popovicheva, O., Allan, J., Bernardoni, V., Cao, J., Cavalli, F., Cozic, J., Diapouli, E., Eleftheriadis, K., Genberg, P. J., Gonzalez, C., Gysel, M., John, A., Kirchstetter, T. W., Kuhlbusch, T. A. J., Laborde, M., Lack, D., Müller, T., Niessner, R., Petzold, A., Piazzalunga, A., Putaud, J. P., Schwarz, J., Sheridan, P., Subramanian, R., Swietlicki, E., Valli, G., Vecchi, R., and Viana, M.: Soot reference materials for instrument calibration and intercomparisons: a workshop summary with recommendations, Atmos. Meas. Tech., 5, 1869–1887, https://doi.org/10.5194/amt-5-1869-2012, 2012.
Bernardoni, V., Pileci, R. E., Caponi, L., and Massabò, D.: The Multi-Wavelength Absorption Analyzer (MWAA) model as a tool for source and component apportionment based on aerosol absorption properties: application to samples collected in different environments, Atmosphere, 8, 218, https://doi.org/10.3390/atmos8110218, 2017a.
Bernardoni, V., Valli, G., and Vecchi, R.: Set-up of a multi-wavelength polar photometer for the off-line measurement of light absorption properties of atmospheric aerosol collected with high-temporal resolution, J. Aerosol Sci., 107, 84–93, https://doi.org/10.1016/j.jaerosci.2017.02.009, 2017b.
Bond, T. C., Anderson, T. L., and Campbell, D.: Calibration and Intercomparison of Filter-Based Measurements of Visible Light Absorption by Aerosols, Aerosol Sci. Technol., 30, 582–600, https://doi.org/10.1080/027868299304435, 1999.
Bond, T. C., S. J. Doherty, D. W. Fahey, P. M. Forster, T. Berntsen, B. J. DeAngelo, M. G. Flanner, S. Ghan, B. Kärcher, D. Koch, S. Kinne, Y. Kondo, P. K. Quinn, M. C. Sarofim, M. G. Schultz, M. Schulz, C. Venkataraman, H. Zhang, S. Zhang, N. Bellouin, S. K. Guttikunda, P. K. Hopke, M. Z. Jacobson, J. W. Kaiser, Z. Klimont, U. Lohmann, J. P. Schwarz, D. Shindell, T. Storelvmo, S. G. Warren, and C. S. Zender: Bounding the role of black carbon in the climate system: A scientific assessment, J. Geophys. Res.-Atmos., 118, 5380–5552, https://doi.org/10.1002/jgrd.50171, 2013.
Collaud Coen, M., Weingartner, E., Apituley, A., Ceburnis, D., Fierz-Schmidhauser, R., Flentje, H., Henzing, J. S., Jennings, S. G., Moerman, M., Petzold, A., Schmid, O., and Baltensperger, U.: Minimizing light absorption measurement artifacts of the Aethalometer: evaluation of five correction algorithms, Atmos. Meas. Tech., 3, 457–474, https://doi.org/10.5194/amt-3-457-2010, 2010.
Cuesta-Mosquera, A., Močnik, G., Drinovec, L., Müller, T., Pfeifer, S., Minguillón, M. C., Björn, B., Buckley, P., Dudoitis, V., Fernández-García, J., Fernández-Amado, M., Ferreira De Brito, J., Flentje, H., Heffernan, E., Kalivitis, N., Kalogridis, A.-C., Keernik, H., Marmureanu, L., Luoma, K., Marinoni, A., Pikridas, M., Schauer, G., Serfozo, N., Servomaa, H., Titos, G., Yus-Díez, J., Zioła, N., and Wiedensohler, A.: Intercomparison and characterization of 23 Aethalometers under laboratory and ambient air conditions: Procedures and unit-to-unit variabilities, Atmos. Meas. Tech. Discuss. [preprint], https://doi.org/10.5194/amt-2020-344, in review, 2020.
Deming, W. E.: Statistical adjustment of data, Wiley, NY (Dover Publications edition, 1985), 1943.
Di Biagio, C., Formenti, P., Cazaunau, M., Pangui, E., Marchand, N., and Doussin, J.-F.: Aethalometer multiple scattering correction Cref for mineral dust aerosols, Atmos. Meas. Tech., 10, 2923–2939, https://doi.org/10.5194/amt-10-2923-2017, 2017.
Drinovec, L., Močnik, G., Zotter, P., Prévôt, A. S. H., Ruckstuhl, C., Coz, E., Rupakheti, M., Sciare, J., Müller, T., Wiedensohler, A., and Hansen, A. D. A.: The “dual-spot” Aethalometer: an improved measurement of aerosol black carbon with real-time loading compensation, Atmos. Meas. Tech., 8, 1965–1979, https://doi.org/10.5194/amt-8-1965-2015, 2015.
Ferrero, L., Močnik, G., Cogliati, S., Gregorič, A., Colombo, R., and Bolzacchini, E.: Heating Rate of Light Absorbing Aerosols: Time-Resolved Measurements, the Role of Clouds, and Source Identification, Environ. Sci. Technol., 52, 3546–3555, https://doi.org/10.1021/acs.est.7b04320, 2018.
Fialho, P., Hansen, A. D. A., and Honrath, R. E.: Absorption coefficients by aerosols in remote areas: a new approach to decouple dust and black carbon absorption coefficients using seven-wavelength Aethalometer data, J. Aerosol Sci., 36, 267–282, https://doi.org/10.1016/j.jaerosci.2004.09.004, 2005.
Forello, A. C., Bernardoni, V., Calzolai, G., Lucarelli, F., Massabò, D., Nava, S., Pileci, R. E., Prati, P., Valentini, S., Valli, G., and Vecchi, R.: Exploiting multi-wavelength aerosol absorption coefficients in a multi-time resolution source apportionment study to retrieve source-dependent absorption parameters, Atmos. Chem. Phys., 19, 11235–11252, https://doi.org/10.5194/acp-19-11235-2019, 2019.
Forello, A. C., Amato, F., Bernardoni, V., Calzolai, G., Canepari, S., Costabile, F., Di Liberto, L., Gualtieri, M., Lucarelli, F., Nava, S., Perrino, C., Petralia, E., Valentini, S., Valli, G., and Vecchi, R.: Gaining knowledge on source contribution to aerosol optical absorption properties and organics by receptor modelling, Atmos. Environ., 243, 117873, https://doi.org/10.1016/j.atmosenv.2020.117873, 2020.
Fuller, G. W., Tremper, A. H., Baker, T. D., Yttri, K. E., and Butterfield, D.: Contribution of wood burning to PM10 in London, Atmos. Environ., 87, 87–94, https://doi.org/10.1016/j.atmosenv.2013.12.037, 2014.
GAW Report No. 227: WMO/GAW Aerosol Measurement Procedures, Guidelines and Recommendations, 2nd edn., ISBN: 978-92-63-11177-7, 2016.
Harrison, R. M., Beddows, D. C. S., Jones, A. M., Calvo, A., Alves, C., and Pio, C: An evaluation of some issues regarding the use of aethalometers to measure woodsmoke concentrations, Atmos. Environ., 80, 540–548, https://doi.org/10.1016/j.atmosenv.2013.08.026, 2013.
Hänel, G.: Radiation budget of the boundary layer: Part II. Simultaneous measurement of mean solar volume absorption and extinction coefficients of particles, Beit. Phys. Atmos., 60, 241–247, 1987.
Hänel, G.: Optical properties of atmospheric particles: Complete parameter sets obtained through polar photometry and an improved inversion technique, Appl. Optics, 33, 7187–7199, https://doi.org/10.1364/AO.33.007187, 1994.
Hansen, A. D. A., Rosen, H., and Novakov, T.: Real-time measurement of the absorption coefficient of aerosol particles, Appl. Optics, 21, 3060–3062, 1982.
Helin, A., Niemi, J., Virkkula, A., Pirjola, L., Teinilä, K., Backman, J., Aurela, M., Saarikoski, S., Rönkkö, T., Asmi, E., and Timonen, H.: Characteristics and source apportionment of black carbon in the Helsinki metropolitan area, Finland, Atmos. Environ., 190, 87–98, https://doi.org/10.1016/j.atmosenv.2018.07.022, 2018.
IPCC Climate Change 2013: The Physical Science Basis. Contribution of Working Group I to the Fifth Assessment Report of the Intergovernmental Panel on Climate Change, eds: Stocker, T. F., Qin, D., Plattner, G.-K., Tignor, M., Allen, S. K., Boschung, J., Nauels, A., Xia, Y., Bex, V., and Midgley, P. M., Cambridge University Press, Cambridge, United Kingdom and New York, NY, USA, 1535 pp., https://doi.org/10.1017/CBO9781107415324, 2013.
Kim, J.-H., Kim, S.-W., Ogren, J. A., Sheridan, P. J., Yoon, S.-C., Sharma, S., and Lin, N.-H.: Multiple scattering correction factor estimation for aethalometer aerosol absorption coefficient measurement, Aerosol Sci. Technol., 53, 160–171, https://doi.org/10.1080/02786826.2018.1555368, 2019.
Kumar, N. K., Corbin, J. C., Bruns, E. A., Massabó, D., Slowik, J. G., Drinovec, L., Močnik, G., Prati, P., Vlachou, A., Baltensperger, U., Gysel, M., El-Haddad, I., and Prévôt, A. S. H.: Production of particulate brown carbon during atmospheric aging of residential wood-burning emissions, Atmos. Chem. Phys., 18, 17843–17861, https://doi.org/10.5194/acp-18-17843-2018, 2018.
Lack, D. A., Bahreini, R., Langridge, J. M., Gilman, J. B., and Middlebrook, A. M.: Brown carbon absorption linked to organic mass tracers in biomass burning particles, Atmos. Chem. Phys., 13, 2415–2422, https://doi.org/10.5194/acp-13-2415-2013, 2013.
Laing, J. R., Jaffe, D. A., and Sedlacek, A. J. III: Comparison of filter-based absorption measurements of biomass burning aerosol and background aerosol at the Mt. Bachelor observatory, Aerosol Air Qual. Res., 20, 663–678, https://doi.org/10.4209/aaqr.2019.06.0298, 2020.
Laj, P., Bigi, A., Rose, C., Andrews, E., Lund Myhre, C., Collaud Coen, M., Lin, Y., Wiedensohler, A., Schulz, M., Ogren, J. A., Fiebig, M., Gliß, J., Mortier, A., Pandolfi, M., Petäja, T., Kim, S.-W., Aas, W., Putaud, J.-P., Mayol-Bracero, O., Keywood, M., Labrador, L., Aalto, P., Ahlberg, E., Alados Arboledas, L., Alastuey, A., Andrade, M., Artíñano, B., Ausmeel, S., Arsov, T., Asmi, E., Backman, J., Baltensperger, U., Bastian, S., Bath, O., Beukes, J. P., Brem, B. T., Bukowiecki, N., Conil, S., Couret, C., Day, D., Dayantolis, W., Degorska, A., Eleftheriadis, K., Fetfatzis, P., Favez, O., Flentje, H., Gini, M. I., Gregorič, A., Gysel-Beer, M., Hallar, A. G., Hand, J., Hoffer, A., Hueglin, C., Hooda, R. K., Hyvärinen, A., Kalapov, I., Kalivitis, N., Kasper-Giebl, A., Kim, J. E., Kouvarakis, G., Kranjc, I., Krejci, R., Kulmala, M., Labuschagne, C., Lee, H.-J., Lihavainen, H., Lin, N.-H., Löschau, G., Luoma, K., Marinoni, A., Martins Dos Santos, S., Meinhardt, F., Merkel, M., Metzger, J.-M., Mihalopoulos, N., Nguyen, N. A., Ondracek, J., Pérez, N., Perrone, M. R., Petit, J.-E., Picard, D., Pichon, J.-M., Pont, V., Prats, N., Prenni, A., Reisen, F., Romano, S., Sellegri, K., Sharma, S., Schauer, G., Sheridan, P., Sherman, J. P., Schütze, M., Schwerin, A., Sohmer, R., Sorribas, M., Steinbacher, M., Sun, J., Titos, G., Toczko, B., Tuch, T., Tulet, P., Tunved, P., Vakkari, V., Velarde, F., Velasquez, P., Villani, P., Vratolis, S., Wang, S.-H., Weinhold, K., Weller, R., Yela, M., Yus-Diez, J., Zdimal, V., Zieger, P., and Zikova, N.: A global analysis of climate-relevant aerosol properties retrieved from the network of Global Atmosphere Watch (GAW) near-surface observatories, Atmos. Meas. Tech., 13, 4353–4392, https://doi.org/10.5194/amt-13-4353-2020, 2020.
Laskin, A., Laskin, J., and Nizkorodov, S. A.: Chemistry of Atmospheric Brown Carbon, Chem. Rev., 115, 4335–4382, https://doi.org/10.1021/cr5006167, 2015.
Liousse, C., Cachier, H., and Jennings, S. G.: Optical and thermal measurements of black carbon aerosol content in different environments: variation of the specific attenuation cross-section, sigma (σ), Atmos. Environ. A-Gen., 27, 1203–1211, https://doi.org/10.1016/0960-1686(93)90246-U, 1993.
Liu, S., Aiken, A. C., Gorkowski, K., Dubey, M. K., Cappa, C. D., Williams, L. R., Herndon, S. C., Massoli, P., Fortner, E. C., Chhabra, P. S., Fortner, E. C., Chhabra, P. S., Brooks, W. A., Onasch, T. B., Jayne, J. T., Worsnop, D. R., China, S., Sharma, N., Mazzoleni, C., Xu, L., Ng, N. L., Liu, D., Allan, J. D., Lee, J. D., Fleming, Z. L., Mohr, C., Zotter, P., Szidat, S., and Prévôt, A. S. H.: Enhanced light absorption by mixed source black and brown carbon particles in UK winter, Nat. Commun., 6, 8435, https://doi.org/10.1038/ncomms9435, 2015.
Lu, Z., Streets, D. G., Winijkul, E., Yan, F., Chen, Y., Bond, T. C., Feng, Y., Dubey, M. K., Liu, S., Pinto, J. P., and Carmichael G. R.: Light Absorption Properties and Radiative Effects of Primary Organic Aerosol Emissions, Environ. Sci. Technol., 49, 4868–4877, https://doi.org/10.1021/acs.est.5b00211, 2015.
Martinsson, J., Abdul Azeem, H., Sporre, M. K., Bergström, R., Ahlberg, E., Öström, E., Kristensson, A., Swietlicki, E., and Eriksson Stenström, K.: Carbonaceous aerosol source apportionment using the Aethalometer model – evaluation by radiocarbon and levoglucosan analysis at a rural background site in southern Sweden, Atmos. Chem. Phys., 17, 4265–4281, https://doi.org/10.5194/acp-17-4265-2017, 2017.
Massabò, D., Bernardoni, V., Bove, M. C., Brunengo, A. M., Cuccia, E., Piazzalunga, A., Prati, P., Valli, G., and Vecchi, R.: A multi-wavelength optical set-up for the characterization of carbonaceous particulate matter, J. Aerosol Sci. 60, 34–46, https://doi.org/10.1016/j.jaerosci.2013.02.006, 2013.
Massabò, D., Caponi, L., Bernardoni, V., Bove, M. C., Brotto, P., Calzolai, G., Cassola, F., Chiari, M., Fedi, M. E., Fermo, P., Giannoni, M., Lucarelli, F., Nava, S., Piazzalunga, A., Valli, G., Vecchi, R., and Prati, P.: Multi-wavelength optical determination of black and brown carbon in atmospheric aerosols, Atmos. Environ., 108, 1–12, https://doi.org/10.1016/j.atmosenv.2015.02.058, 2015.
Moosmüller, H., Chakrabarty, R. K., and Arnott, W. P.: Aerosol light absorption and its measurement: A review, J. Quant. Spectrosc. Rad., 110, 844–878, https://doi.org/10.1016/j.jqsrt.2009.02.035, 2009.
Müller, T.: Development of correction factors for Aethalometers AE31 and AE33, available at: http://www.wmo-gaw-wcc-aerosol-physics.org/files/WP3.2-Aethalometer-AE31-AE33-Mueller.pdf (last access: 18 March 2020), 2015.
Müller, T., Henzing, J. S., de Leeuw, G., Wiedensohler, A., Alastuey, A., Angelov, H., Bizjak, M., Collaud Coen, M., Engström, J. E., Gruening, C., Hillamo, R., Hoffer, A., Imre, K., Ivanow, P., Jennings, G., Sun, J. Y., Kalivitis, N., Karlsson, H., Komppula, M., Laj, P., Li, S.-M., Lunder, C., Marinoni, A., Martins dos Santos, S., Moerman, M., Nowak, A., Ogren, J. A., Petzold, A., Pichon, J. M., Rodriquez, S., Sharma, S., Sheridan, P. J., Teinilä, K., Tuch, T., Viana, M., Virkkula, A., Weingartner, E., Wilhelm, R., and Wang, Y. Q.: Characterization and intercomparison of aerosol absorption photometers: result of two intercomparison workshops, Atmos. Meas. Tech., 4, 245–268, https://doi.org/10.5194/amt-4-245-2011, 2011.
Petzold, A. and Schönlinner, M.: Multi-angle absorption photometry – A new method for the measurement of aerosol light absorption and atmospheric black carbon, J. Aerosol Sci., 35, 421–441, https://doi.org/10.1016/j.jaerosci.2003.09.005, 2004.
Petzold, A., Kopp, C., and Niessner, R.: The Dependence of the Specific Attenuation Cross-Section on Black Carbon Mass Fraction and Particle Size, Atmos. Environ., 31, 661–672, https://doi.org/10.1016/S1352-2310(96)00245-2, 1997.
Petzold, A., Schloesser, H., Sheridan, P. J., Arnott W. P., Ogren J. A., and Virkkula, A.: Evaluation of Multiangle Absorption Photometry for Measuring Aerosol Light Absorption, Aerosol Sci. Technol., 39, 40–51, https://doi.org/10.1080/027868290901945, 2005.
Petzold, A., Ogren, J. A., Fiebig, M., Laj, P., Li, S.-M., Baltensperger, U., Holzer-Popp, T., Kinne, S., Pappalardo, G., Sugimoto, N., Wehrli, C., Wiedensohler, A., and Zhang, X.-Y.: Recommendations for reporting ”black carbon” measurements, Atmos. Chem. Phys., 13, 8365–8379, https://doi.org/10.5194/acp-13-8365-2013, 2013.
Piazzalunga, A., Fermo, P., Bernardoni, V., Vecchi, R., Valli, G., De Gregorio, M.A: A simplified method for levoglucosan quantification in wintertime atmospheric particulate matter by high performance anion-exchange chromatography coupled with pulsed amperometric detection, Int. J. Environ. Anal. Chem., 90, 934–947, https://doi.org/10.1080/03067310903023619, 2010.
Ripley, B. D. and Thompson, M: Regression techniques for the detection of analytical bias. Analyst, 112, 377–383. https://doi.org/10.1039/AN9871200377, 1987.
Saleh, R., Robinson, E. S., Tkacik, D. S., Ahern, A. T., Liu, S., Aiken, A. C., Sullivan, R. C., Presto, A. A., Dubey, M. K., Yokelson, R. J., Donahue, N. M. and Robinson, A. L., Brownness of organics in aerosols from biomass burning linked to their black carbon content, Nat. Geosci., 7, 647–650, https://doi.org/10.1038/NGEO2220, 2014.
Sandradewi, J., Prévôt, A. S. H., Szidat, S., Perron, N., Alfarra, M. R., Lanz, V. A., Weingartner, E., and Baltensperger, U.: Using aerosol light absorption measurements for the quantitative determination of wood burning and traffic emission contributions to particulate matter, Environ. Sci. Technol., 42, 3316–3323, https://doi.org/10.1021/es702253m, 2008a.
Sandradewi, J., Prévôt, A. S. H., Weingartner, E., Schmidhauser, R., Gysel, M., and Baltensperger, U.: A study of wood burning and traffic aerosols in an Alpine valley using a multi-wavelength Aethalometer, Atmos. Environ., 42, 101–112, https://doi.org/10.1016/j.atmosenv.2007.09.034, 2008b.
Saturno, J., Pöhlker, C., Massabò, D., Brito, J., Carbone, S., Cheng, Y., Chi, X., Ditas, F., Hrabě de Angelis, I., Morán-Zuloaga, D., Pöhlker, M. L., Rizzo, L. V., Walter, D., Wang, Q., Artaxo, P., Prati, P., and Andreae, M. O.: Comparison of different Aethalometer correction schemes and a reference multi-wavelength absorption technique for ambient aerosol data, Atmos. Meas. Tech., 10, 2837–2850, https://doi.org/10.5194/amt-10-2837-2017, 2017.
Schmid, O., Artaxo, P., Arnott, W. P., Chand, D., Gatti, L. V., Frank, G. P., Hoffer, A., Schnaiter, M., and Andreae, M. O.: Spectral light absorption by ambient aerosols influenced by biomass burning in the Amazon Basin. I: Comparison and field calibration of absorption measurement techniques, Atmos. Chem. Phys., 6, 3443–3462, https://doi.org/10.5194/acp-6-3443-2006, 2006.
Segura, S., Estellés, V., Titos, G., Lyamani, H., Utrillas, M. P., Zotter, P., Prévôt, A. S. H., Močnik, G., Alados-Arboledas, L., and Martínez-Lozano, J. A.: Determination and analysis of in situ spectral aerosol optical properties by a multi-instrumental approach, Atmos. Meas. Tech., 7, 2373–2387, https://doi.org/10.5194/amt-7-2373-2014, 2014.
Valentini, S., Bernardoni, V., Massabò, D., Prati, P., Valli, G., and Vecchi, R.: Tailoring coefficients in the IMPROVE algorithm to assess site-specific reconstructed light extinction, Atmos. Environ., 172, 168–176, https://doi.org/10.1016/j.atmosenv.2017.10.038, 2018.
Valentini S., Barnaba, F., Bernardoni, V., Calzolai G., Costabile, F., Di Liberto, L., Forello, A. C., Gobbi, G. P., Gualtieri, M., Lucarelli, F., Nava, S., Petralia, E., Valli, G., Wiedensohler, A., and Vecchi, R: Classifying aerosol particles through the combination of optical and physical-chemical properties: Results from a wintertime campaign in Rome (Italy), Atmos. Res., 235, 104799, https://doi.org/10.1016/j.atmosres.2019.104799, 2020.
Valentini, S., Bernardoni, V., Ciniglia D., Forello, A. C., Massabó, D., Prati, P., Soldan, F., Valli G., and Vecchi R.: Applicability of Benchtop Multi-Wavelength Polar Photometers to Off-line Measurements of the Multi-Angle Absorption Photometer (MAAP) Samples, J. Aerosol Sci., 152, 105701, https://doi.org/10.1016/j.jaerosci.2020.105701, 2021.
Vecchi, R., Bernardoni, V., Paganelli, C., and Valli, G.: A filter-based light-absorption measurement with polar photometer: Effects of sampling artefacts from organic carbon, J. Aerosol Sci., 70, 15–25, https://doi.org/10.1016/j.jaerosci.2013.12.012, 2014.
Virkkula, A.: Correction of the Calibration of the 3-wavelength Particle Soot Absorption Photometer (3λ PSAP), Aerosol Sci. Tech., 44, 706–712, https://doi.org/10.1080/02786826.2010.482110, 2010.
Virkkula, A., Mäkelä, T., Hillamo, R., Yli-Tuomi, T., Hirsikko, A., Hämeri, K., and Koponen, I. K.: A simple procedure for correcting loading effects of aethalometer data, J. Air Waste Manage., 57, 1214–1222, https://doi.org/10.3155/1047-3289.57.10.1214, 2007.
Washenfelder, R. A., Attwood, A. R., Brock, C. A., Guo, H., Xu, L., Weber, R. J., Ng, N. L., Allen, H. M., Ayres, B. R., Baumann, K., R. C., Cohen, Draper, D. C., Duffey, K. C., Edgerton, E., Fry J. L., Hu, W. W., Jimenez, J. L., Palm, B. B., Romer, P., Stone, E. A., Wooldridge, P. J., and Brown, S. S: Biomass burning dominates brown carbon absorption in the rural southeastern United States, Geophys. Res. Lett., 42, 653–664, https://doi.org/10.1002/2014GL062444, 2015.
Weingartner, E., Saathoff, H., Schnaiter, M., Streit, N., Bitnar, B., and Baltensperger, U.: Absorption of light by soot particles: Determination of the absorption coefficient by means of aethalometers, J. Aerosol Sci., 34, 1445–1463, https://doi.org/10.1016/S0021-8502(03)00359-8, 2003.
Zhao, G., Yu, Y., Tian, P., Li, J., Guo, S. and Zhao, C.: Evaluation and Correction of the Ambient Pparticle Sectral Light Absorption Measured Using a Filter-based Aethalometer, Aerosol Air Qual. Res, 20, 1833–1841, https://doi.org/10.4209/aaqr.2019.10.0500, 2020.
Zotter, P., Herich, H., Gysel, M., El-Haddad, I., Zhang, Y., Močnik, G., Hüglin, C., Baltensperger, U., Szidat, S., and Prévôt, A. S. H.: Evaluation of the absorption Ångström exponents for traffic and wood burning in the Aethalometer-based source apportionment using radiocarbon measurements of ambient aerosol, Atmos. Chem. Phys., 17, 4229–4249, https://doi.org/10.5194/acp-17-4229-2017, 2017.