the Creative Commons Attribution 4.0 License.
the Creative Commons Attribution 4.0 License.
 | 20 May 2021
A field intercomparison of three passive air samplers for gaseous mercury in ambient air
Attilio Naccarato
Antonella Tassone
Maria Martino
Sacha Moretti
Antonella Macagnano
Emiliano Zampetti
Paolo Papa
Joshua Avossa
Nicola Pirrone
Michelle Nerentorp
John Munthe
Ingvar Wängberg
Geoff W. Stupple
Carl P. J. Mitchell
Adam R. Martin
Alexandra Steffen
Diana Babi
Eric M. Prestbo
Francesca Sprovieri
Passive air samplers (PASs), which provide time-averaged concentrations of gaseous mercury over the timescale of weeks to months, are promising for filling a gap in the monitoring of atmospheric mercury worldwide. Their usefulness will depend on their ease of use and robustness under field conditions, their availability and affordability, and most notably, their ability to provide results of acceptable precision and accuracy. Here we describe a comparative evaluation of three PASs with respect to their ability to precisely and accurately record atmospheric background mercury concentrations at sites in both southern Italy and southern Ontario, Canada. The study includes the CNR-PAS with gold nanoparticles as a sorbent, developed by the Italian National Research Council, the IVL-PAS using an activated carbon-coated disk, developed by the Swedish Environmental Research Institute, and the MerPAS® using a sulfur-impregnated activated carbon sorbent, developed at the University of Toronto and commercialized by Tekran. Detection limits are deduced from the variability in the amount of mercury quantified in more than 20 field blank samples for each PAS. Analytical and sampling precision is quantified through 22 triplicate deployments for each PAS, ranging in duration from 2 to 12 weeks. Accuracy and bias are assessed through comparison with gaseous elemental mercury concentrations recorded by Tekran 2537 automated mercury analyzers operating alongside the PASs at both locations. The performance of the PASs was significantly better in Italy, with all of them providing concentrations that are not significantly different from the average concentrations of the Tekran 2537 instruments. In Canada, where weather conditions were much harsher and more variable during the February through April deployment period, there are differences amongst the PASs. At both sites, the MerPAS® is currently the most sensitive, precise, and accurate among the three PASs. A key reason for this is the larger size and the radial configuration of the MerPAS®, which results in lower blank levels relative to the sequestered amounts of mercury when compared to the other two PASs, which rely on axial diffusion geometries. Since blank correction becomes relatively smaller with longer deployments, performance tends to be closer amongst the PASs during deployments of 8 and 12 weeks.
- Article
(1352 KB) - Full-text XML
-
Supplement
(594 KB) - BibTeX
- EndNote


Mercury (Hg) is a highly toxic pollutant, which due to its significant adverse impact on ecosystem and human health has been added to the environmental political agenda at national, regional, and global levels. In recent years, the adoption of the Minamata Convention has aimed to protect human health and the environment from Hg releases and emissions (UNEP, 2013). Article 22 of the convention requires parties to formally assess, through the provision of “comparable monitoring data on the presence and movement of mercury and mercury compounds in the environment”, how effective the structure and implementation of the convention is at meeting its primary goal (Article 1). Article 19 of the Convention highlights the importance of environmental monitoring. While such efforts should build on existing monitoring networks (UNEP, 2013), this will also require research and development of monitoring technologies.
The accurate assessment of air pollutants has increasingly come into focus as the need to understand their transport and mechanisms of deposition to ecosystems grows (Dinoi et al., 2017; Moretti et al., 2020; Naccarato et al., 2018, 2020; Tassone et al., 2020). Special attention is given to the atmosphere because it is a well-recognized pathway for Hg distribution throughout various environmental compartments (Driscoll et al., 2013). In this context, many regional atmospheric networks have been operating since the mid-1990s, including the US National Atmospheric Deposition Network-Mercury Deposition Network (NADP-MDN) (Vermette et al., 1995), the Environment and Climate Change Canada Atmospheric Mercury Measurement Network (ECCC-AMM), the Arctic Monitoring and Assessment Programme (AMAP) group of long-term measurements (Arctic Council, 1991), and the European Monitoring and Evaluation Programme (EMEP) (Tørseth et al., 2012). In 2010, the Global Mercury Observation System (GMOS) was created in an attempt to establish a global atmospheric Hg measurement network, integrating EMEP and AMAP, with more than 40 monitoring sites distributed worldwide. Since their beginning, there has been a growing interest in improving global monitoring of Hg by increasing the spatial resolution of gaseous Hg data, especially in remote locations and in developing countries (Pirrone et al., 2013), in order to meet Minamata Convention objectives.
Current methodologies, however, have a limited ability to monitor Hg on a truly global scale. Indeed, the use of active automated sampling systems based on sorbent traps with gold amalgamation, which are desorbed at relatively fine time resolution (3–5 min) for Hg quantification (Brown et al., 2010; Landis et al., 2002; Munthe et al., 2001; Steffen et al., 2012; Wängberg et al., 2001), may be limited by cost and the need for reliable electricity, consumables, and maintenance by well-trained operators (Huang et al., 2014; McLagan et al., 2016b; Pirrone et al., 2013). Given these constraints, passive sampling has been proposed as a viable alternative or supplemental system to fill the gaps in worldwide Hg monitoring. Compared to active sampling instruments, passive air samplers (PASs) for gaseous Hg are relatively inexpensive and thus can be deployed in large numbers, allowing for the identification and characterization of Hg sources through finely resolved spatial mapping (Huang et al., 2014; McLagan et al., 2016b; Pirrone et al., 2013). PASs are also suitable for deployment at remote sites because they require no power supply and are based on the unassisted molecular diffusion of gaseous Hg. Moreover, they are compact, portable, and easy to use. The adoption of PASs raises the very real possibility of a sustainable, long-term global network of atmospheric Hg measurements that includes regions not covered by existing efforts.
Over the past few years, a number of mercury PASs have been developed, each with different materials and geometries (Macagnano et al., 2018; McLagan et al., 2016a; Wängberg et al., 2016). While each sampler has its merit, the performance of different designs has yet to be compared systematically. This remains an impediment for understanding which PASs may be most appropriate for possible adoption in monitoring networks or whether a mix of designs can be reliably employed.
In this paper, for the first time, we report the results of a field-based intercomparison campaign and a controlled, blind performance comparison among different Hg PASs. The performance of three different PASs were evaluated at two monitoring sites, located in Italy and Canada, over a 3-month period. The PASs involved in this study were developed by the Italian Institute of Atmospheric Pollution Research (CNR-IIA) (Macagnano et al., 2018), the Swedish Environmental Research Institute (IVL) (Wängberg et al., 2016), and the University of Toronto (McLagan et al., 2016a). Data were submitted for compilation to a blind third party to control for reporting bias. The PASs were assessed for accuracy through comparison with active sampling data, for precision via replication, and for sensitivity through the assessment of blanks and detection limits, as well as in terms of the linearity of uptake over extended deployment periods.
2.1 Passive air samplers (PASs)
Characteristics of the three PAS designs included in the comparison are summarized in Table 1. The CNR-IIA PAS (CNR-PAS) consists of a fibrous quartz filter coated with sorbent material, which is attached to the bottom of a borosilicate glass vessel equipped with a double cap system to minimize operator handling and to avoid contamination that could result from the cap opening (Macagnano et al., 2018). The IVL-PAS consists of a disk coated with an activated carbon sorbent that is inserted in a badge-type device (Wängberg et al., 2016). The geometry of CNR-PAS and IVL-PAS makes them both axial diffusion samplers. The MerPAS®, developed at the University of Toronto and commercialized by Tekran Instrument Corp., consists of sulfur-impregnated activated carbon sorbent (HGR-AC, Calgon Carbon Corp.) housed in a stainless-steel mesh cylinder that is inserted into a commercial white Radiello® (Sigma Aldrich) diffusive body (McLagan et al., 2016a). The MerPAS® is a radial sampler.
Table 1Characteristics of the three passive air samplers for gaseous mercury that were compared in this study.

2.2 Study design
The study design involved the side-by-side deployment of the three PAS types in the vicinity of existing active air sampling sites in Rende (Italy) and Toronto (Canada) during late winter and early spring of 2019. At both sites, 11 overlapping PAS deployment periods ranged in length from 2 to 12 weeks, whereby each deployment involved triplicate PASs and one unexposed PAS as a field blank, for a total of 88 PASs of each type. In some cases, additional storage blanks were taken. Each participating research group supplied their PASs along with deployment instructions, performed the chemical analysis, and reported volumetric air concentrations and basic QA/QC results to an independent third party. Gaseous elemental mercury concentrations recorded by active air sampling instruments, averaged for the 22 deployment periods, were reported at the same time. After data submission, only the following changes were made to the data: a typographical error affecting the assumed uncertainty of the sampling rate of the IVL-PAS was corrected. The blank correction for the CNR-PAS was performed using the average of the field blanks at one location instead of using field blanks specific for a deployment, in order to be consistent with the blank correction applied for the other two PASs. Additional submitted results for the MerPAS® with temperature-adjusted sampling rates were disregarded, as they were the only set of results currently able to take into account this effect, and temperature adjustment did not improve the accuracy of the MerPAS® results. Although the field sites were in Canada and Italy, respectively, none of the groups reporting the results for the PASs had prior knowledge of the results from the active measurement at either location.
2.3 Sampling sites
Two existing active air monitoring sites in Italy and Canada were used for the performance evaluation of the three different PASs. The Italian site was a monitoring station close to the CNR Institute of Atmospheric Pollution Research (39∘21′27.2′′ N, 16∘13′53.7′′ E) in Rende. The Canadian site was located on the grounds of the Downsview office of Environment and Climate Change Canada in a northern suburb of Toronto (43∘46′49.65′′ N, 79∘28′2.46′′ W). During the campaign, air temperature, relative humidity, wind speed, and wind direction were measured at both sites. In Rende, meteorological data were recorded at a meteorological station situated at few meters from the deployment area that was equipped with a thermo-hygrometer (LSI LASTEM DMA875) for the monitoring of temperature and relative humidity, a pluviometer (LSI LASTEM DQA030) for the acquisition of precipitation depth, and an anemometer (LSI LASTEM DNA821) for the acquisition of wind speed and direction. In Rende, the weather conditions were characterized by an average temperature of 12.0±4.6 ∘C (range 0.9–30.6 ∘C) and average relative humidity of 60.4±18.1 % (range 13.6 %–97.9 %). Total rainfall over the study period was 1.71 mm and no precipitation fell as snow. The wind blew mainly from the south-southeast with an average speed of 1.2±0.9 m s−1 (range 0 and 6.9 m s−1). Meteorological data in Toronto were obtained from a co-located integrated weather station (Vaisala WXT520) operated by the Ontario Ministry of Environment, Conservation and Parks. Temperature was variable through the spring season with a mean temperature of 0.6±6.6 ∘C (range −15.8–21.5 ∘C), average wind speed of 2.4 m s−1 (range of hourly averages 0 to 11 m s−1), and average relative humidity (based on raw, uncorrected data) of 64.7±15.7 % (range 18.5 %–92.1 %). The predominant (20.5 % of the time) wind vector was from the west, between 260 and 285∘. Total precipitation during the PAS deployment period was 225 mm, of which 168 mm fell as rain and the remainder as snow.
2.4 Active air sampling
At both sites, gaseous mercury concentrations were obtained at 5 min intervals using Tekran 2537x and 2537a automated mercury analyzers (Tekran Instruments Corporation, Toronto, ON, Canada). In Toronto, two systems – both a Tekran 2537x and a Tekran 2537a (5037 and 0075 units, respectively) were operated in parallel to quantify the duplicate precision of the active air sampling technique. These systems collect air onto gold traps, which are thermally desorbed for quantification of mercury by atomic fluorescence spectroscopy (Ebinghaus et al., 2011). The sampling was performed with airflow rates of 1.5 and 1.0 L min−1 at Rende and Toronto, respectively. To ensure that the Tekran systems were operating consistently, flow verifications and calibrations were carried out before and during the intercomparison campaign by external injections of mercury and by using the instrument's internal mercury permeation source for automatic calibration at 23 and 72 h intervals in Toronto and Rende, respectively, throughout the monitoring period.
Calibration results and data acquisition were quality controlled according to established quality assurance and quality control procedures (QA/QC). The GMOS-Data Quality Management (G-DQM) approach (D'Amore et al., 2015) was used to check the Tekran 2537x mercury concentration data collected at the Rende site and to monitor the performance of the instrument in terms of baseline shifts, sample volume cell bias, and difference between gold traps, thus verifying that it adhered to standard procedures in a way that minimizes losses and inaccuracies in data production. The Toronto QA/QC system used to check all data collected by Tekran analyzers was based on the research data management quality (RDMQ) standards defined in Steffen et al. (2012). These standards invalidate data based on cell bias and sample volume, while also monitoring for baseline shifts and deviation amongst other warning flags.
2.5 PAS deployment
Samplers were sent by international courier from each participating laboratory to the two sampling locations shortly before the first deployment period. Following instructions provided by each participating research group, the samplers were deployed on a metal support rack at a height of about 4 m above ground to facilitate free air circulation (Fig. S1 in the Supplement). At both sites, all PASs were within 2 m of each other and from the inlet of the active air sampler. When not deployed, samplers were stored on-site at room temperature. Samplers were returned to the participating laboratories, again by international courier, shortly after the end of the last deployment.
While the three PASs were treated the same as much as possible, there were some unavoidable differences. The IVL-PASs made return air trips by international courier to both sampling sites and were deployed at both sites by personnel with no experience with this sampler. The CNR-PAS did not need to undergo extended travel to the Rende site and the MerPAS® was only transported by car between different locations within the city of Toronto (Tekran facilities, University of Toronto Scarborough Campus, ECCC sampling site in Downsview). At Rende, CNR-PASs were deployed by personnel with some familiarity working with this sampler; the same occurred at Toronto with the MerPAS®. In both locations, several personnel were involved in the deployment and retrieval of PASs over the 12 weeks of the study, but it was always the same personnel who handled all three PASs at any one of the seven deployment and retrieval dates.
After removal of the top cap, CNR-PASs and IVL-PASs were positioned in the seats of the shelter with the diffusive membrane or steel mesh net facing downwards. After exposure, CNR-PASs were removed from the seat, closed with the top cap, and placed into an aluminum bag containing a mercury scrubber cartridge. IVL-PASs were similarly removed, placed in a plastic container, and then in a plastic bag. MerPAS® samplers were secured to the metallic support using the embedded screw and bolt dowel and the solid lid was replaced with the screened lid. After exposure, the screened lid was replaced by a solid lid, and the device was sealed with tape and placed in a Ziploc bag.
The PASs were deployed from 5 February to 30 April 2019, following a sampling plan that included four deployments of 2 weeks, three deployments of 4 weeks, two deployments of 6 weeks, and one deployment each of 8 and 12 weeks (Table S1 in the Supplement). All PAS deployments were in triplicate, with the addition of a field blank for each type of PAS to check the potential for contamination during transport, storage and handling of the samplers. The CNR-PAS and MerPAS® field blanks were deployed in the field alongside each triplicate without opening their cap or lid. The IVL-PAS field blanks were not deployed at the actual field locations, but were only briefly transported to the deployment site during a sample changeover. During the remainder of the 12 weeks of the study, they stayed in storage in indoor locations in Rende and Toronto. Additionally, five storage blanks of the CNR-PAS in each of Rende and Toronto were used to check for mercury contamination during the PAS storage and transport. There were only five such storage blanks of the MerPAS® in Rende, i.e., none in Toronto.
2.6 Analysis of PAS sorbents for Hg
Mercury in CNR-PASs was quantified using a CNR-IIA-designed thermal desorption system, comprising a glass cylinder housed in a heater furnace connected to a mercury vapor analyzer (Tekran 2537a) for Hg detection by CVAFS. The sorbent membrane is placed into the cylinder, which is heated to 550 ∘C to desorb the trapped mercury (Macagnano et al., 2018). After analysis, the collection surface of the CNR-PASs can be regenerated for reuse (Macagnano et al., 2018). The accuracy of the lab-made analytical system was periodically verified using CNR-PAS with a known Hg concentration, while the Tekran system was calibrated by automatic and manual procedures.
For mercury determination in IVL-PASs, the carbon filters were carefully removed from each sample and individually boiled in an acid solution () for 5–6 h. BrCl was added to the cold solution as an oxidant and subsequent reduction was performed by adding SnCl2 prior to analysis. Excessive BrCl was reduced using hydroxylamine hydrochloride prior to addition of SnCl2. Liquid–gas separation was performed using a purge system with Hg pre-concentration on a gold trap. The sample gold trap was analyzed in an IVL-custom made desorption system connected to a CVAFS detector (Tekran 2500 unit) (Wängberg et al., 2016).
Determination of mercury concentration in the activated carbon sorbent used in the MerPAS® was carried out at the Tekran laboratory in Toronto using a Nippon MA-3000 system for automated combustion, amalgamation, and detection by atomic absorption spectroscopy. Throughout the analysis, standard reference materials and liquid Hg standards (2 to 8 ng) added to activated carbon were analyzed. Standard reference materials were bituminous coal (NIST 2684b, NIST 2685) and an activated carbon sample generated in-house at the University of Toronto.
For QA/QC of mercury analytical data during sorbent analyses, both analytical and field blanks were used. Analytical blanks were analyzed before deployment and sampling to ensure sorbent materials (HGR-AC, AuNPs-TiO2NPs layer, and activated carbon layer for MerPAS®, CNR-PAS, and IVL-PAS, respectively) were free from Hg contamination. The field blanks were used to ascertain whether there was contamination during sampler assembly, shipping, transport, deployment, retrieval, and storage. Storage blanks were used to assess any contamination due to the transport and storage only, i.e., not during the handling of the PASs during deployment and retrieval operations.
The samplers were deployed in triplicate during the campaign to assess the precision of each PAS. Method detection limits (MDLs) and practical quantification limits (PQLs) in ng were calculated as 3 and 10 times the standard deviation of the amount of mercury in field blanks, respectively. The limits of detection (LOD) and quantification (LOQ) in ng m−3 were obtained by dividing the MDL and PQL by the product of sampling rate (SR) and deployment time (days).
2.7 Determination of volumetric Hg concentration
The average Hg concentration in the atmosphere measured by each sampler (C; ng m−3) was obtained from the analyzed mass of Hg in the sorbent material according to Eq. (1):
where m is the mass of sorbed Hg (ng) corrected for the blank contamination, t is the deployment time of the PAS (days, ”d”) and SR is the sampling rate of the PAS (m3 d−1). Because field blank levels were not significantly different between different deployment periods, but were different between Rende and Toronto, the average field blank contamination at one location was used for blank correction. Constant and previously experimentally derived SR values were used for each PAS; these rates were not adjusted for deployment-specific meteorological conditions. For the CNR-PASs, the SR was 0.0147 m3 d−1 with an uncertainty of 0.0007 m3 d−1. This value is slightly different from a previously reported one (Macagnano et al., 2018) because it is the result of further improvements in CNR-PAS geometry. For the IVL-PASs, the SR was 0.028 m3 d−1 in Rende and 0.029 m3 d−1 in Toronto (calculated using the diffusivity for Hg according to Massman, 1999). The SR of the MerPAS® (0.111±0.017 m3 d−1) is higher than that of the other two PASs, which is a function of the MerPAS®'s radial design. This SR, which was derived from a number of calibration experiments conducted by Tekran, deviates slightly from previously published values (McLagan et al., 2016a, 2018) because of small modifications between the MerPAS® and the original sampler. For each PAS type, the uncertainty of the SR is directly propagated to the volumetric air concentration.
2.8 Statistical analysis
All statistical analyses were performed using R v. 3.3.3 software (R Foundation for Statistical Computing, Vienna, Austria). We evaluated the relative accuracy of different PASs, by first calculating the percentage concentration differences between actively sampled concentrations [Hg]Tekran, and those derived from each of the paired PASs [Hg]PAS. These percent concentration differences were calculated as
Based on these calculations, we then used absolute concentration differences for subsequent analysis. First, we used a variance partitioning analysis to quantify the proportion of the overall variability in absolute percentage concentration difference values (calculated in Eq. 2), which is explained by (1) deployment site, (2) deployment time, (3) Tekran identity (in the case of Toronto), and (4) PAS type. This variance partitioning analysis was based on n=99 total observations of absolute percent concentration differences. To perform this analysis, we first fit a linear mixed effects model to our data using the “lme” function in the “nlme” R package (Pinheiro et al., 2017); in this model, absolute percent concentration differences are predicted as a function of a single fixed effect (i.e., the model intercept, which represents the overall mean percent concentration difference) and four random effects (i.e., four nested factors including (1) PAS type, within (2) Tekran IDs, alternatively, the deployment location, within (3) deployment periods, within (4) deployment site, i.e., one of Rende or Toronto). Based on this model, we then used the “varcomp” function in the “ape” R package (Paradis et al., 2004) to quantify the proportion of variation in concentration differences that owes to each of the four nested factors.
Based on these results, we then sought to calculate and compare mean absolute concentration percentage differences across both PAS types and sites, while accounting for (1) the non-independence of samples, (2) unbalanced sample sizes across sites and PASs, and (3) potentially confounding effects of (a) sampling deployment times and (b) sites. Therefore, we parameterized a second linear mixed effects model where absolute concentration differences were predicted as a function of PAS type, site, and a PAS-by-site interaction term as fixed factors; this mixed model statistically accounted for the non-independence of samples by including deployment period and Tekran identity as nested random effects. Based on this model, we then used the “lsmeans” and “difflsmeans” functions in the “lmerTest” R package (Kuznetsova et al., 2017) to calculate and statistically compare least square mean concentration difference values (and associated standard errors) across each PAS type, site, and PAS-by-site combination. This analysis therefore assessed whether least square mean concentration differences in any of these groups differed significantly from one another or differed significantly from zero.
3.1 Mercury concentrations obtained by active sampling
The concentration of gaseous mercury in ambient air was determined by averaging the values recorded by the Tekran Hg analyzers every 5 min during a specific PAS deployment period. The complete series of valid Hg concentration data is displayed in Fig. S2 in the Supplement. Interruptions are due to instrument calibration or maintenance. As mentioned in Sect. 2.4, the values obtained at Rende were validated against the GMOS-Data Quality Management (G-DQM), resulting in 98.9 % valid data. The average measured Hg concentration at Rende over the 12 weeks was 1.72±0.25 ng m−3, with a range from 0.88 to 8.80 ng m−3. The mean Hg concentration during the 11 PAS deployment periods was quite constant, varying between 1.66 and 1.79 ng m−3.
At Toronto, the use of the RDMQ standards for data quality assessment and measurement gaps during daily calibration periods, hourly standard additions, and instrument maintenance resulted in 82.5 % valid data coverage throughout the entire deployment period for the primary 2537x analyzer. The secondary co-located 2537a analyzer experienced an 8 % shift in the mass flow meter calibration during the study. Since it was not possible to determine when the shift occurred, data from this analyzer were not used for comparison with the PAS (but were included in the statistical analysis described in 2.8). The active Hg concentration ranged between 1.17 and 34.6 ng m−3, and averaged 1.57 ng m−3 with a standard deviation of 0.45 ng m−3. Five short periods of elevated concentrations (over 4 ng m−3) were observed over the study period, the maximum reaching 34.6 ng m−3. Although unusual, the elevated values were observed on both the primary and secondary analyzers, lasted between 10 and 35 min, and are therefore accepted as valid. The Toronto site is located in a northern suburb of Canada's largest urban center and it is believed that these elevated episodes are a result of nearby industrial mercury emissions. Similar to Rende, the mean Hg concentration for each deployment varied only slightly, between 1.51 and 1.63 ng m−3.
3.2 Comparison of passive air sampler performance
3.2.1 Blanks and detection limits
The amount of Hg in the field blanks of the different passive air samplers is summarized in Table S2 in the Supplement. The averages of those values are displayed in the top row of panels in Fig. 1. The amounts in field blanks are similar between the different passive samplers, ranging from generally less than 0.2 ng in the CNR-PAS to slightly above 0.4 ng in the IVL-PAS. The blank levels of the CNR-PAS are the lowest recorded during the campaign, especially for exposure in Rende. The MerPAS® showed no difference in the blank levels between Rende and Toronto, whereas the CNR-PAS and IVL-PAS showed a slight difference between the two sites. In the case of the MerPAS® and CNR-PAS where field blanks were deployed together with samplers in the field for variable lengths of time, there was no indication that the field blank contamination increased with deployment duration (Table S2 in the Supplement). This is consistent with blank contamination arising during handling and transport and not during placement at the deployment location. However, in the case of the CNR-PAS, the storage blanks (0.066±0.010 ng, n=5, Toronto; 0.042±0.009 ng, n=5, Rende) have, in general, considerably lower levels than the field blanks (0.20±0.07 ng, n=5, Toronto; 0.15±0.02 ng, n=5, Rende), which implies that the deployment and retrieval of those samplers does introduce some contamination. The amount quantified in MerPAS® storage blanks (0.187±0.009 ng, n=5, Rende) is only marginally lower than the amount in field blanks (0.23±0.06 ng, n=10, Rende).
The relative standard deviation (RSD) of levels in field blanks was also similar between the three samplers, being slightly lower in the IVL-PAS (∼18 %) than in the MerPAS® and CNR-PAS (∼23 % on average). This may be a result of the IVL-PAS field blanks all being treated the same, whereas the MerPAS® and CNR-PAS field blanks had slightly different handling processes, as they were deployed alongside the exposed samplers. The RSD of the CNR-PAS deployed in Rende was notably lower (12 %) than in Toronto (34 %).
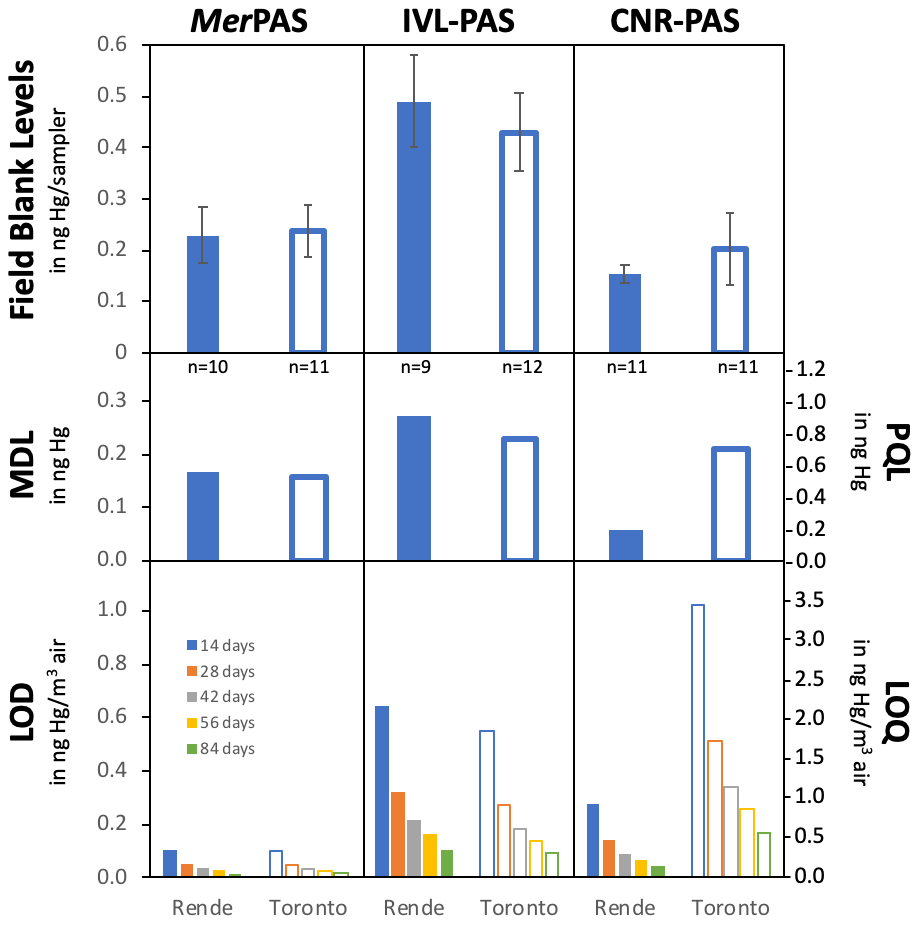
Figure 1Mean and standard deviation of field blank levels, method detection limit (MDL), practical quantification limit (PQL), limit of detection (LOD), and limit of quantification (LOQ) for the three passive air samplers deployed in Rende, Italy, and Toronto, Canada.
The amount of mercury detected in field blanks was used for the calculation of the method detection limit (MDL), the practical quantification limit (PQL), the limit of detection (LOD), and limit of quantification (LOQ). Field blank levels, MDLs, PQLs, LODs, and LOQs for the three samplers separated for the two locations are displayed in Fig. 1. The numerical results can be found in Table S3 in the Supplement. The MDL and PQL are derived from the variability in the field blank levels. Therefore, they are similar between the three samplers (middle row of panels in Fig. 1). Even though the RSD of the field blank levels is smaller for the IVL-PAS, the larger absolute SD means that it has slightly higher MDL and PQL (∼0.25 and ∼0.83 ng, respectively) than the other two samplers (0.13 and 0.45 ng for the CNR-PAS on average, 0.16 and 0.54 ng for the MerPAS®).
In terms of volumetric air concentrations, the LODs and LOQs decrease with the sampled air volume, which, in turn, increases with a sampler's SR and deployment period. The bottom row of panels in Fig. 1 therefore displays the LODs and LOQs for each of the five deployment times used in this study. Larger differences between the MerPAS® and the other two PASs become apparent, because the former has a SR that is ∼4 to ∼8 times higher than that of the latter and accordingly samples Hg from a much larger air volume during similar deployment times. This implies that even though the absolute amounts of Hg in field blanks are similar between the samplers, the amount in field blanks relative to the amounts in exposed samplers is quite different (Table S4 in the Supplement). Field blank contamination in the MerPAS® does not exceed 8 % of the quantified amount in an exposed sampler (range 1 % to 8 %), whereas that percentage in the IVL and CNR-PAS is similar and ranged between 7 %–47 %, with higher values during short periods of deployment. This means that during a two-week deployment the MerPAS® has an LOD of 0.11 ng m−3 and an LOQ of 0.34 ng m−3, which are ∼6 times lower than the LODs and LOQs of the IVL-PAS and the CNR-PAS. It is important to stress that blank contamination and therefore also MDL/PQL and LOD/LOQ are study specific and therefore need to be determined during every study anew. The two deployments of the CNR-PAS in Toronto and Rende illustrate this very effectively. The lower and more consistent blank levels of the CNR-PASs deployed in Rende compared to those deployed in Toronto translate into 4 times lower LODs (0.28 ng m−3 vs. 1.02 ng m−3 for a two-week deployment) and LOQs (0.9 ng m−3 vs. 3.4 ng m−3 for a 2-week deployment).
3.2.2 Precision
The very large number of triplicate deployments in this study allows for a thorough characterization of the precision of the different PASs. Specifically, we assess the replicate precision of three PASs deployed simultaneously, both before and after blank correction. Table S5 in the Supplement reports the amount of Hg quantified in the PAS during the 22 different deployments. The precision of the quantified amount in a PAS reported in this table is a combined measure of the consistency and reproducibility of PAS manufacturing, deployment, and handling as well as the laboratory analytical process. Table S6 in the Supplement reports the blank-adjusted amount of Hg in the PASs. The precision of the blank-corrected amounts reported in this table additionally accounts for the consistency and reproducibility of the blank contamination.
The relative standard deviation in percent (RSD%) of the mean amount of Hg quantified in three samplers is used as a measure of precision. Blank correction was performed using the average value of all field blanks deployed at one location, because the field blanks did not show a dependence on deployment length for any sampler but did display differences between Rende and Toronto deployments for some samplers. The precision of the blank-corrected amount was calculated by propagating the standard deviations of the amount in exposed samplers and of the amounts in field blanks. Fig. 2 displays the replicate precision for the three samplers, averaged for different deployment lengths, across the two locations, and across all replicated deployments. Numerical results are presented in Table S7 in the Supplement.
When judged based on the amount of Hg quantified in triplicated samplers, MerPAS®, IVL-PAS, and CNR-PAS had an average precision across all 22 replicated deployments of 3 %, 9 %, and 7 %, respectively. In the case of the MerPAS® this is consistent with previously reported replicated precision, e.g., 3.6 % in a global study involving deployments in numerous locations (McLagan et al., 2018). Replicate precision was generally similar in Rende and Toronto deployments; only the IVL-PAS had on average slightly poorer precision in Rende (∼11 %) than in Toronto (∼7 %). The replicate precision of the MerPAS® improved slightly with increasing deployment length (from ∼5 % for the 2-week samples to ∼2 % for the 12-week samples). In general, one might expect larger amounts of Hg to be quantified more reliably than smaller amounts, which would explain such a trend. The MerPAS®, for example, collected ca. 3 ng of Hg in a 2-week period but ca. 17 ng in a 12-week deployment. The IVL-PAS followed a similar trend of improving precision with longer deployment between the 4-week (∼13 %) and the 12-week samples (∼5 %). However, the relatively good precision of the 2-week samples (∼7 %) does not fit this pattern. The precision of the CNR-PAS was not related to deployment length, with the poorest precision for the 8-week deployments (∼13 %) and the best precision for the 4-week deployments (∼5 %).
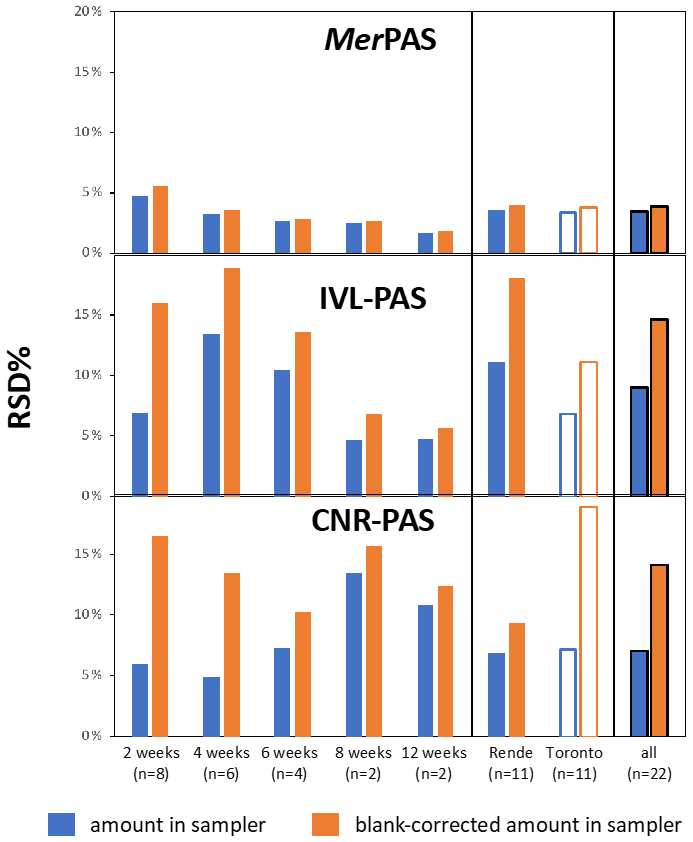
Figure 2Precision expressed as the relative standard deviation in percent of the amounts of mercury quantified in triplicate PASs, both before (blue) and after blank correction (orange), averaged over different deployment lengths, across different locations, and over all replicated deployments. Note that in some cases a sampler was lost and therefore some deployments were only duplicated.
When judged based on the blank-corrected amounts in replicate samplers, precision was 4 %, 15 %, and 14 % for MerPAS®, IVL-PAS, and CNR-PAS, respectively. This precision is inevitably worse than for the non-blank corrected amount, because the variability of the field blank levels adds uncertainty. The extent of this increase in uncertainty upon blank correction depends very strongly on how large the blank contamination is relative to the amount in exposed samplers. This explains why the increase is much smaller for the MerPAS® than for the other two samplers and it also explains why the increase is larger for shorter deployment periods. As was already mentioned above, the blank correction for IVL-PAS and CNR-PAS deployed for 2 weeks is quite large, ranging from 28 % to 47 % of the amount quantified in exposed samplers. Therefore, the uncertainty of the deducted amount adds notably to the uncertainty of the blank-corrected value. However, the CNR-PAS also illustrates how sampler precision can be greatly improved by consistent field blank levels. The blank correction of the CNR-PASs deployed in Rende adds far less uncertainty (from 7 % to 9 %) than the blank correction of the CNR-PASs deployed in Toronto (from 7 % to 19 %), which is a result of the much smaller variability in the field blank levels measured in Rende (see Fig. 1).
3.2.3 Accuracy
The average air concentration during each of the 22 deployment periods was derived by dividing the blank corrected amounts in a PAS by the product of the deployment period and the SR. These concentration values are reported in Table S8 in the Supplement. The SR and its estimated uncertainty for each PAS was provided by each participating laboratory. Specifically, the uncertainty of the MerPAS® SR was assumed to be 15 %, whereas that of the CNR-PAS was 4.7 %. The SR uncertainty of the IVL-PAS was assumed to be 6 % and 13 % during the deployments in Rende and Toronto, respectively. The uncertainty of the concentration values in Table S8 in the Supplement was obtained by propagating the estimated uncertainty of the SR and the standard uncertainty of the blank-corrected amounts (in Table S6 in the Supplement). The average value of the relative uncertainty of the volumetric concentrations is very similar among the three PASs: 9 % for MerPAS® and CNR-PAS and 8 % for the IVL. However, these values cannot be directly compared with each other, as the self-reported uncertainty of the SRs was not established the same way by the three study participants.
The accuracy of the PAS-derived time-averaged air concentrations in Table S8 in the Supplement was judged by comparing them to the average value derived by the active Tekran instruments operating alongside the PAS. The sampling rate of all three PASs used in this study had originally been obtained in calibration studies involving active Tekran instruments, i.e., any uncertainties as to the precise speciation of gaseous mercury being sampled by either a PAS or a Tekran instrument would have affected calibration and evaluation equally. A direct comparison therefore should be valid. Tekran values were considered as a benchmark for pragmatic reasons, knowing full well that this measurement itself may provide biased results (Aspmo et al., 2005; Slemr et al., 2015; Temme et al., 2007). This is true even though flow and detector accuracy audits of the active instruments were performed before, during, and after PAS deployments at both locations. The possible size of this bias was estimated from the data collected by the two Tekran systems operating side-by-side in Toronto, although the comparison was somewhat hampered by an inconsistency between measured flow at the beginning and end of the sampling period for the 2537a (unit 0075) (see Sect. 3.1). If we disregard that uncertainty, the 2537a (unit 0075) instrument yielded values averaged over the deployment periods that were consistently lower than those measured by the 2537x (unit 5037) instrument that was chosen as the reference. This bias was on average 3.2 % for the 11 sampling periods and ranged from a low of 1.0 % for the third 2-week period to a high of 6.5 % for the last 4-week period.
Table 2Average bias and average absolute discrepancy between the time-averaged volumetric air concentrations of Hg derived by the passive air samplers and the Tekran instrument.

Table 2 summarizes the average bias and the average absolute difference between the average concentrations measured by the Tekran instrument at each location and the various PASs. This compilation reveals a number of features: the accuracy of all three PASs is much better during the deployments in Rende than the deployments in Toronto. On average, the IVL-PAS and CNR-PAS results for Rende show no bias, whereas the MerPAS® results are slightly biased high (∼3 %). Also, the absolute discrepancies are quite small in Rende, averaging ∼3 % for the MerPAS® and ∼7 % for the other two samplers. In Toronto, the MerPAS® air concentrations are biased high, on average by 10 %. The IVL-PAS also shows a positive bias (∼17 %), whereas the CNR-PAS levels are on average 9 % lower than the Tekran results. The average, absolute discrepancies range from 10 % for the MerPAS® to 18 % for the IVL-PAS and 25 % for the CNR-PAS.
Figure 3 displays the discrepancies of the PAS results from the average concentrations measured by the Tekran analyzers for each of the 22 sampling periods. This illustration reinforces the noticeable differences in sampler accuracy between deployments in Rende and Toronto. It additionally shows that there is no apparent relationship between the accuracy of the PASs and the length of the deployment period in Rende. For the MerPAS®, there is also no relationship between discrepancies and deployment length in Toronto. The high bias tends to be consistent, indicating that the SR was likely higher than the applied value of 0.111 m3 d−1. The discrepancy of the IVL-PAS and CNR-PAS from the Tekran results tend to be smaller during the longer deployments in Toronto (6 weeks and up). In fact, for the IVL-PAS, the discrepancies tend to get smaller with increasing deployment times. This makes sense considering that the uncertainty introduced by the blank correction becomes much smaller with longer deployments. The three 4-week deployments of the CNR-PAS in Toronto are consistently biased very low (by about 50 %), whereas the two sampling periods with very high bias are both 2-week deployments, so it is difficult to decipher a consistent pattern in the discrepancies.
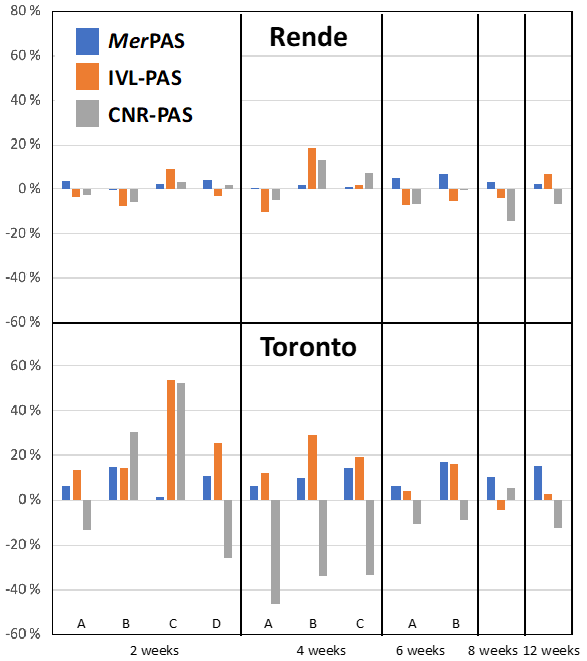
Figure 3Discrepancies of the time averaged air concentrations of Hg during 22 deployment periods as derived by the three PASs from the average concentration obtained by an active Tekran system deployed at the same time. Deployments in Rende/Toronto are displayed in the upper/lower panel, respectively. Positive/negative discrepancies indicate a PAS-derived concentration higher/lower than the Tekran value, respectively.
Our variance partitioning analysis, coupled with mixed effects models, confirmed that all PAS-derived concentrations were significantly closer to the Tekran values for the deployments in Rende than they were for the deployments in Toronto (Fig. 4). The asterisks in Fig. 4 designate the significance level by which the mean absolute concentration difference of a “dataset” differs significantly from 0, i.e., whether PAS-derived concentrations (based on Eq. 2) differ significantly from Tekran concentrations. We can see that the mean concentration differences in Rende, for all three PASs individually, and when the data are “pooled” among all PASs, they are not significantly different from 0. On the other hand, all of the mean concentration differences in the Toronto site are significantly different from 0, again both for all PASs individually and when the data are “pooled” among all PASs. When data from both sites and all PASs are “pooled” together, the mean concentration values differ significantly from 0, which is mainly driven by the poorer agreement of values in Toronto. Note that we use here the terms “pooled” and “datasets”, even though the results in Fig. 4 are based on the single mixed effects model and are not the results of multiple t tests.
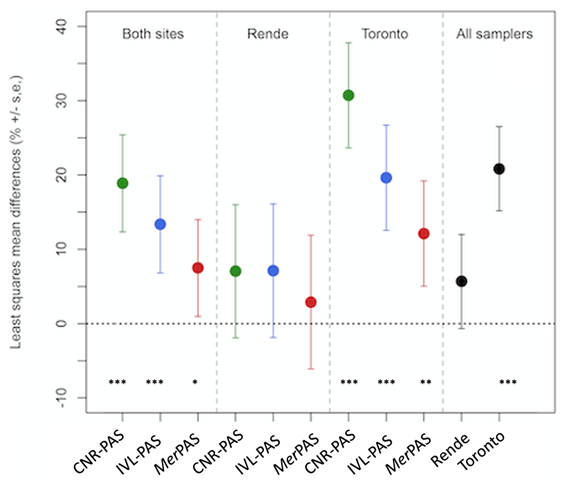
Figure 4Least square means and standard errors of the differences in concentrations measured by the PASs and by the Tekran units. Results are shown either for each PAS individually (colored markers) or for the three PASs together (black markers). They are also shown either separately for the two sampling sites or both of them together. The asterisks below each bar indicate whether or not the least square mean concentration differences from that “dataset” differed significantly from 0 (where denotes p≤0.001, denotes p≤0.01, and * denotes p≤0.05).
Of course, the same concentrations measured by different techniques should not be significantly different. It implies that the uncertainty of the concentrations derived from all three PASs deployed in Toronto must have been underestimated, i.e., the assumed uncertainty of the SR applied in the calculation of the concentrations must have been too small. We may surmise that if meteorological conditions during a deployment deviate considerably from those prevailing during the calibration of a PAS (as they did for all three PASs during a Toronto winter), the SR incurs considerably higher uncertainty than if calibration and application take place under similar environmental conditions.
The variance decomposition analysis attributed roughly half of the variance in percentage concentration differences to the PAS type (48.3 %) and most of the other half of total variance by differences observed between Toronto and Rende (site =46.8 %) (Table S9 in the Supplement). According to the mixed effects model, there were significant differences for both site (Rende vs. Toronto; p<0.001) and PAS type (p=0.006) (Table S10 in the Supplement). In the post hoc least squares comparison (Table S11 in the Supplement), differences amongst PAS types were not significant at Rende (p=0.458 to 0.992). At Toronto, the percentage difference between Tekran and PAS concentrations was not significant between the IVL and MerPAS® samplers (p=0.312), but both the IVL (p=0.013) and MerPAS® (p<0.001) had concentrations significantly closer to Tekran values than did the CNR sampler.
3.2.4 Linearity of uptake
A PAS's performance depends on having an uptake capacity that is sufficiently high for mercury to remain in a linear uptake phase throughout the entire deployment period. We can test this by assessing the linearity of uptake. While this is sometimes done by plotting the blank-corrected amount quantified in the samplers mPAS against the sampler deployment time Δt, this disregards the variability in the gaseous mercury concentrations between different deployments. By plotting the amount in a sampler against the product of Δt and the average air concentration during the deployment of that sampler Cair, we can eliminate the influence of the gaseous mercury concentration variability (Restrepo et al., 2015). We used the data from the Tekran instruments as the input for Cair in this analysis. Incidentally, using the data from this intercomparison study this way amounts to a sampler calibration, as the slope of the linear relationship between mPAS in ng and Δt×Cair in units of d ng m−3 corresponds to the SR of the PAS in m3 d−1.
Figure 5 shows these uptake plots for all three samplers at the two sampling locations. Also shown are the linear regression lines fitted to the displayed data. Table 3 reports the slopes with standard error of the regression line, which has been forced through the origin, and the coefficient of correlation r2. The slopes are also the SR applicable to the PASs at the two locations during the time period of the study.
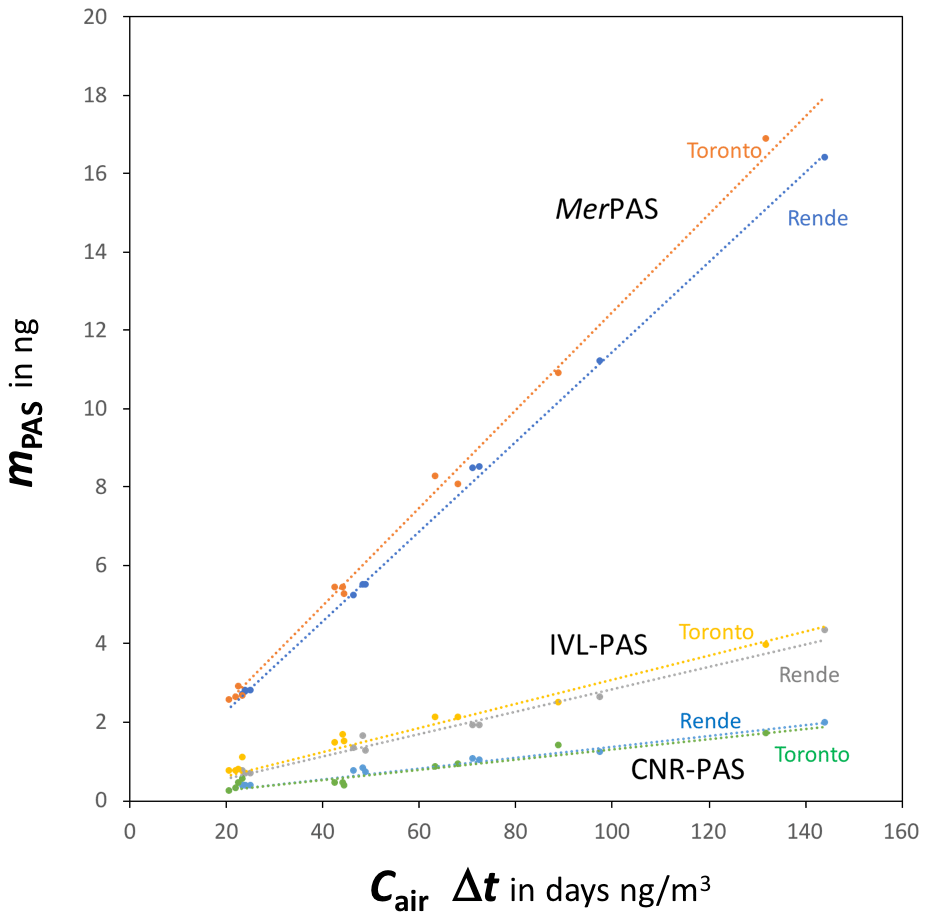
Figure 5Plot of the blank-corrected amount of Hg quantified in three types a passive air sampler deployed in Rende or Toronto against the product of the deployment time of a sampler Δt and the average air concentration during the deployment of that sampler Cair, as determined independently by a Tekran active sampling system.
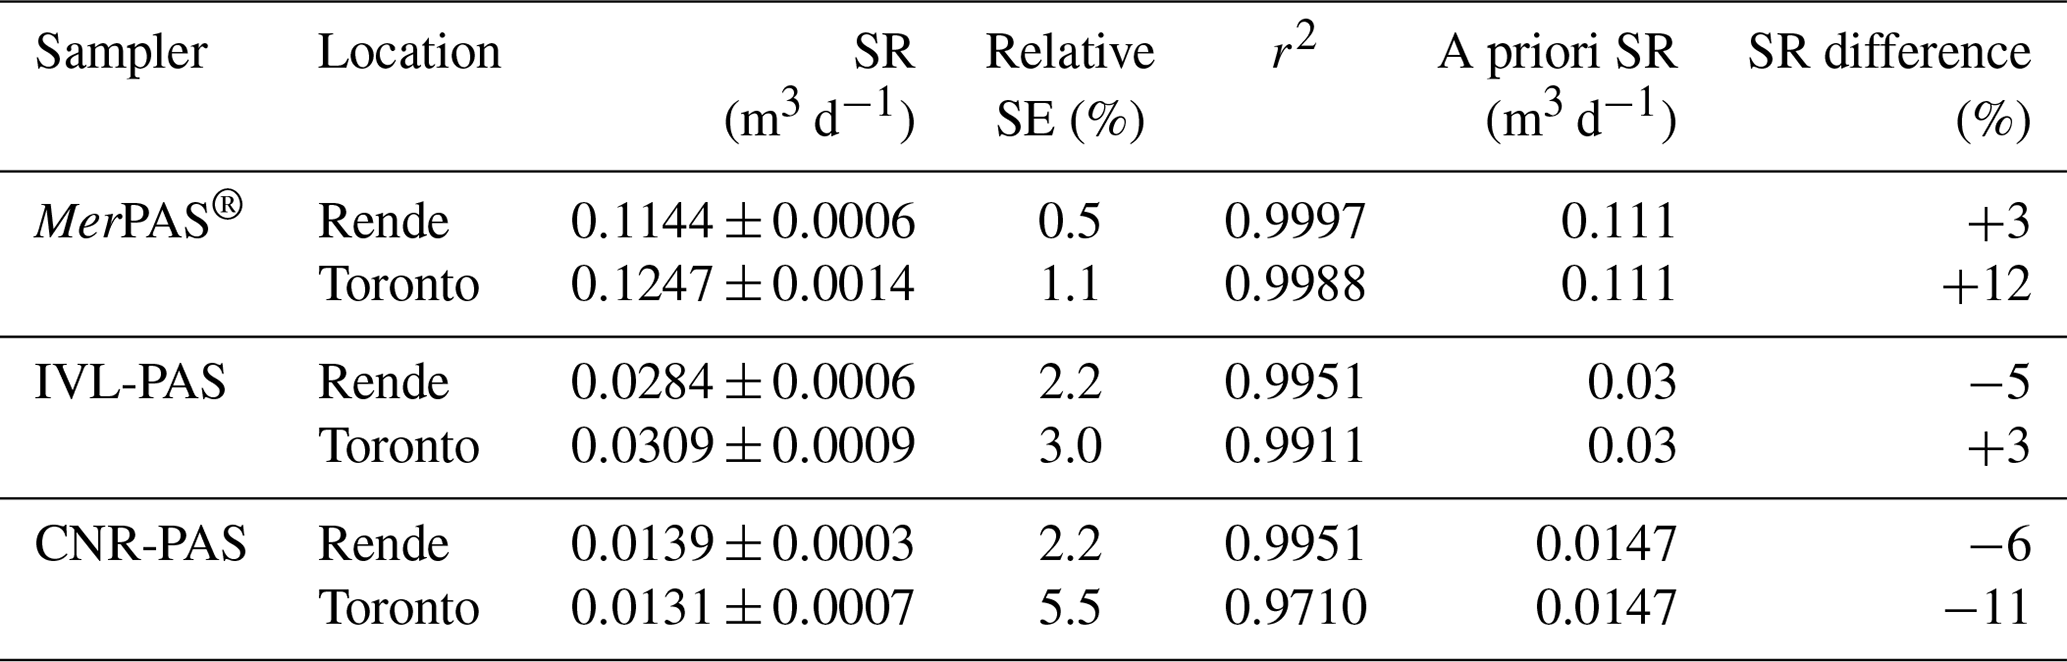
Table 3Results of the linear regressions displayed in Fig. 5. The slope of the regression line corresponds to the sampling rate of a passive air sampler.
All uptake curves are linear with high r2 values and small relative standard errors of the slope of the linear regressions (1 % for MerPAS®, 2 % to 3 % for IVL-PAS, and 2 % to 5 % for CNR-PAS). A graphical inspection of Fig. 5 also confirms that forcing the regression through the origin was justified, indicating that the blank correction was largely effective for all three samplers. Consistent with what should be expected from the sampler performance at the two locations, the regressions are generally better for the Rende than for the Toronto deployments. Overall, it is clear that all three samplers perform as true linear uptake samplers at both locations over a 3-month period.
Table 3 also compares the site- and deployment specific SRs obtained from the regressions with the generic a priori ones that were used in the calculation of the volumetric air concentrations from the PASs. Deviations between these SRs should be roughly similar to the bias of the PAS-derived air concentrations reported in Table 2. In the case of the MerPAS®, they are indeed very similar (+2.8 % vs. +3.1 % at Rende, +10.2 % vs. +12.3 % at Toronto). In the case of the IVL-PAS (−0.5 % vs. −5.4 % at Rende, +17.0 % vs. +3.0 % at Toronto) and CNR-PAS (−1.4 % vs. −5.7 % at Rende, −8.8 % vs. −10.7 % at Toronto) they are less similar, although the direction of bias is the same. The deviations are not exactly the same, because the longer deployments have a stronger impact on the slope of the lines in Fig. 5 than shorter ones, whereas when the average bias given in Table 2 was calculated, each sample counted the same, irrespective of deployment length.
We can also compare the relative size of the fitted SRs at the two locations. Interestingly, for both the MerPAS® and IVL-PAS, the SR was 9 % higher in Toronto than in Rende. The SR of the CNR sampler shows an opposite behavior, being 5 % lower in Toronto than in Rende. Meteorological factors can be responsible for differences in SR between deployments at different sites or during different time periods. In particular, an increase in the molecular diffusivity of Hg in air with warmer temperatures can lead to a higher SR, whereas an increase in wind speed can reduce the thickness of the stagnant air boundary layer surrounding a PAS's diffusive barrier, therefore, also leading to a higher SR (McLagan et al., 2017). Toronto was much colder than Rende during the study period (average during the 12 weeks deployment period of 1 and 12 ∘C, respectively), which would be consistent with a lower SR in Toronto as was observed for the CNR-PAS. On the other hand, wind speeds in Toronto were approximately double those in Rende (average of 2.4 and 1.2 m s−1, respectively), which would be consistent with higher SR in Toronto as was observed by IVL-PAS and MerPAS®.
3.2.5 Reasons for the different performance in Rende and Toronto
Generally, the three PASs performed better in Rende than in Toronto. This is most apparent in the assessment of accuracy (Figs. 3 and 4). However, this did not apply to all performance indicators. For example, the magnitude and variability in field blanks was comparable between the two sites for the MerPAS® and IVL-PAS, while the CNR-PAS had much more variable field blank contamination in Toronto than in Rende (Fig. 1). Also, replicate precision (prior to blank correction) was very similar at the two sites (Fig. 2); in the case of the IVL-PAS, the replicate precision was in fact better in Toronto. This suggests that operator handling is unlikely to be responsible for the differences in performance at the two sites.
A major difference between the two sites is the harshness of the weather conditions during the deployment period, which comprised the 3 months of February to April 2019. Winter and early spring in Toronto can be very cold, can have large temperature fluctuations over short time periods, and can have precipitation in different forms (snow, freezing rain, sleet, and rain). As was discussed in the preceding section, temperature and wind speed can influence the rate of diffusion to the passive sampling sorbent, causing variability in the SRs. It is also conceivable that during inclement weather, hoarfrost forms on the surfaces of the diffusive barriers or blowing snow could accumulate on the samplers, potentially impeding the path of Hg to the sorbent. However, it will often not be possible to attribute discrepancies to weather conditions, for example when deviations occur in opposite directions during overlapping deployments (e.g., the third 2-week and the second 4-week deployments overlap, yet the CNR-PAS shows positive bias in the former and negative bias in the latter).
Another possible source of the discrepancies between Tekran and PAS concentrations in Toronto (Fig. 3) is the higher fraction of missing or rejected data from the Tekran instrument operating in Toronto. While 98.9 % of Tekran data were valid in Rende, the data coverage for the PAS deployment was 82.5 % for the Tekran 2537x unit providing the reference value in Toronto. The reason for the lower percentage in Toronto is a sampling method that relies on daily calibrations (2.4 % daily loss of coverage) and hourly (8.3 % daily loss of coverage) spikes, which together account for a 10.7 % per day loss of coverage, yet improve confidence in the data. The distribution of the standard addition spikes throughout the day, however, means they are unlikely to result in any bias of the results. The remainder of data loss was due to regular maintenance and a power outage. A different, but equally valid, sampling method in Rende ran calibrations every 3 d with no spikes. For individual deployments, data coverage ranged as low as 66 % for the fourth 2-week deployment in Toronto. However, the discrepancy between the PASs and Tekran instrument are not unusually large during that deployment period (Fig. 3).
A final difference between the two study locations is the occurrence of several short spikes of elevated gaseous mercury concentrations in Toronto. If these had been caused by a local source in the immediate vicinity of the sampling site, it is conceivable that spatial gaseous mercury concentration gradients may have been present within the assembly of PASs and Tekran inlets. However, no relationship between the occurrence of such spikes and the discrepancies in PAS results is apparent. In any case, it is more likely the spikes were caused by sources sufficiently far from the sampling site to not result in concentration gradients on the scale of a few meters.
Table 4 compiles the key performance indicators for the three passive air samplers. In contrast to most of the sections above, this table provides the average of all values obtained from the Rende and Toronto deployments. This compilation reveals that the MerPAS® is currently the best performing PAS among the three, having the lowest LODs, the highest precision, and the best accuracy when judged based on the discrepancy from the Tekran system. An important reason for this better performance is the larger size and radial diffusion configuration of the MerPAS®, which leads to much higher SRs than for the other samplers, which are axial diffusion samplers and also much smaller in size. A higher SR means that the amount of Hg taken up in a MerPAS® during a deployment is much greater relative to the blank contamination level than it is for the other two samplers, which have very similar blank contamination levels. That inconsistent and relatively high blank contamination levels could hamper the performance of a PAS is evident from the comparison of performance at the two sites. Higher and more variable blank levels of the CNR-PAS in Toronto translate into much higher LODs (Table 2) and much poorer precision after blank correction than in Rende. Incidentally, this also highlights pathways for improvement, namely either a reduction in the magnitude and variability of blank contamination and/or a change in the sampler size and configuration that increases the SR. A promising result of this study is that the SRs of the CNR-PAS at the two locations are more similar than for the other two PAS, which may hint at a SR that has a relatively small dependence on meteorological factors. However, this will still need to be confirmed by calibrating the sampler under a wide variety of meteorological circumstances. Overall, a deeper understanding of how temperature, wind speed, relative humidity, and atmospheric pressure may influence the sampling rates of the PAS should be sought. In particular, empirical investigations into the merits of adjusting sampling rates to deployment specific meteorological conditions are warranted.
Table 4Summary of the key metrics describing the performance of the three passive air samplers for Hg as determined in this study.

Table 4 also shows that IVL-PAS and CNR-PAS are remarkably similar in their performance characteristics with very similar LODs and replicate precision. While the average bias of the CNR-PAS overall is very small, this is largely because fairly large discrepancies occur in either direction and therefore cancel each other out. Overall, the IVL-PAS-derived air concentrations agree better with the Tekran-derived data than those of the CNR-PAS (12.5 % vs. 19.1 %).
The MerPAS®-derived air concentrations were on average 6.5 % higher than the Tekran-derived values, and this positive bias was evident at both deployment locations, albeit more pronounced in Toronto. Discrepancies with Tekran data of similar size have previously been reported for the sampler by McLagan et al. (2016a), on which the MerPAS® is based. For example, McLagan et al. (2018) reported an average discrepancy of ∼9 %. Nevertheless, the results presented here indicate that the generic SR of 0.111 m3 d−1 applied here may benefit from further refinement and should possibly be somewhat higher.
The data presented in this study are available from the authors upon request.
The supplement related to this article is available online at: https://doi.org/10.5194/amt-14-3657-2021-supplement.
AN conceived and coordinated the study, planned the PAS deployment strategy, assembled the CNR-PAS data submission, collected the research data, and wrote the original draft. AT, MM, and SM were responsible for the field deployments and TEKRAN measurements in Rende and contributed to data analysis and writing. AM, EZ, PP, JA prepared and analyzed the CNR-PAS. NP and FS acquired funding and managed some of the projects leading to this publication. MN, JM, and IW prepared and analyzed the IVL-PAS and assembled the IVL-PAS data submission. GWS was responsible for the field deployments and the TEKRAN measurements in Toronto. DB performed the analysis of the MerPAS® for mercury. ARM conducted the statistical analyses. FW contributed to the study design, assembled the MerPAS® data submission, performed the comparative data analysis, made the figures, and wrote parts of the manuscript. CPJM, AS, and EMP contributed to the design of the MerPAS® and the study as a whole. CPJM acquired funding. All co-authors contributed to reviewing and editing the manuscript.
The author declare the following competing financial interest(s): Tekran Instruments Corp. pays some licensing fees to the University of Toronto related to the MerPAS®, which are in part distributed to co-authors Carl P. J. Mitchell and Frank Wania. Eric M. Prestbo and Diana Babi are employees of Tekran Instruments Corp., which sells the MerPAS® commercially.
This article is part of the special issue “Research results from the 14th International Conference on Mercury as a Global Pollutant (ICMGP 2019), MercOx project, and iGOSP and iCUPE projects of ERA-PLANET in support of the Minamata Convention on Mercury (ACP/AMT inter-journal SI)”. It is not associated with a conference.
We are grateful to David Gay for compiling the data generated by the different participants and making them available after they had all been received, and to Emily Alvarez for help with sampler deployments in Toronto. The Ontario Ministry of Environment, Conservation and Parks is acknowledged for site access and meteorological data.
The work in Toronto was supported by a Discovery Grant of the Natural Sciences and Engineering Research Council of Canada to Frank Wania and a grant and contribution agreement from Environment and Climate Change Canada (fund no. GCXE19S042) with Carl P. J. Mitchell. The work in Rende was funded by the European Commission – H2020, the ERA-PLANET program (http://www.era-planet.eu/, last access: 16 March 2021; grant agreement no. 689443) within the IGOSP project (http://www.igosp.eu/, last access: 16 March 2021). The study was also supported by the MercOx project (EMPIR EURAMET, project no. 16ENV01). IVL has received financial support from the EU ERA-Net Cofund program ERA Planet – iGOSP, grant agreement no. 689443, and the Foundation for the Swedish Environmental Research Institute (SIVL).
This paper was edited by Pierre Herckes and reviewed by four anonymous referees.
Arctic Council: Arctic Monitoring and Assessment Programme (AMAP), Arctic Council, Tromsø, Norway, available at: https://www.amap.no/ (last access: 5 August 2020), 1991.
Aspmo, K., Gauchard, P. A., Steffen, A., Temme, C., Berg, T., Bahlmann, E., Banic, C., Dommergue, A., Ebinghaus, R., Ferrari, C., Pirrone, N., Sprovieri, F., and Wibetoe, G.: Measurements of atmospheric mercury species during an international study of mercury depletion events at Ny-Ålesund, Svalbard, spring 2003. How reproducible are our present methods?, Atmos. Environ., 39, 7607–7619, 2005.
Brown, R. J. C., Pirrone, N., Van Hoek, C., Sprovieri, F., Fernandez, R., and Toté, K.: Standardisation of a European measurement method for the determination of total gaseous mercury: Results of the field trial campaign and determination of a measurement uncertainty and working range, J. Environ. Monit., 12, 689–695, https://doi.org/10.1039/b924955a, 2010.
D'Amore, F., Bencardino, M., Cinnirella, S., Sprovieri, F., and Pirrone, N.: Data quality through a web-based QA/QC system: Implementation for atmospheric mercury data from the global mercury observation system, Environ. Sci.: Processes Impacts, 17, 1482–1491, https://doi.org/10.1039/c5em00205b, 2015.
Dinoi, A., Cesari, D., Marinoni, A., Bonasoni, P., Riccio, A., Chianese, E., Tirimberio, G., Naccarato, A., Sprovieri, F., Andreoli, V., Moretti, S., Gullì, D., Calidonna, C. R., Ammoscato, I., and Contini, D.: Inter-comparison of carbon content in PM2.5 and PM10 collected at five measurement sites in Southern Italy, Atmosphere, 8, 243, https://doi.org/10.3390/atmos8120243, 2017.
Driscoll, C. T., Mason, R. P., Chan, H. M., Jacob, D. J., and Pirrone, N.: Mercury as a global pollutant: Sources, pathways, and effects, Environ. Sci. Technol., 47, 4967–4983, https://doi.org/10.1021/es305071v, 2013.
Ebinghaus, R., Jennings, S. G., Kock, H. H., Derwent, R. G., Manning, A. J., and Spain, T. G.: Decreasing trends in total gaseous mercury observations in baseline air at Mace Head, Ireland from 1996 to 2009, Atmos. Environ., 45, 3475–3480, https://doi.org/10.1016/j.atmosenv.2011.01.033, 2011.
Huang, J., Lyman, S. N., Hartman, J. S., and Gustin, M. S.: A review of passive sampling systems for ambient air mercury measurements, Environ. Sci.: Processes Impacts, 16, 374–392, https://doi.org/10.1039/c3em00501a, 2014.
Kuznetsova, A., Brockhoff, P. B., and Christensen, R. H. B.: lmerTest Package: Tests in Linear Mixed Effects Models, J. Stat. Softw., 82, 1–26, https://doi.org/10.18637/jss.v082.i13, 2017.
Landis, M. S., Stevens, R. K., Schaedlich, F., and Prestbo, E. M.: Development and characterization of an annular denuder methodology for the measurement of divalent inorganic reactive gaseous mercury in ambient air, Environ. Sci. Technol., 36, 3000–3009, https://doi.org/10.1021/es015887t, 2002.
Macagnano, A., Papa, P., Avossa, J., Perri, V., Marelli, M., Sprovieri, F., Zampetti, E., De Cesare, F., Bearzotti, A., and Pirrone, N.: Passive Sampling of Gaseous Elemental Mercury Based on a Composite TiO2NP/AuNP Layer, Nanomaterials, 8, 798, https://doi.org/10.3390/nano8100798, 2018.
Massman, W. J.: Molecular diffusivities of Hg vapor in air, O2 and N2 near STP and the kinematic viscosity and thermal diffusivity of air near STP, Atmos. Environ., 33, 453–457, https://doi.org/10.1016/S1352-2310(98)00204-0, 1999.
McLagan, D. S., Mitchell, C. P. J., Huang, H., Lei, Y. D., Cole, A. S., Steffen, A., Hung, H., and Wania, F.: A high-precision passive air sampler for gaseous mercury, Environ. Sci. Technol. Lett., 3, 24–29, https://doi.org/10.1021/acs.estlett.5b00319, 2016a.
McLagan, D. S., Mazur, M. E. E., Mitchell, C. P. J., and Wania, F.: Passive air sampling of gaseous elemental mercury: a critical review, Atmos. Chem. Phys., 16, 3061–3076, https://doi.org/10.5194/acp-16-3061-2016, 2016b.
McLagan, D. S., Mitchell, C. P. J., Huang, H., Abdul Hussain, B., Lei, Y. D., and Wania, F.: The effects of meteorological parameters and diffusive barrier reuse on the sampling rate of a passive air sampler for gaseous mercury, Atmos. Meas. Tech., 10, 3651–3660, https://doi.org/10.5194/amt-10-3651-2017, 2017.
McLagan, D. S., Mitchell, C. P. J., Steffen, A., Hung, H., Shin, C., Stupple, G. W., Olson, M. L., Luke, W. T., Kelley, P., Howard, D., Edwards, G. C., Nelson, P. F., Xiao, H., Sheu, G.-R., Dreyer, A., Huang, H., Abdul Hussain, B., Lei, Y. D., Tavshunsky, I., and Wania, F.: Global evaluation and calibration of a passive air sampler for gaseous mercury, Atmos. Chem. Phys., 18, 5905–5919, https://doi.org/10.5194/acp-18-5905-2018, 2018.
Moretti, S., Salmatonidis, A., Querol, X., Tassone, A., Andreoli, V., Bencardino, M., Pirrone, N., Sprovieri, F., and Naccarato, A.: Contribution of volcanic and fumarolic emission to the aerosol in marine atmosphere in the central mediterranean sea: Results from med-oceanor 2017 cruise campaign, Atmosphere, 11, 149, https://doi.org/10.3390/atmos11020149, 2020.
Munthe, J., Wängberg, I., Pirrone, N., Iverfeldt, Å., Ferrara, R., Ebinghaus, R., Feng, X., Gårdfeldt, K., Keeler, G., Lanzillotta, E., Lindberg, S. E., Lu, J., Mamane, Y., Prestbo, E., Schmolke, S., Schroeder, W. H., Sommar, J., Sprovieri, F., Stevens, R. K., Stratton, W., Tuncel, G., and Urba, A.: Intercomparison of methods for sampling and analysis of atmospheric mercury species, Atmos. Environ., 35, 3007–3017, https://doi.org/10.1016/S1352-2310(01)00104-2, 2001.
Naccarato, A., Tassone, A., Moretti, S., Elliani, R., Sprovieri, F., Pirrone, N., and Tagarelli, A.: A green approach for organophosphate ester determination in airborne particulate matter: Microwave-assisted extraction using hydroalcoholic mixture coupled with solid-phase microextraction gas chromatography-tandem mass spectrometry, Talanta, 189, 657–665, https://doi.org/10.1016/j.talanta.2018.07.077, 2018.
Naccarato, A., Tassone, A., Cavaliere, F., Elliani, R., Pirrone, N., Sprovieri, F., Tagarelli, A., and Giglio, A.: Agrochemical treatments as a source of heavy metals and rare earth elements in agricultural soils and bioaccumulation in ground beetles, Sci. Total Environ., 749, 141438, https://doi.org/10.1016/j.scitotenv.2020.141438, 2020.
Paradis, E., Claude, J., and Strimmer, K.: APE: Analyses of Phylogenetics and Evolution in R language, Bioinformatics, 20, 289–290, https://doi.org/10.1093/bioinformatics/btg412, 2004.
Pinheiro, J., Bates, D., DebRoy, S., Sarkar, D., and R Core Team: nlme: Linear and Nonlinear Mixed Effects Models, R package version 3.1-131, available at: https://CRAN.R-project.org/package=nlme (last access: July 2020), 2017.
Pirrone, N., Aas, W., Cinnirella, S., Ebinghaus, R., Hedgecock, I. M., Pacyna, J., Sprovieri, F., and Sunderland, E. M.: Toward the next generation of air quality monitoring: Mercury, Atmos. Environ., 80, 599–611, https://doi.org/10.1016/j.atmosenv.2013.06.053, 2013.
Restrepo, A. R., Hayward, S. J., Armitage, J. M., and Wania, F.: Evaluating the PAS-SIM model using a passive air sampler calibration study for pesticides, Environ. Sci.: Processes Impacts, 17, 1228–1237, https://doi.org/10.1039/c5em00122f, 2015.
Slemr, F., Angot, H., Dommergue, A., Magand, O., Barret, M., Weigelt, A., Ebinghaus, R., Brunke, E.-G., Pfaffhuber, K. A., Edwards, G., Howard, D., Powell, J., Keywood, M., and Wang, F.: Comparison of mercury concentrations measured at several sites in the Southern Hemisphere, Atmos. Chem. Phys., 15, 3125–3133, https://doi.org/10.5194/acp-15-3125-2015, 2015.
Steffen, A., Scherz, T., Olson, M., Gay, D., and Blanchard, P.: A comparison of data quality control protocols for atmospheric mercury speciation measurements, J. Environ. Monit., 14, 752–765, https://doi.org/10.1039/c2em10735j, 2012.
Tassone, A., Moretti, S., Martino, M., Pirrone, N., Sprovieri, F., and Naccarato, A.: Modification of the EPA method 1631E for the quantification of total mercury in natural waters, MethodsX, 7, 100987, https://doi.org/10.1016/j.mex.2020.100987, 2020.
Temme, C., Blanchard, P., Steffen, A., Banic, C., Beauchamp, S., Poissant, L., Tordon, R., and Wiens, B.: Trend, seasonal and multivariate analysis study of total gaseous mercury data from the Canadian atmospheric mercury measurement network (CAMNet), Atmos. Environ., 41, 5423–5441, https://doi.org/10.1016/j.atmosenv.2007.02.021, 2007.
Tørseth, K., Aas, W., Breivik, K., Fjæraa, A. M., Fiebig, M., Hjellbrekke, A. G., Lund Myhre, C., Solberg, S., and Yttri, K. E.: Introduction to the European Monitoring and Evaluation Programme (EMEP) and observed atmospheric composition change during 1972–2009, Atmos. Chem. Phys., 12, 5447–5481, https://doi.org/10.5194/acp-12-5447-2012, 2012.
UNEP: Minamata Convention on Mercury – Text and Annexes, UNEP, Geneva, Switzerland, 1–59, 2013.
Vermette, S. J., Lindberg, S. E., and Bloom, N. S.: The Mercury Deposition Network of the National Atmospheric Deposition Program (Nadp/Mdn), in: Abstracts of Papers of the American Chemical Society, vol. 210, 81 pp., GEOC, American Chemical Society, Washington, DC, United States, WOS Accession Number: A1995RP25601924, 1995.
Wängberg, I., Munthe, J., Pirrone, N., Iverfeldt, Å., Bahlman, E., Costa, P., Ebinghaus, R., Feng, X., Ferrara, R., Gårdfeldt, K., Kock, H., Lanzillotta, E., Mamane, Y., Mas, F., Melamed, E., Osnat, Y., Prestbo, E., Sommar, J., Schmolke, S., Spain, G., Sprovieri, F., and Tuncel, G.: Atmospheric mercury distribution in Northern Europe and in the Mediterranean region, Atmos. Environ., 35, 3019–3025, https://doi.org/10.1016/S1352-2310(01)00105-4, 2001.
Wängberg, I., Hageström, U., Sommar, J., and Ferm, M.: Development and Testing of a Passive Sampler for Measurement of Gaseous Mercury, Atmos. Chem. Phys. Discuss. [preprint], https://doi.org/10.5194/acp-2016-528, 2016.