the Creative Commons Attribution 4.0 License.
the Creative Commons Attribution 4.0 License.
 | 13 Jul 2021
Total ozone column intercomparison of Brewers, Dobsons, and BTS-Solar at Hohenpeißenberg and Davos in 2019/2020
Ralf Zuber
Luca Egli
Mario Ribnitzky
Wolfgang Steinbrecht
Julian Gröbner
During the 2019/2020 measurement campaign at Hohenpeißenberg (Germany) and Davos (Switzerland) we compared the well-established Dobson and Brewer spectrometers (single- and double-monochromator Brewer) with newer BTS array-spectroradiometer-based systems in terms of total ozone column (TOC) determination. The aim of this study is to validate the BTS performance in a longer-term TOC analysis over more than 1 year with seasonal and weather influences. Two different BTS setups have been used – a fibre-coupled entrance optic version by PMOD/WRC called Koherent and a diffusor optic version from Gigahertz Optik GmbH called BTS-Solar, which proved to be simpler in terms of calibration. The array-spectrometer-based BTS systems have been calibrated with traceability to NMI, and both versions of TOC retrieval algorithms are based on spectral measurements in the range of 305 to 350 nm instead of single-wavelength or wavelength pair measurements as per Brewer or Dobson. The two BTS-based systems, however, used fundamentally different retrieval algorithms for the TOC assessment, whereby the retrieval of the BTS-Solar turned out to achieve significantly smaller seasonal drifts. The intercomparison showed a difference of the BTS-Solar to Brewers of < 0.1 % with an expanded standard deviation (k=2) of < 1.5 % over the whole measurement campaign. Koherent showed a difference of 1.7 % with an expanded standard deviation (k=2) of 2.7 % mostly caused by a significant seasonal variation. To summarize, the BTS-Solar performed at the level of Brewers in the comparison in Hohenpeißenberg. The BTS-Solar showed very small dependence on the slant path column compared to the double-monochromator Brewer and performed better than the single-monochromator Brewer. Koherent showed a strong seasonal variation in Davos due to the sensitivity of its ozone retrieval algorithm to stratospheric temperature.
- Article
(3272 KB) - Full-text XML
- BibTeX
- EndNote


Atmospheric ozone is recognized as an essential climate variable in the Global Climate Observing System (GCOS) of the World Meteorological Organization (WMO). Careful long-term monitoring of the global ozone layer is still crucial in verifying the successful implementation of the Montreal Protocol and its amendments (MPA) for the protection of the ozone layer, with the eventual recovery of the ozone layer to pre-1970s levels.
McKenzie et al. (2019) showed for instance that no global, statistically significant recovery of the ozone layer has taken place yet, but no further decline has been observed either. This alone suggests that longer periods of observation are necessary. In addition Montzka et al. (2018) stated that, despite the ban, CFC-11 has been released in measurable quantities in China. This means that not only the control of the expected recovery of the ozone layer but also the monitoring of the Montreal Protocol for the CFC ban is an important task (Bais et al., 2019).
On the other hand, the effects of the global climate change to the ozone layer are yet not completely understood (Bais et al., 2019, 2018, 2015; Seckmeyer et al., 2018), which provides another argument for continuing observations.
The monitoring of the ozone layer started in 1926, with the development of the Dobson spectrophotometer designed and built by Prof. Gordon Miller Bourne Dobson at the Oxford University (Dobson, 1931, 1968). The first small network with six stations (Abisko, Arosa, Lerwick, Lindenberg, Oxford, Valentia) was established in 1926 (Köhler and Claude, 2006) to measure the total ozone column (TOC). A remarkable extension of the global network has occurred since 1957/1958 (International Geophysical Year). In the following decades, up to 130 instruments were produced and employed. The Meteorological Observatory Hohenpeißenberg (MOHp) of the German National Weather Service (Deutscher Wetterdienst, or DWD) started its observations of the ozone layer with ozone sonde (vertical profile of the ozone up 35 km) and with Dobson no. 104 (TOC) in 1967/68. Approximately 50 stations with Dobson instruments are still operational today and submitting data to the World Ozone and Ultraviolet Radiation Data Centre (WOUDC) in Toronto (Canada). Thus, this type of spectrophotometer is still a backbone in the global ozone monitoring network, although new, modern instruments like the Brewer spectrophotometer have been established in this network since the 1980s.
State-of-the-art array spectrophotometers measuring spectral UV radiation are potential candidates for new types of instruments to monitor the ozone layer (Egli et al., 2016). These instruments benefit from being less mechanically complex as no moving parts are required for spectral measurements. Due to strong ozone absorption between 300 and 350 nm, TOC can be retrieved from spectral direct-sun measurements in the UV band (Huber et al., 1995). The same spectral range is used for TOC retrieval from Brewers and Dobsons (Kerr et al., 1988). However, the advantage of array spectroradiometers is that a spectrum is measured at wavelength step increments < 0.2 nm instead of at only a few wavelengths as per the Brewer (five wavelengths) or the Dobsons (single and double pair observations). Measurements obtained at multiple wavelengths with a narrow spectral step we will refer here to as “full spectrum” in order to distinguish from the four- or five-wavelength approach of the Dobsons and Brewers. One may assume that this additional spectral information from the full spectrum increases the reliability of TOC retrieval. The general specifications for spectral global solar UV measurements in the TOC-relevant band are stated in several guideline publications (e.g. Seckmeyer et al., 2010, 2001). The performance of global UV measurements of different commercially available array spectroradiometers has been tested at the intercomparison presented in Egli et al. (2016). The results of the global UV intercomparison in Egli et al. (2016) showed that the tested instruments suffered significantly from stray light. In particular at high solar zenith angles (SZAs), the UV radiation at short wavelengths between 300 and around 315 nm are significantly biased, while the spectral measurements at longer wavelength are well reproduced. At low SZAs, only a few well-characterized and well-calibrated devices provided acceptable deviation in solar irradiance in the range of 5 % to the reference.
The first instruments using the full spectrum of array spectroradiometer for TOC retrieval are Pandora (Herman et al., 2015) and Phaeton (Gkertsi et al., 2018). The Pandora system retrieves TOC by spectral fitting of the attenuated spectrum in the wavelength band between 305 and 330 nm. Herman et al. (2017) reported an averaged difference of 2.1 ± 3.2 % for TOC with a relative drift of 0.2 % yr−1 for Pandora system no. 34 compared to NOAA Dobson no. 061 in Boulder, Colorado, based on a 3-year intercomparison. For the comparison, both instruments were corrected for the impact of stratospheric temperature using their standard ozone absorption cross section. The Dobson was not corrected for stray light. However, AD-pair direct-sun Dobson observations (detailed explanation of the various observation methods in Komhyr, 1980, and Evans, 2008) were used in comparisons with Pandora within the acceptable range of air masses that would minimize the impact of stray light. Additionally, a correction has been implemented for the Pandora system addressing the effect of stray light.
The Phaeton instrument is a DOAS/MAXDOAS system using the wavelength band between 315 and 337 nm. The instrument was characterized for stray light with a tuneable laser, and a stray-light correction was applied. The 2-year comparison with a single-monochromator Brewer spectrophotometer revealed an average bias of 1.85 ± 1.86 % for TOC using the Paur and Bass (1985) cross section at constant temperature of 228 K. When including the daily variability of the stratospheric temperature, the differences are reduced to 0.94 ± 1.26 %.
The BTS array spectroradiometer was released after the assessment of the quality of the aforementioned global UV array spectroradiometers (Egli et al., 2016). The accuracy and stability of BTS-Solar global spectral irradiance measurements were compared against well-established double-monochromator-based systems (Zuber et al., 2018a). The BTS reduces stray light by filtering optical radiation from longer wavelength with different bandpass filters inside the array spectroradiometer. Due to this stray-light suppression, the UV index measurements derived from the BTS spectra were within ±1 % for SZAs smaller than 70∘ and ±3 % for SZAs between 70 and 85∘ in reference to an NDACC device (Zuber et al., 2018a). The comparison of the BTS-Solar UV spectra with the reference showed some biases of up to 5 % for wavelengths shorter than 310 nm for SZAs larger than 70∘ (Zuber et al., 2018a). These biases may affect the TOC retrieval using the full spectrum, including short wavelengths. Addressing this question, Zuber et al. (2018b) noted a deviation of TOC determination of less than 1.5 % (for SZAs smaller than 65∘) to other instruments in most situations and not exceeding 3 % from established TOC measurement systems such as Dobson or Brewer at the Izaña Atmospheric Observatory in Tenerife. At higher SZAs the deviation slightly increased for the TOC determination. This may be an effect of the remaining stray light in the wavelength band between 305 and 310 nm, which was used during this intercomparison. Potential effects on TOC caused by the remaining stray light will be further discussed based on the results of this study.
In this publication we show the longer-term (more than 1 year) performance of BTS-based systems concerning TOC determination in terms of different solar zenith angles, different TOC level, and seasonal and weather influences in harsh environment at Hohenpeißenberg (Germany) and Davos (Switzerland). Furthermore, two distinctly different retrieval algorithms from the BTS-Solar and the Koherent system are compared and discussed based on the results of this long-term intercomparison.
The intercomparison took place in the 2019/2020 measurement campaign at the DWD Hohenpeißenberg, Germany (altitude: 953 m; coordinates: 47.80∘ N, 11.01∘ E), and Physikalisch-Meteorologisches Observatorium Davos (PMOD/WRC), Switzerland (altitude: 1580 m; coordinates: 46.81∘ N, 9.83∘ E).
Both stations are part of the global ozone monitoring network of WMO's Global Atmosphere Watch (GAW) and the European Brewer Network (http://www.eubrewnet.org/, last access: 8 July 2021). The DWD Hohenpeißenberg has been the WMO Regional Dobson Calibration Centre for Europe (RDCC-E) since 1999 and part of the GAW network since 1995 (Köhler, 2002). The PMOD/WRC is the world calibration centre for meteorological radiation measuring instruments. At Hohenpeißenberg the BTS-Solar is compared to the instruments Dobson no. 104, reference Dobson no. 064 on a few special days, Brewer no. 010 (single monochromator) and Brewer no. 226 (double monochromator). At Davos the BTS-based Koherent is compared to Brewer no. 163 (double monochromator).
2.1 Dobson/Brewers
Today Dobson and Brewer spectrophotometers are still the main instruments in the global network used to monitor the ozone layer, and they have been in use since the 1920s and 1980s, respectively.
The operational instruments used at the Meteorological Observatory Hohenpeißenberg are one field and one reference Dobson spectrophotometer and two field Brewer spectrophotometers; both types of spectrophotometer use a similar physical principle. They measure the incoming solar radiation in various spectral lines in the short UV-B (280–315 nm) and the longer UV-A range (315–400 nm). Whereas the short wavelengths are affected by ozone absorption, the wavelengths longer than 340 nm are unaffected by ozone absorption.
The Dobson spectrophotometer measures the relative intensity of the solar radiation at three wavelength pairs, using a photomultiplier tube and a so-called optical wedge. Detailed descriptions of the Dobson design and function, the data processing algorithms, and the treatment and minimizing of special instrumental and atmospheric effects (internal and external stray light like Mie scattering, dependence on the effective temperature of the ozone layer etc.) can be found in a large plurality of old, historical and recent literature. Dobson-relevant papers include the following: Dobson (1931, 1957a, b, 1968), Komhyr (1980), Evans (2008), Staehlin et al. (2003) and Vogler et al. (2007).
The measurement principle of the Brewer spectrophotometer is similar, as it uses the spectral lines of the solar radiation in the same UV range as the Dobson. As with the Dobsons, the TOC retrieval with Brewer is obtained with the double-ratio technique of the wavelength pairs using a slightly different weighting for the individual channels. Publications describing the Brewer spectrometer are Kerr et al. (1985, 1981), Kerr (2002) and Savastiouk (2006). The essential difference is that this spectrophotometer measures the photon counts directly with a photomultiplier at each of the five wavelengths used for ozone and additionally SO2. The same procedure of the double-ratio technique as with the Dobson is then applied to derive the TOC. One advantage of the Brewer type is its automatic operation using a PC with a special control and TOC-calculation software, which is in contrast to normal Dobsons, which are manually operated (except the Swiss automatic Dobsons; Stübi et al., 2017). However, both methods of measurements, manual and automatic, need several minutes (e.g. Brewer allows a single measurement within 30 s; however typically 3 min is needed in order to detect cloud influences) to acquire a reasonable amount of data and to optimize for a reliable value of the TOC. At this point, it should be noted for comparison that the fully automated BTS-based devices allow reliable measurements within 8 to 45 s (depending on SZA and BTS setup); however usually an averaging of 1 to 5 min is applied in order to acquire a practical amount of data and optimize the signal-to-noise ratio (SNR).
Many publications about medium- and long-term intercomparisons between both spectrophotometer types have been published in the past 3 decades: Kerr et al. (1988), Köhler and Attmannspacher (1986), Köhler et al. (1989), Staehelin et al. (2003) with a detailed description of function and ozone retrieval algorithms of Dobson and Brewer, and Scarnato et al. (2010). An important publication on the compatibility of Brewer measurements in Arosa and Davos was published by Stübi et al. (2017). The paper of Redondas et al. (2014) describes the effects of the planned introduction of new ozone absorption cross sections (Gorshelev et al., 2014; Serdyuchenko et al., 2014) on the Brewer and Dobson ozone retrievals. A comparison of Dobsons and Brewers with different cross sections was recently performed at PMOD/WRC (Gröbner et al., 2021). In addition to the introduction of new ozone absorption cross sections, a further potential improvement of Dobson data is the use of effective absorption coefficients for each Dobson. The determination and application of these individual absorption coefficients, taking into account the effective temperature of the ozone layer and individual effective slit functions for each Dobson, has recently been investigated and discussed (Köhler et al., 2018; Redondas et al., 2014).
The last official calibration services of Dobson no. 104 with the regional standard Dobson no. 064 of the Hohenpeißenberg RDCC-E were performed in 2018 and 2019 and confirmed its stable calibration level, as the agreement with the standard was better than 1 %. The Hohenpeißenberg Brewers no. 010 (running since 1983) and 226 (running since 2014) underwent a calibration service in July 2020, done by IOS (International Ozone Services) using the travelling standard Brewer no. 017 (see Fig. 2). These kinds of calibration services have been performed every year in the past 20 years. The stability of the calibration levels of both Brewers (differences to the reference < 1 %) has been confirmed almost every year, including in 2020.
Both systems are still in regular use, even though Dobson spectrophotometers are no longer manufactured. In order to further maintain a dense network of TOC observations worldwide, new automatic, reliable, simple and cost-effective systems have been developed.
2.2 BTS-Solar
BTS-Solar is based on a BTS unit with directly mounted diffusor entrance optic and a tube for field-of-view (FOV) limitation for irradiance measurements (no optical fibre). The device is described and characterized (e.g. FOV = ±1.4∘) in detail in Zuber et al. (2018b). For the TOC determination a least-squares minimization algorithm in the wavelength range from 305 to 350 nm according to Huber et al. (1995) could be used to take advantage of the entire full spectrum, as is used by the Koherent measurement system discussed in Sect. 2.3. However, for the BTS-Solar, and in contrast to Koherent, we developed a different TOC retrieval algorithm, which is validated by the long-term/seasonal performance in this study. The algorithm is also described in more detail in Zuber et al. (2018b). In summary, the technique is based on the comparison of two selected wavelength bands (instead of the entire spectrum as for Koherent) of the measured data with a lookup table (LUT) pre-calculated by the libRadtran software package for radiative transfer calculations (Emde et al., 2016).
For the intercomparison within this paper two adaptions of the previous campaign retrieval algorithm (Zuber et al., 2018b) have been applied.
First, the two wavelength bands which are considered for the TOC retrieval are adapted to 307 to 311 nm (high ozone absorption) and 319 to 324 nm (low ozone absorption; see Fig. 1), which proved to be the most robust configuration for the BTS device. The reason for this choice is that both wavelength bands are within one optical filter's measurement range of the BTS and the measurement time could be further decreased in principle to this single filter measurement. Second, an air pressure correction for this retrieval algorithm was introduced in order to consider the larger differences that can be expected within a period of the measurement campaign. A correction model was used since the calculation of a different LUT for every air pressure would be possible, but it is too calculation intensive. The standard deviation (k=1) of the correction within the whole expected air pressure variability at Hohenpeißenberg is < 0.8 DU, which was derived by comparing the model with calculated LUTs for different air pressure (for an air pressure range of 870 to 930 hPa, as observed at Hohenpeißenberg, a correction of maximum 2.5 DU results). For this purpose, five different LUTs with different pressures were calculated, and a best-fit model for the pressure correction was determined. This correction was applied after the TOC retrieval based on a standard pressure with the actual present air pressure during the measurement campaign. The air pressure data were supplied by the DWD.
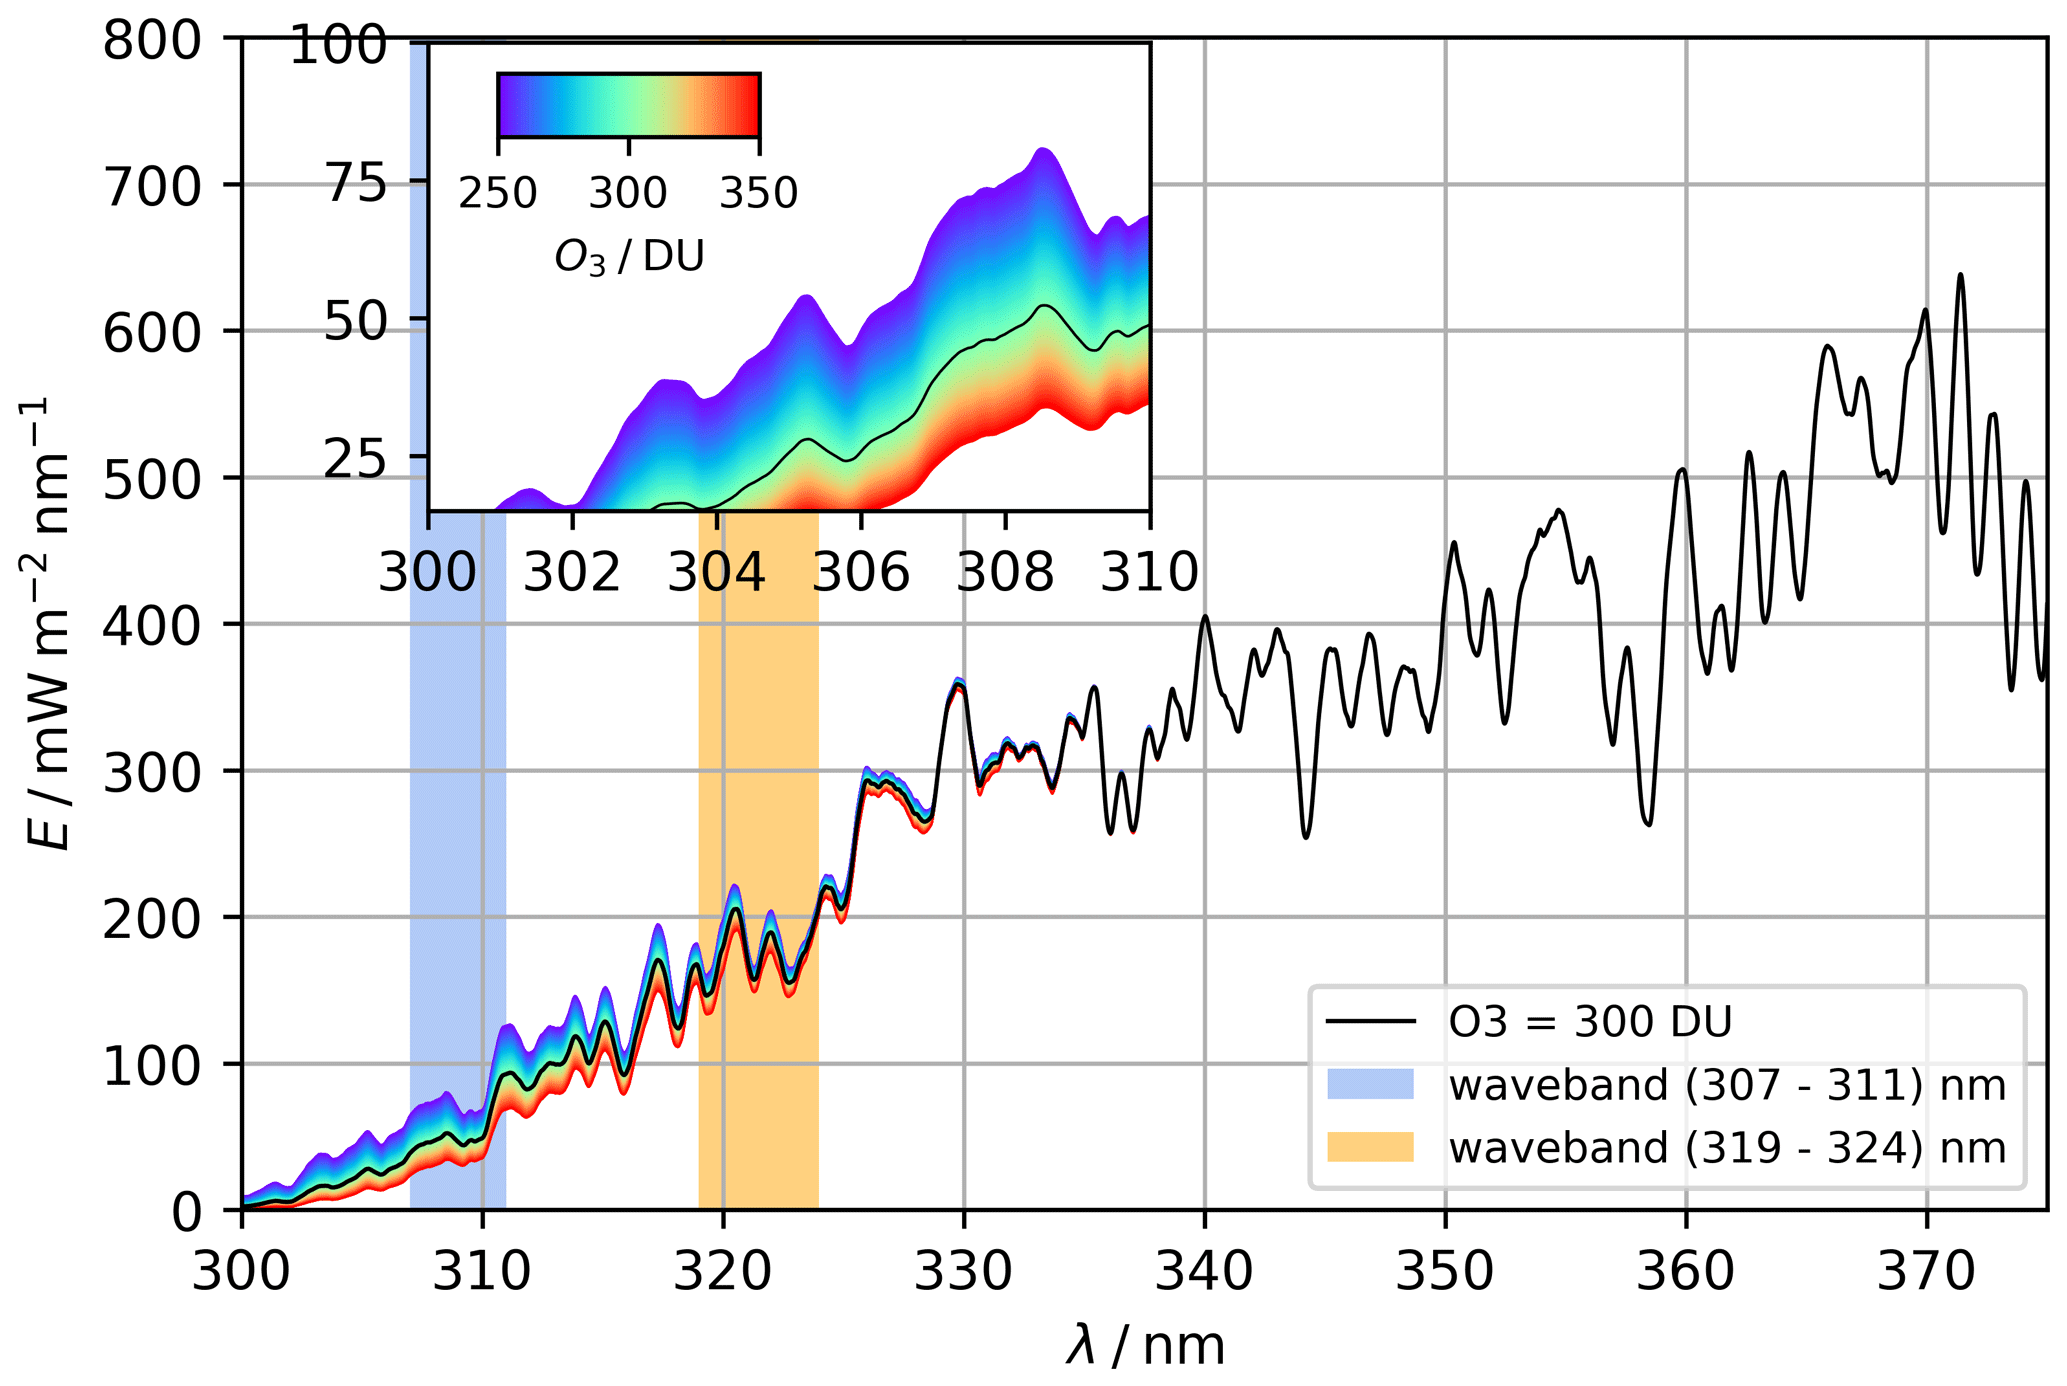
Figure 1Direct irradiance spectra of the lookup table modelled with libRadtran. The two wavebands for the TOC retrieval are marked with blue (high O3 absorption) and orange (low O3 absorption).
In general, for the calculation of the LUT, the following values for the input parameters have been chosen for Hohenpeißenberg: air pressure as stated above, an altitude of 953 m, an atmospheric profile typical for subarctic (due to the mountain region) summer and winter (transition in April and October) given by Anderson et al. (1986), and the ozone cross section of Paur and Bass (1985); the IUP (Institut für Umweltphysik, University of Bremen) cross sections of Serdyuchenko et al. (2014) are in the meantime also available for libRadtran. A sample check of 1 d (24 February 2020) results in a difference of 0.4 DU when using Bass and Paur or IUP. Finally, the high-resolution QASUMEFTS extra-terrestrial spectrum of Gröbner et al. (2017) is used for the libRadtran modelling. For aerosol, albedo (which has no significant influence on direct solar irradiance) and SO2 standard values of libRadtran have been used. This methodology was applied with excellent results to measurements at Izaña Atmospheric Observatory in Tenerife (Zuber et al., 2018b) using slightly different wavelengths for the ozone retrievals, as well as in the intercomparison in Huelva with comparable results which have not been scientifically published yet. The results of this study with the adopted wavelength show that a retrieval based on a comparison of the LUT to the measurement provided accurate results for many cases. At this point we want to emphasize that this retrieval method based on LUT does not require any further time-dependent input parameters apart from the current air pressure. However, more precise and extensive modelling for each measurement individually would be possible and maybe also needed for some measurement sites with different and fast-changing atmospheric conditions. However, in the libRadtran software package further atmospheric profiles are available and can be applied for other sites (midlatitude summer and winter, subarctic summer and winter, tropical and US standard atmosphere) (Emde et al., 2016). During this campaign, the mentioned pre-defined standard parameters were used for the LUT and were not changed within the whole intercomparison campaign except for the seasonal atmosphere model (summer/winter), which was changed in April and October. At the date of the season change no significant change in TOC retrieval was recognizable at the evaluated air mass factors (AMFs) up to 3.5. No additional correction of stratospheric ozone temperature has been applied so far.
The BTS-Solar has been calibrated for this campaign with a well-known spectral irradiance calibration setup with 70 cm distance at the Gigahertz Optik ISO 17025 certified calibration laboratory (D-K-15047-01-00, D-PL-15047-17025-2020). This calibration proved to be robust, and small measurement uncertainties of 2.5 % (expanded measurement uncertainty k=2) in spectral irradiance can be achieved (Zuber et al., 2018b; Vaskuri et al., 2018). After 6 months a check of the calibration was performed, which showed no significant change (differences below the calibration uncertainty of the standard lamp). As a result, the calibration was not changed throughout the whole measurement campaign.
A measurement interval of 2 min was chosen. During the whole measurement campaign at Hohenpeißenberg, only 16 d were affected by power breakdowns due to construction work at the site and an IP server issue/software conflict in the beginning of the campaign. This represents about 3 % downtime during the whole campaign. For the performance evaluation all measurement data of the whole intercomparison campaign were considered. Only measurements with a standard deviation error of 10 DU within five consecutive measurements were removed since such a large change in TOC within such a short time interval can only be expected due to instrument malfunction, cloud movement or very high SZA.
2.3 Koherent
Koherent is based on a fibre-coupled BTS-2048-UV-S-F array spectroradiometer. Contrary to the instrument at Hohenpeißenberg, the BTS-2048-UV-S-F is connected to a lens-based imaging telescope, with a field of view of about ±0.6∘. The telescope is mounted on a sun tracker on the measurement platform at PMOD/WRC as presented in Egli and Gröbner (2018). The array spectroradiometer is embedded in a temperature-stabilized weatherproof box keeping the instrument at a constant temperature of 22 ± 1 ∘C through all seasons of the year.
The raw data of the BTS are acquired with a Python software routine on an embedded computer inside the box, providing data with almost no technical failure during the entire campaign. The readings are taken in intervals of 1 min for each measurement. Usually, the device needs around 45 s for one measurement. However, at high SZAs in the early morning or late evening with low direct-sun irradiance intensity, around 2 min is needed due to increased integration time. The data were aggregated to a 5 min data point, by averaging the individual data. When the standard deviation of the individual measurements within 5 min exceeded 10 DU, the data were considered as invalid. These small-time-scale variations are caused by instable atmosphere such as cirrus clouds or noise from the detector at low sun elevations. The criterion of 10 DU was chosen to remove theses outliers.
The postprocessing was performed offline with the following steps: (a) converting the raw counts of the readings to irradiance using the laboratory calibration, (b) wavelength shift correction using the MatShic software developed at PMOD/WRC (Egli, 2014), and (c) retrieving TOC with a least-squares minimization algorithm according to Huber et al. (1995) and Vaskuri et al. (2018).
The aforementioned least-squares algorithm uses a spectral fit in the wavelength range from 305 to 350 nm and an atmospheric model based on the Beer–Lambert law:
where Iλ represents the measured solar irradiance from Koherent at the specific wavelength λ and I0 is the extraterrestrial spectrum at the top of the atmosphere. For the retrieval, the QASUMEFTS extra-terrestrial spectrum is applied (Gröbner et al., 2017).
The air mass m is important for the attenuation of ozone through the atmosphere, which depends on geographical location and the time of the day and thus on the solar zenith angle during a day and the seasons. The air mass for the ozone (), aerosol () and Rayleigh () optical thickness (Eq. 2) is calculated independently for various profiles from the standard US atmosphere afglus (NOAA, 1976).
The attenuation is summarized by the term τλ, indicating the absorption and scattering by ozone, aerosols and Rayleigh (Eq. 2). The absorption cross section by ozone is provided by the University of Bremen, IUP (Serdyuchenko et al., 2014). For the retrieval, the IUP cross section at the stratospheric temperature of constant −45∘ is used for the standard US atmosphere. The assumption of −45 ∘C is the same as used in the standard Brewer procedure.
Finally, the aerosol absorption is parameterized with a spectrally linear model and the Rayleigh scattering by the parameterization of Nicolet (1984) assuming a constant ground air pressure of 820 hPa (for the higher-altitude station Davos).
The advantage of the minimal least-squares fit approach is that the attenuation by aerosol optical depth is a free-fitting parameter for each measurement during the ozone retrieval and is not required as an input parameter. Note that ozone and aerosol optical depth are weakly correlated, which allows fitting the free variables by the least-squares fit algorithm. The stratospheric temperature and the height of the stratospheric layer are currently not retrieved by the algorithm, nor is SO2 included. In summary, the retrieval algorithm used for this comparison displays a first simple approach to test the performance of the above standard settings of the retrieval method.
The system was calibrated for absolute irradiance at the PMOD/WRC laboratory facilities on 14 and 19 November 2019 using four 1000 W FEL lamps on a linear stage at distances of 2.40 and 1.30 m. Due to the low light throughput of the fibre-coupled telescope setup and the sensitivity of the alignment to small angular deviations on the linear stage, the responsivity varied, resulting in TOC differences of 2.2 % (k=1). An averaged responsivity of the system, which appeared to be the best calibration, was used for the calibration of the raw data and resulting TOC from Koherent presented here.
In analogy to the comparison at Hohenpeißenberg, Koherent is compared with the PMOD/WRC double-monochromator Brewer no. 163. The Brewer is annually calibrated for TOC retrieval by the Regional Brewer Calibration Center Europe (RBCC-E) with an uncertainty of around 1 % compared to the reference Brewer of the calibration centre (Redondas et al., 2019), while the stability of the instrument is operationally monitored on a daily schedule. However, an absolute uncertainty of Brewer no. 163 is not known. Due to this quality and stability assurance of the Brewer no. 163 TOC data, Brewer no. 163 serves as a reference for the comparison with Koherent in Davos. Brewer TOC readings are taken on an irregular schedule, since the Brewer also measures operationally spectral global UV irradiance.
3.1 BTS-Solar at Hohenpeißenberg
A particular day of the intercomparison at Hohenpeißenberg (28 July 2020) is presented in Fig. 2. During this day the RDCC-E reference Dobson no. 064, the Indian Dobson no. 036 and the IOS Brewer no. 017 for service purposes joined the intercomparison. The measurements of seven instruments (BTS-Solar; Dobson no. 036, 064 and 104l; Brewer no. 010, 017 and 226) showed a good agreement with differences between all instruments mostly less than ±1 % (see Fig. 2) on this particular day. Only at low sun elevations in the morning did the BTS-Solar and the single-monochromator Brewer no. 010 show a bias of about 5 DU to the other instruments.

Figure 2TOC measurements of the IOS Brewer calibration service on 28 July 2020 at Hohenpeißenberg.
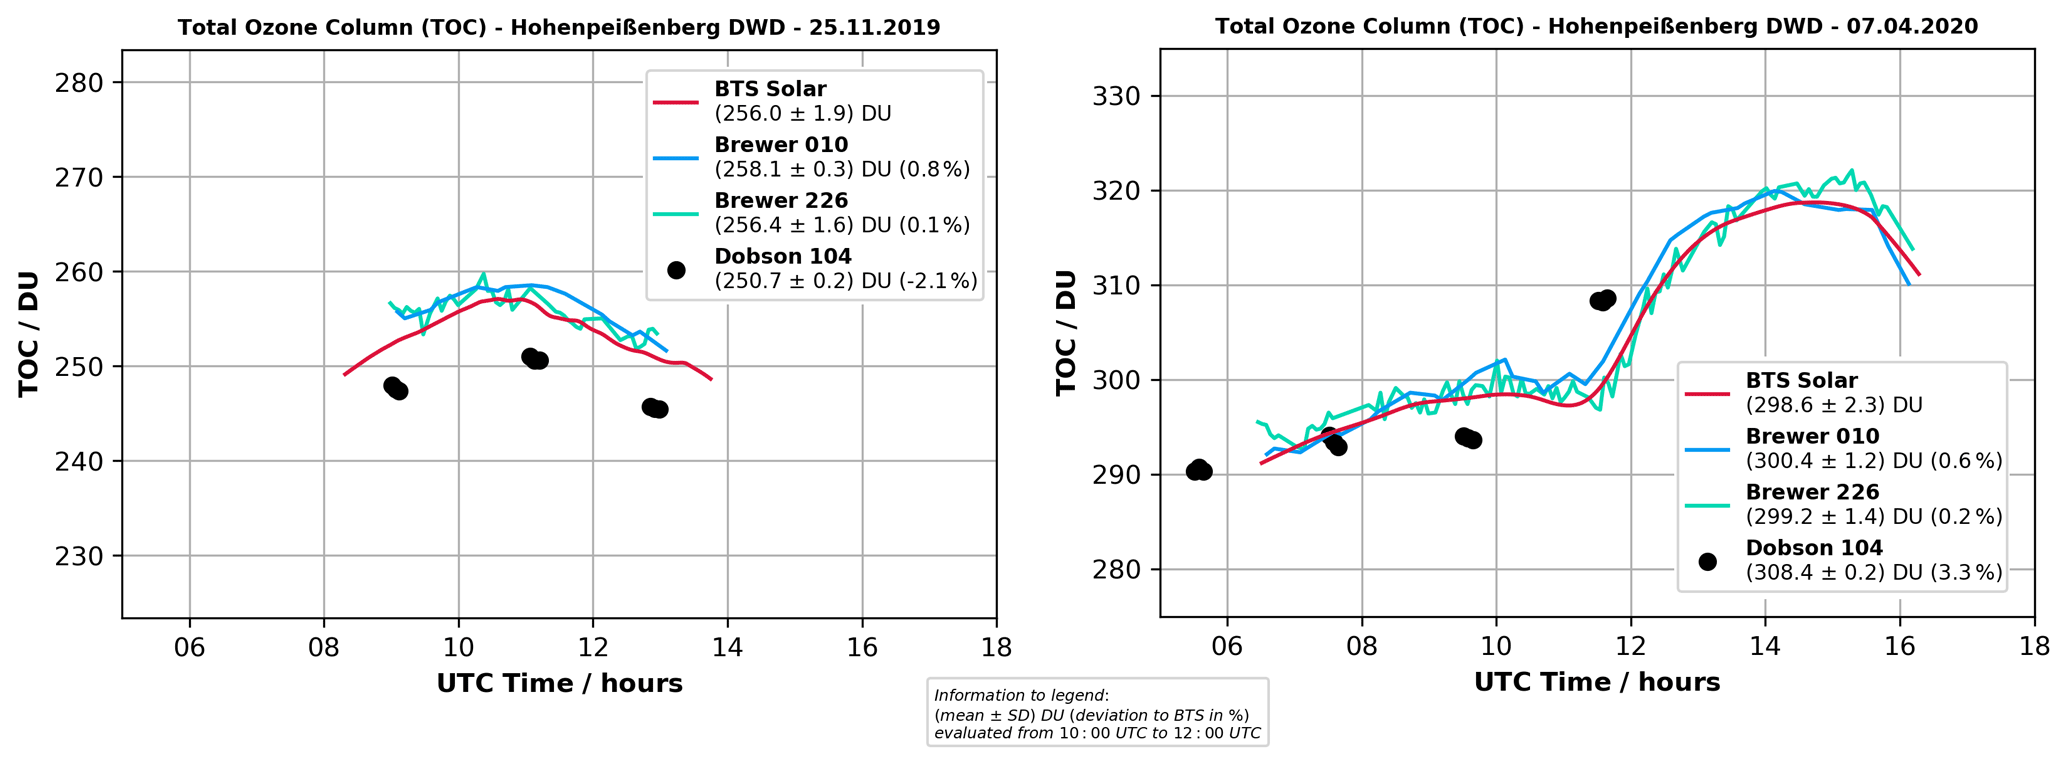
Figure 3Two exemplarily days of the intercomparison. Measurements on 7 April 2020 show a strong dynamically driven change in TOC within the day.
Figure 3 presents two examples of daily courses of TOC. One shows a strong diurnal dynamic and the higher temporal resolution of BTS-Solar and Brewers compared to the Dobson. These data show that the BTS-Solar and both Brewers capture about the same TOC variability (SZA). The Dobson shows the aforementioned offset in the winter season and delivers only a few data points for each day due to its manual operation. However, the Dobson is also able to capture atmospheric changes if a sufficient amount of data are measured (time interval).
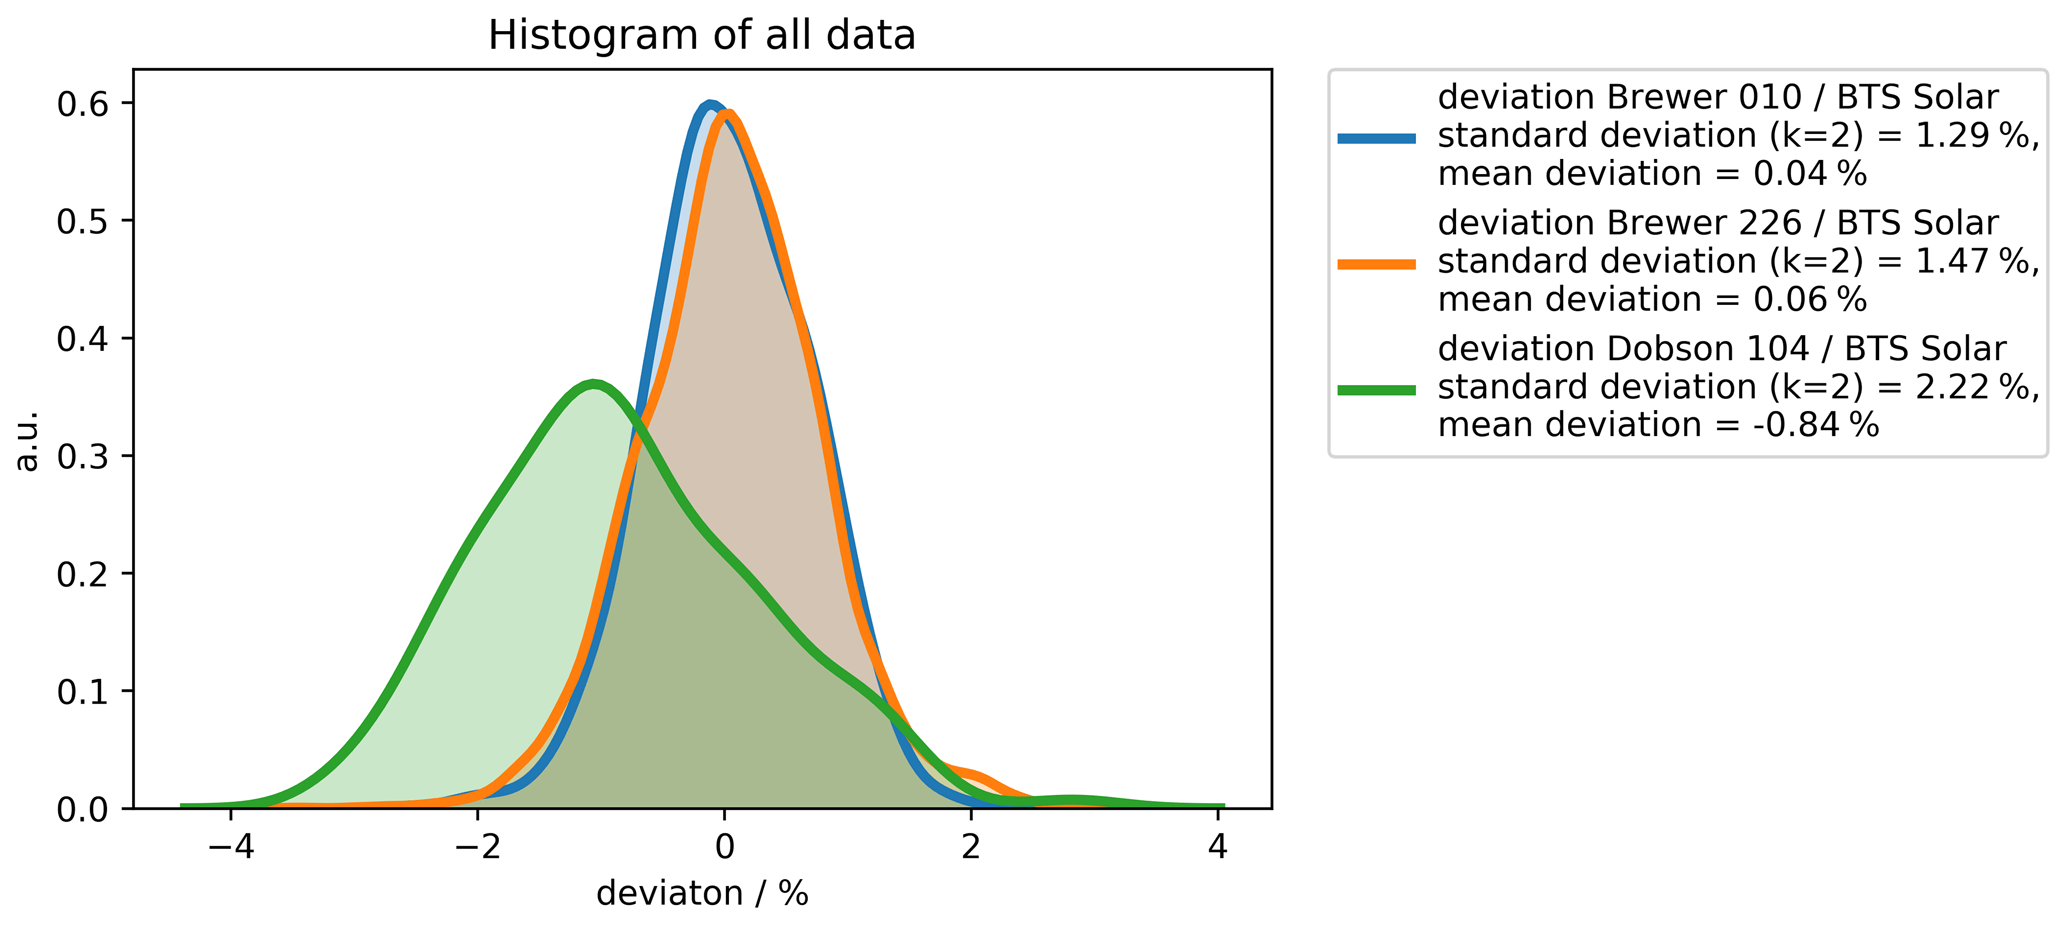
Figure 4The figure shows the histogram of deviations of BTS-Solar from Brewer no. 010, Brewer no. 226 and Dobson no. 104 compared to BTS-Solar data from Hohenpeißenberg. The data show a comparable performance between Brewer no. 010 (deviation of 1.29 % to BTS-Solar), Brewer no. 226 (deviation of 1.47 % to BTS-Solar) and BTS-Solar and a larger mean and standard deviation of Dobson no. 104 (deviation of 2.22 % to BTS-Solar).
Since different devices are compared to the BTS-Solar and all of them exhibit their own measurement uncertainty (e.g. 3.7 DU for the BTS; see Vaskuri et al., 2018), we compared all data in Fig. 4 relative to the BTS-Solar.
Figure 4 shows that the histogram of all data is comparable between Brewer no. 010 with a mean deviation of 0.04 % deviation between the devices (e.g. (Brewer no. 010 − BTS-Solar) BTS-Solar × 100) and an expanded standard deviation (k=2) of 1.29 % and Brewer no. 226 with a mean deviation of 0.06 % and an expanded standard deviation (k=2) of 1.47 %. Dobson no. 104 shows a mean deviation of −0.84 % and an expanded standard deviation (k=2) of 2.22 %.
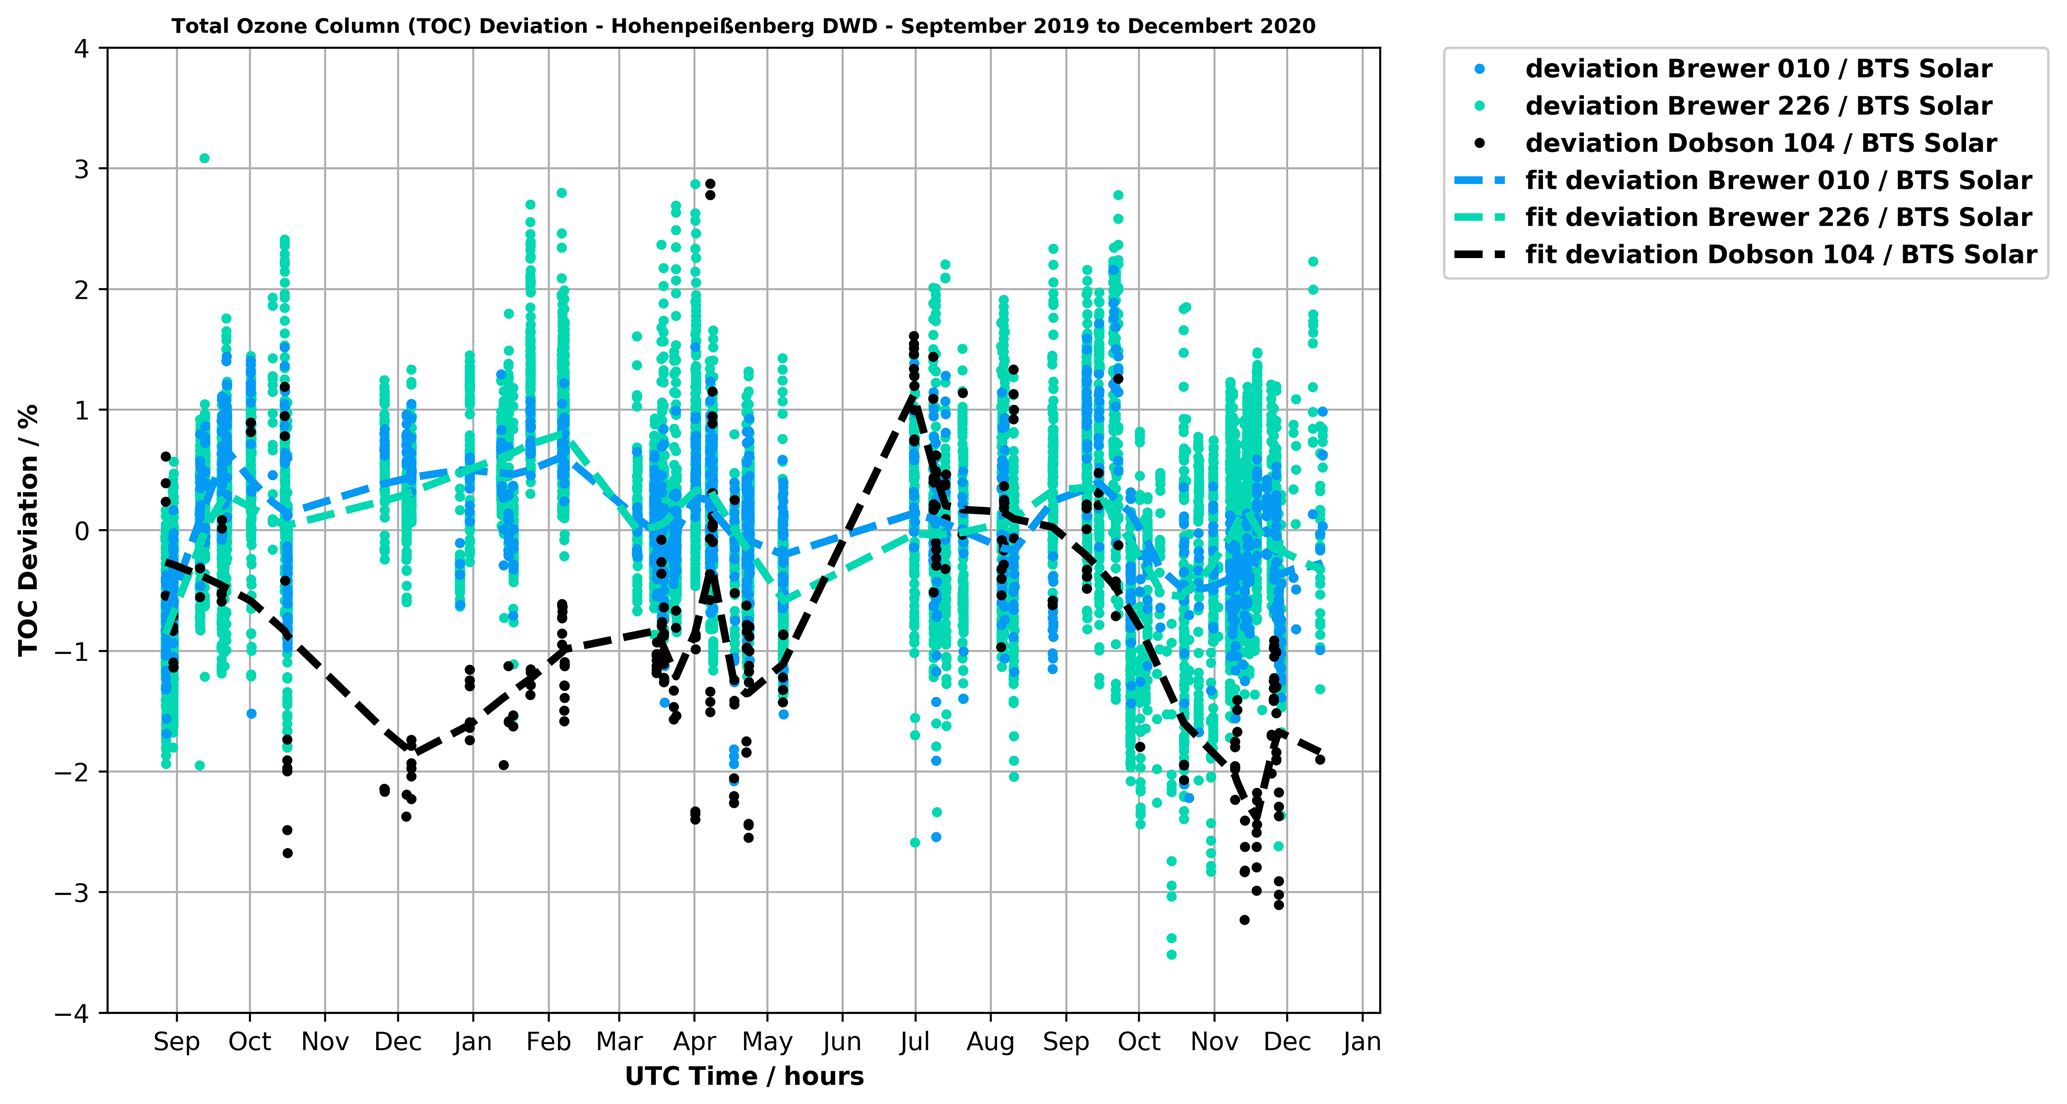
Figure 5TOC differences between BTS-Solar and Brewers/Dobson over the whole campaign at Hohenpeißenberg. This graph shows not only the seasonal dependency of Dobson no. 104 but also the comparable temporal course of the Brewers and BTS-Solar, which is expressed by the least-squares fit deviation of less than ±1 % over the whole campaign.
Figure 5 illustrates the seasonal course of all TOC data for the complete measurement campaign. This explains the larger deviation of Dobson no. 104 due to the seasonal dependency (Gröbner et al., 2021; Kerr et al., 1988; Scarnato et al., 2010; Staehelin et al., 2003; Vanicek, 2006). Figure 5 also shows the comparable results of the Brewers and BTS-Solar, since the least-squares fit of the full data is within ±1 % TOC deviation over the whole measurement campaign.
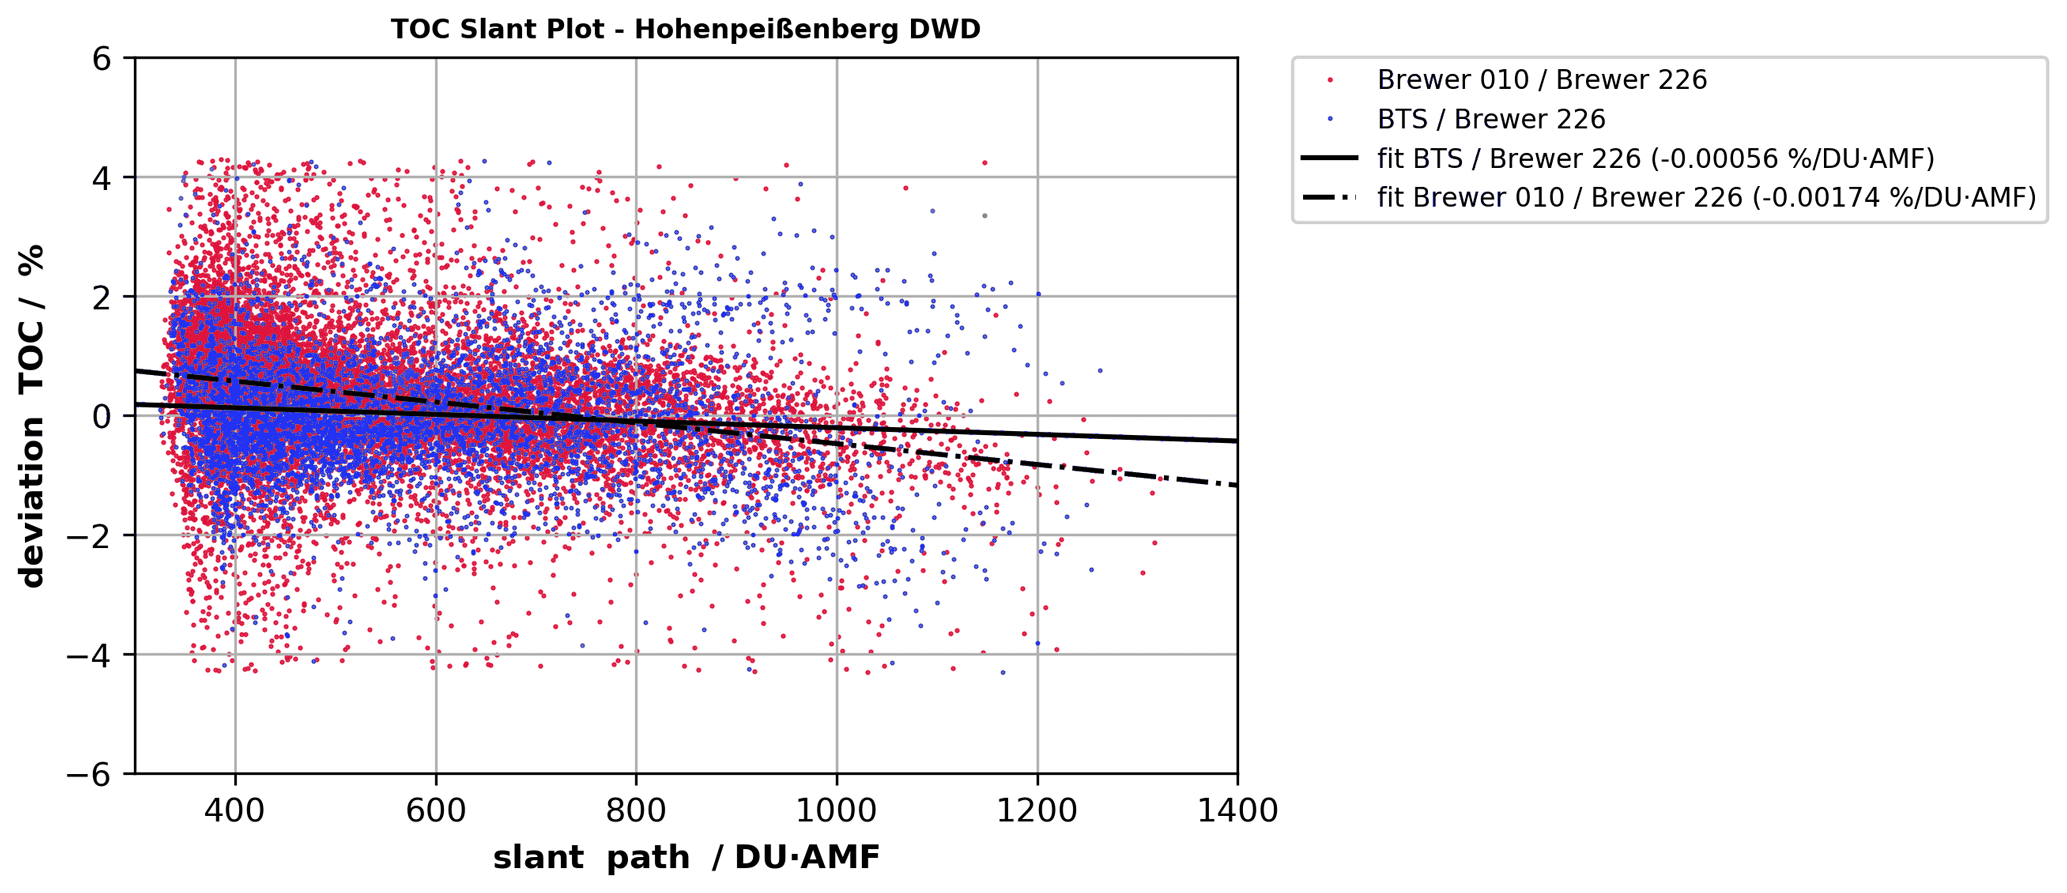
Figure 6TOC differences as a function of slant path column between BTS-Solar and Brewers at Hohenpeißenberg. The TOC slant plot for BTS-Solar of all data shows a smaller air mass factor (AMF) dependency than the single-monochromator Brewer no. 010 for the BTS-Solar. Linear fits are used.
Figure 6 shows the TOC slant path deviation (slant path = TOC × AMF) of Brewer no. 010 (single monochromator) and BTS-Solar compared to Brewer no. 226 (double monochromator). This figure is a measure of the TOC evaluation with respect to air mass factor. AMF is dependent on the SZA due to the longer attenuation path through the atmosphere at high SZAs, and the deviations should ideally be independent of this factor. As illustrated, the BTS-Solar is less dependent on the slant path than Brewer no. 010 (slope −0.00174 % DU × AMF), but a small dependency (slope −0.00056 % DU × AMF) is recognizable compared to Brewer no. 226.
3.2 Koherent
Figure 7 presents exemplary daily courses of TOC from Koherent and Brewer no. 163 during the winter day of 2 February 2020 and the summer day of 27 July 2020, respectively.
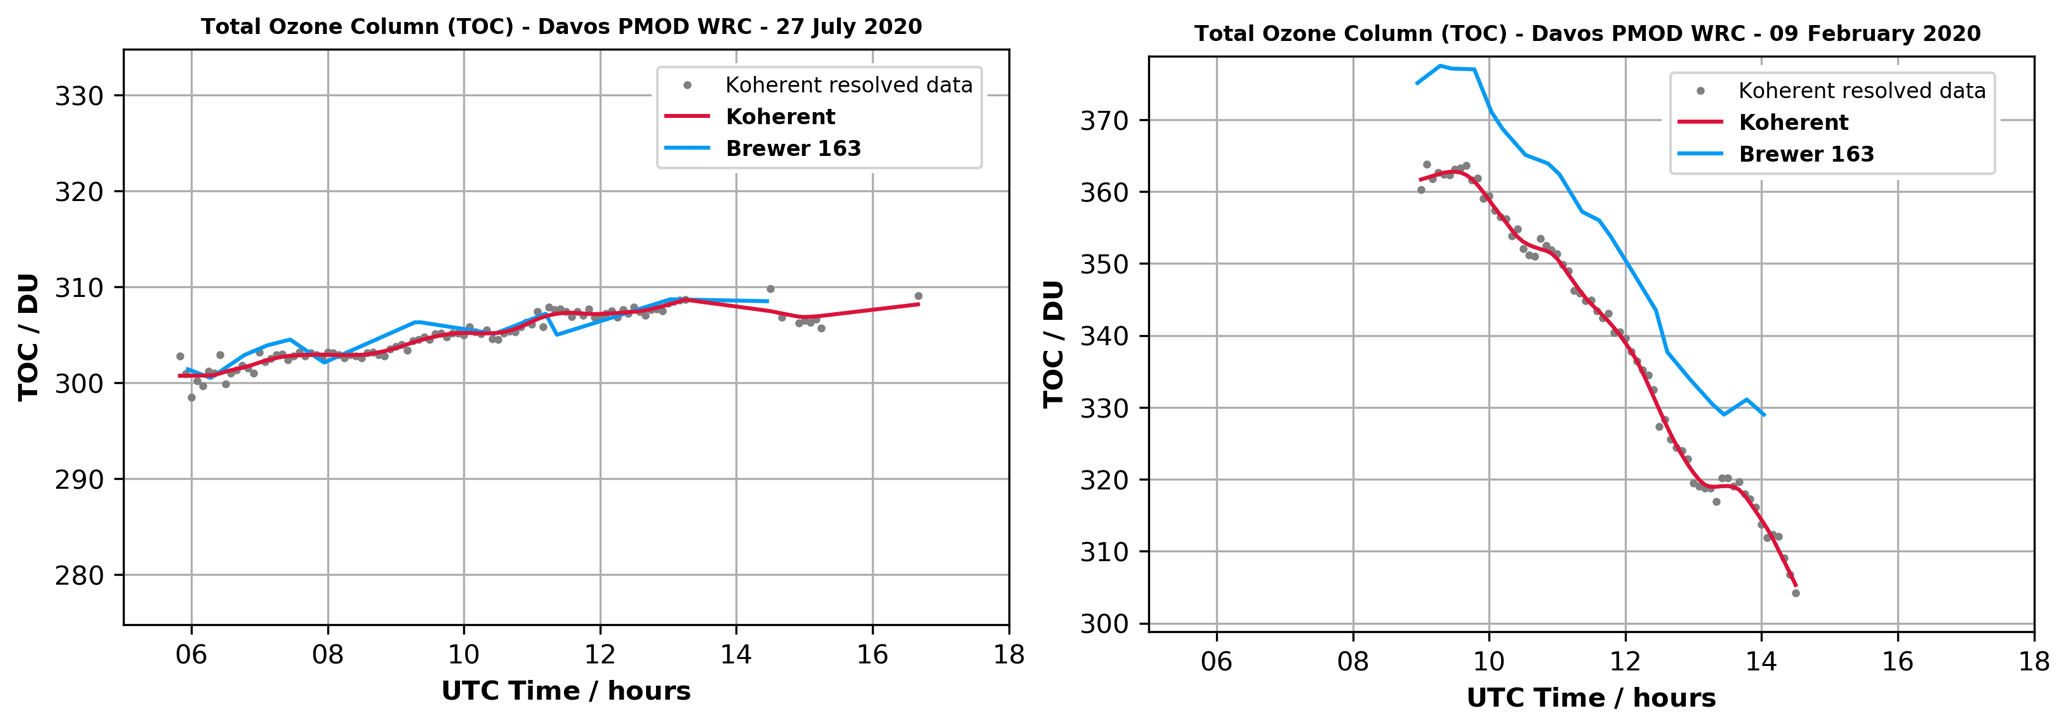
Figure 7Two exemplarily days of Koherent vs. Brewer no. 163 in winter and summer season. These days illustrate the high temporal resolution of Koherent and show the seasonal dependency of the deviation.
One can see that the daily variation is well reproduced by Koherent with a high temporal resolution and its temporal development is in line with the values of Brewer no. 163. However, there is an absolute bias of TOC of around −10 DU compared to Brewer no. 163 depending on the season. In winter, Koherent shows a larger offset than in summer, where the values are almost congruent.

Figure 8Temporal course of the relative differences of Koherent and Brewer no. 163 during the entire period of comparison. The dashed line shows a least-squares fit of the data.
Figure 8 shows the temporal course of the relative difference of TOC values between Koherent and Brewer no. 163 during the entire comparison period between 1 October 2019 and 30 December 2020 ((Koherent − Brewer163) Brewer163). The least-squares fit in the figure reveals clearly the seasonal dependency of up to 4 % of the differences through the seasons. The differences are about −3 % in the summer season and about +1 % in the winter season with respect to the fit in Fig. 8.
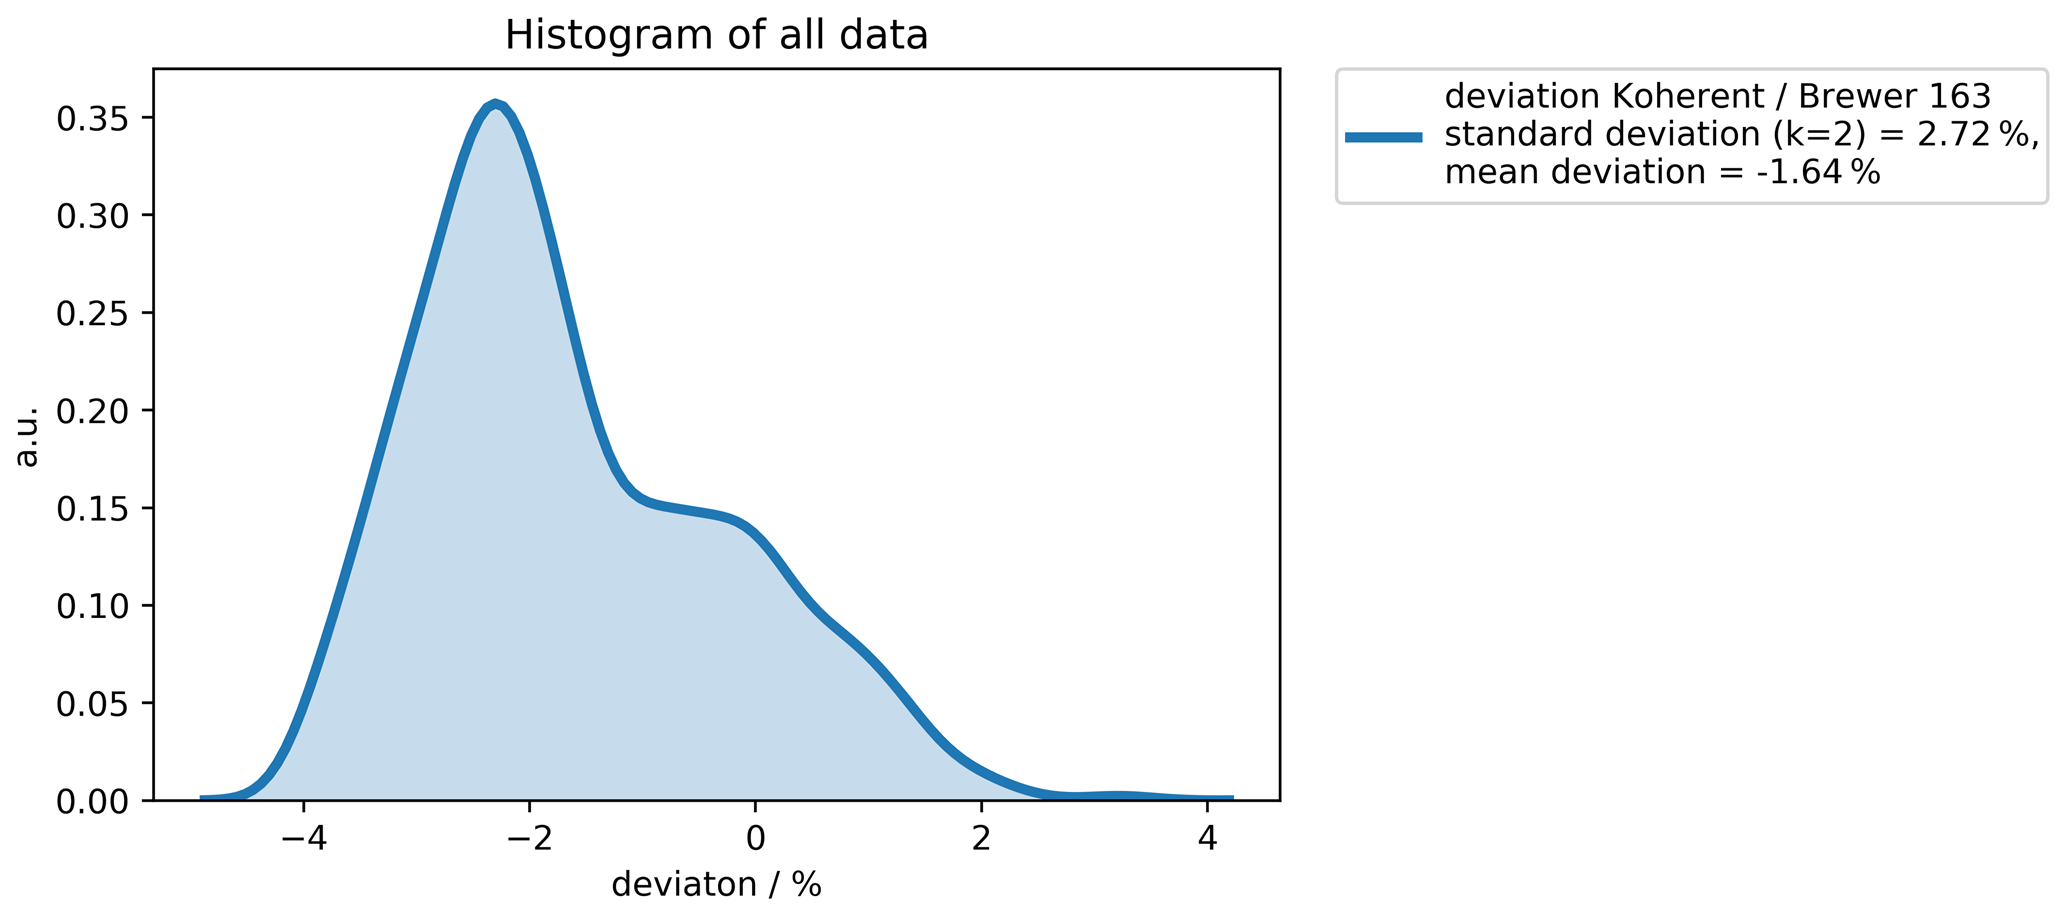
Figure 9Histogram of the relative differences of Koherent and Brewer no. 163. The mean difference between both instruments is −1.64 %, revealing a clear bias of TOC. The standard deviation (k=2) of 2.72 % reflects the seasonal variation of the deviation.
Figure 9 presents the histogram of all synchronous data of the difference between Koherent and Brewer no. 163. The histogram of the percent differences of TOC reveals a systematic overestimation by Koherent of an average of 1.64 % during the entire period, with an expanded standard deviation of about 2.7 % (k=2). This variation mainly reflects the seasonal variability and less the measurement error of the system, which is assumed to be comparable to the BTS-Solar system (see Sect. 3.1).
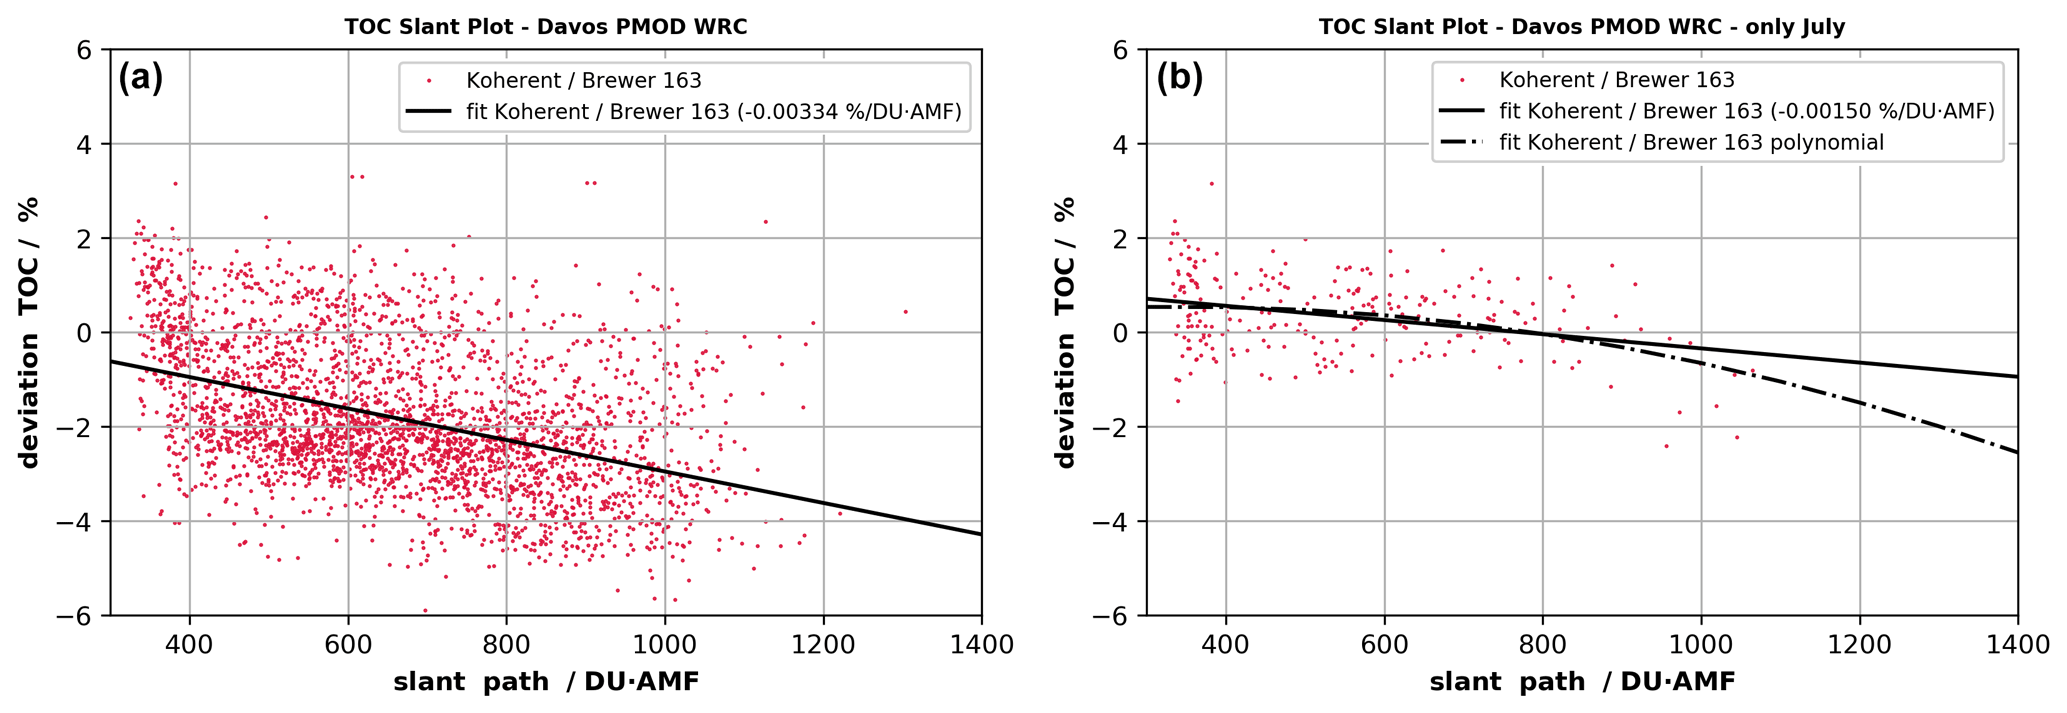
Figure 10Slant path dependency of Koherent vs. Brewer no. 163 (a) for the entire period of comparison and (b) for the month of July 2020 only including a quadratic polynomial fit additional to the linear fits.
In order to compare the slant path dependency of the instrument, Fig. 10 demonstrates the deviation of the differences as a function of the ozone slant path, defined as the multiplication of the AMF and TOC. Figure 10a shows a strong ozone slant path dependency with a slope of −0.0033 % TOC × AMF that is observed with Koherent. For further comparison, the slant path dependency is determined for the summer month of July 2020 only (Fig. 10b), with air masses between 1.1 and 3.4 and stratospheric temperatures ranging from 230.2 to 231.1 K. The slope of the linear fit of −0.0015 % TOC × AMF indicates that the slant path dependency is significantly lower than for the entire period. Figure 10b also includes a polynomial fit of degree = 2 (quadratic), highlighting that for slant paths below 800 DU the dependency shows almost no trend. For higher slant paths, however, the differences increase.
In this longer-term intercomparison of more than 1 year the array-spectroradiometer-based BTS systems demonstrated their instrument performance published in Zuber et al. (2018b) and Egli and Gröbner (2018) for TOC determination as well as during harsh environmental conditions like in Davos or Hohenpeißenberg. Both BTS setups, the fibre-coupled entrance optic version by PMOD/WRC called Koherent and a diffusor-optic-based version by Gigahertz Optik GmbH called BTS-Solar, ran for the whole campaign without any significant technical issues.
The BTS-Solar was demonstrated to be robust and accurate in terms of stability since no change in responsivity was observed during the whole measurement campaign period (differences below the uncertainty of the calibration). The TOC retrieval algorithm used, which is based on a lookup table, was also demonstrated to be robust and accurate in terms of TOC determination over all seasons. Apart from the current air pressure (corrections of < 0.8 DU over the full measurement campaign) no further parameters such as ozone temperature or other measured parameters are required as inputs of the algorithm for the evaluation at Hohenpeißenberg. Only standard parameters of the measurement location such as height and position are needed. Based on these parameters, two (summer and winter) LUTs are calculated for a specific station with the libRadtran software package, and later on just an air pressure correction is applied. This seems remarkable, since this simple modelling alone achieved accurate TOC results over the whole season at this site.
The retrieval algorithm of BTS-Solar is principally a partial spectral fit of two wavelengths bands, which substantially differs from the four-wavelength retrieval from Brewers and double wavelength pairs from Dobsons or the least-squares fit retrieval of Koherent. The partial spectral fit technique with the usage of a LUT has already demonstrated its performance in very different places such as Izaña Atmospheric Observatory in Tenerife (Zuber et al., 2018b), Huelva (not scientifically published yet) and now Hohenpeißenberg. The algorithm allows worldwide usage (due to different available atmosphere models of libRadtran) but may need finer parameterization at other locations worldwide or for special atmospheric profile situations which may not be tested yet. For the slant path dependency, a slope of −0.00056 % DU × AMF was achieved, which is significantly lower than that of the single-monochromator Brewer (−0.00174 % TOC × AMF) (double-monochromator Brewer used as a reference).
Contrary to BTS-Solar, the TOC retrieval from Koherent uses the full-spectrum retrieval in the spectral range of 305–350 nm. The minimal least-squares algorithm as in Huber et al. (1995) and Vaskuri et al. (2018) also includes the fitting of the aerosol optical depth for each retrieved TOC data point. This procedure of including the aerosol optical depth as a free-fitting parameter of the algorithm allows for operational use at other locations worldwide with different atmospheric conditions.
Currently, the stratospheric temperature is not retrieved by the algorithm, and a climatologically averaged value of −45 ∘C is chosen instead. The strong seasonal trend correlates with the variation of the stratospheric temperature at Davos. Effective stratospheric ozone temperatures from ozone launches in Payerne (Switzerland) or from the ECMWF reanalysis as presented in Gröbner et al. (2021) show a difference of about 10 K between summer season and winter season, correlating with the differences in TOC. This indicates that the algorithm for Koherent may be highly sensitive to stratospheric temperature. In a future version of the algorithm we will investigate if stratospheric temperature can be retrieved from the measurements or be included in the retrieval.
The strong ozone slant path dependency of Koherent in Fig. 10 also reflects this seasonal trend of the deviations, since larger SZAs and corresponding higher air masses are more pronounced in the winter season than in the summer season. Figure 10b shows the ozone slant path dependency restricted to 1 month with an almost constant stratospheric ozone temperature of around 230 K. The graph reveals that the slant path dependency is significantly lower (−0.0015 % TOC × AMF) than that for the entire period over all seasons (−0.0033 % TOC × AMF). This supports the conclusion that the strong slant path dependency is caused by biases due to stratospheric temperature differences.
However, slant path dependency could also be caused by stray light, which biases the ozone at large air masses. As mentioned in the Introduction and stated in Zuber et al. (2018a), the BTS array spectroradiometer suffers from stray light at short wavelengths (below 310 nm) at high SZAs. A potential effect of this remaining stray light can explain the increase of the differences at high slant paths above 900 DU as shown in Fig. 10b. The slope of the slant path dependency of −0.0015 % TOC × AMF is comparable to the slant path dependency between a single- and a double-monochromator Brewer with a slope of −0.0017 % TOC × AMF (Fig. 6). However, a proper assessment of the effect of stray light from Koherent can only be addressed when the effect of stratospheric temperature is corrected. Based on this dataset, where the stratospheric temperature is not included, the biases from stratospheric ozone temperature seem to be much stronger than a potential effect of stray light.
For BTS-Solar, potential stray-light impact on TOC is less pronounced. In Fig. 2, a slight deviation of 5 DU can be observed in the early morning at high SZAs. The statistical analysis of the slant path dependency reveals a linear slope of −0.00056 % TOC × AMF, which is less than for single-monochromator Brewers. Practically the measurement range of TOC is comparable since the TOC values of double-monochromator Brewers at high SZAs/AMF are usually not used due to too low SNR (e.g. DWD applies an AMF filter > 3.5 for single-monochromator Brewer or AMF > 4 for double-monochromator Brewer to TOC values). These values were determined on the basis of long-term experience. We assume that the impact of stray light is less pronounced than for Koherent, because the first wavelength band of the BTS-Solar is an average between 307 and 311 nm, where less stray light can be expected than using the full spectrum until 305 nm for the least-squares fit algorithm. Most likely the least-squares fit algorithm of Koherent is more sensitive to biases at short wavelengths.
The calibration of Koherent proved to be stable over the whole measurement campaign; however an offset was detectable. We assume that the large variation of 2.2 % (k=1) from the instrument responsivities is based on the calibration difficulty of a lens-based telescope for an irradiance calibration. The alignment of the telescope-based system seems to be very sensitive to distances between the lamp and the collimating lenses and the angular orientation of the telescope.
In the future, a recalibration of Koherent is planned with an improved calibration setup and comparison with additional reference instruments.
In this respect the irradiance calibration of the BTS-Solar seems to be easier to apply, since only a global diffusor system has to be calibrated using standard irradiance calibration with an easily accessible reference plane instead of a lens-based telescope. The fibre-coupled telescope system has a significantly lower light throughput and is therefore more sensitive to noise at short wavelengths.
In general, the BTS-Solar is comparable to Brewer no. 010 with a mean deviation of 0.04 % and an expanded standard deviation (k=2) of 1.29 % and Brewer no. 226 with a mean deviation of 0.06 % and an expanded standard deviation (k=2) of 1.47 %. Dobson no. 104 showed a mean deviation of −0.84 % and an expanded standard deviation (k=2) of 2.22 % compared to BTS-Solar.
Koherent achieved a deviation of 1.64 % compared to Brewer no. 163 with an expanded standard deviation (k=2) of 2.72 % by showing a significant seasonal peak of up to 4 %.
In the discussion of replacing standard ozone observing instruments, the comparison of Brewers and Dobsons has a long tradition. It was observed that, when using the Paur and Bass (1985) cross section, the Brewers and Dobsons show a seasonal difference depending on the stratospheric temperature. Redondas et al. (2014) showed that this difference is significantly smaller when using the IUP cross section (Serdyuchenko et al., 2014). Recently, Gröbner et al. (2021) compared Brewers and Dobsons using other different cross sections and including stratospheric temperature. The study, especially the data of Koherent, highlights again the importance of applying a specific cross section and its stratospheric temperature dependency in order to homogenize TOC data from different co-located instruments. From this point of view the new systems in general should be further compared at different locations with different atmospheric conditions, and the optimal cross section for the best homogenization of the data should be systematically investigated.
In summary, the BTS-Solar performance regarding TOC determination with data of more than 1 year is comparable to the performance of the Brewers used in this study. The slant path dependencies (slope of the curve) of the BTS-Solar may hint at some remaining stray light at high SZAs (above 65∘), which is less than a single-monochromator Brewer but larger than of a double-monochromator Brewer.
The LUT retrieval algorithm used at Hohenpeißenberg was insensitive to stratospheric temperature and provided accurate results through simple modelling. However, validation in the presence of significant SO2 or aerosol levels could not be tested. The performance at specific other stations regarding the atmospheric composition should be further investigated.
Koherent showed a comparable performance to a double-monochromator Brewer regarding TOC determination in summertime (around 1 % bias), albeit with a significant seasonal drift in the wintertime of down to −3 %. The least-squares fit algorithm of Koherent is expected to be insensitive to atmospheric changes, due to the included fitting of aerosol optical depth. Currently, the algorithm of Koherent is sensitive to stratospheric temperature, which explains the seasonal variability relative to Brewer no. 163. In a future version of the retrieval algorithm, the stratospheric temperature will be either retrieved by the algorithm or added as an additional parameter to the retrieval routine in order to reduce the observed seasonal variation.
The datasets used in this study can be downloaded from https://doi.org/10.6084/m9.figshare.14686656.v1 (Zuber, 2021).
RZ, UK and LE wrote the manuscript. RZ and MR were responsible for the BTS-Solar, and UK and WS for the Brewer and Dobsons at Hohenpeißenberg. LE and JG were responsible for Koherent and the Brewer in Davos.
The authors declare that they have no conflict of interest.
Publisher's note: Copernicus Publications remains neutral with regard to jurisdictional claims in published maps and institutional affiliations.
We further acknowledge the reviewers Natalya Kramarova and Vladimir Savastiouk and the anonymous reviewer, who substantially helped to improve this publication. We also thank Mike Clark for linguistic corrections of the paper.
This research has been supported by the ESA (project QA4EO, grant no. QA4EO/SER/SUB/09) and by MeteoSwiss (project INFO3RS, grant no. 123001926).
This paper was edited by Natalya Kramarova and reviewed by Vladimir Savastiouk and two anonymous referees.
Anderson, G., Clough, S., Kneizys, F., Chetwynd, J., and Shettle, E.: AFGL Atmospheric Constituent Profiles (0.120 km), 46, Environmental research papers No. 954, Air Force Geophysics Lab, Hanscom AFB Massachusetts, USA, 1986.
Bais, A. F., McKenzie, R. L., Bernhard, G., Aucamp, P. J., Ilyas, M., Madronich, S., and Tourpali, K.: Ozone depletion and climate change: impacts on UV radiation, Photoch. Photobio. Sci., 14, 19–52, https://doi.org/10.1039/C4PP90032D, 2015.
Bais, A. F., Lucas, R. M., Bornman, J. F., Williamson, C. E., Sulzberger, B., Austin, A. T., Wilson, S. R., Andrady, A. L., Bernhard, G., McKenzie, R. L., Aucamp, P. J., Madronich, S., Neale, R. E., Yazar, S., Young, A. R., de Gruijl, F. R., Norval, M., Takizawa, Y., Barnes, P. W., Robson, T. M., Robinson, S. A., Ballare, C. L., Flint, S. D., Neale, P. J., Hylander, S., Rose, K. C., Wangberg, S. A., Hader, D. P., Worrest, R. C., Zepp, R. G., Paul, N. D., Cory, R. M., Solomon, K. R., Longstreth, J., Pandey, K. K., Redhwi, H. H., Torikai, A., and Heikkila, A. M.: Environmental effects of ozone depletion, UV radiation and interactions with climate change: UNEP Environmental Effects Assessment Panel, update 2017, Photoch. Photobio. Sci., 17, 127–179, https://doi.org/10.1039/c7pp90043k, 2018.
Bais, A. F., Bernhard, G., McKenzie, R. L., Aucamp, P. J., Young, P. J., Ilyas, M., Jöckel, P., and Deushi, M.: Ozone–climate interactions and effects on solar ultraviolet radiation, Photoch. Photobio. Sci., 18, 602–640, https://doi.org/10.1039/C8PP90059K, 2019.
Dobson, G. M. B.: A photoelectric spectrophotometer for measuring the amount of atmospheric ozone, P. Phys. Soc., 43, 324–339, https://doi.org/10.1088/0959-5309/43/3/308, 1931.
Dobson, G. M. B.: Observers' handbook for the ozone spectrophotometer, Ann. Int. Geophys. Year, 5, Part 1, 46–89, 1957a.
Dobson, G. M. B.: Adjustment and calibration of the ozone spectrophotometer, Ann. Int. Geophys. Year, 5, Part 1, 90–114, 1957b.
Dobson, G. M. B.: Forty years research on atmospheric ozone at Oxford – a history, Appl. Optics, 7, 387–405, 1968.
Egli, L.: Post processing of data from array spectroradiometer, UVnet workshop, 15–16 July 2014, Davos, Switzerland, 2014.
Egli, L. and Gröbner, J.: A Novel Array-Spectroradiometer System for Total Column Ozone Retrieval, Annual Report PMOD/WRC, Davos, Switzerland, 2018.
Egli, L., Gröbner, J., Hülsen, G., Bachmann, L., Blumthaler, M., Dubard, J., Khazova, M., Kift, R., Hoogendijk, K., Serrano, A., Smedley, A., and Vilaplana, J.-M.: Quality assessment of solar UV irradiance measured with array spectroradiometers, Atmos. Meas. Tech., 9, 1553–1567, https://doi.org/10.5194/amt-9-1553-2016, 2016.
Emde, C., Buras-Schnell, R., Kylling, A., Mayer, B., Gasteiger, J., Hamann, U., Kylling, J., Richter, B., Pause, C., Dowling, T., and Bugliaro, L.: The libRadtran software package for radiative transfer calculations (version 2.0.1), Geosci. Model Dev., 9, 1647–1672, https://doi.org/10.5194/gmd-9-1647-2016, 2016.
Evans, R. D.: Operations Handbook – Ozone Observations with a Dobson Spectrophotometer – revised version, WMO, Geneva, Switzerland, WMO/GAW Report No. 183, 2008.
Gkertsi, F., Bais, F. A., Kouremeti, N., Drosoglou, T., Fountoulakis, I., and Fragkos, K.: DOAS-based total column ozone retrieval from Phaethon system, Atmos. Environ., 180, 51–58, https://doi.org/10.1016/j.atmosenv.2018.02.036, 2018.
Gorshelev, V., Serdyuchenko, A., Weber, M., Chehade, W., and Burrows, J. P.: High spectral resolution ozone absorption cross-sections – Part 1: Measurements, data analysis and comparison with previous measurements around 293 K, Atmos. Meas. Tech., 7, 609–624, https://doi.org/10.5194/amt-7-609-2014, 2014.
Gröbner, J., Kröger, I., Egli, L., Hülsen, G., Riechelmann, S., and Sperfeld, P.: The high-resolution extraterrestrial solar spectrum (QASUMEFTS) determined from ground-based solar irradiance measurements, Atmos. Meas. Tech., 10, 3375–3383, https://doi.org/10.5194/amt-10-3375-2017, 2017.
Gröbner, J., Schill, H., Egli, L., and Stübi, R.: Consistency of total column ozone measurements between the Brewer and Dobson spectroradiometers of the LKO Arosa and PMOD/WRC Davos, Atmos. Meas. Tech., 14, 3319–3331, https://doi.org/10.5194/amt-14-3319-2021, 2021.
Herman, J., Evans, R., Cede, A., Abuhassan, N., Petropavlovskikh, I., and McConville, G.: Comparison of ozone retrievals from the Pandora spectrometer system and Dobson spectrophotometer in Boulder, Colorado, Atmos. Meas. Tech., 8, 3407–3418, https://doi.org/10.5194/amt-8-3407-2015, 2015.
Herman, J., Evans, R., Cede, A., Abuhassan, N., Petropavlovskikh, I., McConville, G., Miyagawa, K., and Noirot, B.: Ozone comparison between Pandora #34, Dobson #061, OMI, and OMPS in Boulder, Colorado, for the period December 2013–December 2016, Atmos. Meas. Tech., 10, 3539–3545, https://doi.org/10.5194/amt-10-3539-2017, 2017.
Huber, M., Blumthaler, M., Ambach, W., and Staehelin, J.: Total atmospheric ozone determined from spectral measurements of direct solar UV irradiance, Geophys. Res. Lett., 22, 53–56, https://doi.org/10.1029/94gl02836, 1995.
Kerr, J.: New methodology for deriving total ozone and other atmospheric variables from Brewer spectrophotometer direct sun spectra, J. Geophys. Res.-Atmos., 107, ACH 22-1–ACH 22-17, https://doi.org/10.1029/2001JD001227, 2002.
Kerr, J. B., McElroy, C. T., and Olafson, R. A.: Measurements of total ozone with the Brewer spectrophotometer, Proc. Quad. Ozone Symp., 4–9 August 1980, Boulder, CO, USA, edited by: London, J., Natl. Cent. for Atmos. Res., 74–79, 1981.
Kerr, J. B., McElroy, C. T., Wardle, D. I., Olafson, R. A., and Evans, W. F.: The automated Brewer Spectrophotometer, Proceed. Quadr. Ozone Symp., 3–7 September 1984, Halkidiki, Greece, edited by: Zerefos, C. S. and Ghazi, A., D. Reidel, Norwell, Mass., USA, 396–401, 1985.
Kerr, J. B., Asbridge, I. A., and Evans, W. F. J.: Intercomparison of total ozone measured by the Brewer and Dobson Spectrophotometers at Toronto, J. Geophys. Res., 93, 11129–11140, 1988.
Köhler, U.: Europäisches Dobson Kalibrierzentrum Hohenpeißenberg garantiert hohe Datenqualität, Ozonbulletin des Deutschen Wetterdienstes Nr. 87, Meteorologisches Observatorium, Hohenpeißenberg, Germany, 2002.
Köhler, U. and Attmannspacher, W.: Long time intercomparison between Brewer and Dobson spectrophotometer at the Hohenpeissenberg, Phys. Atmosph., 59, 85–96, 1986.
Köhler, U. and Claude, H.: Prof. G.M.B. Dobson – 80 Jahre Erfolgsgeschichte seines Ozon-Spektrophotometer, Ozonbulletin des Deutschen Wetterdienstes Nr. 109, Meteorologisches Observatorium, Hohenpeißenberg, Germany, 2006.
Köhler, U., Claude, H., Hartmannsgruber, R., and Wege, K.: Vergleich und Bewertung von zwei Spektrophotometern zur Messung des Gesamtozons, Meteorolog. Rundschreiben, 42, 1–9, 1989.
Köhler, U., Nevas, S., McConville, G., Evans, R., Smid, M., Stanek, M., Redondas, A., and Schönenborn, F.: Optical characterisation of three reference Dobsons in the ATMOZ Project – verification of G. M. B. Dobson's original specifications, Atmos. Meas. Tech., 11, 1989–1999, https://doi.org/10.5194/amt-11-1989-2018, 2018.
Komhyr, W. D.: Operations handbook-ozone observations with a Dobson spectrophotometer, WMO Ozone Res. and Monit. Project, WMO, Geneva, Switzerland, Report no. 6, 125 pp., 1980.
McKenzie, R., Bernhard, G., Liley, B., Disterhoft, P., Rhodes, S., Bais, A., Morgenstern, O., Newman, P., Oman, L., Brogniez, C., and Simic, S.: Success of Montreal Protocol Demonstrated by Comparing High-Quality UV Measurements with “World Avoided” Calculations from Two Chemistry-Climate Models, Sci. Rep., 9, 12332, https://doi.org/10.1038/s41598-019-48625-z, 2019.
Montzka, S. A., Dutton, G. S., Yu, P., Ray, E., Portmann, R. W., Daniel, J. S., Kuijpers, L., Hall, B. D., Mondeel, D., Siso, C., Nance, J. D., Rigby, M., Manning, A. J., Hu, L., Moore, F., Miller, B. R., and Elkins, J. W.: An unexpected and persistent increase in global emissions of ozone-depleting CFC-11, Nature, 557, 413–417, https://doi.org/10.1038/s41586-018-0106-2, 2018.
Nicolet, M.: On the molecular scattering in the terrestrial atmosphere: An empirical formula for its calculation in the homosphere, Planet. Space Sci., 32, 1467–1468, https://doi.org/10.1016/0032-0633(84)90089-8, 1984.
NOAA: National Oceanic and Atmospheric Administration (NOAA), US Standard Atmosphere, Dept. of Commerce, National Oceanic and Atmospheric Administration, Washington, USA, NOAA-S/T 76-1562, 1976.
Paur, R. J. and Bass, A. M.: The Ultraviolet Cross-Sections of Ozone: II. Results and Temperature Dependence, Atmospheric Ozone, Dordrecht, the Netherlands, 611–616, 1985.
Redondas, A., Evans, R., Stuebi, R., Köhler, U., and Weber, M.: Evaluation of the use of five laboratory-determined ozone absorption cross sections in Brewer and Dobson retrieval algorithms, Atmos. Chem. Phys., 14, 1635–1648, https://doi.org/10.5194/acp-14-1635-2014, 2014.
Redondas, A., León-Luís, S. F., López-Solano, J., Berjón, A., and Carreño, V.: Thirteenth Intercomparison Campaign of the Regional Brewer Calibration Center Europe, Joint publication of State Meteorological Agency (AEMET), Madrid, Spain and World Meteorological Organization (WMO), Geneva, Switzerland, WMO/GAWReport No. 246, https://doi.org/10.31978/666-20-018-3, 2019.
Savastiouk, V.: Improvements to the direct-sun ozone observations taken with the Brewer Spectrophotometer, A thesis submitted to the Faculty of Graduate Studies, York University, Toronto, Ontario, Canada, 2006.
Scarnato, B., Staehelin, J., Stübi, R., and Schill, H.: Long Term Total Ozone Observations at Arosa (Switzerland) with Dobson and Brewer Instruments (1988–2007), J. Geophys. Res., 115, D13306, https://doi.org/10.1029/2009JD011908, 2010.
Seckmeyer, G., Bais, A., Bernhard, G., Blumthaler, M., Booth, C., Disterhoft, P., Eriksen, P., McKenzie, R., Miyauchi, M., and Roy, C.: Instruments to measure solar ultraviolet irradiance. Part 1: Spectral instruments, World Meteorological Organization (WMO), Geneva, Switzerland, 30 pp., 2001.
Seckmeyer, G., Bais, A., Bernhard, G., Blumthaler, M., Drueke, S., Kiedron, P., Lantz, K., McKenzie, R., and Riechelmann, S.: Instruments to measure solar ultraviolet radiation Part 4: Array spectroradiometers, World Meteorological Organization (WMO), Geneva, Switzerland, WMO TD No. 1538, 43 pp., 2010.
Seckmeyer, G., Wendisch, M., and Macke, A.: Biologische und medizinische Wirkungen solarer Bestrahlung – Biological and medical effects of solar radiation, promet Meteorologische Fortbildung DWD, Deutscher Wetterdienst (DWD), Offenbach, Germany, 2018.
Serdyuchenko, A., Gorshelev, V., Weber, M., Chehade, W., and Burrows, J. P.: High spectral resolution ozone absorption cross-sections – Part 2: Temperature dependence, Atmos. Meas. Tech., 7, 625–636, https://doi.org/10.5194/amt-7-625-2014, 2014.
Staehelin, J., Kerr, J., Evans, R., and Vanicek, K.: Comparison of total ozone measurements of Dobson and Brewer spectrophotometers and recommended transfer functions, GAW (Global Atmosphere Watch), Rep. 149, WMO, Geneva, Switzerland, 2003.
Stübi, R., Schill, H., Klausen, J., Vuilleumier, L., Gröbner, J., Egli, L., and Ruffieux, D.: On the compatibility of Brewer total column ozone measurements in two adjacent valleys (Arosa and Davos) in the Swiss Alps, Atmos. Meas. Tech., 10, 4479–4490, https://doi.org/10.5194/amt-10-4479-2017, 2017.
Vanicek, K.: Differences between ground Dobson, Brewer and satellite TOMS-8, GOME-WFDOAS total ozone observations at Hradec Kralove, Czech, Atmos. Chem. Phys., 6, 5163–5171, https://doi.org/10.5194/acp-6-5163-2006, 2006.
Vaskuri, A., Kärhä, P., Egli, L., Gröbner, J., and Ikonen, E.: Uncertainty analysis of total ozone derived from direct solar irradiance spectra in the presence of unknown spectral deviations, Atmos. Meas. Tech., 11, 3595–3610, https://doi.org/10.5194/amt-11-3595-2018, 2018.
Vogler, C., Brönnimann, S., Staehelin, J., and Griffin, R. E. M.: Dobson total ozone series of Oxford: Reevaluation and application, J. Geophys Res., 112, D20116, https://doi.org/10.1029/2007JD008894 2007.
Zuber, R.: Intercomparison Davos Hohenpeißenberg, figshare [data set], https://doi.org/10.6084/m9.figshare.14686656.v1, 2021.
Zuber, R., Ribnitzky, M., Tobar, M., Lange, K., Kutscher, D., Schrempf, M., Niedzwiedz, A., and Seckmeyer, G.: Global spectral irradiance array spectroradiometer validation according to WMO, Meas. Sci. Technol., 29, 105801, https://doi.org/10.1088/1361-6501/aada34, 2018a.
Zuber, R., Sperfeld, P., Riechelmann, S., Nevas, S., Sildoja, M., and Seckmeyer, G.: Adaption of an array spectroradiometer for total ozone column retrieval using direct solar irradiance measurements in the UV spectral range, Atmos. Meas. Tech., 11, 2477–2484, https://doi.org/10.5194/amt-11-2477-2018, 2018b.