the Creative Commons Attribution 4.0 License.
the Creative Commons Attribution 4.0 License.
 | 17 Aug 2021
Introducing the MISR level 2 near real-time aerosol product
Marcin L. Witek
Michael J. Garay
David J. Diner
Michael A. Bull
Felix C. Seidel
Abigail M. Nastan
Earl G. Hansen
Atmospheric aerosols are an important element of Earth's climate system and have significant impacts on the environment and on human health. Global aerosol modeling has been increasingly used for operational forecasting and as support for decision making. For example, aerosol analyses and forecasts are routinely used to provide air quality information and alerts in both civilian and military applications. The growing demand for operational aerosol forecasting calls for additional observational data that can be assimilated into models to improve model accuracy and predictive skill. These factors have motivated the development, testing, and release of a new near real-time (NRT) level 2 (L2) aerosol product from the Multi-angle Imaging SpectroRadiometer (MISR) instrument on NASA's Terra platform. The NRT product capitalizes on the unique attributes of the MISR aerosol retrieval approach and product contents, such as reliable aerosol optical depth as well as aerosol microphysical information. Several modifications are described that allow for rapid product generation within a 3 h window following acquisition of the satellite observations. Implications for the product quality and consistency are discussed and compared to the current operational L2 MISR aerosol product. Several ways of implementing additional use-specific retrieval screenings are also highlighted.
- Article
(5727 KB) - Full-text XML
- BibTeX
- EndNote


© 2021 California Institute of Technology. Government sponsorship acknowledged.
Atmospheric aerosols have long been recognized to influence the climate, environment, and human health (e.g., IPCC, 2013; Lelieveld et al., 2015; Shindell et al., 2013; Turnock et al., 2020). They also affect satellite remote sensing of important geophysical parameters such as ocean color (e.g., Frouin et al., 2019; Gordon, 1997) and greenhouse gas abundance (Butz et al., 2009; Frankenberg et al., 2012; Houweling et al., 2005). Aerosol particles and their properties have been extensively studied in situ and remotely from the ground, in the air, and from space. These observational data vary in spatial and temporal coverage but usually only offer snapshots of local conditions. Since atmospheric aerosols have a life cycle ranging from hours to days, numerical modeling of their emission, transport, and deposition has filled the coverage gaps and extended our understanding of their global impacts. This has given rise to a number of global aerosol reanalyses (Buchard et al., 2017; Gelaro et al., 2017; Inness et al., 2013, 2019; Lynch et al., 2016; Randles et al., 2017; Rienecker et al., 2011) that provide a long-range, gridded, and internally consistent outlook on aerosol burdens around the world. Furthermore, global aerosol modeling has been increasingly used for operational forecasting (e.g., Xian et al., 2019) and as support for decision making in, for example, air quality alerts and non-civilian applications (Liu et al., 2007).
The growing demand for consistent gridded aerosol products has been driving development and steady improvement of numerical predictions. For example, the International Cooperation for Aerosol Prediction initiative was founded in 2010 (Benedetti et al., 2011; Reid et al., 2011) with one of its goals being the development of a global multi-model aerosol forecasting ensemble for basic research and operational use (Xian et al., 2019). Still, models suffer from often poorly resolved aerosol emissions and sinks and can be affected by errors in the underlying meteorology. As a result, systematic and sampling-related biases in aerosol fields are often found between model simulations and satellite observations (e.g., Buchard et al., 2015; Colarco et al., 2010; Lamarque et al., 2013; Zhang and Reid, 2009). An effective way to mitigate some of these problems is by assimilating aerosol observations into numerical models (e.g., Bocquet et al., 2015; Fu et al., 2017; Sekiyama et al., 2010; Di Tomaso et al., 2017; Werner et al., 2019; Zhang et al., 2008). Satellite observations of aerosol optical and microphysical properties are inseparable from these data assimilation activities as they offer the necessary data volume, near-global coverage, and a frequent repeat cycle. However, an often-considerable latency for generating science-quality “standard” satellite products (8 to 40 h) renders them unsuitable for operational forecasting. This has led to the development of aerosol products within the timeframe required by modeling centers, usually 3 h from satellite overpass. A number of near real-time (NRT) products has emerged.
One example of a platform that provides users with NRT satellite products and imagery is NASA's Land, Atmosphere Near real-time Capability for EOS (LANCE) project (https://earthdata.nasa.gov/earth-observation-data/near-real-time, last access: 6 August 2021). A range of instruments deliver various level 1 (L1) and level 2 (L2) data products (https://earthdata.nasa.gov/collaborate/open-data-services-and-software/data-information-policy/data-levels, last access: 6 August 2021) including radiances, land surface properties, and atmospheric thermodynamics and composition within 3 h from satellite observation. NRT aerosol products are currently available from the Moderate Resolution Imaging Spectroradiometer (MODIS), Ozone Monitoring Instrument (OMI), and Visible Infrared Imaging Radiometer Suite (VIIRS). NASA's Multi-angle Imaging SpectroRadiometer (MISR) currently provides NRT radiance and cloud motion vector products. The purpose of this paper is to introduce a new MISR NRT L2 aerosol product available within LANCE.
This paper is organized as follows. Sections 2 and 3 provide brief descriptions of the MISR instrument and the data processing sequence, respectively. Section 4 first outlines the cloud identification methods employed in the MISR aerosol algorithm and then describes algorithmic modifications introduced in the NRT processing. Adjustments to cloud and retrieval screening parameters and their implications are discussed. The global distributions of the NRT product and comparisons of total and fractional aerosol optical depths (AODs) with the standard aerosol product are presented in Sect. 5. Section 6 provides a summary.
The MISR instrument flies aboard the NASA Earth Observing System (EOS) Terra satellite, launched in December 1999 to a sun-synchronous descending polar orbit at an orbital altitude of 705 km, an orbital period of 99 min, and an equatorial crossing time of 10:30 local time. MISR makes 14.56 orbits per day with a repetition cycle (revisit) of 16 d. The orbit tracks are georeferenced to a fixed set of 233 ground paths. With a cross-track swath of about 380 km, total Earth coverage is obtained every 9 d at the Equator and every 2 d at high latitudes.
MISR contains nine pushbroom cameras with viewing angles at the Earth's surface ranging from 0∘ (nadir) to ±70.5∘ oriented along the direction of the flight track. A point on the ground is imaged by all nine cameras in approximately 7 min. The cameras make observations of reflected solar radiance in four spectral bands, centered at 446 (blue), 558 (green), 672 (red), and 866 (near-infrared) nm. The spatial resolution depends on the camera and wavelength. The red band has a full 275 m resolution in all cameras. The other three spectral channels are averaged on board to 1.1 km resolution in global-mode operation (Diner et al., 1998), with the exception of the nadir camera, which preserves the full 275 m resolution in all spectral channels. See https://misr.jpl.nasa.gov/Mission/ (last access: 6 August 2021) for more details.
MISR employs two processing pathways for aerosol retrievals, one for observations over land (Martonchik et al., 2009) and another for dark water (DW) (Kalashnikova et al., 2013), which applies over deep oceans, seas, and lakes. Previous versions of the MISR aerosol product were extensively validated over the years (e.g., Kahn et al., 2010; Kahn and Gaitley, 2015; Kalashnikova et al., 2013; Shi et al., 2014; Witek et al., 2013), showing high retrieval quality over land and ocean.
The current operational version of the MISR aerosol product, designated as version 23 (V23), was released publicly in June 2018. It introduced multiple algorithmic, data product, and data usability improvements (Garay et al., 2020; Witek et al., 2018a, b). V23 provides aerosol information with a spatial resolution of 4.4 km × 4.4 km packaged in NetCDF-4 format. Initial validation efforts showed that V23 retrievals are more accurate than previous versions, with the most pronounced improvements in the DW algorithm (Garay et al., 2020). V23 retrievals over oceans were extensively validated by Witek et al. (2019), indicating excellent agreement with ground-based observations. Other V23 aerosol optical depth (AOD) evaluation efforts show similar results (e.g., Choi et al., 2019; Sayer et al., 2020; Si et al., 2020; Sogacheva et al., 2020). A first regional insight into retrieved particle properties from the MISR V23 aerosol product shows that MISR generally captures the distinct spatial and temporal features of aerosol type in East Asia (Tao et al., 2020). Furthermore, V23 has greatly improved the quality of reported AOD uncertainties, which now realistically represent retrieval errors (Sayer et al., 2020; Witek et al., 2019). This is especially relevant as pixel-level retrieval uncertainties are very important for satellite data assimilation, which is being increasingly used in aerosol modeling studies (Lynch et al., 2016; Shi et al., 2011, 2013; Zhang and Reid, 2010). MISR data and the related documentation can be obtained from https://asdc.larc.nasa.gov/project/MISR (last access: 6 August 2021).
MISR currently provides several L1 and L2 near real-time (NRT) radiance and cloud motion vector products (https://earthdata.nasa.gov/earth-observation-data/near-real-time/download-nrt-data/misr-nrt, last access: 6 August 2021). All MISR NRT processing is based on level 0 data downlinked in observational sessions. These session-based files, representing portions of a single MISR orbit, usually cover between 10 and 50 min of observations, as compared to the full orbit period of 98.9 min. This session-based processing is necessary to allow for the fast product delivery required for NRT applications.
The new NRT L2 aerosol product file content, described in the Data Product Specification (https://asdc.larc.nasa.gov/documents/misr/DPS_AEROSOL_NRT_V023.20210430.pdf, last access: 6 August 2021), is equivalent to the standard aerosol product (Garay et al., 2020). The NRT L2 aerosol product file name convention is: MISR_AM1_AS_AEROSOL_T{yyyymmddHHMMSS} _P{ppp}_O{oooooo}_F13_0023.nc, where “yyyy”, “mm”, and “dd” are the year, month, and day, and “HH”, “MM”, and “SS” are the hours, minutes, and seconds, respectively. Furthermore, {ppp} is the three-digit path identifier (between 001 and 233) and {oooooo} is the six-digit orbit number. The NRT L2 aerosol product files are available for download within 3 h of acquisition at NASA's Atmospheric Science Data Center (ASDC) (https://asdc.larc.nasa.gov/project/MISR, last access: 6 August 2021).
For clarity, it is important to distinguish between the three different MISR L2 aerosol products: NRT, FIRSTLOOK, and standard aerosol (SA) product (see Fig. 1). NRT is generated within a 3 h time interval after acquisition and uses the same ancillary inputs as FIRSTLOOK. These include the monthly gridded (1.0∘) snow or ice mask and surface wind speed from the Terrestrial Atmospheric and Surface Climatology (TASC) database and the seasonal Radiometric Camera-by-camera Threshold Dataset (RCTD) (Diner et al., 1999a). Both NRT and FIRSTLOOK utilize TASC and RCTD datasets from the current month or season in the prior year. The FIRSTLOOK product is generated within 2 days from acquisition and includes cloud classification parameters obtained from the L1 and L2 cloud products. The SA product is available after final processing is performed on a seasonal basis and within 3 months from the end of the season, which results in a 3- to 6-month latency. The final processing utilizes the most recent snow or ice and wind speed data.
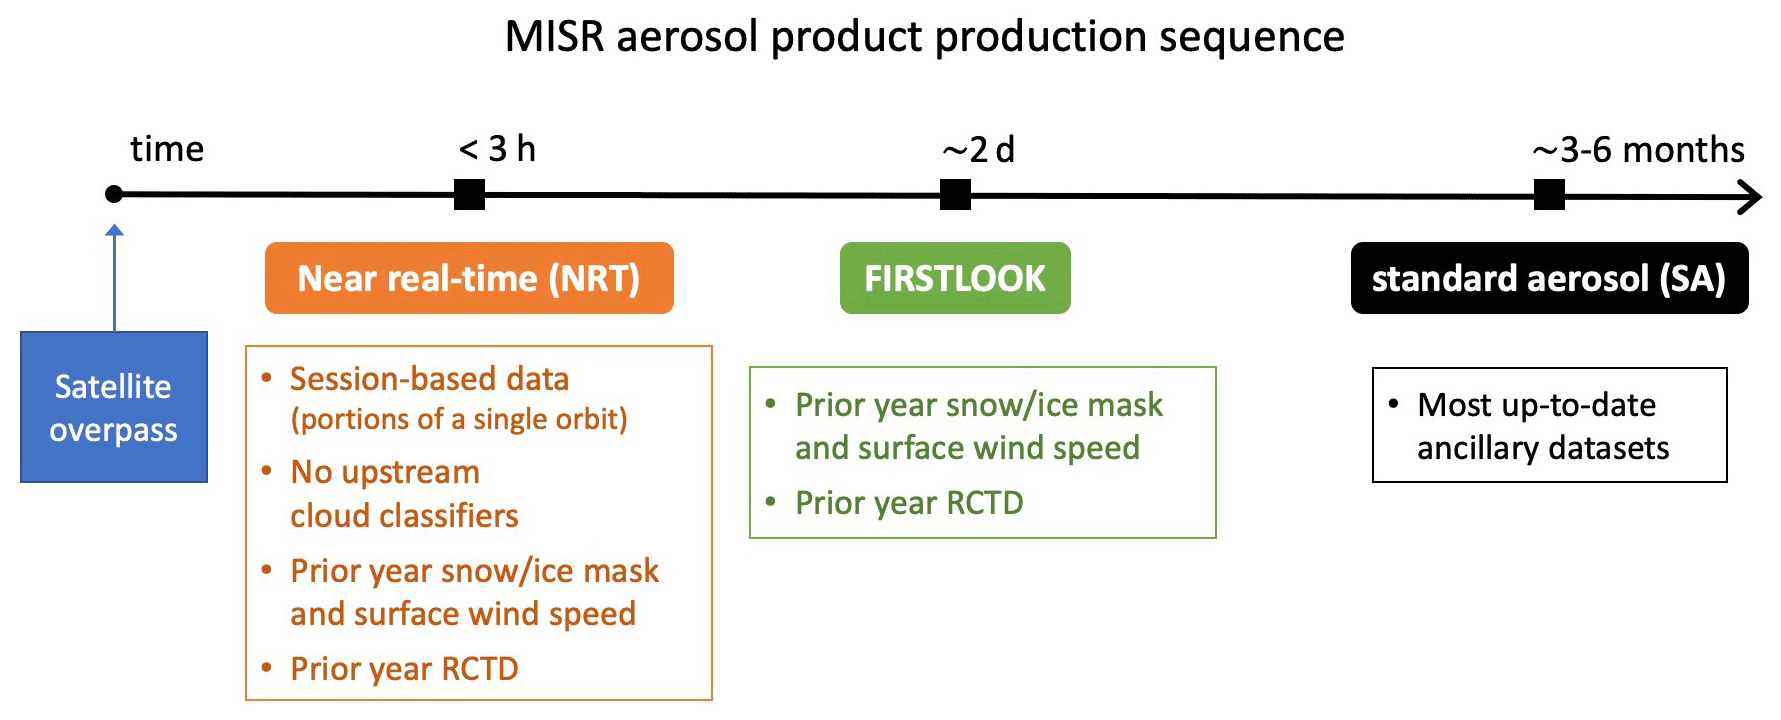
Figure 1Schematic showing the MISR aerosol product delivery timeline. Snow or ice mask and surface wind speed data are monthly averages. RCTD stands for Radiometric Camera-by-camera Threshold Dataset. MISR final production (SA) is processed on a seasonal cycle and is often delayed 1 to 3 months from the end of each season, which results in a latency of up to 6 months.
4.1 Cloud identification
Identification of cloudy pixels is a critical element of all satellite aerosol remote sensing algorithms. MISR employs several cloud identification strategies that can be loosely split into two groups: the first group relies on cloud classifiers previously generated with the MISR level 2 cloud detection and classification algorithm (Diner et al., 1999b), and the second group includes built-in tests that are internal to the aerosol retrieval algorithm (Diner et al., 2008).
4.1.1 Upstream cloud classifiers
The operational MISR aerosol algorithm relies on a range of external input datasets that are either static – for example, a monthly wind speed climatology – or that need to be generated prior to aerosol retrievals in upstream processing. A notable example of such external inputs to the SA and FIRSTLOOK algorithms are cloud classification parameters obtained from the MISR L2 cloud product. An important implication of this dependency is that aerosol processing needs to wait for the cloud product to be generated, creating a time lag that is prohibitive for NRT applications. Typically, the L2 cloud product is generated within about 18 h of overpass, and the MISR L2 FIRSTLOOK aerosol processing is completed within about 2 d. In order to produce an L2 aerosol product within an approximate 3 h timeframe, the algorithm needs to operate without the upstream cloud classifiers.
Two specific L2 cloud classification parameters utilized in FIRSTLOOK and SA aerosol processing are the MISR Stereoscopically Derived Cloud Mask (SDCM) and the Angular Signature Cloud Mask (ASCM) (Diner et al., 1999b; Girolamo and Davies, 1994). In addition to these L2 products, the Radiometric Camera-by-camera Cloud Mask (RCCM) (Diner et al., 1999a; Girolamo and Davies, 1995) retrieved in L1B processing is also employed. All three parameters are reported at 1.1 km × 1.1 km resolution. It should be noted that RCCM also serves as an input to the algorithm that generates SDCM and ASCM, indicating that these parameters are not independent.
In the FIRSTLOOK and SA algorithm, the RCCM, SDCM, and ASCM cloud masks are used together to determine whether a particular 1.1 km × 1.1 km subregion is clear or cloudy. The implication is that if any of the nine MISR cameras is designated as cloudy in a subregion, this subregion is excluded from aerosol retrieval. The clear or cloudy decision logic depends on the underlying surface type, which is divided into three categories: land, water, and snow or ice. Generally, a “clear” outcome is favored over the two most frequently used surface types, land and water, assigning a subregion as cloudy only if the RCCM and SDCM masks indicate a cloud. The logic is considerably more conservative over snow or ice surfaces due to difficulties in distinguishing clouds from the underlying bright features. Details of the cloud mask decision logic over different surface types can be found in Diner et al. (2008).
Analyzing 3 months of V23 L2 SA product (March, April, May 2020) indicates that the cloud masks along with the brightness test (see Sect. 4.1.2) lead to screening of about 50 % of retrievals. As such, they have the largest impact on identifying and removing pixels where clouds might be present. These masks and decision pathways, however, have their deficiencies and additional checks were put in place to further decrease the frequency of cloud-contaminated aerosol retrievals.
4.1.2 Built-in cloud detection methods
In addition to the cloud masks retrieved in the L1B processing (RCCM) and from the L2 Cloud Detection and Classification algorithm (SDCM, ASCM), the MISR aerosol retrieval algorithm relies on three internal tests to further identify cloudy pixels that might have escaped earlier detection. These are (1) the brightness test, (2) the angle-to-angle smoothness test, and (3) the angle-to-angle correlation test. Details of these tests can be found in Martonchik et al. (2002) or Diner et al. (2008), but a short summary is provided here for completeness.
The brightness test is employed to identify clouds that lacked sufficient texture to be picked up by SDCM. For each surface type, a fixed threshold is adopted on measured bidirectional reflectance factors (BRFs), and when exceeded in all spectral bands for at least one camera, it renders a subregion unsuitable for aerosol retrieval. The thresholds are set to 1.0, 0.5, and 0.5 for snow or ice, land, and water surfaces, respectively. The value of 1.0 means that the brightness test is effectively turned off over snow or ice. Furthermore, the brightness test does not override subregions that were identified as clear by RCCM.
The angular smoothness test checks for unusually large variations in the measured equivalent reflectances as a function of camera angle, the premise being that in the absence of artifacts or subpixel clouds, the measured radiance should change smoothly from camera to camera. The test is achieved by fitting a polynomial to equivalent reflectances, separately for aft (+nadir) and forward (+nadir) cameras and each spectral band, and checking if the goodness of fit metric (definition in Diner et al., 2008) exceeds a threshold. If in at least one case the test fails, the subregion is eliminated.
Finally, the angle-to-angle correlation test also investigates radiance smoothness and correlation between camera angles, which makes it conceptually similar to the angular smoothness test, but instead utilizes high-resolution information from the red spectral band. It uses 4 × 4 arrays of the 275 m spatial resolution red band equivalent reflectances in each 1.1 km × 1.1 km subregion. The test then evaluates spatial variability within the 4 × 4 array for each camera and compares it to a variability within a camera-average template. Variances, covariances, and normalized cross-correlations are calculated (see Diner et al., 2008 for details). If the variability within a camera deviates considerably from the average, this camera might have sub-pixel clouds or other contaminants, and as a result the subregion is excluded from aerosol retrievals.
In the 3 months of data analyzed in this study (March, April, May 2020), the relative occurrence of retrieval screening due the abovementioned internal tests are about 4.0 % and 0.1 % for the correlation and smoothness tests, respectively. These statistics come from analyzing the output field Aerosol_Retrieval_ Screening_Flags and as such they do not represent the absolute rates of success of each individual test. That is because the tests are performed sequentially, and if one fails, subsequent tests are not performed. For SA product generation, the order is: upstream cloud mask described in Sect. 4.1.1, the brightness test, the correlation test, and the smoothness test. For example, the correlation test is only performed on pixels that already passed the upstream cloud tests as well as the brightness test. Additionally, the brightness test does not have its own flag in the Aerosol_Retrieval_Screening_Flags output but is grouped together with the upstream cloud classifiers.
4.2 Retrieval screening using regional cloud parameters
The methods described in Sect. 4.1 focus on identifying and excluding cloudy 1.1 km × 1.1 km subregions from the aerosol retrieval process. The retrieval region consists of 16 (4 × 4) subregions. These methods are highly effective at removing cloud-contaminated pixels, but since they rely on MISR visible wavelengths they might miss certain cloud signatures more easily detected in the infrared spectrum (e.g., Gao et al., 1993). For example, MODIS routinely uses its reflective and emissive infrared channels to detect optically thin cirrus clouds (Ackerman et al., 2010; Levy et al., 2013). As a result, MISR cloud detection methods occasionally fail, which leads to visible outliers in retrieved AODs (Witek et al., 2018b). For that reason, an additional set of screenings is applied in an effort to eliminate such unusually high AOD retrievals (Garay et al., 2020). Two of these additional methods look at overall cloudiness in the retrieval region (consisting of 4 × 4 subregions) as well as in a larger area consisting of 3 × 3 regions (12 × 12 subregions). The cloud screening parameter (CSP) represents the fraction of clear grid cells within a region, whereas the cloud screening parameter neighbor 3 × 3 (CSP9) is similar to CSP but for the larger area. If CSP is below 0.7 and CSP9 below 0.5, the retrieval is not reported in the final product intended for most users. However, it is still included in the product's AUXILIARY subcategory and annotated with the term “Raw” to indicate that the product has not passed the recommended quality screenings.
4.3 Adjusting cloud screening thresholds
4.3.1 Performance of the prototype NRT product
This subsection presents the results and analysis of prototype NRT aerosol retrievals. These are obtained prior to any threshold and screening adjustments included in the final version of the product. To differentiate between the final and the prototype NRT products, the latter is denoted as NRTprot.
As mentioned in the previous section, the NRT processing cannot rely on the cloud masks generated in the L1 and L2 cloud products, namely the RCCM, SDCM, and ASCM. This implies that potentially less screening of cloudy subregions would be applied, increasing the probability of cloud contamination in aerosol retrievals. However, some of the burden of cloud identification is picked up by the built-in cloud tests described in Sect. 4.1.2. The frequency of these tests identifying cloudy pixels increases in NRT processing in comparison to standard processing, in large part mitigating the negative consequences resulting from the lack of the upstream cloud masks. This is well evidenced by examining the normalized probability density functions (pdfs) of AOD from spring 2020 (Fig. 2). The SA (red) and NRTprot (blue) lines are very similar, indicating that the built-in cloud tests substitute to a significant extent for the missing upstream cloud masks in generating the NRTprot product. The largest difference occurs in the high-AOD range, suggesting that NRTprot has more retrievals in this regime. The black dotted line shows a pdf of the NRTprot AOD retrievals that do not have a matching SA retrieval. This is labeled as “NRTprot gained” as it represents additional retrievals obtained in NRT processing due to the lack of external cloud masks. The “NRTprot gained” pdf is clearly shifted towards higher AODs, confirming that the NRTprot processing tends to retrieve higher AODs in places where SA is not available.
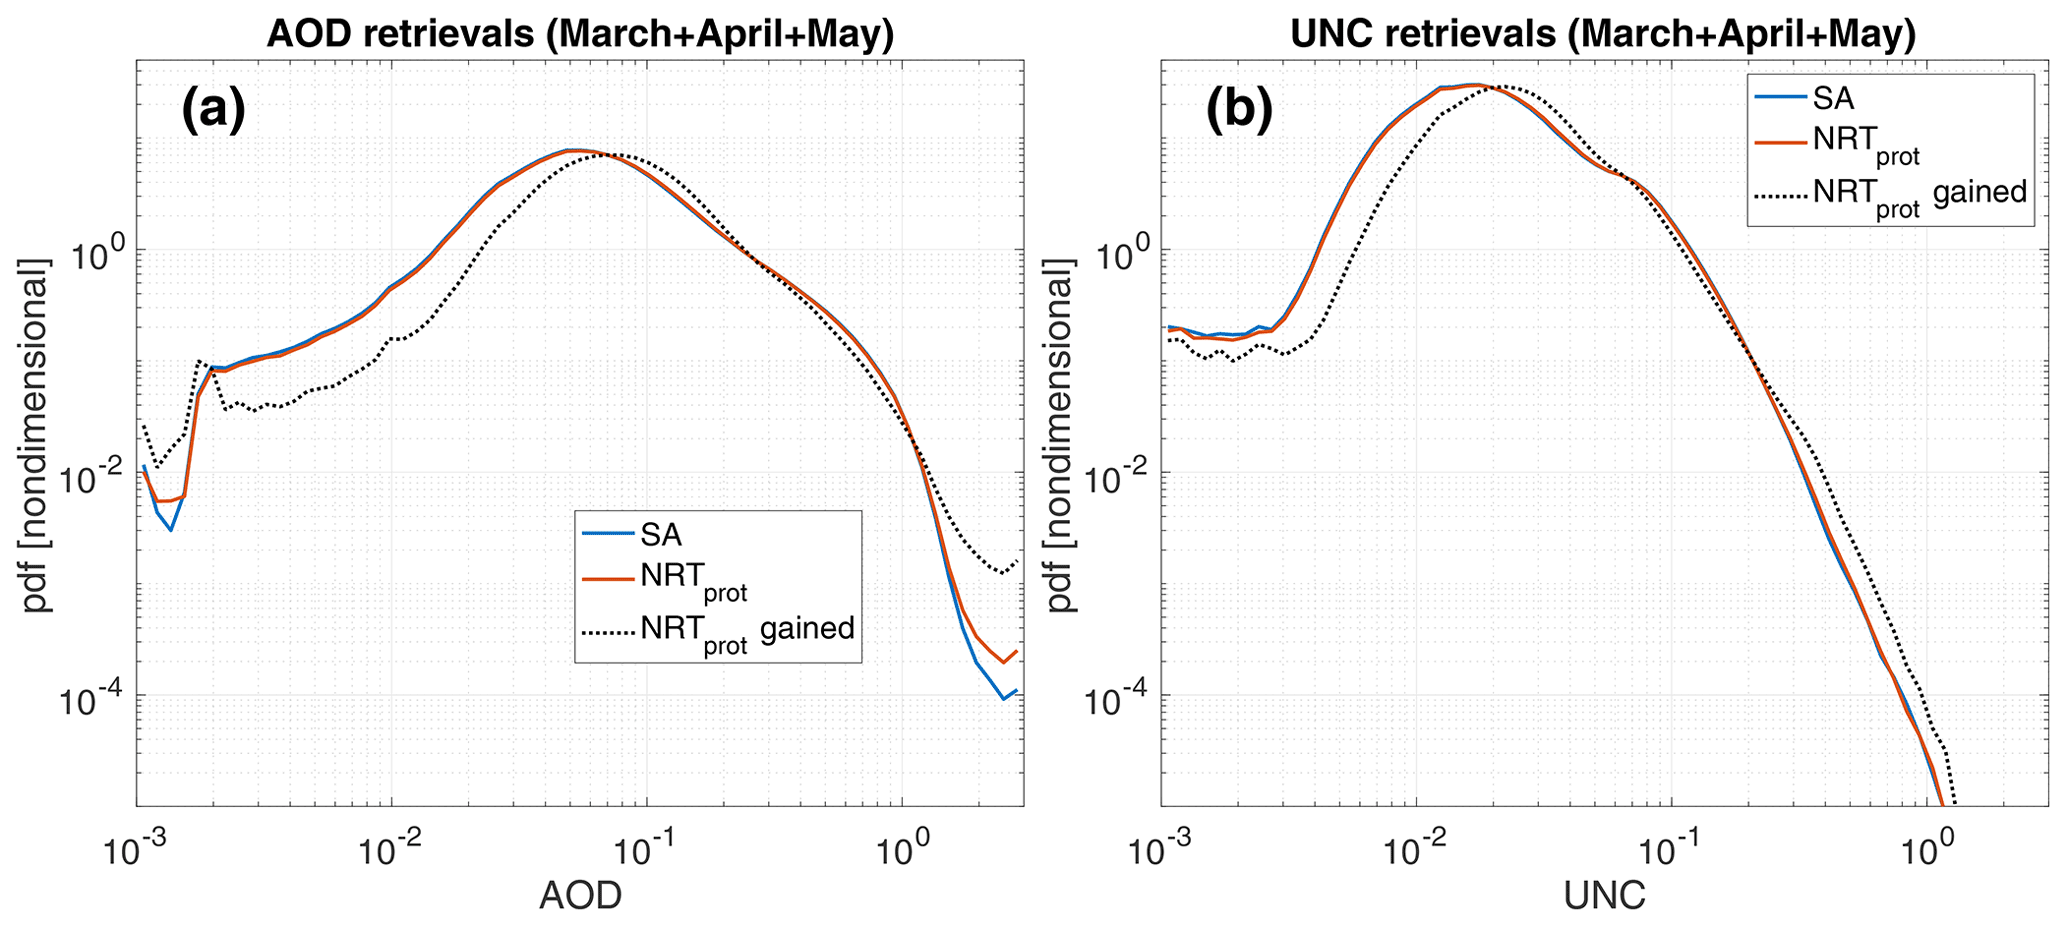
Figure 2(a) AOD normalized probability density functions from SA, prototype NRT, and prototype NRT retrievals that do not have a matching SA equivalent (labeled as NRTprot gained). (b) Same as in (a), but for retrieved AOD uncertainties (UNC). Data statistics for AODs are provided in Table 1.
Figure 3 shows pdfs of AOD but with retrievals separated between DW (Fig. 3a) and land (Fig. 3b). These pdfs indicate that the retrievals over oceans are the main source of increased frequency of high-AODs in the NRTprot product. The pdfs over land are virtually unchanged, including a slightly flattened but still relatively comparable distribution of the “NRTprot gained” retrievals (Fig. 3b). The additional statistics of the data presented in Figs. 2 and 3, including the retrieval count, the mean AOD, and the geometric mean AOD, which is better suited for log-normal distributions of AOD (Sayer and Knobelspiesse, 2019), are provided in Table 1. Note that the number of NRTprot gained is not the same as the number of NRTprot minus SA. This is because some SA retrievals do not have their NRTprot equivalent, making the SA count larger than it would have been otherwise.

Figure 3AOD pdfs for land (a) and DW (b) retrievals. Data statistics are provided in Table 1.
Table 1Additional statistics for the data presented in Figs. 2 and 3 (statistics for FIRSTLOOK not shown). NRTprot gained stands for the prototype NRT retrievals that do not have a matching SA equivalent; geomean stands for the geometric mean AOD.
In the 3-month period analyzed in this study (March, April, May 2020), the NRTprot processing leads to about 6.4 % more retrievals than SA (see Table 1). Of the 5.5 million NRTprot retrievals that do not have a matching SA retrieval (NRTprot gained), the majority of them (67 %) are DW retrievals. The overall geometric means are almost identical in SA and NRTprot, although small variations in this statistic are seen in DW and land categories. The NRTprot gained have visibly higher arithmetic and geometric mean values, the increase coming mainly from DW retrievals. These basic statistics warrant a further look at the NRTprot performance over DW.
4.3.2 Sensitivity to CSP and CSP9 thresholds in DW retrievals
One way to screen potentially cloud-contaminated high-AOD retrievals is to adjust the thresholds on CSP and CSP9 parameters (Garay et al., 2020). This is furthermore justified by the fact that in the absence of RCCM, SDCM, and ASCM in NRT processing, fewer cloudy subregions are identified in a retrieval area and consequently CSP and CSP9 have by default lower values. This argument provides strong justification for investigating sensitivity to increased CSP and CSP9 thresholds in the NRT processing.
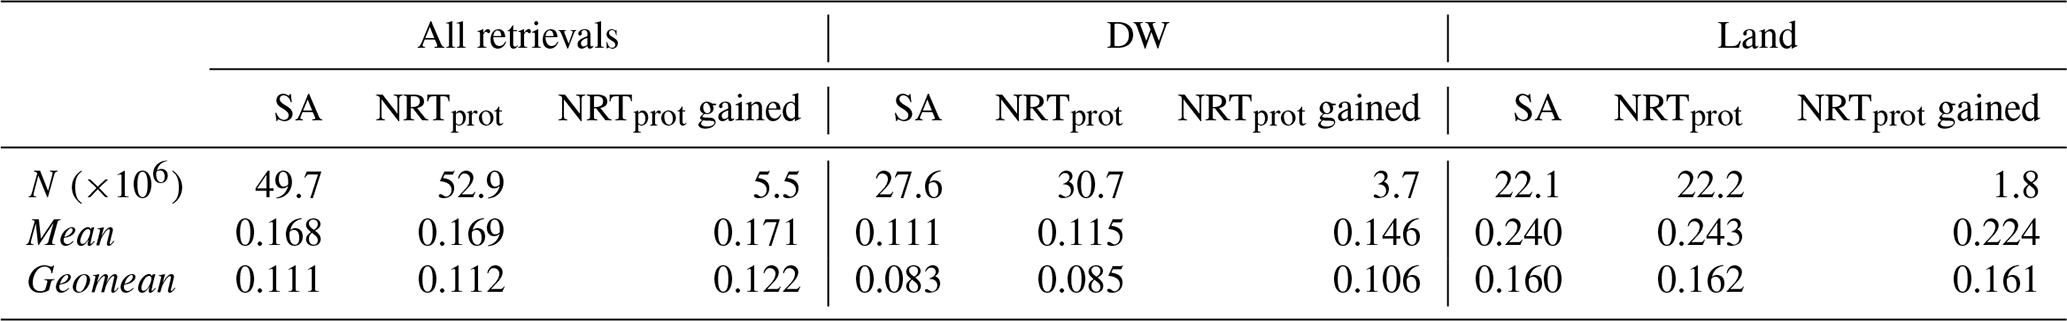
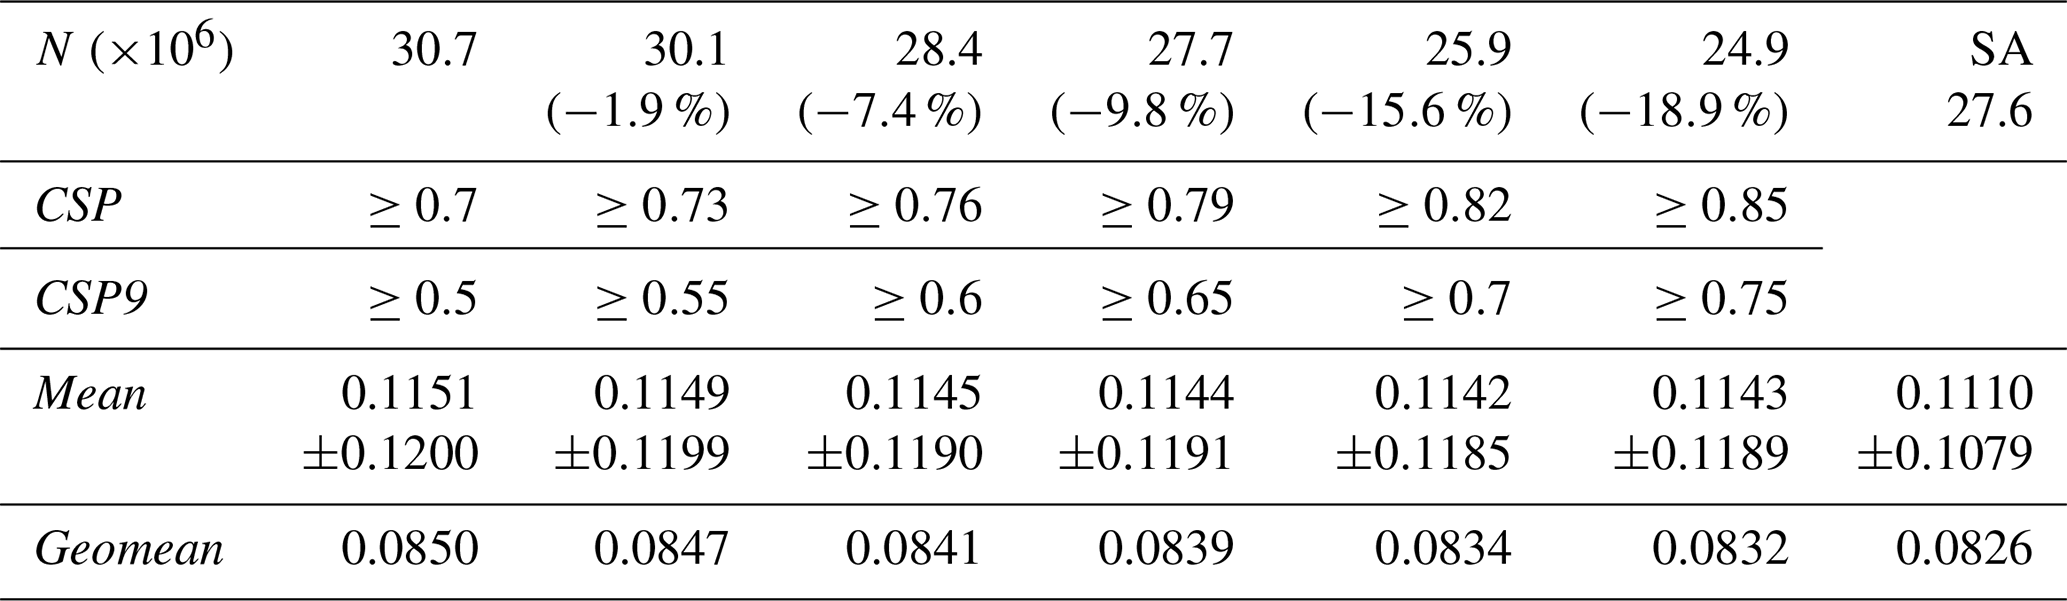
The SA product uses the thresholds of CSP = 0.7 and CSP9 = 0.5 (Garay et al., 2020); when the values of CSP and CSP9 are below these thresholds in a retrieval region, the aerosol retrieval is removed from the data field recommended for users. Figure 4 and Table 2 show pdfs and AOD statistics for different thresholds of CSP and CSP9 parameters in the NRTprot product over dark water surfaces. There are only minor changes in the pdfs when the thresholds are increased, including in the high-AOD regime. The arithmetic and geometric mean values decrease slowly; even at the highest considered thresholds (0.85 for CSP and 0.75 for CSP9) these statistics are still above the SA values. At the same time, the number of passing NRTprot retrievals decreases considerably faster, with almost 19 % of retrievals lost when the highest thresholds are used. These results indicate that adjusting CSP and CSP9 thresholds is not an effective strategy for constraining NRTprot retrievals.
Figure 4Prototype NRT AOD pdfs over dark water surfaces from spring 2020 obtained with different CSP and CSP9 cloud-screening thresholds. Data statistics are provided in Table 2.
Table 2Additional statistics for the data presented in Fig. 4. Values for CSP and CSP9 indicate their corresponding thresholds for screening AOD retrievals. The arithmetic mean values are accompanied by their respective ±1 standard deviations.
4.3.3 Sensitivity to ARCI threshold in DW retrievals
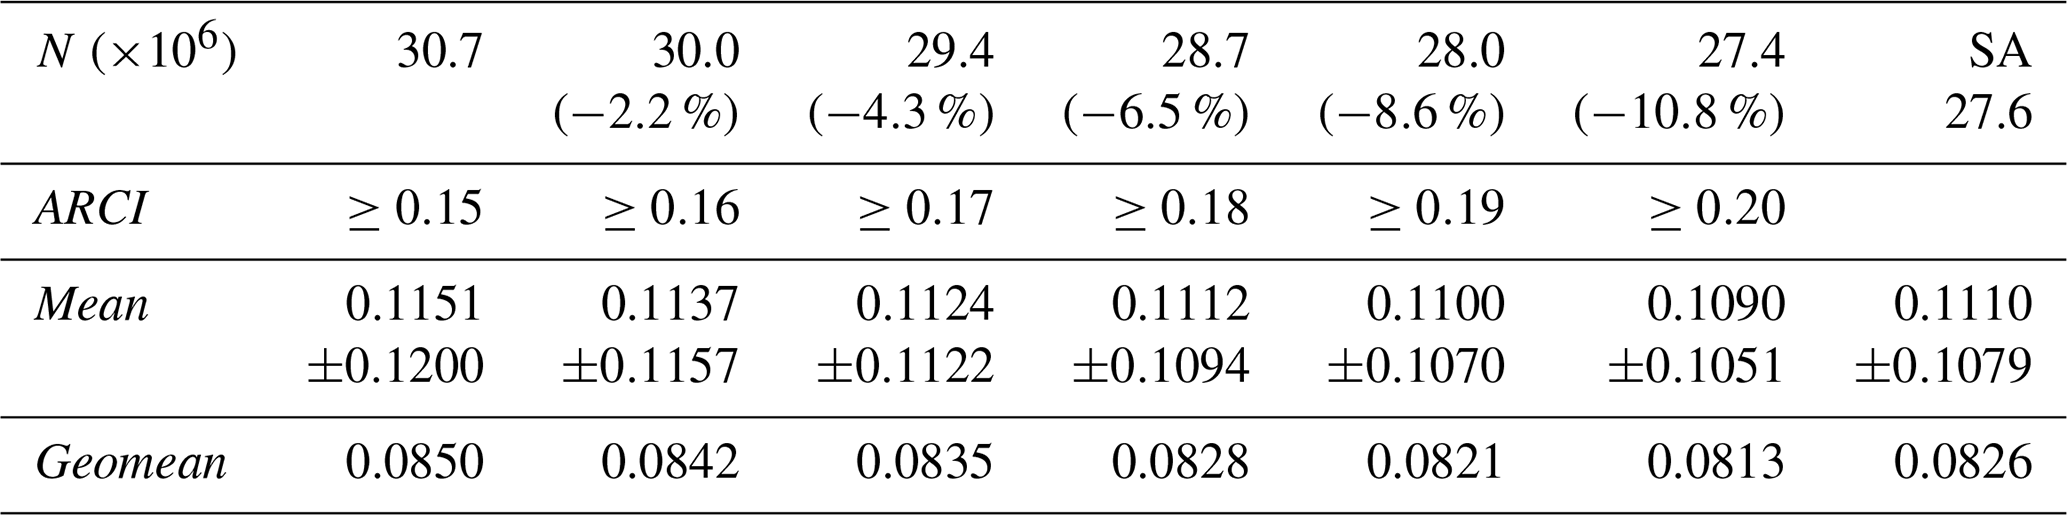
V23 of the MISR aerosol product introduced a new parameter called the aerosol retrieval confidence index (ARCI) that is used to screen high-AOD retrieval outliers caused by cloud contamination and other factors (Witek et al., 2018b). ARCI, defined only for DW retrievals, proved to be an efficient metric at filtering out potentially cloud-contaminated AOD retrievals. In standard processing, retrievals with ARCI <0.15 are removed from the recommended user field but are retained in the AUXILIARY group. The 0.15 threshold is well supported through statistical analysis (Witek et al., 2018b), although some erroneous results still pass this screening method, suggesting that increasing this threshold might be beneficial in NRT processing.
Figure 5 and Table 3 show pdfs and AOD statistics for different thresholds of ARCI in the NRTprot product. In this case the differences between ARCI thresholds are quite noticeable, especially in the high-AOD range of retrievals. Increasing the ARCI threshold to 0.2 leads to a loss of about 11 % of NRTprot DW retrievals, but the resulting arithmetic and geometric mean values are lower than the SA values. At the same time, the absolute number of NRTprot DW retrievals (27.4 million) is still comparable to the number of SA DW retrievals (27.6 million). The pdfs and the statistics suggest that increasing the NRTprot ARCI threshold from 0.15 to 0.18 leads to a product that has similar characteristics to SA.
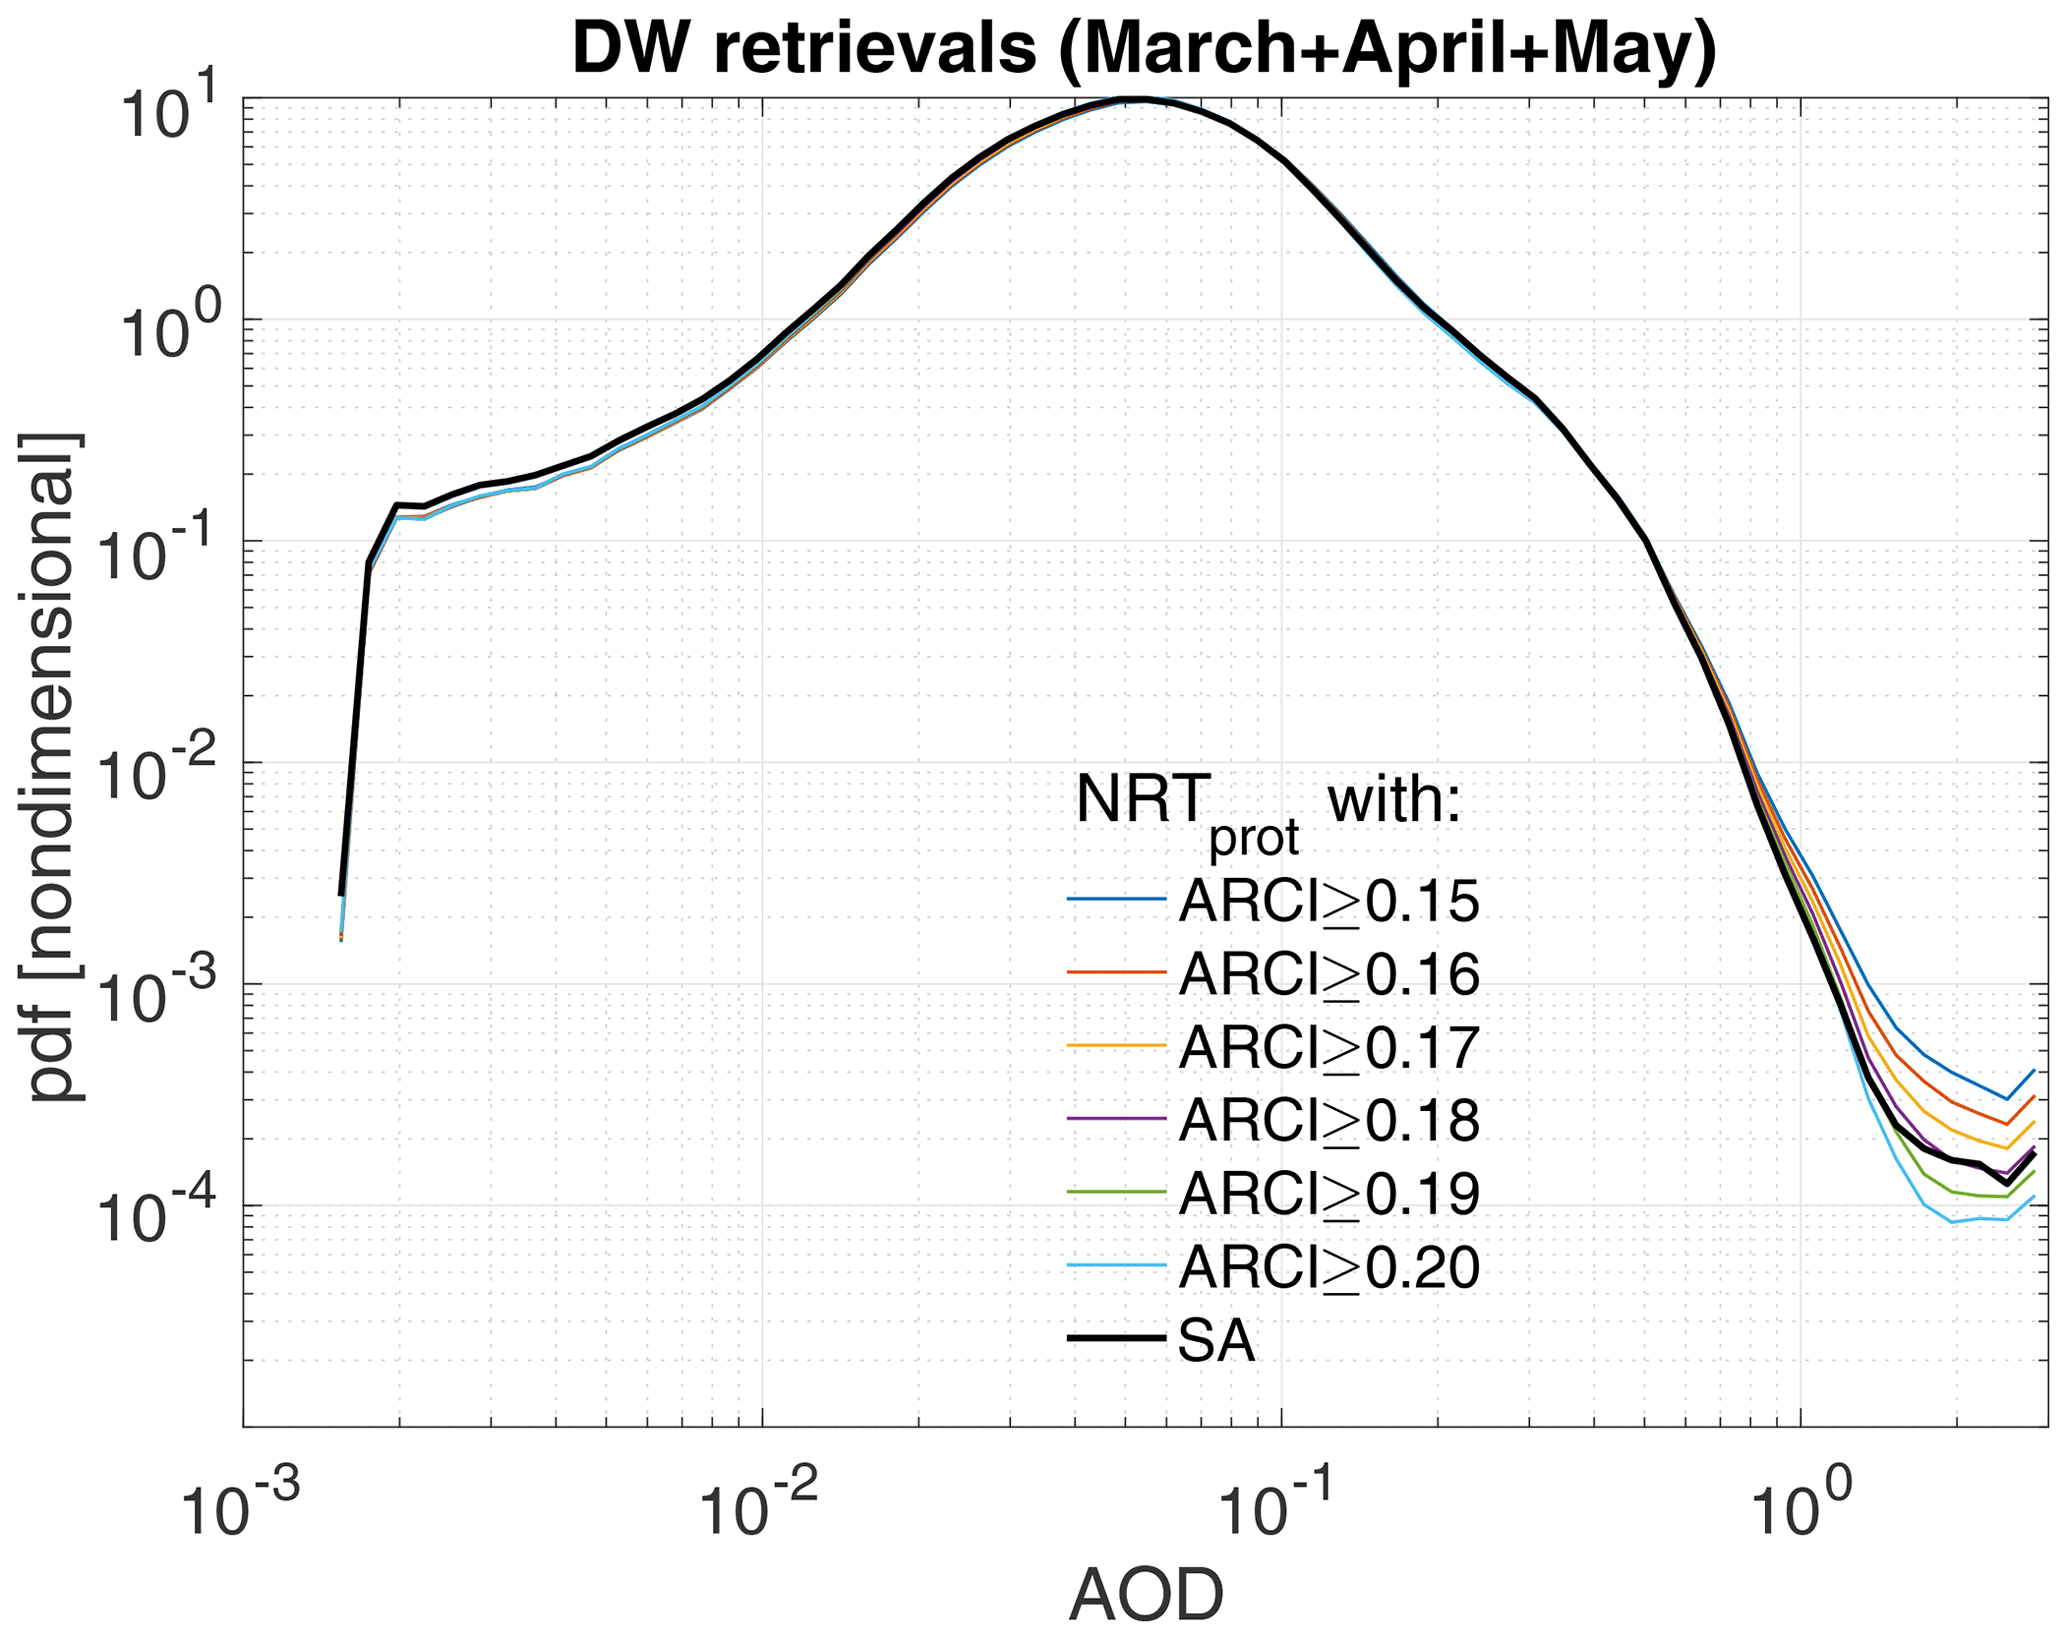
Figure 5Prototype NRT AOD pdfs from spring 2020 obtained with different ARCI thresholds. Data statistics are provided in Table 3.
Table 3Additional statistics for the data presented in Fig. 5.
4.3.4 Recommendation for NRT processing
The statistical analyses presented in the previous sections indicate that the lack of RCCM, SDCM, and ASCM in NRT processing has negative consequences on the product, especially by allowing more potentially cloud-contaminated, high-AOD DW retrievals to pass screening criteria. Adjusting built-in cloud screening thresholds on CSP and CSP9 brings only limited benefits at the cost of losing a considerable percentage of retrievals. However, the ARCI threshold adjustments result in much closer statistical correspondence between the NRTprot and standard AOD retrievals. For that reason, a revised ARCI threshold of 0.18 is implemented in NRT processing. Since the unscreened retrievals, as well as the ARCI parameter, are also provided in the AUXILIARY group of the product, users are encouraged to experiment with their own thresholds, which might prove more beneficial in specific applications or geographic areas.
4.4 Cloud or clear decision logic over snow or ice
In Sect. 4.1.1 the impact of upstream cloud classifiers in standard processing – namely, the RCCM, SDCM, and ASCM – on the subregion's cloud or clear designation was briefly described. The decision pathway depends on the underlying surface type, which can be either land, water, or snow or ice. Over land and water, the “cloud” outcome is only obtained when both RCCM and SDCM designate the subregion as cloudy. In the absence of RCCM and SDCM the default outcome is “clear”. Over snow or ice, however, the logic is more restrictive and favors the “cloudy” designation (Diner et al., 2008). Specifically, when the upstream cloud classifiers are not available, the subregion designation is set to “cloudy” by default. This has important implications on aerosol retrievals in areas where snow and ice occur seasonally.
The snow or ice surface mask, unlike land and water, is not static and changes every month. Furthermore, the snow or ice mask input to MISR aerosol processing has a 1.0∘ horizontal resolution, which is re-gridded to a 1.1 km resolution corresponding to the resolution of MISR subregion. In FIRSTLOOK processing, the snow or ice mask from the same month but in the previous year is used. The final SA processing is performed when the current year's monthly snow or ice mask becomes available. The NRT processing, similarly to FIRSTLOOK, relies on the previous year's snow or ice mask. Additionally, given the lack of upstream cloud classifiers, the snow or ice areas are designated as “cloudy” for aerosol retrieval purposes. This is well visualized in Fig. 6, which shows the visible image and the corresponding maps of AOD and aerosol retrieval screening flag in the NRT processing. The dark blue color (index 5) denotes cloudy regions determined using the snow or ice cloud logic. The box-like nature of the excluded areas is associated with the coarse resolution of the snow or ice mask (1.0∘). The previous year's mask might also not be representative of the current conditions on the ground. It is worth noting that the FIRSTLOOK product often suffers from the same exclusion rules as NRT. This is because of the strict clear or cloud logic over snow or ice surfaces that favors the cloudy outcome; in the case shown in Fig. 6, the AOD gaps in FIRSTLOOK (not shown) look very similar to the NRT product.

Figure 6Example of snow or ice masking in NRT AOD retrievals. (a) Visible image of the retrieval area. (b) Corresponding NRT AOD retrievals. (c) NRT aerosol retrieval screening flag for the same area; the dark blue color denotes regions designated as cloudy.
Several attempts have been made by the MISR science team to improve NRT aerosol retrievals in snow or ice covered areas. However, identifying and isolating snow-covered surfaces in the absence of upstream cloud classifiers proves very challenging. The quality of aerosol retrievals is often negatively affected in such conditions. For that reason, and in an attempt to eliminate as many NRT AOD outliers as possible, the current snow or ice logic is retained in the NRT aerosol processing.
5.1 Total AOD
In this section, geographic distributions of MISR AOD retrievals from SA and NRT products are analyzed. The datasets encompass 3 months, March, April, and May of 2020. The NRT retrievals are screened with the revised ARCI threshold of 0.18 as suggested in Sect. 4.3.4. The spatial overlap of the SA and NRT data is achieved using an intersect of the X_Dim and Y_Dim fields in the two data products.
Figure 7 shows the global distributions of geometric mean AOD from the (a) SA and (b) NRT products. The retrievals are gridded at 2∘ × 2∘ spatial resolution. Figure 7c shows the AOD difference between the two products (NRT − SA).

Figure 7(a) Global distribution of SA AOD geometric mean values across March, April, and May of 2020 at 2∘ × 2∘ spatial resolution. (b) Same as in (a), but for NRT AOD. (c) AOD difference between NRT and SA. Grid points with less than 15 retrievals are excluded.
The largest AOD differences are seen in areas with climatologically high cloud cover, especially over the Southern Ocean and over land in areas where potential snow cover could be an issue. Over the Southern Ocean the SA AODs are predominantly higher than the NRT AODs. This is due to the increased ARCI threshold in NRT (0.18 vs. 0.15 in SA), which brings in more aggressive screening of cloud-contaminated retrievals (Witek et al., 2018b). Over land, where the ARCI parameter is not available, the gridded NRT AODs tend to be higher than the SA AODs, which is in part related to the differences in snow or ice mask between the two products. Still, the AOD differences in Fig. 7c are rather small and reflect sampling issues rather than any systematic deficiencies in NRT processing. At the same time, the lack of cloud classifiers in NRT does not adversely affect AOD distributions, which is consistent with the statistical analysis presented in Sect. 4.2.3.
5.2 Retrieval yields
Figure 8 complements Fig. 7 by showing (a) the SA retrieval count distribution as well as (b) the retrieval count difference between the SA and NRT products.

Figure 8(a) Decimal logarithm of the retrieval count from the SA product in March, April, and May of 2020. (b) Retrieval count difference between NRT and SA. Presented values are gridded at 2∘ × 2∘ spatial resolution and grid points with less than 15 retrievals are excluded.
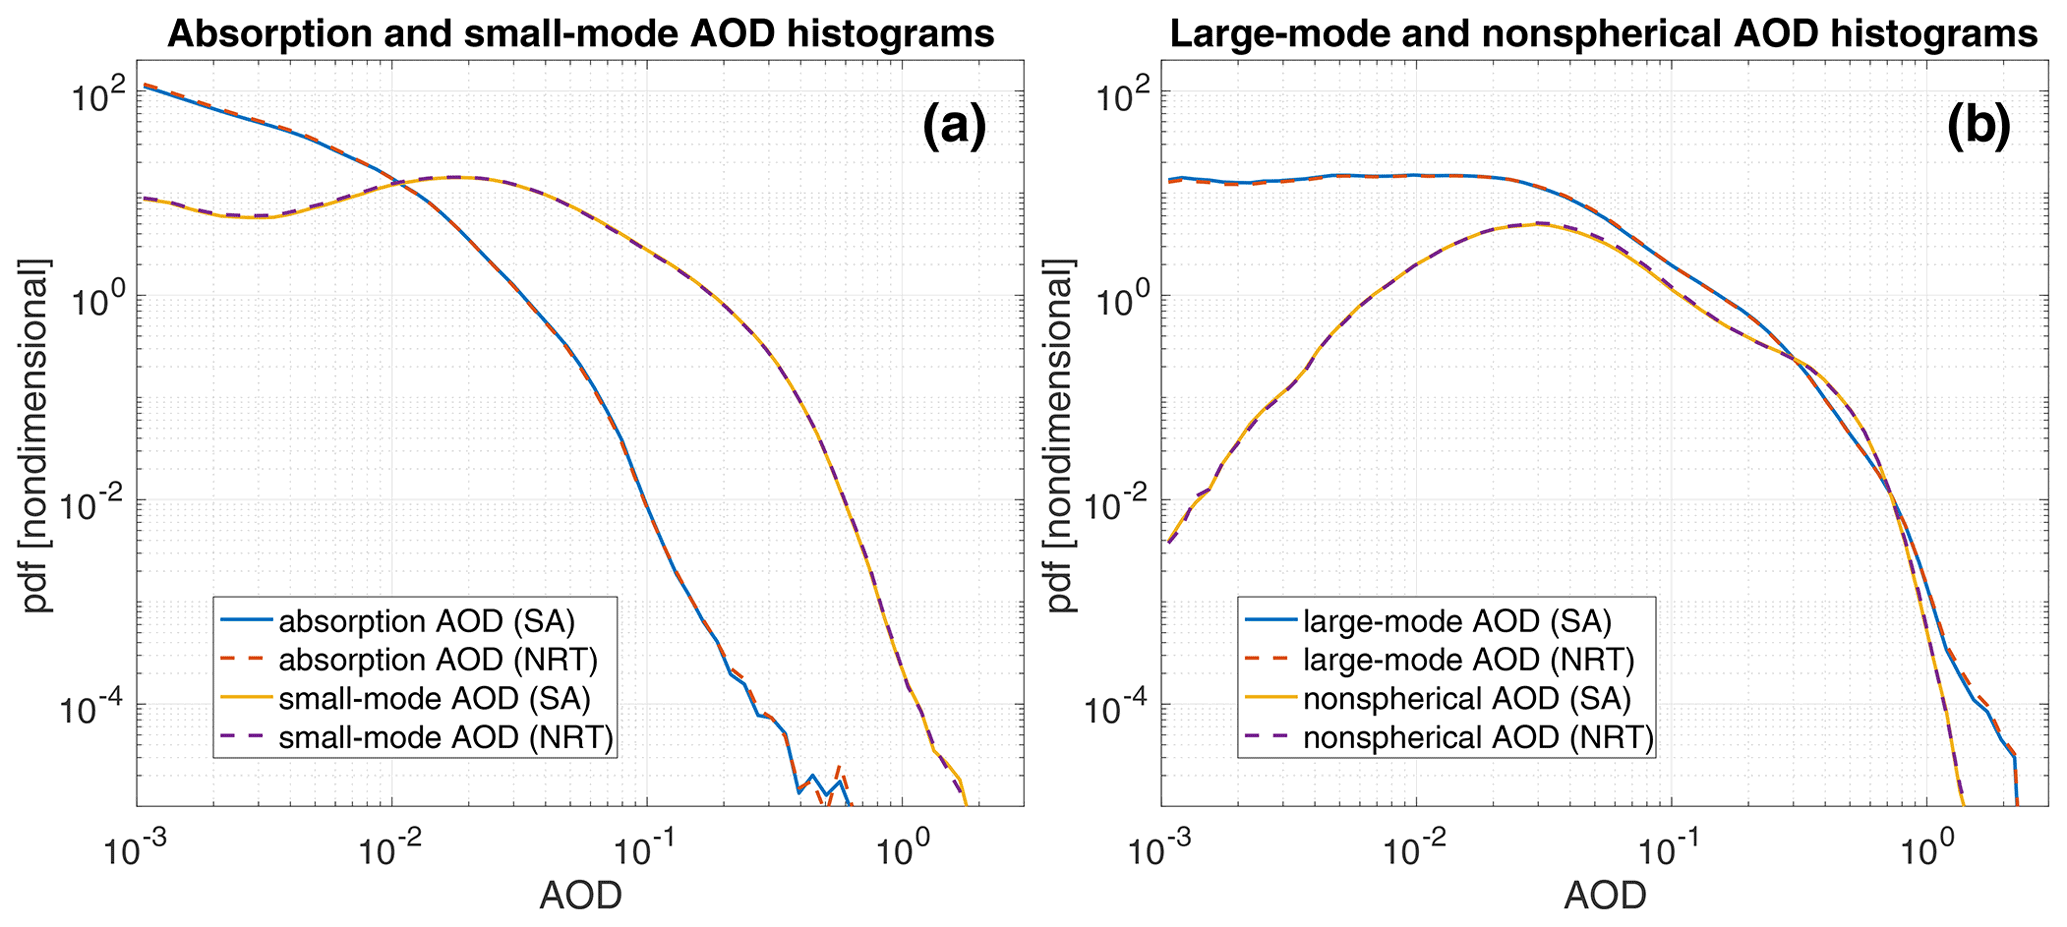
Figure 9Normalized probability density functions for select MISR particle property retrievals in March, April, and May 2020. Solid lines represent SA retrievals and dashed lines represent NRT retrievals. (a) Absorption AOD and small-mode AOD retrievals. (b) Large-mode AOD and nonspherical AOD retrievals. The differences between the SA and NRT products are negligible.
The highest number of retrievals is found over the subtropical continents where the cloud cover is usually the smallest. Over the subtropical oceans in the Southern Hemisphere, the NRT retrieval counts are typically higher than in SA, which results from the absence of upstream cloud classifiers in NRT processing and subsequently fewer subregions being excluded as cloudy. Note that this increase in retrieval count caused by the lack of cloud classifiers is not compensated for by the increased ARCI threshold in NRT processing (ARCI ≥ 0.18), which always reduces the number of retrievals when compared to the default SA threshold (ARCI ≥ 0.15). The lack of hemispheric symmetry in this case is likely due to the seasonal variability (only months in northern spring are analyzed here). Over land, the lack of upstream cloud classifiers also results in a higher number of NRT retrievals in certain regions, but the surface type exclusion rules reverse this pattern, especially at higher latitudes. The conservative cloud logic over snow or ice surfaces in NRT processing often results in the lower number of NRT retrievals in the high latitudes of the Northern Hemisphere.
A metric relevant to the potential use of the NRT product in data assimilation is the retrieval yield per model grid point. The retrieval yield can be measured as, for example, the number of 1∘ × 1∘ grid cells that have at least 15 valid satellite retrievals in them. From this perspective, the NRT product has a retrieval yield that is about 0.7 % higher than the SA product, based on the 3 months of data analyzed in this study.
5.3 Fractional AOD
MISR's multi-angle retrieval approach enables characterization of aerosol optical and microphysical properties, such as fractional AODs associated with particle absorption, nonsphericity, and size (see, e.g., Kahn and Gaitley, 2015). This attribute of the MISR SA product has been applied to many climate and air quality studies and inclusion of this capability in the NRT product would benefit data assimilation for numerical prediction of atmospheric aerosols (Benedetti et al., 2018). Consequently, this section provides preliminary statistical comparisons of the SA and NRT absorption AOD along with small-mode, large-mode, and nonspherical AOD. The results shown in Fig. 9 indicate that the probability density functions of these aerosol properties in the NRT product are statistically equivalent to the SA product. This assessment reaffirms the consistency of the NRT and SA products. Future studies will examine geographic and statistical differences and other particle properties in more detail.
The MISR V23 aerosol product, publicly available since mid-2018, is a high-resolution state-of-the-art data product from NASA's Terra flagship mission. V23 AOD retrievals have remarkable accuracy compared against ground-based observations (Garay et al., 2020; Tao et al., 2020; Witek et al., 2019) and the product is more intuitive and easier to use than previous versions. The product is available within 2 d from satellite overpass as a FIRSTLOOK version and within 3 to 6 months as a final science-quality SA version that employs the most up-to-date ancillary datasets. In response to the needs of operational user communities, a new MISR L2 NRT aerosol product has been developed with a 3 h latency.
The new NRT algorithm does not depend on the upstream cloud classifiers that are generated in L1 and L2 cloud processing. The lack of cloud classifiers is in large part mitigated by the aerosol algorithm's built-in cloud identification methods. Analysis of the prototype NRT product has shown an increased frequency of high-AOD retrievals, especially over oceans and in climatologically cloudy areas, likely due to an increase in cloud contamination. Adjusting the ARCI threshold in DW retrievals proves highly effective at eliminating some of these high-AOD outliers and improves the NRT product's statistical agreement with the SA version. The new NRT aerosol product applies an ARCI threshold of 0.18 to mitigate cloud contamination in the absence of upstream cloud masks in NRT processing. The remaining differences in statistical and geographic distributions between the NRT and SA AODs, which includes information from the L2 cloud product, are small and largely confined to areas with high cloud cover.
The results of this study also serve as an example of the effects of screening threshold adjustments in MISR aerosol retrievals on AOD statistics and distributions. Researchers interested in particular applications and/or specific geographic regions are encouraged to experiment with their own threshold to achieve the most optimal results. The NRT aerosol product contains both the recommended product contained within the main science directory “4.4_KM_PRODUCTS” that has the stricter ARCI threshold (ARCI ≥ 0.18) and the unscreened product without the additional cloud and ARCI filtering designed for more experienced users, located within the AUXILIARY group.
The MISR V23 SA and NRT data are publicly available and can be downloaded from https://asdc.larc.nasa.gov/project/MISR (NASA, 2021). MISR NRT data are not stored permanently and are only available for 3 to 6 months from the time of acquisition; please contact the corresponding author to request the NRT data from the months analyzed in this study.
MLW conceptualized the study, performed the analyses, and prepared the manuscript. MAB processed the initial NRT data and provided technical support. MJG, EGH, and all coauthors assisted with the analyses and provided feedback on the results. Furthermore, AMN, FCS, and DJD contributed to the writing and editing of the manuscript.
The authors declare that they have no conflict of interest.
Publisher’s note: Copernicus Publications remains neutral with regard to jurisdictional claims in published maps and institutional affiliations.
This research was carried out at the Jet Propulsion Laboratory, California Institute of Technology, under a contract with the National Aeronautics and Space Administration. Support from the MISR project is acknowledged. Special thanks to Andrew Sayer, Jeffrey Reid, and one anonymous reviewer for carefully reading the manuscript and providing valuable comments. We would also like to thank Ralph Kahn for providing feedback on the manuscript.
This research has been supported by the Jet Propulsion Laboratory (MISR project).
This paper was edited by Thomas Eck and reviewed by Andrew Sayer, Jeffrey Reid, and one anonymous referee.
Ackerman, S., Richard, F., Kathleen, S., Yinghui, L., Liam, G., Bryan, B., and Paul, M.: Discriminating clear-sky from cloud with MODIS algorithm theoretical basis document (MOD35), Univ. Wisconsin – Madison, 6th Edn. (October), 129, available at: http://citeseerx.ist.psu.edu/viewdoc/summary?doi=10.1.1.385.4885 (last access: 6 August 2021), 2010.
Benedetti, A., Reid, J. S., and Colarco, P. R.: International cooperative for aerosol prediction workshop on aerosol forecast verification, B. Am. Meteorol. Soc., 92, ES48–ES53, https://doi.org/10.1175/BAMS-D-11-00105.1, 2011.
Benedetti, A., Reid, J. S., Knippertz, P., Marsham, J. H., Di Giuseppe, F., Rémy, S., Basart, S., Boucher, O., Brooks, I. M., Menut, L., Mona, L., Laj, P., Pappalardo, G., Wiedensohler, A., Baklanov, A., Brooks, M., Colarco, P. R., Cuevas, E., da Silva, A., Escribano, J., Flemming, J., Huneeus, N., Jorba, O., Kazadzis, S., Kinne, S., Popp, T., Quinn, P. K., Sekiyama, T. T., Tanaka, T., and Terradellas, E.: Status and future of numerical atmospheric aerosol prediction with a focus on data requirements, Atmos. Chem. Phys., 18, 10615–10643, https://doi.org/10.5194/acp-18-10615-2018, 2018.
Bocquet, M., Elbern, H., Eskes, H., Hirtl, M., Žabkar, R., Carmichael, G. R., Flemming, J., Inness, A., Pagowski, M., Pérez Camaño, J. L., Saide, P. E., San Jose, R., Sofiev, M., Vira, J., Baklanov, A., Carnevale, C., Grell, G., and Seigneur, C.: Data assimilation in atmospheric chemistry models: current status and future prospects for coupled chemistry meteorology models, Atmos. Chem. Phys., 15, 5325–5358, https://doi.org/10.5194/acp-15-5325-2015, 2015.
Buchard, V., da Silva, A. M., Colarco, P. R., Darmenov, A., Randles, C. A., Govindaraju, R., Torres, O., Campbell, J., and Spurr, R.: Using the OMI aerosol index and absorption aerosol optical depth to evaluate the NASA MERRA Aerosol Reanalysis, Atmos. Chem. Phys., 15, 5743–5760, https://doi.org/10.5194/acp-15-5743-2015, 2015.
Buchard, V., Randles, C. A., da Silva, A. M., Darmenov, A., Colarco, P. R., Govindaraju, R., Ferrare, R., Hair, J., Beyersdorf, A. J., Ziemba, L. D., and Yu, H.: The MERRA-2 aerosol reanalysis, 1980 onward. Part II: Evaluation and case studies, J. Climate, 30, 6851–6872, https://doi.org/10.1175/JCLI-D-16-0613.1, 2017.
Butz, A., Hasekamp, O. P., Frankenberg, C., and Aben, U.: Retrievals of atmospheric CO2 from simulated space-borne measurements of backscattered near-infrared sunlight: Accounting for aerosol effects, Appl. Optics, 48, 3322–3336, https://doi.org/10.1364/AO.48.003322, 2009.
Choi, M., Lim, H., Kim, J., Lee, S., Eck, T. F., Holben, B. N., Garay, M. J., Hyer, E. J., Saide, P. E., and Liu, H.: Validation, comparison, and integration of GOCI, AHI, MODIS, MISR, and VIIRS aerosol optical depth over East Asia during the 2016 KORUS-AQ campaign, Atmos. Meas. Tech., 12, 4619–4641, https://doi.org/10.5194/amt-12-4619-2019, 2019.
Colarco, P., Da Silva, A., Chin, M., and Diehl, T.: Online simulations of global aerosol distributions in the NASA GEOS-4 model and comparisons to satellite and ground-based aerosol optical depth, J. Geophys. Res.-Atmos., 115, D14207, https://doi.org/10.1029/2009JD012820, 2010.
Di Girolamo, L. and Davies, R.: A Band-Differenced Angular Signature Technique for Cirrus Cloud Detection, IEEE T. Geosci. Remote, 32, 890–896, https://doi.org/10.1109/36.298017, 1994.
Di Girolamo, L. and Davies, R.: The Image Navigation Cloud Mask for the Multiangle Imaging Spectroradiometer (MISR), J. Atmos. Ocean. Technol., 12, 1215–1228, https://doi.org/10.1175/1520-0426(1995)012<1215:tincmf>2.0.co;2, 1995.
Diner, D. J., Beckert, J. C., Reilly, T. H., Bruegge, C. J., Conel, J. E., Kahn, R. A., Martonchik, J. V., Ackerman, T. P., Davies, R., Gerstl, S. A. W., Gordon, H. R., Muller, J. P., Myneni, R. B., Sellers, P. J., Pinty, B., and Verstraete, M. M.: Multiangle Image Spectroradiometer (MISR) instrument description and experiment overview, IEEE T. Geosci. Remote, 36, 1072–1087, 1998.
Diner, D. J., Di Girolamo, L., and Clothiaux, E. E.: Level 1 Cloud Detection Algorithm Theoretical Basis, Jet Propuls. Lab. Calif. Inst. Technol., D-13397 (Rev. B), available at: https://eospso.gsfc.nasa.gov/sites/default/files/atbd/atbd-misr-06.pdf (last access: 9 August 2021), 1999a.
Diner, D. J., Davies, R., Di Girolamo, L., Horvath, A., Moroney, C., Muller, J. P., Paradise, S. R., Wenkert, D., and Zong, J.: Level 2 Cloud Detection and Classification Algorithm Theoretical Basis, Jet Propuls. Lab. Calif. Inst. Technol., D-11399 (Rev. D), available at: https://eospso.gsfc.nasa.gov/sites/default/files/atbd/atbd-misr-07.pdf (last access: 9 August 2021), 1999b.
Diner, D. J., Abdou, W. A., Ackerman, T. P., Crean, K., Gordon, H. R., Kahn, R. A., Martonchik, J. V, McMuldroch, S., Paradise, S. R., and Pinty, B.: Level 2 aerosol retrieval algorithm theoretical basis, Jet Propuls. Lab. Calif. Inst. Technol., D-11400 (Rev. G), available at: https://eospso.gsfc.nasa.gov/sites/default/files/atbd/atbd-misr-09.pdf (last access: 9 August 2021), 2008.
Di Tomaso, E., Schutgens, N. A. J., Jorba, O., and Pérez García-Pando, C.: Assimilation of MODIS Dark Target and Deep Blue observations in the dust aerosol component of NMMB-MONARCH version 1.0, Geosci. Model Dev., 10, 1107–1129, https://doi.org/10.5194/gmd-10-1107-2017, 2017.
Frankenberg, C., Hasekamp, O., O'Dell, C., Sanghavi, S., Butz, A., and Worden, J.: Aerosol information content analysis of multi-angle high spectral resolution measurements and its benefit for high accuracy greenhouse gas retrievals, Atmos. Meas. Tech., 5, 1809–1821, https://doi.org/10.5194/amt-5-1809-2012, 2012.
Frouin, R. J., Franz, B. A., Ibrahim, A., Knobelspiesse, K., Ahmad, Z., Cairns, B., Chowdhary, J., Dierssen, H. M., Tan, J., Dubovik, O., Huang, X., Davis, A. B., Kalashnikova, O., Thompson, D. R., Remer, L. A., Boss, E., Coddington, O., Deschamps, P. Y., Gao, B. C., Gross, L., Hasekamp, O., Omar, A., Pelletier, B., Ramon, D., Steinmetz, F., and Zhai, P. W.: Atmospheric Correction of Satellite Ocean-Color Imagery During the PACE Era, Front. Earth Sci., 7, 145, https://doi.org/10.3389/feart.2019.00145, 2019.
Fu, G., Prata, F., Lin, H. X., Heemink, A., Segers, A., and Lu, S.: Data assimilation for volcanic ash plumes using a satellite observational operator: a case study on the 2010 Eyjafjallajökull volcanic eruption, Atmos. Chem. Phys., 17, 1187–1205, https://doi.org/10.5194/acp-17-1187-2017, 2017.
Gao, B. C., Goetz, A. F. H., and Wiscombe, W. J.: Cirrus cloud detection from Airborne Imaging Spectrometer data using the 1.38 µm water vapor band, Geophys. Res. Lett., 20, 301–304, https://doi.org/10.1029/93GL00106, 1993.
Garay, M. J., Witek, M. L., Kahn, R. A., Seidel, F. C., Limbacher, J. A., Bull, M. A., Diner, D. J., Hansen, E. G., Kalashnikova, O. V., Lee, H., Nastan, A. M., and Yu, Y.: Introducing the 4.4 km spatial resolution Multi-Angle Imaging SpectroRadiometer (MISR) aerosol product, Atmos. Meas. Tech., 13, 593–628, https://doi.org/10.5194/amt-13-593-2020, 2020.
Gelaro, R., McCarty, W., Suárez, M. J., Todling, R., Molod, A., Takacs, L., Randles, C. A., Darmenov, A., Bosilovich, M. G., Reichle, R., Wargan, K., Coy, L., Cullather, R., Draper, C., Akella, S., Buchard, V., Conaty, A., da Silva, A. M., Gu, W., Kim, G. K., Koster, R., Lucchesi, R., Merkova, D., Nielsen, J. E., Partyka, G., Pawson, S., Putman, W., Rienecker, M., Schubert, S. D., Sienkiewicz, M., and Zhao, B.: The modern-era retrospective analysis for research and applications, version 2 (MERRA-2), J. Climate, 30, 5419–5454, https://doi.org/10.1175/JCLI-D-16-0758.1, 2017.
Gordon, R.: Atmospheric correction of ocean color imagery in the Earth Observing System era, J. Geophys. Res.-Atmos., 102, 17081–17106, https://doi.org/10.1029/96JD02443, 1997.
Houweling, S., Hartmann, W., Aben, I., Schrijver, H., Skidmore, J., Roelofs, G.-J., and Breon, F.-M.: Evidence of systematic errors in SCIAMACHY-observed CO2 due to aerosols, Atmos. Chem. Phys., 5, 3003–3013, https://doi.org/10.5194/acp-5-3003-2005, 2005.
Inness, A., Baier, F., Benedetti, A., Bouarar, I., Chabrillat, S., Clark, H., Clerbaux, C., Coheur, P., Engelen, R. J., Errera, Q., Flemming, J., George, M., Granier, C., Hadji-Lazaro, J., Huijnen, V., Hurtmans, D., Jones, L., Kaiser, J. W., Kapsomenakis, J., Lefever, K., Leitão, J., Razinger, M., Richter, A., Schultz, M. G., Simmons, A. J., Suttie, M., Stein, O., Thépaut, J.-N., Thouret, V., Vrekoussis, M., Zerefos, C., and the MACC team: The MACC reanalysis: an 8 yr data set of atmospheric composition, Atmos. Chem. Phys., 13, 4073–4109, https://doi.org/10.5194/acp-13-4073-2013, 2013.
Inness, A., Ades, M., Agustí-Panareda, A., Barré, J., Benedictow, A., Blechschmidt, A.-M., Dominguez, J. J., Engelen, R., Eskes, H., Flemming, J., Huijnen, V., Jones, L., Kipling, Z., Massart, S., Parrington, M., Peuch, V.-H., Razinger, M., Remy, S., Schulz, M., and Suttie, M.: The CAMS reanalysis of atmospheric composition, Atmos. Chem. Phys., 19, 3515–3556, https://doi.org/10.5194/acp-19-3515-2019, 2019.
IPCC: Climate Change 2013: The Physical Science Basis, Contribution of Working Group I to the Fifth Assessment Report of the Intergovernmental Panel on Climate Change, edited by: Stocker, T. F., Qin, D., Plattner, G. K., Tignor, M. M. B., Allen, S. K., Boschung, J., Nauels, A., Xia, Y., Bex, V., and Midgley, P. M., Cambridge University Press, Cambridge, United Kingdom and New York, NY, USA, 2013.
Kahn, R. A. and Gaitley, B. J.: An analysis of global aerosol type as retrieved by MISR, J. Geophys. Res.-Atmos., 120, 4248–4281, https://doi.org/10.1002/2015JD023322, 2015.
Kahn, R. A., Gaitley, B. J., Garay, M. J., Diner, D. J., Eck, T. F., Smirnov, A., and Holben, B. N.: Multiangle Imaging SpectroRadiometer global aerosol product assessment by comparison with the Aerosol Robotic Network, J. Geophys. Res.-Atmos., 115, D23209, https://doi.org/10.1029/2010JD014601, 2010.
Kalashnikova, O. V., Garay, M. J., Martonchik, J. V., and Diner, D. J.: MISR Dark Water aerosol retrievals: operational algorithm sensitivity to particle non-sphericity, Atmos. Meas. Tech., 6, 2131–2154, https://doi.org/10.5194/amt-6-2131-2013, 2013.
Lamarque, J.-F., Shindell, D. T., Josse, B., Young, P. J., Cionni, I., Eyring, V., Bergmann, D., Cameron-Smith, P., Collins, W. J., Doherty, R., Dalsoren, S., Faluvegi, G., Folberth, G., Ghan, S. J., Horowitz, L. W., Lee, Y. H., MacKenzie, I. A., Nagashima, T., Naik, V., Plummer, D., Righi, M., Rumbold, S. T., Schulz, M., Skeie, R. B., Stevenson, D. S., Strode, S., Sudo, K., Szopa, S., Voulgarakis, A., and Zeng, G.: The Atmospheric Chemistry and Climate Model Intercomparison Project (ACCMIP): overview and description of models, simulations and climate diagnostics, Geosci. Model Dev., 6, 179–206, https://doi.org/10.5194/gmd-6-179-2013, 2013.
Lelieveld, J., Evans, J. S., Fnais, M., Giannadaki, D., and Pozzer, A.: The contribution of outdoor air pollution sources to premature mortality on a global scale, Nature, 525, 367–371, https://doi.org/10.1038/nature15371, 2015.
Levy, R. C., Mattoo, S., Munchak, L. A., Remer, L. A., Sayer, A. M., Patadia, F., and Hsu, N. C.: The Collection 6 MODIS aerosol products over land and ocean, Atmos. Meas. Tech., 6, 2989–3034, https://doi.org/10.5194/amt-6-2989-2013, 2013.
Liu, M., Westphal, D. L., Walker, A. L., Holt, T. R., Richardson, K. A., and Miller, S. D.: COAMPS real-time dust storm forecasting during operation Iraqi freedom, Weather Forecast., 22, 192–206, https://doi.org/10.1175/WAF971.1, 2007.
Lynch, P., Reid, J. S., Westphal, D. L., Zhang, J., Hogan, T. F., Hyer, E. J., Curtis, C. A., Hegg, D. A., Shi, Y., Campbell, J. R., Rubin, J. I., Sessions, W. R., Turk, F. J., and Walker, A. L.: An 11-year global gridded aerosol optical thickness reanalysis (v1.0) for atmospheric and climate sciences, Geosci. Model Dev., 9, 1489–1522, https://doi.org/10.5194/gmd-9-1489-2016, 2016.
Martonchik, J. V., Diner, D. J., Crean, K. A., and Bull, M. A.: Regional aerosol retrieval results from MISR, IEEE T. Geosci. Remote, 40, 1520–1531, https://doi.org/10.1109/TGRS.2002.801142, 2002.
Martonchik, J. V., Kahn, R. A., and Diner, D. J.: Retrieval of aerosol properties over land using MISR observations, in Satellite Aerosol Remote Sensing over Land, edited by: Kokhanovsky, A. A. and de Leeuw, G., Springer, Berlin, Heidelberg, pp. 267–293, 2009.
NASA: Multi-angle Imaging SpectroRadiometer, NASA [data set], available at: https://asdc.larc.nasa.gov/project/MISR, last access: 6 August 2021.
Randles, C. A., da Silva, A. M., Buchard, V., Colarco, P. R., Darmenov, A., Govindaraju, R., Smirnov, A., Holben, B., Ferrare, R., Hair, J., Shinozuka, Y., and Flynn, C. J.: The MERRA-2 aerosol reanalysis, 1980 onward. Part I: System description and data assimilation evaluation, J. Climate, 30, 6823–6850, https://doi.org/10.1175/JCLI-D-16-0609.1, 2017.
Reid, J. S., Benedetti, A., Colarco, P. R., and Hansen, J. A.: International operational aerosol observability workshop, B. Am. Meteorol. Soc., 92, ES21–ES24, 2011.
Rienecker, M. M., Suarez, M. J., Gelaro, R., Todling, R., Bacmeister, J., Liu, E., Bosilovich, M. G., Schubert, S. D., Takacs, L., Kim, G. K., Bloom, S., Chen, J., Collins, D., Conaty, A., Da Silva, A., Gu, W., Joiner, J., Koster, R. D., Lucchesi, R., Molod, A., Owens, T., Pawson, S., Pegion, P., Redder, C. R., Reichle, R., Robertson, F. R., Ruddick, A. G., Sienkiewicz, M., and Woollen, J.: MERRA: NASA's modern-era retrospective analysis for research and applications, J. Climate, 24, 3624–3648, https://doi.org/10.1175/JCLI-D-11-00015.1, 2011.
Sayer, A. M. and Knobelspiesse, K. D.: How should we aggregate data? Methods accounting for the numerical distributions, with an assessment of aerosol optical depth, Atmos. Chem. Phys., 19, 15023–15048, https://doi.org/10.5194/acp-19-15023-2019, 2019.
Sayer, A. M., Govaerts, Y., Kolmonen, P., Lipponen, A., Luffarelli, M., Mielonen, T., Patadia, F., Popp, T., Povey, A. C., Stebel, K., and Witek, M. L.: A review and framework for the evaluation of pixel-level uncertainty estimates in satellite aerosol remote sensing, Atmos. Meas. Tech., 13, 373–404, https://doi.org/10.5194/amt-13-373-2020, 2020.
Sekiyama, T. T., Tanaka, T. Y., Shimizu, A., and Miyoshi, T.: Data assimilation of CALIPSO aerosol observations, Atmos. Chem. Phys., 10, 39–49, https://doi.org/10.5194/acp-10-39-2010, 2010.
Shi, Y., Zhang, J., Reid, J. S., Holben, B., Hyer, E. J., and Curtis, C.: An analysis of the collection 5 MODIS over-ocean aerosol optical depth product for its implication in aerosol assimilation, Atmos. Chem. Phys., 11, 557–565, https://doi.org/10.5194/acp-11-557-2011, 2011.
Shi, Y., Zhang, J., Reid, J. S., Hyer, E. J., and Hsu, N. C.: Critical evaluation of the MODIS Deep Blue aerosol optical depth product for data assimilation over North Africa, Atmos. Meas. Tech., 6, 949–969, https://doi.org/10.5194/amt-6-949-2013, 2013.
Shi, Y., Zhang, J., Reid, J. S., Liu, B., and Hyer, E. J.: Critical evaluation of cloud contamination in the MISR aerosol products using MODIS cloud mask products, Atmos. Meas. Tech., 7, 1791–1801, https://doi.org/10.5194/amt-7-1791-2014, 2014.
Shindell, D. T., Lamarque, J.-F., Schulz, M., Flanner, M., Jiao, C., Chin, M., Young, P. J., Lee, Y. H., Rotstayn, L., Mahowald, N., Milly, G., Faluvegi, G., Balkanski, Y., Collins, W. J., Conley, A. J., Dalsoren, S., Easter, R., Ghan, S., Horowitz, L., Liu, X., Myhre, G., Nagashima, T., Naik, V., Rumbold, S. T., Skeie, R., Sudo, K., Szopa, S., Takemura, T., Voulgarakis, A., Yoon, J.-H., and Lo, F.: Radiative forcing in the ACCMIP historical and future climate simulations, Atmos. Chem. Phys., 13, 2939–2974, https://doi.org/10.5194/acp-13-2939-2013, 2013.
Si, Y., Chen, L., Xiong, X., Shi, S., Husi, L., and Cai, K.: Evaluation of the MISR fine resolution aerosol product using MODIS, MISR, and ground observations over China, Atmos. Environ., 223, 117229, https://doi.org/10.1016/j.atmosenv.2019.117229, 2020.
Sogacheva, L., Popp, T., Sayer, A. M., Dubovik, O., Garay, M. J., Heckel, A., Hsu, N. C., Jethva, H., Kahn, R. A., Kolmonen, P., Kosmale, M., de Leeuw, G., Levy, R. C., Litvinov, P., Lyapustin, A., North, P., Torres, O., and Arola, A.: Merging regional and global aerosol optical depth records from major available satellite products, Atmos. Chem. Phys., 20, 2031–2056, https://doi.org/10.5194/acp-20-2031-2020, 2020.
Tao, M., Wang, J., Li, R., Chen, L., Xu, X., Wang, L., Tao, J., Wang, Z., and Xiang, J.: Characterization of Aerosol Type Over East Asia by 4.4 km MISR Product: First Insight and General Performance, J. Geophys. Res.-Atmos., 125, e2019JD031909, https://doi.org/10.1029/2019JD031909, 2020.
Turnock, S. T., Allen, R. J., Andrews, M., Bauer, S. E., Deushi, M., Emmons, L., Good, P., Horowitz, L., John, J. G., Michou, M., Nabat, P., Naik, V., Neubauer, D., O'Connor, F. M., Olivié, D., Oshima, N., Schulz, M., Sellar, A., Shim, S., Takemura, T., Tilmes, S., Tsigaridis, K., Wu, T., and Zhang, J.: Historical and future changes in air pollutants from CMIP6 models, Atmos. Chem. Phys., 20, 14547–14579, https://doi.org/10.5194/acp-20-14547-2020, 2020.
Werner, M., Kryza, M., and Guzikowski, J.: Can data assimilation of surface PM2.5 and Satellite AOD improve WRF-Chem Forecasting? A case study for two scenarios of particulate air pollution episodes in Poland, Remote Sens., 11, 2364, https://doi.org/10.3390/rs11202364, 2019.
Witek, M. L., Garay, M. J., Diner, D. J., and Smirnov, A.: Aerosol optical depths over oceans: A view from MISR retrievals and collocated MAN and AERONET in situ observations, J. Geophys. Res.-Atmos., 118, 12620–12633, https://doi.org/10.1002/2013JD020393, 2013.
Witek, M. L., Diner, D. J., Garay, M. J., Xu, F., Bull, M. A., and Seidel, F. C.: Improving MISR AOD Retrievals with Low-Light-Level Corrections for Veiling Light, IEEE T. Geosci. Remote, 56, 1251–1268, https://doi.org/10.1109/TGRS.2017.2727342, 2018a.
Witek, M. L., Garay, M. J., Diner, D. J., Bull, M. A., and Seidel, F. C.: New approach to the retrieval of AOD and its uncertainty from MISR observations over dark water, Atmos. Meas. Tech., 11, 429–439, https://doi.org/10.5194/amt-11-429-2018, 2018b.
Witek, M. L., Garay, M. J., Diner, D. J., and Smirnov, A.: Oceanic Aerosol Loading Derived From MISR's 4.4 km (V23) Aerosol Product, J. Geophys. Res.-Atmos., 124, 10154–10174, https://doi.org/10.1029/2019JD031065, 2019.
Xian, P., Reid, J. S., Hyer, E. J., Sampson, C. R., Rubin, J. I., Ades, M., Asencio, N., Basart, S., Benedetti, A., Bhattacharjee, P. S., Brooks, M. E., Colarco, P. R., da Silva, A. M., Eck, T. F., Guth, J., Jorba, O., Kouznetsov, R., Kipling, Z., Sofiev, M., Perez Garcia-Pando, C., Pradhan, Y., Tanaka, T., Wang, J., Westphal, D. L., Yumimoto, K., and Zhang, J.: Current state of the global operational aerosol multi-model ensemble: An update from the International Cooperative for Aerosol Prediction (ICAP), Q. J. Roy. Meteor. Soc., 145, 176–209, https://doi.org/10.1002/qj.3497, 2019.
Zhang, J. and Reid, J. S.: An analysis of clear sky and contextual biases using an operational over ocean MODIS aerosol product, Geophys. Res. Lett., 36, L15824, https://doi.org/10.1029/2009GL038723, 2009.
Zhang, J. and Reid, J. S.: A decadal regional and global trend analysis of the aerosol optical depth using a data-assimilation grade over-water MODIS and Level 2 MISR aerosol products, Atmos. Chem. Phys., 10, 10949–10963, https://doi.org/10.5194/acp-10-10949-2010, 2010.
Zhang, J., Reid, J. S., Westphal, D. L., Baker, N. L., and Hyer, E. J.: A system for operational aerosol optical depth data assimilation over global oceans, J. Geophys. Res.-Atmos., 113, D10208, https://doi.org/10.1029/2007JD009065, 2008.
- Abstract
- Copyright statement
- Introduction
- MISR instrument and aerosol data product
- NRT latency and data description
- Cloud screening in the NRT MISR aerosol product
- NRT and SA product comparisons
- Summary
- Data availability
- Author contributions
- Competing interests
- Disclaimer
- Acknowledgements
- Financial support
- Review statement
- References