the Creative Commons Attribution 4.0 License.
the Creative Commons Attribution 4.0 License.
 | 04 May 2022
Quantification of major particulate matter species from a single filter type using infrared spectroscopy – application to a large-scale monitoring network
Bruno Debus
Andrew T. Weakley
Satoshi Takahama
Kathryn M. George
Anahita Amiri-Farahani
Bret Schichtel
Scott Copeland
Anthony S. Wexler
Ann M. Dillner
To enable chemical speciation, monitoring networks collect particulate matter (PM) on different filter media, each subjected to one or more analytical techniques to quantify PM composition present in the atmosphere. In this work, we propose an alternate approach that uses one filter type (teflon or polytetrafluoroethylene, PTFE, commonly used for aerosol sampling) and one analytical method, Fourier transform infrared (FT-IR) spectroscopy to measure almost all of the major constituents in the aerosol. In the proposed method, measurements using the typical multi-filter, multi-analytical techniques are retained at a limited number of sites and used as calibration standards. At all remaining sites, only sampling on PTFE and analysis by FT-IR is performed. This method takes advantage of the sensitivity of the mid-IR domain to various organic and inorganic functional groups and offers a fast and inexpensive way of exploring sample composition. As a proof of concept, multiple years of samples collected within the Interagency Monitoring of PROtected Visual Environment network (IMPROVE) are explored with the aim of retaining high quality predictions for a broad range of atmospheric compounds including mass, organic (OC), elemental (EC), and total (TC) carbon, sulfate, nitrate, and crustal elements. Findings suggest that models based on only 21 sites, covering spatial and seasonal trends in atmospheric composition, are stable over a 3 year period within the IMPROVE network with acceptable prediction accuracy (R2 > 0.9, median bias less than 3 %) for most constituents. The major limitation is measuring nitrate as it is known to volatilize off of PTFE filters. Incorporating additional sites at low cost, partially replacing existing, more time- and cost-intensive techniques, or using the FT-IR data for quality control or substitute for missing data, are among the potential benefits of the one-filter, one-method approach.
- Article
(3224 KB) - Full-text XML
-
Supplement
(32814 KB) - BibTeX
- EndNote


In the United States, filter-based chemical speciation of ambient aerosols has been in operation for decades to quantify trends, assess transport and atmospheric transformation, identify sources of air pollution, evaluate impacts of pollution regulations, assess impacts on visibility, radiative forcing, human and ecosystem health, and evaluate atmospheric and climatological models. The two federally funded speciation networks, the Interagency Monitoring of PROtected Visual Environments (IMPROVE) and the Chemical Speciation Network (CSN) collect 24 h filter samples using three filter media: polytetrafluoroethylene (PTFE) for analysis by gravimetry, X-ray fluorescence (XRF) and hybrid integrating plate and sphere (HIPS), quartz for thermal optical reflectance (TOR), and nylon for ion chromatography. Over the decades of operation, the analytical methods have evolved with efforts to maintain consistency in trends while also adopting improved methodology and retiring obsolete equipment. Impacts of many of these changes have been addressed in the literature (Hyslop et al., 2015, 2012; White et al., 2016; Zhang et al., 2021; Chow et al., 2007, 2015) and in data advisories posted on the IMPROVE website (http://vista.cira.colostate.edu/Improve/data-advisories/, last access: 31 July 2021).
In this paper, we explore the use of Fourier transform-infrared spectroscopy (FT-IR) to reproduce most of the existing speciation data based on the optical activity of the components in the mid-IR. The number and bands of organic compounds are numerous, but generally group frequencies can be found above 1500 cm−1 and compound-specific spectral patterns (“fingerprint region”) below this frequency; down to approximately 700 cm−1 (for example, Weakley et al., 2016; Mayo et al., 2004). Graphitic carbon displays peaks near 1600 cm−1 due to lattice defects (Tuinstra and Koenig, 1970; Friedel and Carlson, 1971), displacement vibrations near 868 cm−1 (Nemanich et al., 1977), and a broad, sloping absorbance between 4000 and 1500 cm−1 due to the tail of the electronic transition more strongly observed in the UV (Parks et al., 2021). Inorganic substances containing polyatomic ions such as sulfate, nitrate, and ammonium have strong vibrational modes above 600 cm−1 (Mayo et al., 2004). Crystalline and amorphous geological minerals in the form of oxides (which include hydroxides and oxyhydroxides) have distinct internal vibrational modes influenced by the electronegativity of the metal to which the oxygen is bonded (Busca and Resini, 2006; Chukanov and Chervonnyi, 2016; Margenot et al., 2017).
FT-IR spectra with partial least squares (PLS) calibrations have been shown to reproduce OC and EC concentrations using organic and graphitic carbon absorption bands, respectively, at a limited number of sites in the IMPROVE network (Dillner and Takahama, 2015a, b; Reggente et al., 2016), CSN (Weakley et al., 2016, 2018a) and FRM network (Weakley et al., 2018b). Takahama et al. (2019) reviewed these findings and the overall framework to be used for the two phases of such statistical calibrations: model building (sample selection, spectral preparation, model generation, model selection, model evaluation, and model understanding) and operation (error anticipation and model updating). Inorganic ions and geological mineral absorption bands have been used for chemical speciation of these substances using FT-IR in prior studies (e.g., Cunningham et al., 1974; McClenny et al., 1985; Pollard et al., 1990; Bogard et al., 1982; Foster and Walker, 1984).
Organic absorption bands are useful for measuring OC but also provide spectral information needed to add detailed knowledge of composition not currently measured in air quality monitoring networks – such as organic matter (OM) and organic functional group composition – which is the subject of other work (Reggente et al., 2019; Boris et al., 2019, 2021; Bürki et al., 2020). Such calibrations, also combined with factor analytic approaches, can provide source characterization on par with more costly mass spectrometric techniques (Boris et al., 2021; Yazdani et al., 2021a; Hawkins et al., 2010; Takahama et al., 2011; Liu et al., 2012; Corrigan et al., 2013).
Although FT-IR shows promise for measuring many constituents in aerosol, it is not without its challenges. One limitation is that not all PM constituents can be measured, or measured with high sensitivity, from the FT-IR spectrum. For instance, NaCl and MgCl2 do not have IR-active substituents. While a multitude of spectral signatures associated with mineral dust arise from their constituent bonds, for example, the metal–oxygen bonds in oxides (the oxide form is explicitly assumed in estimating dust mass concentrations from elemental composition for the IMPROVE network), some must be predicted from correlation with other constituents (e.g., some forms of iron) if IR-activity is lacking. Other substances are IR-active but have weak responses, such as graphitic carbon (Niyogi et al., 2006; Parks et al., 2021). The absorption and scattering by the PTFE filter also pose challenges for quantitative analysis. The PTFE-based material changes over time due to change in manufacturer or manufacturing process, and is difficult to fully characterize a priori or treat with simple blank subtraction techniques. PTFE absorption limits full access to the range of spectroscopic information in the mid-IR, for instance in the region of carbon–oxygen bonds that can lead to less than full recovery of OM mass. Additionally, scattering leads to broadly varying slope in the group frequency region. This scattering artifact is minimized by baselining (Kuzmiakova et al., 2016) and using many standards that have a range of scattering and absorption observed in the network (Debus et al., 2019), yet these techniques can still lead to errors in quantification. Weakley et al. (2018b) demonstrated that calibrations built using one brand of filter can be accurately extended to another brand of PTFE filter with numerically marginal but statistically significant increase in method error (e.g., +2 % error for α=0.05). However, these studies are insufficient to generalize findings to all types of sampling filters.
The goal of this work is to assess the capability of using FT-IR to measure the aerosol chemical composition at all IMPROVE sites. FT-IR quickly and non-destructively collects information-rich spectra from routinely collected PTFE filter samples. Ambient samples from strategically selected IMPROVE sites are used for calibration and reasonably mimic the composition, matrix effects and substrates of the unknowns, all of which theoretically lead to accurate estimations of concentrations. Using all samples from selected sites reduces maintenance, shipping, processing, and coordinating required to maintain intermittent quartz and nylon filter sampling at every site. Sites are selected using data from 2015 and are used for calibrating samples from 2015–2017. Samples from all other (non-calibration) IMPROVE sites are predicted and compared to routine IMPROVE data to assess the quality of prediction. Aerosol components to be measured include TC, OC, EC, inorganic ions, soil elements, particulate mass, and light absorption.
2.1 Network data
IMPROVE samples collected every third day at all North American sites (Sect. S1 in the Supplement) from January 2015 through December 2017 are included in this study. Fine particulate matter (aerodynamic diameter less than 2.5 µm) is deposited on 25 mm diameter filters polytetrafluoroethylene (PTFE, Teflo, Pall Gelman) and quartz filters by sampling air at a nominal flow rate of 22.8 L min−1 from midnight to midnight local time. Parallel 37 mm nylon filters are collected at the same flow flow rate. PTFE filters are analyzed by multiple instruments and archived for future analysis. Nylon filters and a portion of each quartz filter undergoes destructive analysis and the remaining part of the quartz filters are retained for archive.
Over the period covered in this study, two different TOR instruments were employed to measure OC, EC, and TC. Quartz filters sampled prior to 2016 were analyzed on a DRI Model 2001 thermal optical carbon analyzers (Chow et al., 1993) while filters collected beginning in January of 2016 were analyzed on a DRI Model 2015 multi-wavelength thermal optical carbon instrument (Magee Scientific, Berkley, USA) (Chow et al., 2015). Both instruments use the IMPROVE_A protocol (Chow et al., 2007), which outlines the temperature step, gaseous environment in the instrument and that reflectance is used to define the split point between OC and EC. To correct for gas phase adsorption onto the quartz filter, the monthly median field blank OC concentration is subtracted from each OC measurement during that sample month. Carbon concentrations are reported in µg m−3.
An in-house Hybrid Integrating Plate and Sphere (HIPS) system evaluates light absorption from the PTFE filters in the IMPROVE network (White et al., 2016). In this work, the measured absorption coefficient (Fabs) is converted into a TOR EC equivalent concentration assuming a Fabs EC ratio of 10 m2 g−1 (Malm et al., 1994). The resulting value, referred to as HIPS Black Carbon (HIPS BC), is used as part of a quality control procedure to evaluate potential outliers in TOR EC measurements.
Data from gravimetry and X-ray fluorescence (XRF) analysis obtained from PTFE filters and ion chromatography from the nylon filters are also used in this study. Additional information on routine IMPROVE methods can be found on the IMPROVE website (http://vista.cira.colostate.edu/Improve/, last access: 31 July 2021). IMPROVE data are available online at (http://views.cira.colostate.edu/fed, last access: 31 July 2021).
2.2 Outlier removal
Data were screened for outliers to eliminate their influence on the results. Out of the ∼ 61 500 total number of samples in the 3-year period, fewer than 800 were excluded from the analysis due sampling issues or missing TOR, XRF, or IC data. In addition, 65 samples collected at the Wheeler Peak Wilderness (New Mexico) site between November 2015 and April 2016 were excluded due to an EC contamination caused by a diesel-powered ski lift.
Potential outliers in TOR measurements were investigated by regressing TOR EC against HIPS BC concentrations. Samples with differences exceeding a predefined threshold value (0.68 µg m−3) were flagged as potential outliers (Sect. S2). The status of these samples was confirmed by building separate TOR EC and HIPS BC calibrations. The poor agreement between TOR EC and FT-IR EC concentrations contrasts with the nearly 1 : 1 relationship HIPS BC and FT-IR BC predicted values indicating that TOR EC concentrations were likely compromised (Sect. S2). For the period considered in this study, 112 samples with faulty TOR EC values were identified and excluded from further analysis. The number of valid sample spectra retained in this study is 61 462.
2.3 Fourier-transform infrared (FT-IR) analyses
Since 2015, all PTFE in the IMPROVE network have been analyzed by infrared spectroscopy for research and evaluation purposes. FT-IR measurement occurs after gravimetric analysis and prior to XRF and HIPS to prevent possible loss of volatile species under the mild vacuum in XRF. Three FT-IR spectrometers including one Tensor 27 and two Tensor 2 instruments (Bruker Optics, Billerica, MA) equipped with a pre-aligned mid-IR source and a liquid nitrogen-cooled wide-band mercury cadmium telluride (MCT) detector were used for spectra acquisition in the range 4000–420 cm−1 by averaging 512 scans at a nominal resolution of 4 cm−1. The single beam signal associated with each PTFE filter was converted to an absorbance spectrum using the most recent zero reference signal, updated hourly.
Previously, it was determined that calibration transfer between multiple FT-IR instruments is not required as long as their spectral response is carefully matched by controlling a set of key environmental and instrumental parameters (Debus et al., 2019). Briefly, each MCT detector is connected to an automatic liquid nitrogen micro-dosing system (NORHOF, Ede, Netherlands) designed to improve signal stability and maintain a high signal to noise ratio. The repeatability and reproducibility of the filter position relative to the IR beam is controlled via a house-built sample chamber (4.0 × 5.1 × 4.5 cm) mounted inside the instrument sample compartment. Details regarding the chamber design have been published elsewhere (Debus et al., 2019). Finally, the contribution of water vapor and carbon dioxide to the signal was minimized by continuously purging both the sample chamber and the optical bench with a VCD Series CO2 adsorber/dryer system (PureGas LLC, Broomfield, CO). For each sample, the acquisition procedure involves a 4 min purge followed by spectrum collection lasting about 1 min. An in-house macro interfaced to the OPUS software (Bruker Optics, Billerica, MA) controls each step. PTFE filters were measured in transmission mode without sample preparation. No interpolated data (from zero-filling) are included in the final raw spectra. Collected spectra are subjected to weekly quality control procedures detailed in Debus et al. (2019). Duplicate and replicate measurements were also performed to evaluate instrument stability and found to be within ±10 %.
2.4 Multivariate calibration model – partial least squares regression
While the presence of certain categories of atmospheric compounds can be identified qualitatively from an FT-IR spectrum, an accurate quantification of their concentration requires calibration. PLS is a commonly used algorithm to relate a multi-wavenumber measurement to any particular sample properties such as concentration (Wold et al., 2001). In brief, PLS maximizes the co-variance between a set of response variables (species measurements) and a reference measurement (FT-IR spectra) from which equivalent predicted values are desired. In so doing, the optimal combination of response variables best describing the reference measurement is identified and the selected features are used to build a multivariate calibration. With all least-squares calibration methodologies, concentration-dependent biases in residuals that are determined by the quality of fit (R2), and dynamic range of the data are expected due to the nature of least-squares estimation (Besalú et al., 2006; Draper and Smith, 1998). For further discussion of these biases, see Sect. S1.
The applicability of PLS to quantify carbonaceous aerosol species (Reggente et al., 2016; Weakley et al., 2016, 2018a) or functional groups (Boris et al., 2019; Ruthenburg et al., 2014) collected on PTFE filters in various monitoring networks and field campaigns has been successfully demonstrated. A complete review of the implementation of PLSR calibration in the framework of atmospheric particulate matter characterization has been recently published (Takahama et al., 2019).
To evaluate model performance, FT-IR predicted concentrations were regressed against their reference measurement to quantify residuals and a series of metrics. Reported figures of merit include the coefficient of determination (R2), bias, error, and the method detection limit (MDL). Residuals are defined as the difference between predicted and reference concentrations, bias corresponds to the median residual, while error is the median absolute residual. To facilitate inter-model comparison, relative performance metrics were calculated by normalizing the values by their reference value. FT-IR PLSR calibration MDL was estimated from field blank predicted concentrations as the 95th percentile minus the median residuals, as is done for other species in the IMPROVE network (http://vista.cira.colostate.edu/improve/wp-content/uploads/2021/07/IMPROVE-SOP-351_Data-Processing-and-Validation_2021_final.pdf, last access: 15 March 2020). Performance is reported for all samples together regardless if the samples were included in the calibration. This enables comparison between models with different samples used for calibration. Maps of annual median values of the reference method concentration and performance metric are generated for each aerosol component. Isopleths on the maps are calculated using an ordinary Kriging algorithm and are intended to guide the eye to capture the regional nature of the concentrations and performance quality. For the MDL map, the difference between the percentage of samples below MDL for the reference method is subtracted from the percentage below MDL for FT-IR to indicate if the reference method or FT-IR have more samples below MDL.
For further insight into model prediction accuracy, the distribution in FT-IR residuals is qualitatively compared with residuals from collocated measurements. Collocated quartz filters are collected at the Everglades (FL), Hercules-Glades (MO), Medicine Lake (MT), and Phoenix (AZ) sites. Similarly, collocated Teflon filters are sampled at Mesa Verde (CO), Proctor Maple Research Facility (VT), Saint Marks National Wildlife Refuge (FL), Yosemite (CA), and Phoenix (AZ) sites, while collocated nylon filters are featured at the Phoenix (AZ), Frostburg Reservoir (MD), Mammoth Cave (KY), and San Gabriel (CA) sites.
Data handling and analysis was performed in Matlab R2018a (The MatWorks, Inc, Natick, MA, United States) using the statistics and signal processing toolboxes. PLS was computed via the libPLS Matlab package (v1.9) (Li et al., 2018).
2.5 FT-IR calibrations for predicting PM composition
This section presents the design of calibrations for quantifying the concentration of major atmospheric species by taking advantage of the composition-based information embedded within an FT-IR spectrum. In practice, spectra are calibrated against reference measurements from TOR, XRF, IC, HIPS, and gravimetric analysis with the aim of predicting concentrations of atmospheric constituents using only spectra of PTFE filters as input.
A multilevel model (Snijders and Bosker, 2011; Takahama et al., 2019) is proposed in which dedicated calibration models for subgroups of samples are constructed, and applied according to a predetermined selection criterion for each sample. This model considers two subgroups: (i) samples determined to be dominated by biomass burning, which are calibrated with similar samples, and (ii) the remaining samples, which are calibrated with samples from a limited number of sites.
To establish baseline performance metrics for comparison, a “Global model” in which a single calibration (for each species) is constructed from all samples considered together is described in Sect. S1 (Supplement).
The first step in the development of the multilevel model consists of screening for biomass burning samples. These samples are removed from consideration during the site selection process. A simple detection method combining estimates of key functional group spectral peak areas and spectral dissimilarity metrics were used to segregate biomass burning samples from all other samples. Next, a Gaussian mixture model (GMM) was applied to the spectra of all non-biomass burning samples. The GMM exploits the specificity of the infrared signal for organic and inorganic species. The GMM was implemented with the aim of clustering the non-biomass burning FT-IR spectra into groups sharing similar spectral features (Sect. 2.5.2). Those groups were later used as part of the methodology for selecting sites with representative atmospheric composition. Spectra from the year 2015 were used as a benchmark to validate the biomass burning detection strategy, build the GMM, and establish the list of representative sites where multi-filter collection/multi-analyses should be retained (Sect. 2.5.2). The identified biomass burning samples are used to build a calibration for biomass burning samples (Sect. 2.5.1).
2.5.1 Biomass burning model
FT-IR spectra were used to estimate functional group areas and calculate spectral dissimilarities metrics to segregate biomass burning samples from all other samples. Although this paper focuses on using FT-IR to measure the major aerosol components in routine speciated aerosol monitoring networks, FT-IR is more frequently used to measure organic functional groups (e.g., Russell et al., 2011; Ruthenburg et al., 2014; Boris et al., 2019). Specific regions in the IR spectra correspond to specific functional groups. Peak areas, calculated from baseline corrected spectra (see Sect. S3 for baseline procedure), for carbonyl, OH and CH were used rather than functional group calibrations for simplicity. Because the relative functional group peak area tends to increase significantly as the cumulative peak area decreases, especially for low mass deposition samples, an estimate of spectral dissimilarities, the squared Mahalanobis distance (), for each site is also considered to minimize false detection. The Mahalanobis distance (Mahalanobis, 1936; Cios et al., 1998) is a measure of the spectral dissimilarity between a given spectrum at a site and the mean spectrum at the site. Taking advantage of and relative functional group areas, a set of criteria were established from observations at known wildfire sites during wildfire season (O'Dell et al., 2019). First, samples collected under heavy smoke conditions whose spectra fulfill C–H ≥ 2 %, C=O ≥ 15 % and were detected (Sect. S3). This group of spectra tend to have large values and, consequently, the threshold often excludes samples with low to moderate biomass burning contributions. For a more inclusive detection, spectra from the first group were removed from consideration, the values are updated for each sample and the plots were regenerated. The cut-off value for the relative carbonyl functional group area was lowered to 8 % while other parameters were not changed. Spectra identified by the first and second rounds are considered biomass burning samples. This procedure is performed for each site and for each year of sample collection (Sect. S3)
Recent work has shown that smoke samples may be identified using techniques such as cluster analysis (Bürki et al., 2020) similar to the GMM used here and through detection of molecular markers – levoglucosan and lignin – or peak profiles in FT-IR spectra (Yazdani et al., 2021a, b). For the large data set in this work (∼ 20 000 samples in 2015), cluster analysis resulted in multiple clusters that could be associated with smoke-impacted samples likely due to the variations in fuel, oxidation conditions, and contributions from other sources. Therefore, for this work, we selected a single group of smoke-impacted samples based on specific organic features known to be present in FT-IR spectra. While the criteria for selecting smoke-impacted samples can be defined differently according to each intended purpose, the method presented here is demonstrated to sufficiently partition the samples for building accurate submodels to predict concentrations of PM constituents.
While ions and crustal species are not necessary correlated with wildfire emissions, the biomass burning sub-model accounts for interferences that are used to maintain high prediction accuracy for samples collected on smoky days.
2.5.2 Limited sites model
To assess major PM2.5 composition regimes in the network and to identify representative sites to use as calibration standards in the limited sites model, screening of all FT-IR spectra (except samples identified as biomass burning samples) across all locations and seasons was performed by building a GMM (Bilmes, 1998; Hastie et al., 2009). The basic idea behind GMM is to group FT-IR spectra into clusters of similar spectral shape using a probabilistic approach describing the likelihood that any given spectrum belongs to a particular class. To minimize the concentration dependence and emphasize composition, raw spectra were transformed to second derivative spectra using a 2nd order, 21 point, Savitzky–Golay filter (Savitzky and Golay, 1964), differenced with filter blank spectra and divided by their respective Euclidean norm (Bro and Smilde, 2003). Additional details about the GMM pre-processing and implementation as well as cluster interpretation are provided in Sect. S4.
After classification, a single site per cluster was selected to represent the atmospheric composition captured in that cluster. For any given cluster, the retained location was defined as the site with the largest number of classified spectra with the highest probabilities of belonging to that cluster. To prevent misleading site selection and enhance spatial coverage, the following set of decision rules were used: (i) if the same site is representative of two clusters, it is ascribed to the cluster with the largest number of classified spectra from that site, (ii) if none of the retained sites accounts for a given spatial region or known source type in the network, an additional site with the highest number of classified spectra is selected from a nearby cluster, and (iii) only sites under continuous operation between 2015 and 2017 are eligible for selection. Criterion (ii) was invoked once to add a site in the midwest to improve spatial coverage in that region and to capture prescribed fire emissions in Kansas. All non-biomass burning samples from selected sites were used as FT-IR calibration standards for all species and all non-biomass burning samples are predicted with these models. Once established, the selected sites are not re-evaluated but instead are used in all subsequent years as would occur in practice.
2.5.3 Application of multilevel model
The multilevel model is the combination of the FT-IR predicted concentrations from the limited sites and biomass burning models. Multilevel modeling will be discussed in the context of carbonaceous aerosols before extending the modeling to other atmospheric constituents with detectable infrared signatures. In addition to OC and EC, species evaluated for FT-IR prediction include PM2.5 mass, soil elements (silicon, aluminum, calcium, titanium, iron), anions (sulfate, nitrate) and HIPS BC. As mentioned previously, NaCl is not IR active and so there is no direct measure of sea salt from FT-IR. Next, the years 2016 and 2017 will be examined to assess the long-term stability of the proposed multilevel strategy by screening for smoke samples and re-calibrating each year using the sites selected using 2015 data.
In the following sections, the quality of FT-IR based calibrations for quantifying aerosol composition across continental US and their long-term applicability to large speciation monitoring networks will be assessed. Sect. 3.1 describes the selected calibration samples for the biomass burning and limited sites models. In Sect. 3.2, biomass burning and limited model performance will be briefly reviewed before exploring the Multilevel FT-IR predictions for all samples. Initially focused on carbonaceous species on PTFE samples collected in 2015, FT-IR predictions will be extended to other atmospheric constituents and years. Data reported here is available at Dillner et al. (2021).
3.1 Multilevel modeling – calibration sample selection
3.1.1 Biomass burning sample selection
Using the methods described above, 492 samples impacted by biomass burning emissions were identified in 2015 (2.5 % of the network), 288 samples in 2016 (1.5 %), and 817 samples in 2017 (3.7 %). The mean OC concentration of the biomass burning samples range was 5.6–8.3 µg m−3 with maximum concentrations extending from 44 to 97 µg m−3 over the three year period. Similarly, per year, the mean EC concentration varies between 0.6–0.9 µg m−3 with maximums up to 2.9–3.9 µg m−3. Mean OC EC ratios are larger than 7, in agreement with past literature (Schichtel et al., 2008; Sorooshian et al., 2011). Analysis of the detected samples shows reliable spatial and seasonal distributions, consistent with biomass burning emissions predominantly in summer and fall across the Pacific north west and northwestern US (Sect. S3). Two-thirds of the identified samples were selected (Sect. S5) as calibration standards for the calibration and resulting model was applied to the remaining third of the smoke impacted samples.
3.1.2 Limited sites model – clusters and retained sites
Figure 1 shows the spatial distribution and annual average composition (from routine IMPROVE data) of the 21 sites selected for the limited sites model calibration. From a spatial standpoint, retained sites appear reasonably scattered across the network including Hawaii and the Virgin Islands. Clusters are represented by a distribution of urban and rural sites. One urban cluster is represented by Fresno and contains mostly urban samples from Fresno and Phoenix. All other clusters contain mostly rural and pristine sites. However, two other urban sites were retained, Phoenix and Birmingham. The Phoenix cluster contains samples from the southwest in the spring. The Birmingham site along with the Tallgrass site represent a non-western cluster in the spring and summer.
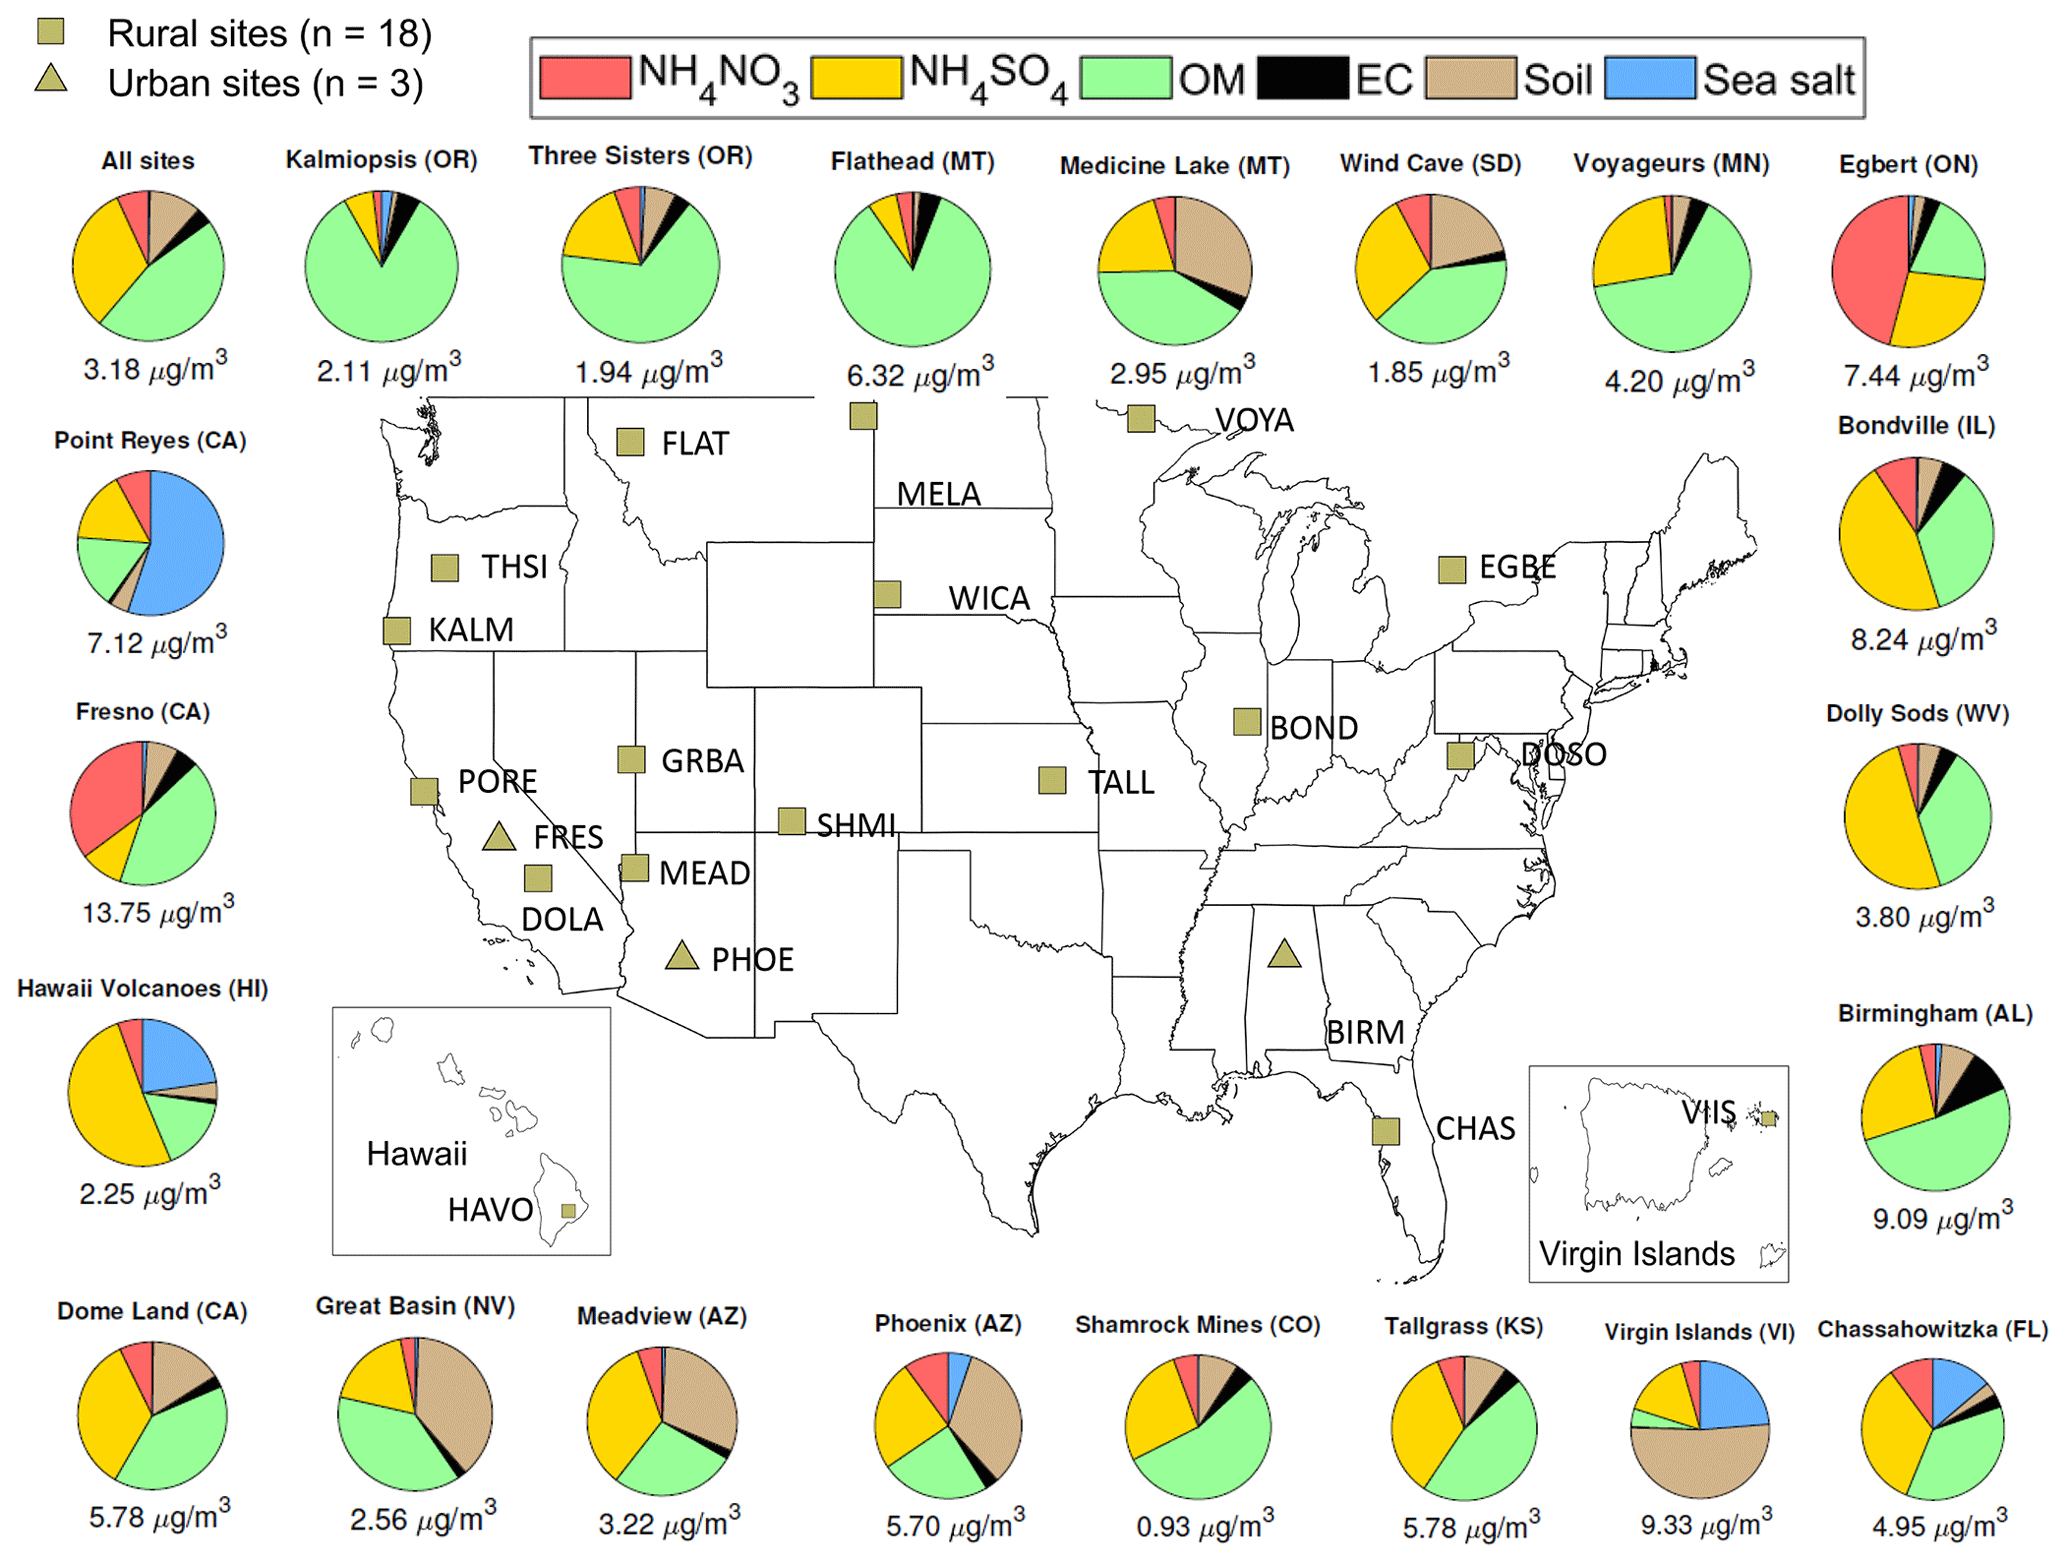
Figure 1Spatial distribution, median PM2.5 concentration and composition of the 21 representative sites. The composition is obtained from routine IMPROVE (non-FT-IR) measurements and the IMPROVE reconstructed fine mass equation (http://vista.cira.colostate.edu/Improve/reconstructed-fine-mass/, last access: 15 March 2020) to calculate soil and sea salt. Sites are identified by the four letter site code which is the first four letters of a single word site name (Fresno = FRES) or the first two letters of the first and second word for two word site names (Dome Land = DOLA). The top left pie chart shows the median PM2.5 composition across all sites and samples for comparison.
The clusters are also seasonally distributed (Sect. S6): five clusters are dominated by fall–winter samples, 10 clusters containing summer samples (along with varying number of spring and fall samples), two clusters are predominately spring and one is spring–fall. Three clusters have little seasonality.
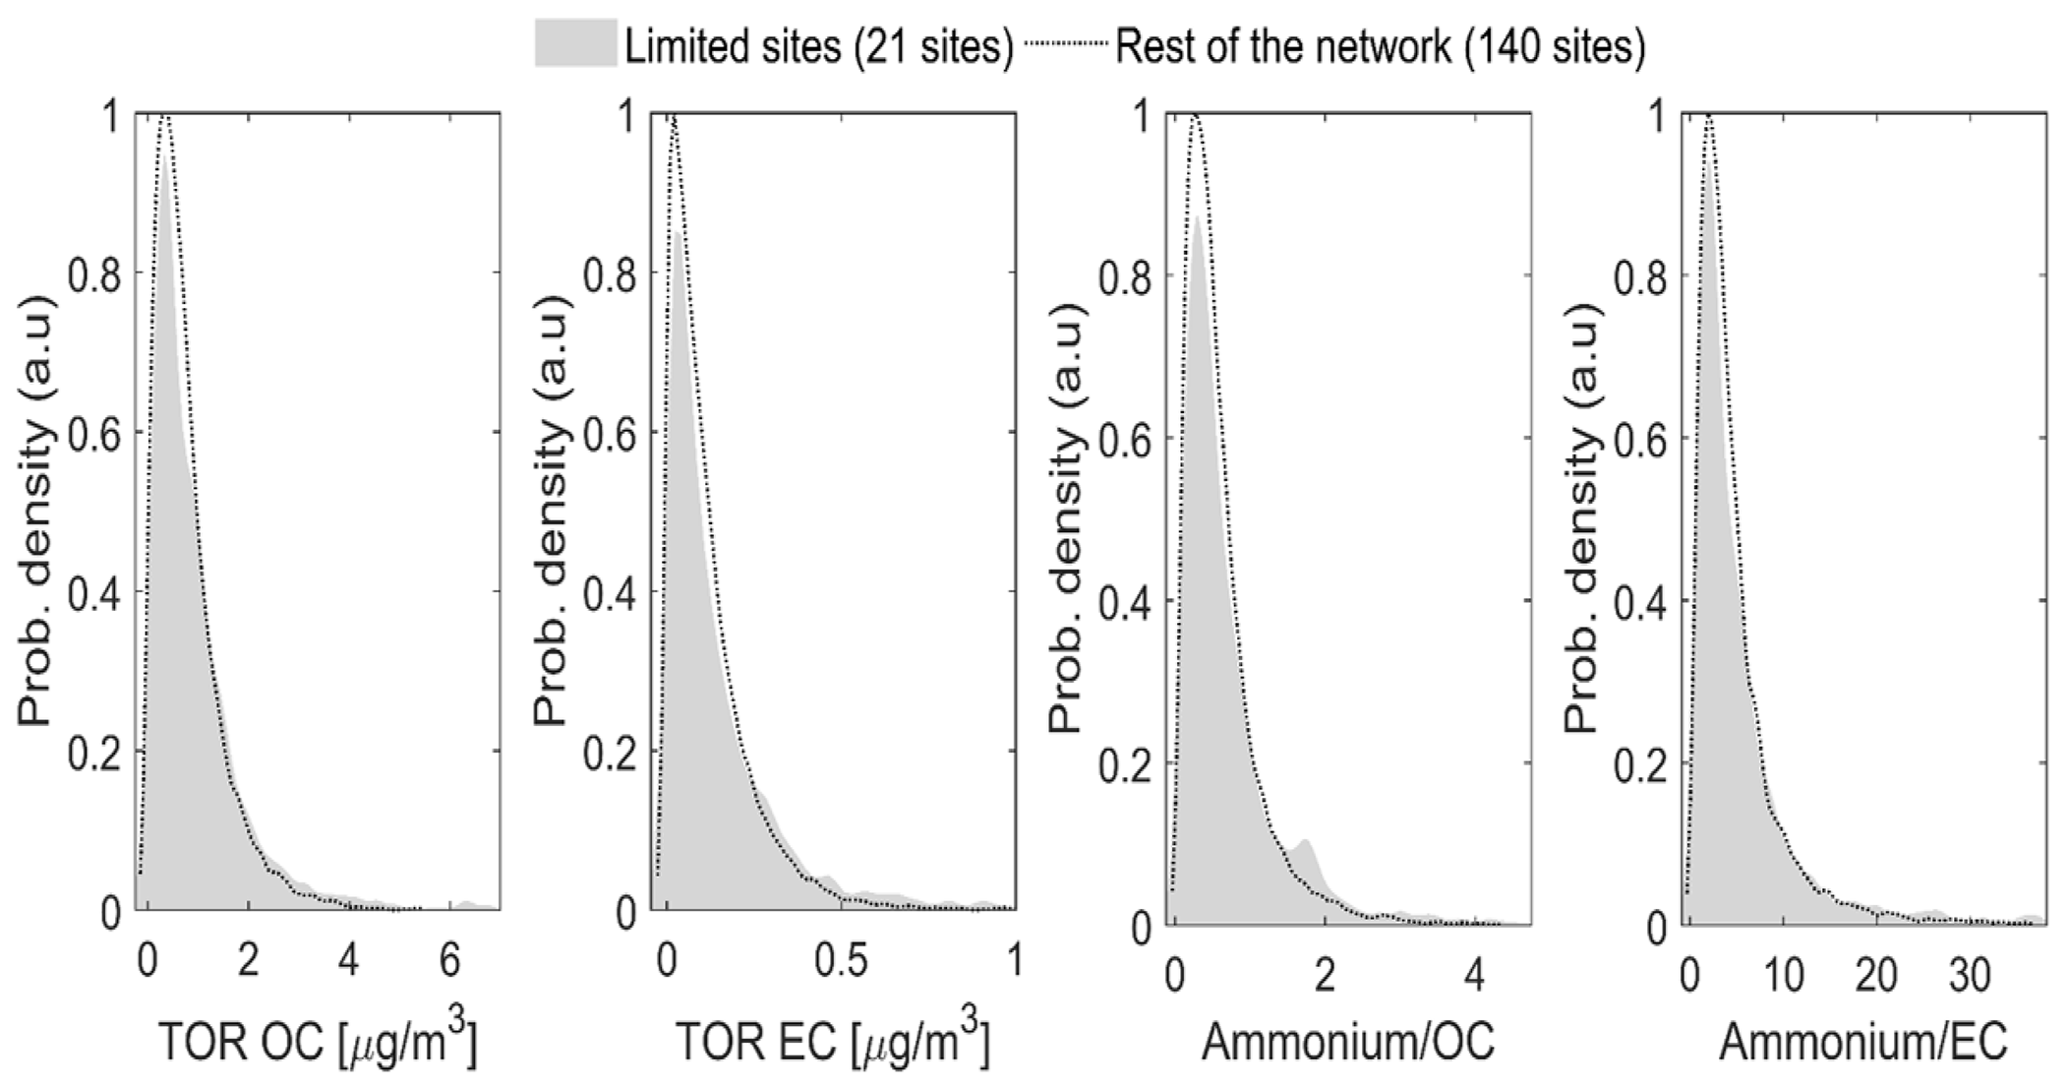
Figure 2Comparison of probability density function for OC and EC concentrations and ammonium relative to OC and EC in 2015 between the 21 sites retained for limited calibration and the rest of the network.
Because FT-IR spectra are clustered based on composition, the first step in assessing the representativeness of the 21 sites is to compare the concentration ranges. For this purpose, distributions in TOR OC and EC concentrations excluding biomass burning samples are compared for the 21 sites used for calibration and the 140 remaining sites. In Fig. 2, the two probability density functions are very similar for both OC and EC despite large differences in sample populations (2572 and 16 543, respectively). In addition to matching the range of carbonaceous concentrations observed in the rest of the network, the presence of species interfering with organic functional groups should also be accounted for by the calibration. Because ammonium absorptions overlap with carbonaceous absorptions, situations where ammonium to OC and ammonium to EC ratios are different between calibration samples and samples to be predicted were associated with additional sources of bias and error (Dillner and Takahama, 2015a, b). Although not measured in IMPROVE, ammonium concentration is approximated from nitrate and sulfate assuming both species are fully neutralized. The corresponding probability distribution in Fig. 2 confirms the equivalence between the ranges of ammonium/OC and ammonium/EC concentrations spanned by the limited sites samples and the overall network. In Sect. S6, Fig. S6-3 shows reasonable agreement between the selected sites and the rest of the network for PM2.5 mass, ions, elements and HIPS BC. Together, these results suggest the list of 21 sites is a suitable representation of network variations in OC and EC and their relative proportion to ammonium, and for all other predicted constituents.
The spatial and seasonal as well as the urban and rural diversity supports the compositional diversity of the selected sites as shown in Fig. 1. The three urban sites have distinct characteristics. At the Fresno (CA) site, the composition is dominated by nitrate (35 %) and organic matter (42 %). A large number of autumn–winter samples were included in the cluster which is consistent with agriculture and residential wood burning activities (Ngo et al., 2010) as well as with the formation of secondary aerosols during stagnation events and a low inversion layer (Watson and Chow, 2002). Phoenix, AZ site features a strong soil component (33 %) associated with spring dust storms and windblown dust and equal proportions of ammonium sulfate (25 %) and OM (24 %) occurring mostly in spring and summer. The ammonium sulfate and organic matter has been attributed to regional power production and traffic (Brown et al., 2007). In contrast, Birmingham samples show little seasonal trend with elevated OM (52 %) and EC (10 %) fractions originating from various combustion processes including vehicle exhaust, biomass burning and biogenic secondary organic aerosols (Blanchard et al., 2016). The other dominant species at this site is ammonium sulfate (26 %), characteristic of coal burning and industrial activities in the eastern US (Watson et al., 2015).
Among rural sites, four noticeable patterns in PM2.5 composition are distinguishable. The first corresponds to OM fractions accounting for more than two-thirds of the filter mass. High OM samples are encountered at four locations in northwestern US, namely the Kalmiopsis (OR), Three Sisters (OR), Flathead (MT) and Voyageurs (MT) sites. Samples from Voyageurs (MN) and Flathead (MT) sites are from summer–fall and present elevated median PM2.5 concentrations (4.20 and 6.32 µg m−3, respectively) and very large percentage of OM consistent with biomass burning emissions. Kalmiopsis (OR) and Three Sisters (OR) samples have a lower and nearly identical median PM2.5 concentration (≈ 2 µg m−3) but differ in their monthly distribution with the former displaying more winter samples than any other season whereas the later shows little seasonality.
The second type of sites have high OM and sulfate concentrations. Both Shamrock Mines (CO) and Tallgrass Prairie (KS) sites have larger OM than sulfate content. However, the Colorado site has more autumn–winter samples, represents samples in the Rockies and Alaska and an overall small median PM2.5 concentration (< 1 µg m−3). The Kansas site has a majority of spring samples, representing non-western samples and has a significantly larger PM2.5 concentration (≈ 6 µg m−3) that is attributed to prescribed burning near the Tallgrass site (Whitehill et al., 2019). Other sites have higher median sulfate concentrations (∼ 50 %) than OM concentrations (∼ 40 %) such as Dolly Sods (WV) and Bondville (IL). The monthly sample distribution indicates seasonal influences: Bondville (IL) samples are mostly from the summer and the concentrations are relatively high while the Dolly Sods (WV) site samples are mostly not in the summer with lower concentrations. Because the spectra were normalized to minimize influence of concentration, these two clusters likely have different organic composition even though the relative amount of OM is the same. Finally, sites where sulfate and OM are present in equal proportions (≈ 36 %) are reported at the Dome Land (CA) and Chassahowitzka (FL) pristine sites mainly featuring spring–summer and winter samples, respectively.
A third group of rural sites contains a large fraction of soil (> 20 % of the total mass). The Virgin Islands (VI) site presents the highest soil fraction across the network with 52 % of the total PM2.5 mass from soil, mostly originating from long-range Sahara soil dust transport (Holmes and Miller, 2004). In addition to sulfate and OM, elevated soil contributions are observed for the Wind Cave (SD), Meadview (AZ), Medicine Lake (MT), and Great Basin (NV) sites with soil content between 20 % and 40 %. Although the seasonality is somewhat different between these sites, they all have many samples from the spring suggesting the dust is due at least in part to spring dust storms and may also contain resuspended road dust and more localized dust sources.
A fourth and final distinct category of PM2.5 composition includes a collection of sites with unique local atmospheric pollution sources, specific to those locations. The Hawaii Volcanoes (HI) site where sulfur is emitted as part of the volcanic activity, contains 51 % sulfate along with sea salt (23 %). Another location with unique composition is the Point Reyes (CA) site where the sea salt contribution reaches 55 % of the median filter mass for the clustered samples, larger than any other marine site in the network. Finally, the Egbert (ON) Canadian site, representing the upper midwest in winter is dominated by nitrate (46 %), sulfate (27 %), and OM (20 %).
As described above, the 21 sites retained for the limited sites sub-calibration present seasonal, regional and compositional features consistent with known or expected trends in PM2.5 across the network. The median PM2.5 mass at those locations covers a broad range of concentrations ranging from 0.93 to 13.75 µg m−3 and includes both urban and rural sites. Capturing the large variability in PM2.5 composition and concentration is essential to ensure the proposed site list is a representative subset of the parent network. However, it should be mentioned that the proposed site list is not unique but is one of the many feasible solutions since sites whose samples clustered together in the GMM are likely interchangeable.
3.2 Evaluation of biomass burning model
Prior to describing the overall results from the multilevel model, the biomass burning model is evaluated to determine if the biomass burning model improves predictions for those samples. To evaluate the quality of the biomass burning model, the predictions are compared to a global model (Sect. S1) which contains a few samples from all 160 sites. Due to the selection method of calibration standards for the global modal, most of the samples are non-smoke samples but a few smoke samples are included. Visual inspection of Fig. 3 suggests the equivalence of the biomass burning models to the global model at the lower end of the concentration range. However, improvement in prediction accuracy can be claimed at high concentrations for the biomass burning model. The gain in model performance is subtle for OC and TC; however, for EC, predictions benefit from having a dedicated calibration for samples impacted by wildfire emissions, with an increase in R2 from 0.747 to 0.902 (Sect. S7).
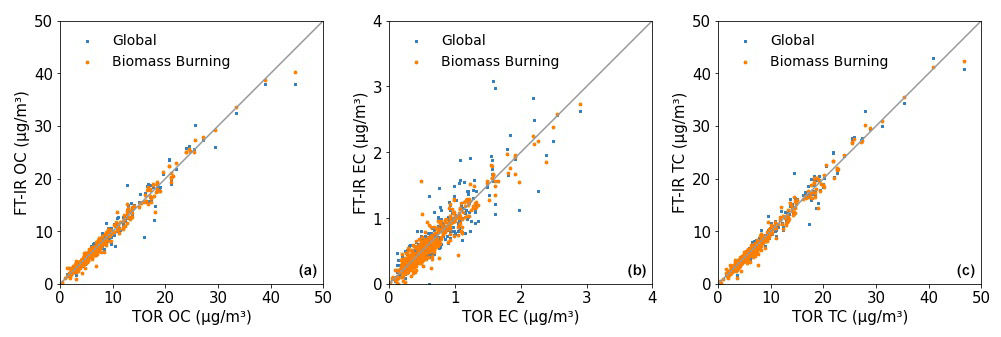
Figure 3Inter-model OC (a), EC (b), TC (c) comparison between global (Sect. S1) and biomass burning predicted concentrations for the 492 samples classified as biomass burning in 2015. EC prediction, in particular, benefit from having a dedicated biomass burning calibration model.
Therefore, we retain the biomass burning model as part of the multilevel model and present the results for the multilevel model below.
3.3 Multilevel modeling – performance evaluation
3.3.1 Carbonaceous aerosol predictions
Figure 4 shows the correspondence between FT-IR multilevel concentrations for OC and EC and TOR OC and EC measurements for 2015 (plot for TC can be found in Sect. S9) and Table 1 lists the prediction metrics for all three carbonaceous components. The visual agreement between FT-IR and the reference measurements of TOR OC and EC is high but EC shows higher scatter than the other measurements. Table 1 indicates that FT-IR OC and TC has higher prediction quality than EC but both perform satisfactorily. FT-IR OC and TC error is on par with TOR precisions (Table 1) indicating that on average FT-IR does not add significant additional error to the measurement. FT-IR EC predictions, however, have higher error than TOR precision. With respect to reference (TOR) measurements, concentration-dependent biases in residuals that are determined by the quality of fit (R2) and dynamic range of the data are expected due to the nature of least-squares estimation (Besalú et al., 2006; Draper and Smith, 1998). For bias defined as FT-IR predictions minus the reference (TOR) measurement, least-squares estimator causes an apparent linear bias which is positive at the low end of the concentration range and negative at the high end of the concentration range (see Sect. S8 for further discussion). The satisfactory agreement between FT-IR and TOR concentrations as well as the equivalence agreements using the global model (Sect. S1) support the validity of the proposed Multilevel modeling in the context of carbonaceous aerosols prediction from PTFE filters in large speciation networks.
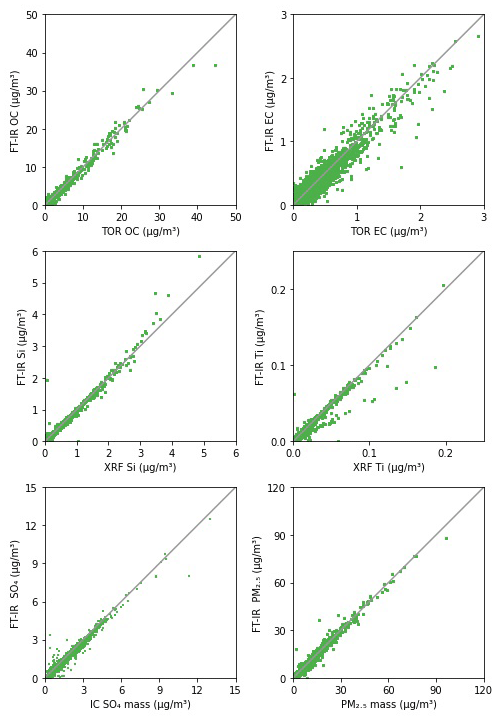
Figure 4Comparison of predicted FT-IR OC, EC, Si, Ti, SO4, and mass concentrations using the multilevel model against their reference measurements. Each subplot contains all 19 608 samples collected in the year 2015.
Table 1Summary of Multilevel model performance for IR-active atmospheric constituents for 19 608 spectra analyzed by FT-IR in the year 2015.

∗ Median relative error for TOR, XRF, IC, and gravimetric analysis. OC, EC, and TC median relative error estimated from collocated sampling as measurement error/uncertainty is not reported by IMPROVE for this components. For all other components, the normalized error was calculated as the uncertainty divided by the concentration prior to selecting the median. BC is not reported by IMPROVE so measurement error is not estimated.
In addition to OC, EC, and TC, light absorption which is predominantly due to black carbon, is also a measure of one fraction of the carbonaceous aerosol. FT-IR calibrations are found to be adequate for replicating HIPS BC measurements (Sect. S9). As expected, the corresponding model is similar in performance to EC with R2 and relative error of 0.920 and 23.3 %, respectively (Table 1). FT-IR BC residuals have a broader interquartile range than in the HIPS BC collocated data (Sect. S9). We attribute this effect to a difference in signal to noise ratio and sensitivity to chemical interferents between the two analytical techniques. While HIPS exploits the strong absorption properties of refractory carbon in the visible domain, the weak absorptivity of EC in the mid-infrared domain (Niyogi et al., 2006) and the presence of overlapping species makes the quantification less accurate.
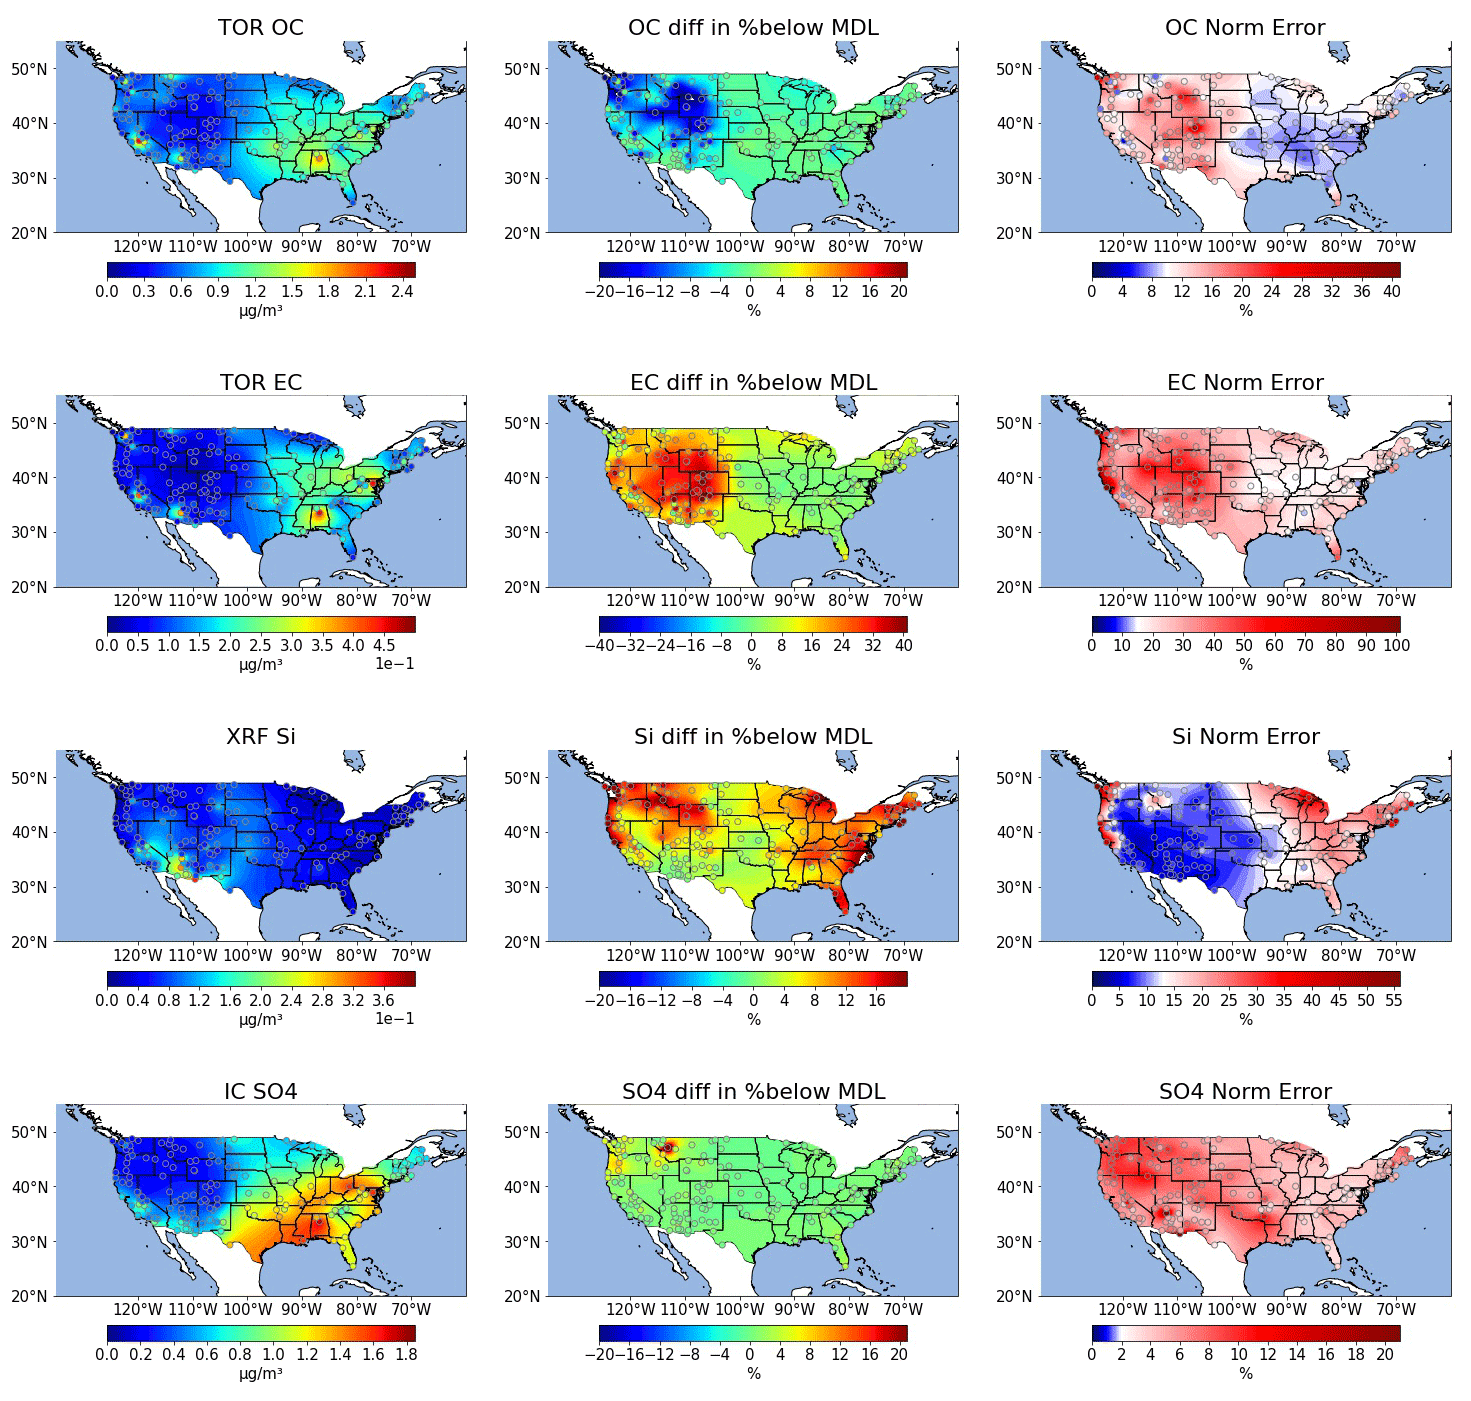
Figure 5Annual median reference method concentrations (left), difference in % below MDL (middle) and normalized relative error (right) per site for OC, EC, silicon, and sulfate for CONUS for 2015. For the MDL plot, sites in green and blue indicate that the FTIR has the same or fewer samples below MDL than the reference method. Sites in yellow and red have more samples below MDL for FTIR than for the reference method. For the relative error maps, the median relative error of the reference method estimated using methods described in Table 1 is white. For sites in blue, FTIR has lower relative error than the reference method and sites in red are higher.
Further exploration of the regional and site by site quality of data is made via contiguous United States (CONUS) maps of annual median reference method concentrations (left), difference in % below MDL between FTIR and reference method (middle) and relative error (right) are shown in Fig. 5 for OC and EC. TC is very similar to OC and BC is very similar to EC.
Maps for all constituents with annual median FTIR and reference method concentrations, as well as annual median prediction metrics are shown in Sect. S10.
Annual median maps of FT-IR OC and TOR OC as well as maps of FT-IR EC and TOR EC (Supplement Sect. S10) are nearly identical. As shown in Fig. 5, annual median OC and EC concentrations are highest at the four urban IMPROVE sites of Seattle (WA), Fresno (CA), Phoenix (AZ), and Birmingham (AL) than the rural sites and are higher in the east than in the west. For OC, the relative error is lower than the TOR relative error in the east (where concentrations are higher) and higher than TOR relative error in the west. FT-IR OC has an equal or lower number of samples below MDL than TOR at all sites. For EC, FTIR relative error is higher than TOR relative error at almost all sites. The percentage of samples of EC that are below MDL for FTIR is similar to or are slightly higher than TOR in the eastern US where EC concentrations are higher and are significantly higher than TOR in the western US where concentrations are lower. These patterns indicate that FTIR does not add error to OC measurements when concentrations are above ∼ 0.75 µg m−3 but does add some error at lower OC concentrations and for EC measurements.
3.3.2 Elemental oxide predictions
Taking advantage of known mineral absorbance bands in the mid-infrared range (Hahn et al., 2018; Madejová and Komadel, 2001; Senthil Kumar and Rajkumar, 2013) (Sect. S9), Multilevel calibrations for soil elements were evaluated for the five crustal elements commonly used to estimate soil: silicon, aluminum, calcium, titanium, and iron (Table 1 and Fig. 4 for Si and Ti). All models present a satisfactory agreement between XRF and FT-IR predicted concentrations (R2 > 0.94). The quality of prediction of the elemental oxides falls into two groups. The first group includes silicon, aluminum and calcium and is characterized by moderate relative errors (11 %–13 %), similar in magnitude to the FT-IR OC model (12 %) and have similar errors to XRF measurements. This indicates that like OC and TC, on-average FT-IR does not add additional uncertainty. The second group includes titanium and iron which have larger relative errors (20.9 %–24.8 %), analogous to HIPS BC and EC models (23.3 %–30 %). Comparing residuals to collocated XRF measurements (Sect. S9) shows that the FT-IR based models have a larger interquartile range. For Fe, XRF uncertainty is quite low and FT-IR adds additional uncertainty to the measurement. XRF Ti measurements have higher error than the other elements but there is an incremental increase in error due to FT-IR. In addition, cross plots of titanium concentrations show a bifurcation (Fig. 4). While most samples fall near their expected titanium concentration, samples collected at the Sycamore Canyon (AZ) site present a systematic negative bias, consistent across years, tentatively attributed to a site-specific soil composition not accounted for by the limited calibration. Takahama et al. (2019) demonstrated several methods to identify the possible occurrence of anomalous predictions in OC and EC based on comparison of new sample spectra to calibration spectra based on projected PLS scores and regression residual vectors. These samples with systematic negative bias in titanium predictions can presumably be identified using such an approach, provided that compositional differences are detected in the IR spectrum. Although distinct IR fingerprints exist, FT-IR calibrations for quantifying mineral contents should be interpreted with care as specific elements may be indirectly quantified through their correlation with another element even in the absence of clear IR signature (Hahn et al., 2018). For instance, the variable importance in projection (VIP) scores for the Si, Al, and Ti calibrations suggests use of similar spectral variables, with small differences, for prediction of these species (Sect. S9). However, the 21 GMM sites coverage still meet the necessary requirements for providing a reliable insight into soil composition in the IMPROVE network.
Figure 5 shows the distribution of concentrations of XRF Si across CONUS. The highest annual median concentrations are in the southwest. Similar patterns are found for Al, Ca, Ti, and Fe except that high Fe concentrations are also observed at the urban sites, particularly Fresno (CA) and Birmingham (AL) (Figs. S10-6 through S10-9). For Si, FTIR normalized error is lower than XRF in the west where concentrations are higher. For Ca, Ti and Al, FT-IR normalized error is lower only in the southwest. For Fe, FT-IR is above XRF normalized error. The percentage of samples below MDL are similar to XRF (0 %–10 % different) in the southwest and central US and modestly higher (15 %–20 %) in the northwest and eastern US for Si. For Fe, the spatial pattern is similar but the FTIR % below MDL is up to 50 % higher than XRF. However, for Al, Ca, and Ti, FTIR percent below MDL is approximately the same or lower than XRF at all sites.
3.3.3 Inorganic ions
The two most abundant inorganic anions quantified in the network, nitrate and sulfate, can also be measured by FT-IR (absorption bands used for prediction are discussed in Sect. S9). FT-IR sulfate concentrations display a satisfactory agreement with the reference IR measurements (Fig. 4). Model performance metrics include R2 above 0.98 and relative error of 6 %. The relative error is the same as for FT-IR PM2.5 and lower than OC, TC, and Si (Table 1). However, IC measurements have even lower error than FT-IR sulfate. Compared to sulfate, FT-IR nitrate concentrations (Sect. S9) are characterized by a moderate drop in the overall model performance (R2=0.927) while relative bias and error exceed 15 % and 50 %, respectively and the error far exceeds reference IC nitrate measurement error. A direct comparison against differential nitrate concentrations at collocated sites highlights the broad uncertainty in determining nitrate content from PTFE filters (Sect. S9, Fig. S9-3). Unlike nylon filters for which nitrate is trapped on the surface, nitrate is known to evaporate from PTFE filters and the extent of volatilization is dependent on temperature and relative humidity during and after sampling. This causes a discrepancy between the mass of nitrate deposited onto the nylon filter and the mass of nitrate on the PTFE filter (Eldred and Ashbaugh, 2004), therefore FT-IR calibrations with the nitrate measurements by IC from nylon filters as the reference should be used with caution. Although there are physical limitations to measuring ambient nitrate on PTFE filters, a measure of nitrate on PTFE filters which corresponds to its contribution to the gravimetric mass is useful for mass closure and data validation. FT-IR has been shown to be useful for measuring and evaluating nitrate under controlled laboratory conditions (ex. Wu et al., 2007). For network samples, nitrate could be measured using laboratory calibration standards and this effort will be addressed in future work.
The annual median sulfate concentrations by IC are shown in Fig. 5. Annual median concentrations are highest in the southeast and eastern US with a gradient in concentrations observed across the midwest. The median relative error for sulfate by IC is only 2 % and all FTIR sulfate has higher relative error. There are however, spatial differences. In the eastern US sulfate relative error is less than 15 % but in the west, it is considerably higher, peaking in Wyoming where concentrations are very low. The % below MDL is very similar for FTIR and IC across the continent. Due to volatility of nitrate, the nitrate metrics for FTIR are poor compared to sulfate (Fig. S10-11).
3.3.4 PM2.5 mass predictions
Since the major aerosol species are shown to be reasonably well measured by FT-IR, it was anticipated that PM2.5 mass calibration would perform well. The PM2.5 model presents reliable filter mass predictions (R2=0.985) characterized by relative bias and error that are to of those for OC and on par with gravimetric error (Table 1). The cross plot of gravimetric mass and FT-IR predictions (Fig. 4) and maps of predictions metrics (Fig. S10-12) show that PM2.5 mass can be accurately predicted across a broad concentration range indicating that FT-IR spectra of PTFE filters do not contain interferents or other limitations that make PM mass predictions error prone.
3.4 Long-term stability
Finally, multilevel calibrations are extended to 2016 and 2017 to evaluate the inter-year consistency and determine if the assumptions behind limited sites and biomass burning models remain valid over time. For each sampling year, new calibrations were developed following the framework established for 2015. Models were recalibrated with data from the 21 sites and biomass burning samples were detected by the functional group screening procedure. Fig. 6 shows the median relative bias (top) and error (bottom) for the 3 years of data (cross plots and prediction metrics shown for all predicted species for 2016 and 2017 in Sect. S11). These results indicate that the modeling methodology provided reasonably consistent results across all 3 years.
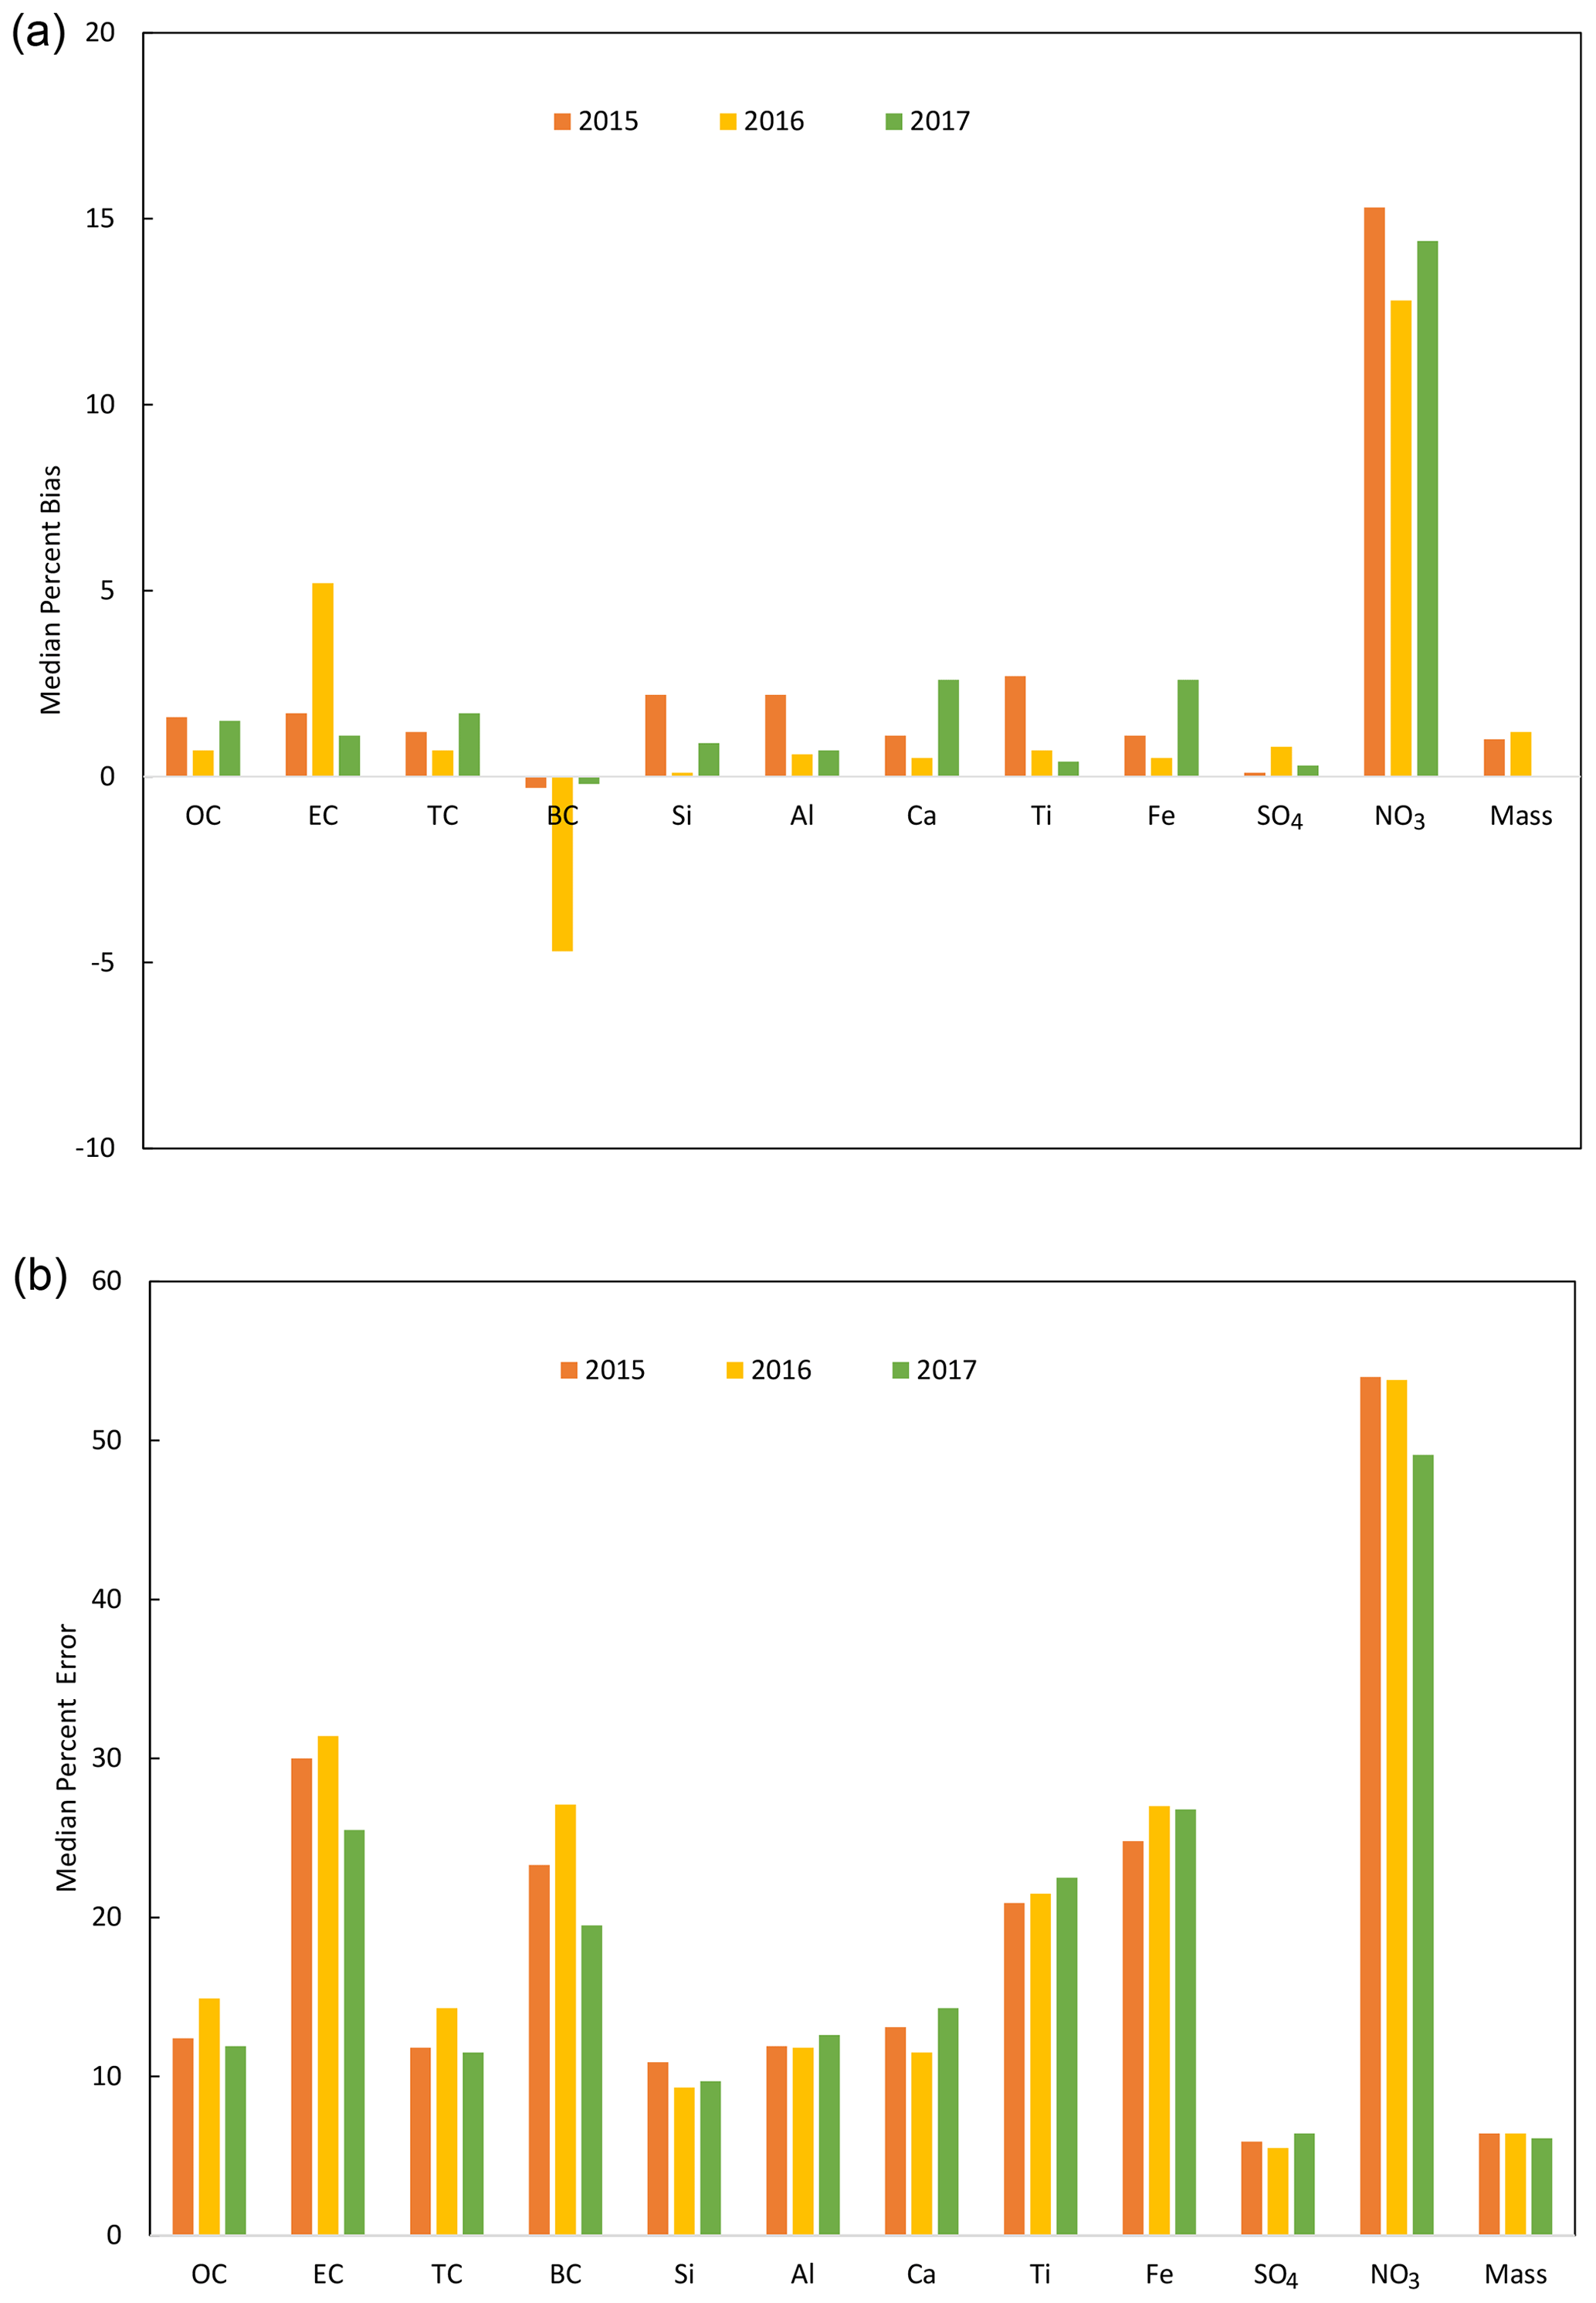
Figure 6(a) Median percent bias and (b) median percent error for each constituent measured for each year.
Normalized bias for most species is below 3 % and normalized error is consistent for all species across all 3 years. The relative bias for EC and BC are similar to other species in 2015 and 2017 but in 2016 they are larger in magnitude than the other two years and different in sign. the first year of TOR data from the multiwavelength TOR instruments is 2016 (Chow et al., 2015) so higher bias could be potentially be related to the new instruments. However, the HIPS instrument was overhauled beginning in 2017 which provides no explanation for high bias in 2016 (http://vista.cira.colostate.edu/improve/Data/QA_QC/Advisory/da0041/da0041_HIPSmodifications.pdf, last access: 6 October 2019). Further, the EC and BC calibrations are independent of each other except for using the same filters for calibrations (as all species do) so the fact that the median bias is roughly equal but opposite in sign is not due to codependence of the models.
In future work, calibrations models will be updated more frequently than annually with the most recent year of ambient samples which may smooth biases and errors due to changes to atmospheric condition and instrument drift.
In this paper, we investigate the feasibility of using FT-IR to measure speciated PM2.5 concentrations in a large monitoring network. In this method, all sites in the network collect PTFE filters for FT-IR analysis. A few select sites, used for calibration, retain all sampling and analyses of current IMPROVE sites to enable re-calibration of the FT-IR method on a routine basis. Re-calibration is especially important as atmospheric changes occur and as conditions in the network evolve over time, for example new reference instruments, new or significantly modified FT-IR instruments, changes to sampling protocol or changes in filter material. The validity of such a design was evaluated with all PTFE filters collecting PM2.5 aerosols at 161 IMPROVE sites in 2015 and then tested for all filters in 2016 and 2017.
A multi-level modeling algorithm was used whereby smoke impacted samples are identified and predicted by one model and the rest of the samples are predicted by another model developed from 21 selected IMPROVE sites. The data from the two models are combined to evaluate performance of the FT-IR method. The selection of sites was performed such that if one of the 21 sites ceases to operate, another site, selected from the same compositional cluster can be used for calibration.
The cross-plots and prediction metrics indicate that the Multilevel model is equivalent to conventional calibrations built from samples from every available site. Reliable performance in predicted concentrations were reported for a broad range of atmospheric constituents with detectable infrared signatures such as OC, EC, TC, sulfate, soil elements (Si, Al, Ca, Ti, Fe), light absorption, and PM2.5 mass. Due to volatilization off the PTFE filter, nitrate measurements were found to be unsatisfactory. NaCl is not active in the infrared and cannot be measured. The calibration method was developed using data from 2015, and the same methodology was applied to 2016 and 2017. The model performance metrics in all 3 years were similar. Results across ∼ 61 500 FT-IR spectra highlight the suitability of the Multilevel calibration design to quantify multiple atmospheric PM2.5 species in large monitoring networks.
This work presents an alternative, lower cost, filter analysis method to measure speciated aerosol in a routine monitoring network. This could be a valuable addition to routine speciated aerosol monitoring networks, such as IMPROVE, by incorporating monitoring sites that collect samples on only a PTFE filter for subsequent analysis. This would provide the opportunity to have a subset of less expensive monitoring site, which could be used for scoping studies to understand the aerosol composition in unmonitored locations. It could also serve as a network cost savings method by having a subset of network sites collect aerosol samples on Teflon filters only. However, the inability to measure particulate nitrate is a significant deficiency for using this method to replace existing monitoring sites. The FTIR derived aerosol concentrations are also a semi-independent measurement from the routine speciated aerosol measurements. Therefore, routine FTIR measurements would provide valuable QA/QC information for any speciated monitoring network. In addition, FTIR derived concentrations could be used to substitute for missing concentrations in the case where the Teflon sample is valid, but filter samples or analyses on the nylon or quartz fiber filters are not.
For IMPROVE's urban counterpart, the CSN network, after evaluation of the quality of predictions in CSN, this framework could be used to accomplish goals similar to those of IMPROVE. Additionally, this method could be used to predict samples collected in the Federal Reference Method (FRM) network which is a PM mass only network. In addition, this method, with appropriate ambient standards, could be applied at other regional or international monitoring networks or sites to provide low-cost comprehensive composition data. As shown in our previous work, additional data, including an estimate of organic matter and it's functional group composition, can also be obtained from FT-IR spectra of PTFE filters, further increasing the utility of infrared spectroscopy of aerosol samples.
Data is available at https://doi.org/10.25338/B8TP8V (Dillner et al., 2021).
The supplement related to this article is available online at: https://doi.org/10.5194/amt-15-2685-2022-supplement.
BD developed the software, performed the formal analysis and visualization for much of the paper, and wrote the original draft of the paper, ATW developed software, and performed formal analysis and visualization of the GMM work, ST participated in conceptualization, methodology software, visualization, and reviewing and editing the paper. KMG developed parts of the biomass burning identification methodology. AAF performed the final visualizations for parts of the paper and was responsible for additional visualizations made to the paper based on reviewer comments. BS, SC, and ASW, provided input throughout the project and reviewed and edited the paper, AMD conceptualized of and acquired funding for this project, developed methodology, performed project administration and supervision and reviewed, edited, and finalized the paper.
The contact author has declared that neither they nor their co-authors have any competing interests.
Publisher’s note: Copernicus Publications remains neutral with regard to jurisdictional claims in published maps and institutional affiliations.
We are grateful to Kelsey Seibert for overseeing daily FT-IR operations at the University of California Davis and to the numerous undergraduate students who performed spectra collection from 2015 to 2017.
This research has been supported by the National Park Service in cooperation with the Environmental Protection Agency (grant no. P18AC01222).
This paper was edited by Albert Presto and reviewed by two anonymous referees.
Besalú, E., de Julián-Ortiz, J. V., Iglesias, M., and Pogliani, L.: An overlooked property of plot methods, J. Math. Chem., 39, 475–484, https://doi.org/10.1007/s10910-005-9035-z, 2006.
Bilmes, J. A.: A gentle tutorial of the EM algorithm and its application to parameter estimation for Gaussian mixture and hidden Markov models, 4, 126, https://www.ee.columbia.edu/~sfchang/course/svia/papers/bilmes-gentleEM-review-tr-97-021.pdf (last access: 26 April 2022), 1998.
Bogard, J. S., Johnson, S. A., Kumar, R., and Cunningham, P. T.: Quantitative analysis of nitrate ion in ambient aerosols by Fourier-transform infrared spectroscopy, Environ. Sci. Technol., 16, 136–140, https://doi.org/10.1021/es00097a004, 1982.
Boris, A. J., Takahama, S., Weakley, A. T., Debus, B. M., Fredrickson, C. D., Esparza-Sanchez, M., Burki, C., Reggente, M., Shaw, S. L., Edgerton, E. S., and Dillner, A. M.: Quantifying organic matter and functional groups in particulate matter filter samples from the southeastern United States – Part 1: Methods, Atmos. Meas. Tech., 12, 5391–5415, https://doi.org/10.5194/amt-12-5391-2019, 2019.
Boris, A. J., Takahama, S., Weakley, A. T., Debus, B. M., Shaw, S. L., Edgerton, E. S., Joo, T., Ng, N. L., and Dillner, A. M.: Quantifying organic matter and functional groups in particulate matter filter samples from the southeastern United States – Part 2: Spatiotemporal trends, Atmos. Meas. Tech., 14, 4355–4374, https://doi.org/10.5194/amt-14-4355-2021, 2021.
Bro, R. and Smilde, A. K.: Centering and scaling in component analysis, J. Chemometr., 17, 16–33, https://doi.org/10.1002/cem.773, 2003.
Brown, S. G., Frankel, A., Raffuse, S. M., Roberts, P. T., Hafner, H. R., and Anderson, D. J.: Source Apportionment of Fine Particulate Matter in Phoenix, AZ, Using Positive Matrix Factorization, J. Air Waste Manage., 57, 741–752, https://doi.org/10.3155/1047-3289.57.6.741, 2007.
Bürki, C., Reggente, M., Dillner, A. M., Hand, J. L., Shaw, S. L., and Takahama, S.: Analysis of functional groups in atmospheric aerosols by infrared spectroscopy: method development for probabilistic modeling of organic carbon and organic matter concentrations, Atmos. Meas. Tech., 13, 1517–1538, https://doi.org/10.5194/amt-13-1517-2020, 2020.
Busca, G. and Resini, C.: Vibrational Spectroscopy for the Analysis of Geological and Inorganic Materials, in: Encyclopedia of Analytical Chemistry, John Wiley & Sons, Ltd, ISBN 978-0-470-02731-8, 2006.
Chow, J. C., Watson, J. G., Pritchett, L. C., Pierson, W. R., Frazier, C. A., and Purcell, R. G.: The DRI thermal/optical reflectance carbon analysis system: description, evaluation and applications in U.S. Air quality studies, Atmos. Environ. A-Gen., 27, 1185–1201, https://doi.org/10.1016/0960-1686(93)90245-T, 1993.
Chow, J. C., Watson, J. G., Chen, L. W. A., Chang, M. C. O., Robinson, N. F., Trimble, D., and Kohl, S.: The IMPROVE_A Temperature Protocol for Thermal/Optical Carbon Analysis: Maintaining Consistency with a Long-Term Database, J. Air Waste Manage., 57, 1014–1023, https://doi.org/10.3155/1047-3289.57.9.1014, 2007.
Chow, J. C., Wang, X., Sumlin, B. J., Gronstal, S. B., Chen, L.-W. A., Trimble, D. L., Watson, J. G., Kohl, S. D., Mayorga, S. R., Riggio, G., Hurbain, P. R., Johnson, M., and Zimmermann, R.: Optical Calibration and Equivalence of a Multiwavelength Thermal/Optical Carbon Analyzer, Aerosol Air Qual. Res., 15, 1145–1159, https://doi.org/10.4209/aaqr.2015.02.0106, 2015.
Chukanov, N. V. and Chervonnyi, A. D.: Infrared Spectroscopy of Minerals and Related Compounds, Springer International Publishing, ISBN 978-3-319-25347-3, 2016.
Cios, K., Pedrycz, W., and Swiniarski, R. W.: Data Mining Methods for Knowledge Discovery, Kluwer Academic Publishers, Norwell, MA, USA, 495 pp., ISBN 9780792382522, 1998.
Corrigan, A. L., Russell, L. M., Takahama, S., Äijälä, M., Ehn, M., Junninen, H., Rinne, J., Petäjä, T., Kulmala, M., Vogel, A. L., Hoffmann, T., Ebben, C. J., Geiger, F. M., Chhabra, P., Seinfeld, J. H., Worsnop, D. R., Song, W., Auld, J., and Williams, J.: Biogenic and biomass burning organic aerosol in a boreal forest at Hyytiälä, Finland, during HUMPPA-COPEC 2010, Atmos. Chem. Phys., 13, 12233–12256, https://doi.org/10.5194/acp-13-12233-2013, 2013.
Cunningham, P. T., Johnson, S. A., and Yang, R. T.: Variations in chemistry of airborne particulate material with particle size and time, Environ. Sci. Technol., 8, 131–135, https://doi.org/10.1021/es60087a002, 1974.
Debus, B., Takahama, S., Weakley, A. T., Seibert, K., and Dillner, A. M.: Long-Term Strategy for Assessing Carbonaceous Particulate Matter Concentrations from Multiple Fourier Transform Infrared (FT-IR) Instruments: Influence of Spectral Dissimilarities on Multivariate Calibration Performance, Appl. Spectrosc., 73, 271–283, https://doi.org/10.1177/0003702818804574, 2019.
Dillner, A. M. and Takahama, S.: Predicting ambient aerosol thermal–optical reflectance measurements from infrared spectra: elemental carbon, Atmos. Meas. Tech., 8, 4013–4023, https://doi.org/10.5194/amt-8-4013-2015, 2015a.
Dillner, A. M. and Takahama, S.: Predicting ambient aerosol thermal-optical reflectance (TOR) measurements from infrared spectra: organic carbon, Atmos. Meas. Tech., 8, 1097–1109, https://doi.org/10.5194/amt-8-1097-2015, 2015b.
Dillner, A. M., Debus, B., Weakley, A. T., Takahama, S., George, K. M., Schichtel, B., Copeland, S., and Wexler, A. S.: Data from “Quantification of major particulate matter species from a single filter type using infrared spectroscopy – Application to a large-scale monitoring network”, Dryad [data set], https://doi.org/10.25338/B8TP8V, 2021.
Draper, N. R. and Smith, H.: Applied Regression Analysis, 3rd edn., Wiley Publishers, ISBN 978-1-118-62568-2, 1998.
Eldred, R. and Ashbaugh, L. L.: Loss of particle nitrate from Teflon sampling filters: Effects on measured gravimetric mass in California and in the IMPROVE network, J. Air Waste Manage., 54, 93–104, https://doi.org/10.1080/10473289.2004.10470878, 2004.
Foster, R. D. and Walker, R. F.: Quantitative determination of crystalline silica in respirable-size dust samples by infrared spectrophotometry, Analyst, 109, 1117–1127, https://doi.org/10.1039/AN9840901117, 1984.
Friedel, R. A. and Carlson, G. L.: Infrared spectra of ground graphite, J. Phys. Chem., 75, 1149–1151, https://doi.org/10.1021/j100678a021, 1971.
Hahn, A., Vogel, H., Andó, S., Garzanti, E., Kuhn, G., Lantzsch, H., Schüürman, J., Vogt, C., and Zabel, M.: Using Fourier transform infrared spectroscopy to determine mineral phases in sediments, Sediment. Geol., 375, 27–35, https://doi.org/10.1016/j.sedgeo.2018.03.010, 2018.
Hastie, T., Tibshirani, R., and Friedman, J.: The Elements of Statistical Learning: Data Mining, Inference, and Prediction, Second Edition, Springer New York, New York, NY, ISBN 9780387848587, 2009.
Hawkins, L. N., Russell, L. M., Covert, D. S., Quinn, P. K., and Bates, T. S.: Carboxylic acids, sulfates, and organosulfates in processed continental organic aerosol over the southeast Pacific Ocean during VOCALS-REx 2008, J. Geophys. Res.-Atmos., 115, D13201, https://doi.org/10.1029/2009jd013276, 2010.
Holmes, C. W. and Miller, R.: Atmospherically transported elements and deposition in the Southeastern United States: local or transoceanic?, Appl. Geochem., 19, 1189–1200, https://doi.org/10.1016/j.apgeochem.2004.01.015, 2004.
Hyslop, N. P., Trzepla, K., and White, W. H.: Reanalysis of Archived IMPROVE PM2.5 Samples Previously Analyzed over a 15-Year Period, Environ. Sci. Technol., 46, 10106, https://doi.org/10.1021/es301823q, 2012.
Hyslop, N. P., Trzepla, K., and White, W. H.: Assessing the Suitability of Historical PM2.5 Element Measurements for Trend Analysis, Environ. Sci. Technol., 49, 9247–9255, https://doi.org/10.1021/acs.est.5b01572, 2015.
Kuzmiakova, A., Dillner, A. M., and Takahama, S.: An automated baseline correction protocol for infrared spectra of atmospheric aerosols collected on polytetrafluoroethylene (Teflon) filters, Atmos. Meas. Tech., 9, 2615–2631, https://doi.org/10.5194/amt-9-2615-2016, 2016.
Li, H.-D., Xu, Q.-S., and Liang, Y.-Z.: libPLS: An integrated library for partial least squares regression and linear discriminant analysis, Chemometr. Intell. Lab., 176, 34–43, https://doi.org/10.1016/j.chemolab.2018.03.003, 2018.
Liu, S., Ahlm, L., Day, D. A., Russell, L. M., Zhao, Y., Gentner, D. R., Weber, R. J., Goldstein, A. H., Jaoui, M., Offenberg, J. H., Kleindienst, T. E., Rubitschun, C., Surratt, J. D., Sheesley, R. J., and Scheller, S.: Secondary organic aerosol formation from fossil fuel sources contribute majority of summertime organic mass at Bakersfield, J. Geophys. Res.-Atmos., 117, D00V26, https://doi.org/10.1029/2012JD018170, 2012.
Madejová, J. and Komadel, P.: Baseline studies of the clay minerals society source clays: Infrared methods, Clay. Clay Miner., 49, 410–432, https://doi.org/10.1346/CCMN.2001.0490508, 2001.
Mahalanobis, P. C.: On the generalized distance in statistics, Proceedings of the National Institute of Sciences (Calcutta), 2, 49–55, 1936.
Malm, W. C., Sisler, J. F., Huffman, D., Eldred, R. A., and Cahill, T. A.: Spatial and seasonal trends in particle concentration and optical extinction in the United States, J. Geophys. Res., 99, 1347–1370, https://doi.org/10.1029/93jd02916, 1994.
Margenot, A. J., Calderón, F. J., Goyne, K. W., Mukome, F. N. D., and Parikh, S. J.: IR Spectroscopy, Soil Analysis Applications, in: Encyclopedia of Spectroscopy and Spectrometry (Third Edition), edited by: Lindon, J. C., Tranter, G. E., and Koppenaal, D. W., Academic Press, Oxford, 448–454, https://doi.org/10.1016/B978-0-12-409547-2.12170-5, 2017.
Mayo, D. W., Miller, F. A., and Hannah, R. W.: Course Notes on the Interpretation of Infrared and Raman Spectra, John Wiley & Sons, Hoboken, NJ, ISBN 978-0-471-24823-1, 2004.
McClenny, W. A., Childers, J. W., Rōhl, R., and Palmer, R. A.: FTIR transmission spectrometry for the nondestructive determination of ammonium and sulfate in ambient aerosols collected on teflon filters, Atmos. Environ., 19, 1891–1898, https://doi.org/10.1016/0004-6981(85)90014-9, 1985.
Nemanich, R. J., Lucovsky, G., and Solin, S. A.: Infrared active optical vibrations of graphite, Solid State Commun., 23, 117–120, https://doi.org/10.1016/0038-1098(77)90663-9, 1977.
Ngo, M. A., Pinkerton, K. E., Freeland, S., Geller, M., Ham, W., Cliff, S., Hopkins, L. E., Kleeman, M. J., Kodavanti, U. P., Meharg, E., Plummer, L., Recendez, J. J., Schenker, M. B., Sioutas, C., Smiley-Jewell, S., Haas, C., Gutstein, J., and Wexler, A. S.: Airborne particles in the San Joaquin Valley may affect human health, Calif. Agr., 64, 12–16, https://doi.org/10.3733/ca.v064n01p12, 2010.
Niyogi, S., Bekyarova, E., Itkis, M. E., McWilliams, J. L., Hamon, M. A., and Haddon, R. C.: Solution Properties of Graphite and Graphene, J. Am. Chem. Soc., 128, 7720–7721, https://doi.org/10.1021/ja060680r, 2006.
O'Dell, K., Ford, B., Fischer, E. V., and Pierce, J. R.: Contribution of wildland-fire smoke to US PM2.5 and its influence on recent trends, Environ. Sci. Technol., 53, 1797–1804, https://doi.org/10.1021/acs.est.8b05430, 2019.
Parks, D. A., Griffiths, P. R., Weakley, A. T., and Miller, A. L.: Quantifying elemental and organic carbon in diesel particulate matter by mid-infrared spectrometry, Aerosol Sci. Tech., 55, 1014–1027, https://doi.org/10.1080/02786826.2021.1917764, 2021.
Pollard, M., Jaklevic, J., and Howes, J.: Fourier Transform Infrared and Ion-Chromatographic Sulfate Analysis of Ambient Air Samples, Aerosol Sci. Tech., 12, 105–113, https://doi.org/10.1080/02786829008959330, 1990.
Reggente, M., Dillner, A. M., and Takahama, S.: Predicting ambient aerosol thermal–optical reflectance (TOR) measurements from infrared spectra: extending the predictions to different years and different sites, Atmos. Meas. Tech., 9, 441–454, https://doi.org/10.5194/amt-9-441-2016, 2016.
Reggente, M., Dillner, A. M., and Takahama, S.: Analysis of functional groups in atmospheric aerosols by infrared spectroscopy: systematic intercomparison of calibration methods for US measurement network samples, Atmos. Meas. Tech., 12, 2287–2312, https://doi.org/10.5194/amt-12-2287-2019, 2019.
Russell, L. M., Bahadur, R., and Ziemann, P. J.: Identifying organic aerosol sources by comparing functional group composition in chamber and atmospheric particles, P. Natl. Acad. Sci. USA, 108, 3516–3521, https://doi.org/10.1073/pnas.1006461108, 2011.
Ruthenburg, T. C., Perlin, P. C., Liu, V., McDade, C. E., and Dillner, A. M.: Determination of organic matter and organic matter to organic carbon ratios by infrared spectroscopy with application to selected sites in the IMPROVE network, Atmos. Environ., 86, 47–57, https://doi.org/10.1016/j.atmosenv.2013.12.034, 2014.
Savitzky, A. and Golay, M. J. E.: Smoothing and differentiation of data by simplified least squares procedures, Anal. Chem., 36, 1627–1639, https://doi.org/10.1021/ac60214a047, 1964.
Schichtel, B. A., Malm, W. C., Bench, G., Fallon, S., McDade, C. E., Chow, J. C., and Watson, J. G.: Fossil and contemporary fine particulate carbon fractions at 12 rural and urban sites in the United States, J. Geophys. Res.-Atmos., 113, D02311, https://doi.org/10.1029/2007jd008605, 2008.
Senthil Kumar, R. and Rajkumar, P.: Characterization of minerals in air dust particles in the state of Tamilnadu, India through ftir spectroscopy, Atmos. Chem. Phys. Discuss., 13, 22221–22248, https://doi.org/10.5194/acpd-13-22221-2013, 2013.
Snijders, T. A. B. and Bosker, R. J.: Multilevel Analysis: An Introduction to Basic and Advanced Multilevel Modeling, SAGE, 370 pp., ISBN 978-1-4462-5433-2, 2011.
Sorooshian, A., Wonaschütz, A., Jarjour, E. G., Hashimoto, B. I., Schichtel, B. A., and Betterton, E. A.: An aerosol climatology for a rapidly growing arid region (southern Arizona): Major aerosol species and remotely sensed aerosol properties, J. Geophys. Res.-Atmos., 116, D19205, https://doi.org/10.1029/2011jd016197, 2011.
Takahama, S., Schwartz, R. E., Russell, L. M., Macdonald, A. M., Sharma, S., and Leaitch, W. R.: Organic functional groups in aerosol particles from burning and non-burning forest emissions at a high-elevation mountain site, Atmos. Chem. Phys., 11, 6367–6386, https://doi.org/10.5194/acp-11-6367-2011, 2011.
Takahama, S., Dillner, A. M., Weakley, A. T., Reggente, M., Bürki, C., Lbadaoui-Darvas, M., Debus, B., Kuzmiakova, A., and Wexler, A. S.: Atmospheric particulate matter characterization by Fourier transform infrared spectroscopy: a review of statistical calibration strategies for carbonaceous aerosol quantification in US measurement networks, Atmos. Meas. Tech., 12, 525–567, https://doi.org/10.5194/amt-12-525-2019, 2019.
Tuinstra, F. and Koenig, J. L.: Raman Spectrum of Graphite, J. Chem. Phys., 53, 1126–1130, https://doi.org/10.1063/1.1674108, 1970.
Watson, J. G. and Chow, J. C.: A wintertime PM2.5 episode at the Fresno, CA, supersite, Atmos. Environ., 36, 465–475, https://doi.org/10.1016/S1352-2310(01)00309-0, 2002.
Watson, J. G., Chow, J. C., Lowenthal, D. H., Antony Chen, L.-W., Shaw, S., Edgerton, E. S., and Blanchard, C. L.: PM2.5 source apportionment with organic markers in the Southeastern Aerosol Research and Characterization (SEARCH) study, J. Air Waste Manage., 65, 1104–1118, https://doi.org/10.1080/10962247.2015.1063551, 2015.
Weakley, A. T., Takahama, S., and Dillner, A. M.: Ambient aerosol composition by infrared spectroscopy and partial least-squares in the chemical speciation network: Organic carbon with functional group identification, Aerosol Sci. Tech., 50, 1096–1114, https://doi.org/10.1080/02786826.2016.1217389, 2016.
Weakley, A. T., Takahama, S., Wexler, A. S., and Dillner, A. M.: Ambient aerosol composition by infrared spectroscopy and partial least squares in the chemical speciation network: Multilevel modeling for elemental carbon, Aerosol Sci. Tech., 52, 642–654, https://doi.org/10.1080/02786826.2018.1439571, 2018a.
Weakley, A. T., Takahama, S., and Dillner, A. M.: Thermal/optical reflectance equivalent organic and elemental carbon determined from federal reference and equivalent method fine particulate matter samples using Fourier transform infrared spectrometry, Aerosol Sci. Tech., 52, 1048–1058, https://doi.org/10.1080/02786826.2018.1504161, 2018b.
White, W. H., Trzepla, K., Hyslop, N. P., and Schichtel, B. A.: A critical review of filter transmittance measurements for aerosol light absorption, and de novo calibration for a decade of monitoring on PTFE membranes, Aerosol Sci. Tech., 50, 984–1002, https://doi.org/10.1080/02786826.2016.1211615, 2016.
Whitehill, A. R., George, I., Long, R., Baker, K. R., and Landis, M.: Volatile organic compound emissions from prescribed burning in tallgrass prairie ecosystems, Atmosphere, 10, 464, https://doi.org/10.3390/atmos10080464, 2019.
Wold, S., Sjöström, M., and Eriksson, L.: PLS-regression: A basic tool of chemometrics, Chemometr. Intell. Lab., 58, 109–130, https://doi.org/10.1016/S0169-7439(01)00155-1, 2001.
Wu, H. B., Chan, M. N., and Chan, C. K.: FTIR Characterization of Polymorphic Transformation of Ammonium Nitrate, Aerosol Sci. Tech., 41, 581–588, https://doi.org/10.1080/02786820701272038, 2007.
Yazdani, A., Dudani, N., Takahama, S., Bertrand, A., Prévôt, A. S. H., El Haddad, I., and Dillner, A. M.: Characterization of primary and aged wood burning and coal combustion organic aerosols in an environmental chamber and its implications for atmospheric aerosols, Atmos. Chem. Phys., 21, 10273–10293, https://doi.org/10.5194/acp-21-10273-2021, 2021a.
Yazdani, A., Dillner, A. M., and Takahama, S.: Estimating mean molecular weight, carbon number, and OM OC with mid-infrared spectroscopy in organic particulate matter samples from a monitoring network, Atmos. Meas. Tech., 14, 4805–4827, https://doi.org/10.5194/amt-14-4805-2021, 2021b.
Zhang, X., Trzepla, K., White, W., Raffuse, S., and Hyslop, N. P.: Intercomparison of thermal–optical carbon measurements by Sunset and Desert Research Institute (DRI) analyzers using the IMPROVE_A protocol, Atmos. Meas. Tech., 14, 3217–3231, https://doi.org/10.5194/amt-14-3217-2021, 2021.