the Creative Commons Attribution 4.0 License.
the Creative Commons Attribution 4.0 License.
 | 30 May 2022
Aircraft-engine particulate matter emissions from conventional and sustainable aviation fuel combustion: comparison of measurement techniques for mass, number, and size
Joel C. Corbin
Tobias Schripp
Bruce E. Anderson
Greg J. Smallwood
Patrick LeClercq
Ewan C. Crosbie
Steven Achterberg
Philip D. Whitefield
Richard C. Miake-Lye
Zhenhong Yu
Andrew Freedman
Max Trueblood
David Satterfield
Wenyan Liu
Patrick Oßwald
Claire Robinson
Michael A. Shook
Richard H. Moore
Sustainable aviation fuels (SAFs) have different compositions compared to conventional petroleum jet fuels, particularly in terms of fuel sulfur and hydrocarbon content. These differences may change the amount and physicochemical properties of volatile and non-volatile particulate matter (nvPM) emitted by aircraft engines. In this study, we evaluate whether comparable nvPM measurement techniques respond similarly to nvPM produced by three blends of SAFs compared to three conventional fuels. Multiple SAF blends and conventional (Jet A-1) jet fuels were combusted in a V2527-A5 engine, while an additional conventional fuel (JP-8) was combusted in a CFM56-2C1 engine.
We evaluated nvPM mass concentration measured by three real-time measurement techniques: photoacoustic spectroscopy, laser-induced incandescence, and the extinction-minus-scattering technique. Various commercial instruments were tested, including three laser-induced incandescence (LII) 300s, one photoacoustic extinctiometer (PAX), one micro soot sensor (MSS+), and two cavity-attenuated phase shift PMSSA (CAPS PMSSA) instruments. Mass-based emission indices (EIm) reported by these techniques were similar, falling within 30 % of their geometric mean for EIm above 100 mg per kg fuel (approximately 10 µg PM m−3 at the instrument); this geometric mean was therefore used as a reference value. Additionally, two integrative measurement techniques were evaluated: filter photometry and particle size distribution (PSD) integration. The commercial instruments used were one tricolor absorption photometer (TAP), one particle soot absorption photometer (PSAP), and two scanning mobility particle sizers (SMPSs). The TAP and PSAP were operated at 5 % and 10 % of their nominal flow rates, respectively, to extend the life of their filters. These techniques are used in specific applications, such as on board research aircraft to determine particulate matter (PM) emissions at cruise. EIm reported by the alternative techniques fell within approximately 50 % of the mean aerosol-phase EIm.
In addition, we measured PM-number-based emission indices using PSDs and condensation particle counters (CPCs). The commercial instruments used included TSI SMPSs, a Cambustion differential mobility spectrometer (DMS500), and an AVL particle counter (APC), and the data also fell within approximately 50 % of their geometric mean. The number-based emission indices were highly sensitive to the accuracy of the sampling-line penetration functions applied as corrections. In contrast, the EIm data were less sensitive to those corrections since a smaller volume fraction fell within the size range where corrections were substantial. A separate, dedicated experiment also showed that the operating laser fluence used in the LII 300 laser-induced incandescence instrument for aircraft-engine nvPM measurement is adequate for a range of SAF blends investigated in this study. Overall, we conclude that all tested instruments are suitable for the measurement of nvPM emissions from the combustion of SAF blends in aircraft engines.
- Article
(4223 KB) - Full-text XML
- BibTeX
- EndNote


Aircraft-engine particulate matter (PM) emissions are composed of non-volatile (black carbon, metal ash, oxygenated functional groups) and volatile components (volatile organic compounds, nitrates, sulfates) (Gagné et al., 2021; Masiol and Harrison, 2014; Petzold et al., 2013). Non-volatile particulate matter (nvPM) emissions are formed in the combustor, while volatile particulate matter (vPM) emissions, present in the gas phase at the engine exit, condense after emission. Aircraft engines emit vPM with orders of magnitude similar to or greater than nvPM, especially after the vapour pressure of volatile species is lowered by oxidative ageing (Kılıç et al., 2018) or by cooling (Beyersdorf et al., 2014). The nvPM and vPM are constituents of total PM, which affects air quality, health, and climate. The International Civil Aviation Organization (ICAO) has developed standards and recommended practices (SARPs) for measuring the mass- and number-based emissions of nvPM emitted from aircraft engines with maximum rated thrust > 26.7 kN (ICAO, 2017). Currently, SARPs have not been established for vPM or total PM (Lobo et al., 2020). The SARPs for nvPM specify standardized sampling and measurement protocols (SAE, 2013, 2018; ICAO, 2017), which have been extensively evaluated and validated (Lobo et al., 2015b, 2020; Kinsey et al., 2021). The nvPM regulatory limits are applicable for type certification of aircraft engines, but they do not address the vPM, which may have substantial environmental impacts.
To reduce CO2 emissions, mitigate environmental impacts, and make the aviation sector more sustainable, a significant effort is underway to develop and deploy sustainable aviation fuels (SAFs). Various feedstocks and different conversion pathways can be used to produce SAFs (Hileman and Stratton, 2014), which differ in chemical and physical properties compared to conventional petroleum jet fuel (Vozka et al., 2019), most notably by lacking aromatic and sulfur species that are precursors to nvPM and vPM emissions. New SAF candidates must undergo a rigorous qualification and approval process (ASTM D4054, 2019) prior to being certified under the ASTM D7566 (2020) standard specification as a blending component. Currently, the ASTM D7566 standard allows for SAF blend ratios of up to 50 % with conventional fuel for drop-in fuels (Wilson et al., 2013).
The combustion of neat SAFs and blends with conventional jet fuel has been shown to result in different PM emissions characteristics as a function of engine type and operating condition (Beyersdorf et al., 2014; Brem et al., 2015; Corporan et al., 2011; Lobo et al., 2011, 2015a, 2016; Moore et al., 2017; Schripp et al., 2018, 2019; Timko et al., 2010). In addition to changes in PM mass- and number-based emissions, SAF combustion results in changes to particle size distributions (PSDs) (Beyersdorf et al., 2014; Cain et al., 2013; Kinsey et al., 2012; Lobo et al., 2011, 2015a, 2016; Schripp et al., 2018; Timko et al., 2010), chemical composition (Elser et al., 2019; Kinsey et al., 2012; Timko et al., 2013; Williams et al., 2012), morphology (Huang and Vander Wal, 2013; Kumal et al., 2020; Liati et al., 2019), hygroscopic properties (Trueblood et al., 2018), and optical properties (Elser et al., 2019).
The standardized sampling and measurement protocol for aircraft-engine nvPM emissions was designed and validated for engine certification tests using conventional jet fuel. The SARPs require that number-based nvPM emissions are measured with a butanol-based condensation-nuclei counter with a 50 % cut-off size of, at most, 10 nm sampling in single-particle-counting mode downstream of a diluter and volatile particle remover. For mass-based nvPM emissions, the instrument must be insensitive to vPM and able to meet performance specifications for repeatability, zero drift, linearity, limit of detection, rise time, sampling interval, accuracy, and applicability. Limited information is available on aircraft-engine nvPM emissions characteristics measured with the standardized system for different engine types burning SAFs and blends with conventional fuel (Durdina et al., 2021; Durand et al., 2021; Elser et al., 2019; Lobo et al., 2015a, 2016).
The standardized system components are not easily adaptable for use on aircraft for measurement of cruise level nvPM emissions. Consequently, there are no comparable in-flight engine-emissions data available for developing and validating models that predict cruise nvPM emissions based on engine certification data. Particle size distribution measurements are also not included in the standardized system, which are important for assessing the effects of fuels, operating conditions, and engine technologies on the environmental impacts of PM emissions. Thus to advance our understanding of aircraft-engine emissions and the factors that control them, as well as to develop a large and consistent observational database, it is important to evaluate the relative performance of other diagnostic instruments that are not prescribed in the standardized protocol but meet these needs. Such instruments must be evaluated for their response to nvPM and total PM emissions from aircraft engines using standardized and non-standardized systems and for measurements at the engine exit plane and downstream of the engine in the near field, since these instruments are typically used with minimal change to their operating parameters for a wide range of sampling conditions. Very limited data are available in the literature for this purpose, and no data have yet been published for SAFs.
Here, we present the inter-comparison of real-time measurements of aircraft-engine nvPM emissions in terms of physical characteristics such as mass, number, and size distributions using different diagnostic instruments and measurement principles. The nvPM mass emissions were evaluated using three real-time measurement techniques: photoacoustic spectroscopy, the extinction-minus-scattering technique, and laser-induced incandescence (LII), and two alternative measurement techniques widely used in laboratories and on board aircraft, filter-based photometry and PSD integration. We note that one of the photoacoustic instruments and the LII instruments have been demonstrated to be compliant with the ICAO SARPs' performance specifications. The PM number-based emissions were measured using a condensation particle counter (CPC). The PSD characteristics measured by scanning mobility particle sizers and an electrical mobility spectrometer were also compared. The nvPM and total PM emissions were delineated using a thermodenuder and a catalytic stripper. We also report the effect of laser fluence on the laser-induced incandescence of nvPM for SAF combustion as changing carbon nanostructure is known to influence particle light absorption and consequently LII signals and hence the derived nvPM mass concentration. The impact of fuel composition on PM emissions will be reported separately (Schripp et al., 2022).
The observations presented in this paper were collected during the NASA/DLR-Multidisciplinary Airborne Experiment (ND-MAX) Emission and Climate Impact of Alternative Fuel (ECLIF) 2 campaign that was conducted at Ramstein Air Base, Ramstein-Miesenbach, Germany, in January–February 2018. The campaign included ground-based and in-flight measurements of emissions from the DLR Advanced Technology Research Aircraft (ATRA) A320 aircraft with V2527-A5 engines running on two conventional jet fuels and three blends with SAF. The main objective of the ground-based measurements was to characterize the nvPM, total PM, and hydrocarbon emissions as functions of engine thrust condition and fuel composition. Several identical instruments were included in the in-flight sampling aircraft (NASA DC-8) and ground measurement diagnostic instrument suites to enable comparisons of engine emissions during ground and airborne operations and create a data set for testing cruise emission models. The NASA DC-8 aircraft with CFM56-2C1 engines was also used as an emissions source to compare various emissions diagnostic instruments during the ground-based measurements.
2.1 Engine and fuels
In the majority of this work, emissions were sampled from a single IAE mixed-flow V2527-A5 starboard engine of the DLR ATRA aircraft (Airbus A320-232). The engine was operated on two conventional, petroleum jet fuels, referred to as REF3 and REF4, and three sustainable aviation fuel blends, referred to as SAF1, SAF2, and SAF3. The abbreviations for the two conventional petroleum fuels are used to avoid confusion with the previous ECLIF campaign (Schripp et al., 2018).
Table 1Properties of the fuels used for the ground-based measurements (fuel samples acquired from wing-tank after test).
A limited number of experiments were also performed with JP-8 fuel, combusted in the starboard CFM56-2C1 engine (no. 3) of the NASA DC-8 aircraft. Due to limited fuel availability, none of the other five fuels could be combusted in the CFM56-2C1 engine. The properties of the six fuels are summarized in Table 1.
2.2 Ambient conditions
The measurements presented here were performed outdoors during winter in western Germany. Detailed meteorology for each test point is given in the “Data availability” section. The minimum, median, and maximum temperatures were 2.3, 2.9, and 8.3 ∘C, respectively. Conditions were humid (> 83 % humidity) and sometimes rainy. Winds ranged from 0 to 15.5 km h−1, and wind direction was sometimes variable. The median wind direction was southwesterly, while the source aircraft was oriented facing to the east. Consequently, winds blowing approximately 45∘ angle from the right rear of the source aircraft sometimes prevented the engine emissions from reaching the sampling probe at low engine thrust settings.
2.3 Emissions sampling
An extensive suite of aerosol and gas-phase instruments operated by the members of six different institutions was deployed in two different shipping containers to characterize the emissions (Table 2, Fig. 1). The complete emission-sampling setup is discussed in a companion paper (Schripp et al., 2022). Briefly, emissions were sampled through a probe located 43 m downstream of the starboard engine of the aircraft. The probe was placed in front of a blast fence located on the western side of the Ramstein Air Base flight line, and the fence redirected the engine exhaust upwards for safety. The probe was connected to a 18.5 mm ID, 20 m long electrically conductive sampling line heated to 60 ∘C, that transported flow to a sampling plenum maintained at 33 ∘C. To minimize residence time and particle losses in this sampling line, a pump ensured that a total of at least 137 L min−1 flowed through the sampling manifold at all times. Higher flows produce an unacceptably large pressure drop in the primary sampling line. The majority of this flow was discarded as excess.
Table 2Instruments used to measure nvPM and key measured properties. All instruments reported data at 1 s intervals except the SMPSs (45 s intervals for NRC and DLR, 60 s for NASA) and filter samplers. Instrument abbreviations are defined in the text.
a nvPM measured via particulate absorption as equivalent BC (eBC). b Particle size distribution, here measured with respect to mobility diameter. c nvPM measured via laser-induced incandescence as refractory BC (rBC). d Numbers are indices corresponding to the penetration functions shown in Fig. 4.
Figure 1Schematic of sampling configuration behind the DLR ATRA aircraft. The length and flow rate of sampling lines from the manifold to the various instruments varied as described in the text. The NRC and NASA instruments were all placed within Container 1, while the NARS and ARI instruments were placed in Container 2. For simplicity, the figure omits a short heated line connecting the first plenum to the NARS. The ARI instruments were downstream of all NARS instruments except the DMS500 (see Lobo et al., 2016, for detailed NARS diagram). NARS is the North American Reference System.
Table 3Summary of the ratios between the EIm of individual instruments and the geometric mean of the Group 1 (real-time) instruments. The corresponding raw data are shown in Fig. 11. Regression: linear regression against Group 1 geometric mean weighted by standard deviations, with k = 2 uncertainties from fit. SD: standard deviation. RSD: relative SD. Group 1: real-time instruments. Group 2: integrative instruments.
a PSAP operated at 10 % of its nominal flow rate. b TAP operated at 5 % of its nominal flow rate.
The plenum was placed inside a modified shipping container (Container 1) behind the blast fence, along with the NRC, DLR, and NASA instruments. The North American Reference System (NARS) was connected to the plenum by a short section of heated line to the NARS dilutor box, which was heated to 60 ± 15 ∘C and contained a custom Dekati dilutor with a dilution factor of approximately 4 (less than the standard Dekati dilutor factor of 8 to 14). A 25 m line heated to 60 ± 15 ∘C transferred sample aerosols flow from the dilutor box to a second shipping container (Container 2), where the MST and ARI instruments were connected. The NARS components include the 25 m heated line, attached diluters, and MST instrument suite; the system is compliant with specifications for the standardized nvPM sampling and measurement system (SAE, 2013, 2018; ICAO, 2017), and its performance has been demonstrated and evaluated in previous studies (Lobo et al., 2015b, 2016, 2020). Additional instrumentation installed as part of the NARS included a fast electrical mobility spectrometer (Cambustion differential mobility spectrometer (DMS500)), an Aerodyne aerosol mass spectrometer (results not presented here), and a CAPS PMSSA monitor (Aerodyne Research Inc.). The details of the instruments installed inside these two containers are listed in Table 3.
2.3.1 Gaseous measurements
A suite of gaseous emissions was measured in this study, as summarized in Table 2. The CO2 measurements from the NASA LI-COR 7000 were in good agreement with those taken by DLR (MKS MultiGas 2030 Fourier transform infrared (FTIR) continuous gas analyzer) and MST (LI-COR model 840A) but had a faster response time and were therefore used as the reference for instruments in Container 1. Instruments in Container 2 used the MST measurements as reference.
2.3.2 nvPM number and particle size distributions (PSDs)
The nvPM number concentration was measured directly by a certification-test-compliant particle counter (APC; AVL Inc., which contains a TSI Model 3790E CPC and volatile particle remover), which was part of the NARS in Container 2. PSDs were measured with two technologies: scanning mobility particle sizers (SMPSs; TSI Inc.) and electrical mobility sizers (EMSs). Two types of EMS were used, the Cambustion DMS500 (in Container 2, measuring particles 5 to 1000 nm in diameter; data processed with a bimodal calibration matrix and log-normal inversion) and the TSI Engine Exhaust Particle Sizer (EEPS; Container 1, measuring particles from 6 to 523 nm). However, the EEPS data were excluded from this analysis due to unidentified problems with the instrument which led to anomalous PSDs.
Two SMPSs measured nvPM PSDs. An SMPS operated by NRC measured particles 10 to 278 nm in diameter downstream of a catalytic stripper (Model CS015, Catalytic Instruments GmbH), which heated samples to 350 ∘C before oxidizing gas-phase volatile organic compounds (VOCs) to prevent them from recondensing after exiting the device. Another SMPS operated by NASA measured particles 10 to 278 nm in diameter either directly or downstream of a NASA-constructed thermodenuder (TD), also operated at 350 ∘C. The TD employs a concentric activated charcoal filter downstream of the sample heater to prevent re-condensation of volatile species. TDs are commonly used on board aircraft for measuring nvPM number concentration and size distributions (Clarke, 1991; Moore et al., 2017) and have been shown to effectively evaporate nucleation- and accumulation-mode sulfate and organic aerosols (Beyersdorf et al., 2014; Schripp et al., 2018).
2.3.3 nvPM mass measurements
In this study, most of the nvPM mass data were derived from light absorption coefficients (units of m−1), either determined in flow-through sample cells (the CAPS PMSSA, photoacoustic extinctiometer (PAX), and micro soot sensor (MSS) introduced below) or after collecting particles onto a filter (the TAP and particle soot absorption photometer (PSAP) introduced below). Such absorption measurements can be converted to equivalent black carbon or eBC mass concentrations (units of g m−3; Petzold et al., 2013) by dividing them by a reference mass absorption cross-section (MAC; units of m2 g−1). The LII measurements also rely on light absorption, although the measurand is not absorption but incandescence at two wavelengths and is termed rBC (Petzold et al., 2013; Michelsen et al., 2015).
The reference MAC used to report eBC represents an assumed physical property of the nvPM emitted by the engine at a given time. The extensive review of Bond and Bergstrom (2006) concluded that the MAC at 550 nm of externally mixed BC from a variety of sources could be summarized as 7.5 ± 1.2 m2 g−1; the more recent review of in situ measurements by Liu et al. (2020) recommended 8.0 ± 0.7 m2 g−1 at 550 nm. In this study, we have used the Bond and Bergstrom value of 7.5 m2 g−1 for consistency with earlier work and instrument software. These values are assumed to vary inversely with wavelength, with an Ångström (power) exponent of 1; for example, the 660 nm CAPS PMSSA monitor data were processed with a MAC of 7.5 m2 g−1 × (660 nm/550 nm)−1 = 6.5 m2 g−1.
One eBC technique, the CAPS PMSSA monitor (Aerodyne Research Inc.; Onasch et al., 2015), derives absorption coefficients as the difference between measured aerosol extinction and scattering coefficients, from which eBC concentrations were calculated as described above. The CAPS PMSSA measures light extinction by the calibration-free cavity attenuation phase shift (CAPS) technique and light scattering with an integrating nephelometer. The CAPS technique measures the lifetime of photons in a high-finesse optical cavity comprised of two high-reflectivity mirrors, from which the extinction coefficient can be calculated. An integrating nephelometer captures light scattered from a section of this cavity and is calibrated using the measured extinction of small (Rayleigh regime) non-absorbing particles. In this study, two CAPS PMSSA monitors were present, one operated at 630 nm wavelength by ARI and the other at 660 nm wavelength by NRC. The scattering channel of the NRC CAPS PMSSA was calibrated on-site using nebulized and dried ammonium sulfate particles; the other instruments were similarly calibrated prior to the campaign at the manufacturer using 200 nm ammonium sulfate. For the sub-200 nm particles measured in this study, no truncation corrections (Modini et al., 2021) were necessary.
Two other eBC instruments were based on photoacoustic spectroscopy, namely the photoacoustic extinctiometer (PAX; DMT Inc.; Nakayama et al., 2015) and the micro soot sensor (MSS; AVL GmbH; Schindler et al., 2004). In both of these instruments, aerosol absorption is measured by the periodic heating of particles using a modulated laser, resulting in the generation of pressure waves which are amplified by an acoustic cell and detected by a microphone. The PAX was calibrated using nebulized ammonium sulfate as well as graphitic nanoparticles (Aquadag).
During on-site calibration of the PAX using graphitic Aquadag nanoparticles, the PAX signals were observed to drift slowly upwards after each baseline. We were nevertheless able to obtain useful data by configuring the PAX to auto-baseline every 180 s and only using the first 15 s of measurements after each baseline. After the campaign, it was found that a component of the circuit board was damaged during the initial shipment. In spite of this electrical problem, the PAX data do not represent outliers in the following analysis.
Two additional pairs of eBC instruments were deployed at the ground site and on board the NASA DC-8 that measured aerosol absorption coefficients based on filter attenuation, namely a particle soot absorption photometer (PSAP; Radiance Research; Bond et al., 1999) and tricolor absorption photometer (TAP; Brechtel Manufacturing Inc.; Ogren et al., 2017). These instruments were designed as low-cost, low-maintenance devices for monitoring aerosol optical properties in the background atmosphere (i.e. at low concentrations) and have been used previously in airborne and ground-based studies (Moore et al., 2017). In these instruments, particles are continuously collected onto an internal filter, while its light attenuation is measured. The change in light attenuation over time is used to calculate absorption coefficients. This calculation requires post-processing to correct for filter loading effects (which do not require independent measurements) and may also be corrected for light attenuation due to scattering rather than absorption (which requires an independent nephelometer measurement) (Virkkula, 2010). Other sources of error include non-linearities due to size-dependent penetration of particles into the filter media and the evaporation of volatile species over time (Lack et al., 2014; Nakayama et al., 2010). We note that the TAP automatically advances its filter when its transmission drops below 80 %, whereas the PSAP requires a manual filter change. The PSAP filter was therefore changed manually before each set of experiments herein, to ensure that its filter transmission remained above 80 % during all measurements.
Three Artium LII 300 (Artium Technologies) instruments measured rBC, based on two-colour pulsed laser-induced incandescence (LII) (Snelling et al., 2005). These instruments heat nvPM using a 1064 nm pulsed laser and measure the resulting incandescence at two wavelength bands. From this measurement, rBC temperature and mass concentrations can be calculated. One of the LII 300s was a component of the NARS. Of the other two, one was dedicated to an experiment where its operating conditions were varied (Sect. 4.6). Therefore, only two LII 300s were measuring real-time nvPM mass concentration simultaneously at any given time. The MSS+ and the LII 300s were calibrated by reference to the elemental carbon mass (defined by thermal–optical analysis) produced by a laboratory diffusion-flame combustion aerosol source using measurements at three mass concentrations spanning 0.1 to 0.5 mg m−3 (SAE, 2018).
Finally, the SMPS PSDs were converted to equivalent mass concentrations by the integrated PSD approach, described in detail by Momenimovahed and Olfert (2015). In brief, the equivalent mass of each SMPS-reported mobility diameter was calculated using an effective density of 1000 kg m−3, which has been shown to produce better than 20 % accuracy relative to more complete, size-resolved effective densities (Durdina et al., 2014).
2.4 Data analysis
2.4.1 Emission index calculations
The raw data were analyzed over comparable time intervals and cross-checked by independent calculations. The general analysis proceeded as described in this section. First, the time series of measured CO2 concentrations was used as a reference against which to synchronize all time series, based on rapid rises and falls in the observed concentrations (measured at 1 Hz) when the engine thrust condition underwent large changes (as shown at 08:00 local time in Fig. 2). All instruments were synchronized against the NASA CO2 sensor except the instruments in Container 2, which was synchronized against the MST LI-COR CO2 sensor, because of the additional dilution stage. The time synchronization accounted for different lag times due to differences in the response times and clock accuracy of each instrument.
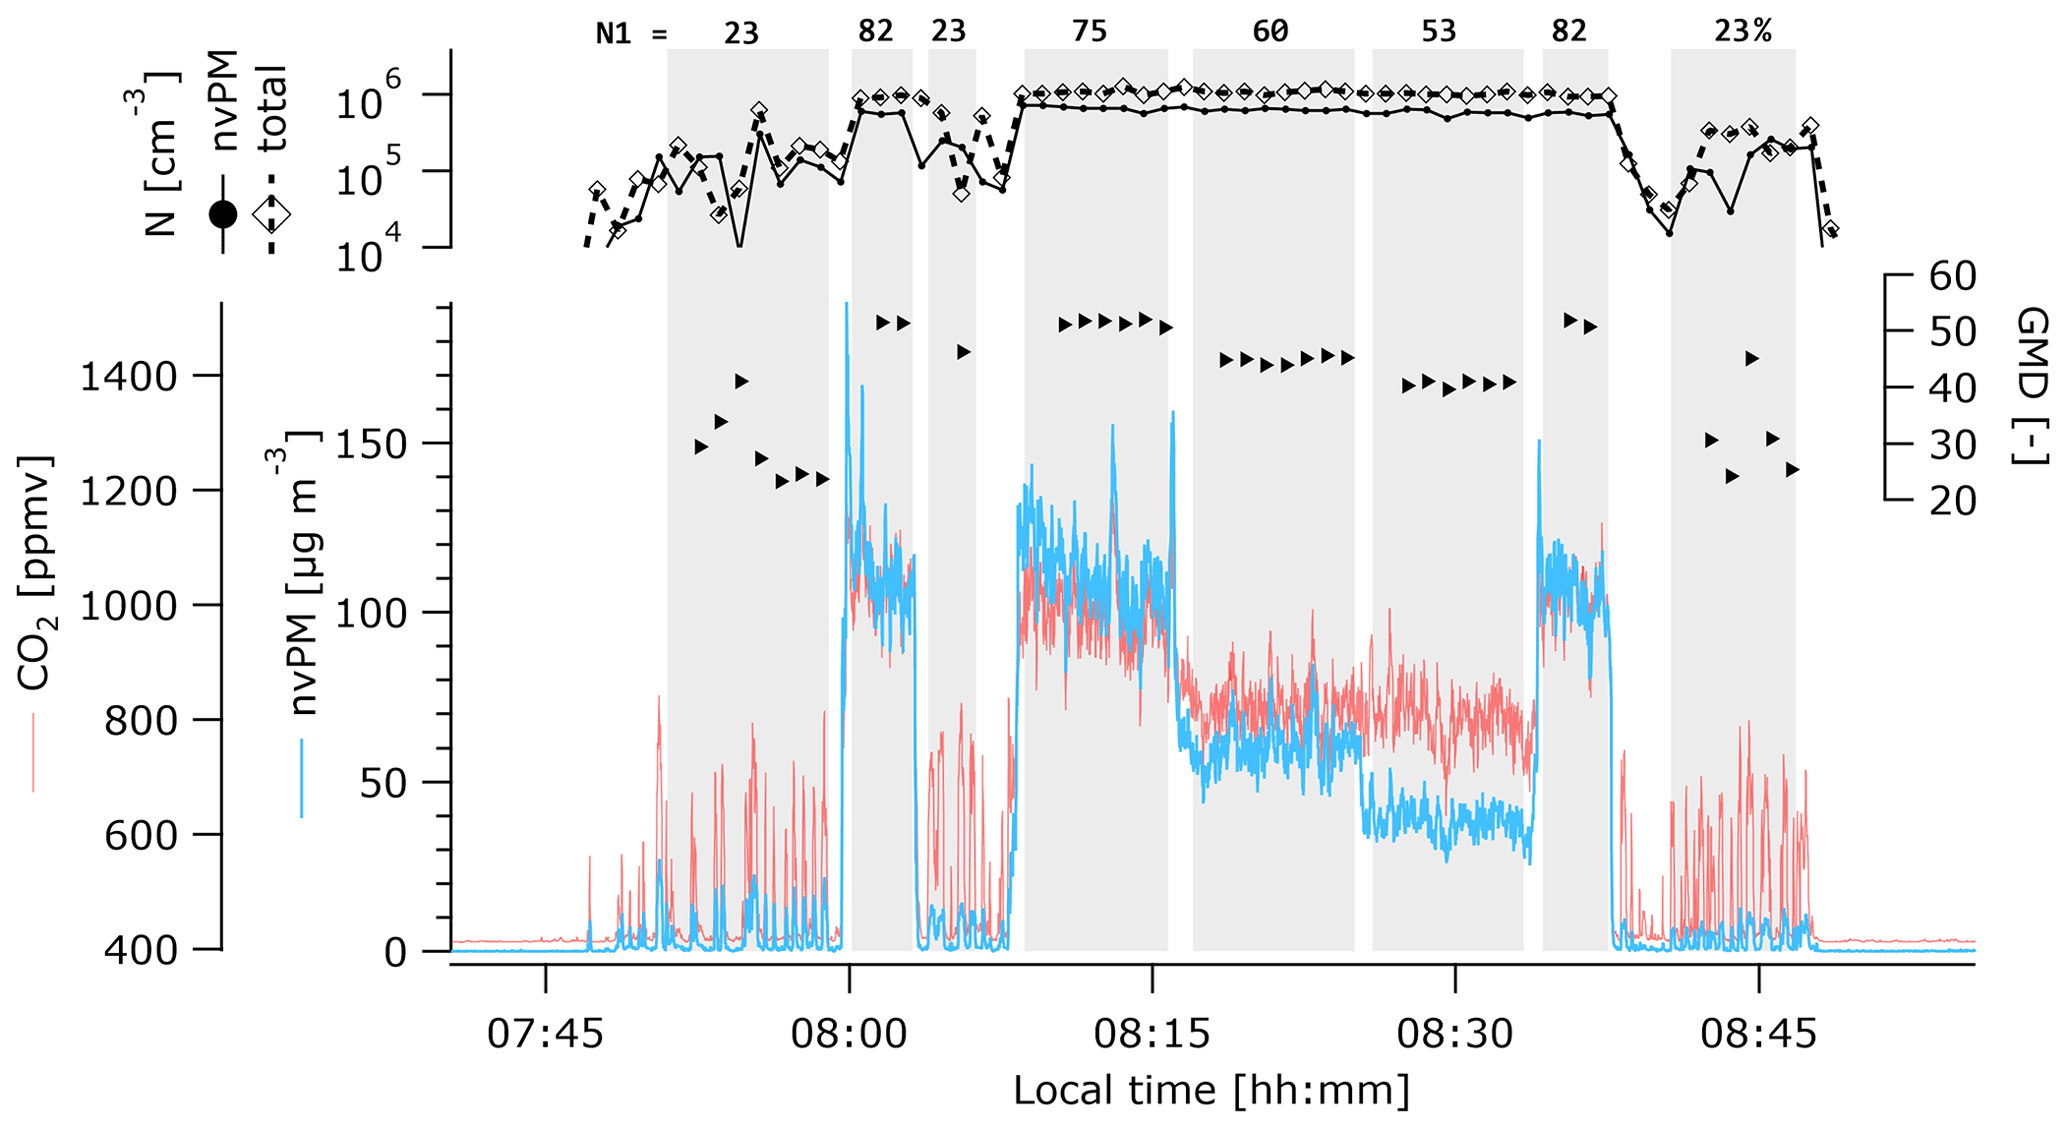
Figure 2Illustration of a typical test run. Variation in the CO2 concentration was not due to instrument noise, as illustrated by the CO2 measurements prior to and following sampling. A representative nvPM mass instrument is shown by the blue trace. Sizing information (GMD) is shown by the black symbols (triangles: GMD; diamonds with dashed line: total PM number; spheres with solid line: nvPM number measured with the CS-SMPS).
Second, the CO2 concentrations [CO2] were baseline-subtracted and filtered as follows. The CO2 baseline ([CO2]b) was calculated as the mean of the CO2 concentrations measured before ([CO2]0) and after ([CO2]1) each test. The uncertainty in this baseline value was calculated as either ([CO2]b–[CO2]0) or ([CO2]b–[CO2]1), whichever was greater.
Due to the prevailing crosswind mentioned above, unstable CO2 concentrations occurred during some test points at the idle engine thrust condition. These unstable conditions were identified and filtered using two separate methods. In the first method, the SMPS PSDs were inspected for reproducibility. In the second method, an algorithm was used to reject any test points with CO2 uncertainties greater than 50 %, CO2 signals less than a factor of 10 greater than uncertainty, or CO2 signals less than 20 % above baseline. We found that the first method rejected all of the points rejected by the algorithm, in addition to a few additional points. The analysis presented uses the first method.
Third, all data were arithmetically averaged over the test point periods defined in Table S1. For each instrument, the averaging periods were refined by inspection of the data since sampling-line residence times varied. The averaged data were typically at 1 Hz sampling frequency initially, although the SMPS instruments measured PSDs at 45 s intervals (NRC instrument) or 30 s intervals (NASA). Emission indices (EIs) were then calculated from the averaged data following SAE (2013):
where EIm and EInum are mass- and number-based EIs, respectively; PMm and PN are mass and number concentrations, respectively, at standard reference temperature (Tm; 273.15 K) and pressure (Pm; 1 atm); α is the hydrogen to carbon ratio of the fuel; MC and MH are the molar masses of carbon and hydrogen, respectively; and R is the ideal gas constant (0.082 L atm K−1 mol−1).
2.4.2 Penetration correction
Particles may be lost to the walls of sampling lines or to deposits on those walls. The fraction of particles penetrating a given system varies with size, according to a characteristic penetration function. Four penetration functions were applied in this study: (1) from the probe to the sampling plenum, (2) from the plenum to the NARS, (3) within the TD, and (4) within the CS (Fig. 4). Function 1 was measured on-site as described below. Function 2 was calculated using the standard equations for line penetration, as detailed in the loss calculation methodologies provided in SAE documents AIR6504 (SAE, 2017) and ARP6481 (SAE, 2019). Function 2 was adapted slightly for each instrument in the NARS due to the relatively small additional losses in the sampling lines of each instrument. Function 3 was experimentally determined in the laboratory by NASA. Function 4 was obtained from theoretical estimates and experimental measurements (Catalytic Instruments GmbH, 2014).
Penetration function 1 (probe-to-plenum penetration) was measured experimentally by nebulizing ammonium sulfate particles at the probe while all instruments were sampling and all heated lines had reached thermal equilibrium. (Function 1 therefore also includes the smaller instrument sampling lines downstream of the plenum in its correction as well; however, these were considered negligible relative to the longer probe-to-plenum and plenum-to-Container 2 transport lengths.) For this measurement, the NRC SMPS was moved to the probe, while the NASA instrument remained in its standard position. The ratio of the NASA to NRC PSDs (geometric mean mobility diameter (GMD) 30 nm, geometric standard deviation (GSD) 1.7) then provided a first estimate of the penetration function. However, this first estimate was not accurate, as the measurements were performed on a cold day (measured as approximately 5 ∘C outdoors and 15 ∘C in the instrument container) and as it does not account for performance differences between the NASA and NRC SMPSs. Therefore, two corrections were made. First, both measurements were corrected to standard temperature and pressure. Second, differences between the two instruments were directly measured by moving the NRC SMPS just outside of the sampling container (to keep it at 5 ∘C) and connecting it to an identical sampling line as the NASA SMPS. The ratio of the two measured PSDs in this setup was defined as equal to unity at all sizes and used to correct the initial penetration function. Therefore, no further correction was made for sampling lines in Container 1. Losses in this additional line were negligible (calculated penetrations of 0.997 at 100 nm and 0.98 at 20 nm), relative to the long NARS line to Container 2 (i.e. Function 2).
All reported data were corrected using penetration functions. Size-resolved data (SMPS PSDs) were corrected using the size-resolved penetration functions shown in Fig. 4. Size-integrated data were corrected using either number-based (for the APC) or mass-based correction (for all other instruments). The number-based line loss corrections were calculated as the ratio of the corrected to uncorrected PSDs. The mass-based corrections were calculated using the corresponding ratio of particle volume distributions (PVDs). Correction factors for each test point are given in the “Data availability” section.
2.5 Uncertainties
All reported uncertainties and error bars represent standard errors, propagated through the calculation as necessary. When two independent sources of uncertainty were available (for example, the standard error in the 10 s averages of [CO2] and the uncertainty in the baseline value), they were added in quadrature. Our bottom-up calculations of uncertainty can be compared with the spread of the data points in our EI comparisons below. This spread represents a top-down uncertainty and is similar in magnitude to the bottom-up uncertainties (i.e. error bars). This similarity lends confidence to our uncertainty estimates. In most figures, error bars have generally been omitted for clarity, but uncertainties are given for each instrument at each test point in Table S1.
3.1 Experiment overview
A typical time series obtained when the emissions from the IAE V2527-A5 engine were sampled is shown in Fig. 2. Nominal low-pressure jet-engine primary fan speeds (N1), expressed as a percentage of maximum continuous thrust, are shown by the labels at the top of the figure. Percent N1 (along with engine fuel flow rate) is another metric for representing the different engine thrust conditions and is used as a primary independent variable in this study. The CO2 concentrations (red line) were highly variable at N1 = 23 % as the ambient wind shifted the aircraft exhaust plume toward and away from the sampling probe. Correspondingly, both nvPM mass and PSD measurements were highly variable, as shown by the blue trace and black symbols, respectively.
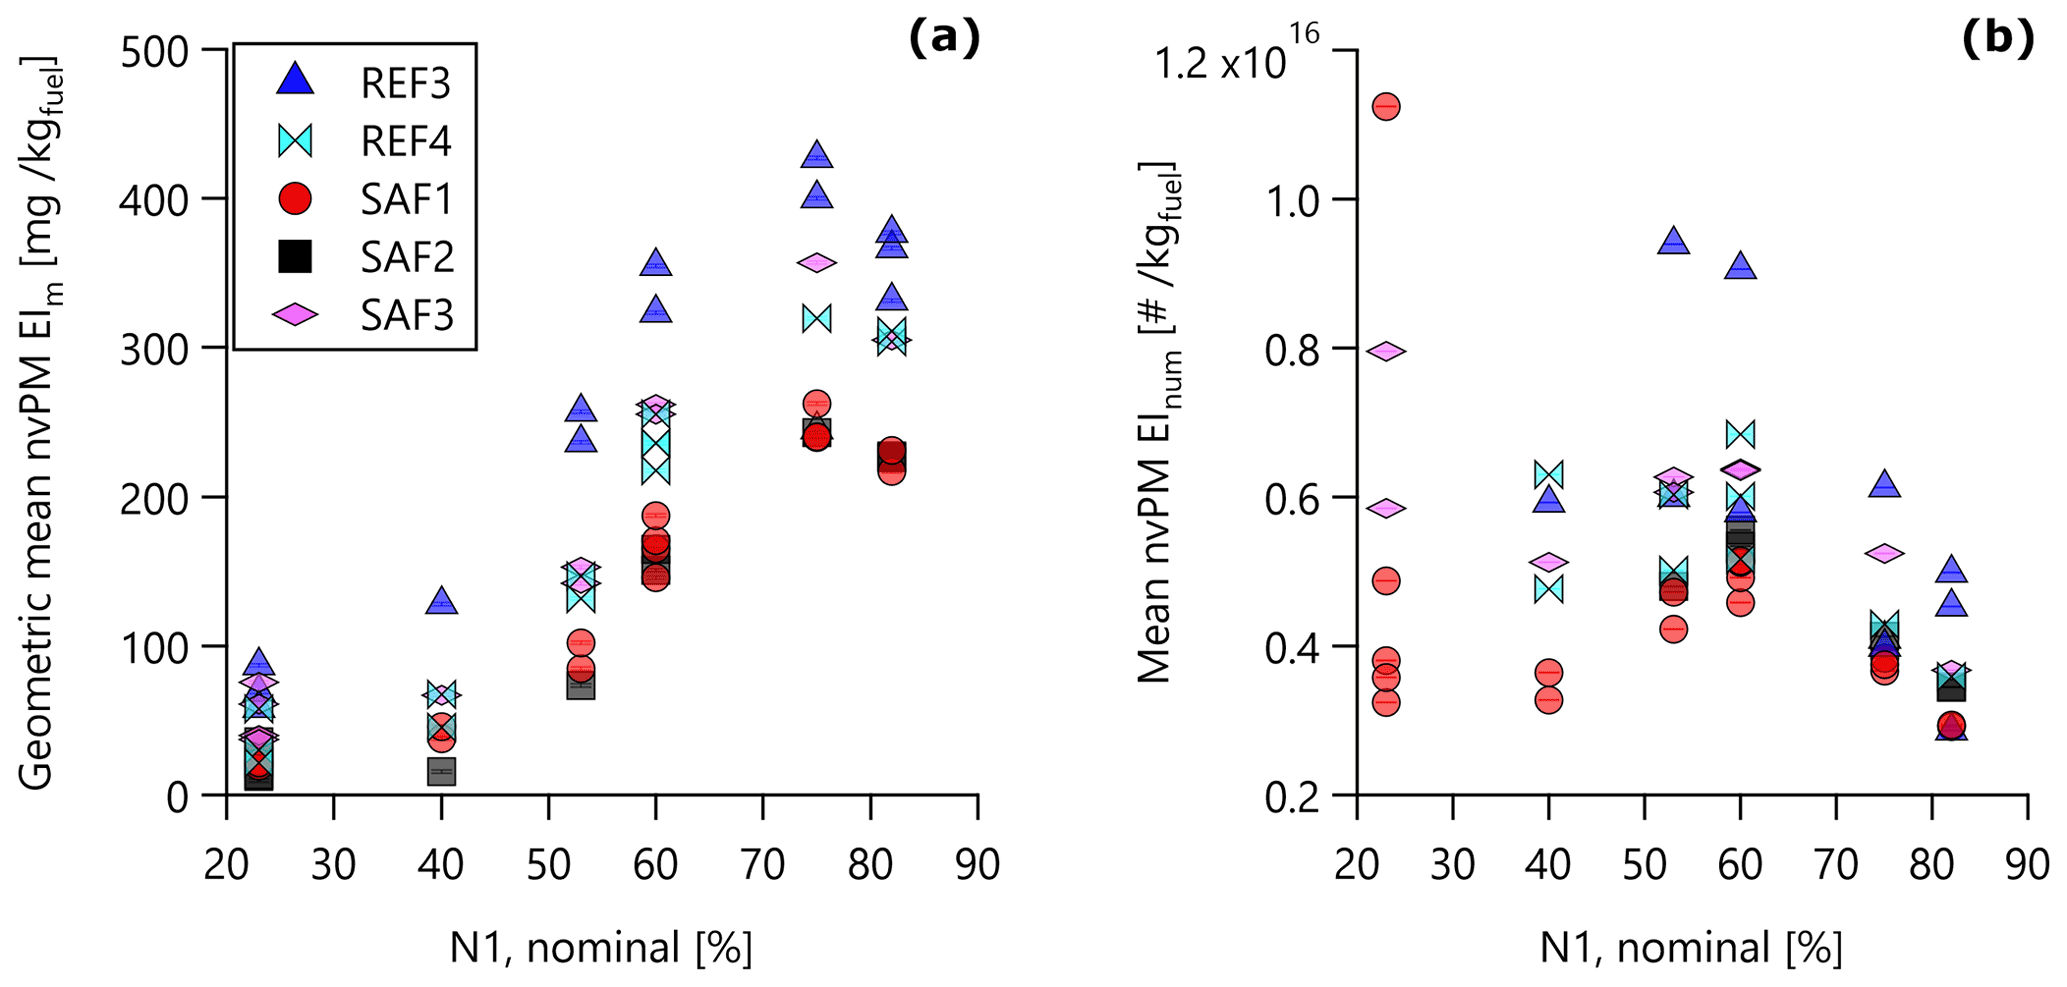
Figure 3Relationship between nvPM (a) EIm and (b) EInum with N1 for all data obtained with the V2527-A5 engine. The trends shown in this plot are discussed further in the companion paper (Schripp et al., 2022). The ordinate values are the geometric mean discussed in the text.
As shown in Fig. 3a, nvPM mass concentrations, represented by EIm, increased with increasing N1 before decreasing slightly at the highest N1, similar to the trends for other engine types reported by Lobo et al. (2015b, 2020). Figure 3b shows that the relationship for EInum is less clear, with a slight increase at moderate N1 followed by a greater decrease at high N1. As discussed below (Sect. 4.2.3), the higher EIm at higher N1 thrust was associated with larger particle sizes and therefore smaller penetration-function corrections (Sect. 4.2.1). Finally, for context, Fig. 3c shows the relationship of the PM mass concentrations, used to calculate EIm (based on the geometric mean EIm discussed in Sect. 4.4.1), with baseline-subtracted CO2 concentrations from the measured plume. An effect of fuel composition is evident and discussed in detail in Schripp et al. (2022).
3.2 Size distributions and penetration functions
3.2.1 Penetration functions
A typical PSD and corresponding PVD are shown in Fig. 4, in the context of the penetration functions applied in this work. The PVD was calculated by assuming spherical particles, which incurs negligible error for aircraft-engine nvPM due to the small diameter of particles produced by such engines (Durdina et al., 2014; Saffaripour et al., 2020). For the example PSD and PVD in Fig. 4 (shading), it is clear that a substantial fraction of the particle number was corrected for penetrations (lines) of roughly 0.5. In contrast, the larger mode of the PVD corresponds to penetrations larger than 0.8 in most cases. These differences led to median number- and mass-based correction factors of 1.51 and 1.19, respectively, for penetration function 1 (probe to plenum) labelled in the figure. The remaining instrument-specific penetration corrections were applied according to the position of each instrument in the sampling system, as specified in Table 2. The magnitude of each correction is given in Table S1.
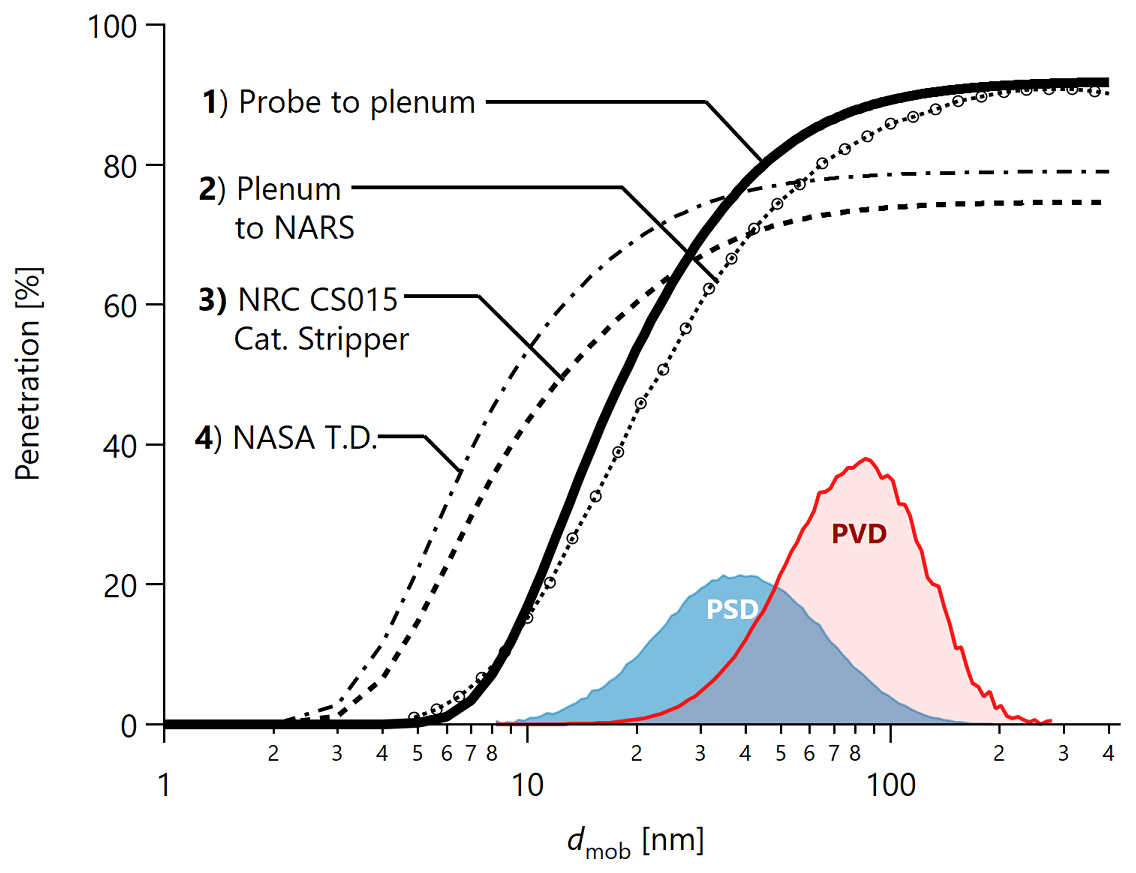
Figure 4Penetration functions for the main probe-to-plenum sampling line as well as other components in the sampling system. Shaded areas illustrate a representative particle size (PSD) and volume (PVD) distribution measurement with GMD 34 nm and GSD 1.72. PSD data for all test points and instruments are provided in the “Data availability” section. NARS: North American Reference System; CS015: catalytic stripper; T.D.: thermodenuder.
3.2.2 PSDs
Figure 5 shows selected PSDs from the IAE V2527-A5 engine operated with SAJF1 (Fig. 5a) and REF4 (Fig. 5b) fuels. The PSDs are corrected for line penetration as described above. The plot illustrates a lower (40 % N1) and a higher thrust point (60 % N1) from the available data for two fuels. Note that the ordinate scales are harmonized across the upper and lower rows only. All abscissa scales are harmonized. The figure indicates roughly comparable PSDs from these two fuels. The companion paper (Schripp et al., 2022) compares the effects of fuel composition in detail.
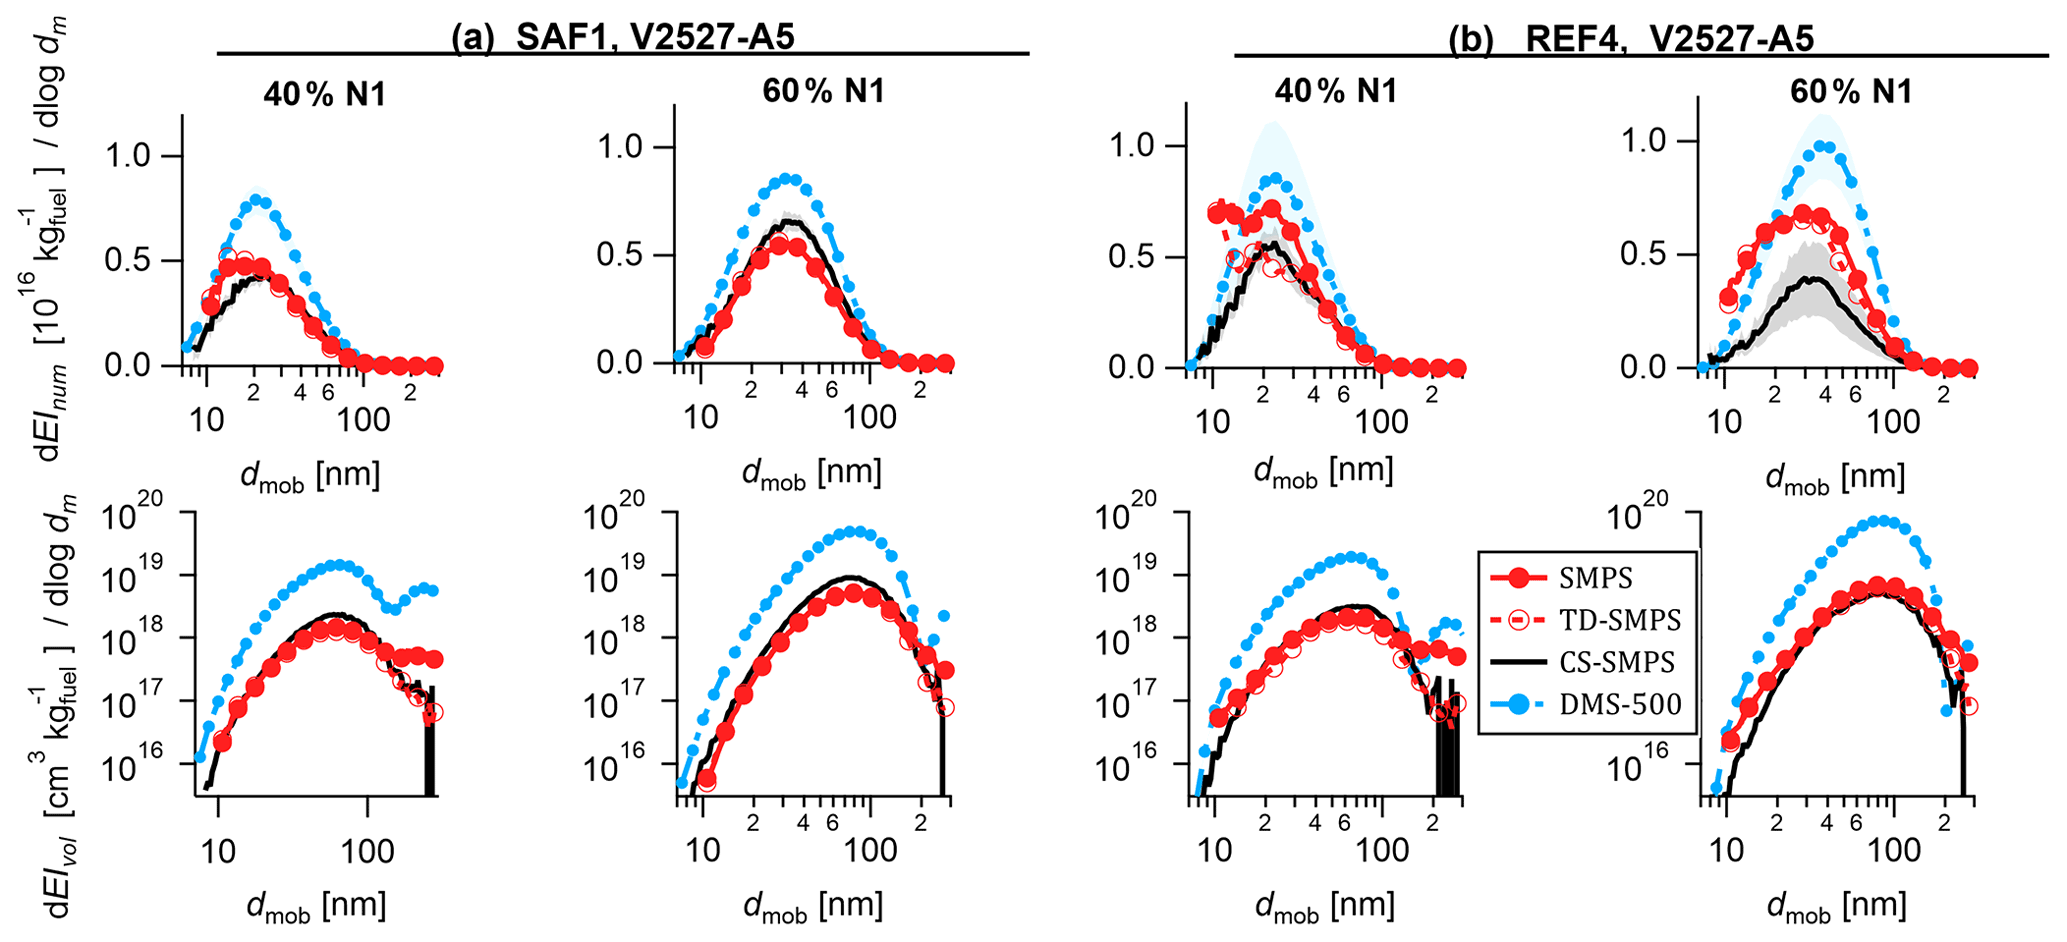
Figure 5Selected PSDs illustrating the V2527-A5 engine with (a) SAF1 fuel and (b) REF4 fuel. Each panel shows 60 % N1 on the right and a lower N1 on the left: 40 % for (a), 60 % for (b). Note that the TD-SMPS and CS-SMPS (open red circles and black line) represent nvPM, while the SMPS and DMS500 represent vPM.
The CFM56-2C1 engine on the DC-8 burning JP-8 emitted an order of magnitude more total particles per unit fuel burned than any of the fuels combusted in the ATRA (data not shown). We attribute this difference to the relatively high sulfur content of the JP-8 fuel (1490 ppm sulfur versus ≤ 105 ppm for the other fuels). The CFM56-2C1 engine also emitted a factor of 3 lower nvPM mass and nvPM number than the V2527-A5 engine.
The presence of extremely small particles with dmob<10 nm was evident in the two nvPM PSDs (not shown due to the extremely large penetration function at these sizes; Fig. 4). The CS-SMPS data extended to smaller diameters and showed that the size range measured by these two instruments was insufficient to capture the full PSD for the CFM56-2C1 engine data at 22 % N1 as well as 63 % N1. The dmob<10 nm mode was not as prominent in the V2527-A5 engine exhaust at any thrust, although some evidence was observed for it (e.g. number distribution at 40 % N1 in Fig. 5b). Our data do not allow us to identify whether these small particles were non-volatile or represent an imperfect performance of the CS and TD.
There is some evidence for an increase in SMPS-calculated volume at larger particle sizes in Fig. 5a, at both 40 % and 60 % N1. If these large particles indicated the presence of a large aerosol mode which varied independently from the primary mode (e.g. if they were emitted by some other process than the engine itself), they would introduce a EIm-dependent bias in the ratio of SMPS-based EIm to other instruments, which was not observed (Sect. 4.4.2).
Since the CFM56-2C1-with-JP-8 data were strongly influenced by a nucleation mode and were therefore not well described by the GMD and GSD of the data, these measurements have been omitted from all subsequent PSD analysis in this paper. Bimodal fits to the data were not possible as the nucleation mode was not captured by our size distributions. However, the nvPM mass measurements are much less sensitive to these small particles (Hinds, 1999) and have therefore been retained. PSDs from all instruments, test points, and fuels from both the CFM56-2C1 and V2527-A5 engines are included in the “Data availability” section.
3.2.3 Particle size statistics: GMD and GSD
Figure 6 summarizes the PSDs measured by three instruments in terms of their GMD and GSD. The data sets labelled SMPS and TD-SMPS were both obtained from NASA's SMPS, which was manually switched to a bypass line and the TD at each test point. The data set labelled CS-SMPS was obtained with NRC's SMPS.
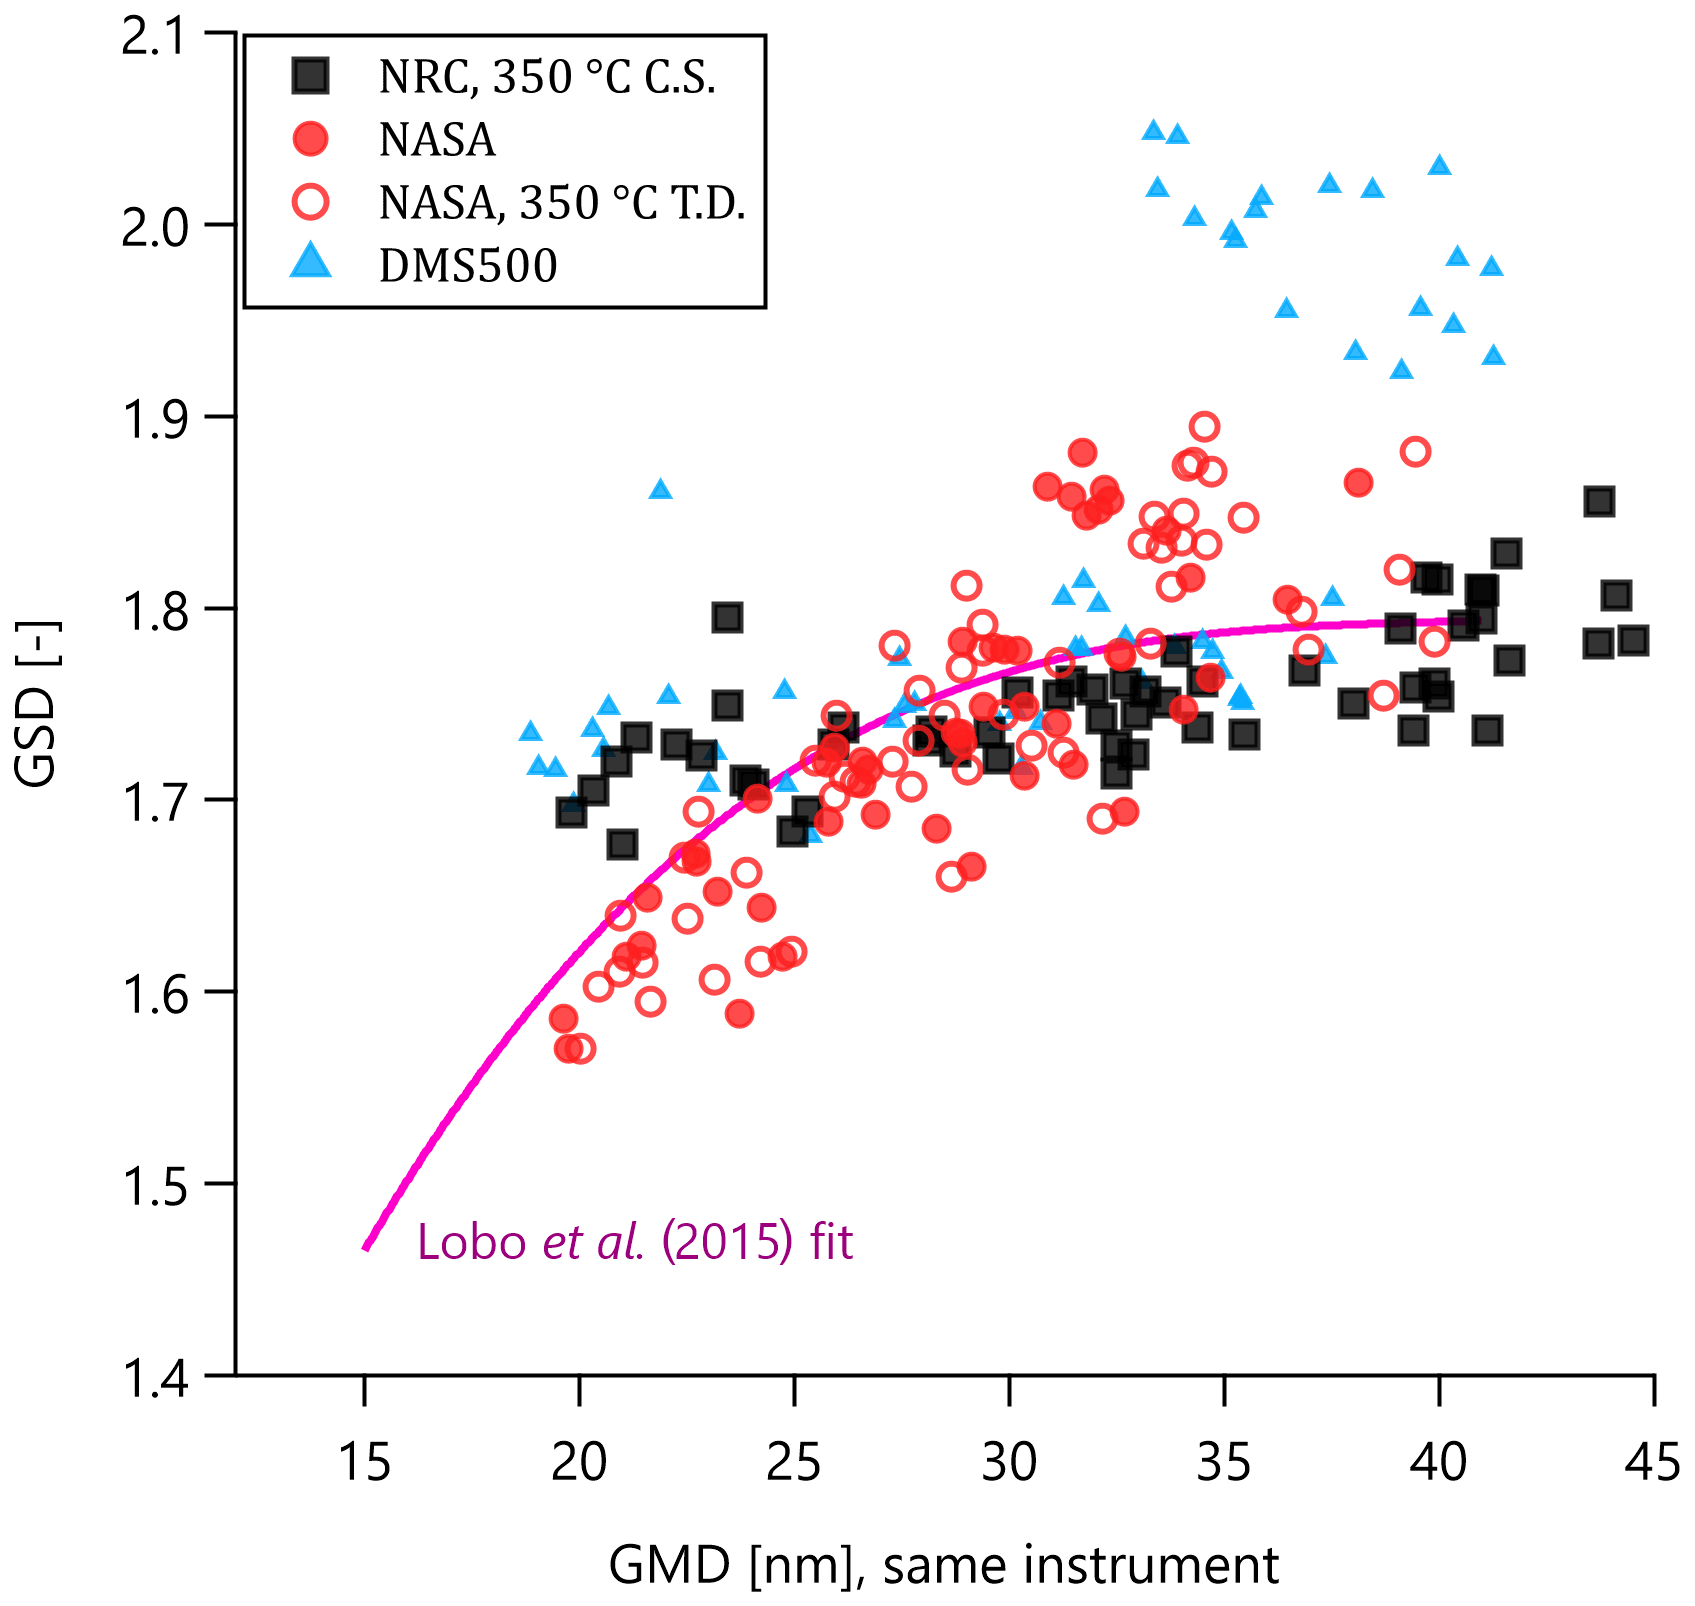
Figure 6GSD versus GMD data as measured by each particle sizer for all test points. Higher GSDs for the DMS500 correspond to bimodal PSDs (non-volatile and volatile modes). Note that size-dependent particle losses (see penetration functions in Fig. 4) may affect both GSD and GMD. Based on Fig. 12, the TD-SMPS (NASA) data may be more accurate than the CS-SMPS data (see text). Fit is from Lobo et al. (2015c).
Total PM is represented by the data sets labelled DMS500 and SMPS. However, the two are not directly comparable because the DMS500 measurements were obtained after an additional dilution by a factor of 4 in the NARS, and the DMS500 was not operated behind a volatile particle remover (CS or TD). Moreover, the inversion of DMS500 data requires more assumptions about the particle size distribution than the analogous SMPS calculation. Either volatiles or this inversion procedure may have caused the 10 % larger GSDs observed for the DMS500 for some data (some measurements with GMDs over 35 nm) relative to the SMPS. Since volatiles would affect both GMD and GSD, but we primarily observed discrepancies in the DMS500 GSD, we suggest that the inversion was the major source of bias in these data.
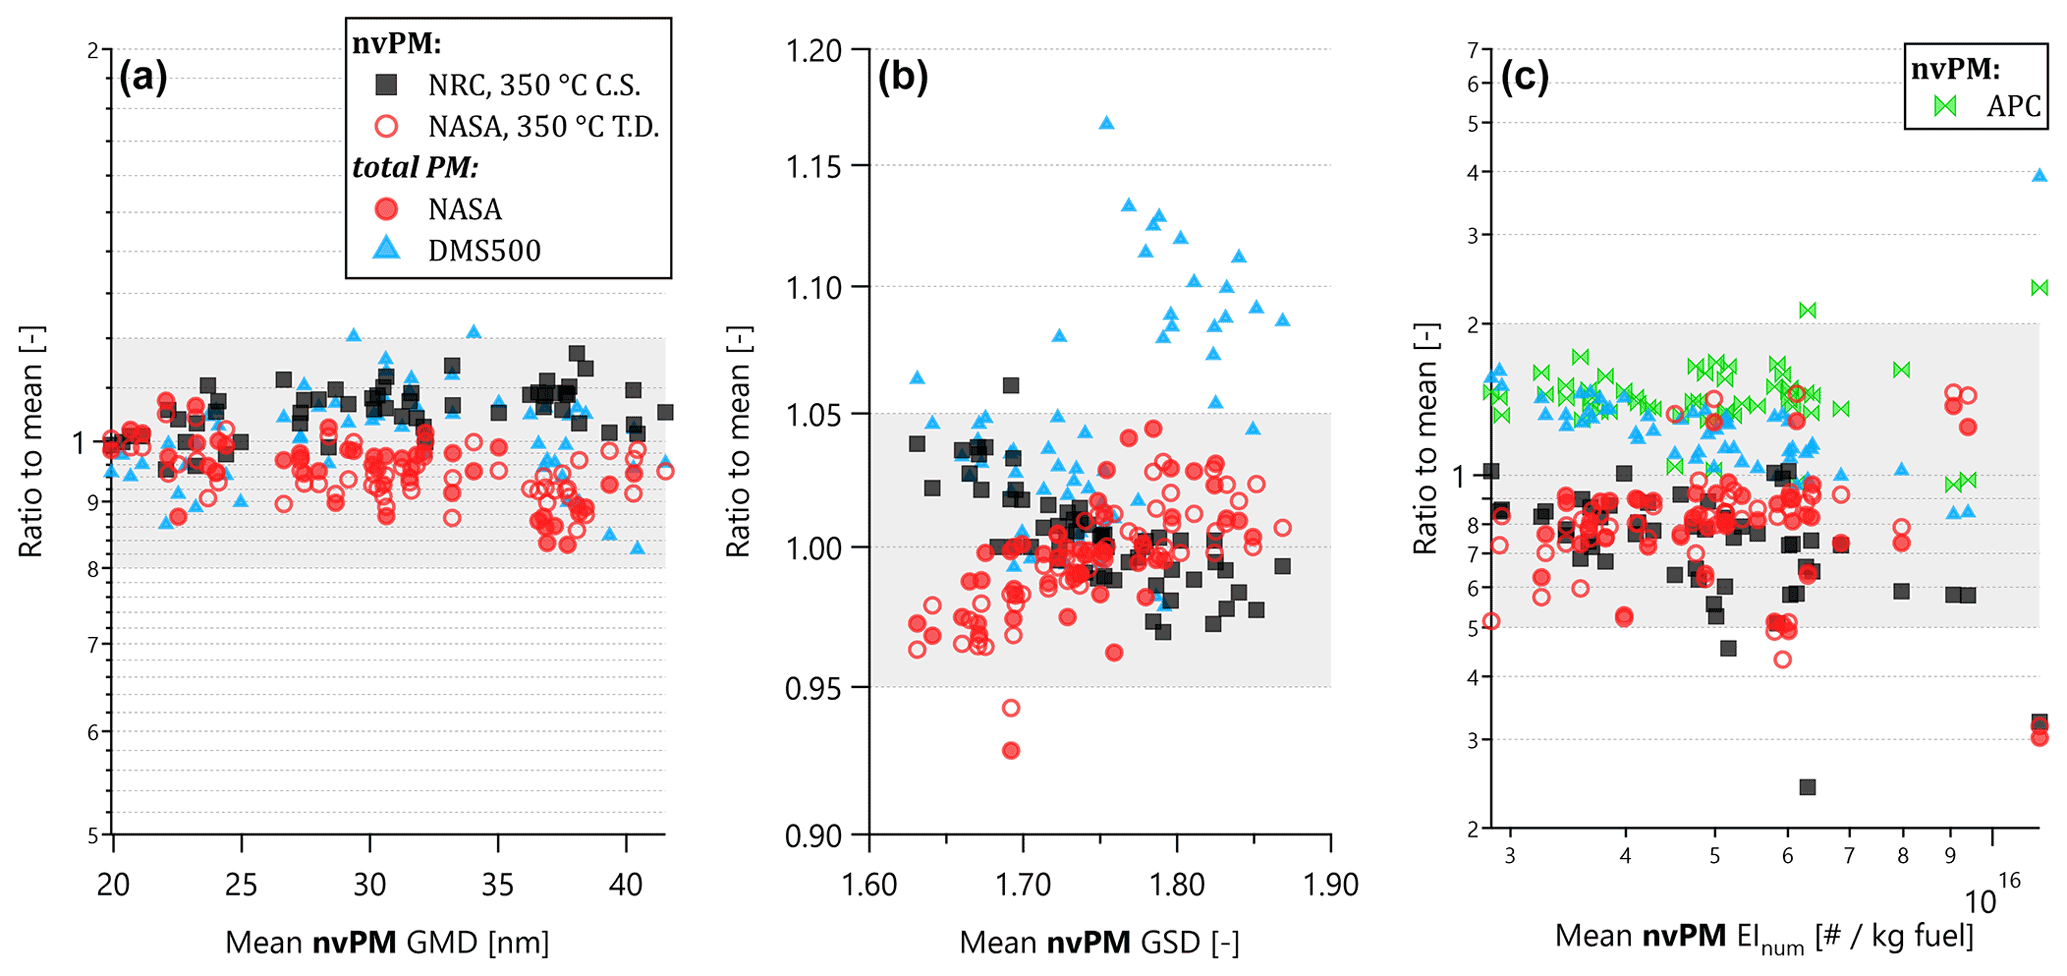
Figure 7Comparison of size and number measurements in terms of GMD, GSD, and EIn. Grey shading shows 20 %, 5 %, and 200 % in GMD, GSD, and EIn, respectively. In panels (a) and (b), mean is defined from the CS-SMPS (NRC) and TD-SMPS (NASA) data. In panel (c), the mean additionally includes the APC (NARS) data (the APC is in the NARS and uses a TSI 3790E CPC).
nvPM is represented by the open circles and filled squares in Fig. 6. These two data sets show a different relationship (slope) between GMD and GSD, reflecting systematic differences in the corresponding PSDs. Relative to the mean of the two instruments, the NRC GMDs were higher (Fig. 7a), while the NRC GSDs were higher at GSD < 1.75 but lower at GSD > 1.75 (Fig. 7b). Inspection of the corresponding PSDs showed that the NASA and NRC instruments agreed at higher dmob but that NRC number concentrations were higher at smaller dmob. This trend suggests that a bias in the penetration functions applied to each instrument (Fig. 4, Table 2) led to the discrepancy in GMD and GSD. Such a bias would affect the nvPM concentration estimated from these PSDs (Fig. 8b) and will be discussed further below.
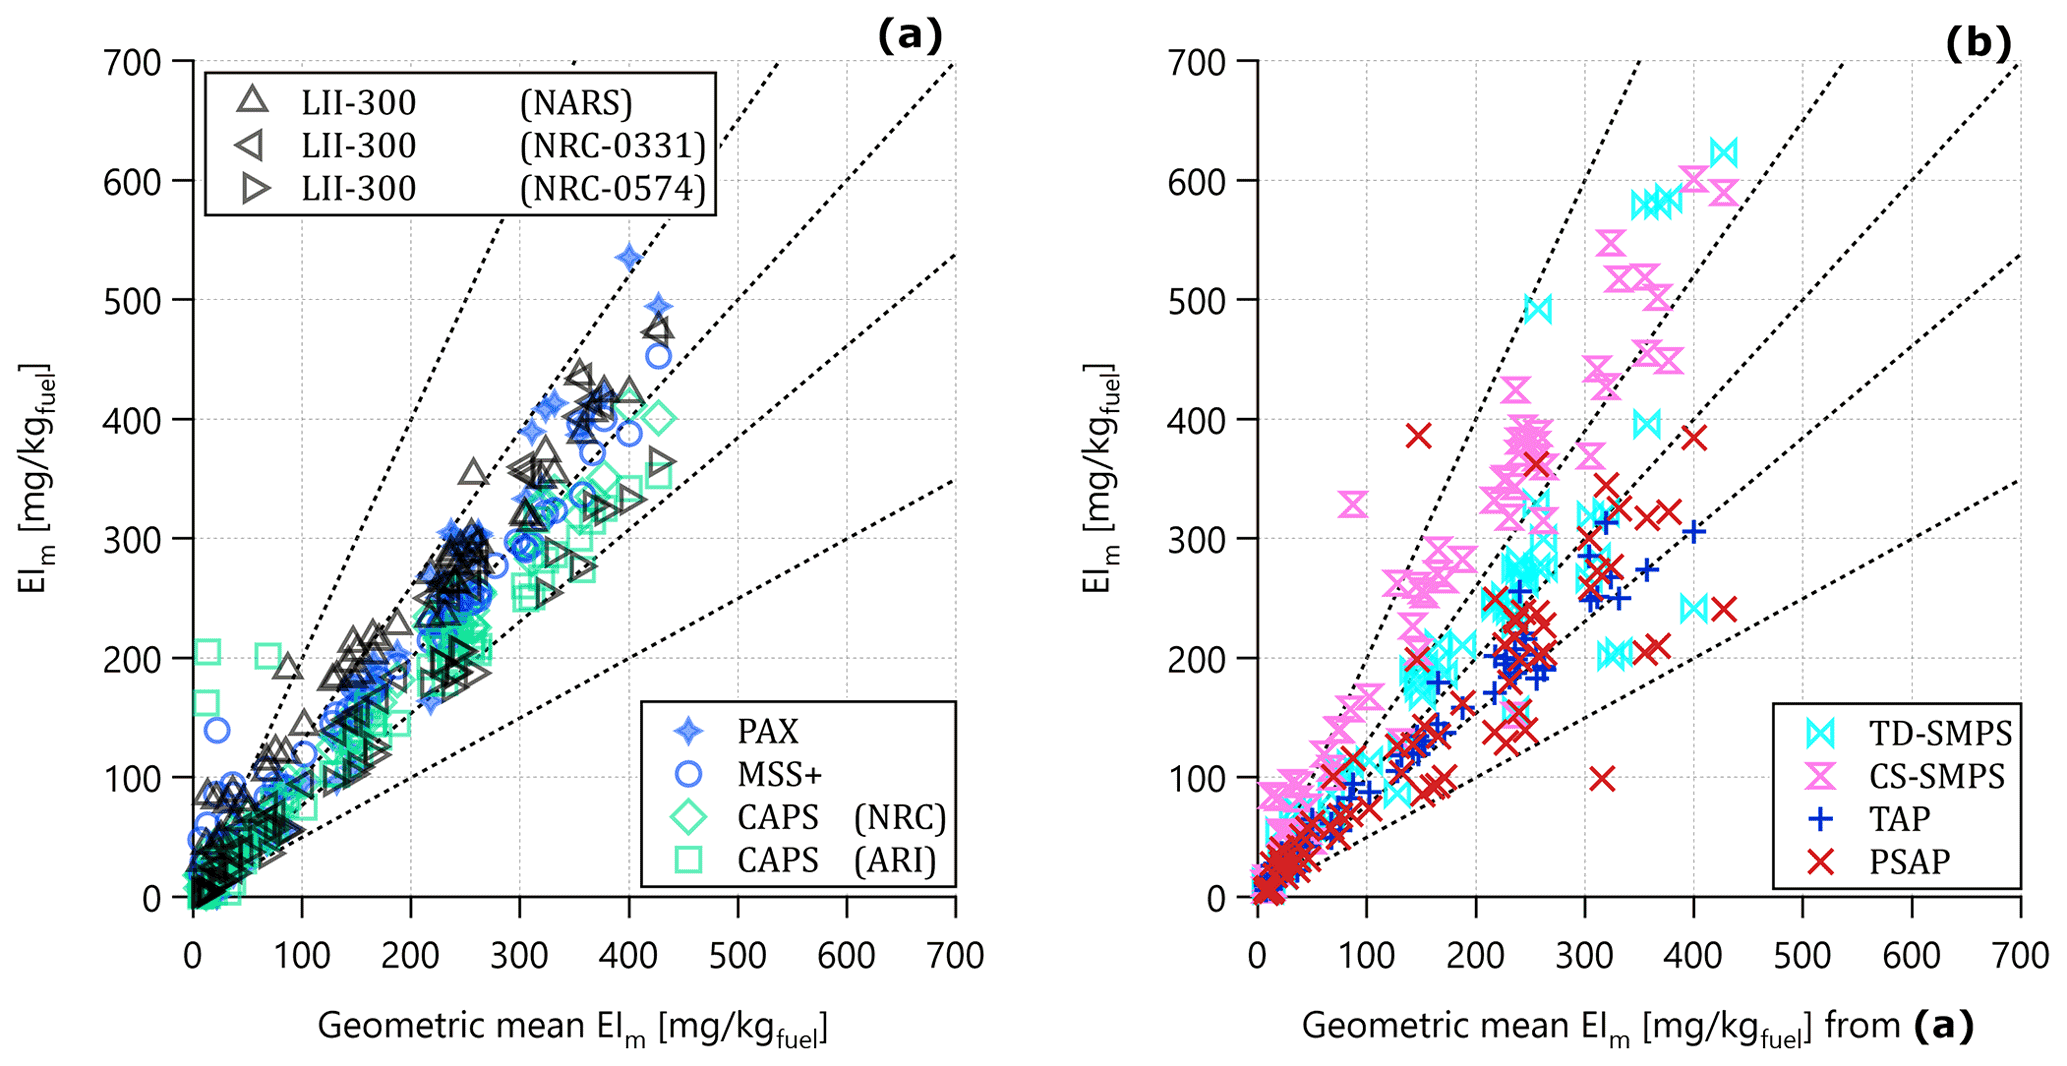
Figure 8EIm scatterplot for (a) real-time and (b) integrative nvPM measurements. The term integrative refers to SMPS measurements (mass concentrations estimated by assuming unit-density spheres) and filter photometer measurements (mass concentrations estimated using standard empirical relationships between light attenuation and light absorption). The abscissa of both panels is the geometric mean of all available data from the seven real-time sampling instruments plotted in (a). Angled lines illustrate slopes of 2, 2−1, 1.3, 1.3−1, and 1.0.
In spite of these trends in GMD and GSD, the PSD measurements agreed to within 20 % (Fig. 7a) for nvPM GMDs and within 5 % for nvPM GSDs (Fig. 7b). Furthermore, these measurements are consistent with previous measurements by Lobo et al. (2015c), as illustrated by the line in Fig. 6, which reproduces the polynomial best-fit line reported by those authors.
3.3 Consistency between number-based emission indices of nvPM and vPM
Figure 7c compares the measured vPM and nvPM EInum with the mean nvPM EInum (i.e. mean of the NRC CS-SMPS, NASA TD-SMPS, and NARS APC). The grey shading shows that all instruments agreed to within a factor of 2. The APC and DMS500 nvPM EInum were both typically higher than the two similar SMPSs. Substantial variability between the two SMPSs was also observed.
In Fig. 7c, the penetration-corrected APC EInum is approximately 50 % larger than the SMPS EInum under all conditions. Our measured PSDs rule out the possibility that 50 % of particles were not seen by the SMPS. Therefore, we attribute the difference between APC and SMPS results to uncertainties in the APC or SMPS penetration correction functions (Fig. 4); i.e. we hypothesize that this difference would not have been observed had the instruments all sampled from the same plenum from comparable sampling lines.
We also attribute the larger nvPM EInum measured by the DMS500 to the same cause, to which a similar penetration function as the APC applies (Sect. 3.4.2). We note that the DMS500 measured total PN, not nvPN, so is expected to report higher number concentrations when volatile particles are present.
3.4 Consistency between mass-based emission indices
3.4.1 EIm measurements by real-time sampling instruments
Figure 8a presents scatterplots of the real-time EIm measurements acquired during this study for all fuels and both engine types. In Fig. 8a, the individual EIm are plotted against the geometric mean of the instruments shown in the caption: three LII 300 instruments, two CAPS instruments, one PAX, and one MSS+. The geometric mean was chosen over the more common arithmetic mean because the data are not normally distributed; the arithmetic mean would therefore have overemphasized outliers.
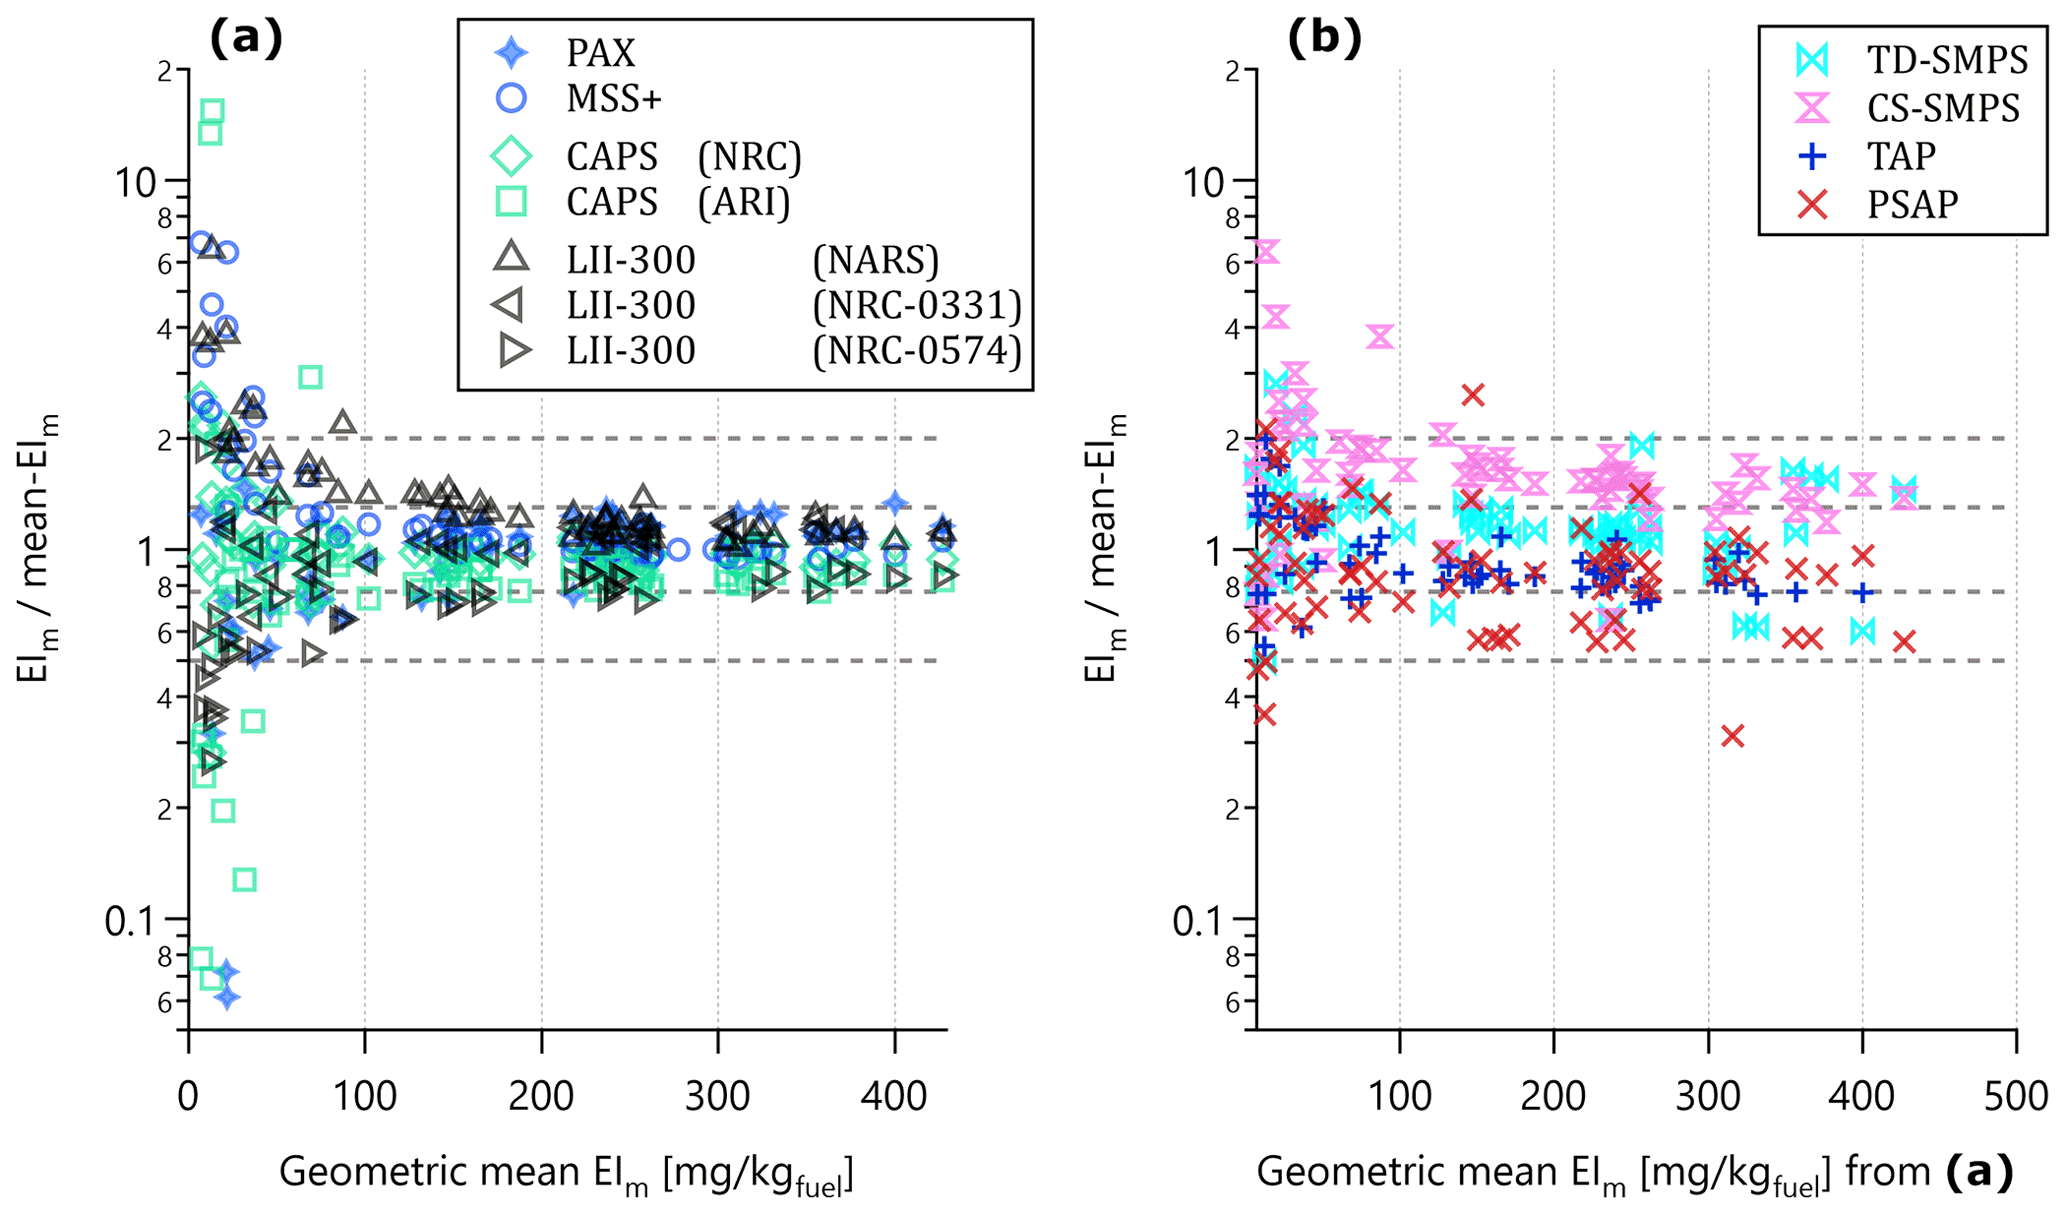
Figure 9Ratio plots corresponding to Fig. 8. The inner and outer horizontal lines show ratios of 2, 2−1, 1.3, 1.3−1, and 1.0. Agreement between the instruments is poorer at EIm < 100 mg per kg fuel, which corresponds to an approximate concentration of 10 µg m−3 (the exact conversion factor varies with CO2 concentration and fuel properties) and is close to the limit of detection for most instruments.
Figure 9a presents the same data as Fig. 8a except that the ordinate data have been normalized to the geometric-mean EIm from Fig. 8a. Most data fall within 30 % of the mean (inner dashed lines) above 100 mg per kg fuel. We note that exhaust samples were diluted with background air by a factor of 40 or more before reaching the inlet probe, so at this lower limit, the actual concentration observed by the instruments was approximately 10 µg m−3 (the exact conversion factor varies with CO2 concentration and fuel properties), which is close to their detection limits, as expected. This lower limit may have been influenced by the ambient measurement conditions, where background nvPM concentrations were non-negligible.
The agreement of the real-time measurements to within 30 % is larger than the calibration uncertainties of the individual instruments and suggests an influence of systematic biases (e.g. in instrument calibration or penetration corrections). There is no evidence of systematic differences between absorption and LII measurements, which might have been hypothesized if coatings of volatile PM on the light-absorbing nvPM had enhanced absorption. The larger scatter at lower EIm values reflects the noise levels of the instruments. Both of these observations are consistent with data reported previously for different engine types by Lobo et al. (2016, 2020). The LII 300 and MSS+ from the North American Reference System (NARS) have been widely used to characterize aircraft-engine nvPM emissions. The two CAPS instruments were independently calibrated and operated. The MSS+ and PAX represent two photoacoustic spectrometers from different manufacturers, operated by different teams, with different principles of calibration. The PAX was also operated with a damaged capacitor on its printed circuit board. As noted in “Methods”, these instruments operate on a variety of physical principles, including photoacoustic spectroscopy (with two different designs), extinction-minus-scattering, and laser-induced incandescence (see Sect. 3.3.3). Agreement between these various principles also suggests that factors such as volatile coatings on nvPM did not influence the instrument responses.
3.4.2 SMPS-based EIm
Figures 8b and 9b are analogous to Figs. 8a and 9a but for the integrative nvPM measurements that do not fall into the real-time sampling category. These data are plotted against the same geometric mean from Fig. 8a. The dashed lines in Fig. 9b represent the same ratios as in Fig. 9a. Considering that the real-time instruments in Fig. 8a were either calibrated to aerosol absorption or to aviation nvPM, we consider their accuracy as greater than the instruments in Fig. 8b and consider departures from the 1 : 1 line as being due to inaccuracy.
Most of the instruments in Fig. 8b were accurate to within 30 % of the reference, similar to Fig. 8a, with the exception of the CS-SMPS and PSAP. This is summarized in Table 3, which shows the mean ratios of all data except engine idle (23 % N1) with the geometric mean. Table 3 also includes the results of a linear regression against the geometric mean to facilitate comparison of our measurements with Kinsey et al. (2021), who performed linear regressions against simultaneous elemental carbon (EC) measurements (in our study, mass concentrations were too low to obtain EC measurements). The PSAP data are discussed in the next section. The CS-SMPS data were systematically higher than the geometric mean, potentially due to an overcorrection of the penetration of large particles to the SMPS or due to uncertainty in the effective density that must be assumed when converting SMPS data to EIm. As noted in Sect. 3.3.3, we assumed an effective density of 1000 kg m−3 based on the work of Durdina et al. (2014). Considerable uncertainty could be introduced due to this assumption, as the effective density of the nvPM particles (Momenimovahed and Olfert, 2015) may vary with the monomer diameter (Abegglen et al., 2015; Durdina et al., 2014) and/or shape of soot aggregates. With respect to the real-time measurements, the TD-SMPS data are also consistent with previous measurements of aviation engine PSDs, which, however, were not corrected for diffusional particle loss (Lobo et al., 2015b, 2020).
3.4.3 Filter-photometer-based EIm from TAP and PSAP
Figures 8b and 9b show that the TAP measurements were within the 30 % range observed for the real-time instruments, with a relative standard deviation (RSD) of 14 % (Table 3) for all data excluding the engine idle condition (23 % N1). This provides high confidence for the use of the TAP for in-flight or field measurements of aircraft-engine nvPM mass emissions, when filter-loading corrections (Sect. 3.3.3) are correctly applied.
The PSAP, on the other hand, showed much greater variability, with an RSD of 36 % (Table 3). This is substantially higher than the variability reported by a laboratory intercomparison of PSAP and CAPS PMSSA (Perim De Faria et al., 2021) (that study did not report a statistic comparable to RSD). Although the PSAP has been observed to deviate up to a factor of 2 higher in cases of high organic aerosol loading or reduced filter transmission (Lack et al., 2014), our data are restricted to transmissions above 0.8. The fact that the PSAP shows great variability rather than a fixed offset indicates that the issue is not due to a systematic error such as an inaccurate MAC or flow rate calibration. We note that the TAP and PSAP were operated with reduced sample flow rates of 0.05 and 0.1 L min−1, respectively, (5 % to 10 % of nominal settings) to extend the life of their filter media while sampling the high soot concentrations in the aircraft exhaust. Under these conditions, detector noise and small fluctuations in sample flow have a magnified effect on resulting derived absorption coefficients. We suspect that the measurements would have been significantly more precise if the instruments had been operated at nominal flows, although this would have required changing filters after each test point. Consistent with our hypothesis, we note that Nakayama et al. (2010) observed substantially larger variability in PSAP measurements at 0.3 than at 0.7 standard L min−1. We also note that Bond et al. (1999) did not observe an impact of flow rate when changing from 1 to 2 L min−1.
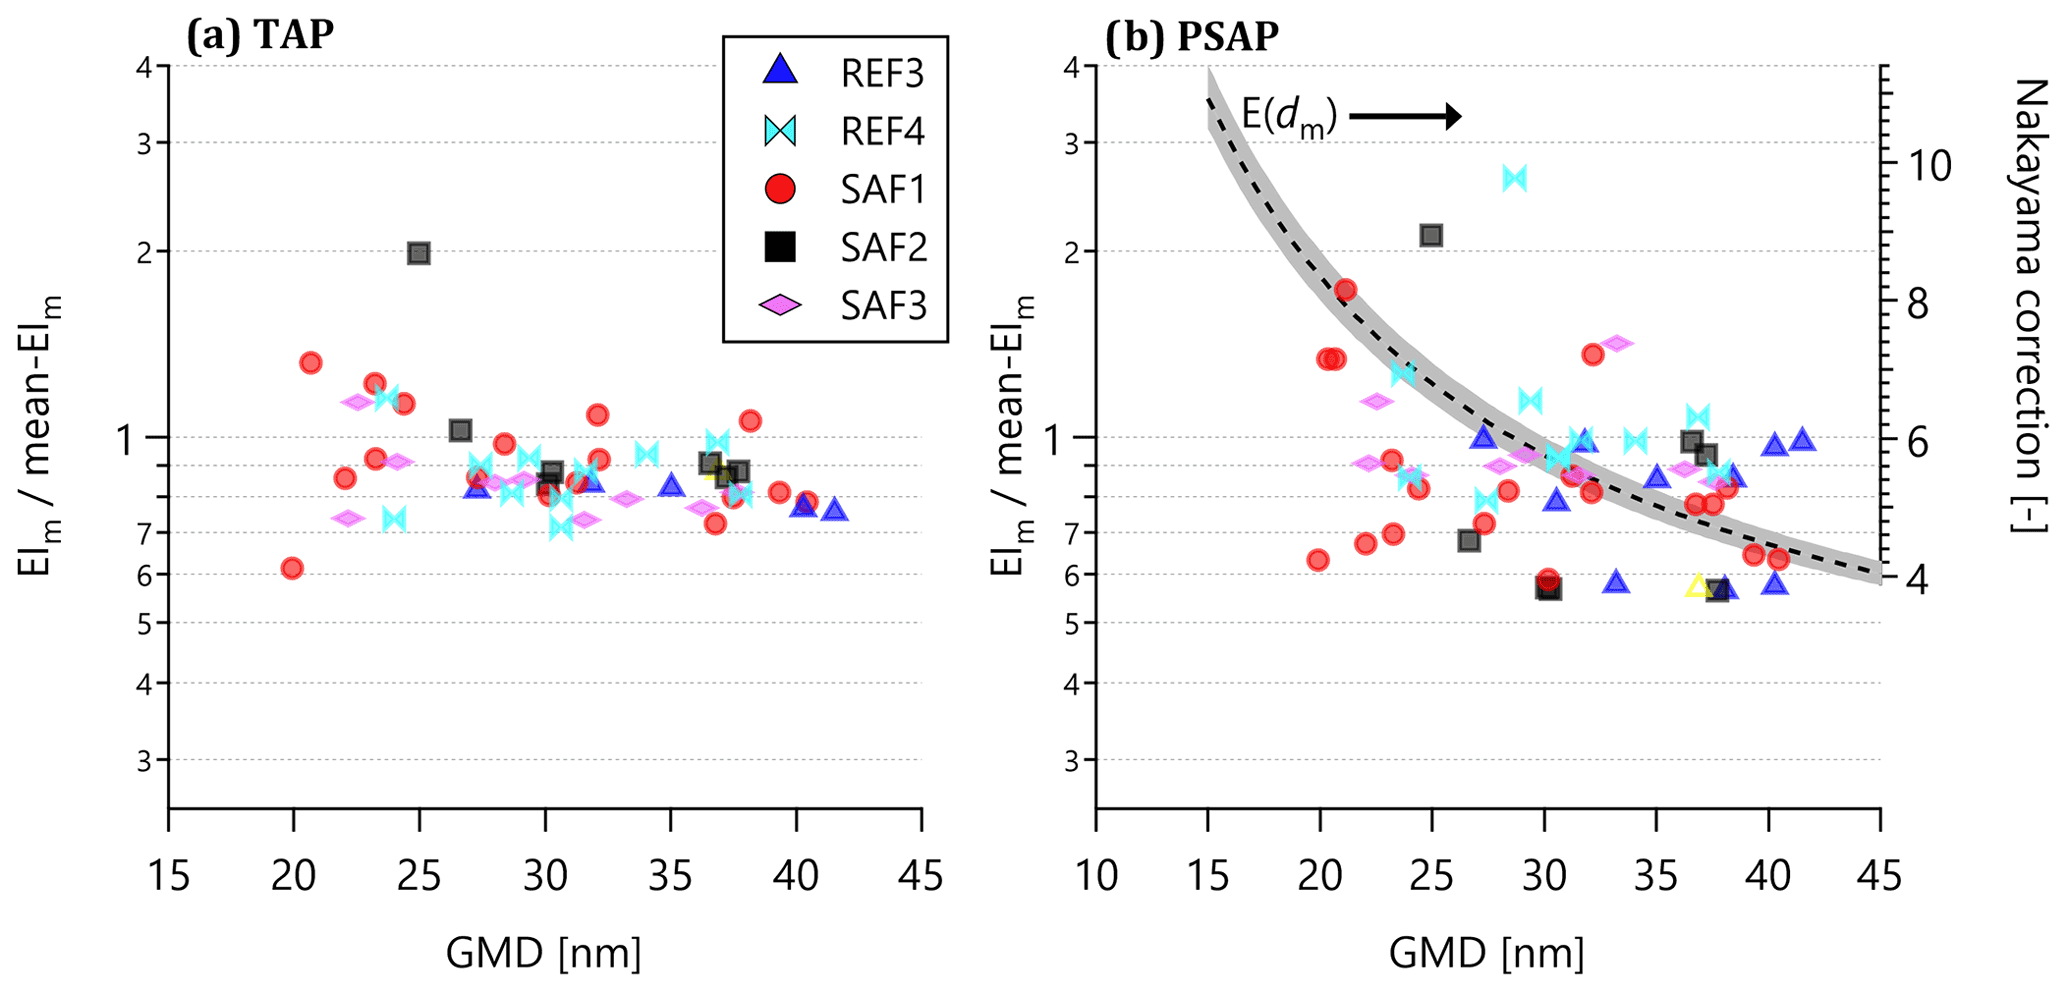
Figure 10EIm mean-EIm ratios from Fig. 9 for the TAP and PSAP (the filter-based photometers) only, plotted as a function of geometric mean mobility diameter (GMD) to highlight potential size-dependent sensitivities of these instruments. The curve labelled E(dmob) in (b) plots the size-dependent PSAP correction factor given by Nakayama et al. (2010; Eq. 8) with 1σ uncertainties shaded. Note that the TAP and PSAP were operated at 5 % and 10 % of their nominal flow rates, respectively, for all measurements in this study.
Figure 10 plots the same relative TAP and PSAP EIm data shown in Fig. 9b as a function of particle GMD. No clear trend of this ratio with size is evident, although the measurements become somewhat more scattered at smaller sizes for the SAF1 data set, where signal to noise is lower (GMD and EIm were correlated; see the discussion of Fig. 12 below). Figure 10b includes the size-dependent PSAP correction function reported by Nakayama et al. (2010) (their Eq. 8), with shading representing a 1σ uncertainty. Those authors predicted the true absorption values using Mie theory for nigrosin particles of diameter 100 to 600 nm and refractive index 1.685−0.285i. Thus, their correction factor is conceptually equivalent to our EIm mean-EIm. Extrapolating their correction function down from 100 to 15 nm gives values ranging from 4 to 8, whereas our measurements are close to 1.0. This discrepancy may be attributed primarily to the extrapolation and possibly also to the fact that we have measured solid nvPM particles rather than liquid nigrosin. Overall, it is clear that the variability in our PSAP data is not sufficiently predicted by the GMD.
Overall, our data show that any possible size dependency in the TAP and PSAP response is smaller than the observed variability between samples. The TAP and PSAP data exhibit relative standard deviations (RSD) of 19 % and 16 %, respectively, for samples with GMD > 25 nm. Future studies may consider correcting PSAP and TAP measurements by the ratios shown in Table 3, if they are operated at similarly modified flow rates. The ratios in Table 3 represent the ratio between the calibrated aerosol-phase nvPM mass measurements and the previously uncalibrated PSAP and TAP measurements, for data above 25 mg per kg fuel and N1 > 40 % and for respective flow rates at 5 % and 10 % of the nominal values.
3.5 Instrument performance for fuels with different composition
Figure 11 shows a category plot of the ratio EIm mean-EIm (that is, the ordinate of Fig. 9) for the different instruments. Data below 100 mg per kg fuel have been excluded as this ratio reflects only noise in that region (Fig. 9). The symbols have been sized by mean N1. The data have been coded by symbol and colour to reflect the six fuels used in this study, although JP-8 measurements are few in number due to the EIm of the data set (CFM56-2C1 with JP-8) being typically below 25 mg per kg fuel.
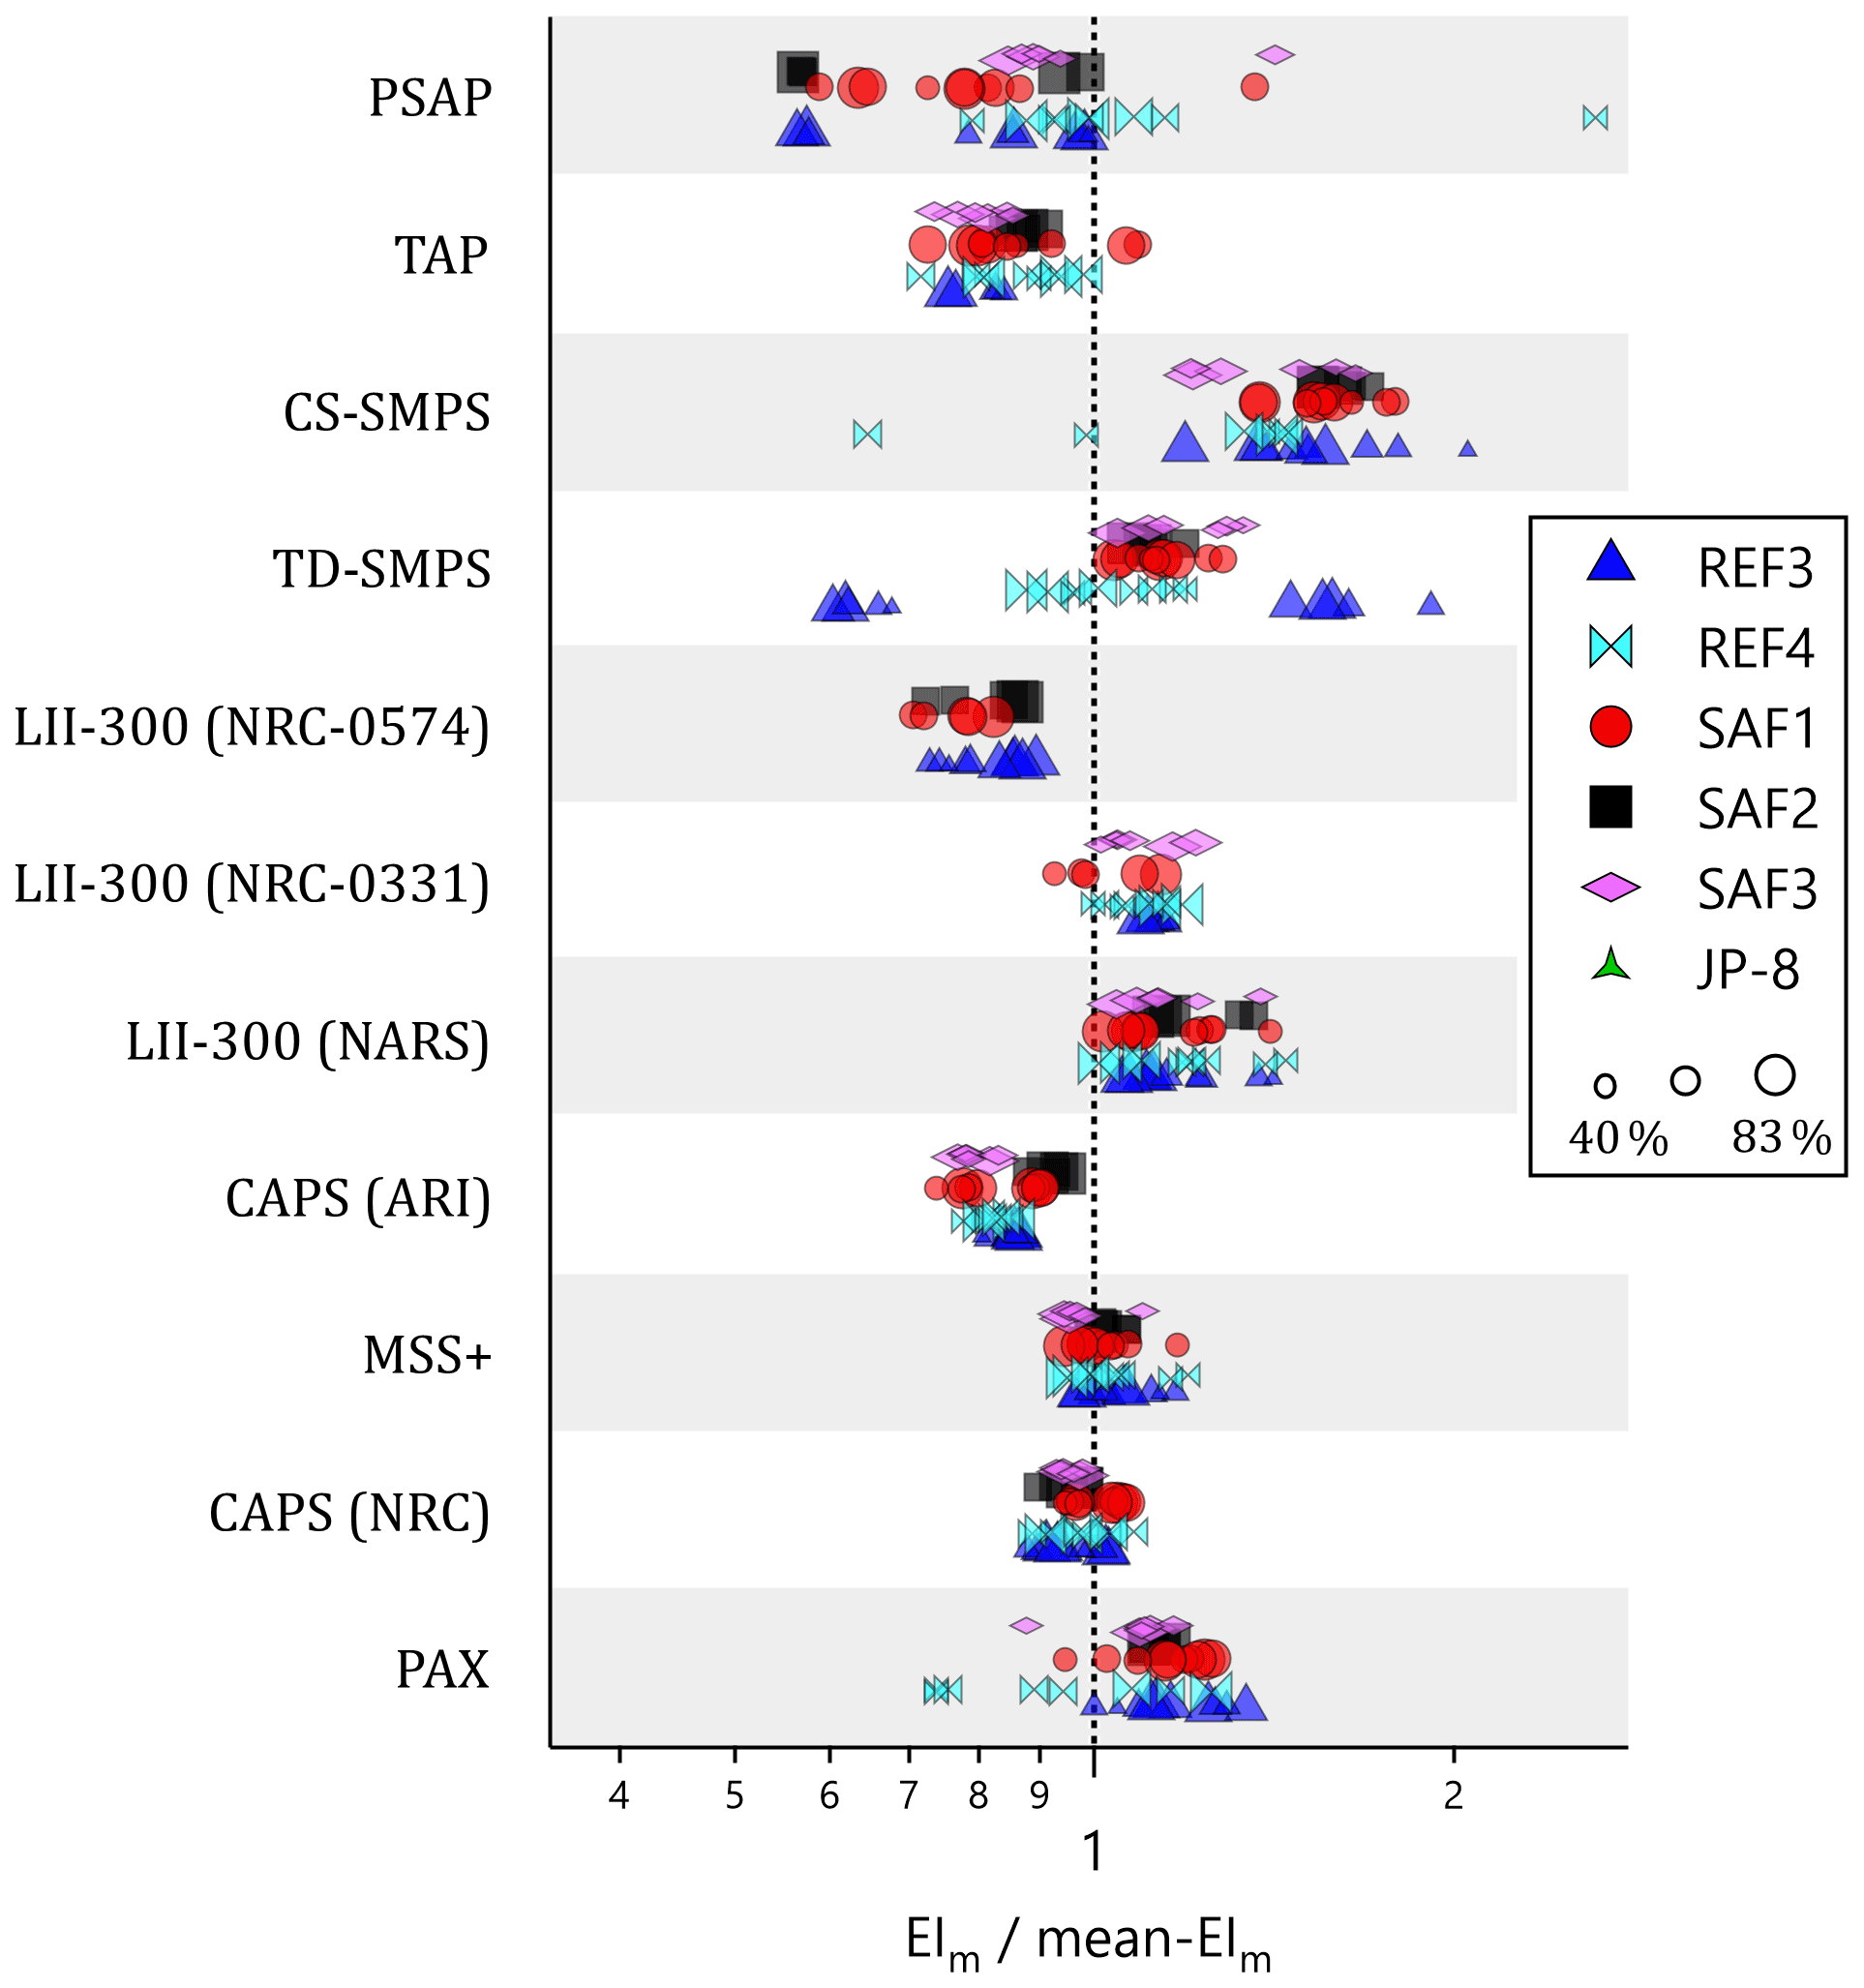
Figure 11Ratios of Fig. 9 grouped by fuel. All fuels except JP-8 were combusted in the V2527-A5 engine; JP-8 was combusted in the CFM56-2C1 engine. Shading is to guide the eye. Symbols are sized by N1 thrust. Plot excludes data where EIm < 25 mg per kg fuel and N1 thrust below 40 % to minimize the effects of instrument noise and wind speed, respectively, on the ratios.
Figure 11 shows that no substantial difference can be seen for these instruments for the nvPM EIm for fuels with different composition; the spread in the data for a given fuel is larger than the difference between fuels. Outliers tend to be associated with low N1 (small symbols). Because low N1 corresponds to both lower concentrations (lower signal-to-noise) and lower exhaust velocities relative to ambient wind speeds, these outliers are not surprising.
The instruments in Fig. 11 show a linear response to nvPM mass and operate on a range of physical principles. This observation indicates that no instrument was uniquely sensitive to changes in particle size over the observed range, since EIm was correlated with GMD (Fig. 12), as is typical of aviation engines (Saffaripour et al., 2020). We note that the response of all of these instruments is proportional to the MAC of the sample, so that it remains possible that the sample MAC changed with GMD or EIm.
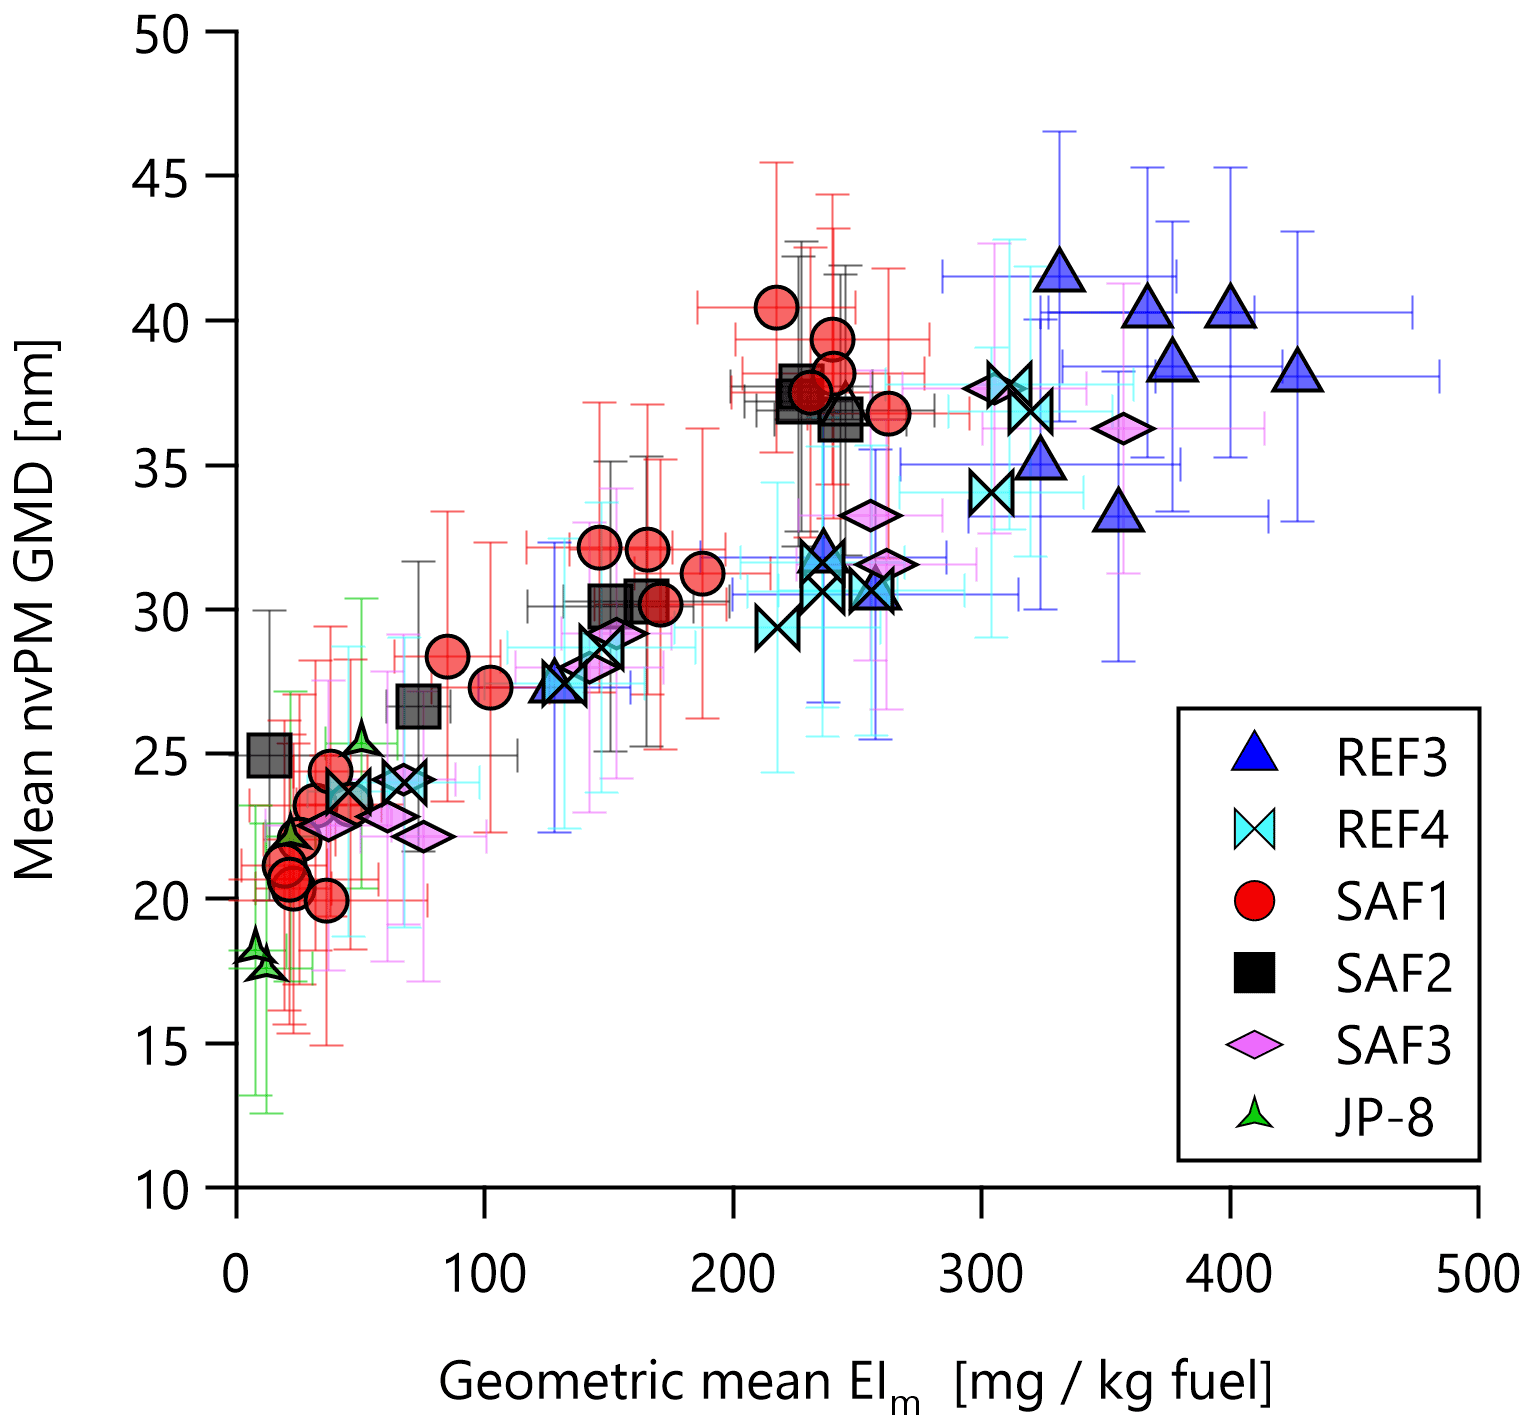
Figure 12Scatterplot of the mean nvPM GMD within test points against geometric mean nvPM EIm from Fig. 8a. The correlation with GMD and EIm indicates that Fig. 9 implicitly represented different particle sizes.
3.6 Influence of LII laser fluence
An additional experiment was performed to test the hypothesis that the laser fluence of the LII 300 may not be sufficiently high to heat nvPM to incandescence in aircraft-engine PM emissions from SAFs at different engine thrusts. The experimental design was similar to that of Yuan et al. (2022). This hypothesis is related to electron microscopy evidence (Vander Wal et al., 2014) showing that the degree of graphitization of aircraft-engine soot may be substantially lowered at low thrusts. A lower degree of graphitization may result in a lower LII signal if the 1064 nm MAC is lower (resulting in a lower maximum temperature being reached) or if part of the laser energy leads to carbon annealing rather than thermal excitation (Botero et al., 2021; Ugarte, 1992; Vander Wal and Choi, 1999). If correct, this hypothesis would mean that the nvPM concentrations reported by an LII 300 operated at reduced fluence would be lower than those of a reference LII 300. Higher fluences are also required for nvPM internally mixed with volatile PM, as some laser energy may be lost to volatile evaporation (Michelsen et al., 2015).
Figure 13a illustrates the experiment we performed to test this hypothesis. The figure presents data for SAF1 only; results for other fuels were similar. One “reduced-fluence” LII 300 was programmed to change its Q-switch delay from 140 to 240 µs, with a randomized order. In this experiment, lower Q-switch delays corresponded to higher laser fluence; the lowest Q-switch delay was the optimal one for this system. Another “reference” LII 300 operated with no change to its Q-switch delay. Figure 13a shows that the reduced-fluence LII reported lower mass concentrations when its Q-switch delay was increased but returned to the expected values when its Q-switch delay was reduced.

Figure 13(a) LII 300 experiment time series, where one LII 300 was operated with increased Q-switch delays to reduce its laser fluence (squares) and the other was operated at standard fluence (solid line). CO2 data are also shown for context. (b) The ratio RLII of the concentration reported by the reduced-fluence LII divided by the reference LII. It is evident from (b) that the standard high-fluence conditions generate data that are independent of N1 thrust and that moderate- and low-fluence conditions (Q-switch delays greater than about 165 to 185 µs) display a weak dependence on thrust.
We defined RLII as the ratio of nvPM mass concentrations reported by the reduced-fluence and reference LII 300 instruments. Figure 13b shows that RLII was a function of Q-switch delay, and therefore laser fluence, for all engine thrust conditions. This observation is expected, since LII signals are lower at lower fluence (Michelsen et al., 2015) and since we calculated RLII without taking this effect into account. We have verified in our laboratory that Q-switch delay is inversely proportional to laser fluence for this system and that saturation effects are negligible.
A trend of decreasing RLII with decreasing N1 is evident at moderate and low Q-switch delays, which can be interpreted as indicating that the nvPM was more graphitic at higher N1 conditions (Vander Wal et al., 2014; Liati et al., 2014). However, RLII reached a plateau at high fluence (smaller Q-switch delay), which is the region where the LII 300 normally operates. This plateau was reached at all engine thrusts, with a broader range for the plateau at higher thrusts and a decreasing range as the thrust was lowered. Therefore, the LII 300 has sufficient fluence and can be expected to perform well for SAF blends at all engine thrust conditions.
For multiple instruments measuring nvPM number, size, and mass, we observed no evidence of anomalous instrument responses to the exhaust emissions produced by SAF blends relative to the combustion of petroleum jet fuel (REFs) in an IAE V2527-A5 engine. The GMD, GSD, and EInum data for all fuels fell within 20 %, 5 %, and a factor of 2 of their mean, respectively. Anomalous instrumental responses would have resulted in two groups of data for these parameters, which was not observed. However, a difference between EInum for instruments located on different-length sampling lines was noted and attributed to a greater sensitivity of EInum than EIm to the penetration function.
The majority of nvPM mass measurements by the real-time instruments (CAPS PMSSA, LII 300, MSS+, and PAX) agreed to within 30 % of their geometric mean (reference mean), for EIm above 100 mg per kg fuel. This lower limit corresponded to a mass concentration of approximately 10 µg m−3 (the conversion of EIm to mass varies because the emitted [CO2] varies), which was the noise level of these instruments in our sampling setup. The ratio of each real-time measurement with the reference mean was close to unity (maximally 1.24, minimally 0.78) and indicated good precision (all RSDs ≤ 17 %).
Integrative nvPM EIm, calculated from PSD measurements or filter attenuation (TAP and PSAP), fell within a factor of 2 of the reference mean. The ratio of each integrative measurement with the reference mean was further from unity (maximally 1.50, minimally 0.88), and variability had a higher precision (all RSDs ≤ 36 %). The variability in TAP data was notably low at 14 %, and the variability in PSAP data was notably high at 36 %, likely due to its operation at a reduced flow rate (as noted, the TAP and PSAP were operated at 5 % and 10 % of their nominal flow rates, respectively).
Two other instrument- and fuel-composition-specific observations were made. A dedicated experiment showed that changing the laser fluence of an LII 300 could influence its reported nvPM mass concentrations at low to moderate fluences. By maintaining sufficiently high fluence a plateau region was established, irrespective of thrust or fuel, where reported nvPM mass concentrations were stable and not influenced by experimental conditions. Second, additional measurements of emissions from JP-8 fuel combusted in a CFM56-2C1 engine indicated the presence of very high concentrations of volatile nucleation-mode particles with diameter < 20 nm. These measurements reflect a different engine, as well as a fuel with a factor 20 higher sulfur content, and the increased total PM number concentration is most likely attributable to the sulfur.
Overall, this study found that real-time instruments for the measurement of nvPM emissions in aviation turbine engines are comparable whether conventional fuels or SAFs are used. Since all real-time measurements were influenced by the MAC and no independent measurement of nvPM mass was made, no conclusions about the variability thereof can be made from this study.
The data presented in Figs. 4 to 10 are available in the Zenodo repository at https://doi.org/10.5281/zenodo.5504098 (Corbin et al., 2021) as a spreadsheet file. Other data are available from the authors upon request.
BEA, PaL, TS, PrL, GJS, PDW, and RCML designed the study. JCC, TS, PaL, GJS, ECC, SA, PDW, RCML, ZY, AF, MT, DS, WL, CR, PO, MAS, and PrL took the measurements. JCC, TS, BEA, RHM, MAS, ECC, SA, and ZY analyzed the data with input from GJS, PrL, RCML, and AF. JCC prepared the figures. JCC and PrL drafted the manuscript. All authors discussed the data interpretation and presentation.
Richard C. Miake-Lye and Andrew Freedman are employed by Aerodyne Research Inc., which produces the CAPS PMSSA commercially. Zhenhong Yu was employed by Aerodyne Research Inc. at the time of the study.
Publisher’s note: Copernicus Publications remains neutral with regard to jurisdictional claims in published maps and institutional affiliations.
We acknowledge the efforts of the flight and ground crews of the DLR ATRA, the NASA DC8, and the U.S. Air Force 86th Airlift Wing. We thank the ground staff of Ramstein Air Base for their operational support during this experiment.
This research has been supported by the Transport Canada (TC Aviation – nvPM from renewable and conventional fuels), the Deutsches Zentrum für Luft- und Raumfahrt (Emission and Climate Impact of Alternative Fuels (ECLIF)), the National Aeronautics and Space Administration Aeronautics Research Mission Directorate, and the Federal Aviation Administration (ASCENT Project 002). ATRA operational and fuel costs along with DLR scientists' participation were funded by the DLR aeronautics program in the framework of the ECLIF project. The U.S. FAA Office of Environment and Energy and the National Aeronautics and Space Administration Aeronautics Research Mission Directorate supported field and DC-8 operations and participation of the US researchers in the project. MS&T and ARI received support from the U.S. Federal Aviation Administration (FAA) through the Aviation Sustainability Center (ASCENT) – a U.S. FAA–NASA–U.S. DoD–Transport Canada–U.S. EPA-sponsored Center of Excellence for Alternative Jet Fuels and Environment under grant no. 13-C-AJFE-MST, Amendment 010. Andrew Freedman was supported by funds from ARI.
This paper was edited by Albert Presto and reviewed by three anonymous referees.
Abegglen, M., Durdina, L., Brem, B. T., Wang, J., Rindlisbacher, T., Corbin, J. C., Lohmann, U., and Sierau, B.: Effective density and mass-mobility exponents of particulate matter in aircraft turbine exhaust: Dependence on engine thrust and particle size, J. Aerosol Sci., 88, 135–147, https://doi.org/10.1016/j.jaerosci.2015.06.003, 2015.
ASTM D4054: Practice for Evaluation of New Aviation Turbine Fuels and Fuel Additives, ASTM International,Conshohocken, PA, https://doi.org/10.1520/D4054-19, 2019.
ASTM D7566: Specification for Aviation Turbine Fuel Containing Synthesized Hydrocarbons, ASTM International, Conshokocken, PA, https://doi.org/10.1520/D7566-20, 2020.
Beyersdorf, A. J., Timko, M. T., Ziemba, L. D., Bulzan, D., Corporan, E., Herndon, S. C., Howard, R., Miake-Lye, R., Thornhill, K. L., Winstead, E., Wey, C., Yu, Z., and Anderson, B. E.: Reductions in aircraft particulate emissions due to the use of Fischer–Tropsch fuels, Atmos. Chem. Phys., 14, 11–23, https://doi.org/10.5194/acp-14-11-2014, 2014.
Bond, T. C. and Bergstrom, R. W.: Light absorption by carbonaceous particles: An investigative review, Aerosol Sci. Technol., 40, 27–67, https://doi.org/10.1080/02786820500421521, 2006.
Bond, T. C., Anderson, T. L., and Campbell, D.: Calibration and Intercomparison of Filter-Based Measurements of Visible Light Absorption by Aerosols, Aerosol Sci. Technol., 30, 582–600, https://doi.org/10.1080/027868299304435, 1999.
Botero, M. L., Akroyd, J., Chen, D., Kraft, M., and Agudelo, J. R.: On the thermophoretic sampling and TEM-based characterisation of soot particles in flames, Carbon N.Y., 171, 711–722, https://doi.org/10.1016/j.carbon.2020.09.074, 2021.
Brem, B. T., Durdina, L., Siegerist, F., Beyerle, P., Bruderer, K., Rindlisbacher, T., Rocci-Denis, S., Andac, M. G., Zelina, J., Penanhoat, O., and Wang, J.: Effects of Fuel Aromatic Content on Nonvolatile Particulate Emissions of an In-Production Aircraft Gas Turbine, Environ. Sci. Technol., 49, 13149–13157, https://doi.org/10.1021/acs.est.5b04167, 2015.
Cain, J., Dewitt, M. J., Blunck, D., Corporan, E., Striebich, R., Anneken, D., Klingshirn, C., Roquemore, W. M., and Vander Wal, R.: Characterization of gaseous and particulate emissions from a turboshaft engine burning conventional, alternative, and surrogate fuels, Energy Fuels, 27, 2290–2302, https://doi.org/10.1021/ef400009c, 2013.
Catalytic Instruments GmbH: Catalytic Stripper CS015 Instrument Manual, Catalytic Instruments GmbH, 2014.
Clarke, A. D.: A thermo-optic technique for in situ analysis of size-resolved aerosol physicochemistry, Atmos. Environ. Part A, Gen. Top., 25, 635–644, https://doi.org/10.1016/0960-1686(91)90061-B, 1991.
Corbin, J., Schripp, T., Anderson, B. E., Smallwood, G. J., LeClercq, P., Crosbie, E. C., Achterberg, S., Whitefield, P. D., Miake-Lye, R. C., Yu, Z., Freedman, A., Satterfield, D., Liu, W., Osswald, P., Trueblood, M., Robinson, C., Shook, M. A., Moore, R. H., and Lobo, P.: NDMAX/ECLIF2 ground test data (Version 09), Zenodo [data set], https://doi.org/10.5281/zenodo.5504098, 2021.
Corporan, E., Edwards, T., Shafer, L., Dewitt, M. J., Klingshirn, C., Zabarnick, S., West, Z., Striebich, R., Graham, J., and Klein, J.: Chemical, thermal stability, seal swell, and emissions studies of alternative jet fuels, Energy Fuels, 25, 955–966, https://doi.org/10.1021/ef101520v, 2011.
Durand, E., Lobo, P., Crayford, A., Sevcenco, Y., and Christie, S.: Impact of fuel hydrogen content on non-volatile particulate matter emitted from an aircraft auxiliary power unit measured with standardised reference systems, Fuel, 287, 119637, https://doi.org/10.1016/j.fuel.2020.119637, 2021.
Durdina, L., Brem, B. T., Abegglen, M., Lobo, P., Rindlisbacher, T., Thomson, K. A., Smallwood, G. J., Hagen, D. E., Sierau, B., and Wang, J.: Determination of PM mass emissions from an aircraft turbine engine using particle effective density, Atmos. Environ., 99, 500–507, https://doi.org/10.1016/j.atmosenv.2014.10.018, 2014.
Durdina, L., Brem, B. T., Elser, M., Schönenberger, D., Siegerist, F., and Anet, J. G.: Reduction of Nonvolatile Particulate Matter Emissions of a Commercial Turbofan Engine at the Ground Level from the Use of a Sustainable Aviation Fuel Blend, Environ. Sci. Technol., 55, 14576–14585, https://doi.org/10.1021/acs.est.1c04744, 2021.
Elser, M., Brem, B. T., Durdina, L., Schönenberger, D., Siegerist, F., Fischer, A., and Wang, J.: Chemical composition and radiative properties of nascent particulate matter emitted by an aircraft turbofan burning conventional and alternative fuels, Atmos. Chem. Phys., 19, 6809–6820, https://doi.org/10.5194/acp-19-6809-2019, 2019.
Gagné, S., Couillard, M., Gajdosechova, Z., Momenimovahed, A., Smallwood, G., Mester, Z., Thomson, K., Lobo, P., and Corbin, J. C.: Ash-Decorated and Ash-Painted Soot from Residual and Distillate-Fuel Combustion in Four Marine Engines and One Aviation Engine, Environ. Sci. Technol., 55, 6584–6593, https://doi.org/10.1021/acs.est.0c07130, 2021.
Hileman, J. I. and Stratton, R. W.: Alternative jet fuel feasibility, Transp. Policy, 34, 52–62, https://doi.org/10.1016/j.tranpol.2014.02.018, 2014.
Hinds, W. C.: Aerosol technology: properties, behavior, and measurement of airborne particles, John Wiley & Sons, ISBN 978-0-471-19410-1, 1999.
Huang, C. H., and Vander Wal, R. L.: Effect of soot structure evolution from commercial jet engine burning petroleum based JP-8 and synthetic HRJ and FT fuels, Energy Fuels, 27, 4946–4958, https://doi.org/10.1021/ef400576c, 2013.
International Civil Aviation Organization (ICAO): International Standards and Recommended Practices – Annex 16 to the Convention on International Civil Aviation: Environmental Protection, Volume II – Aircraft Engine Emissions, 4th edn., Montreal, QC, Canada, ISBN 978-92-9258-314-9, 2017.
Kılıç, D., El Haddad, I., Brem, B. T., Bruns, E., Bozetti, C., Corbin, J., Durdina, L., Huang, R.-J., Jiang, J., Klein, F., Lavi, A., Pieber, S. M., Rindlisbacher, T., Rudich, Y., Slowik, J. G., Wang, J., Baltensperger, U., and Prévôt, A. S. H.: Identification of secondary aerosol precursors emitted by an aircraft turbofan, Atmos. Chem. Phys., 18, 7379–7391, https://doi.org/10.5194/acp-18-7379-2018, 2018.
Kinsey, J. S., Timko, M. T., Herndon, S. C., Wood, E. C., Yu, Z., Miake-Lye, R. C., Lobo, P., Whitefield, P., Hagen, D., Wey, C., Anderson, B. E., Beyersdorf, A. J., Hudgins, C. H., Thornhill, K. L., Edward, W., Howard, R., Bulzan, D. I., Tacina, K. B., and Knighton, W. B.: Determination of the emissions from an aircraft auxiliary power unit (APU) during the alternative aviation fuel experiment (AAFEX), J. Air Waste Manag. Assoc., 62, 420–430, https://doi.org/10.1080/10473289.2012.655884, 2012.
Kinsey, J. S., Giannelli, R., Howard, R., Hoffman, B., Frazee, R., Aldridge, M., Leggett, C., Stevens, K., Kittelson, D., Silvis, W., Stevens, J., Lobo, P., Achterberg, S., Swanson, J., Thomson, K., McArthur, T., Hagen, D., Trueblood, M., Wolff, L., Liscinsky, D., Arey, R., Cerully, K., Miake-Lye, R., Onasch, T., Freedman, A., Bachalo, W., Payne, G., and Durlicki, M.: Assessment of a regulatory measurement system for the determination of the non-volatile particulate matter emissions from commercial aircraft engines, J. Aerosol Sci., 154, 105734, https://doi.org/10.1016/j.jaerosci.2020.105734, 2021.
Kumal, R. R., Liu, J., Gharpure, A., Vander Wal, R. L., Kinsey, J. S., Giannelli, B., Stevens, J., Leggett, C., Howard, R., Forde, M., Zelenyuk, A., Suski, K., Payne, G., Manin, J., Bachalo, W., Frazee, R., Onasch, T. B., Freedman, A., Kittelson, D. B., and Swanson, J. J.: Impact of Biofuel Blends on Black Carbon Emissions from a Gas Turbine Engine, Energy Fuels, 34, 4958–4966, https://doi.org/10.1021/acs.energyfuels.0c00094, 2020.
Lack, D. A., Moosmüller, H., McMeeking, G. R., Chakrabarty, R. K., and Baumgardner, D.: Characterizing elemental, equivalent black, and refractory black carbon aerosol particles: a review of techniques, their limitations and uncertainties, Anal. Bioanal. Chem., 406, 99–122, https://doi.org/10.1007/s00216-013-7402-3, 2014.
Liati, A., Brem, B. T., Durdina, L., Vögtli, M., Dasilva, Y. A. R., Eggenschwiler, P. D., and Wang, J. Electron Microscopic Study of Soot Particulate Matter Emissions from Aircraft Turbine Engines, Environ. Sci. Technol., 48, 10975–10983, https://doi.org/10.1021/es501809b, 2014.
Liati, A., Schreiber, D., Alpert, P. A., Liao, Y., Brem, B. T., Corral Arroyo, P., Hu, J., Jonsdottir, H. R., Ammann, M., and Dimopoulos Eggenschwiler, P.: Aircraft soot from conventional fuels and biofuels during ground idle and climb-out conditions: Electron microscopy and X-ray micro-spectroscopy, Environ. Pollut., 247, 658–667, https://doi.org/10.1016/j.envpol.2019.01.078, 2019.
Liu, F., Yon, J., Fuentes, A., Lobo, P., Smallwood, G. J., and Corbin, J. C.: Review of recent literature on the light absorption properties of black carbon: Refractive index, mass absorption cross section, and absorption function, Aerosol Sci. Technol., 54, 33–51, https://doi.org/10.1080/02786826.2019.1676878, 2020.
Lobo, P., Hagen, D. E., and Whitefield, P. D.: Comparison of PM emissions from a commercial jet engine burning conventional, biomass, and fischer-tropsch fuels, Environ. Sci. Technol., 45, 10744–10749, https://doi.org/10.1021/es201902e, 2011.
Lobo, P., Christie, S., Khandelwal, B., Blakey, S. G., and Raper, D. W.: Evaluation of Non-volatile Particulate Matter Emission Characteristics of an Aircraft Auxiliary Power Unit with Varying Alternative Jet Fuel Blend Ratios, Energy Fuels, 29, 7705–7711, https://doi.org/10.1021/acs.energyfuels.5b01758, 2015a.
Lobo, P., Durdina, L., Smallwood, G. J., Rindlisbacher, T., Siegerist, F., Black, E. A., Yu, Z., Mensah, A. A., Hagen, D. E., Miake-Lye, R. C., Thomson, K. A., Brem, B. T., Corbin, J. C., Abegglen, M., Sierau, B., Whitefield, P. D., and Wang, J.: Measurement of aircraft engine non-volatile PM emissions: Results of the Aviation-Particle Regulatory Instrumentation Demonstration Experiment (A-PRIDE) 4 campaign, Aerosol Sci. Technol., 49, 472–484, https://doi.org/10.1080/02786826.2015.1047012, 2015b.
Lobo, P., Hagen, D. E., Whitefield, P. D., and Raper, D.: PM emissions measurements of in-service commercial aircraft engines during the Delta-Atlanta Hartsfield Study, Atmos. Environ., 104, 237–245, https://doi.org/10.1016/j.atmosenv.2015.01.020, 2015c.
Lobo, P., Condevaux, J., Yu, Z., Kuhlmann, J., Hagen, D. E., Miake-Lye, R. C., Whitefield, P. D., and Raper, D. W.: Demonstration of a Regulatory Method for Aircraft Engine Nonvolatile PM Emissions Measurements with Conventional and Isoparaffinic Kerosene fuels, Energy Fuels, 30, 7770–7777, https://doi.org/10.1021/acs.energyfuels.6b01581, 2016.
Lobo, P., Durdina, L., Brem, B. T., Crayford, A. P., Johnson, M. P., Smallwood, G. J., Siegerist, F., Williams, P. I., Black, E. A., Llamedo, A., Thomson, K. A., Trueblood, M. B., Yu, Z., Hagen, D. E., Whitefield, P. D., Miake-Lye, R. C., and Rindlisbacher, T.: Comparison of standardized sampling and measurement reference systems for aircraft engine non-volatile particulate matter emissions, J. Aerosol Sci., 145, 105557, https://doi.org/10.1016/j.jaerosci.2020.105557, 2020.
Masiol, M. and Harrison, R. M.: Aircraft engine exhaust emissions and other airport-related contributions to ambient air pollution: A review, Atmos. Environ., 95, 409–455, https://doi.org/10.1016/j.atmosenv.2014.05.070, 2014.
Michelsen, H. A., Schulz, C., Smallwood, G. J., and Will, S.: Laser-induced incandescence: Particulate diagnostics for combustion, atmospheric, and industrial applications, Prog. Energy Combust. Sci., 51, 2–48, https://doi.org/10.1016/j.pecs.2015.07.001, 2015.
Modini, R. L., Corbin, J. C., Brem, B. T., Irwin, M., Bertò, M., Pileci, R. E., Fetfatzis, P., Eleftheriadis, K., Henzing, B., Moerman, M. M., Liu, F., Müller, T., and Gysel-Beer, M.: Detailed characterization of the CAPS single-scattering albedo monitor (CAPS PMssa) as a field-deployable instrument for measuring aerosol light absorption with the extinction-minus-scattering method, Atmos. Meas. Tech., 14, 819–851, https://doi.org/10.5194/amt-14-819-2021, 2021.
Momenimovahed, A. and Olfert, J. S.: Effective Density and Volatility of Particles Emitted from Gasoline Direct Injection Vehicles and Implications for Particle Mass Measurement, Aerosol Sci. Technol., 49, 1051–1062, https://doi.org/10.1080/02786826.2015.1094181, 2015.
Moore, R. H., Thornhill, K. L., Weinzierl, B., Sauer, D., D'Ascoli, E., Kim, J., Lichtenstern, M., Scheibe, M., Beaton, B., Beyersdorf, A. J., Barrick, J., Bulzan, D., Corr, C. A., Crosbie, E., Jurkat, T., Martin, R., Riddick, D., Shook, M., Slover, G., Voigt, C., White, R., Winstead, E., Yasky, R., Ziemba, L. D., Brown, A., Schlager, H., and Anderson, B. E.: Biofuel blending reduces particle emissions from aircraft engines at cruise conditions, Nature, 543, 411–415, https://doi.org/10.1038/nature21420, 2017.
Nakayama, T., Kondo, Y., Moteki, N., Sahu, L. K., Kinase, T., Kita, K., and Matsumi, Y.: Size-dependent correction factors for absorption measurements using filter-based photometers: PSAP and COSMOS, J. Aerosol Sci., 41, 333–343, https://doi.org/10.1016/j.jaerosci.2010.01.004, 2010.
Nakayama, T., Suzuki, H., Kagamitani, S., Ikeda, Y., Uchiyama, A., and Matsumi, Y.: Characterization of a Three Wavelength Photoacoustic Soot Spectrometer (PASS-3) and a Photoacoustic Extinctiometer (PAX), J. Meteorol. Soc. Japan. Ser. II, 93, 285–308, https://doi.org/10.2151/jmsj.2015-016, 2015.
Ogren, J. A., Wendell, J., Andrews, E., and Sheridan, P. J.: Continuous light absorption photometer for long-term studies, Atmos. Meas. Tech., 10, 4805–4818, https://doi.org/10.5194/amt-10-4805-2017, 2017.
Onasch, T. B., Massoli, P., Kebabian, P. L., Hills, F. B., Bacon, F. W., and Freedman, A.: Single Scattering Albedo Monitor for Airborne Particulates, Aerosol Sci. Technol., 49, 267–279, https://doi.org/10.1080/02786826.2015.1022248, 2015.
Perim de Faria, J., Bundke, U., Freedman, A., Onasch, T. B., and Petzold, A.: Laboratory validation of a compact single-scattering albedo (SSA) monitor, Atmos. Meas. Tech., 14, 1635–1653, https://doi.org/10.5194/amt-14-1635-2021, 2021.
Petzold, A., Ogren, J. A., Fiebig, M., Laj, P., Li, S.-M., Baltensperger, U., Holzer-Popp, T., Kinne, S., Pappalardo, G., Sugimoto, N., Wehrli, C., Wiedensohler, A., and Zhang, X.-Y.: Recommendations for reporting “black carbon” measurements, Atmos. Chem. Phys., 13, 8365–8379, https://doi.org/10.5194/acp-13-8365-2013, 2013.
SAE: Aerospace Information Report (AIR) 6241 – Procedure for the Continuous Sampling and Measurement of Non-Volatile Particle Emissions from Aircraft Turbine Engines, SAE International, Warrendale, PA, https://doi.org/10.4271/AIR6241, 2013.
SAE: Aerospace Information Report (AIR) 6504 – Procedure for the Calculation of Sampling System Penetration Functions and System Loss Correction Factors, SAE International, Warrendale, PA, https://doi.org/10.4271/AIR6504, 2017.
SAE: Aerospace Recommended Practice (ARP) 6320 – Procedure for the Continuous Sampling and Measurement of Non-Volatile Particulate Matter Emissions from Aircraft Turbine Engines, SAE International, Warrendale, PA, https://doi.org/10.4271/ARP6320, 2018.
SAE: Aerospace Recommended Practice (ARP) 6481 – Procedure for the Calculation of Sampling Line Penetration Functions and Line Loss Correction Factors, SAE International, Warrendale, PA, https://doi.org/10.4271/ARP6481, 2019.
Saffaripour, M., Thomson, K. A., Smallwood, G. J., and Lobo, P.: A review on the morphological properties of non-volatile particulate matter emissions from aircraft turbine engines, J. Aerosol Sci., 139, 105467, https://doi.org/10.1016/j.jaerosci.2019.105467, 2020.
Schindler, W., Haisch, C., Beck, H. A., Niessner, R., Jacob, E., and Rothe, D.: A photoacoustic sensor system for time resolved quantification of diesel soot emissions, SAE Technical Paper 2004-01-0968, SAE International, https://doi.org/10.4271/2004-01-0968, 2004.
Schripp, T., Anderson, B., Crosbie, E. C., Moore, R. H., Herrmann, F., Oßwald, P., Wahl, C., Kapernaum, M., Köhler, M., Le Clercq, P., Rauch, B., Eichler, P., Mikoviny, T., and Wisthaler, A.: Impact of Alternative Jet Fuels on Engine Exhaust Composition during the 2015 ECLIF Ground-Based Measurements Campaign, Environ. Sci. Technol., 52, 4969–4978, https://doi.org/10.1021/acs.est.7b06244, 2018.
Schripp, T., Herrmann, F., Oßwald, P., Köhler, M., Zschocke, A., Weigelt, D., Mroch, M., and Werner-Spatz, C.: Particle emissions of two unblended alternative jet fuels in a full scale jet engine, Fuel, 256, 115903, https://doi.org/10.1016/j.fuel.2019.115903, 2019.
Schripp, T., Anderson, B. E., Bauder, U., Rauch, B., Corbin, J. C., Smallwood, G. J., Lobo, P., Crosbie, E., Shook, M. E., Miake-Lye, R., Yu, Z., Freedman, A., Whitefield, P. D., Robinson, C. E., Achterberg, S. L., Köhler, M., Oßwald, P., Grein, T., Sauer, D., Voigt, C., Schlager, H., and LeClercq, P.: Aircraft engine particulate matter and gaseous emissions from sustainable aviation fuels: results from ground-based measurements during the NASA/DLR Campaign ECLIF2/ND-MAX., submitted to Fuel, 2022.
Snelling, D. R., Smallwood, G. J., Liu, F., Gülder, Ö. L., and Bachalo, W. D.: A calibration-independent laser-induced incandescence technique for soot measurement by detecting absolute light intensity, Appl. Opt., 44, 6773, https://doi.org/10.1364/ao.44.006773, 2005.
Timko, M. T., Yu, Z., Onasch, T. B., Wong, H. W., Miake-Lye, R. C., Beyersdorf, A. J., Anderson, B. E., Thornhill, K. L., Winstead, E. L., Corporan, E., Dewitt, M. J., Klingshirn, C. D., Wey, C., Tacina, K., Liscinsky, D. S., Howard, R., and Bhargava, A.: Particulate emissions of gas turbine engine combustion of a fischer-tropsch synthetic fuel, Energy Fuels, 24, 5883–5896, https://doi.org/10.1021/ef100727t, 2010.
Timko, M. T., Fortner, E., Franklin, J., Yu, Z., Wong, H. W., Onasch, T. B., Miake-Lye, R. C., and Herndon, S. C.: Atmospheric measurements of the physical evolution of aircraft exhaust plumes, Environ. Sci. Technol., 47, 3513–3520, https://doi.org/10.1021/es304349c, 2013.
Trueblood, M. B., Lobo, P., Hagen, D. E., Achterberg, S. C., Liu, W., and Whitefield, P. D.: Application of a hygroscopicity tandem differential mobility analyzer for characterizing PM emissions in exhaust plumes from an aircraft engine burning conventional and alternative fuels, Atmos. Chem. Phys., 18, 17029–17045, https://doi.org/10.5194/acp-18-17029-2018, 2018.
Ugarte, D.: Curling and closure of graphitic networks under electron-beam irradiation, Nature, 359, 707–709, https://doi.org/10.1038/359707a0, 1992.
Vander Wal, R. L. and Choi, M. Y.: Pulsed laser heating of soot: morphological changes, Carbon N.Y., 37, 231–239, https://doi.org/10.1016/S0008-6223(98)00169-9, 1999.
Vander Wal, R. L., Bryg, V. M., and Huang, C.-H.: Aircraft engine particulate matter: Macro- micro- and nanostructure by HRTEM and chemistry by XPS, Combust. Flame, 161, 602–611, https://doi.org/10.1016/j.combustflame.2013.09.003, 2014.
Virkkula, A.: Erratum: Calibration of the 3-wavelength particle soot absorption photometer (3λ PSAP) (Aerosol Science and Technology (2002) 39 (68–83)), Aerosol Sci. Technol., 44, 706–712, https://doi.org/10.1080/02786826.2010.482110, 2010.
Vozka, P., Vrtiška, D., Šimáček, P., and Kilaz, G.: Impact of Alternative Fuel Blending Components on Fuel Composition and Properties in Blends with Jet A, Energy Fuels, 33, 3275–3289, https://doi.org/10.1021/acs.energyfuels.9b00105, 2019.
Williams, P. I., Allan, J. D., Lobo, P., Coe, H., Christie, S., Wilson, C., Hagen, D., Whitefield, P., Raper, D., and Rye, L.: Impact of alternative fuels on emissions characteristics of a gas turbine engine – Part 2: Volatile and semivolatile particulate matter emissions, Environ. Sci. Technol., 46, 10812–10819, https://doi.org/10.1021/es301899s, 2012.
Wilson, G. R., Edwards, T., Corporan, E., and Freerks, R. L.: Certification of alternative aviation fuels and blend components, Energy Fuels, 27, 962–966, https://doi.org/10.1021/ef301888b, 2013.
Yuan, R., Lobo, P., Smallwood, G. J., Johnson, M. P., Parker, M. C., Butcher, D., and Spencer, A.: Measurement of black carbon emissions from multiple engine and source types using laser-induced incandescence: sensitivity to laser fluence, Atmos. Meas. Tech., 15, 241–259, https://doi.org/10.5194/amt-15-241-2022, 2022.