the Creative Commons Attribution 4.0 License.
the Creative Commons Attribution 4.0 License.
 | 20 Jul 2022
Retrieval of the sea spray aerosol mode from submicron particle size distributions and supermicron scattering during LASIC
Jeramy L. Dedrick
Georges Saliba
Abigail S. Williams
Dan Lubin
Improved quantification of sea spray aerosol concentration and size is important for determining aerosol effects on clouds and the climate, though attempts to accurately capture the size distribution of the sea spray mode remain limited by the availability of supermicron size distributions. In this work, we introduce a new approach to retrieving lognormal mode fit parameters for a sea spray aerosol mode by combining submicron size distributions with supermicron scattering measurements using a Mie inversion. Submicron size distributions were measured by an ultra-high-sensitivity aerosol spectrometer (UHSAS), and supermicron scattering was taken as the difference between <10 µm and <1 µm three-wavelength integrating nephelometer measurements (NEPH). This UHSAS-NEPH method was applied during background marine periods of the Department of Energy Atmospheric Radiation Measurement Layered Atlantic Smoke Interactions with Clouds (LASIC) campaign on Ascension Island (November 2016–May 2017), when the contribution of sea spray aerosol was expected to represent a large fraction of the aerosol mass and total scattering. Lognormal sea spray modal parameters were retrieved from comparisons between nephelometer measurements and a lookup table of Mie theory-simulated scattering coefficients for low-error solutions that minimized the 0.4–1 µm residual in the UHSAS size distribution. We evaluated the UHSAS-NEPH method with a set of clean marine measurements in the North Atlantic that included supermicron size and chemical measurements, showing that measured supermicron size distributions are needed to constrain the sea spray number concentration but that mass concentration was reasonably characterized using supermicron scattering. For LASIC, the UHSAS-NEPH method retrieved sea spray mode properties for approximately 88 % of the background marine times when the scattering variability and total particle concentration were low ( 5 Mm−1 and <400 cm−3, respectively), with mass mean diameter ranging from 0.6 to 1.9 µm (1.47 ± 0.17 µm), modal width ranging from 1.1 to 3.97 (2.4±0.3), and mass concentration ranging from 0.18 to 23.0 µg m−3 (8.37. ± 4.1 µg m−3). The measured nephelometer scattering at three wavelengths was found to constrain the mode width marginally at the largest particle sizes in the absence of additional size and chemical measurements for defining parameters for the Mie solutions. Comparing UHSAS-NEPH retrievals to those of a fitting algorithm applied only to the submicron UHSAS number size distribution showed that correlations between retrieved mass concentration and the available mass-based sea spray tracers (coarse scattering, wind speed, and chloride) are low when supermicron measurements are not considered. This work demonstrates the added value of supermicron scattering measurements for retrieving reasonable sea spray mass concentrations, providing the best-available observationally constrained estimate of the sea spray mode properties when supermicron size distribution measurements are not available.
- Article
(5771 KB) - Full-text XML
-
Supplement
(1439 KB) - BibTeX
- EndNote


Sea spray aerosol represents the largest natural source of particles to the global aerosol mass budget (Lewis and Schwartz, 2004). Wind-driven breaking waves and bubbles bursting at the ocean surface produce sea spray particles composed of organic components and sea salts that are injected into the atmosphere (Russell et al., 2010; O'dowd et al., 1997). Field measurements have shown that sea spray aerosol makes up 10 %–30 % of the particles necessary for cloud formation, known as cloud condensation nuclei (CCN), at low supersaturations in marine regions (Modini et al., 2015; Quinn et al., 2017; Sanchez et al., 2021) and thus have important implications for modeled cloud properties and climate feedbacks (Horowitz et al., 2020). Model predictions of sea spray concentration are determined by a number of different emission parameterizations (e.g., Gong, 2003; de Leeuw et al., 2011; Salter et al., 2015), which leads to uncertainties in the sea spray mass production (2.2–118×1012 kg yr−1; de Leeuw et al., 2011), the shortwave scattering direct climate effect (−2.2 to −0.15 W m−2; Ayash et al., 2008), and the aerosol-cloud indirect climate effect (−2.9 to +0.3 W m−2; Paulot et al., 2020).
Ambient measurements of sea spray size distributions across submicron and supermicron sizes requires merging measurements from multiple instruments, often with a differential mobility analyzer (DMA) that measures submicron sizes (10 nm to 1 µm diameter) and an aerodynamic particle sizer (APS) for coarse sizes (0.5 to 10 µm diameter) (Modini et al., 2015; Saliba et al., 2019; Quinn et al., 2017). This DMA-APS-based technique has uncertainties controlled by the limited size range, resolution, and timing of each instrument, as well as by the ambient conditions. Merging mobility and aerodynamic measurements requires varying the particle density and shifting the size distribution until there is agreement between both instruments in the overlapping diameter range (Khlystov et al., 2004) due to uncertainties in particle densities of marine aerosol (Tang et al., 1997). The generally low number concentration of sea spray aerosol at supermicron sizes also causes poor counting statistics in the largest size bins of DMAs, which impacts the range of overlap to which the retrieval is sensitive (Russell et al., 1996a, b).
Coarse-mode sea spray has been retrieved using automated routines that fit a region of the merged size distribution, typically defined as particles larger than 0.4 µm diameter (0.4–10 µm), using a single lognormal mode (Saliba et al., 2019; Quinn et al., 2017). This diameter range often appears as a partial peak or “shoulder” in measured number and mass size distributions and is largely composed of sea salt particles during marine conditions (Quinn et al., 2017; Saliba et al., 2019; Zheng et al., 2018; Sanchez et al., 2021; Murphy et al., 1998). Lognormal fitting routines use parameters defining the shape of the mode (number concentration, geometric mean diameter, and geometric standard deviation) with observation-based constraints for the parameters (Modini et al., 2015; Quinn et al., 2017; Hussein et al., 2005) or an unconstrained approach with parameters that vary freely (Saliba et al., 2019; Sanchez et al., 2021). Correlations of the single lognormal mode to wind speed and sea salt mass concentration provide the justification for identifying the coarse mode as the “sea spray mode” during clean marine conditions (Saliba et al., 2019; Modini et al., 2015; Quinn et al., 2017; Lewis and Schwartz, 2004). When DMA and supermicron size distribution measurements were not available, submicron size-resolved measurements from the ultra-high sensitivity aerosol spectrometer (UHSAS) have been used for the UHSAS-only retrieval of the sea spray mode (Sanchez et al., 2021; Zheng et al., 2018, 2021). These methods have provided some demonstrated skill in predicting the number and cloud-forming properties of sea spray particles less than 1 µm in size, but may not be sufficient to adequately characterize the mass concentration and optical properties of the supermicron fraction of the sea spray (Murphy et al., 1998; Chamaillard et al., 2006; Kleefeld et al., 2002; O'Dowd et al., 2010).
Given the uncertainties associated with merging of multiple instrument size distributions and the limited availability of supermicron size distribution measurements in marine regions, alternative methods should be considered to adequately characterize the modal properties of sea spray aerosol. Supermicron scattering measurements from nephelometers are commonly included as part of long-term atmospheric observations (Uin et al., 2019; Schmale et al., 2022) and provide an attractive alternative to supermicron size distribution measurements for constraining coarse sea spray properties (DeMott et al., 2016; Testa et al., 2021). The premise of the approach proposed here is the observation that the sea spray particle mass concentration often correlates to the supermicron scattering during clean marine conditions (Kleefeld et al., 2002; Chamaillard et al., 2006; Quinn et al., 1998; O'Dowd et al., 2010). Scattering measurements can be translated to equivalent size distributions by employing Mie theory (Mie, 1908), i.e., by using an inverse Mie method (IMM) with assumptions for the particle size, composition, and concentration to obtain the optical properties of the particle population (Bluvshtein et al., 2017). Similar approaches that combine observed or simulated size distributions with scattering measurements have found that optical properties alone, without the addition of a particle sizer, are not sufficient to estimate properties of the aerosol size distribution (Frie and Bahreini, 2021; Shen et al., 2019; Lv et al., 2018).
In this work, we retrieved sea spray aerosol modal properties by fitting a single lognormal mode constrained by supermicron scattering at three wavelengths from a nephelometer to measured mass size distributions from an ultra-high-sensitivity aerosol spectrometer, known here as the UHSAS-NEPH method. Since sea spray aerosol concentrations are most relevant to CCN in “clean” marine environments (Quinn et al., 2017), and the addition of nonmarine sources (e.g., dust) tends to mask supermicron sea spray contributions, we directed the method at measurements that are largely reflective of clean marine conditions on Ascension Island during the Layered Atlantic Smoke Interactions with Clouds (LASIC) campaign. LASIC measurements provide an example where the sea spray size distribution needs to be retrieved but no supermicron size distributions were measured. To compare and support UHSAS-NEPH with previously developed techniques, the method was also applied to an additional dataset that included nephelometer and submicron size measurements as well as size-resolved sea salt mass concentration and supermicron size distributions for the validation of reasonable sea spray mass retrieval.
2.1 LASIC
Measurements from the Department of Energy Atmospheric Radiation Measurement (DOE ARM) site on Ascension Island, Saint Helena (7.96696∘ S, 14.34981∘ W) during the Layered Atlantic Smoke Interactions with Clouds (LASIC) campaign are used to develop the sea spray mode retrieval. LASIC captured the annual and seasonal cycles of aerosol and cloud properties during an 18-month (April 2016–October 2017) deployment of the ARM Mobile Facility 1 (AMF1) (Miller et al., 2016; Zuidema et al., 2016). AMF1 measurements were collected at an isolated site on the windward flank of Green Mountain, away from the island's airport and other inhabited areas (Zhang and Zuidema, 2019). The prevailing wind direction measured by meteorological instrumentation during the campaign was 115 ± 10∘ (east-southeasterly), indicating persistent sampling of offshore maritime air. The ARM Mobile Aerosol Observing System, a component of AMF1, housed the instruments (described in the following subsections) and sampled from an inlet situated 10 m above ground level at an altitude of 365 m above sea level (Uin et al., 2019).
Episodic intrusions of airborne biomass-burning particles are carried into the Ascension Island marine boundary layer from South African wildfires annually during June–October (Zuidema et al., 2016). These events contrast sharply with the clean boundary layer that persists for the remainder of the year (November–May; Pennypacker et al., 2020). Nonmarine aerosol particles are limited during this “background” season, though a few transport events of African dust that entrain into the boundary layer have been documented as occurring during austral summer and fall months (January–April) in the southeast Atlantic (Kishcha et al., 2015; Virkkula et al., 2006). For background (non-biomass-burning) times without dust events, the aerosol population is expected to be largely from marine sources, of which sea spray represents a large fraction of the aerosol mass concentration. This work will focus on LASIC background season observations (November 2016–May 2017) (Table 1).
Table 1LASIC measurements analyzed in this study.
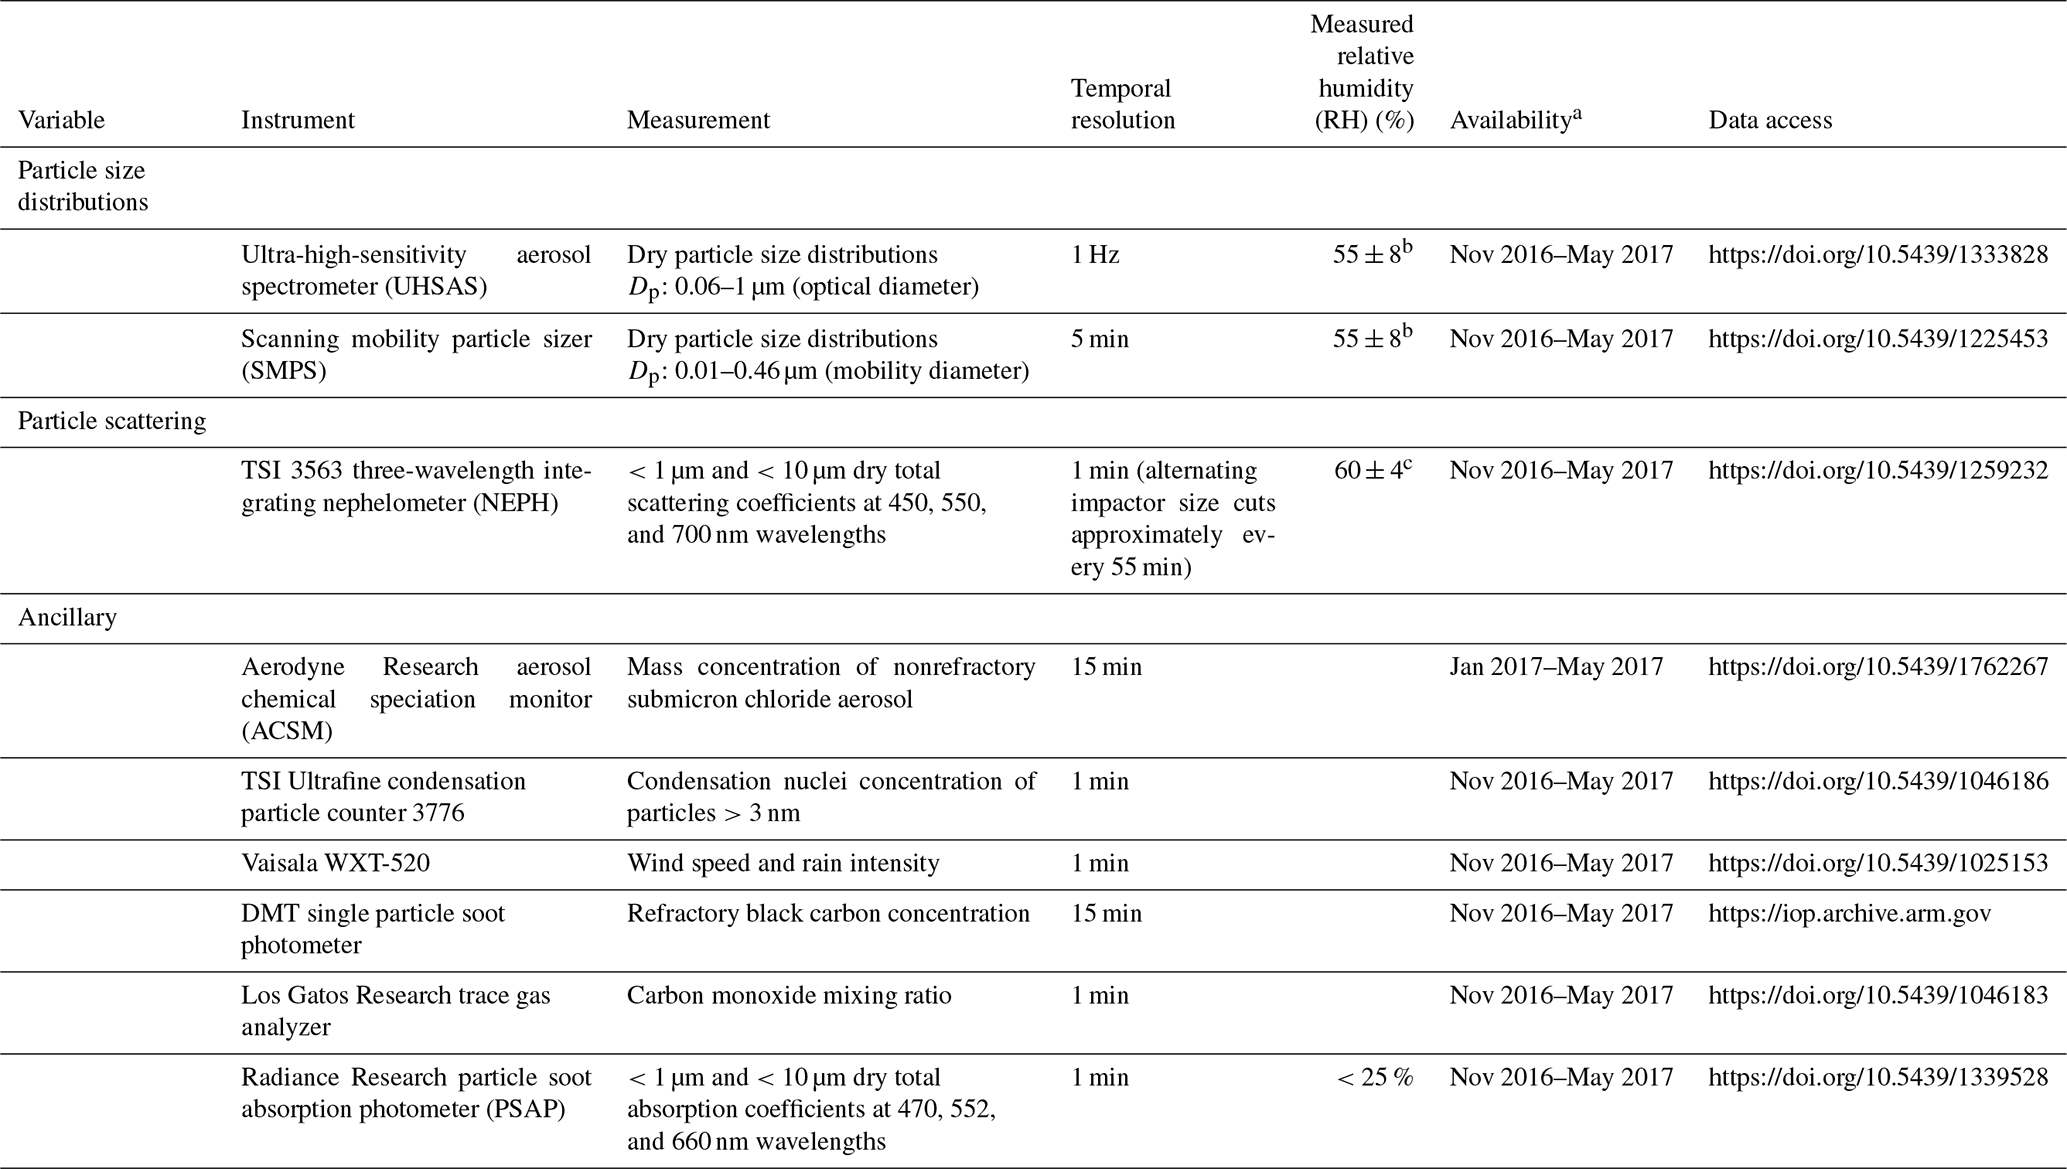
a Full availability defined as the typical Ascension Island background season (November–May). b Not reported in the dataset. Estimated from the internal temperature, ambient temperature, and ambient RH. c Nephelometer measurements used for retrieval were restricted to periods when the RH was below 60 % (Sect. 2.1.2).
2.1.1 Submicron particle size distributions
Two particle sizing instruments were operated during the LASIC campaign: a TSI scanning mobility particle sizer (SMPS; TSI Inc., Shoreview, MN, USA) and an ultra-high-sensitivity aerosol spectrometer (UHSAS; Droplet Measurement Techniques (DMT) Inc., Longmont, CO, USA). The SMPS measured the aerosol size distribution in the 10 to 460 nm dry mobility diameter range, which did not have sufficient overlap with the >0.4 µm diameter range relevant for retrieving the sea spray mode (Fig. 1), meaning that it did not provide constraints on the sea spray mode retrieval and was not used here.
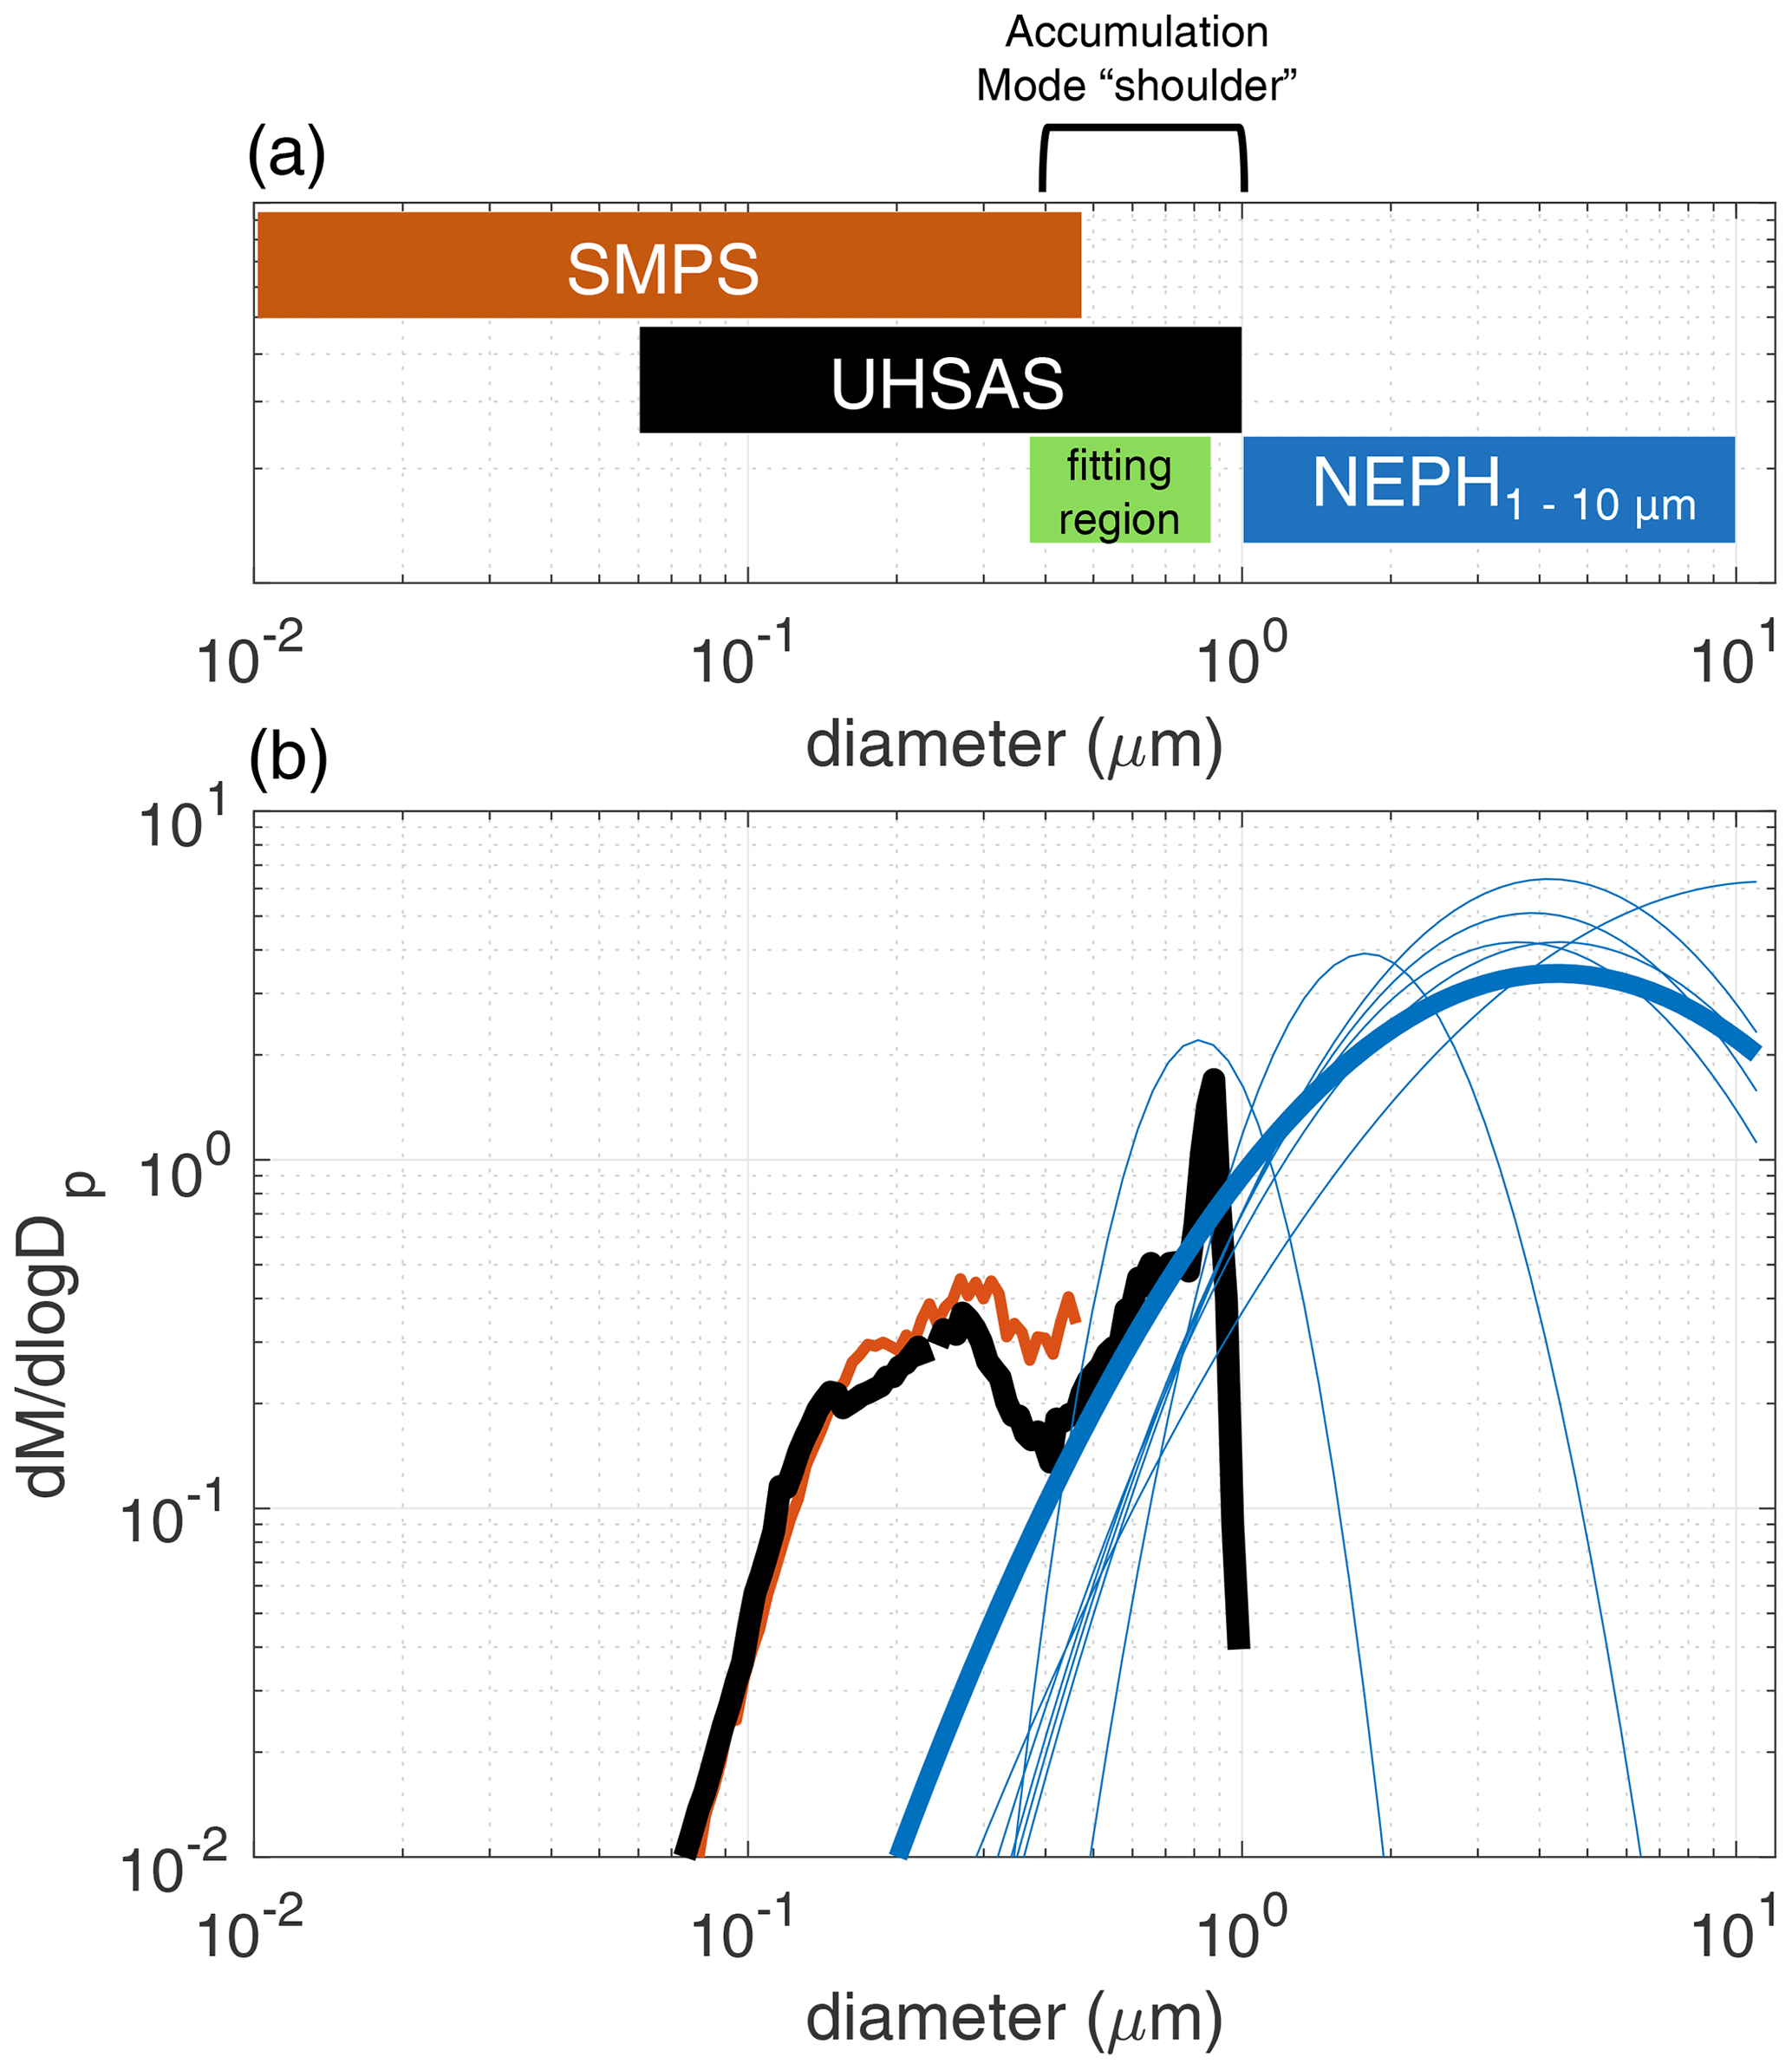
Figure 1Schematic demonstrating the sea spray mode retrieval method using Mie-theory-simulated size distributions, three-wavelength integrating nephelometer supermicron scattering measurements, and UHSAS submicron mass size distributions (UHSAS-NEPH). The retrieval shown is for a 2 h averaging period beginning at 14:00 UTC on 29 November 2016. (a) Instrument size ranges and mode fitting region for size distributions. (b) Mass size distributions (µg m−3) measured by the SMPS (orange) and UHSAS (black), probable Mie-theory-simulated lognormal sea spray mode solutions (thin blue), and best constrained Mie solution (thick blue). Note the UHSAS instrument artifact at Dp=0.85 µm (see text for description).
The UHSAS operated with 99 size channels at logarithmic spacing to cover optical diameters from 60 nm to 1 µm at a temporal resolution of 1 Hz that were averaged to 1 min. The UHSAS was calibrated using polystyrene latex spheres with a refractive index of approximately 1.59 and has a particle counting efficiency of approximately 100 % for particle concentrations below 3000 cm−3 and sizes larger than 0.1 µm (Cai et al., 2008). The counts of particles per bin were converted to number size distributions using the sample flow rate (typically 50 cm3 min−1) and the sample accumulation time (10 s). The UHSAS sample line relative humidity (RH) was not recorded during LASIC, so the RH during UHSAS size distribution measurements was estimated using the UHSAS internal temperature along with the ambient temperature and relative humidity from the Mobile Aerosol Observing System meteorological instrumentation. The UHSAS RH was found to be 55 ± 8 % during LASIC.
UHSAS artifacts at large size bins have been reported for measurements in marine air masses (Pennypacker and Wood, 2017; Sanchez et al., 2021). These artifacts appear as two consistent and narrow modes at optical particle diameters of 0.6 and 0.85 µm, which likely represent the splitting of the sea spray mode by partial drying of salt that has been sampled from high ambient relative humidity (Fig. 2). These two modes constitute low contributions to the particle number concentration (Fig. 2a), but contribute an appreciable amount to the mass concentration (Fig. 2b) of the measured size distributions. We expect that the 0.6 µm mode is the dried part of the salt mode, similar to distributions reported by Sanchez et al. (2021), while the narrow 0.85 µm mode is the remainder of the salt mode that is only partially dried. A treatment for these artifacts to fit the sea spray mode is described in Sect. 3.4.
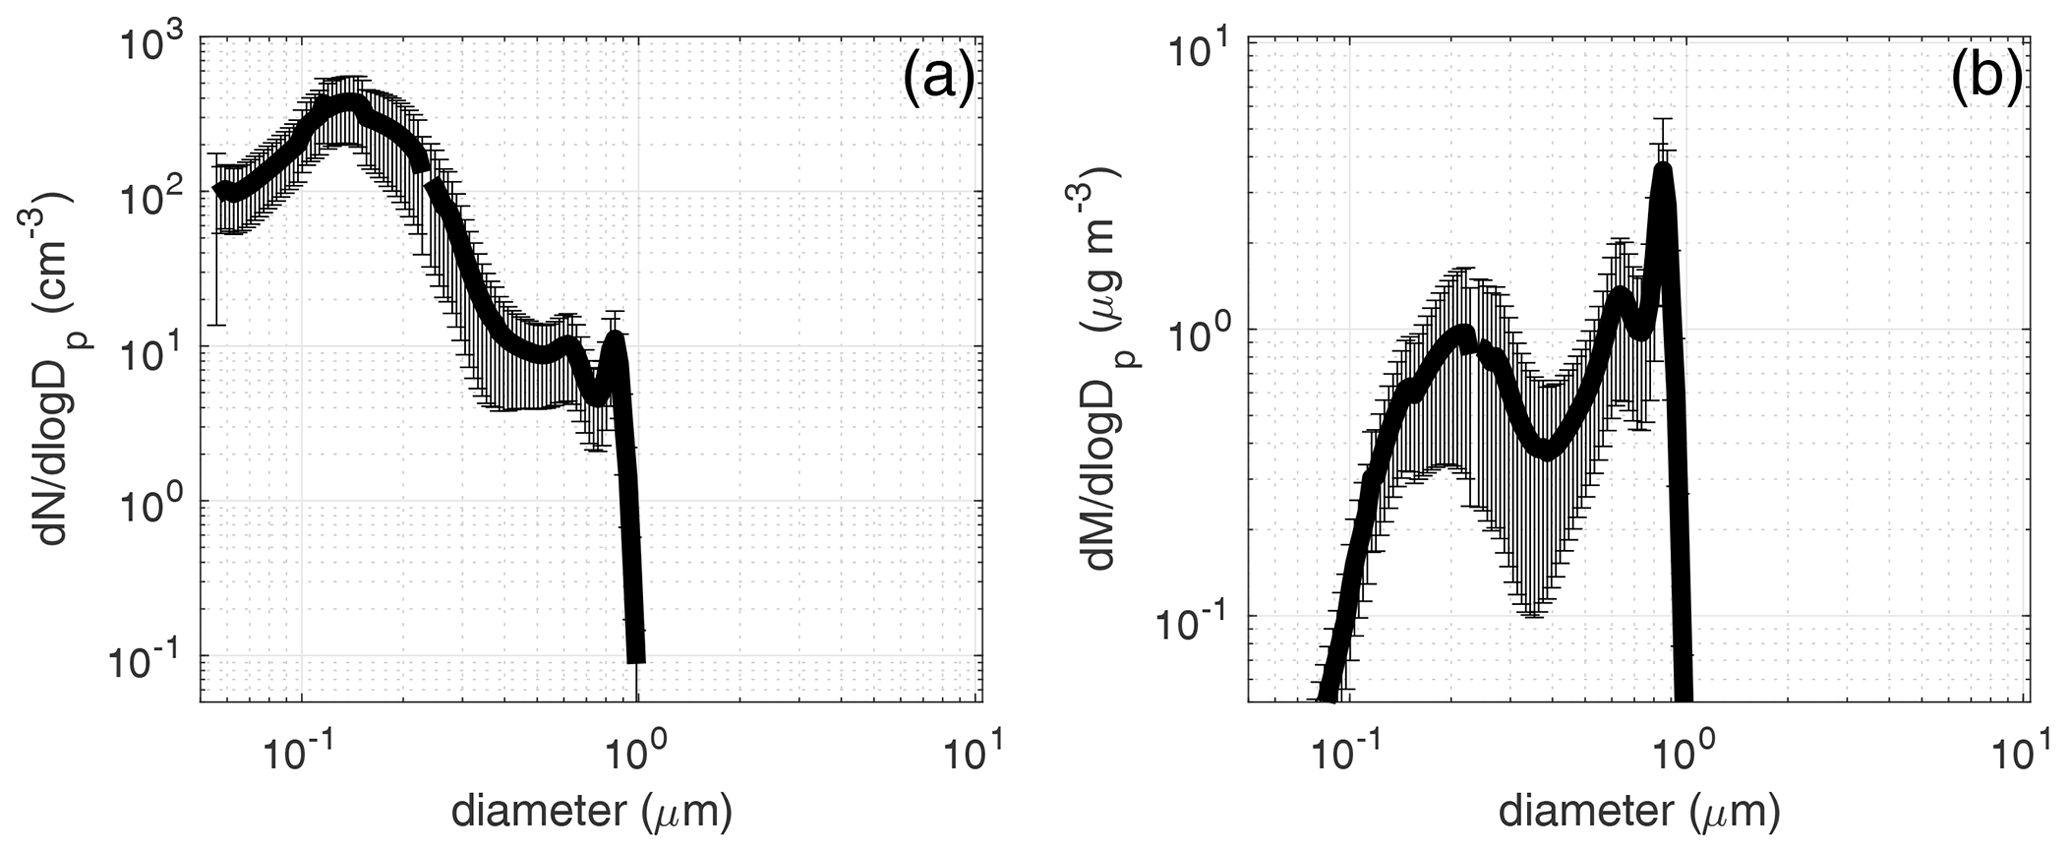
Figure 2Average (solid black line) and variability (1 standard deviation; error bars) of the UHSAS (a) number (cm−3) and (b) mass (µg m−3) size distributions during the clean marine background season of LASIC (November 2016–May 2017).
2.1.2 Supermicron scattering
One-minute-averaged scattering coefficients (bsca) were measured by a TSI 3563 three-wavelength integrating nephelometer at red (700 nm), green (550 nm), and blue (450 nm) light wavelengths over an angular integration range of 7 to 170∘ (Anderson et al., 1996) and using impactor size cuts of 1 and 10 µm that alternated at intervals of about 1 h. Two-hour averages of the scattering measurements for each impactor size cut were used to derive supermicron scattering coefficients at each wavelength ( by differencing the bsca at 1 µm from the bsca at 10 µm. Scattering coefficients were corrected to account for known truncation errors due to significant coarse sea-salt particle forward scattering at angles of less than 7∘ (Anderson and Ogren, 1998). The detection limit of the nephelometer for typical operating conditions is between 0.1 and 0.3 Mm−1, depending on the wavelength (Anderson et al., 1996).
Particle scattering measurements during LASIC were not available at standard dry conditions (<40 %), as operating conditions only allowed for limited heating that typically produced 60 ± 4% RH at the nephelometer inlet for ambient conditions of 88 ± 8 % RH. This average RH of 60 % means that particles were not dried to the efflorescence point for sea salt mixtures (<40 %) (Ming and Russell, 2001). The supermicron scattering (at 450 nm) did not show a significant correlation to the instrument RH (R = 0.22, p = 0.19; Fig. S1 in the Supplement), but the correlation increased to R=0.36 (p<0.05) for RH > 60 %, indicating that the scattering may need to be corrected for humidity at higher RH. Measurements of particle scattering at a series of preset RHs were also collected during LASIC to provide hygroscopic growth factors (f(RH)) to correct the scattering from 65 % RH to the heated conditions (Zieger et al., 2010; Gasso et al., 2000). However, because the uncertainty for f(65 % RH) was estimated to be >30 %, which was approximately fourfold greater than the 8 % for <1 µm and 7 % for <10 µm scattering uncertainties for the heated measurements, we did not apply this correction. This uncertainty was driven by the limited and nonoverlapping times for which f(65 % RH) was available for <1 and <10 µm scattering, each typically spanning only 30 ± 5% of the 2 h averaging period. Without sufficient and simultaneous f(RH) measurements of the humidity dependence of scattering, and given the additional uncertainties associated with correcting optical size distribution measurements with humidity- and composition-dependent refractive indices (Kassianov et al., 2015), correcting the measurements to a standard RH was also not possible. Instead, we restricted the measurements to include only those for which the average nephelometer humidity matched the average UHSAS RH. Restricting nephelometer measurements to those that had RHs below 60 % gives an average RH of 55 % with 10 % measurement uncertainty (55 ± 10 %) while still retaining 78 % of the measurements for this analysis.
Two-hour supermicron scattering during the LASIC background season had an average value of 12.0 ± 6.3 Mm−1 (0.3–41.1 Mm−1), as measured by the nephelometer at 550 nm, and made up 70 ± 7 % of the total scattering for particles less than 10 µm in diameter. The combined use of the submicron particle size distribution from UHSAS and the supermicron scattering coefficients from the nephelometer provides the basis for naming this method UHSAS-NEPH.
2.1.3 Uncertainty and variability of the size distributions and scattering measurements
Measurement variability and instrument error are incorporated into the sea spray mode retrieval to account for uncertainties in the Mie-theory-based inversion of scattering and size distribution measurements (Table 2; Sect. 3).
Table 2Scattering and size distribution measurements and the associated uncertainties and variabilities used in the sea spray mode retrieval method.
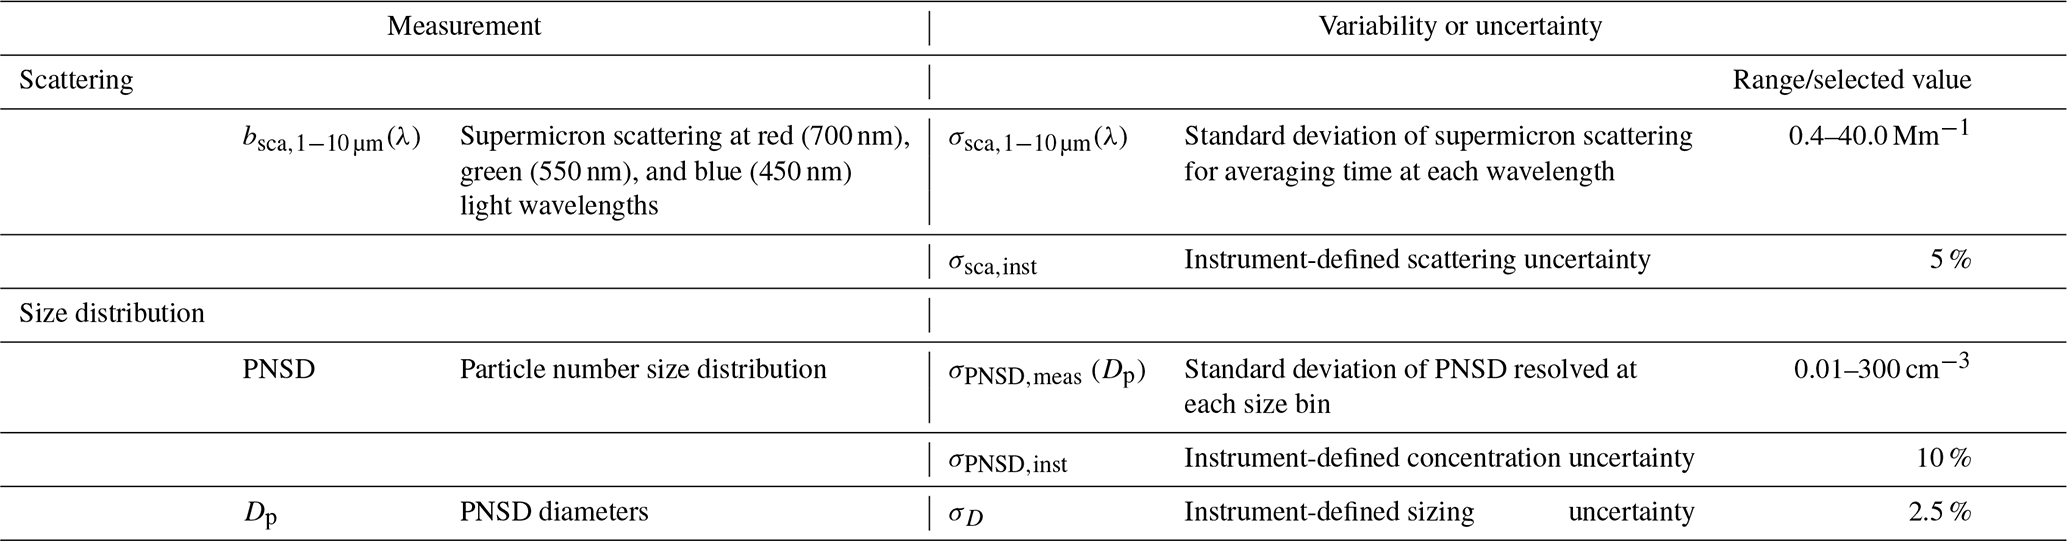
UHSAS sizing uncertainty is within 2.5 % of the particle size (Uin, 2016) with variations of −10 % to +4 % based on calibrated particles with known refractive indices between 1.44 and 1.58 (Moore et al., 2021). The reported systematic uncertainty of the number size concentration for accumulation mode (0.1–1 µm) particles measured by UHSAS has been shown to be 3.9 % due to calibration, flow, and pressure biases (Kupc et al., 2018). This instrument error propagates to −27.5 % to +12.4 % for higher moments of the size distribution, such as surface area and volume (Kupc et al., 2018; Brock et al., 2019). We therefore adopted a size uncertainty value (σD) of 2.5 % as defined by the UHSAS instrument manufacturer (Uin, 2016), and 10 % for the concentration uncertainty (σPNSD), which has been used in previous inversion procedures (Bluvshtein et al., 2017; Frie and Bahreini, 2021). The measured size distribution variability was calculated for the UHSAS size distribution at each diameter bin (σPNSD,meas (Dp)) as the standard deviation of the 2 h averages.
Systematic uncertainties of the particle scattering are mainly due to nonidealities at each measurement wavelength and the angular sensitivities of the nephelometer (Anderson and Ogren, 1998). These features promote the use of a scattering uncertainty (σsca,inst(λ)) value of 5 % that has been used in previous inversion procedures (Frie and Bahreini, 2021; Bluvshtein et al., 2017). The measured scattering variability was calculated for the supermicron scattering at each wavelength ( as the standard deviation during the 2 h average. A list of the measured size distribution and scattering variables and their associated uncertainties and variabilities is provided in Table 2. Particle losses due to aspiration and transmission in the ARM Mobile Aerosol Observing System were assessed using the particle loss calculator (PLC; von der Weiden et al., 2009), sample line configurations and geometry from Bullard et al. (2017), and a particle density of 1 g cm−3. Losses were found to be less than 10 % for particles smaller than 1 µm in diameter, and greater than 50 % for particles larger than approximately 6 µm. We did not correct UHSAS size distributions for these losses given the uncertainty of that correction, but note that nephelometer supermicron scattering measurements may underestimate retrieved sea spray number and mass concentrations at the largest diameters. Using the mean sea spray mode statistics of UHSAS-NEPH, the particle losses in the instruments can equate to underestimations of roughly 13 ± 8 % in the sea spray mass and 0.8 ± 4 % in number using nephelometer scattering.
2.1.4 Ancillary variables
As an alternative to size-resolved filter measurements of sodium, which were not collected during LASIC, measurements from an aerosol chemical speciation monitor (ACSM; Aerodyne Research, Billerica, MA, USA) were used to evaluate sea salt mass retrievals. The ACSM provided the mass and chemical composition (organics, sulfate, nitrate, ammonium, and chloride) of nonrefractory submicron aerosols. Since sea salt does not volatilize efficiently at 600 ∘C, the ACSM measurement of nonrefractory chloride provides a trace signal from NaCl that is detectable in the absence of large sources of nonrefractory chloride (Frossard et al., 2014; Ovadnevaite et al., 2012) and has been used as a tracer to identify sea salt aerosol contributions to CCN (Humphries et al., 2021). We only used chloride measurements for January 2017 through May 2017, as these data were quality assured. The 2 h averaged ACSM chloride concentration showed statistically significant (p<0.05) positive correlations with two common sea spray tracers: wind speed (R=0.2) and nephelometer supermicron scattering at 550 nm (R=0.33) (Fig. S2). This observation supports the potential of LASIC ACSM chloride measurements to serve as a chemical tracer for sea spray mass in the evaluation of UHSAS-NEPH.
We additionally incorporated measurements of the 1 min averaged condensation nuclei concentration above 3 nm (CN3) from a TSI ultrafine condensation particle counter (CPC) 3776, wind speed and rain intensity from a Vaisala WXT-520, refractory black carbon (rBC) concentration from a DMT single particle soot photometer, 470 nm particle absorption from a Radiance Research particle soot absorption photometer (PSAP), and carbon monoxide (CO) mixing ratio from a Los Gatos Research trace gas analyzer (Miller et al., 2016). These measurements were used to identify clean marine periods (Sect. 2.2), assess the environmental influence on retrieval performance, and evaluate the retrieved sea spray masses. Ancillary measurements were averaged to 2 h resolution to match the timing of the supermicron scattering coefficients and size distribution averages.
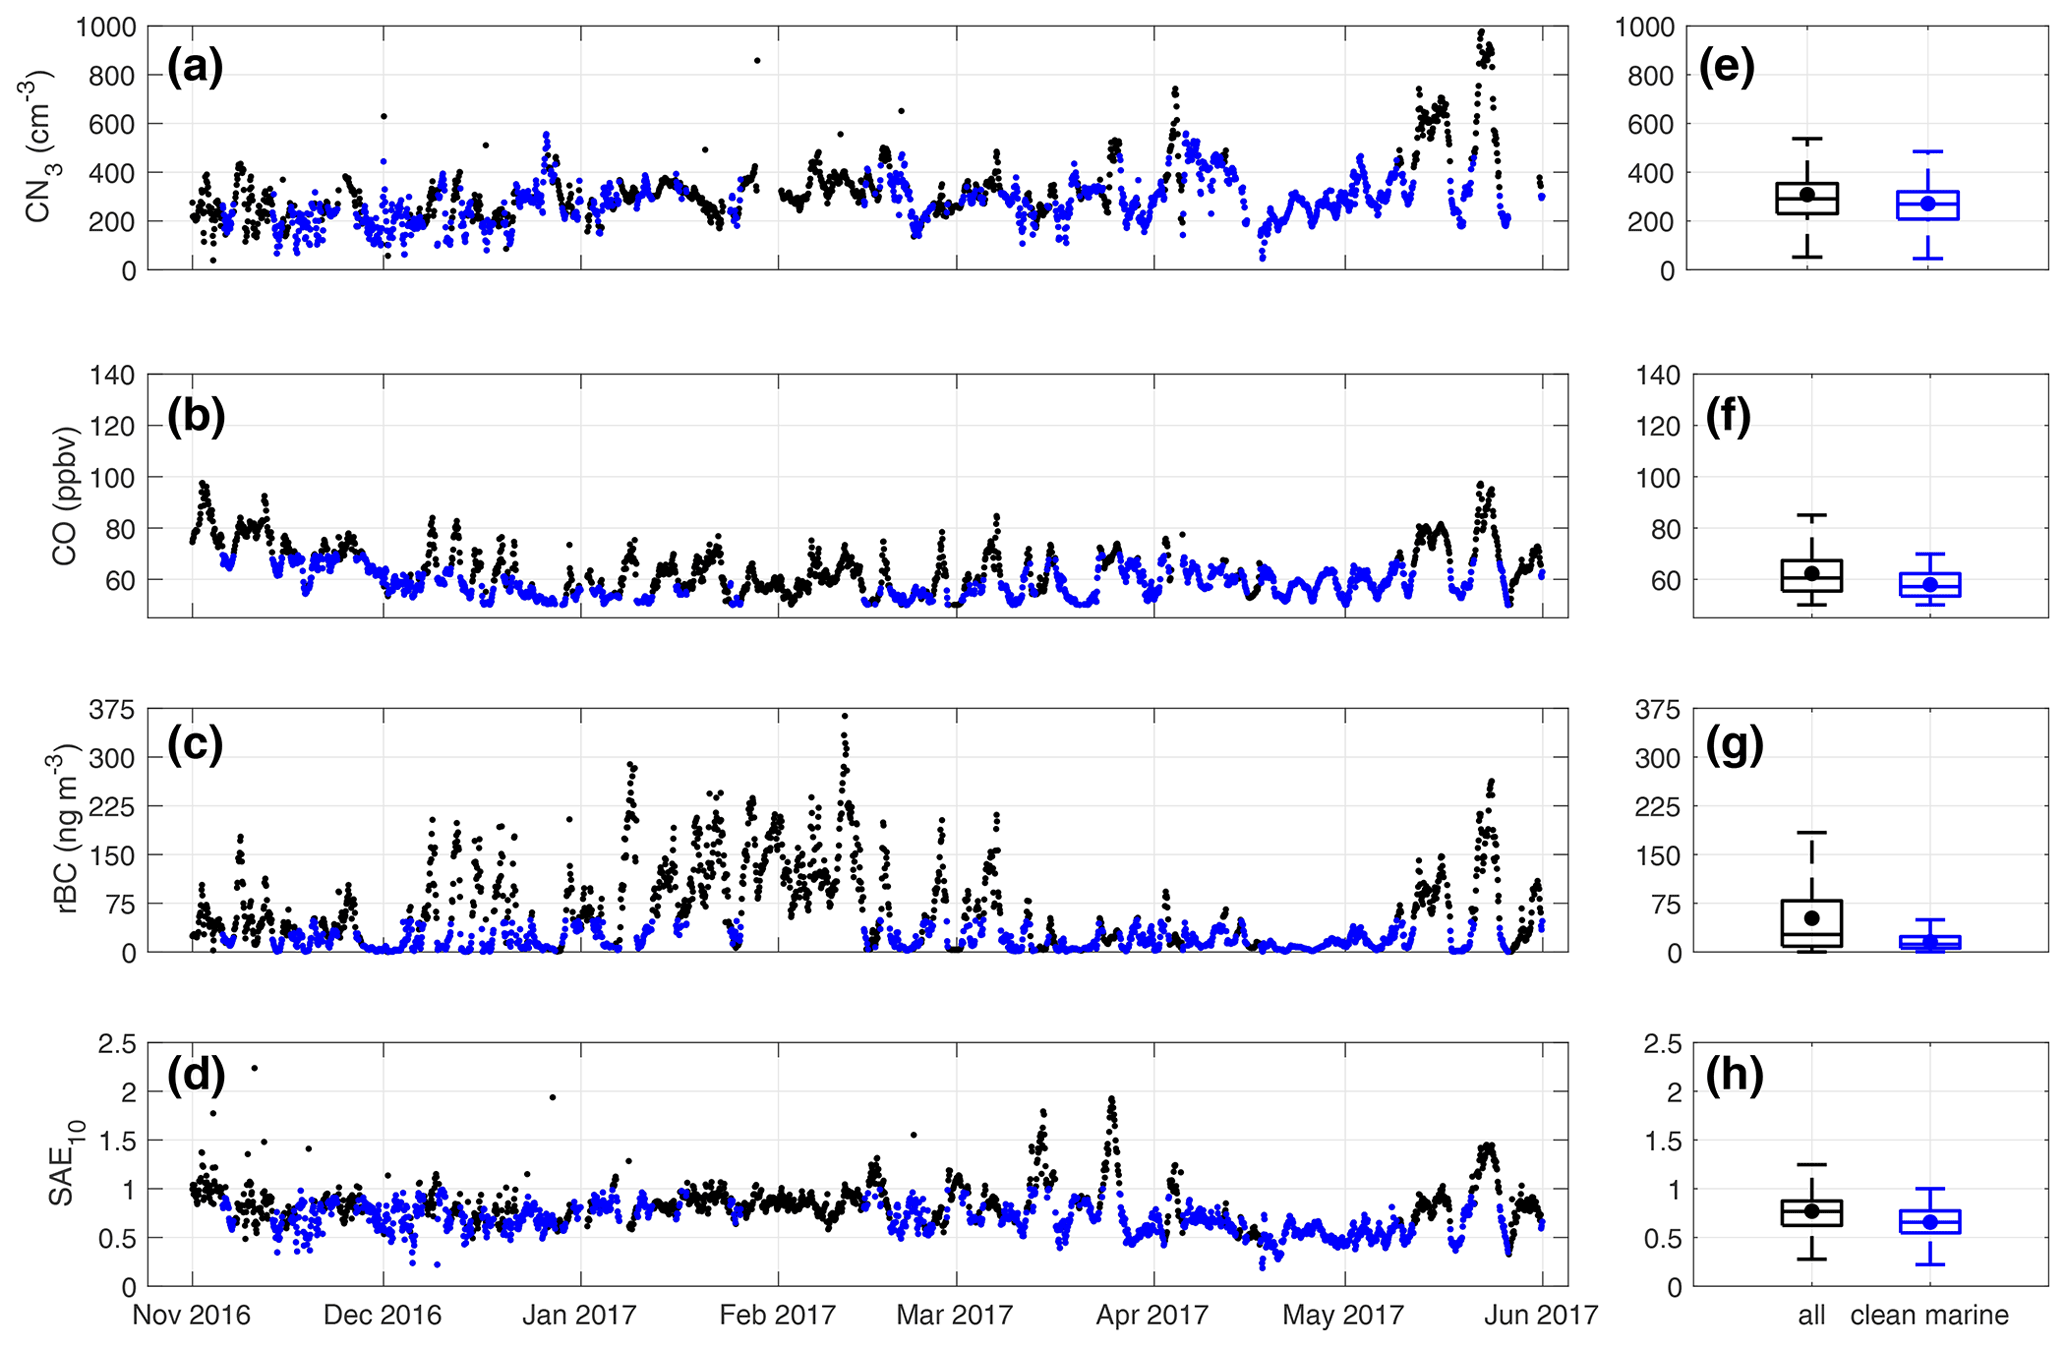
Figure 3Time series (a–d) and box-and-whisker plots (e–h) of 2 h average variables used to determine clean marine periods during the LASIC background season (November 2016–May 2017). (a–d) Periods that meet the criteria thresholds described in Sect. 2.2 are symbolized by blue dots. (e–h) Circles within the box-and-whisker plots are the means and horizontal lines are the medians and interquartile ranges (25 % and 75 %) for the background season (black) and clean marine periods (blue).
2.2 Measurement screening
Nonmarine aerosol particles, specifically those from combustion sources, have been shown to influence the performance of sea spray mode retrievals by contributing number and mass concentrations that overlap with the region used to fit a mode in ambient size distributions (Modini et al., 2015; Saliba et al., 2019). Here we focused on periods when boundary-layer air masses are assumed to have a multiday marine history in order to reduce nonmarine sources and ensure that retrieval results are consistent with sea spray. In the case of LASIC observations, boundary-layer intrusions of biomass-burning aerosol can affect particle optical properties by increasing absorption and reducing scattering for sub- and supermicron particles (Delene and Ogren, 2002; Denjean et al., 2020). In particular, UHSAS instruments show undersizing of particles when highly absorbing biomass-burning aerosol is introduced into the particle population, due to heating from the instrument beam and subsequent particle vaporization and shrinkage (Howell et al., 2021). Although this effect is more likely to impact particles smaller than the assumed sea spray size (Dp<0.4 µm), any impact on potential submicron sea spray aerosol contributions would have an influence on the sea spray mode retrievals. To limit nonmarine influences on UHSAS-NEPH retrieval, we first isolated measurements during “clean marine” periods of the LASIC background season from November 2016 through May 2017 by applying the following criteria (Fig. 3):
-
CN3 concentration less than 600 cm−3, which was the approximate 90th percentile particle concentration during the LASIC campaign;
-
CO mixing ratio (a proxy for continentally sourced air) below the limit of the ambient marine boundary layer background levels observed during LASIC (70 ppbv; Pennypacker et al., 2020);
-
rBC concentration below the combustion source threshold of 50 ng m−3 used by Saliba et al. (2020) in the remote marine North Atlantic; and
-
<10 µm scattering Angstrom exponent (SAE10) values less than 1 for 450 and 700 nm nephelometer scattering (SAE10 characterizes the wavelength dependence of particles and takes on small (<1) values during periods in which coarse aerosol, such as sea salt, has a large mass contribution; Shen et al., 2019; Mulcahy et al., 2009).
Saharan dust and continental aerosol transport from southern Central Africa into the remote tropical Atlantic boundary layer has been a commonly observed contributor to the surface-level aerosol population at Ascension Island (Swap et al., 1996). The mass concentration of transported dust particles is largely in the supermicron size range (Miller et al., 2021; Denjean et al., 2016) and overlaps the fitting region used in UHSAS-NEPH. To exclude interference in the retrieval from dust particles, we used measurements of the sub-10 µm single-scattering albedo at 470 nm (SSA470 nm) from NEPH scattering and PSAP absorption to identify times with a possible dust influence (Sect. S1 in the Supplement). An SSA470 nm threshold of 0.95 was used to distinguish between sea salt and dust aerosol contributions to coarse scattering based on the relationship of SAE10 and the average SSA reported for Saharan dust (Di Biagio et al., 2019; Von Hoyningen-Huene et al., 2009; Haywood et al., 2003). This restriction removed 68 2 h periods.
We additionally removed periods when the rain intensity exceeded 1 mm h−1 at any hour during the 2 h average to ensure a minimal influence of precipitation on the retrieval, namely wet scavenging of sea spray aerosol by rain droplets. 14 periods exceeded this rain intensity restriction. The combination of all criteria identified 909 2 h (nonraining) clean marine periods, which accounted for approximately 40 % of all available background season observations. The clean marine criteria reduced the average criteria values by 12 % for CN3, 7 % for CO, 70 % for rBC, and 15 % for SAE10 after applying these restrictions. The 909 available periods provided persistent marine conditions that included a low aerosol concentration (300 ± 90 cm−3) and a low combustion influence (15.7 ± 12.7 ng m−3) as well as a large scattering contribution from coarse particles (SAE10=0.66 ± 0.15).
This section outlines the procedure used to retrieve sea spray modes from scattering measurements and submicron mass size distributions (Fig. 4). We describe the relationship of particle scattering to particle size (Sect. 3.1) and how this theoretical relationship is used to identify a group of probable sea spray mode solutions that are consistent with the measured supermicron scattering, as well as with literature-reported ranges of modal properties (Sect. 3.2). Mode solutions are then constrained with measured submicron mass size distributions (Dp>0.4 µm) to isolate and retrieve the most consistent sea spray modal properties (Sects. 3.3–3.4).
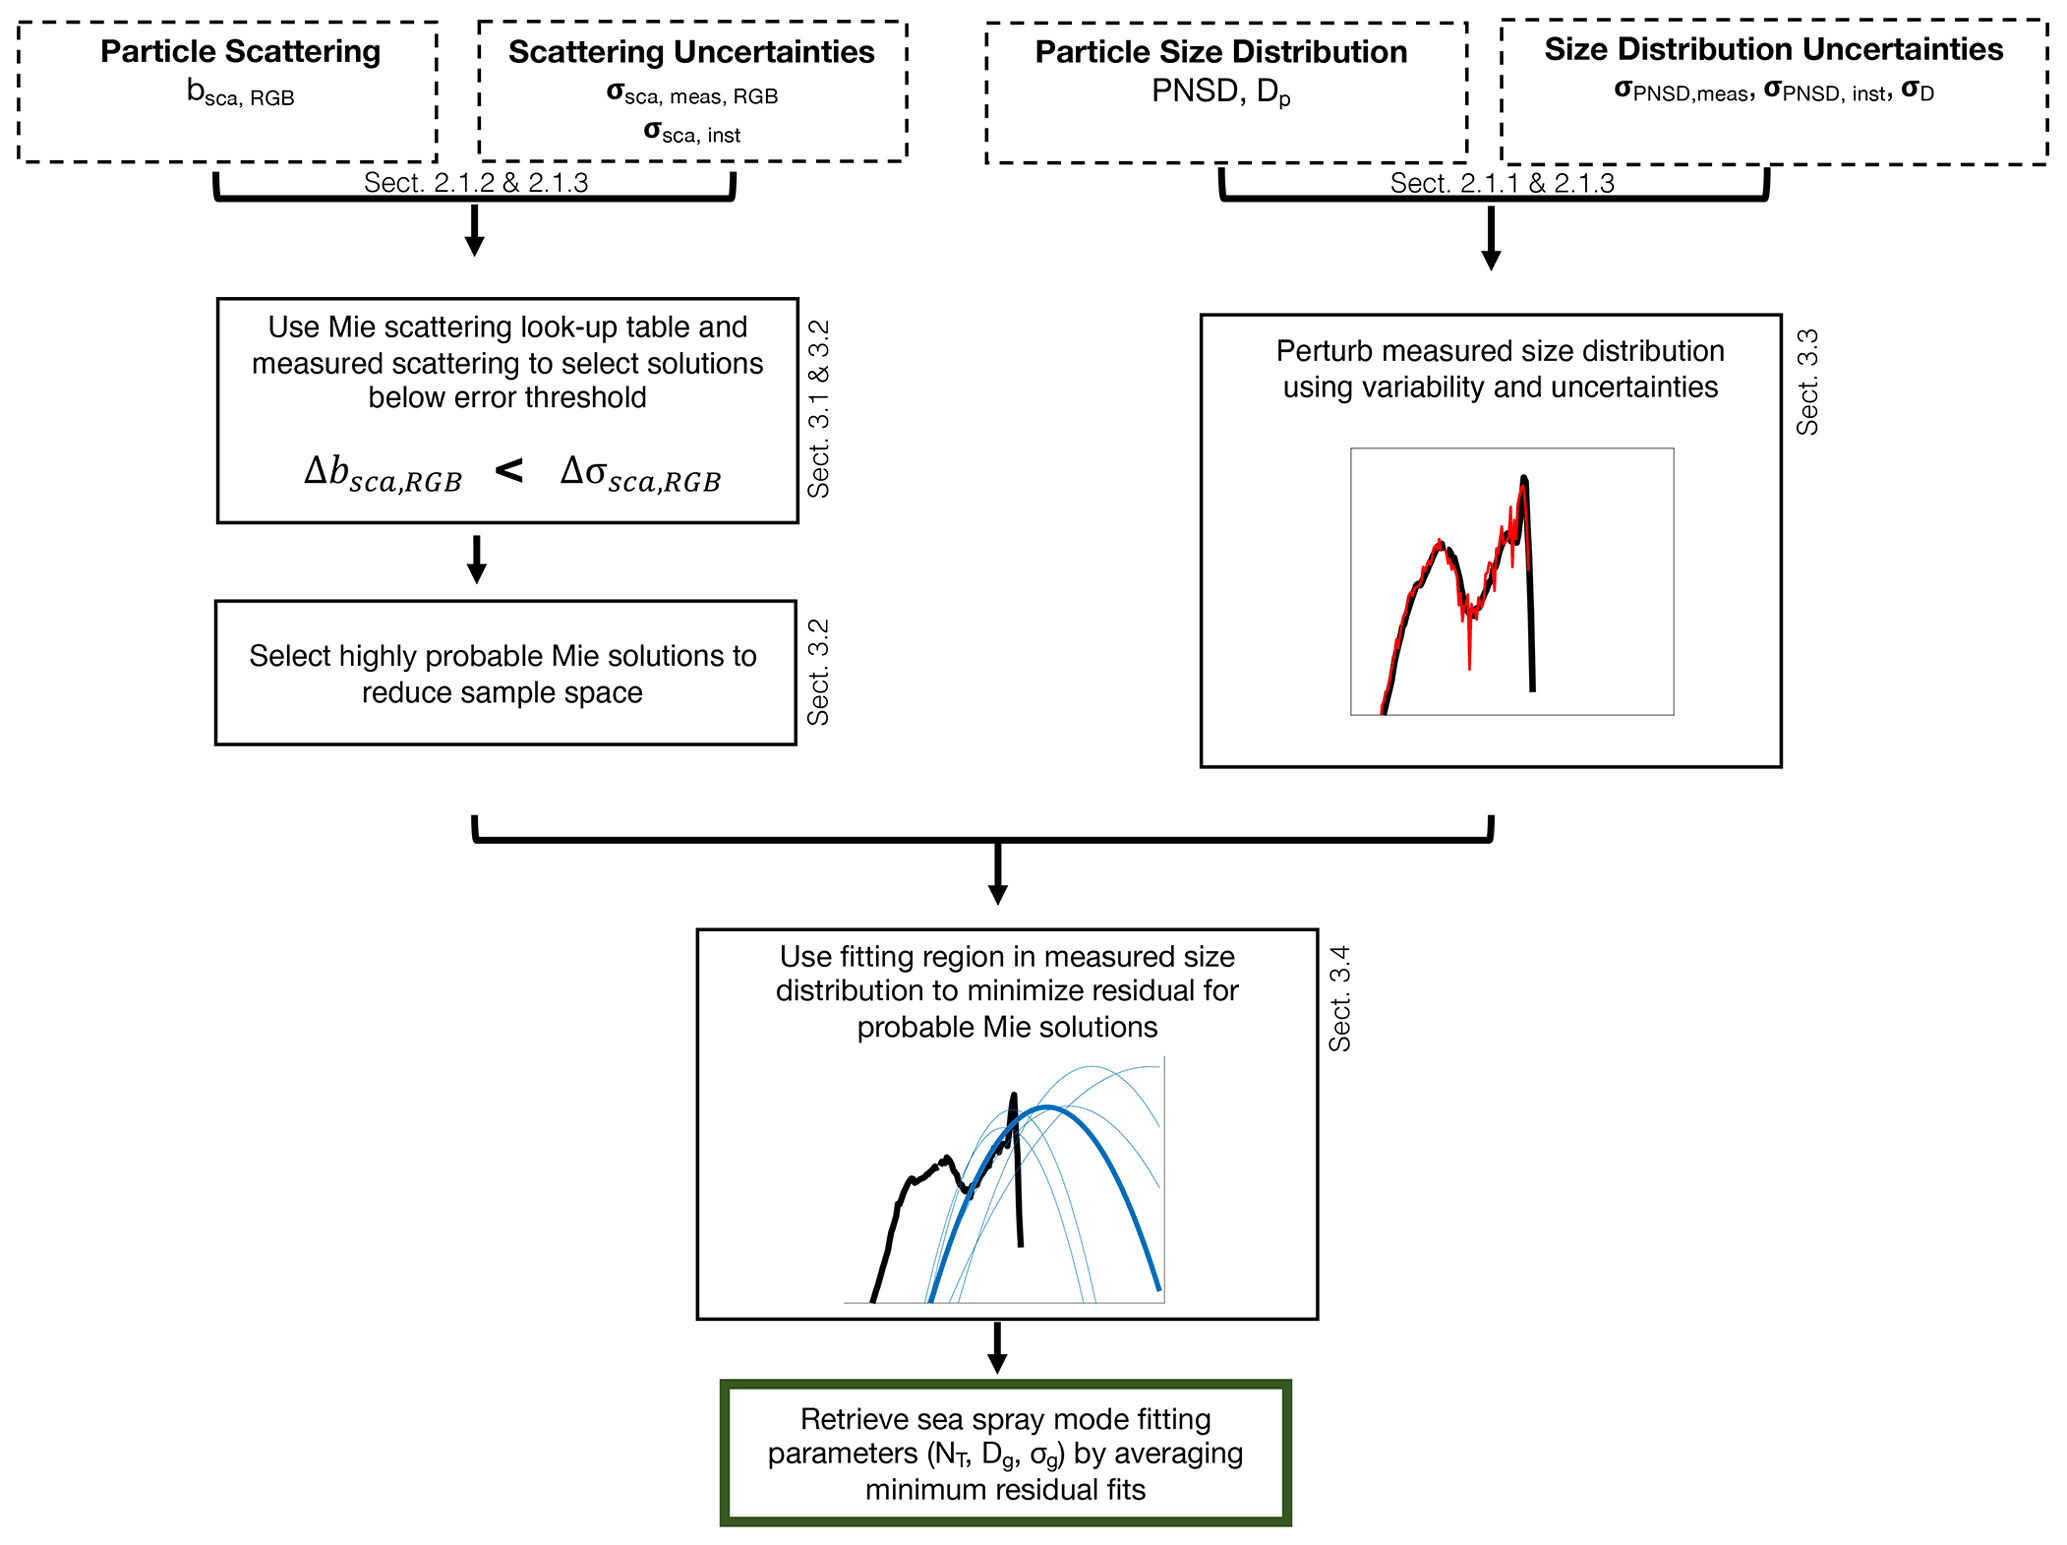
Figure 4Flow chart describing the UHSAS-NEPH retrieval algorithm. The procedure associated with each step is described in the section cited either to the right of or below the relevant box.
3.1 Simulating sea spray mode scattering using Mie theory
A lookup table of scattering coefficients was developed by employing a modified Mie theory code based on the algorithm for red (700 nm), green (550 nm), and blue (450 nm) wavelengths (Bohren and Huffman, 1998; Mätzler, 2002). These wavelengths were chosen to match those used by the three-wavelength integrating nephelometer operated during LASIC (Sect. 2.1.2). Each of the three red, green, and blue (RGB) scattering coefficients is attributed to a combination of lognormal mode fitting parameters (Nt, Dg, and σg) that describe the shape of the sea spray mode. We use the canonical lognormal mode form to represent the number size distribution of the sea spray aerosol with the following equation (Seinfeld and Pandis, 2006):
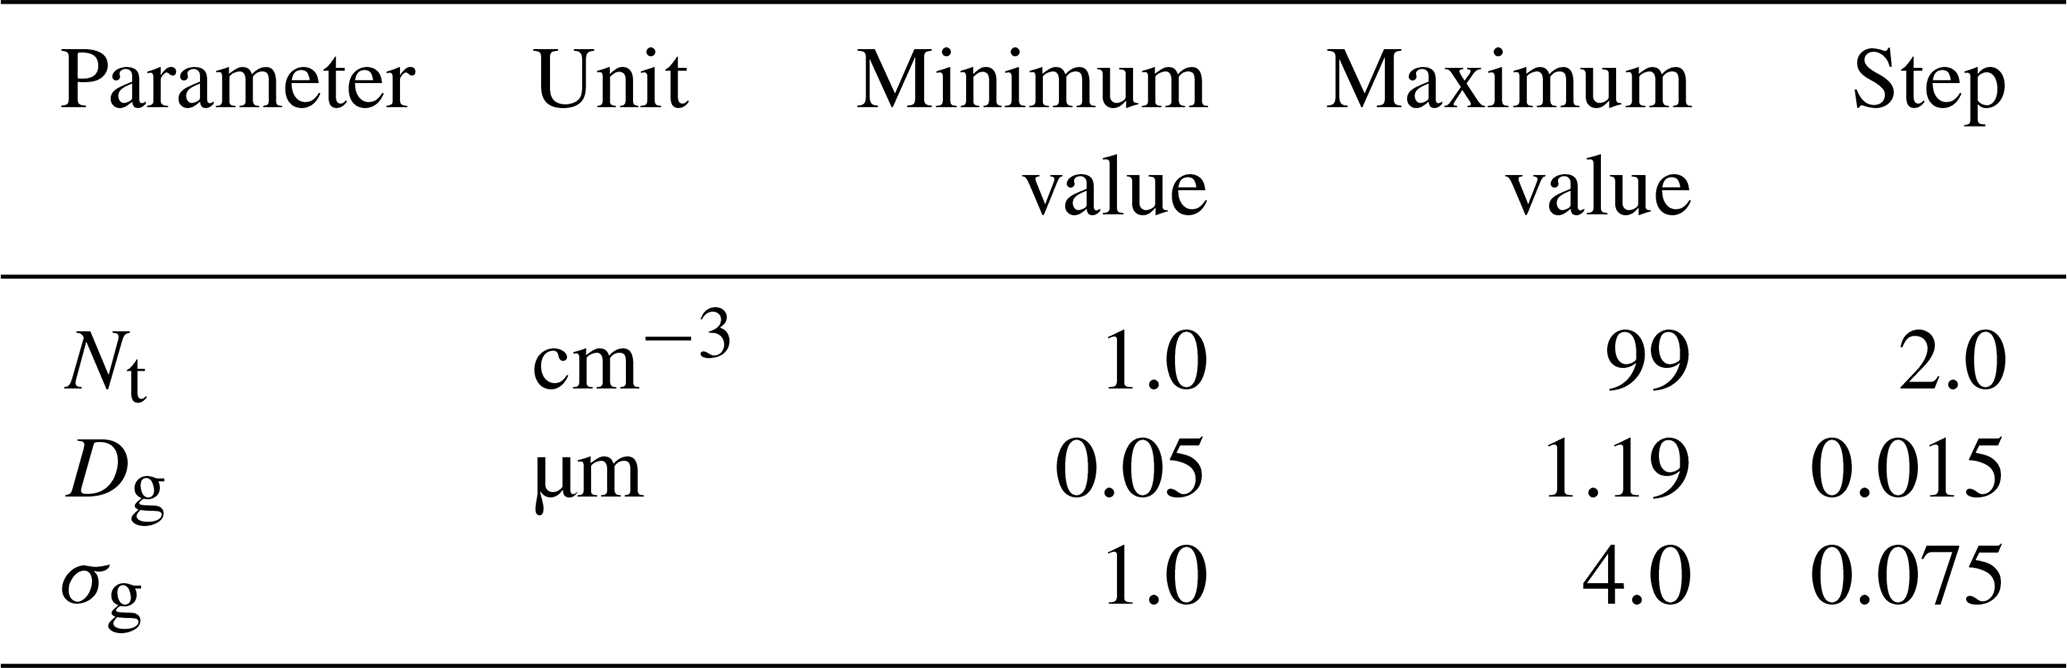
where Nt is the number concentration of particles (cm−3), Dp is the particle diameter (µm), Dg is the geometric mean diameter (µm), and σg is the geometric standard deviation (or mode width; unitless). These values are 1–99 cm−3 for number concentration, 0.05–1.19 µm for mean diameter, and 1–4 for mode width, which provides over 157 000 possible sea spray mode solutions (Table 3). The range of fitting parameters was chosen to reflect those reported in laboratory experiments and field measurements (Table 6; Prather et al., 2013; Modini et al., 2010, 2015; Quinn et al., 2017; Saliba et al., 2019). Similar lookup tables have previously been used for optical measurement inversions (e.g., Lv et al., 2018; Veselovskii et al., 2002).
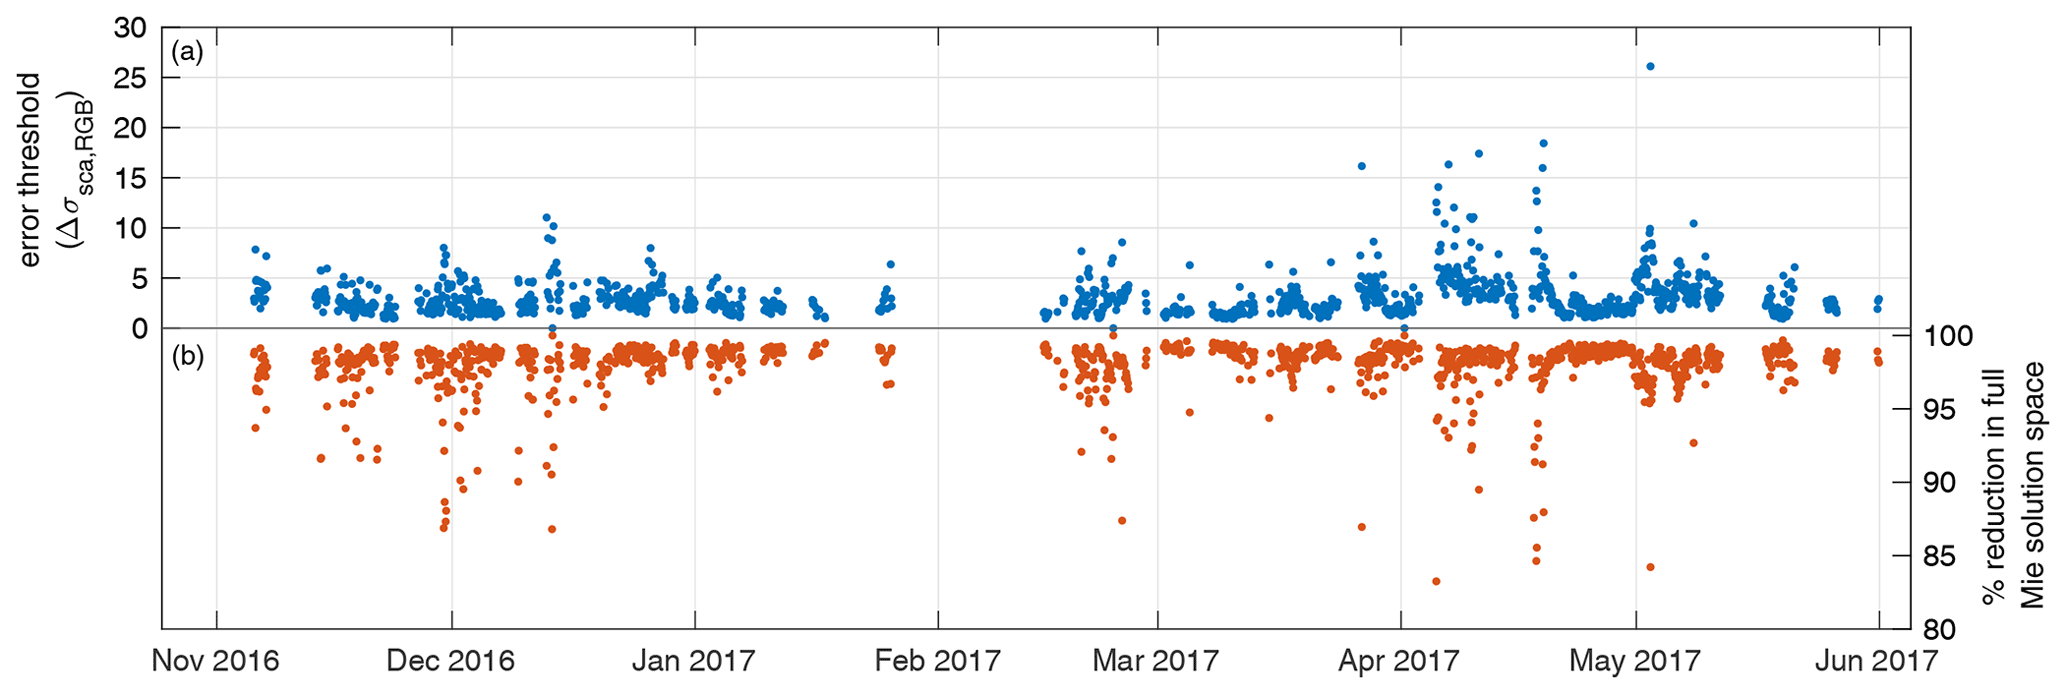
Figure 5(a, blue) Time series of the scattering error threshold (Δσsca, RGB, Mm−1) and (b, orange) percent reduction of the Mie lookup table solution space (N=157 850) for UHSAS-NEPH retrievals during the background season of LASIC.
The scattering coefficients (bsca,MIE(λ)) are then related to the size distribution by integrating Eq. (2) over all particle diameters (0.01–10 µm),
Qsca is the scattering efficiency, λ is the light wavelength, and m is the particle core refractive index (. To match the NEPH and UHSAS RH of 55 % during LASIC (Sect. 2.1.2), a constant m value of 1.45+i0 was selected to simulate sea spray particle scattering. This value is lower than the average refractive index reported for dry sea salt (real component = 1.5–1.6, imaginary component (Wang and Rood, 2008; Randles et al., 2004; Bi et al., 2018) and was calculated as a mass-weighted mixture of salt with water, where water has a refractive index of 1.33 (Wang and Rood, 2008) (Sect. S2). We found no substantial variation in the retrieved fit parameters for the range of 1.4 + 0i to 1.6 + 0i, but correlations to sea spray tracers (chloride and wind speed) were lower for 1.40 + i0 (high RH) and 1.6 + i0 (low RH) (Sect. S2). The midrange value of was used to approximate the scattering of sea salt for the measured RH of 55 %.
Table 3Lognormal mode fitting parameters and resolution (step) used to derive Mie scattering sea spray mode solutions.
3.2 Selecting the most probable Mie solutions
Since many solutions result from the constraints imposed by performing measurements at three wavelengths, we use the error between the nephelometer scattering and the Mie theory solutions to remove mode solutions that are not within the calculated error. The probability of solutions that meet the error threshold are then evaluated, and only the top 5 % most probable solutions are selected.
The measured supermicron scattering coefficient ( is compared to scattering coefficients computed for each simulated sea spray size distribution and Mie theory value of bsca,MIE(λ) in the lookup table by calculating the absolute error at each wavelength (λ) using Eq. (3):
The scattering error (Δbsca, RGB) is then computed by propagating the absolute error at each wavelength via Eq. (4):
The total sample space is then reduced by selecting solutions from the lookup table that fall below the error threshold (Δσsca, RGB) calculated for that measurement time,
where
This error threshold incorporates the measured scattering variability at each wavelength for the averaging period ( and accounts for the instrument error (σsca,inst, which is constant; Table 2). Figure 5 illustrates a time series of these error thresholds and the percent reduction of the Mie solution sample space (N=157 850) for each retrieval during the background season of LASIC. Using these error thresholds, the solution space is reduced by 98 % on average, with a reduction range of 83 %–99 %, resulting in approximately 1000–2000 possible solutions each time.
The majority of the solutions that are below the error threshold typically have a sea spray mode shape similar to those previously reported in the literature (Quinn et al., 2017; Saliba et al., 2019; Bates et al., 2012), namely mass mean diameters within or near the coarse-mode size range (1–10 µm) and mode widths of 2–3, decreasing to a number concentration of below 0.1 cm−3 before the 10 µm cutoff. However, some of the solutions that meet the error threshold criterion are either too wide or large relative to the reported range of sea spray modes (Table 6, Fig. S4), which is a limitation of having only three scattering wavelengths to constrain the mode. To remove the outlier solutions and to reduce the sample space to a more consistent group of solutions, we apply a restriction on the Mie solutions to consider only the most probable fitting parameters (NT, Dg, σg) based on their frequency of occurrence. To demonstrate this restriction, we consider the normalized probabilities of the fitting parameters from Mie solutions that fall below the scattering error threshold, Δσsca, RGB, for one retrieval during LASIC (Fig. 6a–c). This retrieval is selected as its Δσsca, RGB is within the average value for all LASIC observations during the clean marine background season (3.1 ± 2.1 Mm−1) and is representative of most cases assessed.
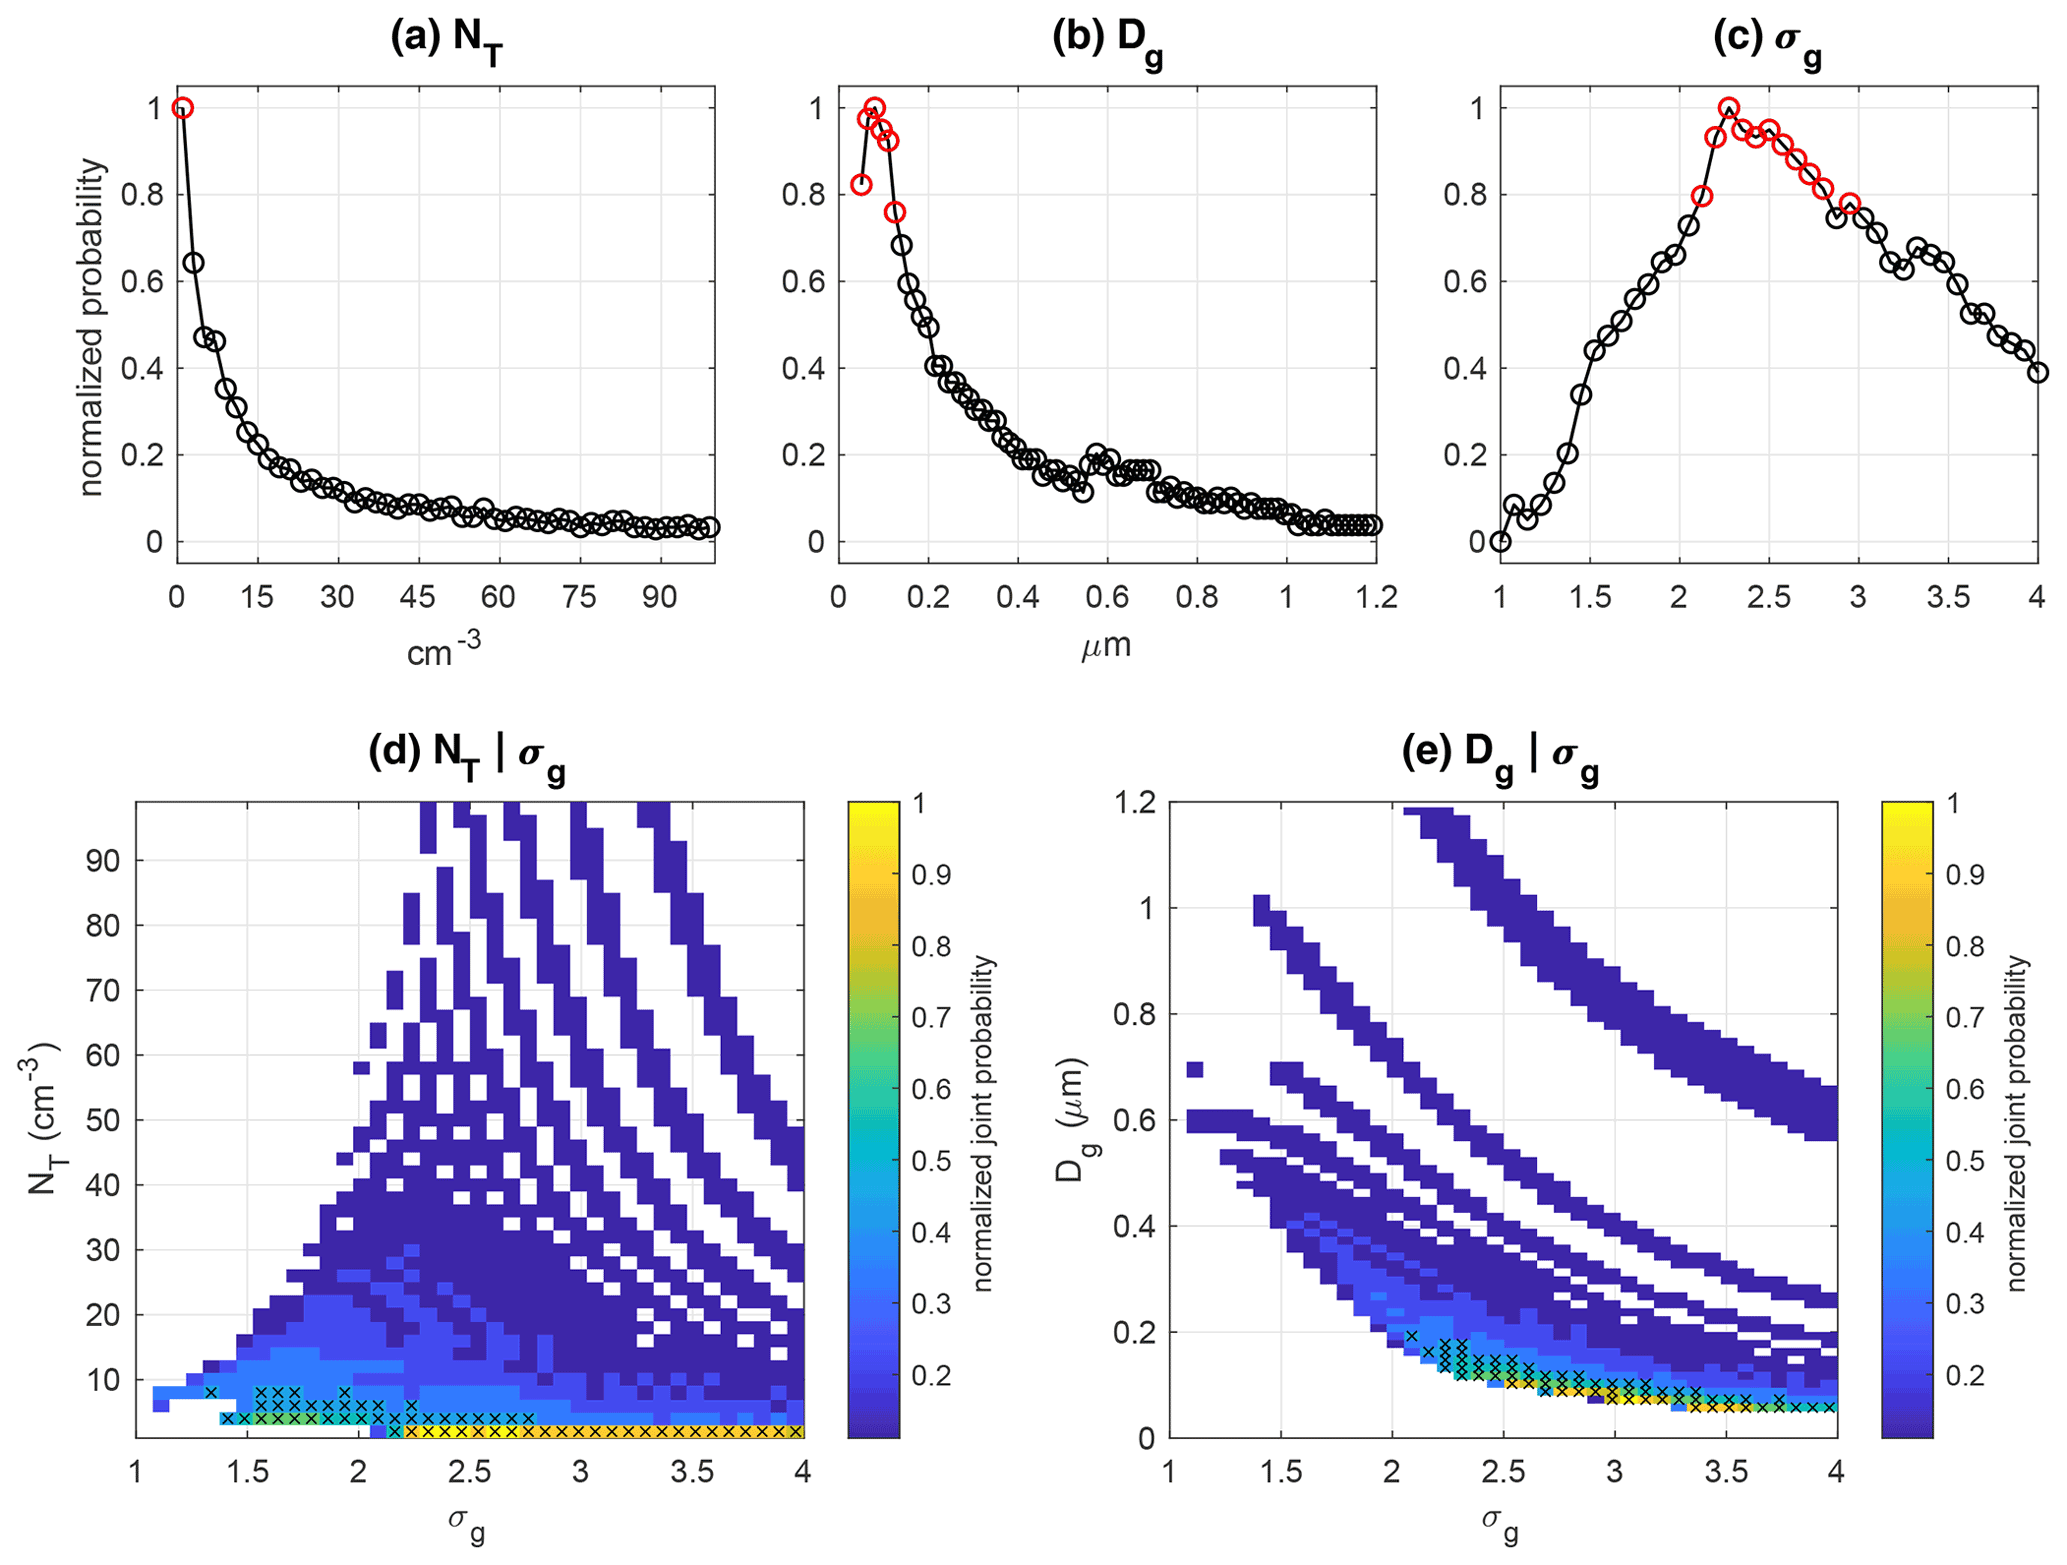
Figure 6(a–c) Normalized probability distributions of sea spray mode fitting parameters obtained for one retrieval (3 December 2016 at 22:00 UTC). (a–c) Fitting parameter values with an occurrence probability of greater than 75 % are symbolized by red circles. (d–e) Normalized joint probabilities (color bar) for fitting parameter combinations of NT|σg and Dg|σg from the same retrieval. Mie solutions that are within the top 5th joint probability percentile for each combination are symbolized by black crosses.
Mie solutions that meet the error threshold constrain the mode number concentration (NT) and mean diameter (Dg) of the sea spray mode, as shown by noting that the likely (probability >75 %) NT and Dg fall within narrow ranges of the low-error solutions (4 % and 10 % of the sample space, respectively), whereas there is a less constrained range for σg (45 % of the sample space) (Fig. 6a–c). Since σg has a wider range of probable values, this parameter is effectively constrained by considering the joint probabilities of NT|σg and Dg|σg. These probabilities are computed as
The highest joint probability values restrict solutions to localized regions of the solution space (Fig. 6d–e). Selecting only the upper 5th normalized probability percentile of joint probabilities further restricts the full Mie solution sample space by an additional 16 % and 13 % for NT|σg and Dg|σg, respectively (Fig. 6d, e).
To assess which of these joint probability restrictions provided the most realistic sea spray mode results, retrieved mass concentrations and fitting parameters during the clean marine background season of LASIC were compared (Fig. S5). Restricting low-error solutions using the Dg|σg joint probability led to retrieved sea spray mass concentrations that were 20 %–30 % higher than the NT|σg combination, had mass mean diameters smaller than NT|σg (0.68 ± 0.08 µm vs. 1.47 ± 0.17 µm), and had much broader mode widths (3.8 ± 0.2 vs. 2.4 ± 0.3). Although the mass mean diameters retrieved using the Dg|σg joint probability were within the range of reported values from the literature (Table 6; Quinn et al., 2017; Saliba et al., 2019; Bates et al., 2012), the exceptionally broad widths outside of the reported range suggest that restricting using Dg|σg does not effectively constrain the mode width as well as the NT|σg combination. For these reasons, only sea spray modes with fitting parameters in the top 5th percentile of the NT|σg joint probability are used for this method, which typically results in reduction of the full sample space to 300–500 Mie solutions for each measurement time.
3.3 Perturbing the size distribution
Uncertainty and variability have been shown to impact the assumed size distributions and optical properties of aerosols when using inversion techniques (Viskari et al., 2012; Frie and Bahreini, 2021). Here, instrument uncertainty and measurement variability are incorporated into the fitting method by introducing random noise into the size distribution based on the size (σD) and number concentration (σPNSD,meas (Dp), σPNSD,inst) uncertainties (Sect. 2.1.3; Table 2). Perturbations are simultaneously made to the measured number size distribution and particle diameters. Each bin of the size distribution is perturbed by introducing Gaussian noise that samples a random number from a normal distribution. The sampled normal distribution is defined by a mean (μ) and a standard deviation (σ), where μ is the measured PNSD averaged over the time interval (σPNSD,meas (Dp)) and σ is the combination of the errors from temporal variability and instrument concentration uncertainty (which is constant):
The diameters in the size distributions are perturbed by shifting the size bins by the same value with a μ of 0 and σ as the instrument size uncertainty (σD). Size distributions are perturbed 100 times to provide a sample space of Nperturb+1 (the measured size distribution and 100 perturbations). Each probable Mie solution retrieved in Sect. 3.2 is then tested for the Nperturb+1 cases within the fitting region of the measured submicron size distribution described in Sect. 3.4.
3.4 Fitting modes to the measured size distribution
The last step in retrieving sea spray modal properties is to select Mie solutions that most closely match the shape of the measured size distribution in a specified fitting region. Given the correlation of supermicron scattering and sea spray mass concentration during clean marine conditions (Chamaillard et al., 2006; Kleefeld et al., 2002; Quinn et al., 1998), all PNSDs are converted to particle mass size distributions (PMSDs) using
with the assumptions of spherical particle homogeneity and constant sea spray density ρ. UHSAS and NEPH measurements were collected at 55 % RH, so 1.3 g cm−3 is used as the estimated sea spray particle density by calculating a mass-weighted mixture of salt with water (Sect. S3).
To account for the consistent UHSAS artifacts at 0.6 and 0.85 µm (Sect. 2.1.1), we restrict the measured size distributions used to fit the Mie-theory-simulated size distributions for diameters larger than 0.4 µm (0.4 to 1 µm UHSAS range) to 0.38–0.83 µm (the closest UHSAS diameter size bins within the specified range), which weights the comparison toward smaller sizes and effectively reduces the influence of the largest artifact while maintaining the shape of the accumulation mode “shoulder” (Fig. 1). For each Mie solution (PMSDMIE), a residual sum of squares is computed between the measured and perturbed PMSDs as
where the index j represents each measured or perturbed size distribution and k is the index of the low-error Mie solution. The fit RSS provides a quantifiable metric for comparing the scattering-retrieved mode to the expected sea spray fitting region. Chi-square “goodness of fit” calculations were also performed and provided similar retrieved sea spray modal properties to those retrieved using the fit RSS minimization. The high-probability Mie solution with the minimum fit RSS for the measured and noise-perturbed size distributions is chosen to establish a range of mode fits. This Monte Carlo approach allows for the selection of Mie solutions that capture the shape of the accumulation mode “shoulder” given the uncertainties associated with measurement variability and instrument error, and it provides a statistically robust sample space for retrieving a unique sea spray mode solution. From the range of fit-RSS-minimized sea spray modes, 95 % confidence intervals of each fitting parameter are calculated to further constrain the most probable solution that fits the measured size distribution in the expected sea spray size range. On average, 30–40 solutions remain from this perturbation analysis for each measurement time, with variabilities of 4 % in number concentration, 3 % in geometric mean diameter, and 1 % in geometric standard deviation, based on the sample means and upper and lower limits of the 95 % confidence intervals. The low variabilities of these fitting parameters demonstrate consistent mode retrievals within the perturbations and stability of the retrieval procedure. Lastly, the fitting parameter solutions that are both highly probable (Sect. 3.2) and within the 95 % confidence interval of fit-RSS-minimized modes are averaged to produce a single lognormal sea spray mode with the uncertainty of the solution defined as the upper and lower bounds of the 95 % confidence interval.
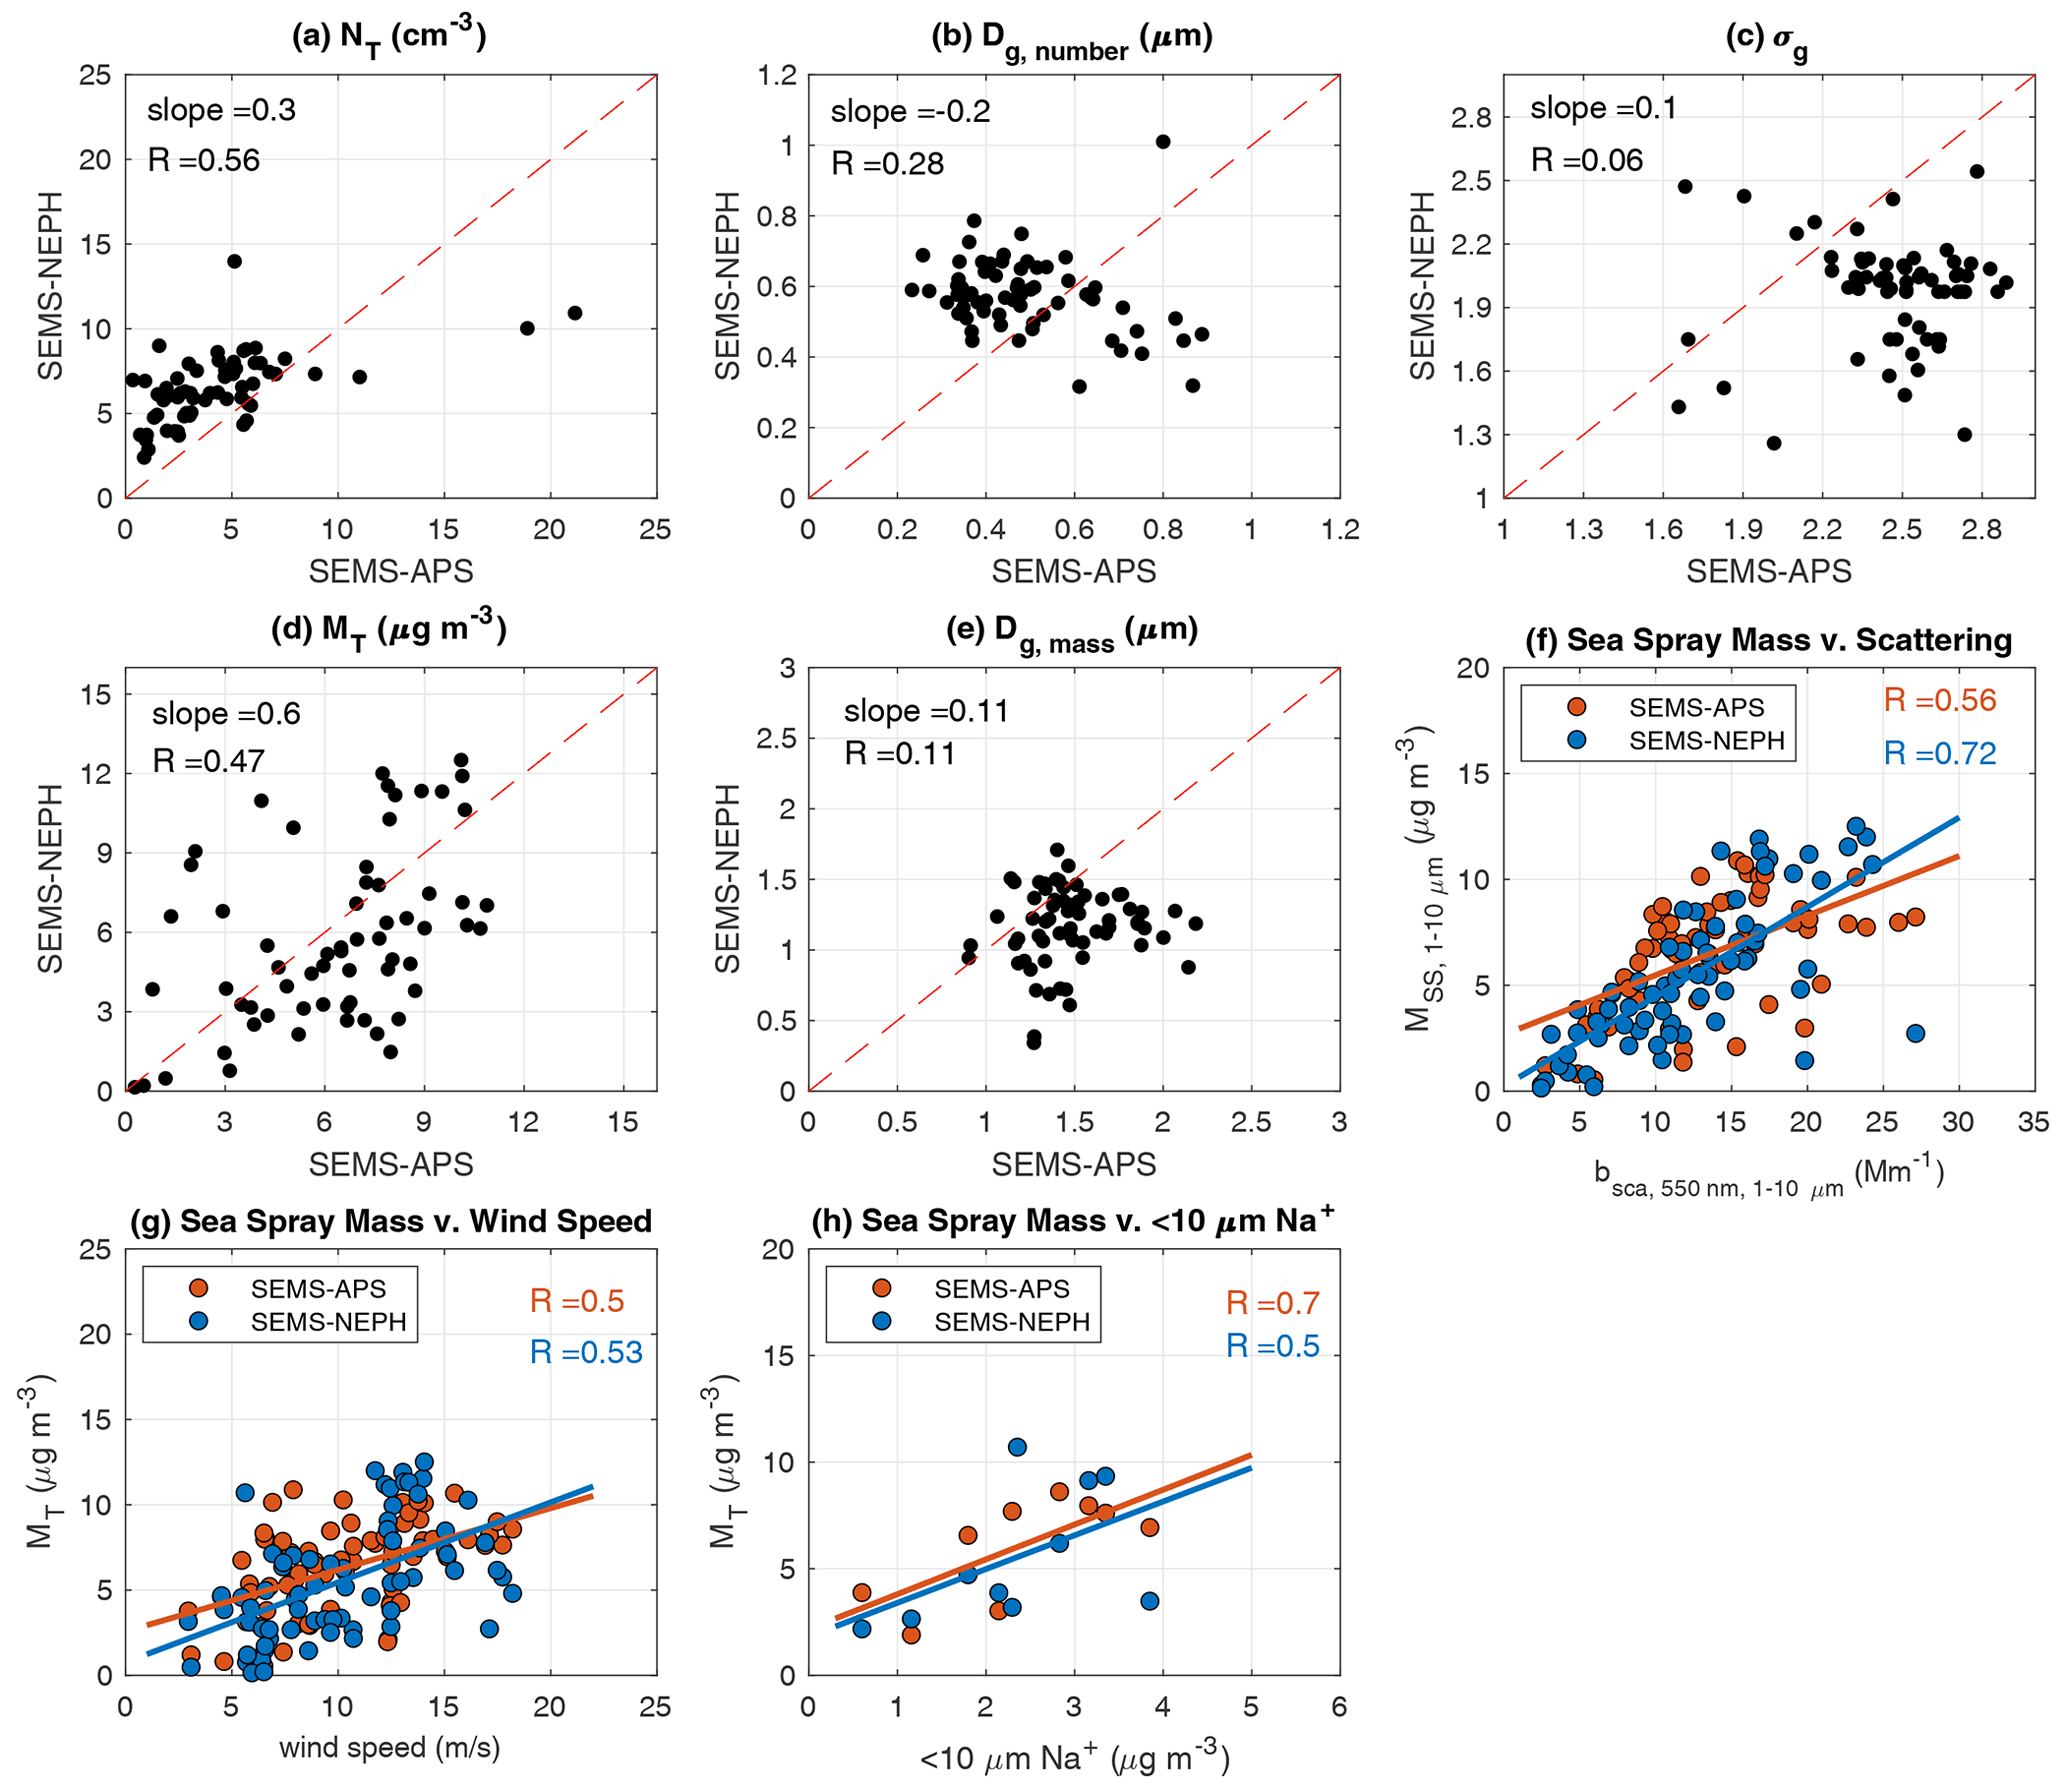
Figure 7Comparison of sea spray modal parameters retrieved using measured supermicron size distributions (SEMS-APS; Saliba et al., 2019) and Mie inversion of nephelometer supermicron scattering (SEMS-NEPH; this study) during clean marine periods of the NAAMES 1 cruise (6 November–30 November 2015). Two-hour-integrated (a) number (cm−3) and (d) mass (µg m−3) concentrations, (b) number and (e) mass mean diameters (µm), and (c) mode widths are shown. Panels (a)–(e) also show the slope of linear best fit and the Pearson correlation coefficient at top left. Dashed red lines represent 1:1 lines. Sea spray mass correlations with supermicron scattering (f), wind speed (g), and <10 µm Na+ mass concentration (h) for the SEMS-APS (orange) and SEMS-NEPH (blue) methods. Na+ mass measurements are from offline filter analysis using ion chromatography. Sea spray mass estimates in (h) are averaged over the filter collection times (24 h), which provided nine samples. Pearson correlation coefficients are indicated at top right and linear best fits are colored by method in (f), (g), (h).
This UHSAS-NEPH method was developed for LASIC measurements because that study lacked supermicron size distribution measurements. To evaluate the performance of the nephelometer-constrained sea spray mode retrieval, we first compared the scattering-constrained retrieval to a retrieval constrained by measured supermicron size distributions and salt mass concentrations. This comparison was done using measurements from clean marine periods of the first North Atlantic Aerosols and Marine Ecosystems Study (NAAMES 1), deployed 6–30 November 2015 (Behrenfeld et al., 2019; Saliba et al., 2019), for which sea spray mode retrievals using supermicron size distributions and salt mass concentrations were also available. NAAMES 1 was selected as a case study of the nephelometer constraint on supermicron size because it had the most persistent clean conditions of the four ship deployments (Saliba et al., 2020). The low particle concentrations during NAAMES 1 (median CNtotal = 94 cm−3) also included the lowest sea spray aerosol concentrations (mean Nsea spray=5 cm−3) of the four cruises (Saliba et al., 2019).
Table 4Comparison of sea spray modal parameters retrieved using measured supermicron size distributions (SEMS-APS; Saliba et al., 2019) and Mie inversion of nephelometer supermicron scattering (SEMS-NEPH; this study) during clean marine periods of the NAAMES 1 cruise (6–30 November 2015). Values of the 2 h integrated number (NT) concentration, mass concentration (MT), number mean diameter (Dg,number), mass mean diameter (Dg,mass), and mode width (σg) are provided as the mean ± 1 standard deviation.
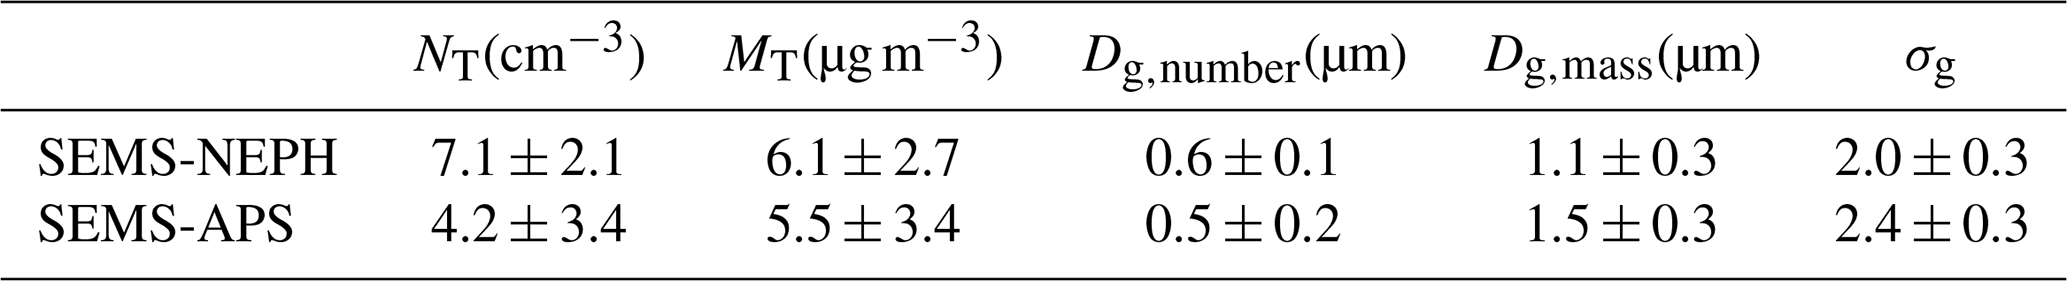
During NAAMES 1, submicron (0.1–0.8 µm) and supermicron (0.5–10 µm) size distributions were measured by a scanning electrical mobility spectrometer (SEMS, model 2002 BMI) and an aerodynamic particle sizer (APS; model 3321 TSI), respectively. Scattering coefficients at <1 µm and <10 µm diameter size cuts were measured by a 3-λ (450, 550, 700 nm) integrating nephelometer (model 3563, TSI). In contrast to the LASIC measurements, the nephelometer and size distribution measurements were performed in dry conditions (RH < 40 %), meaning that dry particle properties could be assumed. Offline analysis of filters using ion chromatography provided size-resolved <10 µm salt (Na+) mass concentrations at a 24 h resolution.
Saliba et al. (2019) retrieved the sea spray aerosol mode by fitting a lognormal mode to the shoulder of the merged ambient size distributions (SEMS-APS) during NAAMES 1. This method expanded upon the techniques described in previous work for fitting lognormal modes to measured marine size distributions (Modini et al., 2015; Quinn et al., 2017; Hussein et al., 2005) by allowing for the diameter and width of the mode to vary without laboratory constraints; when constrained, retrieved parameters were often close to the interval limits. Fifteen-minute-averaged <10 µm SEMS-APS sea spray mode mass concentrations during NAAMES 1 were previously compared to the filter measurements of <10 µm Na+ mass and wind speed and correlations of 0.7 and 0.6 were found, respectively (Saliba et al., 2019). These correlations support the interpretation of the SEMS-APS-retrieved mode as sea spray aerosol. For comparison with the UHSAS-NEPH retrieval method during 2 h NAAMES 1 measurements, SEMS was used as a replacement for UHSAS (SEMS-NEPH) with a refractive index of m=1.56 + 0i and sea spray particle density of 2.0 g cm−3 for dry conditions.
Figure 7 and Table 4 show comparisons of the SEMS-APS and SEMS-NEPH sea spray retrievals for 2 h averaged SEMS, APS, and nephelometer measurements. SEMS-NEPH estimates double the number concentration for the sea spray mode, but only a 10 % higher mass concentration on average than given by SEMS-APS (Fig. 7a, d). The main differences between these two variables can be explained by the retrieval constraints of each method: SEMS-APS constrains the number size distribution, while the Mie-based scattering constraint of SEMS-NEPH is dependent upon the mass concentration. The difference in retrieved number concentrations between the two methods may have implications for attributing particle contributions to CCN. A factor of 2 difference between the SEMS-NEPH and SEMS-APS estimates of particle number could modify the commonly observed 10 %–30 % contribution of sea spray to CCN at supersaturations of 0.1 %–0.4 % (Quinn et al., 2017; Sanchez et al., 2021; Modini et al., 2015), as more particles contribute to an already low CCN concentration during clean marine conditions.
The majority of the integrated mass comparisons fall within a reasonable range of the 1:1 line, except for some periods with low SEMS-APS mass concentrations (<3 µg m−3) (Fig. 7d). The larger mass concentration estimates of SEMS-NEPH could be attributable to supermicron sea spray mass observed by the nephelometer that is not fully resolved by the APS number concentration estimate. This is supported by a stronger correlation of retrieved mass with supermicron scattering for SEMS-NEPH (R=0.72) than what is observed using SEM-APS (R=0.56) (Fig. 7f), although it should be noted that supermicron scattering has been used to constrain SEMS-NEPH solutions. Since the width of the sea spray mode from the scattering-based retrieval has been shown to be a poorly constrained parameter and is often narrower for SEMS-NEPH (2.0 ± 0.3) than for SEMS-APS (2.4 ± 0.3), it may be the source of discrepancies between the other modal properties (Fig. 7c). These discrepancies are particularly apparent for the mode diameters, which are 20 % larger in number mean size and 30 % smaller in mass mean size for SEMS-NEPH in comparison to SEMS-APS. The scattering-based approach uses the probability occurrence of modal width to retrieve an optimal value, but the lack of number size distribution measurements at larger sizes (>0.8 µm) from the SEMS provides insufficient information to constrain this parameter.
For the 2 h averaged concentrations, sea spray mass concentrations show moderate correlations of 0.50 for SEMS-APS and 0.53 for SEMS-NEPH with wind speed (Fig. 7g). The SEMS-APS correlation of mass to wind speed is slightly weaker than the correlation previously reported by Saliba et al. (2019) for 15 min averages (R=0.6), but this moderate correlation is maintained, suggesting that the estimated mass concentration from both retrievals can be attributed to sea spray production by wind. Ambient <10 µm sodium (Na+) mass analyzed with ion chromatography moderately correlates with the SEMS-NEPH retrieval of sea spray mass (Fig. 7h). Although the correlation of the mass concentration to sodium is weaker when using SEMS-NEPH than when using SEMS-APS (R=0.7), the SEMS-NEPH correlation is consistent with other studies merging measured sub- and supermicron size distributions to fit sea spray modes and estimate salt mass in clean marine conditions (Quinn et al., 2017; Modini et al., 2015). Together, these results show the efficacy of nephelometer-constrained estimates of supermicron sea spray particles. The moderate correlations and relative agreement between parameters of the retrieval methodologies with sea spray tracers indicate reasonable retrievals at dry relative humidity, even though supermicron size distributions provide a more accurate retrieval of sea spray number properties.
For LASIC, sea spray modal properties were retrieved for 906 of the 909 2 h clean marine background periods using UHSAS-NEPH. The sea spray mode could not be retrieved for three periods due to missing supermicron scattering measurements for at least one wavelength. To ensure that the algorithm retrievals were sufficiently consistent with both UHSAS and NEPH and representative of marine aerosol, we restricted the results to those with (1) low residual errors between the retrieval and measurements in the fitting region (0.38–0.83 µm), (2) low measured scattering variability during each 2 h time period, and (3) limited influence from potential nonmarine aerosol sources, namely CN3 concentrations <400 cm−3.
The fit RSS (Sect. 3.4) is the difference between the measured size distribution fitting region and the Mie solution determined from three-wavelength supermicron scattering. Low residuals (fit RSS < 2) indicate good agreement between the measured region of the accumulation mode “shoulder” (0.38–0.83 µm) and the modal fit retrieved from scattering; hence, a low RSS shows that the retrieved mode is well constrained by the measured UHSAS size distribution and NEPH scattering. The average fit RSS for the LASIC dataset that met the marine criteria was 1.26 ± 0.89 (Fig. 8a), which indicates that the retrieved modes are generally within the uncertainty of the measured size distribution in the 0.38–0.83 µm fitting region, but solutions that are not constrained by the UHSAS size distribution are also retrieved, as is evident from large values of the fit RSS for various retrieval periods (Fig. 8a). A visual inspection of the retrieved mode fits suggested that values exceeding a residual threshold of 5 should be rejected as there is not sufficient agreement in the overlap region to consider the solution acceptable. Retrieved modes with fits above this threshold tended to have solutions that were either larger than the measured accumulation mode “shoulder” or had peaks in regions where the size distribution was low. These high fit RSSs likely indicate that the supermicron scattering measurements were influenced by particles other than sea spray, which were not effectively constrained by the supermicron scattering. We also examined RSS thresholds of 1 through 10. There were no significant changes in correlations to wind speed or chemical signatures (Sect. 5.2) upon lowering the threshold to values of 1–4, and there were decreases in those correlations for thresholds above a value of 6 (Table S7).
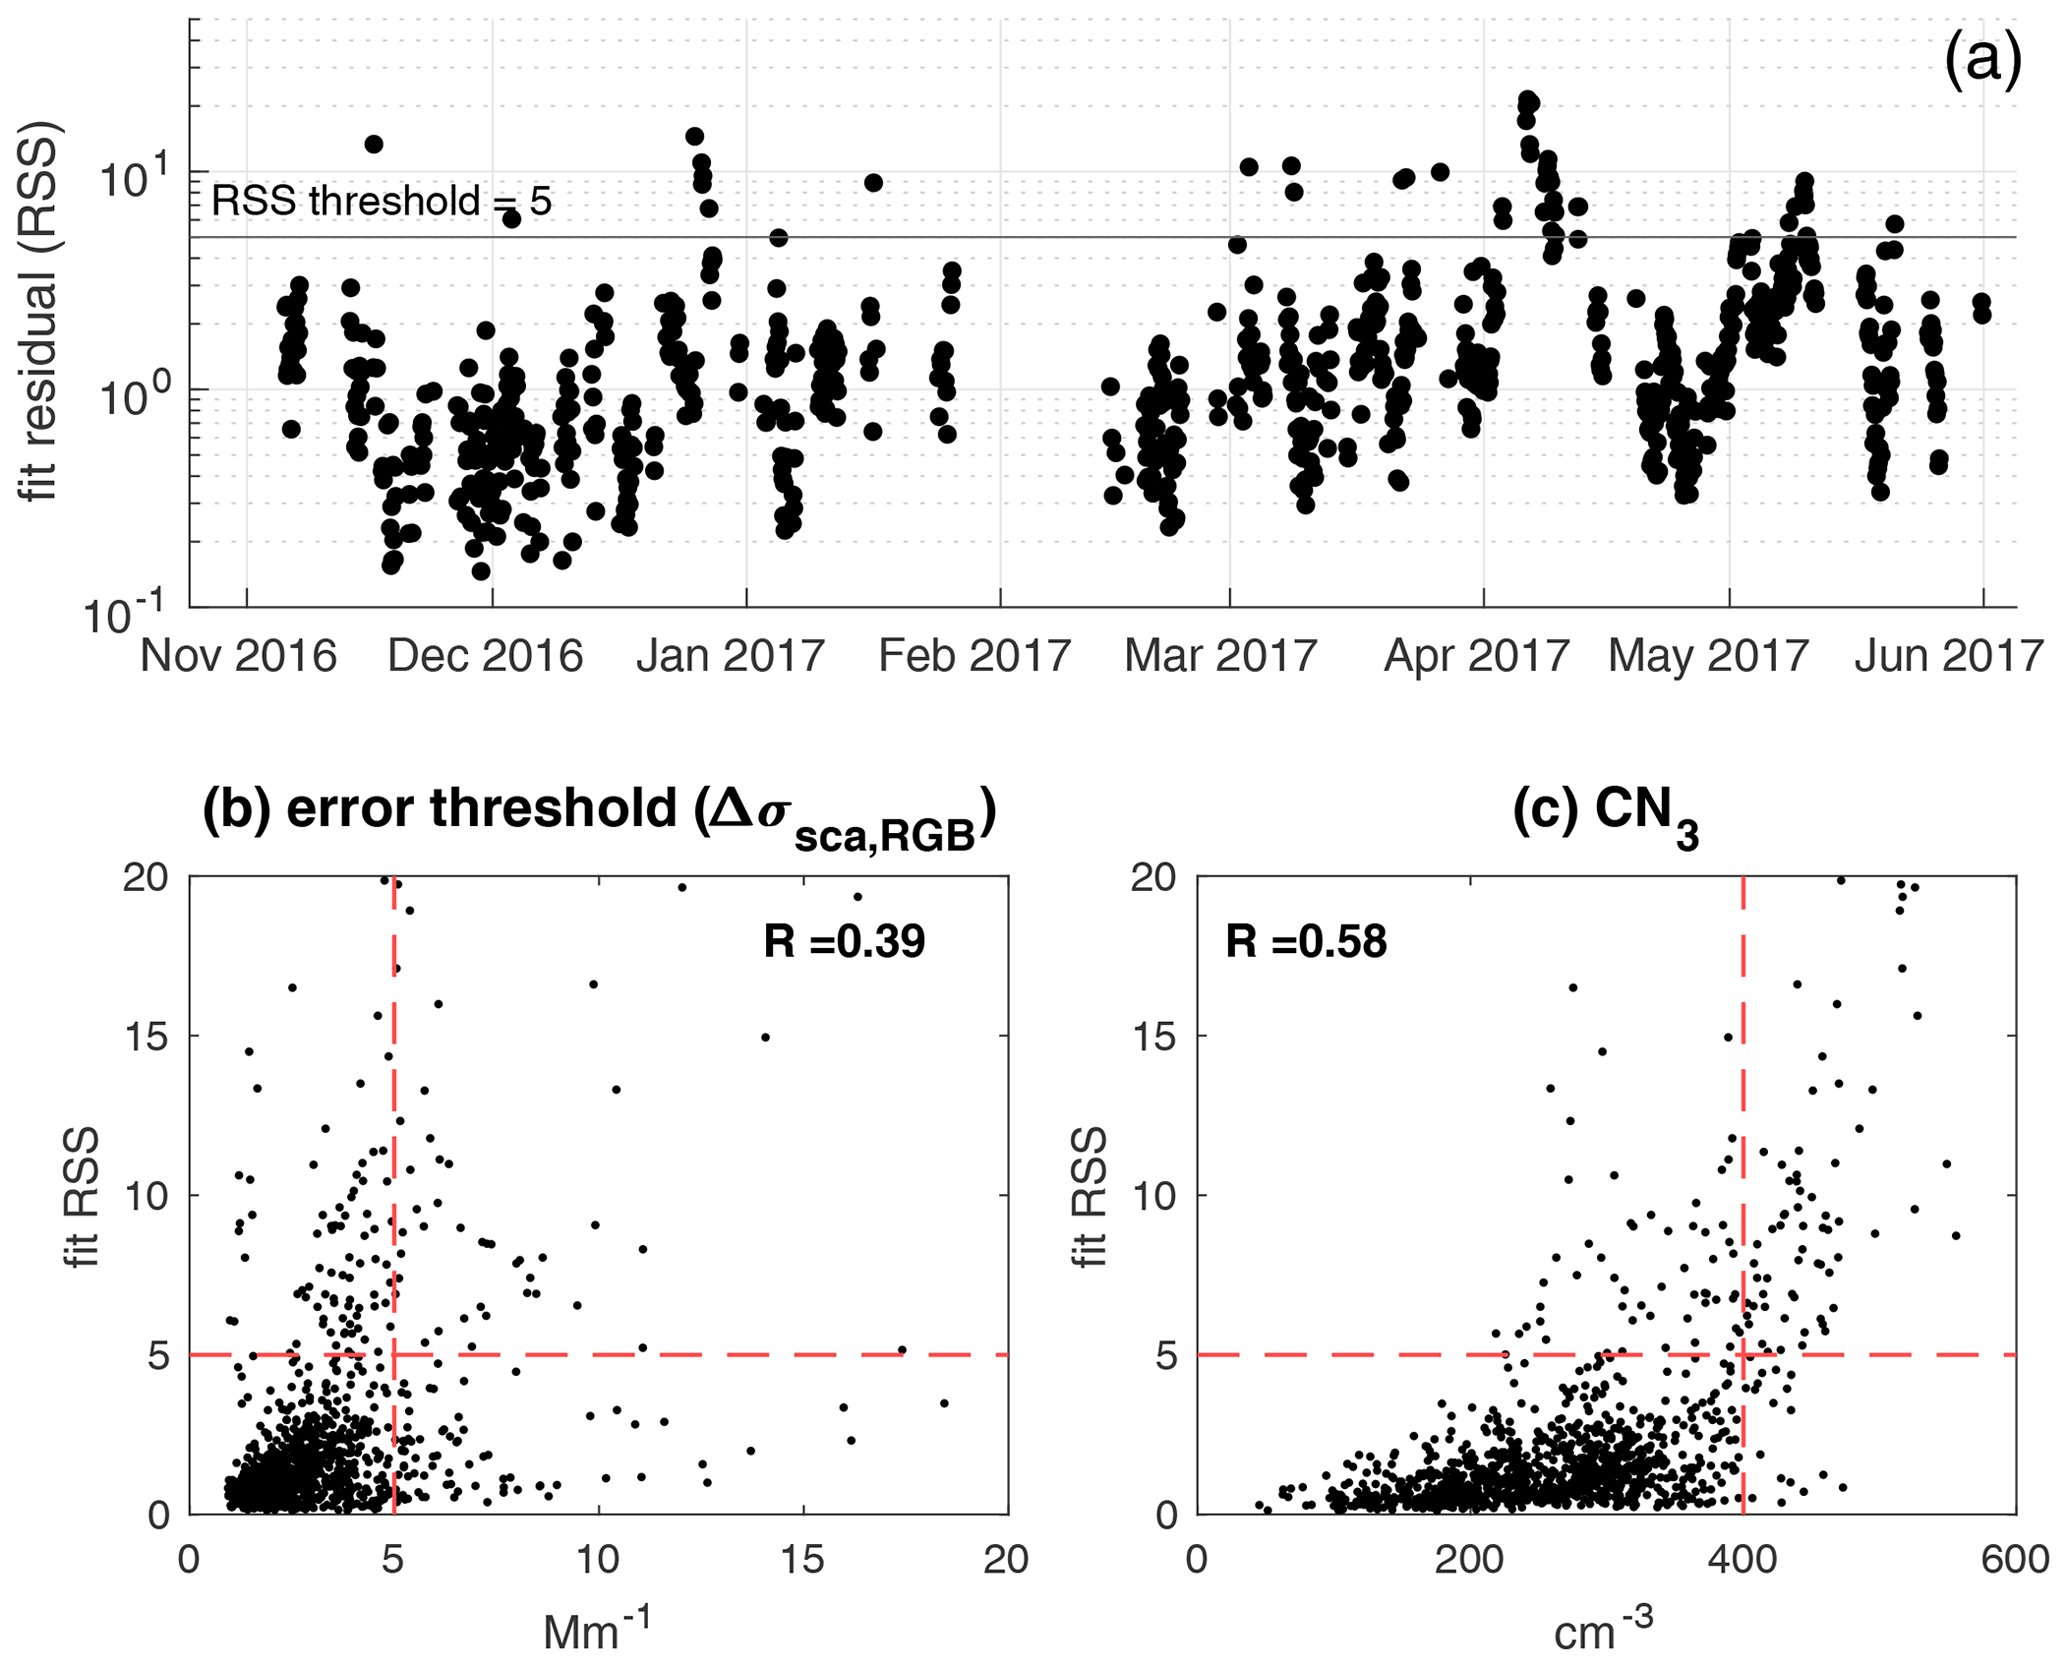
Figure 8(a) Times series of the fit residual (residual sum of squares, RSS) between the retrieved sea spray mode and the UHSAS mass size distribution within the 0.38–0.83 µm fitting region. The horizontal line in (a) delineates the RSS restriction threshold of 5 used in this procedure. Note the logarithmic y axis. (b, c) Selected variables used to restrict sea spray mode retrievals defined by the fit residual (fit RSS, y axes): (b) error threshold (Δσsca, RGB, Mm−1) and (c) condensation nuclei concentration of particles >3 nm optical diameter (CN3, cm−3). Retrieval restriction thresholds are symbolized by dashed red lines in (b, c). Pearson correlation coefficients (p<0.05) are provided within panels (b, c).
To assess the limitations of the algorithm due to the observed variability in measured scattering, we examined the relationship between the scattering error threshold and the fit RSS. The scattering error threshold, Δσsca, RGB, is defined as the combined effect of temporal variability and instrument uncertainty and had an average value of 3.1±2.1 Mm−1 during LASIC. Low fit RSSs (<5) appear to coincide with low values of Δσsca, RGB (R=0.39), which suggests well-constrained sea spray mode solutions when the nephelometer scattering variability is low during the 2 h average (Fig. 8b). The relationship of low Δσsca, RGB with a low fit RSS generally persists to a threshold value of about Mm−1 before the fit RSS values increase in magnitude. Using this observed relationship between Δσsca, RGB and fit RSS as an indicator that the algorithm is sufficiently constrained to provide reasonable fits, we applied an acceptable scattering uncertainty tolerance of 5 Mm−1 as a restriction.
Figure 8c illustrates a moderate correlation between fit RSS and CN3 concentration (R=0.58). Fit RSS is generally below the threshold of 5 for CN3 concentrations less than 400 cm−3. Above this concentration, the fit RSS increases to higher values more consistently. The 600 cm−3 CN3 criterion used to screen for clean periods is above the average and the variability of the clean marine background season after the restriction was applied (300 ± 90 cm−3). Because supermicron sea spray particles contribute low number concentrations to the aerosol budget, increases in particle number concentration likely indicate nonmarine aerosol sources that were not excluded by the <600 cm−3 clean marine criteria applied here. Therefore, we have excluded periods when the total aerosol concentrations exceeds 400 cm−3 from the retrieval evaluation.
This additional screening of the LASIC dataset after applying the restriction on the fit RSS (<5) and the scattering error tolerance (<5 Mm−1) and using CN3<400 cm−3 provided sea spray mode retrievals for 88 % (794) of the available clean marine background periods during LASIC. These 794 sea spray retrievals were used to evaluate UHSAS-NEPH during LASIC.
Since sea salt composition measurements were not collected during the LASIC campaign, four methods were used to evaluate sea salt identification: (1) comparison of UHSAS-NEPH to a modified version of a sea spray size distribution fitting algorithm that has been validated previously with salt composition (Saliba et al., 2019; Modini et al., 2015; Quinn et al., 2017); (2) correlation to the nonrefractory chloride signal measured by the aerosol chemical speciation monitor (ACSM); (3) correlation of supermicron scattering and sea spray mass, where coarse scattering is taken as a tracer for sea spray during clean marine conditions (Kleefeld et al., 2002; Chamaillard et al., 2006; Quinn et al., 1998); and (4) correlation of retrieved mass to wind speed, since this is widely used as a proxy for sea spray mass production (Lewis and Schwartz, 2004) and model flux parameterization (Gong, 2003; de Leeuw et al., 2011; Ma et al., 2008).
6.1 UHSAS-only comparison
We applied the SEMS-APS fitting algorithm described in Sect. 4 to measured UHSAS number size distributions (hereafter identified as “UHSAS-only”) and compared sea spray mode results with those retrieved using UHSAS-NEPH. Sanchez et al. (2021) have recently applied the algorithm to submicron UHSAS size distributions obtained from aircraft measurements in the marine boundary layer of the Southern Ocean and found it to be a good approximation of the sea spray contribution to the CCN number concentration by comparison to quantified sub- and supermicron sea salt particles using electron microscopy. The mode fitting parameters NT and Dg of the UHSAS-only method were converted to mass-derived values for comparison with UHSAS-NEPH using Eq. (7) for the same particle diameter range (Dp=0.01–10 µm). UHSAS-only sea spray modes were fitted for 90 % of the 2 h average size distributions during the clean marine background season. When fits could not be achieved, there was generally noise in the measured size distribution or other common singularities (see the supplement of Saliba et al., 2019). Summary statistics comparing parameters retrieved using UHSAS-NEPH and UHSAS-only are provided in Table 5.
Table 5UHSAS-only and UHSAS-NEPH number concentrations, mass concentrations, and size distribution fitting parameters. Values are the mean ±1 standard deviation. Bracketed values are the minimum and maximum.
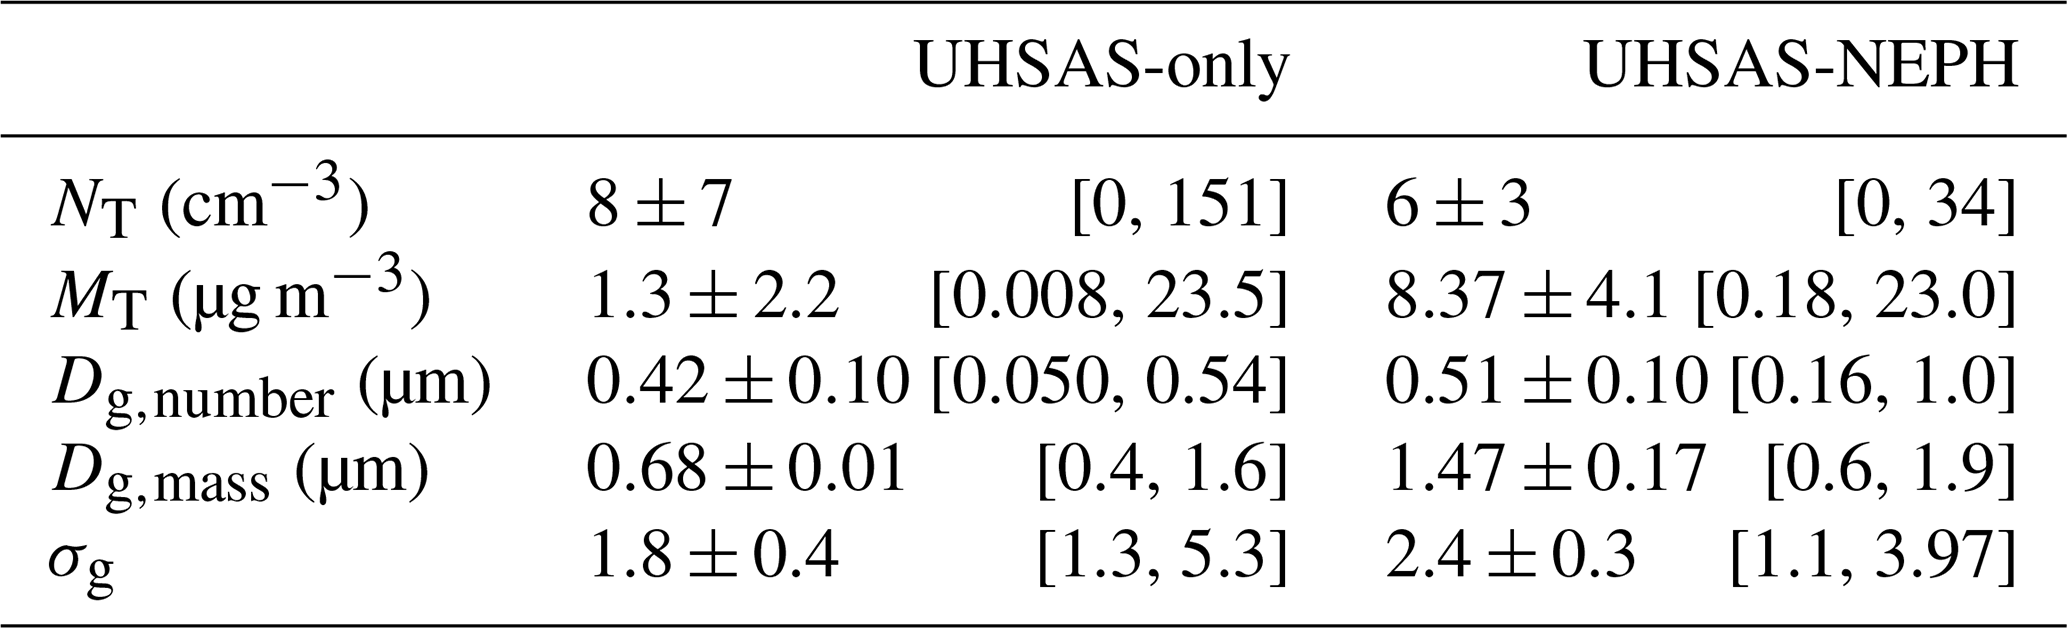
Integrated sea spray mode mass concentrations ranged from 0.008 to 23.5 µg m−3 employing UHSAS-only and from 0.18 to 23.0 µg m−3 with UHSAS-NEPH. Average sea spray mass concentrations of 1.3±2.2 µg m−3 and 8.37 ± 4.1 µg m−3 were observed for UHSAS-only and UHSAS-NEPH, respectively, which indicates that using UHSAS-only provides lower sea spray mass retrievals because UHSAS-only fits are constrained solely by the accumulation mode shoulder. Sea spray mass concentrations from both methods exhibit generally consistent concentrations during the clean marine periods of LASIC with no apparent seasonality (Fig. 9a), but there are distinct differences in the retrieved mode diameters and widths (Fig. 9b, c).
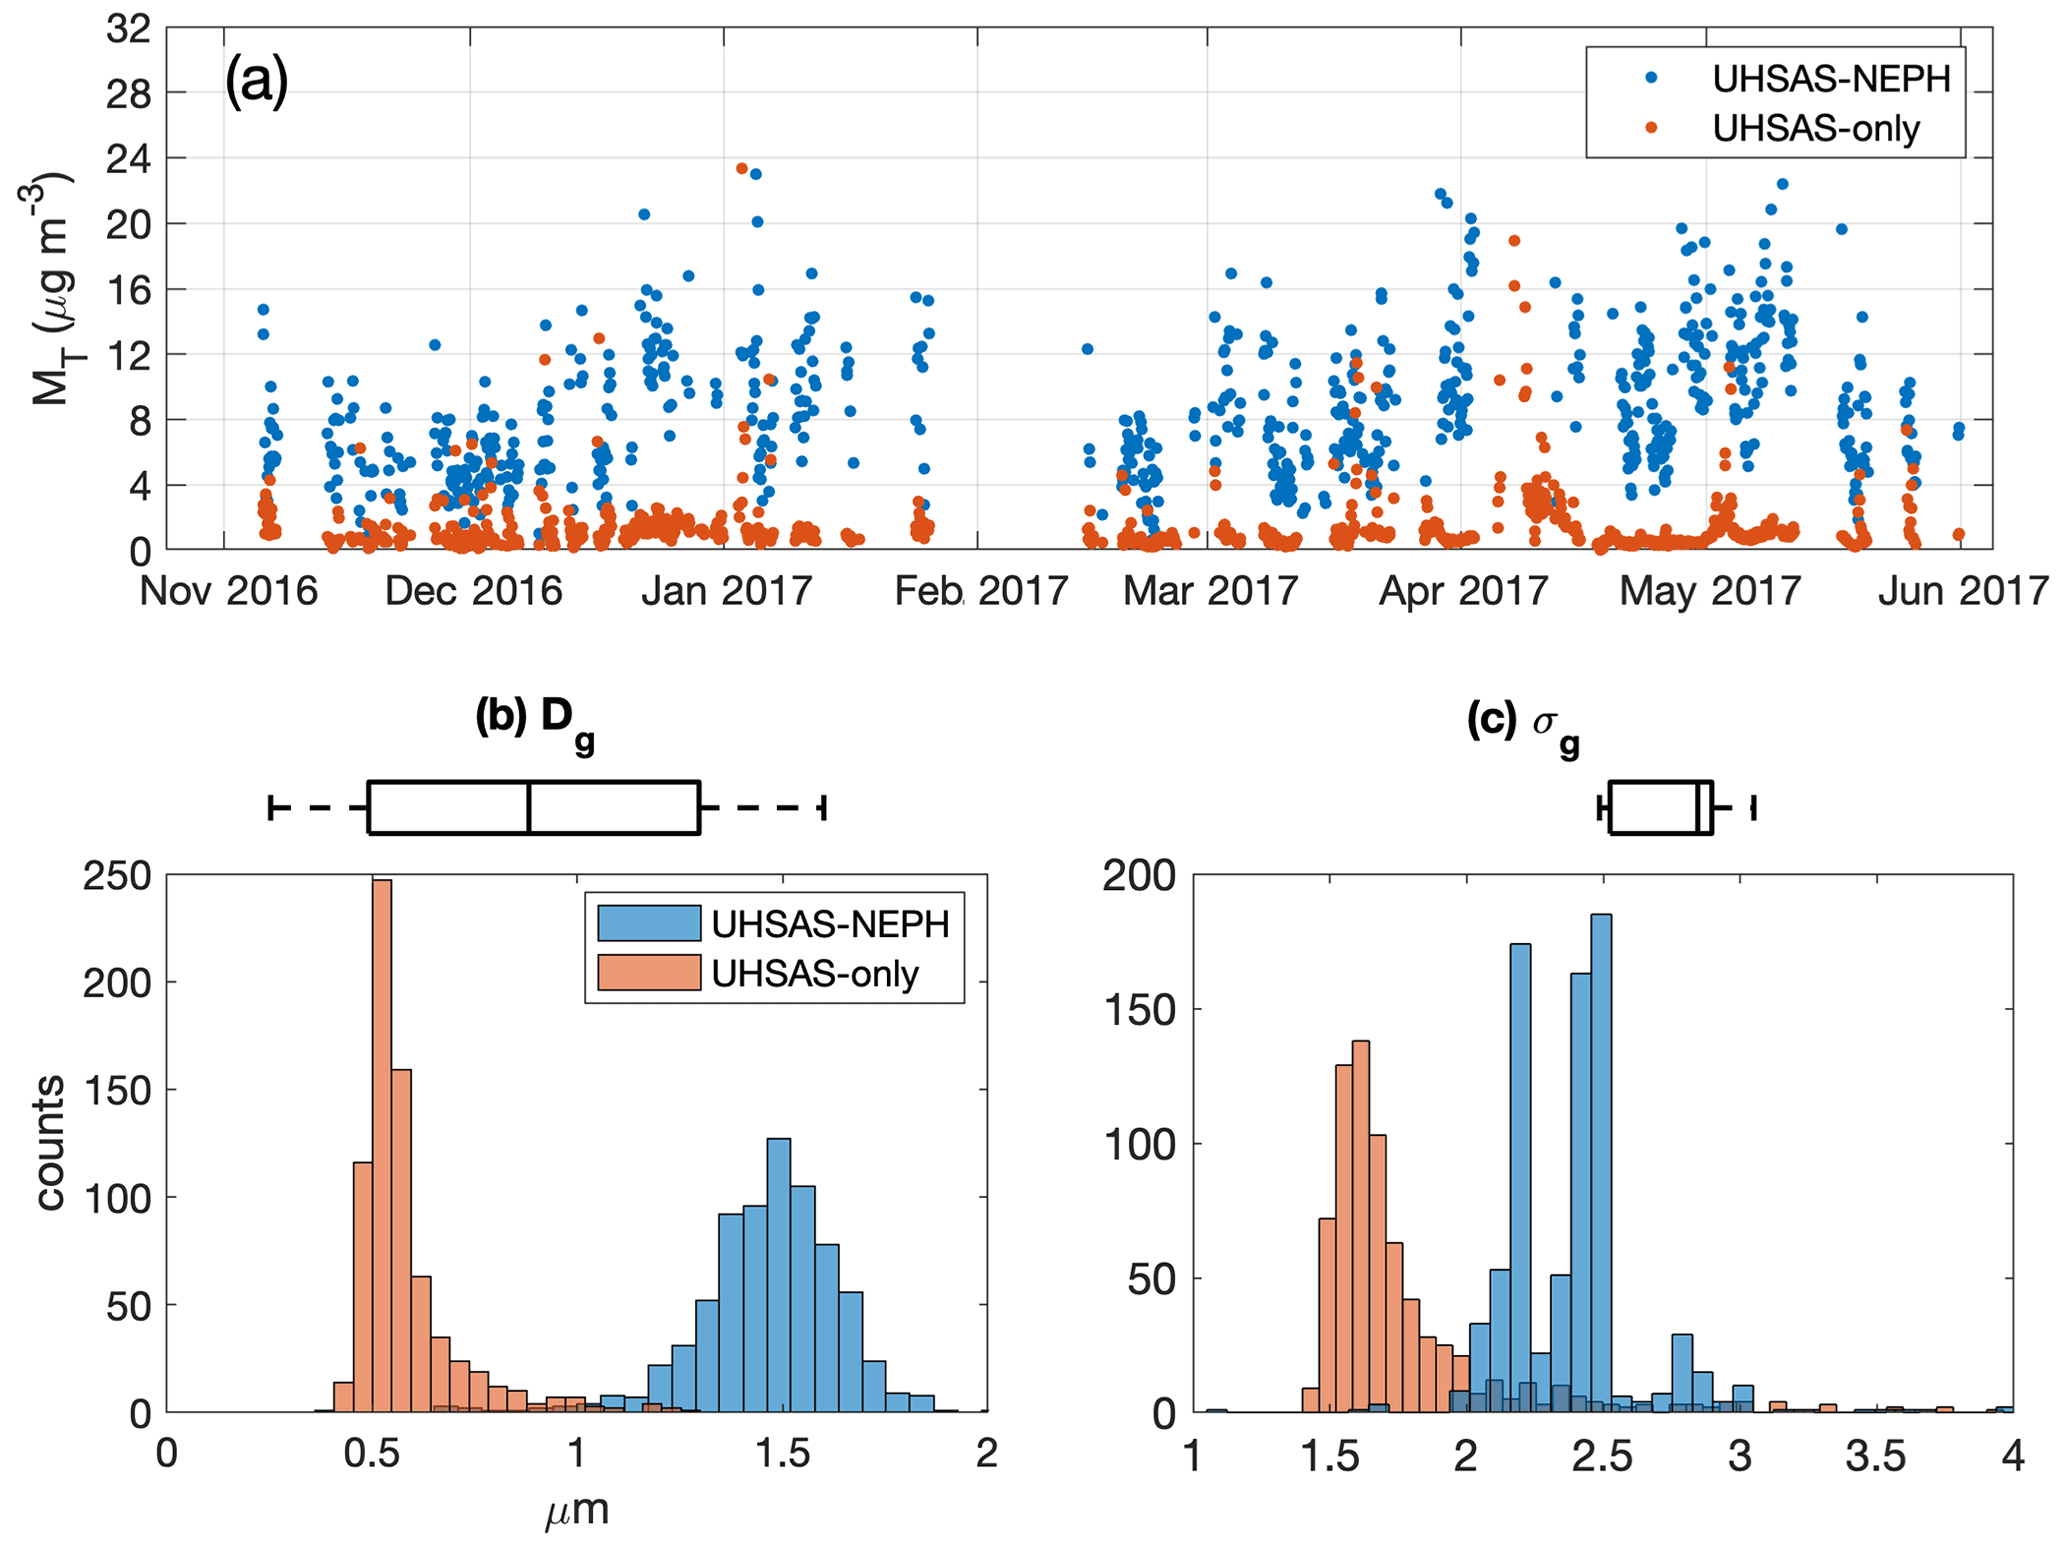
Figure 9(a) Time series of sea spray mass concentrations (MT, µg m−3) retrieved from UHSAS-NEPH (blue) and UHSAS-only (orange) during clean marine periods of the LASIC background season (see Table 5 for summary statistics). Histograms of the (b) geometric mass mean diameter (Dg) and (c) geometric standard deviation (σg mode width) for the retrieved sea spray modes using UHSAS-NEPH and UHSAS-only. Box-and-whisker plots above the histograms represent the quartile ranges (25th and 75th percentiles) and median (vertical line) of sea spray mode fitting parameters reported in laboratory and field measurements (see Table 6).
Sea spray mode retrievals using UHSAS-only were much smaller in mass mean diameter than those of UHSAS-NEPH, with averages of 0.68 ± 0.01 µm and 1.47 ± 0.17 µm, respectively (Fig. 9b). The range of mass mean diameters was similar for both retrieval methods, 0.4 to 1.6 µm for UHSAS-only and 0.6 to 1.9 µm for UHSAS-NEPH, though the majority of the UHSAS-only mean diameters were submicron (Fig. 9b). Just over 2 % (14) of the UHSAS-only retrievals had mass mean diameters in the coarse mode (>1 µm), compared to 91 % (723) of those of UHSAS-NEPH. The peak in mass mean diameters at sizes within the coarse mode using UHSAS-NEPH can be attributed to the additional contributions of supermicron mass identified by the nephelometer supermicron scattering that are not constrained by the UHSAS submicron size distribution. These predominately supermicron mean diameters are consistent with the assumption that sea salt particles contribute a large amount of mass and scattering within the coarse mode, which is simply not captured by the submicron UHSAS distributions alone.
On average, UHSAS-only retrievals were narrower at 1.8 ± 0.4 than those retrieved with UHSAS-NEPH at 2.4 ± 0.3 (Fig. 9c). The range of mode widths using UHSAS-only varied from particularly narrow (1.3) to a fairly broad and unconstrained width of 5.3, compared to 1.1 to 3.97 for UHSAS-NEPH. UHSAS-only widths are determined solely by the shape of the large accumulation mode shoulder in the UHSAS number size distribution and include a variety of widths based on how flat or sharp the slope of this shoulder may be. Mode widths retrieved from both methods were predominately narrower than a value of 3, with only 2 % of UHSAS-only modes and 1 % of UHSAS-NEPH modes greater than this value. The average UHSAS-only mode narrowness again reflects the absence of supermicron size distribution measurements. Sanchez et al. (2021) reported a similarly narrow average mode width (1.44 ± 0.25) for marine boundary layer sea spray aerosol retrieved with UHSAS-only. Conversely, Yu et al. (2019) reported a broad mode width (geometric standard deviation of 2.7) and a volume peak at a supermicron diameter (approximately 2 µm) for 24 h averaged sea salt particle size distributions at Ascension Island using Aerosol Robotic Network retrievals, which is more consistent with UHSAS-NEPH observations. These results indicate that UHSAS-only may provide a good estimate of the sea spray number concentration, which predominantly consists of submicron-sized particles (Sanchez et al., 2021), but the lack of supermicron measurements makes it unable to adequately identify mass contributions from larger particles.
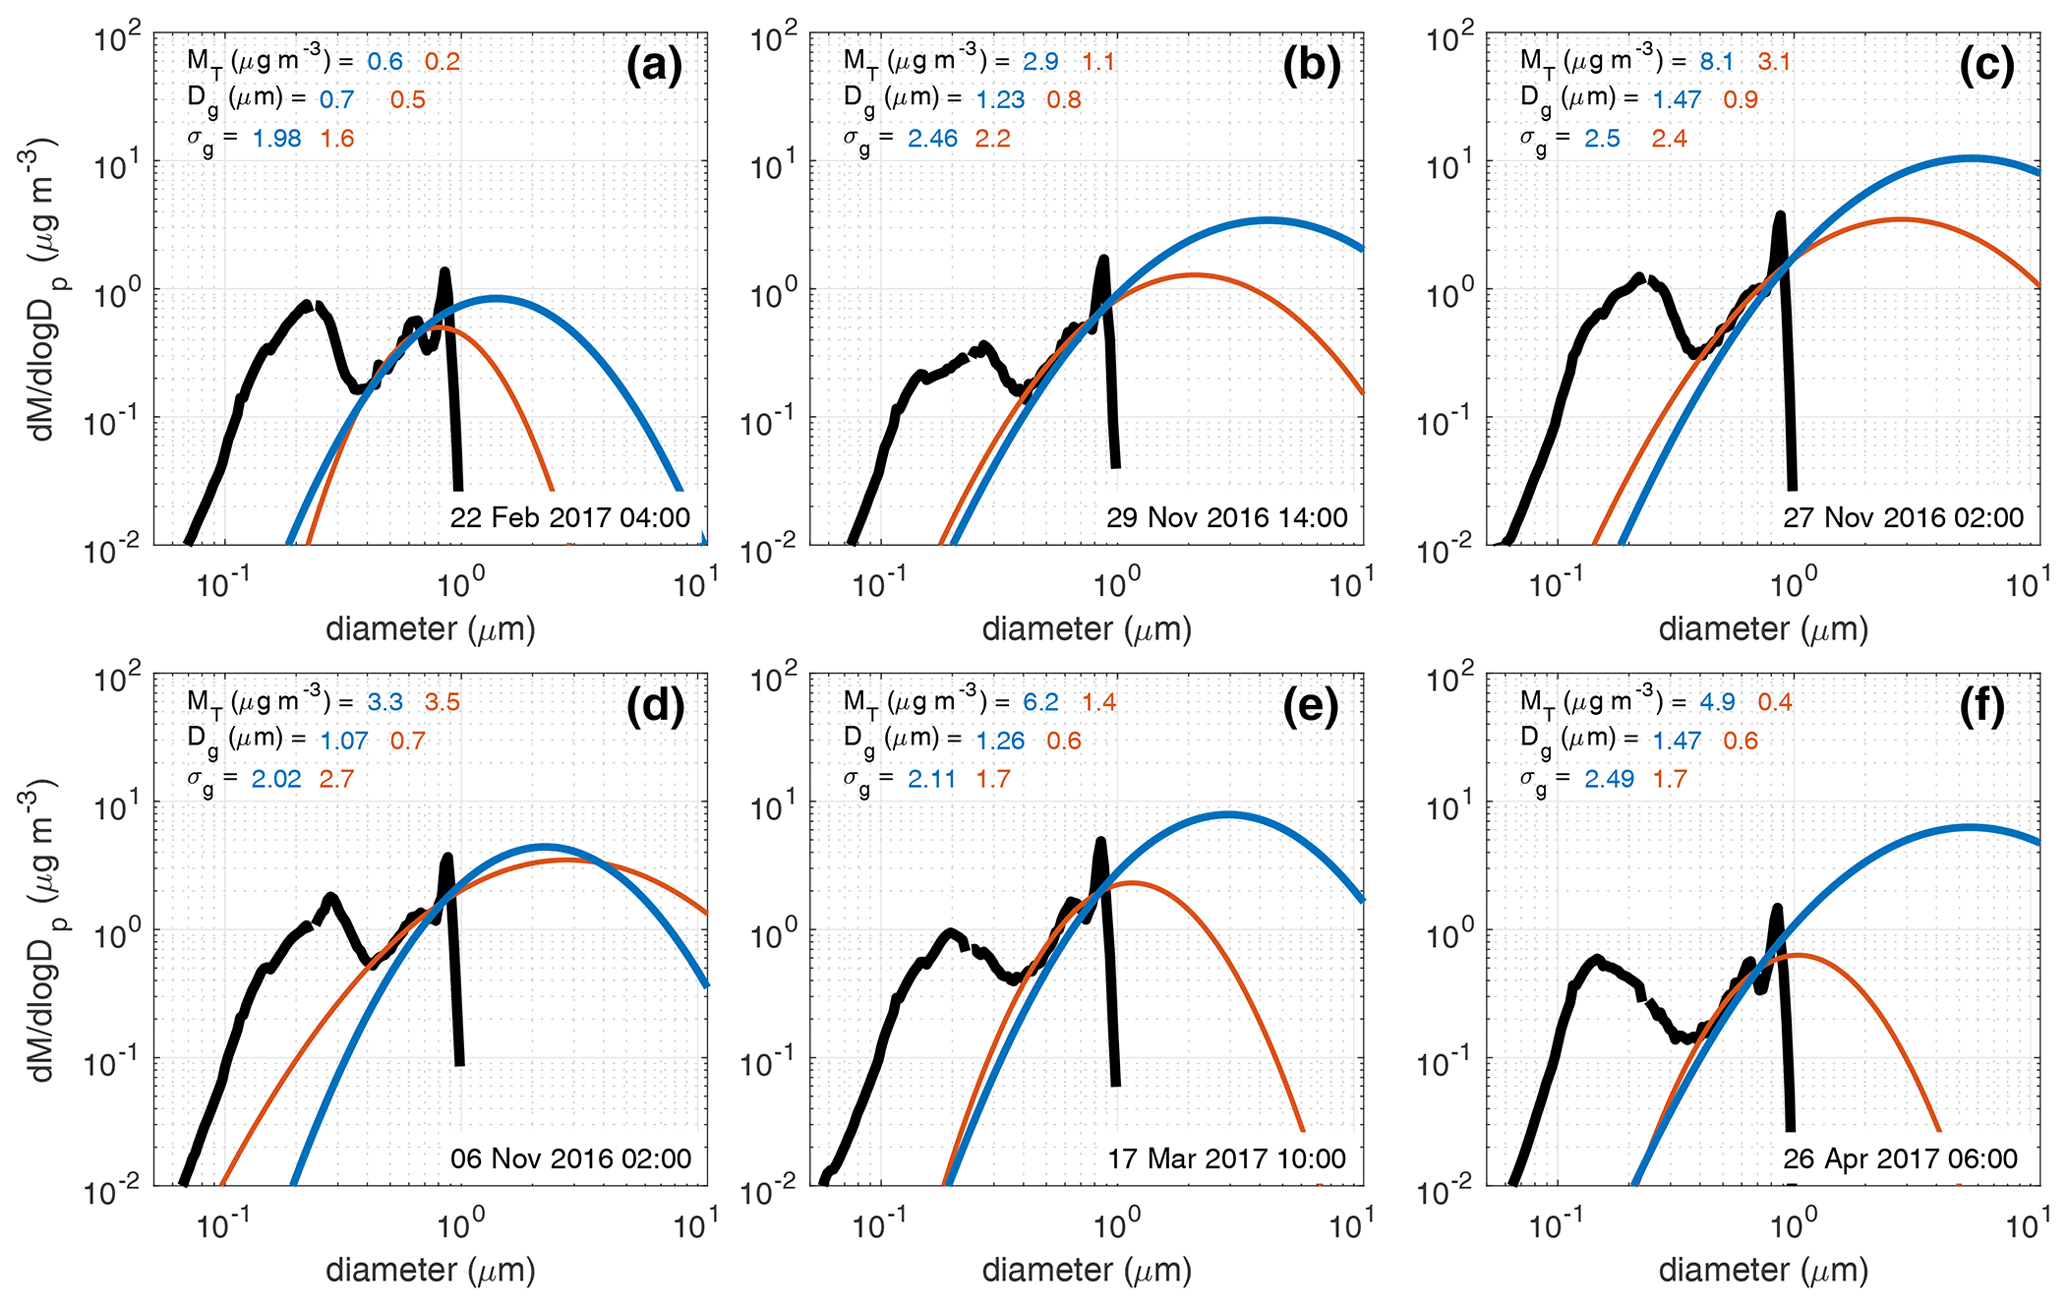
Figure 10Selected characteristic fits to the sea spray mode. UHSAS mass size distribution (black), UHSAS-NEPH (blue), and UHSAS-only (orange). Panels are oriented to reflect increasing mass, size, and width of the sea spray mode retrieved by UHSAS-NEPH from left to right (a–c, d–f). Mode fitting parameters – total mode mass (MT), geometric mass mean diameter (Dg), and geometric standard deviation (σg) – for the UHSAS-NEPH and UHSAS-only methods are identified in text above the plots in each panel and colored by the retrieval method. 2 h average time stamps are provided at the lower right.
Comparing the sea spray mode fitting parameters to those found in the literature shows that retrieved modal properties for both methods are within the ranges of reported values of mass mean dry diameter (0.25–1.6 µm) and mode width (1.4–3) (Fig. 9b, c and Table 6), while it should be noted that these LASIC retrievals are for 55% RH. The median reported mass diameter (0.88 µm) falls in between the statistical mode values (peaks in histograms) of the retrieval methods at the upper end of UHSAS-only and lower end of UHSAS-NEPH (Fig. 9b), showing consistency with other ambient sea spray mode measurements (Quinn et al., 2017; Sanchez et al., 2021; Modini et al., 2015). Retrievals using only the UHSAS number size distributions generally show better agreement in terms of mode size with laboratory-based bubble bursting and breaking wave flume studies, which had mass mean diameters that were less than 1 µm (Prather et al., 2013; Bates et al., 2012; Modini et al., 2010). UHSAS-NEPH retrievals are more consistent with field observations of the sea spray size distribution across several ocean basins, including open ocean studies in the Pacific and Atlantic, in which measurements of supermicron size distributions were incorporated (Quinn et al., 2017; Saliba et al., 2019; Modini et al., 2015). The UHSAS-NEPH retrieval of sea spray mode width was at the lower end of the reported laboratory and field measurement values, while the narrow UHSAS-only modes were generally outside the spread of the majority of reported values. These differences in the ranges of the retrieved values show that the mode width is the least constrained parameter derived by UHSAS-only and UHSAS-NEPH, although the scattering-based constraint provides some apparent improvement compared to UHSAS-only when supermicron mass contributions are considered.
Table 6Values of sea spray modal parameters reported in the literature. Number mean diameters (Dg,number) were converted to mass mean diameters (Dg,mass) using Eq. (7), integrating over particle sizes of 0.01–10 µm and averaging over a total particle concentration range of 1–100 cm−3. Values are averages unless labeled as an upper or lower bound.
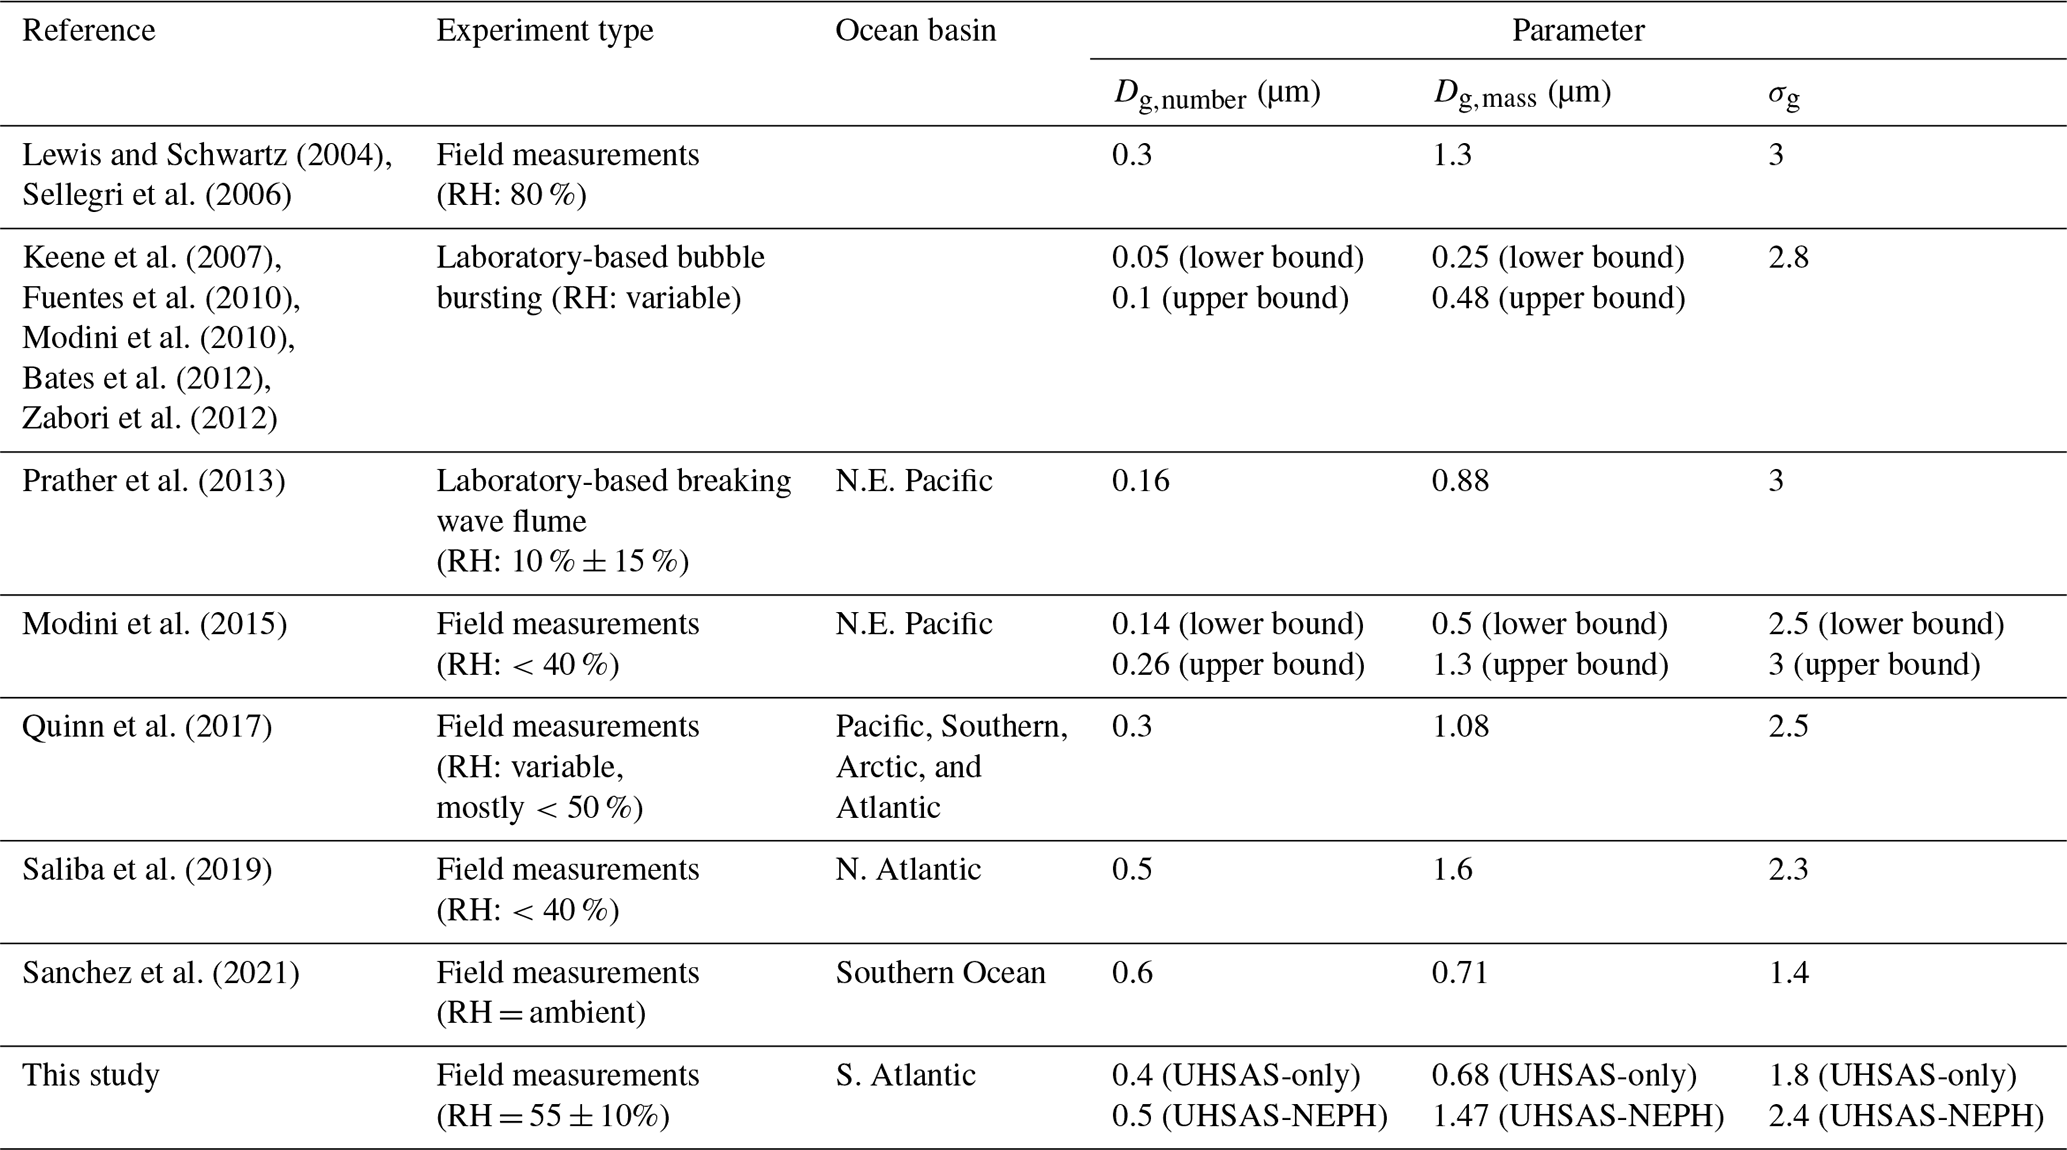
Figure 10 displays six UHSAS-NEPH sea spray mode fits that are characteristic of the retrieval procedure. Cases with different modal properties (diameter, width, mass) and a comparison of this retrieval with the UHSAS-only algorithm are presented. For both methods, the accumulation mode (0.4–1 µm) is generally well characterized by the retrieved modes, which follow the shape of this broad shoulder closely. Differences between the UHSAS-only and UHSAS-NEPH retrieved mass size distributions become more apparent just before the 1 µm size limit of the UHSAS. For narrow modes (σg∼2), the UHSAS-only method appears to generally be sufficient to quantify the sea spray mode mass concentration in the absence of supermicron scattering measurements (Fig. 10a). In these cases, the lower contribution of coarse particles measured by the nephelometer supermicron scattering adds little information at the tail of the size distribution. The limitations of fitting a sea spray mode based solely on the shape of the accumulation mode “shoulder” in the number size distribution are illustrated in Fig. 10b, c, d. The broadness of the shoulder at submicron sizes (0.38–0.83 µm) forces the UHSAS-only retrieval to include more particles from submicron sizes and fewer from the supermicron regime. This leads to lower mass concentrations in UHSAS-only compared to UHSAS-NEPH. Mode retrievals using only the UHSAS size distribution likely underestimate much of the mass at supermicron sizes, as seen by the sharper tailing off of the UHSAS-only modes in the coarse regime (Fig. 10b, c, e, f), with up to 5 µg m−3 of sea spray mass difference in the cases considered here.
6.2 Sea spray tracers
We next compared sea spray mode mass concentrations from UHSAS-only and UHSAS-NEPH with available sea spray tracers to evaluate the extent to which the retrieved modal properties represent realistic sea spray size distributions.
The submicron mass concentration measured by the ACSM provided a trace chloride signal that could be used to examine sea salt mass concentrations from the UHSAS-only and UHSAS-NEPH retrievals. Comparing the retrieved submicron sea spray mass with the ACSM chloride mass, we found correlations of R=0.39 (p<0.05) for UHSAS-only and R=0.35 (p<0.05) for UHSAS-NEPH (Fig. 11a, b). While the ACSM signal is a very indirect chemical measurement of refractory chloride, these positive correlations provide support for the ability of both methods to identify retrieved modes as sea spray. The higher correlation of UHSAS-only over UHSAS-NEPH may be a result of the submicron sampling range of the ACSM, the diameter range in which UHSAS-only is solely constrained. Additionally, much of the sea spray mass retrieved from UHSAS-NEPH is concentrated in the supermicron regime, which is not observed in ACSM submicron chloride measurements.
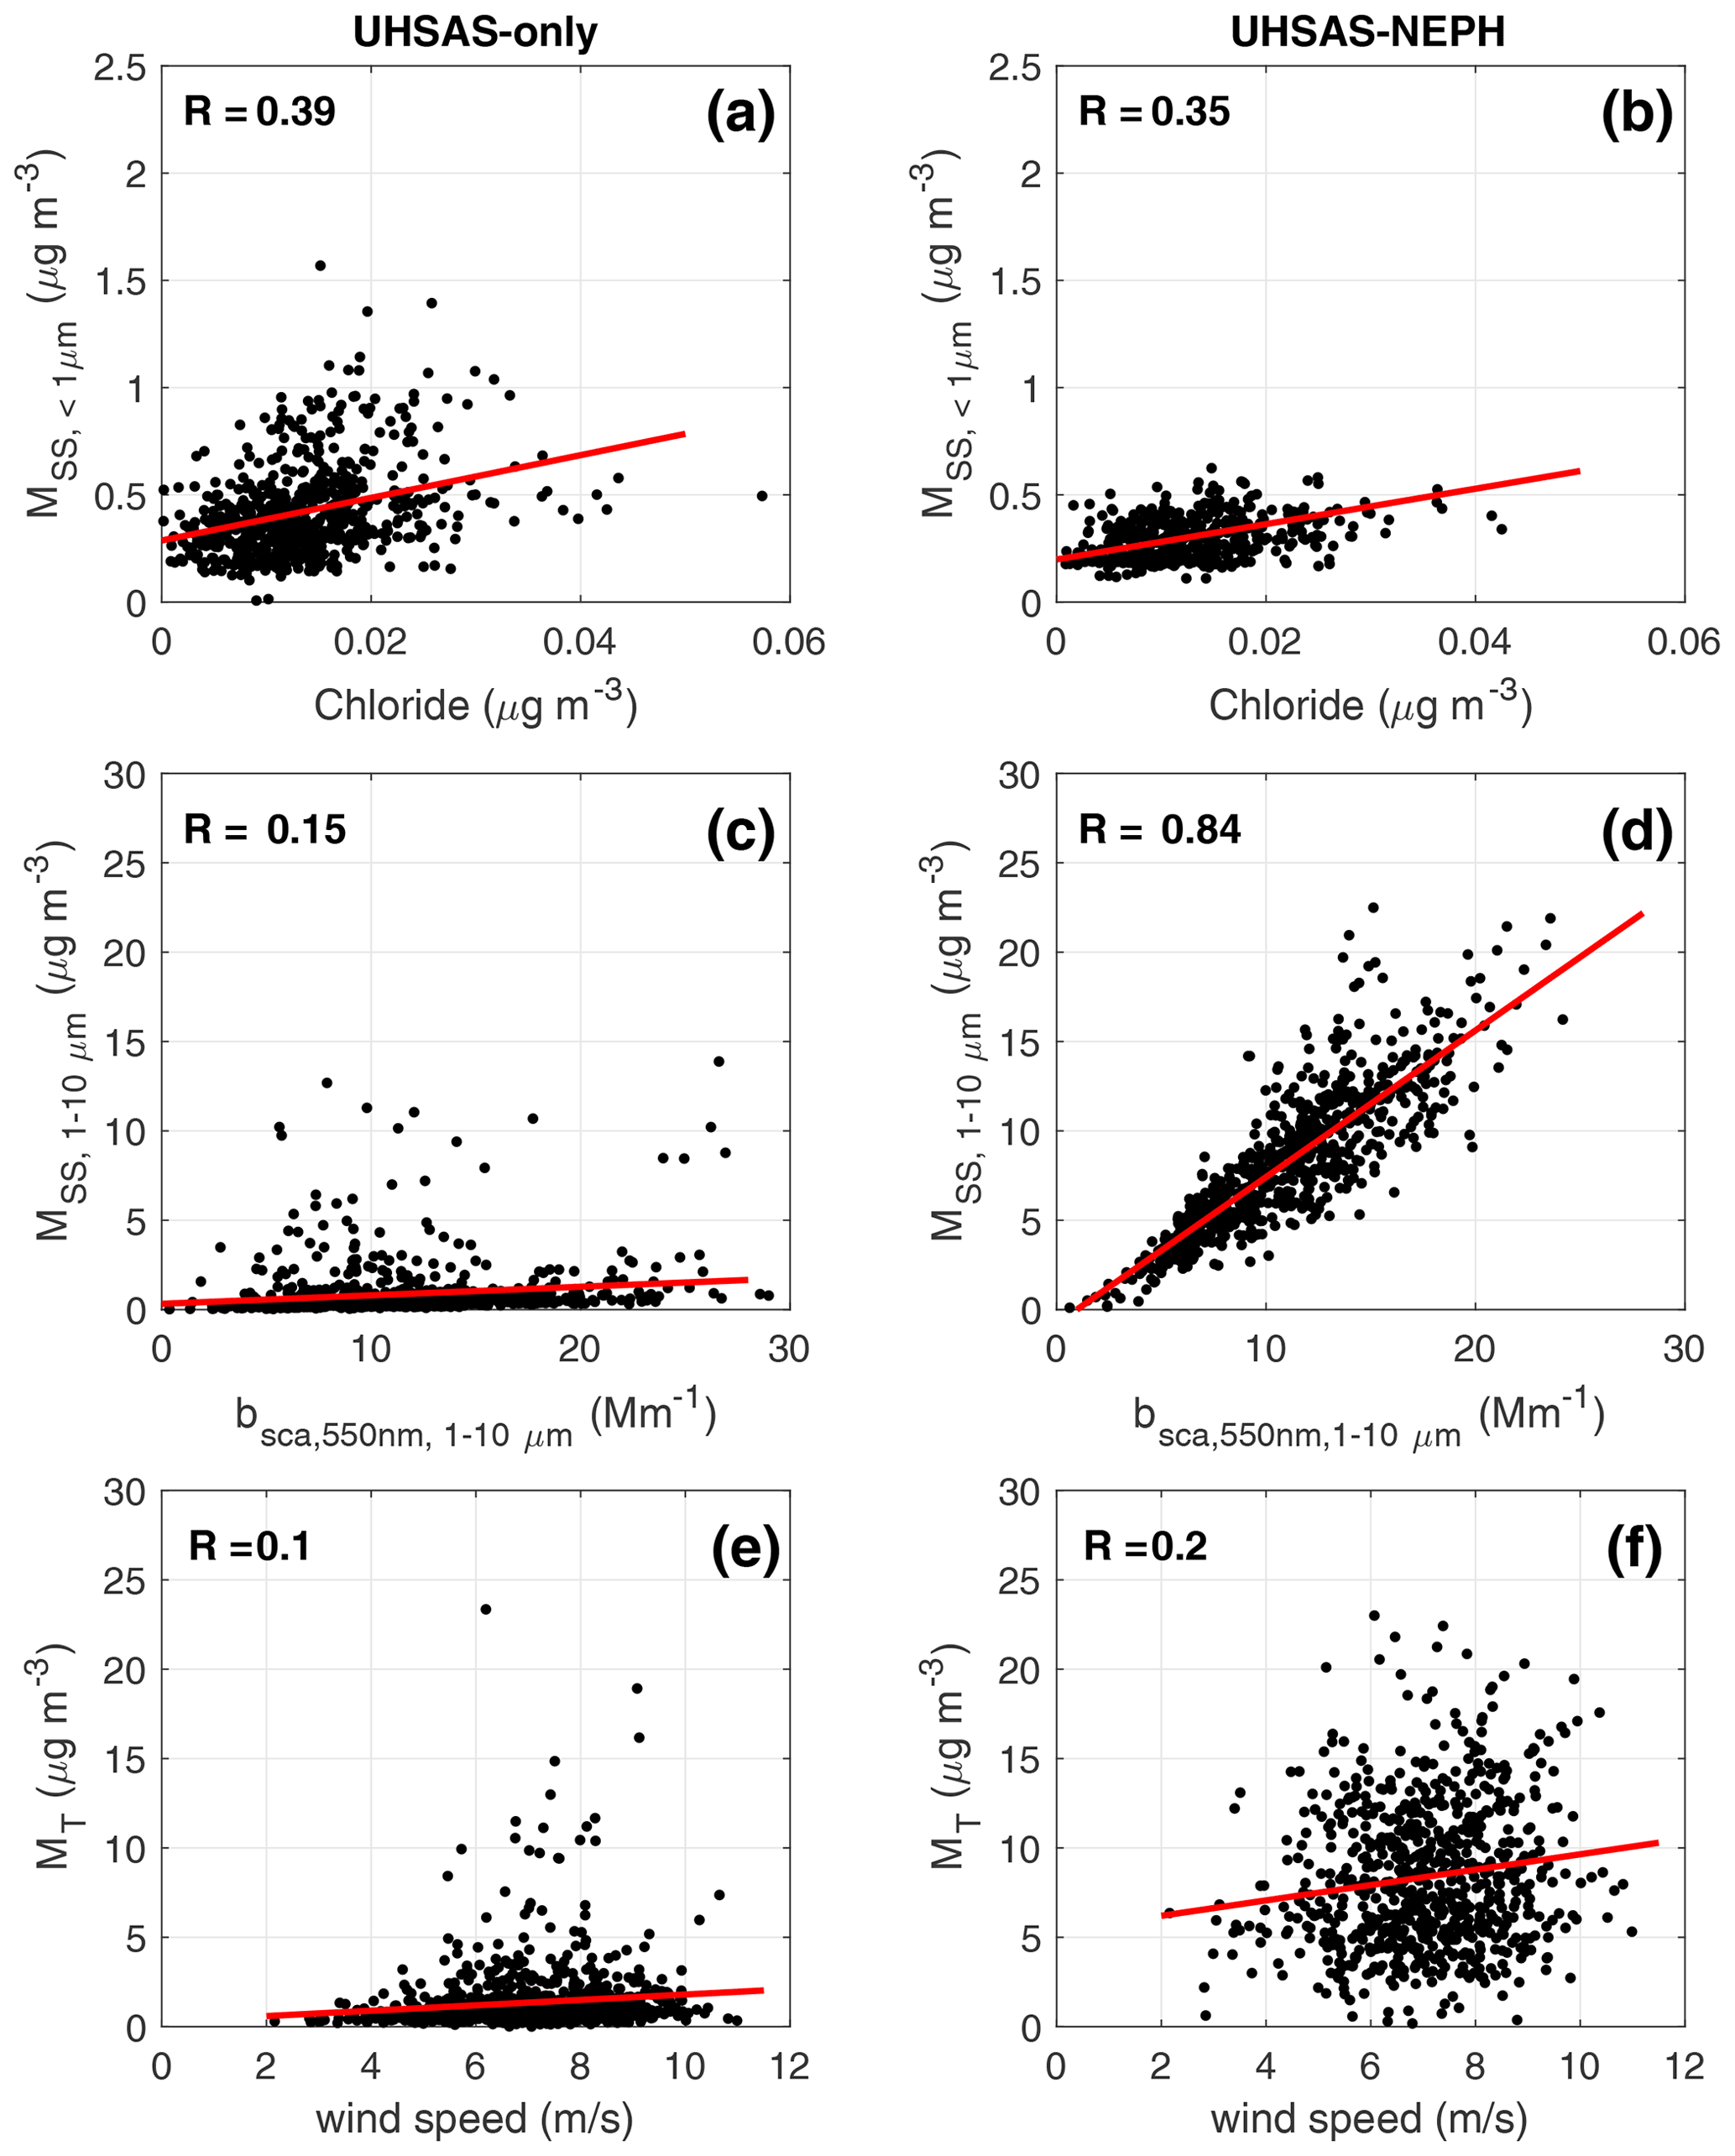
Figure 11Correlations of submicron sea spray mass (; µg m−3) with ACSM chloride (a, b), supermicron sea spray mass (; µg m−3) with measured supermicron scattering at 550 nm (c, d), and total sea spray mode mass (MT, µg m−3) with wind speed (e, f) for the UHSAS-only (left) and UHSAS-NEPH (right) methods. Linear regressions are symbolized by red lines and correlation coefficients are provided inside the panels.
Correlations between sea spray mass and the supermicron scattering coefficient were assessed for UHSAS-only and UHSAS-NEPH using retrievals that followed the criteria discussed in previous sections. Sea spray mass concentrations from UHSAS-only were consistently less than 2 µ g m−3 and were not able to quantitatively explain the variability in the measured supermicron scattering at 550 nm, as indicated by a very weak correlation (R=0.01, p<0.05; Fig. 11c). Although the stronger correlation between sea spray mass concentration and scattering obtained with UHSAS-NEPH (R=0.84, p<0.05, Fig. 11d) is an expected result given that the retrieved modes are constrained by scattering measurements, the lack of correlation from UHSAS-only emphasizes the importance of including supermicron particle size measurements to adequately characterize how optical properties are influenced by the sea spray size distribution.
The functional relationship between sea spray mass concentration and wind speed was evaluated using linear regression on the UHSAS-only and UHSAS-NEPH retrievals, which resulted in correlation coefficients of 0.1 and 0.2, respectively (p<0.05) (Fig. 11e, f). These correlations were lower than the values (in the range of 0.4 to 0.9) reported for numerous basins of the global ocean (Liu et al., 2021; Russell et al., 2010; Feng et al., 2017; Saliba et al., 2019). The calm and generally invariant wind speed observed during the LASIC background season (7.1 ± 1.4 m s−1) could explain the poor correlations for both methods, as the lack of dynamic range in wind speed at Ascension Island reduces the degree to which it explains the variability in concentration. The variability may instead be impacted by marine airmass transport of sea spray aerosol that is from source regions away from Ascension and reaches the island, rather than local wind conditions, which would not be resolved in the correlation (Grythe et al., 2014). The improved correlation of UHSAS-NEPH in comparison to UHSAS-only shows some added value of applying the supermicron scattering constraint to characterize the sea spray mode. Evaluation of the method using North Atlantic measurements (Sect. 4), where more dynamic wind conditions were observed, shows that the use of the supermicron scattering constraint could be comparable to the constraint from measured supermicron size distributions when estimating sea spray production from wind speed, as has been done in previous work (Saliba et al., 2019; Modini et al., 2015; Quinn et al., 2017). These results indicate that the incorporation of nephelometer scattering as a constraint for supermicron particle size provides a reasonable replacement for measured supermicron mass size distributions.
In this work, we have presented a new method that combines measured submicron size distributions and three-wavelength supermicron scattering to estimate observationally constrained sea spray modal properties at a remote marine site using a Mie inversion (UHSAS-NEPH). When the retrieval was limited to marine periods with low aerosol concentrations (CN3<400 cm−3), reasonable sea spray size distributions were obtained 88 % of the time. UHSAS-NEPH had larger fit residuals for higher ambient scattering variability ( Mm−1) and high relative humidity within the nephelometer (>60 %), which affected the consistency with which the Mie solutions could be constrained by scattering measurements and UHSAS submicron mass size distributions.
Retrieved sea spray modes ranged in mass mean diameter from 0.6 to 1.9 µm (1.47 ± 0.17 µm), modal width from 1.1 to 3.9 (2.4±0.3), and mass concentration from 0.18 to 23.0 µg m−3 (8.37 ± 4.1 µg m−3), which are consistent with other field-based measurements of the sea spray aerosol mode. By comparing retrieved modes to available tracers of sea salt, we have shown that estimates of supermicron size, such as from Mie inversion techniques, are necessary to resolve expected sea spray mass correlations with the scattering and wind speed at Ascension Island. The observed positive correlation of UHSAS-NEPH submicron sea spray mode mass with the measured submicron chloride signal (R=0.35) provided indirect chemical support of UHSAS-NEPH modes as sea spray. UHSAS-NEPH showed stronger correlations (R=0.84) to the supermicron scattering in comparison to fitting based only on the submicron size distribution accumulation mode (R=0.01), as expected from using the scattering measurement to constrain UHSAS-NEPH solutions. Incorporation of scattering measurements as an estimate of supermicron mass concentration improved the weak wind speed correlation (R=0.2) relative to using only the submicron size distribution (R=0.1) for sea spray retrieval. This result was consistent with sea spray production, even though the relationship was not as strong as that found in prior studies with greater dynamic ranges of wind speeds and available supermicron size distributions. Other environmental parameters such as sea surface temperature and its impacts on surface tension and kinematic viscosity could also be considered when assessing the relationship between sea spray production and modal properties relative to these retrieval methods at Ascension Island (Saliba et al., 2019; Liu et al., 2021; Salter et al., 2014), although salt measurements provided a more direct evaluation of the method when applied to North Atlantic observations (Sect. 4).
We have demonstrated that three-wavelength scattering measurements constrained with submicron size distributions yield sea spray mode estimates that are consistent with sea salt during clean marine periods of LASIC. Inclusion of additional scattering wavelengths and chemical measurements of particles would provide additional constraints on refractive index and scattering efficiency by allowing for temporally resolved adjustments in parameters used for Mie simulations. The retrieval procedure outlined in this work is a self-contained code with lookup table and is available to the broader scientific community. The future use of this combined approach based on the size distribution and scattering for other measured marine datasets that lack supermicron size distributions can expand the array of sea spray observations and improve upon the size, mass, and emission characterization of marine aerosol in climate models, further constraining the uncertainty in natural aerosol impacts on radiative forcing.
The sea spray mode retrieval algorithm and Mie theory scattering lookup table are available as a MATLAB function and MATLAB matrix file at the UCSD digital archives (https://doi.org/10.6075/J0GT5NCR, Dedrick et al., 2022a). The Mie codes used to simulate sea spray scattering are available at the same location.
All LASIC data are publicly available from the ARM (Atmospheric Radiation Measurement) data discovery (https://adc.arm.gov/discovery/; last access: 5 January 2022, ARM, 2017). Specific directions to each measurement dataset are provided as DOI references in Table 1. Sea spray modal parameters retrieved using LASIC and NAAMES measurements can be found at the UCSD digital archives (https://doi.org/10.6075/J0GT5NCR, Dedrick et al., 2022b). Scattering and chemical measurements from NAAMES 1 are available at https://saga.pmel.noaa.gov/data/download.php?cruise=NAAMES1 (last access: 18 April 2022, Bates and Quinn, 2015); SEMS size distributions from NAAMES 1 are available at https://doi.org/10.6075/J0736P3J (Russell et al., 2018).
The supplement related to this article is available online at: https://doi.org/10.5194/amt-15-4171-2022-supplement.
JLD, GS, and LMR developed the conceptualization and methodology of this work. Code development and formal analysis was led by JLD, GS, and ASW. LMR and DL provided supervision and funding acquisition. The original draft of this manuscript was written by JLD. All authors contributed to the review and editing of the manuscript.
The contact author has declared that neither they nor their co-authors have any competing interests.
Publisher’s note: Copernicus Publications remains neutral with regard to jurisdictional claims in published maps and institutional affiliations.
This article is part of the special issue “New observations and related modelling studies of the aerosol–cloud–climate system in the Southeast Atlantic and southern Africa regions (ACP/AMT inter-journal SI)”. It is not associated with a conference.
The authors graciously thank Paquita Zuidema, the LASIC science team, and ARM instrument mentors for their assistance in the interpretation of measured size distributions from SMPS and UHSAS and nephelometer scattering measurements collected during the LASIC campaign. We thank Timothy Bates and Patricia Quinn for NAAMES 1 scattering and composition measurements. We also extend our thanks to Roya Bahreini for productive discussions on ways to incorporate measurement uncertainties and variabilities into the Mie inversion methodology. The authors express thanks to Ian Eisenman for sharing computing resources that made the execution of Mie scattering simulations and sea spray retrieval possible. Two anonymous reviewers are thanked for their constructive comments that have helped improve the further development of the retrieval method and presentation of results in this study.
This research was supported by the Director, Office of Science, Office of Biological and Environmental Research, Climate and Environmental Sciences Division of the U.S. Department of Energy under Contract DE-SC0021045.
This paper was edited by Frank Eckardt and reviewed by two anonymous referees.
Anderson, T. and Ogren, J.: Determining aerosol radiative properties using the TSI 3563 integrating nephelometer, Aerosol Sci. Technol., 29, 57–69, https://doi.org/10.1080/02786829808965551, 1998.
Anderson, T., Covert, D., Marshall, S., Laucks, M., Charlson, R., Waggoner, A., Ogren, J., Caldow, R., Holm, R., Quant, F., Sem, G., Wiedensohler, A., Ahlquist, N., and Bates, T.: Performance characteristics of a high-sensitivity, three-wavelength, total scatter/backscatter nephelometer, J. Atmos. Ocean. Technol., 13, 967–986, https://doi.org/10.1175/1520-0426(1996)013<0967:PCOAHS>2.0.CO;2, 1996.
Atmospheric Radiation Measurement (ARM): Data Discovery. 2016-05-20 to 2017-10-31, ARM Mobile Facility (ASI) Ascension Island, South Atlantic Ocean; AMF1 (M1) [data set], https://adc.arm.gov/discovery/ (last access: 5 January 2022), 2017.
Ayash, T., Gong, S., and Jia, C.: Direct and indirect shortwave radiative effects of sea salt aerosols, J. Climate, 21, 3207–3220, https://doi.org/10.1175/2007JCLI2063.1, 2008.
Bates, T. S. and Quinn, P. K.: Project/Cruise: NAAMES1 – Nov. 2015, National Oceanic and Atmospheric Administration (NOAA) Pacific Marine Environment Laboratory (PMEL) [data set], https://saga.pmel.noaa.gov/data/download.php?cruise=NAAMES1 (last access: 18 April 2022), 2015.
Bates, T. S., Quinn, P. K., Frossard, A. A., Russell, L. M., Hakala, J., Petaja, T., Kulmala, M., Covert, D. S., Cappa, C. D., Li, S.-M., Hayden, K. L., Nuaaman, I., McLaren, R., Massoli, P., Canagaratna, M. R., Onasch, T. B., Sueper, D., Worsnop, D. R., and Keene, W. C.: Measurements of ocean derived aerosol off the coast of California, J. Geophys. Res.-Atmos., 117, D00V15, https://doi.org/10.1029/2012JD017588, 2012.
Behrenfeld, M., Moore, R., Hostetler, C., Graff, J., Gaube, P., Russell, L., Chen, G., Doney, S., Giovannoni, S., Liu, H., Proctor, C., Bolalios, L., Baetge, N., Davie-Martin, C., Westberry, T., Bates, T., Bell, T., Bidle, K., Boss, E., Brooks, S., Cairns, B., Carlson, C., Halsey, K., Harvey, E., Hu, C., Karp-Boss, L., Kleb, M., Menden-Deuer, S., Morison, F., Quinn, P., Scarino, A., Anderson, B., Chowdhary, J., Crosbie, E., Ferrare, R., Haire, J., Hu, Y., Janz, S., Redemann, J., Saltzman, E., Shook, M., Siegel, D., Wisthaler, A., Martine, M., and Ziemba, L.: The North Atlantic Aerosol and Marine Ecosystem Study (NAAMES): Science Motive and Mission Overview, Front. Mar. Sci., 6, 122, https://doi.org/10.3389/fmars.2019.00122, 2019.
Bi, L., Lin, W., Wang, Z., Tang, X., Zhang, X., and Yi, B.: Optical Modeling of Sea Salt Aerosols: The Effects of Nonsphericity and Inhomogeneity, J. Geophys. Res.-Atmos., 123, 543–558, https://doi.org/10.1002/2017JD027869, 2018.
Bluvshtein, N., Lin, P., Flores, J., Segev, L., Mazar, Y., Tas, E., Snider, G., Weagle, C., Brown, S., Laskin, A., and Rudich, Y.: Broadband optical properties of biomass-burning aerosol and identification of brown carbon chromophores, J. Geophys. Res.-Atmos., 122, 5441–5456, https://doi.org/10.1002/2016JD026230, 2017.
Bohren, C. F., Huffman, D. R., and KGaA, W. V. V. G. C. (Ed.): Absorption and Scattering of Light by Small Particles, John Wiley & Sons, Inc, 530 pp., https://doi.org/10.1002/9783527618156, 1998.
Brock, C. A., Williamson, C., Kupc, A., Froyd, K. D., Erdesz, F., Wagner, N., Richardson, M., Schwarz, J. P., Gao, R.-S., Katich, J. M., Campuzano-Jost, P., Nault, B. A., Schroder, J. C., Jimenez, J. L., Weinzierl, B., Dollner, M., Bui, T., and Murphy, D. M.: Aerosol size distributions during the Atmospheric Tomography Mission (ATom): methods, uncertainties, and data products, Atmos. Meas. Tech., 12, 3081–3099, https://doi.org/10.5194/amt-12-3081-2019, 2019.
Bullard, R.L., Uin, J., Springston, S.R., Kuang, C., and Smith, S: Aerosol Inlet Characterization Experiment Report, United States Department of Energy Atmospheric Radiation Measurement, https://doi.org/10.2172/1355300, 2017.
Cai, Y., Montague, D., Mooiweer-Bryan, W., and Deshler, T.: Performance characteristics of the ultra high sensitivity aerosol spectrometer for particles between 55 and 800 nm: Laboratory and field studies, J. Aerosol Sci., 39, 759–769, https://doi.org/10.1016/j.jaerosci.2008.04.007, 2008.
Chamaillard, K., Kleefeld, C., Jennings, S., Ceburnis, D., and O'Dowd, C.: Light scattering properties of sea-salt aerosol particles inferred from modeling studies and ground-based measurements, J. Quant. Spectrosc. Ra. Transf., 101, 498–511, https://doi.org/10.1016/j.jqsrt.2006.02.062, 2006.
Dedrick, J. L., Saliba, G., Williams, A. S., Russell, L. M., and Lubin, D.: Retrieved Sea Spray Aerosol Fitting Parameters from LASIC and NAAMES, https://doi.org/10.6075/J0GT5NCR, UC San Diego [data set], 2022a.
Dedrick, J. L., Saliba, G., Williams, A. S., Russell, L. M., and Lubin, D.: Sea Spray Mode Retrieval and Mie Scattering Codes, https://doi.org/10.6075/J0GT5NCR, UC San Diego [code], 2022b.
de Leeuw, G., Andreas, E., Anguelova, M., Fairall, C., Lewis, E., O'Dowd, C., Schulz, M., and Schwartz, S.: PRODUCTION FLUX OF SEA SPRAY AEROSOL, Rev. Geophys., 49, RG2001, https://doi.org/10.1029/2010RG000349, 2011.
Delene, D. and Ogren, J.: Variability of aerosol optical properties at four North American surface monitoring sites, J. Atmos. Sci., 59, 1135–1150, https://doi.org/10.1175/1520-0469(2002)059<1135:VOAOPA>2.0.CO;2, 2002.
DeMott, P., Hill, T., McCluskey, C., Prather, K., Collins, D., Sullivan, R., Ruppel, M., Mason, R., Irish, V., Lee, T., Hwang, C., Rhee, T., Snider, J., McMeeking, G., Dhaniyala, S., Lewis, E., Wentzell, J., Abbatt, J., Lee, C., Sultana, C., Ault, A., Axson, J., Martinez, M., Venero, I., Santos-Figueroa, G., Stokes, M., Deane, G., Mayol-Bracero, O., Grassian, V., Bertram, T., Bertram, A., Moffett, B., and Franc, G.: Sea spray aerosol as a unique source of ice nucleating particles, P. Natl. Acad. Sci. USA, 113, 5797–5803, https://doi.org/10.1073/pnas.1514034112, 2016.
Denjean, C., Cassola, F., Mazzino, A., Triquet, S., Chevaillier, S., Grand, N., Bourrianne, T., Momboisse, G., Sellegri, K., Schwarzenbock, A., Freney, E., Mallet, M., and Formenti, P.: Size distribution and optical properties of mineral dust aerosols transported in the western Mediterranean, Atmos. Chem. Phys., 16, 1081–1104, https://doi.org/10.5194/acp-16-1081-2016, 2016.
Denjean, C., Bourrianne, T., Burnet, F., Mallet, M., Maury, N., Colomb, A., Dominutti, P., Brito, J., Dupuy, R., Sellegri, K., Schwarzenboeck, A., Flamant, C., and Knippertz, P.: Overview of aerosol optical properties over southern West Africa from DACCIWA aircraft measurements, Atmos. Chem. Phys., 20, 4735–4756, https://doi.org/10.5194/acp-20-4735-2020, 2020.
Di Biagio, C., Formenti, P., Balkanski, Y., Caponi, L., Cazaunau, M., Pangui, E., Journet, E., Nowak, S., Andreae, M. O., Kandler, K., Saeed, T., Piketh, S., Seibert, D., Williams, E., and Doussin, J.-F.: Complex refractive indices and single-scattering albedo of global dust aerosols in the shortwave spectrum and relationship to size and iron content, Atmos. Chem. Phys., 19, 15503–15531, https://doi.org/10.5194/acp-19-15503-2019, 2019.
Feng, L., Shen, H., Zhu, Y., Gao, H., and Yao, X.: Insight into Generation and Evolution of Sea-Salt Aerosols from Field Measurements in Diversified Marine and Coastal Atmospheres, Sci. Rep., 7, 41260, https://doi.org/10.1038/srep41260, 2017.
Frie, A. and Bahreini, R.: Refractive index confidence explorer (RICE): A tool for propagating uncertainties through complex refractive index retrievals from aerosol particles, Aerosol Sci. Technol., 55, 703–717, https://doi.org/10.1080/02786826.2021.1895428, 2021.
Frossard, A., Russell, L., Burrows, S., Elliott, S., Bates, T., and Quinn, P.: Sources and composition of submicron organic mass in marine aerosol particles, J. Geophys. Res.-Atmos., 119, 12977–13003, https://doi.org/10.1002/2014JD021913, 2014.
Fuentes, E., Coe, H., Green, D., de Leeuw, G., and McFiggans, G.: On the impacts of phytoplankton-derived organic matter on the properties of the primary marine aerosol – Part 1: Source fluxes, Atmos. Chem. Phys., 10, 9295–9317, https://doi.org/10.5194/acp-10-9295-2010, 2010.
Gasso, S., Hegg, D., Covert, D., Collins, D., Noone, K., Ostrom, E., Schmid, B., Russell, P., Livingston, J., Durkee, P., and Jonsson, H.: Influence of humidity on the aerosol scattering coefficient and its effect on the upwelling radiance during ACE-2, Tellus B – Chem. Phys. Meteorol., 52, 546–567, https://doi.org/10.1034/j.1600-0889.2000.00055.x, 2000.
Gong, S.: A parameterization of sea-salt aerosol source function for sub- and super-micron particles, Global Biogeochem. Cy., 17, 1097, https://doi.org/10.1029/2003GB002079, 2003.
Grythe, H., Ström, J., Krejci, R., Quinn, P., and Stohl, A.: A review of sea-spray aerosol source functions using a large global set of sea salt aerosol concentration measurements, Atmos. Chem. Phys., 14, 1277–1297, https://doi.org/10.5194/acp-14-1277-2014, 2014.
Haywood, J., Francis, P., Osborne, S., Glew, M., Loeb, N., Highwood, E., Tanre, D., Myhre, G., Formenti, P., and Hirst, E.: Radiative properties and direct radiative effect of Saharan dust measured by the C-130 aircraft during SHADE: 1. Solar spectrum, J. Geophys. Res.-Atmos., 108, 8577, https://doi.org/10.1029/2002JD002687, 2003.
Horowitz, H., Holmes, C., Wright, A., Sherwen, T., Wang, X., Evans, M., Huang, J., Jaegle, L., Chen, Q., Zhai, S., and Alexander, B.: Effects of Sea Salt Aerosol Emissions for Marine Cloud Brightening on Atmospheric Chemistry: Implications for Radiative Forcing, Geophys. Res. Lett., 47, e2019GL085838, https://doi.org/10.1029/2019GL085838, 2020.
Howell, S. G., Freitag, S., Dobracki, A., Smirnow, N., and Sedlacek III, A. J.: Undersizing of aged African biomass burning aerosol by an ultra-high-sensitivity aerosol spectrometer, Atmos. Meas. Tech., 14, 7381–7404, https://doi.org/10.5194/amt-14-7381-2021, 2021.
Humphries, R. S., Keywood, M. D., Gribben, S., McRobert, I. M., Ward, J. P., Selleck, P., Taylor, S., Harnwell, J., Flynn, C., Kulkarni, G. R., Mace, G. G., Protat, A., Alexander, S. P., and McFarquhar, G.: Southern Ocean latitudinal gradients of cloud condensation nuclei, Atmos. Chem. Phys., 21, 12757–12782, https://doi.org/10.5194/acp-21-12757-2021, 2021.
Hussein, T., Dal Maso, M., Petaja, T., Koponen, I., Paatero, P., Aalto, P., Hameri, K., and Kulmala, M.: Evaluation of an automatic algorithm for fitting the particle number size distributions, Boreal Environ. Res., 10, 337–355, 2005.
Kassianov, E., Berg, L., Pekour, M., Barnard, J., Chand, D., Flynn, C., Ovchinnikov, M., Sedlacek, A., Schmid, B., Shilling, J., Tomlinson, J., and Fast, J.: Airborne Aerosol in Situ Measurements during TCAP: A Closure Study of Total Scattering, Atmosphere, 6, 1069–1101, https://doi.org/10.3390/atmos6081069, 2015.
Keene, W., Maring, H., Maben, J., Kieber, D., Pszenny, A., Dahl, E., Izaguirre, M., Davis, A., Long, M., Zhou, X., Smoydzin, L., and Sander, R.: Chemical and physical characteristics of nascent aerosols produced by bursting bubbles at a model air-sea interface, J. Geophys. Res.-Atmos., 112, D21202, https://doi.org/10.1029/2007JD008464, 2007.
Khlystov, A., Stanier, C., and Pandis, S.: An algorithm for combining electrical mobility and aerodynamic size distributions data when measuring ambient aerosol, Aerosol Sci. Technol., 38, 229–238, https://doi.org/10.1080/02786820390229543, 2004.
Kishcha, P., da Silva, A., Starobinets, B., Long, C., Kalashnikova, O., and Alpert, P.: Saharan dust as a causal factor of hemispheric asymmetry in aerosols and cloud cover over the tropical Atlantic Ocean, Int. J. Remote Sens., 36, 3423–3445, https://doi.org/10.1080/01431161.2015.1060646, 2015.
Kleefeld, C., O'Dowd, C., O'Reilly, S., Jennings, S., Aalto, P., Becker, E., Kunz, G., and de Leeuw, G.: Relative contribution of submicron and supermicron particles to aerosol light scattering in the marine boundary layer, J. Geophys. Res.-Atmos., 107, 8103, https://doi.org/10.1029/2000JD000262, 2002.
Kupc, A., Williamson, C., Wagner, N. L., Richardson, M., and Brock, C. A.: Modification, calibration, and performance of the Ultra-High Sensitivity Aerosol Spectrometer for particle size distribution and volatility measurements during the Atmospheric Tomography Mission (ATom) airborne campaign, Atmos. Meas. Tech., 11, 369–383, https://doi.org/10.5194/amt-11-369-2018, 2018.
Lewis, E. R. and Schwartz, S. E., and Union, A. G. (Ed.): Sea Salt Aerosol Production: Mechanisms, Methods, Measurements and Models, Geophysical Monograph Series, American Geophysical Union, 413 pp., https://doi.org/10.1029/GM152, 2004.
Liu, S., Liu, C., Froyd, K., Schill, G., Murphy, D., Bui, T., Dean-Day, J., Weinzierl, B., Dollner, M., Diskin, G., Chen, G., and Gao, R.: Sea spray aerosol concentration modulated by sea surface temperature, P. Natl. Acad. Sci. USA, 118, e2020583118, https://doi.org/10.1073/pnas.2020583118, 2021.
Lv, M., Wang, Z., Li, Z., Luo, T., Ferrare, R., Liu, D., Wu, D., Mao, J., Wan, B., Zhang, F., and Wang, Y.: Retrieval of Cloud Condensation Nuclei Number Concentration Profiles From Lidar Extinction and Backscatter Data, J. Geophys. Res.-Atmos., 123, 6082–6098, https://doi.org/10.1029/2017JD028102, 2018.
Ma, X., von Salzen, K., and Li, J.: Modelling sea salt aerosol and its direct and indirect effects on climate, Atmos. Chem. Phys., 8, 1311–1327, https://doi.org/10.5194/acp-8-1311-2008, 2008.
Mätzler, C: MATLAB Functions for Mie Scattering and Absorption, Institut für Angewandte Physik, Bern, Switzerland, Research Report No. 2002-08, 26 pp., 2002.
Mie, G.: Articles on the optical characteristics of turbid tubes, especially colloidal metal solutions, Ann. Phys., 25, 377–445, https://doi.org/10.1002/andp.19083300302, 1908.
Miller, M., Nitschke, K., Ackerman, T., Ferrell, W., Hickmon, N., Ivey, M., Turner, D., and Ellingson, R.: The ARM Mobile Facilities, Atmospheric Radiation Measurement (Arm) Program: the First 20 Years, 57, https://doi.org/10.1175/AMSMONOGRAPHS-D-15-0051.1, 2016.
Miller, R. M., McFarquhar, G. M., Rauber, R. M., O'Brien, J. R., Gupta, S., Segal-Rozenhaimer, M., Dobracki, A. N., Sedlacek, A. J., Burton, S. P., Howell, S. G., Freitag, S., and Dang, C.: Observations of supermicron-sized aerosols originating from biomass burning in southern Central Africa, Atmos. Chem. Phys., 21, 14815–14831, https://doi.org/10.5194/acp-21-14815-2021, 2021.
Ming, Y. and Russell, L.: Predicted hygroscopic growth of sea salt aerosol, J. Geophys. Res.-Atmos., 106, 28259–28274, https://doi.org/10.1029/2001JD000454, 2001.
Modini, R. L., Harris, B., and Ristovski, Z. D.: The organic fraction of bubble-generated, accumulation mode Sea Spray Aerosol (SSA), Atmos. Chem. Phys., 10, 2867–2877, https://doi.org/10.5194/acp-10-2867-2010, 2010.
Modini, R., Frossard, A., Ahlm, L., Russell, L., Corrigan, C., Roberts, G., Hawkins, L., Schroder, J., Bertram, A., Zhao, R., Lee, A., Abbatt, J., Lin, J., Nenes, A., Wang, Z., Wonaschutz, A., Sorooshian, A., Noone, K., Jonsson, H., Seinfeld, J., Toom-Sauntry, D., Macdonald, A., and Leaitch, W.: Primary marine aerosol-cloud interactions off the coast of California, J. Geophys. Res.-Atmos., 120, 4282–4303, https://doi.org/10.1002/2014JD022963, 2015.
Moore, R. H., Wiggins, E. B., Ahern, A. T., Zimmerman, S., Montgomery, L., Campuzano Jost, P., Robinson, C. E., Ziemba, L. D., Winstead, E. L., Anderson, B. E., Brock, C. A., Brown, M. D., Chen, G., Crosbie, E. C., Guo, H., Jimenez, J. L., Jordan, C. E., Lyu, M., Nault, B. A., Rothfuss, N. E., Sanchez, K. J., Schueneman, M., Shingler, T. J., Shook, M. A., Thornhill, K. L., Wagner, N. L., and Wang, J.: Sizing response of the Ultra-High Sensitivity Aerosol Spectrometer (UHSAS) and Laser Aerosol Spectrometer (LAS) to changes in submicron aerosol composition and refractive index, Atmos. Meas. Tech., 14, 4517–4542, https://doi.org/10.5194/amt-14-4517-2021, 2021.
Mulcahy, J., O'Dowd, C., and Jennings, S.: Aerosol optical depth in clean marine and continental northeast Atlantic air, J. Geophys. Res., 114, D20204, https://doi.org/10.1029/2009JD011992, 2009.
Murphy, D., Anderson, J., Quinn, P., McInnes, L., Brechtel, F., Kreidenweis, S., Middlebrook, A., Posfai, M., Thomson, D., and Buseck, P.: Influence of sea-salt on aerosol radiative properties in the Southern Ocean marine boundary layer, Nature, 392, 62–65, https://doi.org/10.1038/32138, 1998.
O'Dowd, C., Smith, M., Consterdine, I., and Lowe, J.: Marine aerosol, sea-salt, and the marine sulphur cycle: A short review, Atmos. Environ., 31, 73–80, https://doi.org/10.1016/S1352-2310(96)00106-9, 1997.
O'Dowd, C., Scannell, C., Mulcahy, J., and Jennings, S.: Wind Speed Influences on Marine Aerosol Optical Depth, Adv. Meteorol., 2010, 830846, https://doi.org/10.1155/2010/830846, 2010.
Ovadnevaite, J., Ceburnis, D., Canagaratna, M., Berresheim, H., Bialek, J., Martucci, G., Worsnop, D., and O'Dowd, C.: On the effect of wind speed on submicron sea salt mass concentrations and source fluxes, J. Geophys. Res.-Atmos., 117, D16201, https://doi.org/10.1029/2011JD017379, 2012.
Paulot, F., Paynter, D., Winton, M., Ginoux, P., Zhao, M., and Horowitz, L.: Revisiting the Impact of Sea Salt on Climate Sensitivity, Geophys. Res. Lett., 47, e2019GL085601, https://doi.org/10.1029/2019GL085601, 2020.
Pennypacker, S. and Wood, R.: A Case Study in Low Aerosol Number Concentrations Over the Eastern North Atlantic: Implications for Pristine Conditions in the Remote Marine Boundary Layer, J. Geophys. Res.-Atmos., 122, 12393–12415, https://doi.org/10.1002/2017JD027493, 2017.
Pennypacker, S., Diamond, M., and Wood, R.: Ultra-clean and smoky marine boundary layers frequently occur in the same season over the southeast Atlantic, Atmos. Chem. Phys., 20, 2341–2351, https://doi.org/10.5194/acp-20-2341-2020, 2020.
Prather, K., Bertram, T., Grassian, V., Deane, G., Stokes, M., DeMott, P., Aluwihare, L., Palenik, B., Azam, F., Seinfeld, J., Moffet, R., Molina, M., Cappa, C., Geiger, F., Roberts, G., Russell, L., Ault, A., Baltrusaitis, J., Collins, D., Corrigan, C., Cuadra-Rodriguez, L., Ebben, C., Forestieri, S., Guasco, T., Hersey, S., Kim, M., Lambert, W., Modini, R., Mui, W., Pedler, B., Ruppel, M., Ryder, O., Schoepp, N., Sullivan, R., and Zhao, D.: Bringing the ocean into the laboratory to probe the chemical complexity of sea spray aerosol, P. Natl. Acad. Sci. USA, 110, 7550–7555, https://doi.org/10.1073/pnas.1300262110, 2013.
Quinn, P., Coffman, D., Kapustin, V., Bates, T., and Covert, D.: Aerosol optical properties in the marine boundary layer during the First Aerosol Characterization Experiment (ACE 1) and the underlying chemical and physical aerosol properties, J. Geophys. Res.-Atmos., 103, 16547–16563, https://doi.org/10.1029/97JD02345, 1998.
Quinn, P., Coffman, D., Johnson, J., Upchurch, L., and Bates, T.: Small fraction of marine cloud condensation nuclei made up of sea spray aerosol, Nat. Geosci., 10, 674–+, https://doi.org/10.1038/NGEO3003, 2017.
Randles, C., Russell, L., and Ramaswamy, V.: Hygroscopic and optical properties of organic sea salt aerosol and consequences for climate forcing, Geophys. Res. Lett., 31, L16108, https://doi.org/10.1029/2004GL020628, 2004.
Russell, L., Huebert, B., Flagan, R., and Seinfeld, J.: Characterization of submicron aerosol size distributions from time-resolved measurements in the Atlantic Stratocumulus Transition Experiment Marine Aerosol and Gas Exchange, J. Geophys. Res.-Atmos., 101, 4469–4478, https://doi.org/10.1029/95JD01372, 1996a.
Russell, L., Zhang, S., Flagan, R., Seinfeld, J., Stolzenburg, M., and Caldow, R.: Radially classified aerosol detector for aircraft-based submicron aerosol measurements, J. Atmos. Ocean. Technol., 13, 598–609, https://doi.org/10.1175/1520-0426(1996)013<0598:RCADFA>2.0.CO;2, 1996b.
Russell, L., Hawkins, L., Frossard, A., Quinn, P., and Bates, T.: Carbohydrate-like composition of submicron atmospheric particles and their production from ocean bubble bursting, P. Natl. Acad. Sci. USA, 107, 6652–6657, https://doi.org/10.1073/pnas.0908905107, 2010.
Russell, L. M., Chen, C., Betha, R., Price, D. J., and Lewis, S.: NAAMES1 Research Cruise Aerosol Measurements (2015), in: Aerosol Particle Chemical and Physical Measurements on the 2015, 2016, 2017, and 2018 North Atlantic Aerosols and Marine Ecosystems Study (NAAMES) Research Cruises, UC San Diego Library Digital Collections, [data set], https://doi.org/10.6075/J0736P3J, 2018.
Saliba, G., Chen, C., Lewis, S., Russell, L., Rivellini, L., Lee, A., Quinn, P., Bates, T., Haentjens, N., Boss, E., Karp-Boss, L., Baetge, N., Carlson, C., and Behrenfeld, M.: Factors driving the seasonal and hourly variability of sea-spray aerosol number in the North Atlantic, P. Natl. Acad. Sci. USA, 116, 20309–20314, https://doi.org/10.1073/pnas.1907574116, 2019.
Saliba, G., Chen, C., Lewis, S., Russell, L., Quinn, P., Bates, T., Bell, T., Lawler, M., Saltzman, E., Sanchez, K., Moore, R., Shook, M., Rivellini, L., Lee, A., Baetge, N., Carlson, C., and Behrenfeld, M.: Seasonal Differences and Variability of Concentrations, Chemical Composition, and Cloud Condensation Nuclei of Marine Aerosol Over the North Atlantic, J. Geophys. Res.-Atmos., 125, e2020JD033145, https://doi.org/10.1029/2020JD033145, 2020.
Salter, M., Nilsson, E., Butcher, A., and Bilde, M.: On the seawater temperature dependence of the sea spray aerosol generated by a continuous plunging jet, J. Geophys. Res.-Atmos., 119, 9052–9072, https://doi.org/10.1002/2013JD021376, 2014.
Salter, M. E., Zieger, P., Acosta Navarro, J. C., Grythe, H., Kirkevåg, A., Rosati, B., Riipinen, I., and Nilsson, E. D.: An empirically derived inorganic sea spray source function incorporating sea surface temperature, Atmos. Chem. Phys., 15, 11047–11066, https://doi.org/10.5194/acp-15-11047-2015, 2015.
Sanchez, K. J., Roberts, G. C., Saliba, G., Russell, L. M., Twohy, C., Reeves, J. M., Humphries, R. S., Keywood, M. D., Ward, J. P., and McRobert, I. M.: Measurement report: Cloud processes and the transport of biological emissions affect southern ocean particle and cloud condensation nuclei concentrations, Atmos. Chem. Phys., 21, 3427–3446, https://doi.org/10.5194/acp-21-3427-2021, 2021.
Schmale, J., Sharma, S., Decesari, S., Pernov, J., Massling, A., Hansson, H.-C., von Salzen, K., Skov, H., Andrews, E., Quinn, P. K., Upchurch, L. M., Eleftheriadis, K., Traversi, R., Gilardoni, S., Mazzola, M., Laing, J., and Hopke, P.: Pan-Arctic seasonal cycles and long-term trends of aerosol properties from 10 observatories, Atmos. Chem. Phys., 22, 3067–3096, https://doi.org/10.5194/acp-22-3067-2022, 2022.
Seinfeld, J. H. and Pandis, S. N.: Atmospheric Chemistry and Physics: From Air Pollution to Climate Change, John Wiley & Sons, ISBN: 9780471720171, New York, USA, 2006.
Sellegri, K., O'Dowd, C., Yoon, Y., Jennings, S., and de Leeuw, G.: Surfactants and submicron sea spray generation, J. Geophys. Res.-Atmos., 111, D22215, https://doi.org/10.1029/2005JD006658, 2006.
Shen, Y., Virkkula, A., Ding, A., Luoma, K., Keskinen, H., Aalto, P. P., Chi, X., Qi, X., Nie, W., Huang, X., Petäjä, T., Kulmala, M., and Kerminen, V.-M.: Estimating cloud condensation nuclei number concentrations using aerosol optical properties: role of particle number size distribution and parameterization, Atmos. Chem. Phys., 19, 15483–15502, https://doi.org/10.5194/acp-19-15483-2019, 2019.
Swap, R., Garstang, M., Macko, S., Tyson, P., Maenhaut, W., Artaxo, P., Kallberg, P., and Talbot, R.: The long-range transport of southern African aerosols the tropical South Atlantic, J. Geophys. Res.-Atmos., 101, 23777–23791, https://doi.org/10.1029/95JD01049, 1996.
Tang, I., Tridico, A., and Fung, K.: Thermodynamic and optical properties of sea salt aerosols, J. Geophys. Res.-Atmos., 102, 23269–23275, https://doi.org/10.1029/97JD01806, 1997.
Testa, B., Hill, T., Marsden, N., Barry, K., Hume, C., Bian, Q., Uetake, J., Hare, H., Perkins, R., Mohler, O., Kreidenweis, S., and DeMott, P.: Ice Nucleating Particle Connections to Regional Argentinian Land Surface Emissions and Weather During the Cloud, Aerosol, and Complex Terrain Interactions Experiment, J. Geophys. Res.-Atmos., 126, e2021JD035186, https://doi.org/10.1029/2021JD035186, 2021.
Uin, J.: Ultra-High Sensitivity Aerosol Spectrometer (UHSAS) instrument handbook, United States Department of Energy Atmospheric Radiation Measurement, Technical Report No. DOE/SC-ARM-TR-163, 17 pp., https://doi.org/10.2172/1251410, 2016.
Uin, J., Aiken, A., Dubey, M., Kuang, C., Pekour, M., Salwen, C., Sedlacek, A., Senum, G., Smith, S., Wang, J., Watson, T., and Springston, S.: Atmospheric Radiation Measurement (ARM) Aerosol Observing Systems (AOS) for Surface-Based In Situ Atmospheric Aerosol and Trace Gas Measurements, J. Atmos. Ocean. Technol., 36, 2429–2447, https://doi.org/10.1175/JTECH-D-19-0077.1, 2019.
Veselovskii, I., Kolgotin, A., Griaznov, V., Muller, D., Wandinger, U., and Whiteman, D.: Inversion with regularization for the retrieval of tropospheric aerosol parameters from multiwavelength lidar sounding, Appl. Opt., 41, 3685–3699, https://doi.org/10.1364/AO.41.003685, 2002.
Virkkula, A., Teinilä, K., Hillamo, R., Kerminen, V.-M., Saarikoski, S., Aurela, M., Viidanoja, J., Paatero, J., Koponen, I. K., and Kulmala, M.: Chemical composition of boundary layer aerosol over the Atlantic Ocean and at an Antarctic site, Atmos. Chem. Phys., 6, 3407–3421, https://doi.org/10.5194/acp-6-3407-2006, 2006.
Viskari, T., Asmi, E., Virkkula, A., Kolmonen, P., Petäjä, T., and Järvinen, H.: Estimation of aerosol particle number distribution with Kalman Filtering – Part 2: Simultaneous use of DMPS, APS and nephelometer measurements, Atmos. Chem. Phys., 12, 11781–11793, https://doi.org/10.5194/acp-12-11781-2012, 2012.
von der Weiden, S.-L., Drewnick, F., and Borrmann, S.: Particle Loss Calculator – a new software tool for the assessment of the performance of aerosol inlet systems, Atmos. Meas. Tech., 2, 479–494, https://doi.org/10.5194/amt-2-479-2009, 2009.
Von Hoyningen-Huene, W., Dinter, T., Kokhanovsky, A., Burrows, J., Wendisch, M., Bierwirth, E., Muller, D., and Diouri, M.: Measurements of desert dust optical characteristics at Porte au Sahara during SAMUM, Tellus B – Chem. Phys. Meteorol., 61, 206–215, https://doi.org/10.1111/j.1600-0889.2008.00405.x, 2009.
Wang, W. and Rood, M.: Real refractive index: Dependence on relative humidity and solute composition with relevancy to atmospheric aerosol particles, J. Geophys. Res.-Atmos., 113, D23305, https://doi.org/10.1029/2008JD010165, 2008.
Yu, Q., Zhang, F., Li, J., and Zhang, J.: Analysis of sea-salt aerosol size distributions in radiative transfer, J. Aerosol Sci., 129, 71–86, https://doi.org/10.1016/j.jaerosci.2018.11.014, 2019.
Zábori, J., Matisāns, M., Krejci, R., Nilsson, E. D., and Ström, J.: Artificial primary marine aerosol production: a laboratory study with varying water temperature, salinity, and succinic acid concentration, Atmos. Chem. Phys., 12, 10709–10724, https://doi.org/10.5194/acp-12-10709-2012, 2012.
Zhang, J. and Zuidema, P.: The diurnal cycle of the smoky marine boundary layer observed during August in the remote southeast Atlantic, Atmos. Chem. Phys., 19, 14493–14516, https://doi.org/10.5194/acp-19-14493-2019, 2019.
Zheng, G., Wang, Y., Aiken, A. C., Gallo, F., Jensen, M. P., Kollias, P., Kuang, C., Luke, E., Springston, S., Uin, J., Wood, R., and Wang, J.: Marine boundary layer aerosol in the eastern North Atlantic: seasonal variations and key controlling processes, Atmos. Chem. Phys., 18, 17615–17635, https://doi.org/10.5194/acp-18-17615-2018, 2018.
Zheng, G., Wang, Y., Wood, R., Jensen, M., Kuang, C., McCoy, I., Matthews, A., Mei, F., Tomlinson, J., Shilling, J., Zawadowicz, M., Crosbie, E., Moore, R., Ziemba, L., Andreae, M., and Wang, J.: New particle formation in the remote marine boundary layer, Nat. Commun., 12, https://doi.org/10.1038/s41467-020-20773-1, 2021.
Zieger, P., Fierz-Schmidhauser, R., Gysel, M., Ström, J., Henne, S., Yttri, K. E., Baltensperger, U., and Weingartner, E.: Effects of relative humidity on aerosol light scattering in the Arctic, Atmos. Chem. Phys., 10, 3875–3890, https://doi.org/10.5194/acp-10-3875-2010, 2010.
Zuidema, P., Redemann, J., Haywood, J., Wood, R., Piketh, S., Hipondoka, M., and Formenti, P.: Smoke and Clouds above the Southeast Atlantic Upcoming Field Campaigns Probe Absorbing Aerosol's Impact on Climate, B. Am. Meteorol. Soc., 97, 1131–1135, https://doi.org/10.1175/BAMS-D-15-00082.1, 2016.
- Abstract
- Introduction
- Measurements
- Sea spray mode retrieval (UHSAS-NEPH)
- Evaluation of NEPH-constrained sea spray retrieval using supermicron size measurements
- Performance of UHSAS-NEPH retrievals
- Evaluation of UHSAS-NEPH sea spray retrieval during LASIC
- Concluding remarks
- Code availability
- Data availability
- Author contributions
- Competing interests
- Disclaimer
- Special issue statement
- Acknowledgements
- Financial support
- Review statement
- References
- Supplement