the Creative Commons Attribution 4.0 License.
the Creative Commons Attribution 4.0 License.
 | 12 Aug 2022
Correcting for filter-based aerosol light absorption biases at the Atmospheric Radiation Measurement program's Southern Great Plains site using photoacoustic measurements and machine learning
Joshin Kumar
Theo Paik
Nishit J. Shetty
Patrick Sheridan
Allison C. Aiken
Manvendra K. Dubey
Rajan K. Chakrabarty
Measurement of light absorption of solar radiation by aerosols is vital for assessing direct aerosol radiative forcing, which affects local and global climate. Low-cost and easy-to-operate filter-based instruments, such as the Particle Soot Absorption Photometer (PSAP), that collect aerosols on a filter and measure light attenuation through the filter are widely used to infer aerosol light absorption. However, filter-based absorption measurements are subject to artifacts that are difficult to quantify. These artifacts are associated with the presence of the filter medium and the complex interactions between the filter fibers and accumulated aerosols. Various correction algorithms have been introduced to correct for the filter-based absorption coefficient measurements toward predicting the particle-phase absorption coefficient (Babs). However, the inability of these algorithms to incorporate into their formulations the complex matrix of influencing parameters such as particle asymmetry parameter, particle size, and particle penetration depth results in prediction of particle-phase absorption coefficients with relatively low accuracy. The analytical forms of corrections also suffer from a lack of universal applicability: different corrections are required for rural and urban sites across the world. In this study, we analyzed and compared 3 months of high-time-resolution ambient aerosol absorption data collected synchronously using a three-wavelength photoacoustic absorption spectrometer (PASS) and PSAP. Both instruments were operated on the same sampling inlet at the Department of Energy's Atmospheric Radiation Measurement program's Southern Great Plains (SGP) user facility in Oklahoma. We implemented the two most commonly used analytical correction algorithms, namely, Virkkula (2010) and the average of Virkkula (2010) and Ogren (2010)–Bond et al. (1999) as well as a random forest regression (RFR) machine learning algorithm to predict Babs values from the PSAP's filter-based measurements. The predicted Babs was compared against the reference Babs measured by the PASS. The RFR algorithm performed the best by yielding the lowest root mean square error of prediction. The algorithm was trained using input datasets from the PSAP (transmission and uncorrected absorption coefficient), a co-located nephelometer (scattering coefficients), and the Aerosol Chemical Speciation Monitor (mass concentration of non-refractory aerosol particles). A revised form of the Virkkula (2010) algorithm suitable for the SGP site has been proposed; however, its performance yields approximately 2-fold errors when compared to the RFR algorithm. To generalize the accuracy and applicability of our proposed RFR algorithm, we trained and tested it on a dataset of laboratory measurements of combustion aerosols. Input variables to the algorithm included the aerosol number size distribution from the Scanning Mobility Particle Sizer, absorption coefficients from the filter-based Tricolor Absorption Photometer, and scattering coefficients from a multiwavelength nephelometer. The RFR algorithm predicted Babs values within 5 % of the reference Babs measured by the multiwavelength PASS during the laboratory experiments. Thus, we show that machine learning approaches offer a promising path to correct for biases in long-term filter-based absorption datasets and accurately quantify their variability and trends needed for robust radiative forcing determination.
- Article
(3708 KB) - Full-text XML
- BibTeX
- EndNote


Aerosols affect the climate through the absorption and scattering of radiation, which has been the subject of intensive ongoing research (Brown et al., 2021). Aerosols are one of the most significant sources of uncertainty in climate model predictions of radiative forcing (Masson-Delmotte et al., 2021). The US Department of Energy's Atmospheric Radiation Measurement (ARM) program was established in 1990 to collect measurements to better understand processes that affect atmospheric radiation in climate models (Stokes and Schwartz, 1994). The ARM program currently operates three heavily instrumented fixed-location sites to gather atmospheric data: Southern Great Plains (SGP), North Slope of Alaska (NSA), and Eastern North Atlantic (ENA). The SGP site is the world's most comprehensive climate research facility, with extensive in situ and remote sensing instrument clusters deployed over about 143 000 km2 centered near Lamont, Oklahoma, USA. Instruments at the SGP site measure radiation, cloud properties, and other meteorological quantities (Sisterson et al., 2016). Light absorption by aerosols is measured at the site using a three-wavelength (467, 530, and 660 nm) Particle Soot Absorption Photometer (PSAP; Radiance Research Inc.) (Sheridan et al., 2001) and a three-wavelength (405, 532, and 781 nm) Photoacoustic Absorption Spectrometer (PASS; Droplet Measurement Technologies Inc.), which is an extension of the single-wavelength instrument that was deployed at the island of Jeju, South Korea (Flowers et al., 2010), and in Utqiagvik, Alaska (Myers et al., 2021). Aerosol light scattering is measured using a three-wavelength (450, 550, and 700 nm) nephelometer (TSI model 3563).
The PSAP instrument infers aerosol light absorption using a low-cost filter-based method by measuring transmittance through aerosol particles collected on a filter substrate. The instruments based on this method, such as PSAP, facilitate semi-continuous sampling of particles and produce time-averaged bulk absorption measurements (Pandey et al., 2016). Filter-based aerosol light absorption measurement instruments such as PSAP are widely used due to their low cost and operational ease, even though their accuracy suffers from “unquantifiable artifacts” such as multiple scattering, which can overestimate absorption (Bond et al., 1999; Clarke, 1982; Gorbunov et al., 2002), aerosol overloading on the filter, which can underestimate absorption (Arnott et al., 1999; Weingartner et al., 2003), and the changed morphology of the deposited aerosol on the filter (Subramanian et al., 2007).
The PASS instrument was deployed at the SGP site in January 2009, followed by its decommission in October 2015. The PASS is a contact-free method to measure the particle-phase aerosol light absorption coefficient (Babs). The working principle of the PASS is described in detail in Arnott et al. (1999). Briefly, photons from a modulated laser beam are absorbed by light-absorbing aerosol particles. The absorbed energy is transmitted as heat to the surrounding air, which results in modulated pressure waves that are detected as sound waves by a microphone. The microphone can be calibrated to determine light absorption by the particles. The measurements from the PASS are highly accurate, but they have low sensitivity (1 h average signal–noise ratio ∼ 0.2 Mm−1 at SGP), and long-term deployments can be expensive. PASS also has issues with liquid and/or multiphase particles, as some of the laser energy goes into the phase change associated with heating the particles rather than producing acoustic waves.
Various correction algorithms (Bond et al., 1999; Virkkula et al., 2005; Li et al., 2020; Müller et al., 2014; Nakayama et al., 2010), based on a general analytical equation form, have been developed and used in climate research facilities across the world. The general form of the various previously developed correction algorithms for the PSAP is summarized in Eq. (2), where f is some function that varies between different correction approaches and C0 is a constant representing a fraction of total light scattered by the particles collected on the filter. The absorption coefficient reported by the PSAP (Babs_PSAP) is auto-corrected using an empirical correction f(Tr) applied by the instrument firmware to correct for magnification of the aerosol absorption by the filter medium and nonlinearities in the response as the filter is loaded (Bond et al., 1999; Ogren et al., 2010). The DOE's PSAP Instrument Handbook (Springston, 2018) reports the filter area (APSAP=17.81 mm2) and parameters used for f(Tr) as shown in Eq. (1). Therefore, to obtain the uncorrected absorption coefficients from the PSAP, we undo the filter-loading correction with the same parameters as mentioned in the handbook.
These algorithms, however, are non-universal in applicability and hence limited in accuracy because the fitting parameters of the transmission functions calculated in such algorithms are based on datasets of laboratory-generated aerosols which may or may not represent the diverse aerosol types in various parts of the world (Collaud Coen et al., 2010; Zuidema et al., 2018). The large variation in results of correction creates a need for a universal systematic approach for correcting filter-based measurements that is more accurate than previously stated algorithms.
In this study, we used 3 months of high-resolution ambient data collected by the PASS and PSAP at ARM's SGP site. We corrected for filter-based absorption measurements using Virkkula (2010) (referenced as “unrevised Virkkula” going forward), the Virkkula equation with revised coefficients for the SGP site (referenced as “revised Virkkula”), the average of unrevised Virkkula and Ogren (2010) modified Bond et al. (1999) correction (referenced as the “Average”), and random forest regression (RFR), which is a supervised ensemble machine learning (ML) algorithm used for a wide range of classification and regression predictive problems (Kumar and Sahu, 2021). We provide an intercomparison of the performances of these algorithms and identify the best correction algorithm suitable for the SGP site.
2.1 Ambient data from the SGP observatory
This study used ambient ground-based aerosol data from the SGP site corresponding to a 3-month period from 27 June to 25 September 2015. High-resolution data from the PASS, PSAP, nephelometer, and Aerodyne's Aerosol Chemical Speciation Monitor (ACSM) with sampling intervals of 2 s, 1 min, 1 min, and 30 min, respectively, were used. Figure A1 provides the descriptive statistics of the raw data obtained from the three optical instruments. Figure A2 presents the non-refractory aerosol composition data collected by the ACSM over the study period. We observed that organic aerosols consist of more than 60 % of the mass concentration, followed by sulfates, ammonium, and nitrate. The summary of elemental carbon (EC) concentration, measured by a Sunset Model-4 Semi-Continuous OC-EC instrument from 3 June to 27 November 2013, is shown in Fig. A3. The average EC and organic carbon (OC) concentrations were found to be 0.174 ± 0.123 and 2.267 ± 1.400 µg m−3, respectively. Figure A4 illustrates the time series of the uncorrected aerosol absorption data as derived from the PSAP (Babs_uncorrected_PSAP) and PASS (Babs) instruments. We observed that the average particle-phase Babs at the SGP site ranged from 0 to 8 Mm−1 for most times, with an average Babs of 1.36 Mm−1 across all three wavelengths. A detailed description of the working of each of the instruments at the SGP site can be found in the ARM and SGP aerosol-observing system Instrument Handbook (Uin and Smith, 2020).
Previous studies have measured non-refractive submicrometer aerosol concentration and the composition of its organic and inorganic constituents at the SGP site (Parworth et al., 2015; Liu et al., 2021). Across all studies, the highest mass concentration at the SGP site occurs in the winter and decreases from spring to fall. The nitrates dominate during the winters, while OC, accounting for more than 60 % of total non-refractory particulate matter mass concentrations, dominates for the rest of the year. The PSAP-derived Babs and aerosol scattering coefficient (Bscat) at 550 nm ranged from 0 to 10 and 0 to 50 Mm−1 from 2010 to 2013, respectively (Sherman et al., 2015). Since the site is rural, long-term transport aerosols (such as mineral dust, absorbing organic aerosol, OA, and secondary organic aerosol, SOA) may affect local aerosol properties (Andrews et al., 2019).
In this study, the rationale behind choosing a short-duration time frame in 2015 was because of the availability of quality-controlled PASS datasets. The 532 nm laser module in the PASS underwent an upgrade at the site in early 2015. From Figs. A1a, d and A4, however, we suspect that either the newly installed 532 nm PASS laser could be slightly overestimating absorption or that the old 405 and 781 nm lasers could be slightly underestimating absorption compared to their true values. We preprocessed the data into the following three broad steps for each instrument; first, we only included those timestamps where data were valid across all instruments without incorrect (i.e., negative absorption coefficients), suspect (i.e., PASS measurements > 15 Mm−1 at the SGP site), and missing values (i.e., missing timestamps corresponding to parallel instrument measurements). Second, we smoothed the data from all instruments into 1 h averages. Third, to compare the measurements from different instruments at the same wavelengths, we extrapolate the PASS Babs and nephelometer Bscat to PSAP's operating wavelengths (467, 530, and 660 nm) using the absorption Ångström exponent (AAE) and scattering Ångström exponent (SAE). The Ångström exponent is an aerosol optical parameter used for aerosol characterization and to extrapolate a given particle-phase aerosol absorption or scattering coefficient to any wavelength of interest. The AAE and SAE values were inferred using Eqs. (3) and (4) (Liu et al., 2018). Statistics of AAE and SAE values from SGP's PASS and nephelometer data are summarized in Figure A1. Since the standard deviations of AAE values for the SGP data were significantly high, time-dependent AAE and SAE values were used to extrapolate the particle-phase absorption and scattering coefficients to the PSAP's operating wavelengths. The parameters Babs1 and Babs2 in Eqs. (3) and (4) are the absorption coefficients at wavelengths λ1 and λ2.
The extrapolation of filter-based measurements to other wavelengths using an AAE is less accurate than the extrapolation of PASS measurements because filter-based measurements are inherently biased due to artifacts, and their extrapolation to other wavelengths further adds to the error.
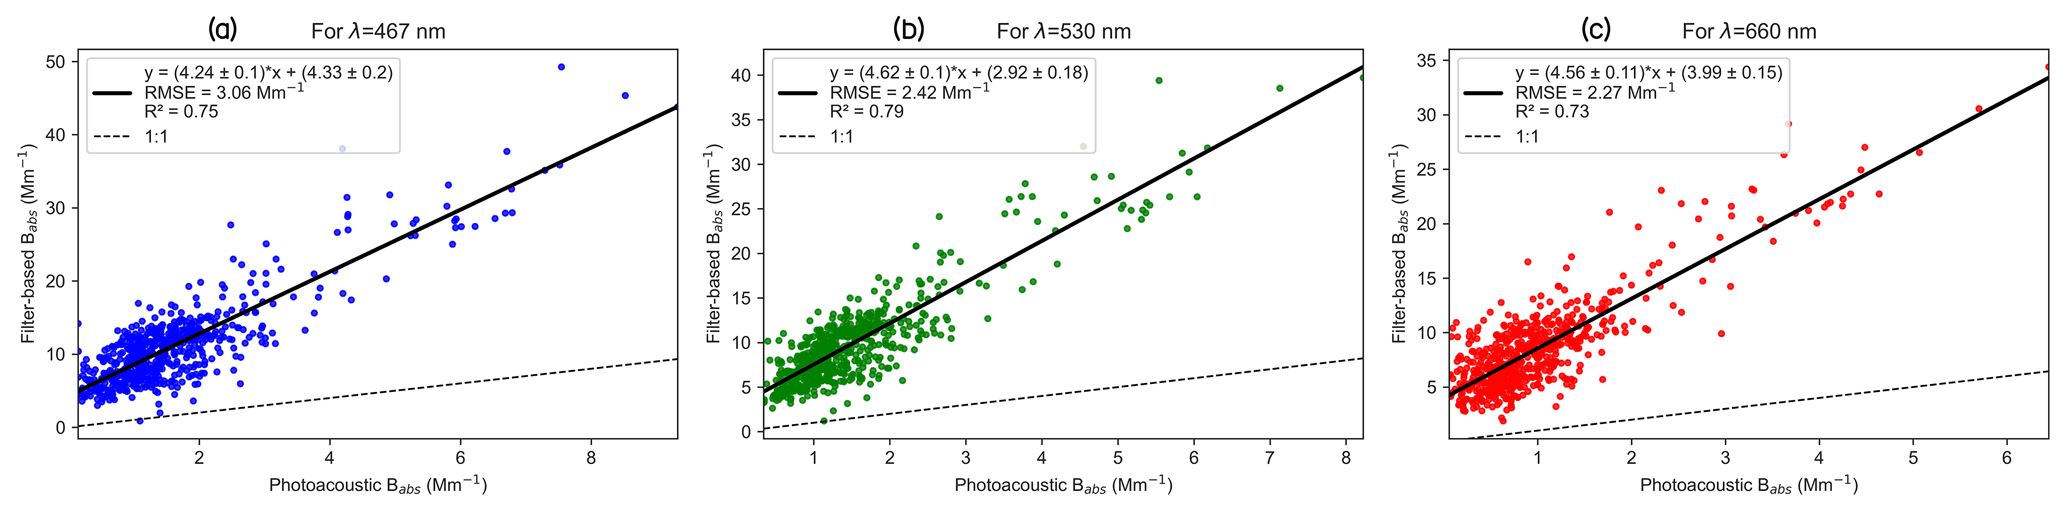
Figure 1Scatterplot of absorption coefficients from the PSAP and extrapolated PASS measurements corresponding to the (a) 467 nm, (b) 530 nm, and (c) 660 nm wavelengths at the SGP site.
Figure 1 presents the comparison of uncorrected filter-based absorption coefficients to the calibrated, particle-phase Babs measured using the PASS. We observed that the uncorrected filter-based absorption coefficients are more than 4 times greater than the particle-phase Babs measured by the PASS across all the wavelengths. Hence, at least for the SGP site, if we choose not to apply any correction algorithm to the filter-based absorption data, we can use a factor of 4 to obtain the Babs with a wavelength-averaged RMSE (root mean square error) of 2.58 ± 0.11 Mm−1. This overestimation of the filter-based aerosol light absorption measurements is due to the scattering of light away from the forward direction by the filter fibers and due to the changed morphology of the deposited aerosol on the filter (Subramanian et al., 2007; Bond et al., 1999; Clarke, 1982; Gorbunov et al., 2002).
2.2 Correction algorithms
In order to correct for these “difficult-to-quantify” artifacts associated with the filter-based measurement of the aerosol absorption, various correction algorithms (Bond et al., 1999; Ogren, 2010; Virkkula et al., 2005; Li et al., 2020) have been introduced to predict the particle-phase absorption coefficient (Babs) using filter-based absorption coefficient measurements. Ogren (2010) modified Bond et al. (1999) and Virkkula (2010) correction algorithms are widely used in global atmosphere monitoring networks such as the Global Atmosphere Watch Programme (GAW) and the NOAA Federated Aerosol Network (Andrews et al., 2019). In this study, we only discuss the commonly used correction algorithms on the ground sites and compared them to the proposed ML-based filter correction algorithm.
2.2.1 Virkkula (2010) with unrevised parameters
Virkkula et al. (2005) developed an analytical correction equation that iteratively calculates Babs from filter-based measurements. The transmittance correction function in the Virkkula equation was a multivariate function of the natural logarithm of transmission and single scattering albedo (SSA) as shown in Eq. (6). The parameters in the Virkkula equation h0, h1, k0, and k1 vary with wavelength. Virkkula (2010) recalculated these parameters by correcting for flowmeter calibration in Eq. (6).
The parameters in Eq. (6) represent the particle-phase absorption coefficient (Babs), the uncorrected absorption coefficient derived from the PSAP (Babs_uncorrected_PSAP), transmission values from the PSAP (Tr), the particle-phase scattering coefficient from the nephelometer (Bscat), SSA = ω0 = , and Virkkula parameters/constants (k0, k1, h0, h1, s).
Using these parameters of the Virkkula equation, we calculated the Babs values from the uncorrected filter-based absorption coefficients. Following the procedure mentioned in Virkkula (2005), due to the unknown values of SSA, the Virkkula equation was iteratively solved for Babs. Babs was first calculated using Eq. (5) and then was used to compute the initial guess for ω0. Next, this value of ω0 was used in Eq. (6) to compute a more accurate value of Babs, and this procedure was repeated until Babs values converged.
2.2.2 Virkkula (2010) with revised parameters for the SGP site
Using the reference measurements of Babs from the PASS at the SGP site, we refitted the parameters in the Virkkula equation (h0, h1, k0, k1) to obtain revised parameters. The fitting was implemented using the “curvefit” function from the “SciPy” Python library, which uses nonlinear least squares to fit a functional equation form to given data. After fitting of optimized parameters of the Virkkula equation, we solved for the particle-phase absorption coefficients using the filter-based absorption coefficients. It is important to note that the calculated revised Virkkula parameters may only be valid for the SGP site because these revised parameters were computed using the absorption data from the PASS and PSAP at the SGP site.
2.2.3 Ogren (2010)–Bond et al. (1999) correction and its average with unrevised Virkkula (2010)
Bond et al. (1999) published a correction scheme for the PSAP which was updated by Ogren (2010). The Ogren (2010) modified Bond et al. (1999) correction is applied using Eq. (7) to obtain the corrected Babs value. Another correction technique that is often used by the DOE ARM community involves computing a simple arithmetic mean of Virkkula (2010) correction with unrevised parameters and the Ogren (2010)–Bond et al. (1999) correction to obtain an average corrected Babs value as shown in Eq. (8) (Flynn et al., 2020; Zuidema et al., 2018). For brevity, going forward we will refer to this correction scheme as the “average” correction algorithm.
2.2.4 Random forest regression model
RFR is an ensemble-supervised ML algorithm used for a wide range of classification and regression predictive problems (Kumar and Sahu, 2021). Random forest involves constructing a large number of decision trees with each decision tree fitted on a different subset of the training dataset (also called bagging) in addition to selecting a random subset of input variables at each split point in the construction of trees. Random forest is known to reduce overfitting of data in decision trees and to provide accurate predictions (Biau, 2012; Breiman, 2001). The three most essential hyperparameters to tune the random forest are (1) a number of random input variables to consider at each split point, (2) the depth of the decision trees, and (3) the number of decision trees in the forest. The core concept behind the random forest is that it aggregates the results of many trained decision trees empirically and outputs the most optimal result.
ML algorithms perform very well on the trained dataset; therefore, it is crucial to test their performance on unseen or untrained data. We split the SGP dataset into training and testing sets in the ratio of 70 : 30. The training set was used to train the RFR model, and then the testing set was used to evaluate the model's performance on the new input data that the model had not encountered before. For the SGP data, we trained the RFR model with an uncorrected absorption coefficient derived from the PSAP (Babs_uncorrected_PSAP), PSAP transmission (Tr), scattering coefficient (Bscat) from the nephelometer, and total mass concentration of non-refractory aerosol components obtained by the ACSM as input variables. The predicted Babs is the output variable and is compared against the reference Babs measured by the PASS. The values of the hyperparameters used for the construction of the RFR model are the number of features to consider while looking for the best split = 5, the number of trees = 100, and the max_depth such that nodes were expanded until all leaves were pure or until all leaves contained fewer than two samples.
The RFR algorithm is entirely a data-driven approach to correct filter-based measurements. The algorithm was trained on input–output variables, which were measured by different instruments installed at the site. The instrument detection limits, precision, and accuracy play a significant role in the training and predicting ability of the RFR algorithm. In order to gain highly accurate predictions from the RFR algorithm on the test dataset (data that are not used while training but that are used to check the accuracy of the algorithm on unseen data), the algorithm requires good-quality training data and with a reasonably large number of samples/instances in the training dataset to ensure that the algorithm's accuracy on the unseen test dataset is not limited by the number of samples of the training dataset on which it is trained. Figure A5 presents the general workflow of ML-based correction models developed in this study.
3.1 Application of the Virkkula (2010) algorithm with unrevised parameters
The parameters mentioned in Virkkula (2010) as shown in Table 1 were directly used to iteratively solve for Babs using Eq. (6). Figure 2 shows comparisons between the unrevised Virkkula calculated Babs and reference Babs measured using the PASS. We observed the %RMSE values (calculated over all three wavelengths as ), which show that the percentage of uncertainty for unrevised Virkkula in the calculation or predictions of Babs is ∼ 376 %, and R2 values are negative for all three wavelengths, which suggests that the unrevised Virkkula algorithm performs worse than a constant prediction of the mean Babs value.
Table 1Unrevised parameters as mentioned in Virkkula (2010) to be used in the Virkkula algorithm (i.e., Eq. 6).
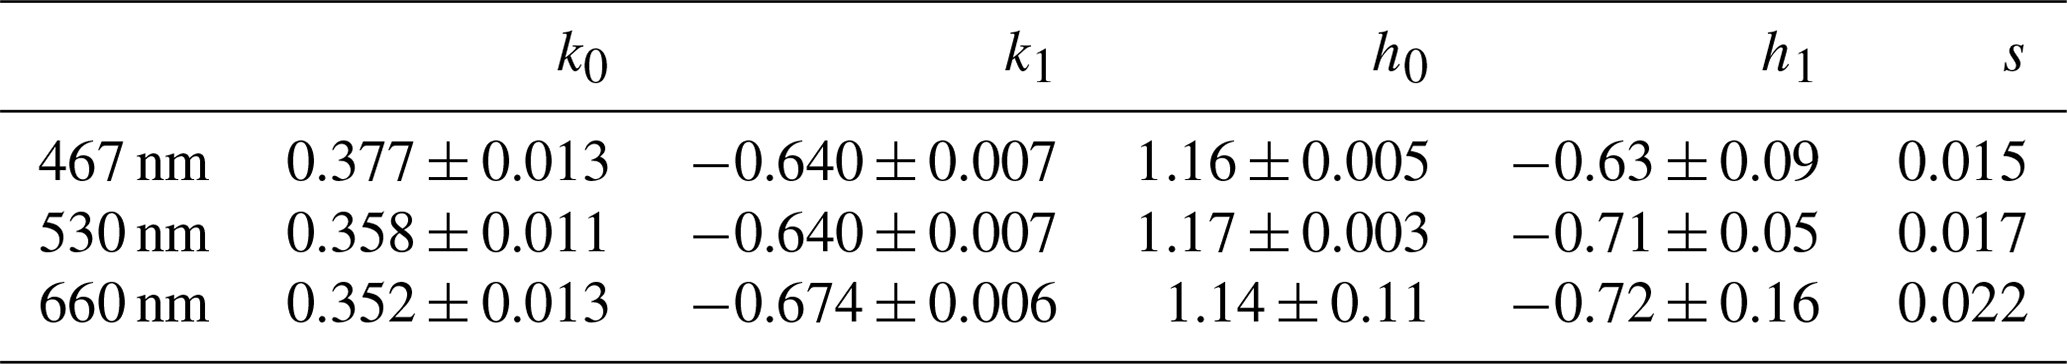
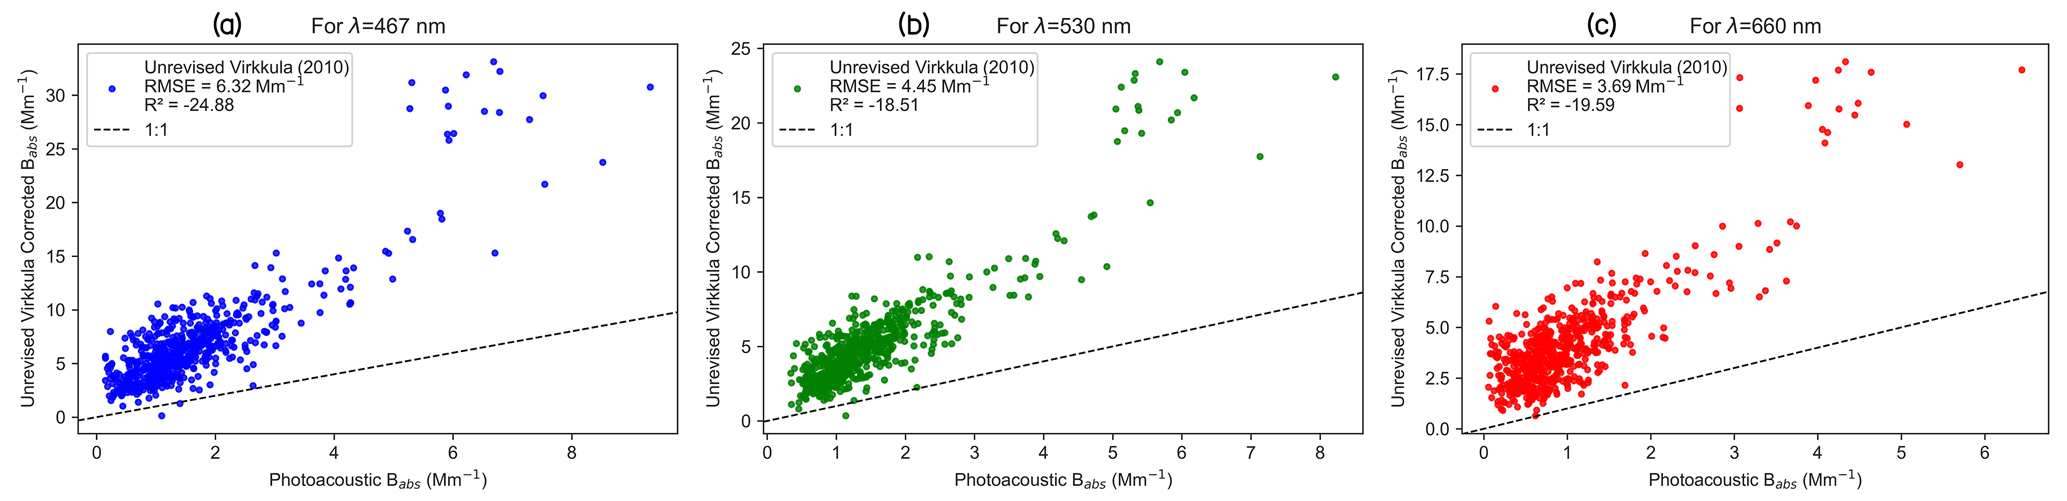
Figure 2Comparison between PSAP absorption coefficients, corrected for using the Virkkula (2010) algorithm with unrevised coefficients and the reference PASS absorption coefficients measured at the SGP site corresponding to the (a) 467 nm, (b) 530 nm, and (c) 660 nm wavelengths.
The variance in Babs calculated using unrevised Virkkula is large enough to undermine the algorithm's applicability without revising the parameters/coefficients. Since fitting parameters in Virkkula (2010) were based on experimental burn data of kerosene soot and “white” ammonium sulfate aerosol, those parameters cannot be universally applied to different types of ambient aerosols (Collaud Coen et al., 2010; Zuidema et al., 2018).
3.2 Application of the Virkkula (2010) algorithm with revised parameters for the SGP site
To overcome the imprecision of the unrevised Virkkula algorithm, we fitted the Virkkula equation to the SGP data to obtain revised Virkkula parameters (i.e., k0, k1, h0, h1) shown in Table 2. The same values of s were used as mentioned in Virkkula (2010) because parameter s represents a fraction of total light scattered, which is experimentally determined by fitting to ammonium sulfate experiments (Virkkula et al., 2005). The Virkkula equation with these newly computed parameters was then used to iteratively solve for Babs using Eq. (6). Figure 3 presents a comparison of filter-based absorption corrected using the revised Virkkula algorithm and reference Babs measured using the PASS. We observed that the Virkkula algorithm performed comparatively well with revised parameters because the RMSE values decreased and R2 values increased in comparison to unrevised Virkkula evaluation metrics (i.e., RMSE, %RMSE, and R2). The results of Figs. 2 and 3 clearly imply that it is essential to revise the parameters before implementing the Virkkula equation for predicting Babs at each site. Since the Virkkula equation does not undertake the seasonal, source, and particle size distributions as inputs, the Virkkula parameters are subject to change with these external factors too.
Table 2Revised parameters for the Virkkula equation computed using the SGP dataset.
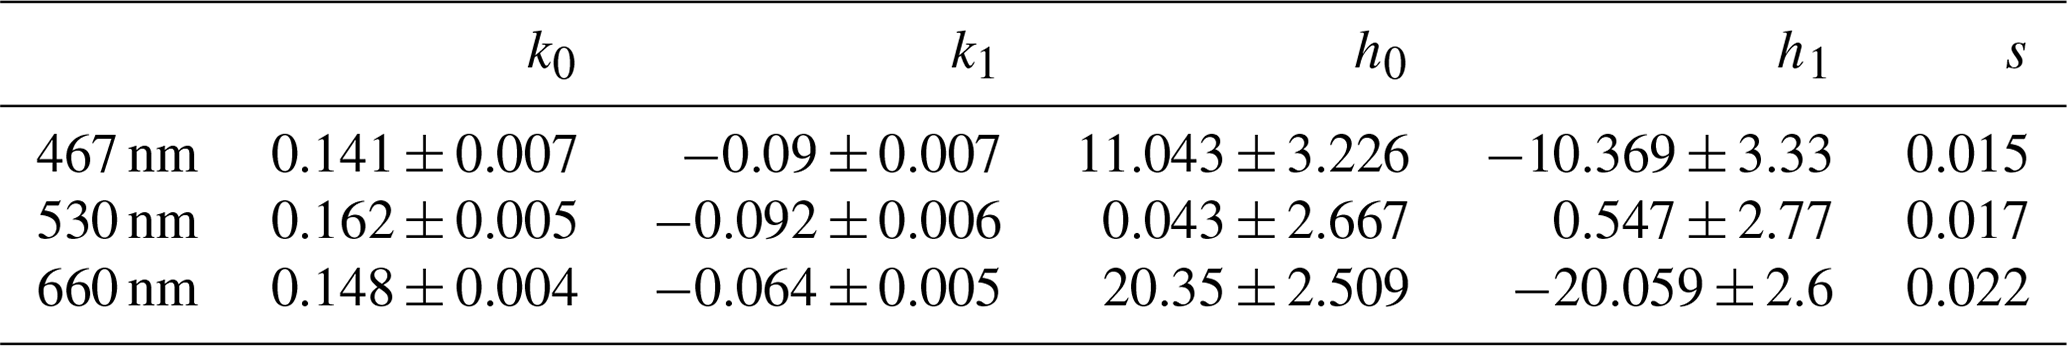

Figure 3Comparison between PSAP absorption coefficients, corrected for using the Virkkula algorithm with revised coefficients, and the reference PASS absorption coefficients measured at the SGP site corresponding to the (a) 467 nm, (b) 530 nm, and (c) 660 nm wavelengths.
It is important to note that, since the Babs predictions of revised Virkkula as shown in Fig. 3 were based on the same data that were used to calculate the Virkkula parameters, the performance of this algorithm on these data is the best that is possible. The %RMSE for the revised Virkkula predictions for the SGP data was ∼ 58 %, which is less than that of unrevised Virkkula, but it still represents significant uncertainty in the calculation/prediction of Babs. This major shortcoming of analytical fits led us to the ML approach to predict the Babs using filter-based measurements.
3.3 Application of the Ogren (2010) modified Bond et al. (1999) correction and its average with unrevised Virkkula (2010)
Figure 4 presents a comparison of filter-based absorption corrected using only the Ogren (2010) modified Bond et al. (1999) algorithm as presented in Eq. (7) and the reference Babs measured using the PASS. The %RMSE for this algorithm on the SGP data is ∼ 312 %, which is almost the same as the %RMSE of unrevised Virkkula (2010). Since the general equation form of Ogren (2010) modified Bond et al. (1999) is similar to that of Virkkula (2010) and both the unrevised versions of the algorithms perform with similar accuracy, the improvement in accuracy of Ogren (2010) modified Bond et al. (1999) with revised coefficients can be expected to be very similar to that in the case of Virkkula.
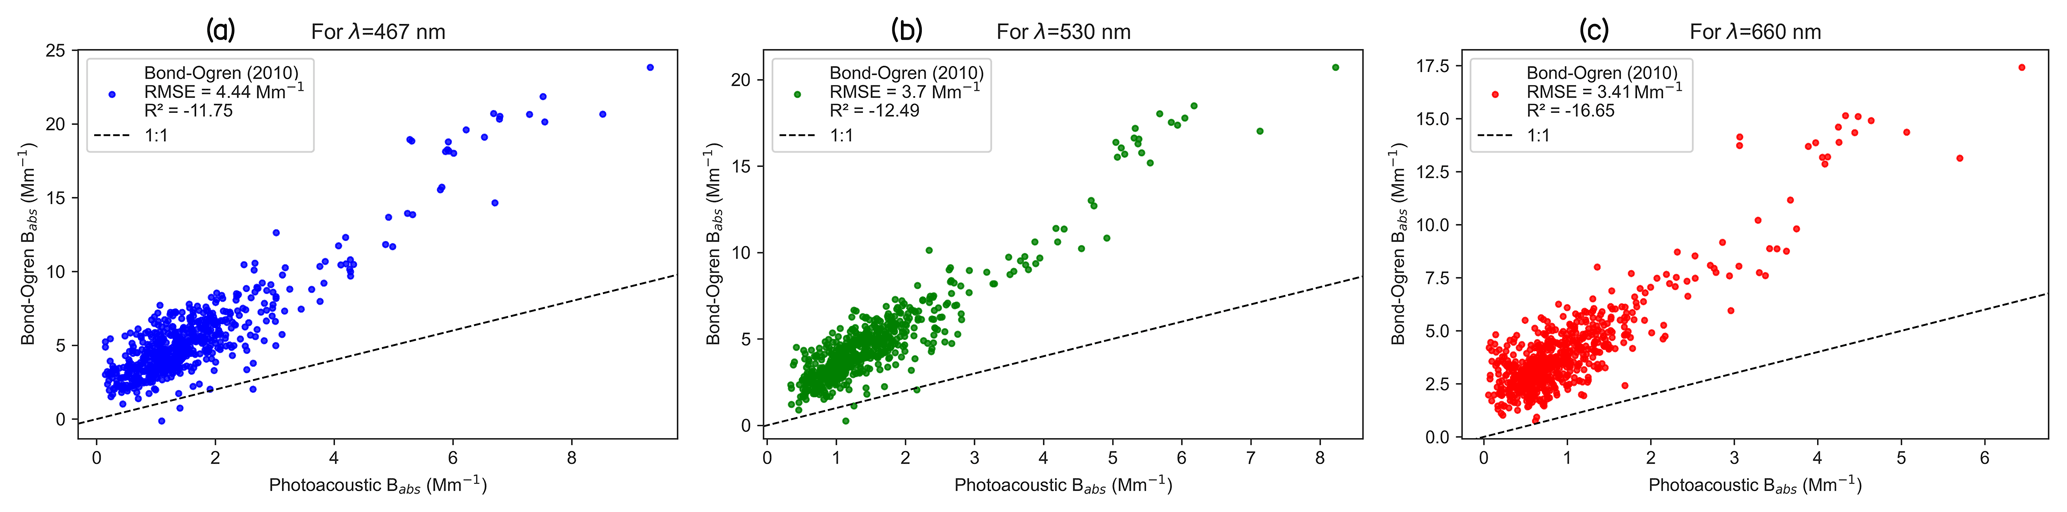
Figure 4Comparison between PSAP absorption coefficients, corrected for using the Bond–Ogren correction algorithm, and the reference PASS absorption coefficients measured at the SGP site corresponding to the (a) 467 nm, (b) 530 nm, and (c) 660 nm wavelengths.
Figure 5 presents a comparison of filter-based absorption corrected using the average of unrevised Virkkula (2010) and Ogren (2010) modified Bond et al. (1999) and reference Babs measured using the PASS. The %RMSE values for the “average” correction are ∼ 343 %, and R2 is negative for all three wavelengths, suggesting that the model performs worse than a constant prediction of the mean Babs value. We observed that the “average” correction performed better than the unrevised Virkkula but still worse than the revised Virkkula algorithm. This justifies the application of the “average” algorithm at ARM sites for better accuracy when PASS-derived Babs values are not available to revise the parameters of the Virkkula equation, and using the unrevised Virkkula algorithm only yields low accuracy.
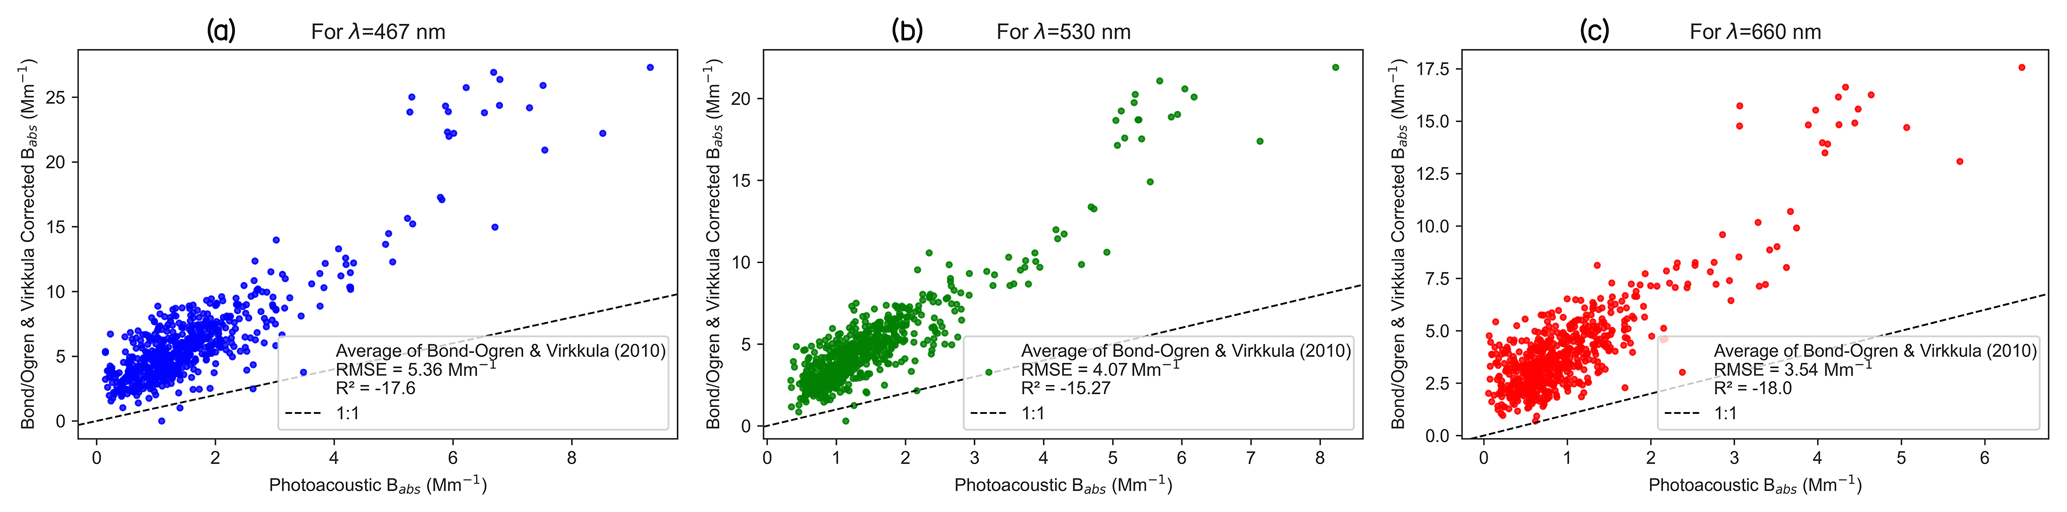
Figure 5Comparison between PSAP absorption coefficients, corrected for using the average of the Bond–Ogren and unrevised Virkkula (2010) algorithms, and the reference PASS absorption coefficients measured at the SGP site corresponding to the (a) 467 nm, (b) 530 nm, and (c) 660 nm wavelengths.
3.4 Application of the RFR algorithm
We used RFR, which is a supervised ML algorithm, to correct for the filter-based PSAP-derived uncorrected absorption coefficients (Babs_uncorrected_PSAP). Figure 6 presents the comparison of RFR-predicted Babs to the reference Babs measured using the PASS. We observed from Fig. 6 that, for all three wavelengths, %RMSE values for the Babs predictions from the RFR algorithm are ∼ 32 %, and the R2 values are also greater than ∼ 0.8, which are much better than the evaluation metrics for both unrevised and revised Virkkula algorithms even when the RFR algorithm's evaluation metrics were computed on unseen test data.
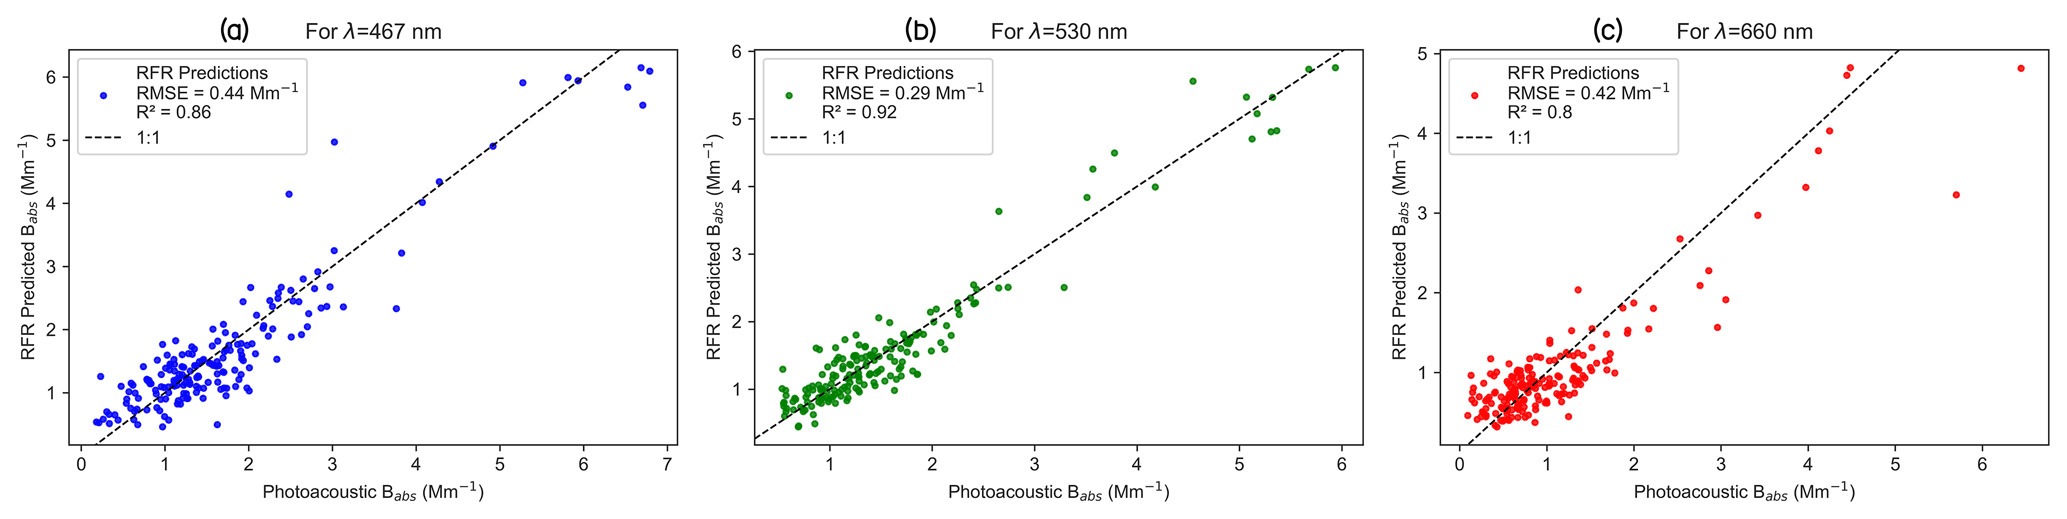
Figure 6Random forest regression, a supervised machine learning algorithm, applied to correct for PSAP absorption coefficients, and comparison of its performance with reference PASS absorption coefficients measured at the SGP site corresponding to the (a) 467 nm, (b) 530 nm, and (c) 660 nm wavelengths.
Apart from the two common correction algorithms (Ogren, 2010, modified Bond et al., 1999, and Virkkula, 2010) applied to PSAP, recent attempts were made to develop new correction algorithms (Li et al., 2020) by constructing a multivariate linear model in the general correction Eq. (2) and including the interaction terms between AAE, SSA, and ln(Tr). It was referred as “Algorithm A” by Li et al. (2020) and produced the R2 values of 0.62, 0.55, and 0.43 on the PSAP's operating wavelengths of 467, 528, and 652 nm, respectively. Comparing just R2 values, the RFR algorithm fares better than “Algorithm A” which is the most recent PSAP correction algorithm developed yet.
The RFR algorithm performs better than the analytical models because it empirically captures the nonlinearities and complex relationships between the input variables and Babs, and it was trained on an extra input of total mass concentration from ACSM. It is important to note that after the eliminative pre-processing of the 3 months of bulk data, the number of valid data samples that remained was relatively small for a typical ML algorithm training; we can expect that the RFR algorithm can perform even better with more extensive data.
3.5 Improving the accuracy of the RFR algorithm
RFR is an ensemble-supervised machine learning algorithm which builds many decision trees using the input data during the training phase and predicts the output as the mean of predictions from all of the trees. The accuracy of the RFR directly depends on the number of different or uncorrelated trees built during the training as shown in Fig. 7. In order to produce many uncorrelated trees, we not only train the trees on different random subsets of training data (i.e., bagging), but also choose different input features or variables randomly to split the nodes. Training the RFR algorithm on all the input variables which significantly affect the output variable not only enables us to increase the number of uncorrelated trees built during training, but also constrains the model for accurate prediction. Hence, the accuracy of RFR in predicting particle-phase Babs could be further improved by training the algorithm using all possible input variables that affect Babs, such as from PSAP/TAP transmission, Bscat, aerosol number size distribution parameters, and composition.
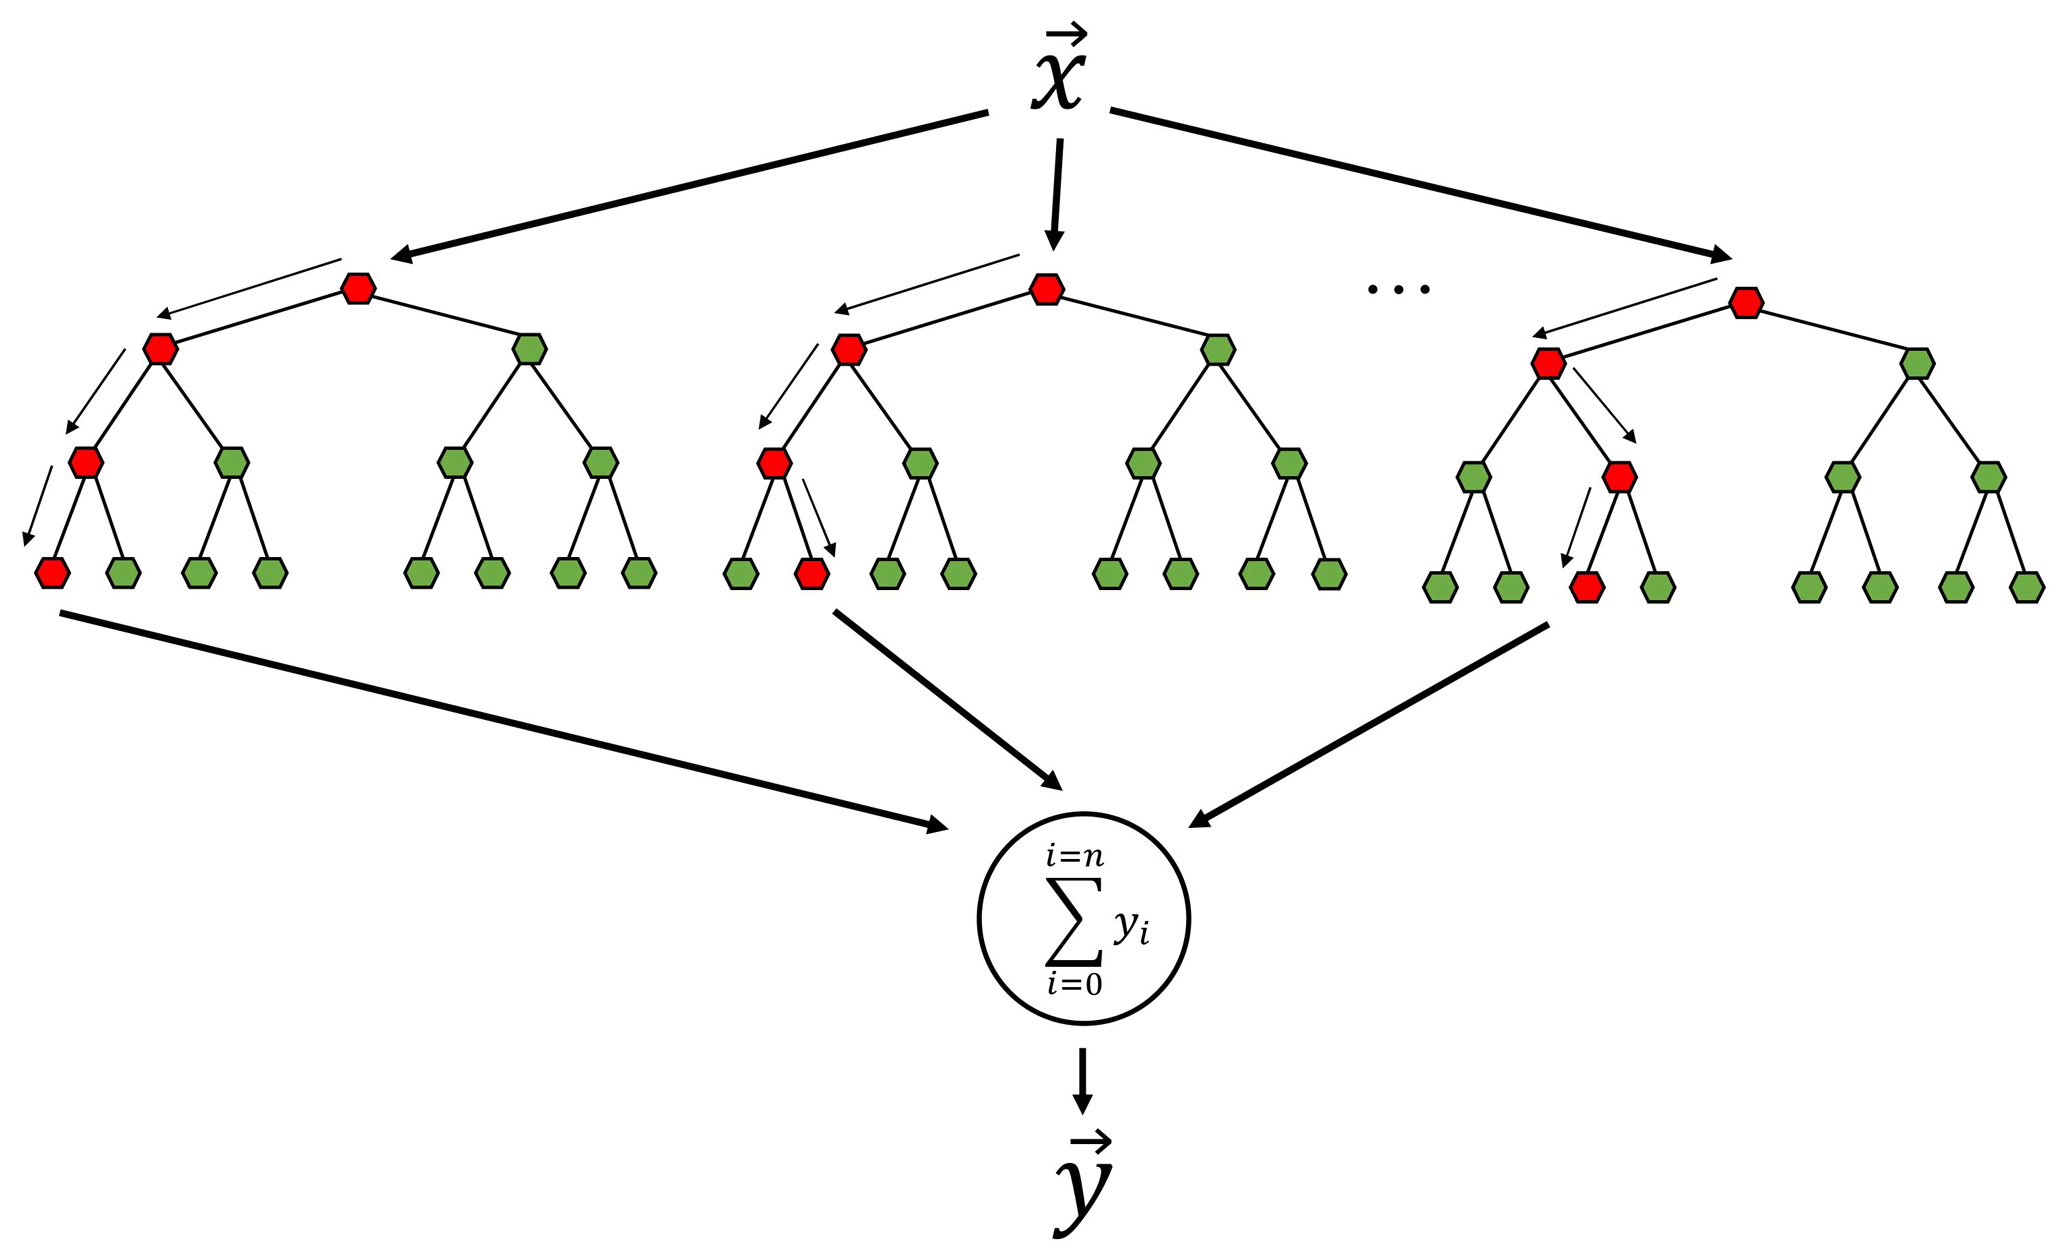
Figure 7Flowchart of RFR illustrating many uncorrelated trees built using random feature sampling whose average prediction is more accurate than each of the individual trees.
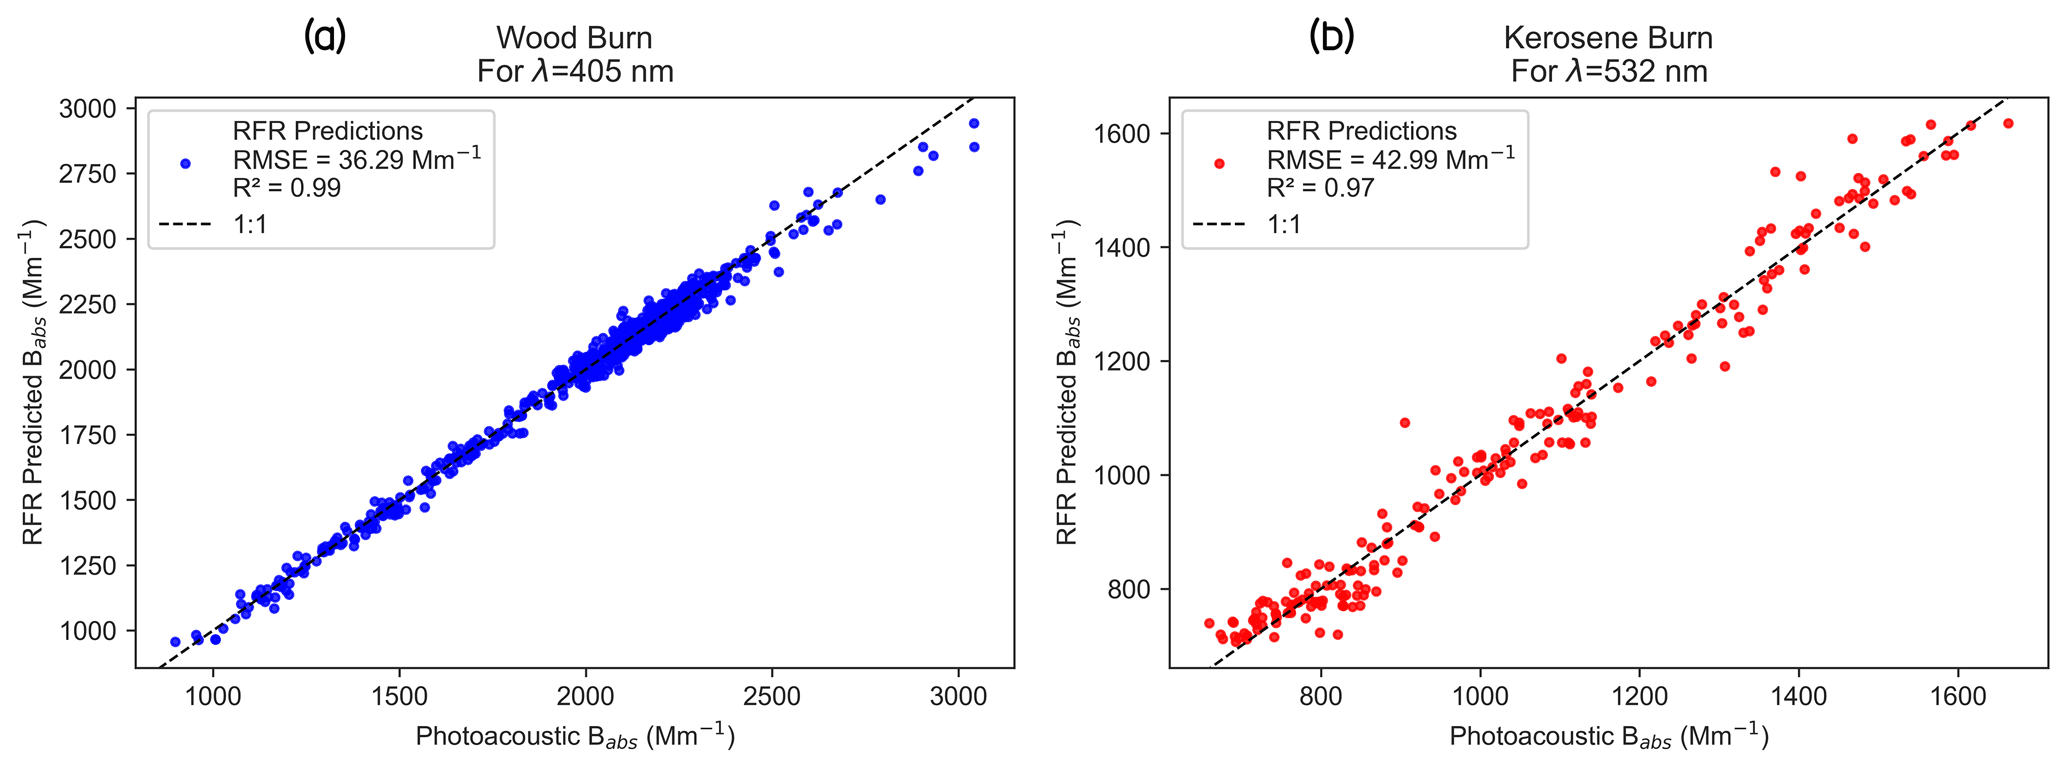
Figure 8An illustration of the power of the RFR algorithm in accurately predicting the particle-phase absorption coefficient when trained with a robust set of input variables. The plots show the accuracy of RFR-trained TAP absorption coefficients in comparison to the reference PASS absorption coefficients corresponding to (a) 405 nm and (b) 532 nm for laboratory-generated aerosols from combustion.
As a proof of concept, we trained and tested the RFR algorithm on a laboratory-generated published dataset of burn chamber experiments (Sumlin et al., 2018; Shetty et al., 2019, 2021). The algorithm was trained using the total number concentration, geometric mean diameter, geometric standard deviation, uncorrected filter-based Tricolor Absorption Photometer (TAP) Babs, and nephelometer Bscat as input variables, while the output variable was the particle-phase absorption coefficient. Figure 8 presents the comparison of RFR-predicted Babs to the reference Babs measured using the PASS during the burn. We observed from Fig. 8 that the RFR algorithm correctly predicted the particle-phase Babs within 5 % (%RMSE) of the reference Babs. We also note that the R2 values are ∼ 1, which shows that the predictions correlate almost perfectly with the reference PASS-derived absorption values. This example demonstrates the capabilities of RFR in capturing the complex relationship between filter-based measurements and particle-phase Babs with the best possible accuracy.
The uncertainties in predicting particle-phase absorption coefficients from filter-based absorption data are due to both measurement uncertainties of the instruments and the uncertainties of parameter computation while using analytical algorithms like those put forth in Virkkula (2010). Little can be done about the instruments' measurement uncertainties, originating from noise and calibration of instruments, standard temperature and pressure (STP) correction, and flow rate uncertainties (Sherman et al., 2015). However, using ML techniques, we can avoid the uncertainties introduced by parameter computation and stiff functional forms, which are inevitable when using algorithms with analytical forms.
Our findings show that the revised and unrevised Virkkula (2010), as well as the “average” algorithms, need to be significantly revised to improve their accuracy. We demonstrate that our RFR algorithm corrects for the PSAP filter-based biases in reference to the PASS measurements at the SGP site accurately and much better than the standard Virkkula algorithm. A unique feature of the SGP site is that, while there are significant monthly variations in the aerosol composition, the optical properties such as the Babs, Bscat, and SSA are bounded in a small range with weak annual cycles. Because of this feature of the SGP site, we argue that the ML-based correction algorithm trained in this study is scalable to other months. Furthermore, the developed correction algorithm can be applied to any climate research facility site globally, provided the seasonality information is included as an input feature to the algorithm during the training using the label-encoding method, which can be used to convert categorical variables such as names of months into numerical variables.
RFR was an ML algorithm of choice in this study because of its high accuracy, even with relatively small training datasets (Kumar and Sahu, 2021). However, if training of a large dataset is involved, other techniques such as XGBoost and neural networks could improve accuracy further than RFR. The RFR algorithm captures nonlinear dependence between variables with the highest accuracy compared to the functional analytical form correction algorithms that were previously developed. We confidently propose that ML models can produce the most accurate and fastest predictions possible of the particle-phase absorption coefficients compared to any other analytical equation form algorithms if the training data are accurate and of a reasonable size.
Major aerosol monitoring networks, such as the Interagency Monitoring of PROtected Visual Environments (IMPROVE) network and the Chemical Speciation Network (CSN), collect particle samples for measurement of the UV-VIS-IR absorption coefficient. The correction scheme developed as part of this study might be applicable to infer aerosol light absorption properties for samples collected from the IMPROVE network, rural facilities, and federal Class-I areas. ML approaches offer a promising path to correct long-term airborne filter-based absorption observations to accurately quantify their variability and trends for robust climate radiative forcing determination. Future work will be in the direction of fine tuning the RFR algorithm to accurately predict light absorption by biomass burning aerosols from the wildfires.
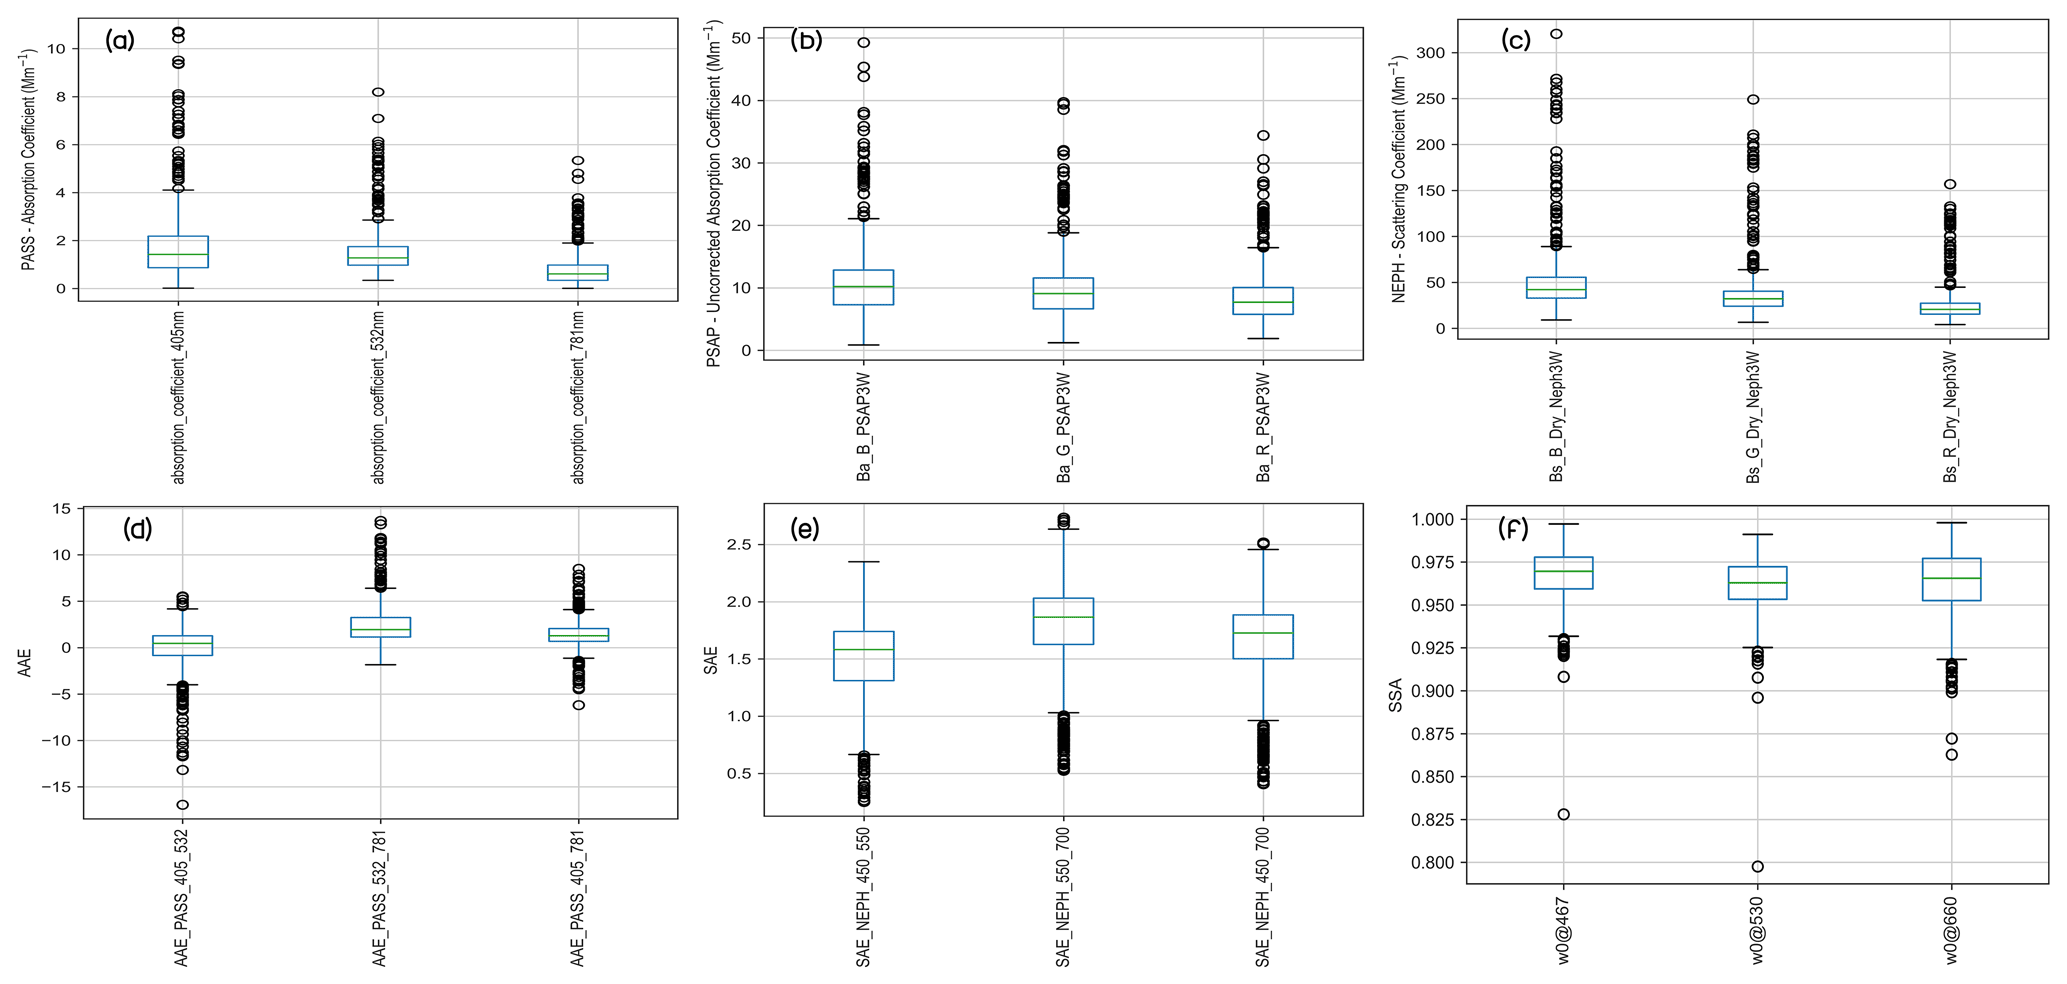
Figure A1Summary of the SGP dataset. The boxplots of raw measurement data are shown as obtained from various instruments used in this study: (a) PASS, (b) PSAP {Babs_uncorrected_PSAP}, and (c) nephelometer. The boxplots of parameters derived from the raw data are also shown: (d) AAE, (e) SAE, and (f) SSA. The green line is the median of the data. The bottom line of the box is the 25th percentile of the data, and the top line of the box is the 75th percentile of the data. Therefore, the box represents the middle 50 % of all the data points, which is the core of the data.
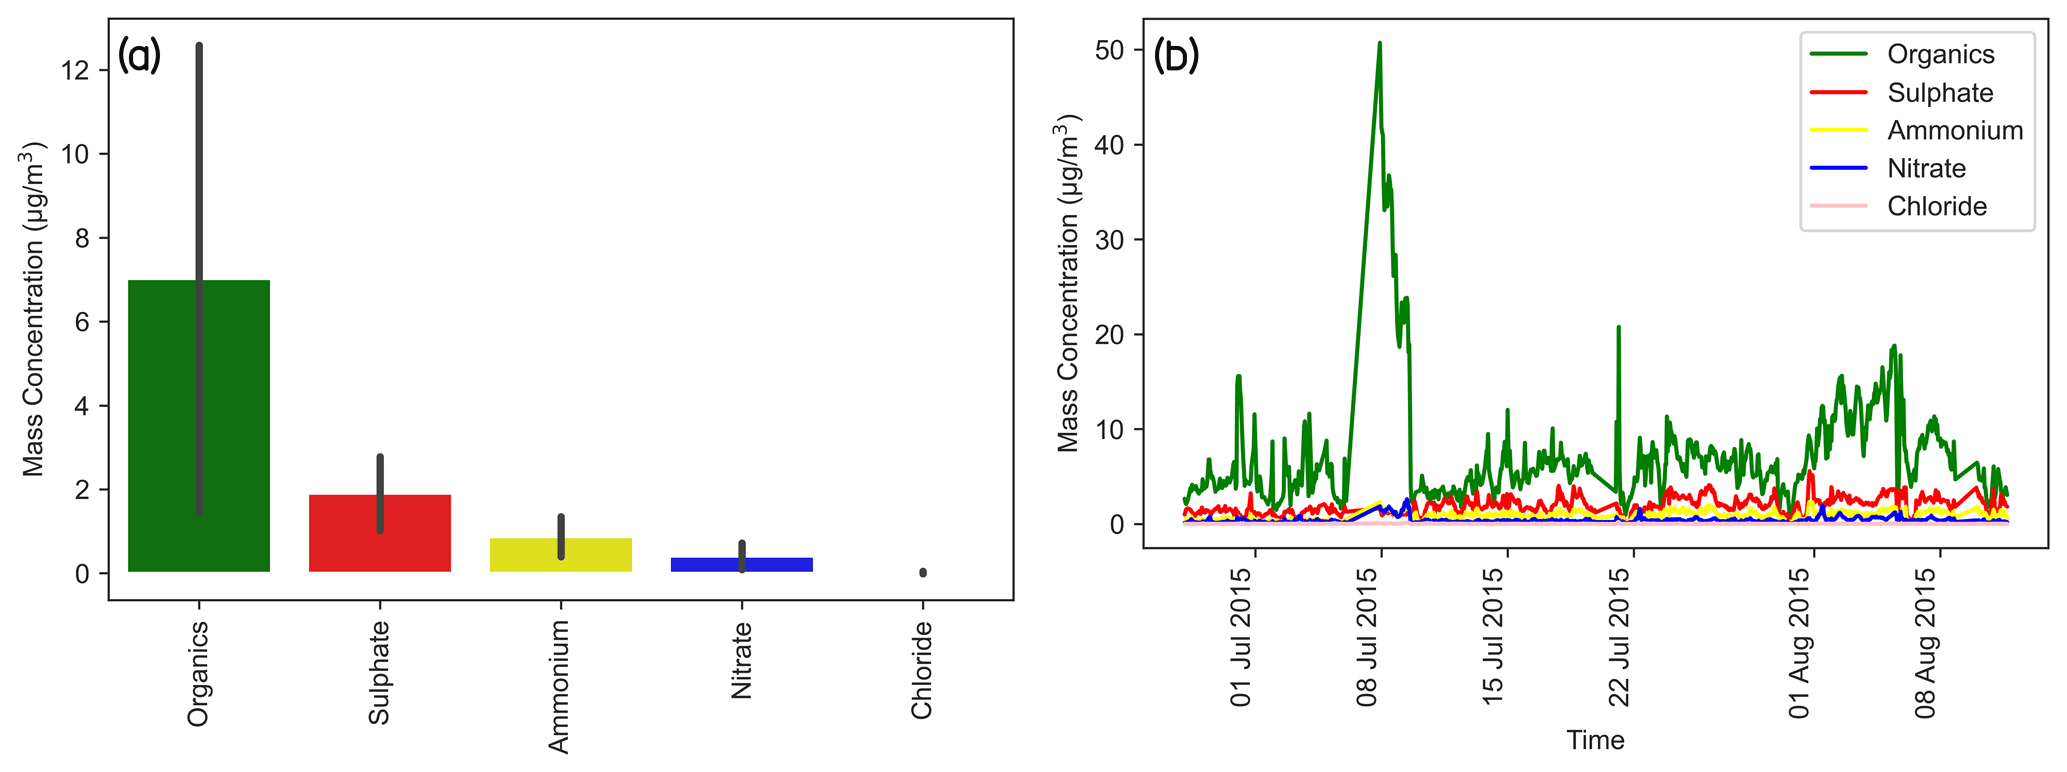
Figure A2Composition of the ambient ground measurement site at SGP. The error bars represent the standard deviations. (a) Mass concentrations of various species. (b) Time series of the absolute mass concentration of particle chemical composition.

Figure A3(a) Time series of elemental carbon (EC) concentration. (b) Time series of the ratio of EC and OC concentrations at SGP from June to November 2013.

Figure A4Time series data of uncorrected absorption coefficients as derived from the PSAP {Babs_uncorrected_PSAP} (at 467, 530, and 660 nm) and PASS (Babs) (at 405, 532, and 781 nm) instruments at the SGP observatory.
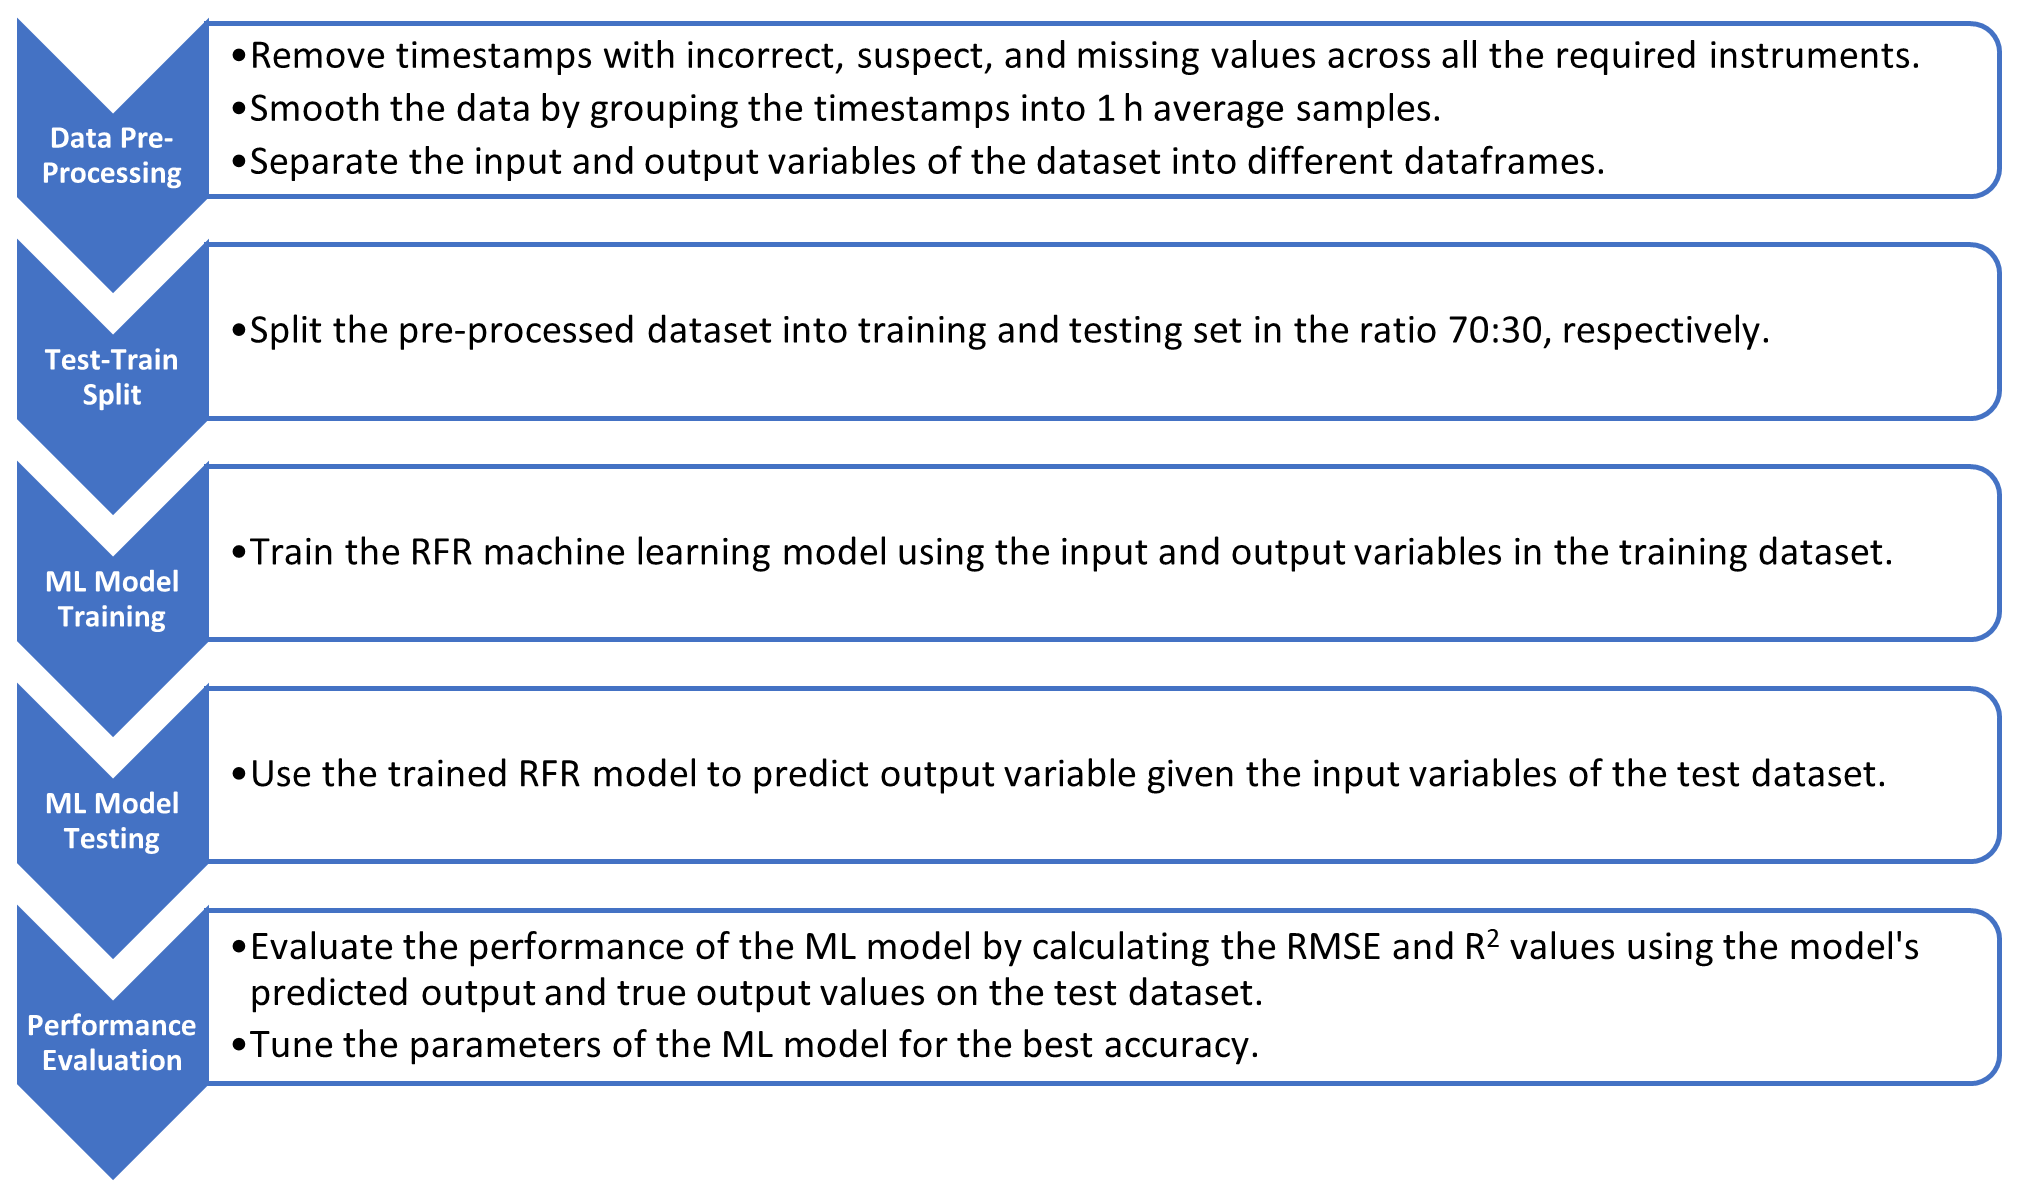
Figure A5Workflow of a machine-learning-based correction model developed and used in this study.
The code for SGP data analysis and ML models is publicly available on Zenodo (https://doi.org/10.5281/zenodo.6835036, Kumar, 2022) and GitHub (https://github.com/joshinkumar/Filter-correction-ML-code, last access: 31 July 2022).
All the data from the SGP site used in this study are available to download at the ARM's Data Discovery website for each of the following instruments used in this study. PASS data: https://doi.org/10.5439/1190011 (ARM user facility, 2009), ACSM data: https://doi.org/10.5439/1763029 (ARM user facility, 2010), PSAP data: https://doi.org/10.5439/1333829 (ARM user facility, 2011a), and Nephelometer data: https://doi.org/10.5439/1258791 (ARM user facility, 2011b). Field campaign data: semi-continuous OCEC SGP 2013: https://adc.arm.gov/discovery/#/results/id::6561_ocec_microchem_scocec_aerosol_blkcarbonconc?showDetails=true (last access: 27 July 2022, Cary, 2013). The laboratory-generated wood and kerosene burn dataset is available at https://github.com/joshinkumar/Filter-correction-ML-code/blob/main/Lab%20Burn%20Dataset.zip (last access: 31 July 2022, Paik et al., 2022).
RKC conceived of the study and its design. JK performed the data analysis, developed and implemented the models, and led the preparation of the manuscript. MKD and ACA collected the PASS dataset at the SGP site. TP performed the laboratory experiments. RKC, NJS, and PS provided guidance and supervision for carrying out the research tasks, interpretation of results, and contribution to the preparation of the manuscript. All the authors were involved in the editing and proofreading of the manuscript.
The contact author has declared that none of the authors has any competing interests.
Publisher’s note: Copernicus Publications remains neutral with regard to jurisdictional claims in published maps and institutional affiliations.
This research has been primarily supported by the US Department of Energy (grant no. DE-SC0021011). The laboratory experiments of the study were partially supported by the National Science Foundation (grant no. AGS-1926817).
This paper was edited by Paolo Laj and reviewed by three anonymous referees.
Andrews, E., Sheridan, P., Ogren, J., Hageman, D., Jefferson, A., Wendell, J., Alástuey, A., Alados-Arboledas, L., Bergin, M., and Ealo, M., Gannet Hallar, A., Hoffer, A., Kalapov, I., Keywood, M., Kim, J., Kim, SW, Kolonjari, F., Labuschagne, C., Lin, NH, Macdonald, A., Mayol-Bracero, O. L., McCubbin, I. B., Pandolfi, M., Reisen, F., Sharma, S., Sherman, J. P., Sorribas, M., and Sun, J.: Overview of the NOAA/ESRL federated aerosol network, B. Am. Meteorol. Soc., 100, 123–135, 2019.
Arnott, W. P., Moosmüller, H., Rogers, C. F., Jin, T., and Bruch, R.: Photoacoustic spectrometer for measuring light absorption by aerosol: instrument description, Atmos. Environ., 33, 2845–2852, 1999.
Atmospheric Radiation Measurement (ARM) user facility: Photoacoustic Soot Spectrometer (AOSPASS3W). 2015-06-27 to 2015-09-25, Southern Great Plains (SGP) Central Facility, Lamont, OK (C1), compiled by: Aiken, A., ARM Data Center [data set], https://doi.org/10.5439/1190011, 2009.
Atmospheric Radiation Measurement (ARM) user facility: ACSM, corrected for composition-dependent collection efficiency (ACSMCDCE). 2015-06-27 to 2015-09-25, Southern Great Plains (SGP) Central Facility, Lamont, OK (C1), compiled by: Zawadowicz, M. and Howie, J., ARM Data Center [data set], https://doi.org/10.5439/1763029, 2010.
Atmospheric Radiation Measurement (ARM) user facility: Particle Soot Absorption Photometer (AOSPSAP3W). 2015-06-27 to 2017-09-25, Southern Great Plains (SGP) Central Facility, Lamont, OK (C1), compiled by: Koontz, A. and Springston, S., ARM Data Center [data set], https://doi.org/10.5439/1333829, 2011a.
Atmospheric Radiation Measurement (ARM) user facility: Nephelometer (AOSNEPHDRY). 2015-06-27 to 2015-09-25, Southern Great Plains (SGP) Central Facility, Lamont, OK (C1), compiled by: Koontz, A. and Uin, J. ARM Data Center [data set], https://doi.org/10.5439/1258791, 2011b.
Biau, G.: Analysis of a random forests model, J. Mach. Learn. Res., 13, 1063–1095, 2012.
Bond, T. C., Anderson, T. L., and Campbell, D.: Calibration and intercomparison of filter-based measurements of visible light absorption by aerosols, Aerosol Sci. Tech., 30, 582–600, 1999.
Breiman, L.: Random forests, Mach. Learn., 45, 5–32, 2001.
Brown, H., Liu, X., Pokhrel, R., Murphy, S., Lu, Z., Saleh, R., Mielonen, T., Kokkola, H., Bergman, T., and Myhre, G.: Biomass burning aerosols in most climate models are too absorbing, Nat. Commun., 12, 1–15, 2021.
Cary, R.: Field Campaign Data: Semi-Continuous OCEC SGP 2013, ARM Data Discovery [data set], https://adc.arm.gov/discovery/#/results/id::6561_ocec_microchem_scocec_aerosol_blkcarbonconc?showDetails=true (last access: 27 July 2022), 2013.
Clarke, A. D.: Integrating sandwich: a new method of measurement of the light absorption coefficient for atmospheric particles, Appl. Optics, 21, 3011–3020, 1982.
Collaud Coen, M., Weingartner, E., Apituley, A., Ceburnis, D., Fierz-Schmidhauser, R., Flentje, H., Henzing, J. S., Jennings, S. G., Moerman, M., Petzold, A., Schmid, O., and Baltensperger, U.: Minimizing light absorption measurement artifacts of the Aethalometer: evaluation of five correction algorithms, Atmos. Meas. Tech., 3, 457–474, https://doi.org/10.5194/amt-3-457-2010, 2010.
Flowers, B. A., Dubey, M. K., Mazzoleni, C., Stone, E. A., Schauer, J. J., Kim, S.-W., and Yoon, S. C.: Optical-chemical-microphysical relationships and closure studies for mixed carbonaceous aerosols observed at Jeju Island; 3-laser photoacoustic spectrometer, particle sizing, and filter analysis, Atmos. Chem. Phys., 10, 10387–10398, https://doi.org/10.5194/acp-10-10387-2010, 2010.
Flynn, C., Koontz, A., Ermold, B., and Chand, D.: ARM Aerosol Optical Properties (AOP) and its Value-Added Product, DOE Office of Science Atmospheric Radiation Measurement (ARM) Program, 2018, https://www.arm.gov/publications/tech_reports/doe-sc-arm-tr-211.pdf (last access: 22 July 2022), 2020.
Gorbunov, B., Hamilton, R., and Hitzenberger, R.: Modeling radiative transfer by aerosol particles on a filter, Aerosol Sci. Tech., 36, 123–135, 2002.
Kumar, V. and Sahu, M.: Evaluation of nine machine learning regression algorithms for calibration of low-cost PM2.5 sensor, J. Aerosol Sci., 157, 105809, https://doi.org/10.1016/j.jaerosci.2021.105809, 2021.
Kumar, J.: joshinkumar/Filter-correction-ML-code: Correcting for filter-based aerosol light absorption biases at Atmospheric Radiation Measurement's Southern Great Plains site using photoacoustic data and machine learning (v1.0), Zenodo [code], https://doi.org/10.5281/zenodo.6835036, 2022.
Li, H., McMeeking, G. R., and May, A. A.: Development of a new correction algorithm applicable to any filter-based absorption photometer, Atmos. Meas. Tech., 13, 2865–2886, https://doi.org/10.5194/amt-13-2865-2020, 2020.
Liu, C., Chung, C. E., Yin, Y., and Schnaiter, M.: The absorption Ångström exponent of black carbon: from numerical aspects, Atmos. Chem. Phys., 18, 6259–6273, https://doi.org/10.5194/acp-18-6259-2018, 2018.
Liu, J., Alexander, L., Fast, J. D., Lindenmaier, R., and Shilling, J. E.: Aerosol characteristics at the Southern Great Plains site during the HI-SCALE campaign, Atmos. Chem. Phys., 21, 5101–5116, https://doi.org/10.5194/acp-21-5101-2021, 2021.
Masson-Delmotte, V., Zhai, P., Pirani, A., Connors, S. L., Péan, C., Berger, S., Caud, N., Chen, Y., Goldfarb, L., and Gomis, M.: Climate change 2021: the physical science basis, Contribution of working group I to the sixth assessment report of the intergovernmental panel on climate change, 2, https://www.ipcc.ch/report/ar6/wg1/downloads/report/IPCC_AR6_WGI_FrontMatter.pdf (last access: 3 August 2022), 2021.
Müller, T., Virkkula, A., and Ogren, J. A.: Constrained two-stream algorithm for calculating aerosol light absorption coefficient from the Particle Soot Absorption Photometer, Atmos. Meas. Tech., 7, 4049–4070, https://doi.org/10.5194/amt-7-4049-2014, 2014.
Myers, D. C., Lawler, M. J., Mauldin, R. L., Sjostedt, S., Dubey, M., Abbatt, J., and Smith, J. N.: Indirect Measurements of the Composition of Ultrafine Particles in the Arctic Late-Winter, J. Geophys. Res.-Atmos., 126, e2021JD035428, https://doi.org/10.1029/2021JD035428, 2021.
Nakayama, T., Kondo, Y., Moteki, N., Sahu, L., Kinase, T., Kita, K., and Matsumi, Y.: Size-dependent correction factors for absorption measurements using filter-based photometers: PSAP and COSMOS, J. Aerosol Sci., 41, 333–343, 2010.
Ogren, J. A.: Comment on “Calibration and intercomparison of filter-based measurements of visible light absorption by aerosols”, Aerosol Sci. Tech., 44, 589–591, 2010.
Paik, T., Shetty, N., and Kumar, J.: Wood and Kerosene Burn Dataset, GitHub [data set], https://github.com/joshinkumar/Filter-correction-ML-code/blob/main/Lab%20Burn%20Dataset.zip, last access: 31 July 2022.
Pandey, A., Pervez, S., and Chakrabarty, R. K.: Filter-based measurements of UV–vis mass absorption cross sections of organic carbon aerosol from residential biomass combustion: Preliminary findings and sources of uncertainty, J. Quant. Spectrosc. Ra., 182, 296–304, 2016.
Parworth, C., Fast, J., Mei, F., Shippert, T., Sivaraman, C., Tilp, A., Watson, T., and Zhang, Q.: Long-term measurements of submicrometer aerosol chemistry at the Southern Great Plains (SGP) using an Aerosol Chemical Speciation Monitor (ACSM), Atmos. Environ., 106, 43–55, 2015.
Sheridan, P., Delene, D., and Ogren, J.: Four years of continuous surface aerosol measurements from the Department of Energy's Atmospheric Radiation measurement Program Southern Great Plains Cloud and Radiation Testbed site, J. Geophys. Res.-Atmos., 106, 20735–20747, 2001.
Sherman, J. P., Sheridan, P. J., Ogren, J. A., Andrews, E., Hageman, D., Schmeisser, L., Jefferson, A., and Sharma, S.: A multi-year study of lower tropospheric aerosol variability and systematic relationships from four North American regions, Atmos. Chem. Phys., 15, 12487–12517, https://doi.org/10.5194/acp-15-12487-2015, 2015.
Shetty, N., Beeler, P., Paik, T., Brechtel, F. J., and Chakrabarty, R. K.: Bias in quantification of light absorption enhancement of black carbon aerosol coated with low-volatility brown carbon, Aerosol Sci. Tech., 55, 539–551, 2021.
Shetty, N. J., Pandey, A., Baker, S., Hao, W. M., and Chakrabarty, R. K.: Measuring light absorption by freshly emitted organic aerosols: optical artifacts in traditional solvent-extraction-based methods, Atmos. Chem. Phys., 19, 8817–8830, https://doi.org/10.5194/acp-19-8817-2019, 2019.
Sisterson, D., Peppler, R., Cress, T., Lamb, P., and Turner, D.: The ARM southern great plains (SGP) site, Meteor. Mon., 57, 6.1–6.14, 2016.
Springston, S.: Particle Soot Absorption Photometer (PSAP) Instrument Handbook, DOE ARM Climate Research Facility, Washington, DC, USA, https://www.osti.gov/servlets/purl/1246162 (last access: 31 July 2022), 2018.
Stokes, G. M. and Schwartz, S. E.: The Atmospheric Radiation Measurement (ARM) Program: Programmatic background and design of the cloud and radiation test bed, B. Am. Meteorol. Soc., 75, 1201–1222, 1994.
Subramanian, R., Roden, C. A., Boparai, P., and Bond, T. C.: Yellow beads and missing particles: Trouble ahead for filter-based absorption measurements, Aerosol Sci. Tech., 41, 630–637, 2007.
Sumlin, B. J., Heinson, Y. W., Shetty, N., Pandey, A., Pattison, R. S., Baker, S., Hao, W. M., and Chakrabarty, R. K.: UV–Vis–IR spectral complex refractive indices and optical properties of brown carbon aerosol from biomass burning, J. Quant. Spectrosc. Ra., 206, 392–398, 2018.
Uin, J. and Smith, S.: Southern Great Plains (SGP) Aerosol Observing System (AOS) Instrument Handbook, Oak Ridge National Laboratory (ORNL), Oak Ridge, TN, USA, https://www.arm.gov/publications/tech_reports/handbooks/doe-sc-arm-tr-267.pdf (last access: 31 July 2022), 2020.
Virkkula, A.: Correction of the calibration of the 3-wavelength Particle Soot Absorption Photometer (3λ PSAP), Aerosol Sci. Tech., 44, 706–712, 2010.
Virkkula, A., Ahlquist, N. C., Covert, D. S., Arnott, W. P., Sheridan, P. J., Quinn, P. K., and Coffman, D. J.: Modification, calibration and a field test of an instrument for measuring light absorption by particles, Aerosol Sci. Tech., 39, 68–83, 2005.
Weingartner, E., Saathoff, H., Schnaiter, M., Streit, N., Bitnar, B., and Baltensperger, U.: Absorption of light by soot particles: determination of the absorption coefficient by means of aethalometers, J. Aerosol Sci., 34, 1445–1463, 2003.
Zuidema, P., Sedlacek III, A. J., Flynn, C., Springston, S., Delgadillo, R., Zhang, J., Aiken, A. C., Koontz, A., and Muradyan, P.: The Ascension Island boundary layer in the remote southeast Atlantic is often smoky, Geophys. Res. Lett., 45, 4456–4465, 2018.