the Creative Commons Attribution 4.0 License.
the Creative Commons Attribution 4.0 License.
 | 30 Aug 2022
Sensitivity analysis of DSD retrievals from polarimetric radar in stratiform rain based on the μ–Λ relationship
Christos Gatidis
Marc Schleiss
Christine Unal
Raindrop size distributions (DSDs) play a crucial role in quantitative rainfall estimation using weather radar. Thanks to dual polarization capabilities, crucial information about the DSD in a given volume of air can be retrieved. One popular retrieval method assumes that the DSD can be modeled by a constrained gamma distribution in which the shape (μ) and rate (Λ) parameters are linked together by a deterministic relationship. In the literature, μ–Λ relationships are often taken for granted and applied without much critical discussion. In this study, we take another look at this important issue by conducting a detailed analysis of μ–Λ relations in stratiform rain and quantifying the accuracy of the associated DSD retrievals. Crucial aspects of our research include the sensitivity of μ–Λ relations to the temporal aggregation scale, drop concentration, inter-event variability, and adequacy of the gamma distribution model. Our results show that μ–Λ relationships in stratiform rain are surprisingly robust to the choice of the sampling resolution, sample size, and adequacy of the gamma model. Overall, the retrieved DSDs are in a rather decent agreement with ground observations (correlation coefficient of 0.57 and 0.74 for μ and Dm). The main sources of errors and uncertainty during the retrievals are calibration offsets in reflectivity (Zhh) and differential reflectivity (Zdr). Measurement noise and differences in scale between radars and disdrometers also play a minor role. The raindrop concentration (NT) remains the most difficult parameter to retrieve, which can be off by several orders of magnitude. After careful data filtering and removal of problematic pairs, the correlation coefficient for the retrieved NT values remained low, only slightly increasing from 0.12 into 0.24.
- Article
(14317 KB) - Full-text XML
- Companion paper
-
Supplement
(1493 KB) - BibTeX
- EndNote


Understanding the natural variability of raindrop size distributions (DSDs) is crucial for radar remote sensing applications and microphysical parameterizations in numerical weather prediction models (e.g., Thompson et al., 2004). Most precipitation-related quantities (e.g., rain rate, mean drop diameter, number concentration, fall velocity, or liquid water content) directly depend on the DSD. Similarly, most radar observables (e.g., Zhh, Zdr) are weighted moments of the DSD. For these reasons, DSD retrieval methods play a central role in numerous weather radar studies.
Efforts to improve quantitative rainfall estimates by retrieving information about DSDs from radar and satellite observations have captured a great deal of interest in the meteorological community, especially after the introduction of polarimetric weather radar (Seliga and Bringi, 1976). Retrievals based on the reflectivity factor at horizontal polarization (Zhh), differential reflectivity (Zdr), and specific differential phase (Kdp) are the most common choices because of their natural link to raindrop concentrations, sizes, and shapes.
According to the literature, DSDs can be parameterized in the form of relatively simple models such as a gamma distribution with the three parameters μ, Λ, and N0 representing the shape, scale, and concentration, respectively. Algorithms for DSD retrievals take advantage of different relationships between radar observables and the three parameters of the gamma. Three main categories of retrieval methods can be distinguished: the first one consists of methods that use two radar observations Zhh and Zdr, as well as a constrained relationship between μ and Λ (Zhang et al., 2001, 2003) or N0 and μ (Ulbrich, 1983). The second category proposed by Bringi et al. (2002) and Gorgucci et al. (2002) uses the three radar observables Zhh, Zdr, and Kdp. However, this method is known to be very sensitive to noise in Kdp estimates. To reduce the uncertainty, the differential phase needs to be filtered and down-sampled, which limits the accuracy and spatial resolution of the retrievals. The last category consists of various retrieval techniques that require special types of radars or measurements, such as double frequency (Rose and Chandrasekar, 2006), triple frequency (Mróz et al., 2020), and/or Doppler power spectra (Unal, 2015). In this paper, only the first category will be discussed.
The main challenges when retrieving DSDs from Zhh and Zdr are the choice of the N0–μ or μ–Λ relationship and its validity across different rain types as well as spatial and temporal aggregation scales. In the literature, μ–Λ relationships are often taken for granted or transferred from one location or scale to another without much critical discussion. And while some studies have documented large differences in relationships across rain types (e.g.,, stratiform vs. convective), little is known about the sensitivity of μ–Λ relationships to the temporal sampling resolution of the disdrometer data used to infer them or the validity of the gamma assumption. Another important issue concerns the fact that the disdrometer data used to define μ–Λ relationships correspond to much smaller sampling volumes than the radar measurements to which they are applied. Therefore, it might be necessary to first apply a statistical transformation to the radar data before retrieving DSDs based on μ–Λ relationships or, equivalently, modify the μ–Λ relation to account for the difference in scale.
Finally, one last issue that tends to be overlooked is that radar measurements are likely to contain systematic errors in the form of calibration offsets in Zhh and Zdr. A possible error in the latter could induce large biases in the retrieved DSDs, especially in light rain with low Zdr and a small signal-to-noise ratio. Several operational polarimetric weather radar networks such as the US Nexrad (Hubbert and Pratte, 2006) and the German DWD network (Frech and Hubbert, 2020) have already devoted extensive efforts toward mitigating these calibration issues. However, achieving and maintaining good calibration over time for research radars remain challenging.
In this paper, we perform a detailed analysis of the sensitivity of DSD retrievals from polarimetric radar to various error sources such as the validity of the μ–Λ relationship and its sensitivity to the temporal sampling resolution, inter-event variability, changes in number concentrations, and adequacy of the gamma distribution model. We also examine the sensitivity of the retrievals to measurement biases in Zhh and potential biases in Zdr due to differences in measurement scale. We illustrate the importance of all these issues by retrieving DSDs during several episodes of light to moderate stratiform rain in Cabauw, the Netherlands, and indirectly validating our retrievals by comparing them to disdrometer observations on the ground. The main focus is not on optimizing the DSD retrieval algorithm but on understanding its sensitivity to potential sources of errors, either directly linked to the radar measurements or indirectly through the critical modeling assumptions behind the method.
This paper is organized as follows. In Sect. 2, the data used are introduced. In Sect. 3, the methodology is presented. In Sect. 4, the main results for the μ–Λ relationship analysis are shown, followed by the sensitivity analysis of the DSD retrievals in Sect. 5. Finally, the conclusions are provided in Sect. 6.
The data used in this study were collected in the Netherlands during the ACCEPT (Analysis of the Composition of Clouds with Extended Polarization Techniques) campaign between October and November 2014. During this campaign, a variety of different in situ and remote sensing measurements were collected at the CESAR (Cabauw Experimental Site for Atmospheric Research) observatory.
2.1 The disdrometer data
The ground DSD spectra used for calibration and validation were collected by a Parsivel2 (Particle Size and Velocity) optical disdrometer. The working principle, strengths, and limitations of the Parsivel2 have already been discussed in great depth in previous studies and will not be part of this study (Löffler-Mang and Joss, 2000; Tokay et al., 2014; Battaglia et al., 2010; Thurai et al., 2011; Raupach and Berne, 2015). For example, the Parsivel is susceptible to errors in the lower drop diameter range, which can affect the DSD shape and number concentrations. However, no efforts have been made to try to correct for these issues within the context of this study. The raw DSD data consist of particle counts across 32 nonuniformly spaced diameter classes ranging from 0 to 25 mm with a sampling resolution of 30 s. From the raw DSD, integrated quantities such as rainfall rate (R) and radar equivalent reflectivity factor (Z) can be derived (Bringi and Chandrasekar, 2001; Thurai and Bringi, 2008). The disdrometer measurements were used to fit gamma DSD models and derive constrained relations between μ and Λ parameters at different temporal resolutions, which is necessary for retrieving DSDs from polarimetric radar measurements. At the same time, the disdrometer measurements were also used to (indirectly) validate the radar retrievals and study their consistency over time and across different events.
Similarly to Gatidis et al. (2020), preprocessing is applied to the disdrometer data.
-
Only the liquid type of precipitation was considered for further analysis. All DSDs with observations above the 22nd diameter class (drop diameters greater than 7 mm) were discarded, since they correspond to mixed or solid precipitation.
-
Each DSD should be comprised of at least three different diameter size classes in order to exclude spurious observations not related to rain.
2.2 Radar data
The radar data used to perform the DSD retrievals were collected by TU Delft's polarimetric S-band (λ=9.1 cm) FMCW radar TARA (Transportable Atmospheric RAdar; Heijnen et al., 2000) in Cabauw, the Netherlands. TARA was collocated with additional sensors. This included a Parsivel disdrometer (see Pfitzenmaier et al., 2018, Fig. 1) provided by the Leibniz Institute for Tropospheric Research (TROPOS). For this experiment, the radar antenna elevation angle of TARA was fixed at 45∘ with constant azimuth. The collected polarimetric radar observables included the reflectivity factor at horizontal polarization (Zhh) and differential reflectivity (Zdr) at 200 m of height (corresponding to the minimum range of TARA). The full specifications of TARA during the ACCEPT campaign are given in Table 1 of Pfitzenmaier et al. (2018).
Table 1Overview of the selected events. Date, duration, number of samples, average rain intensity (), average mass-weighted mean diameter (), average number concentration (), parameters of the μ–Λ relationship (α, β), their corresponding percentage relative errors, correlation coefficient between μ and Λ for each event, and root mean square deviation (RMSD) between μ and Λ points of each event as well as the overall relationship. Note that only the DSDs conforming to the gamma model (see Sect. 3.1, DSD model) were considered when computing these statistics.
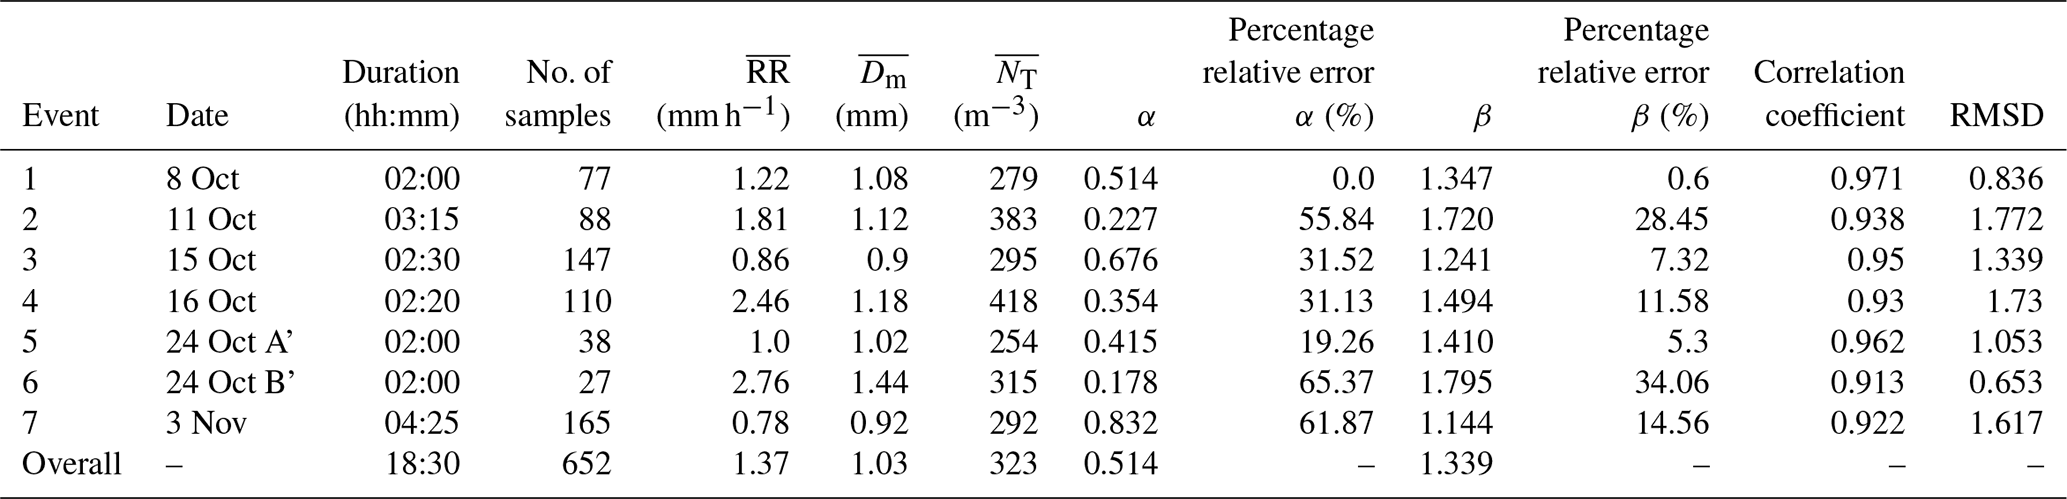
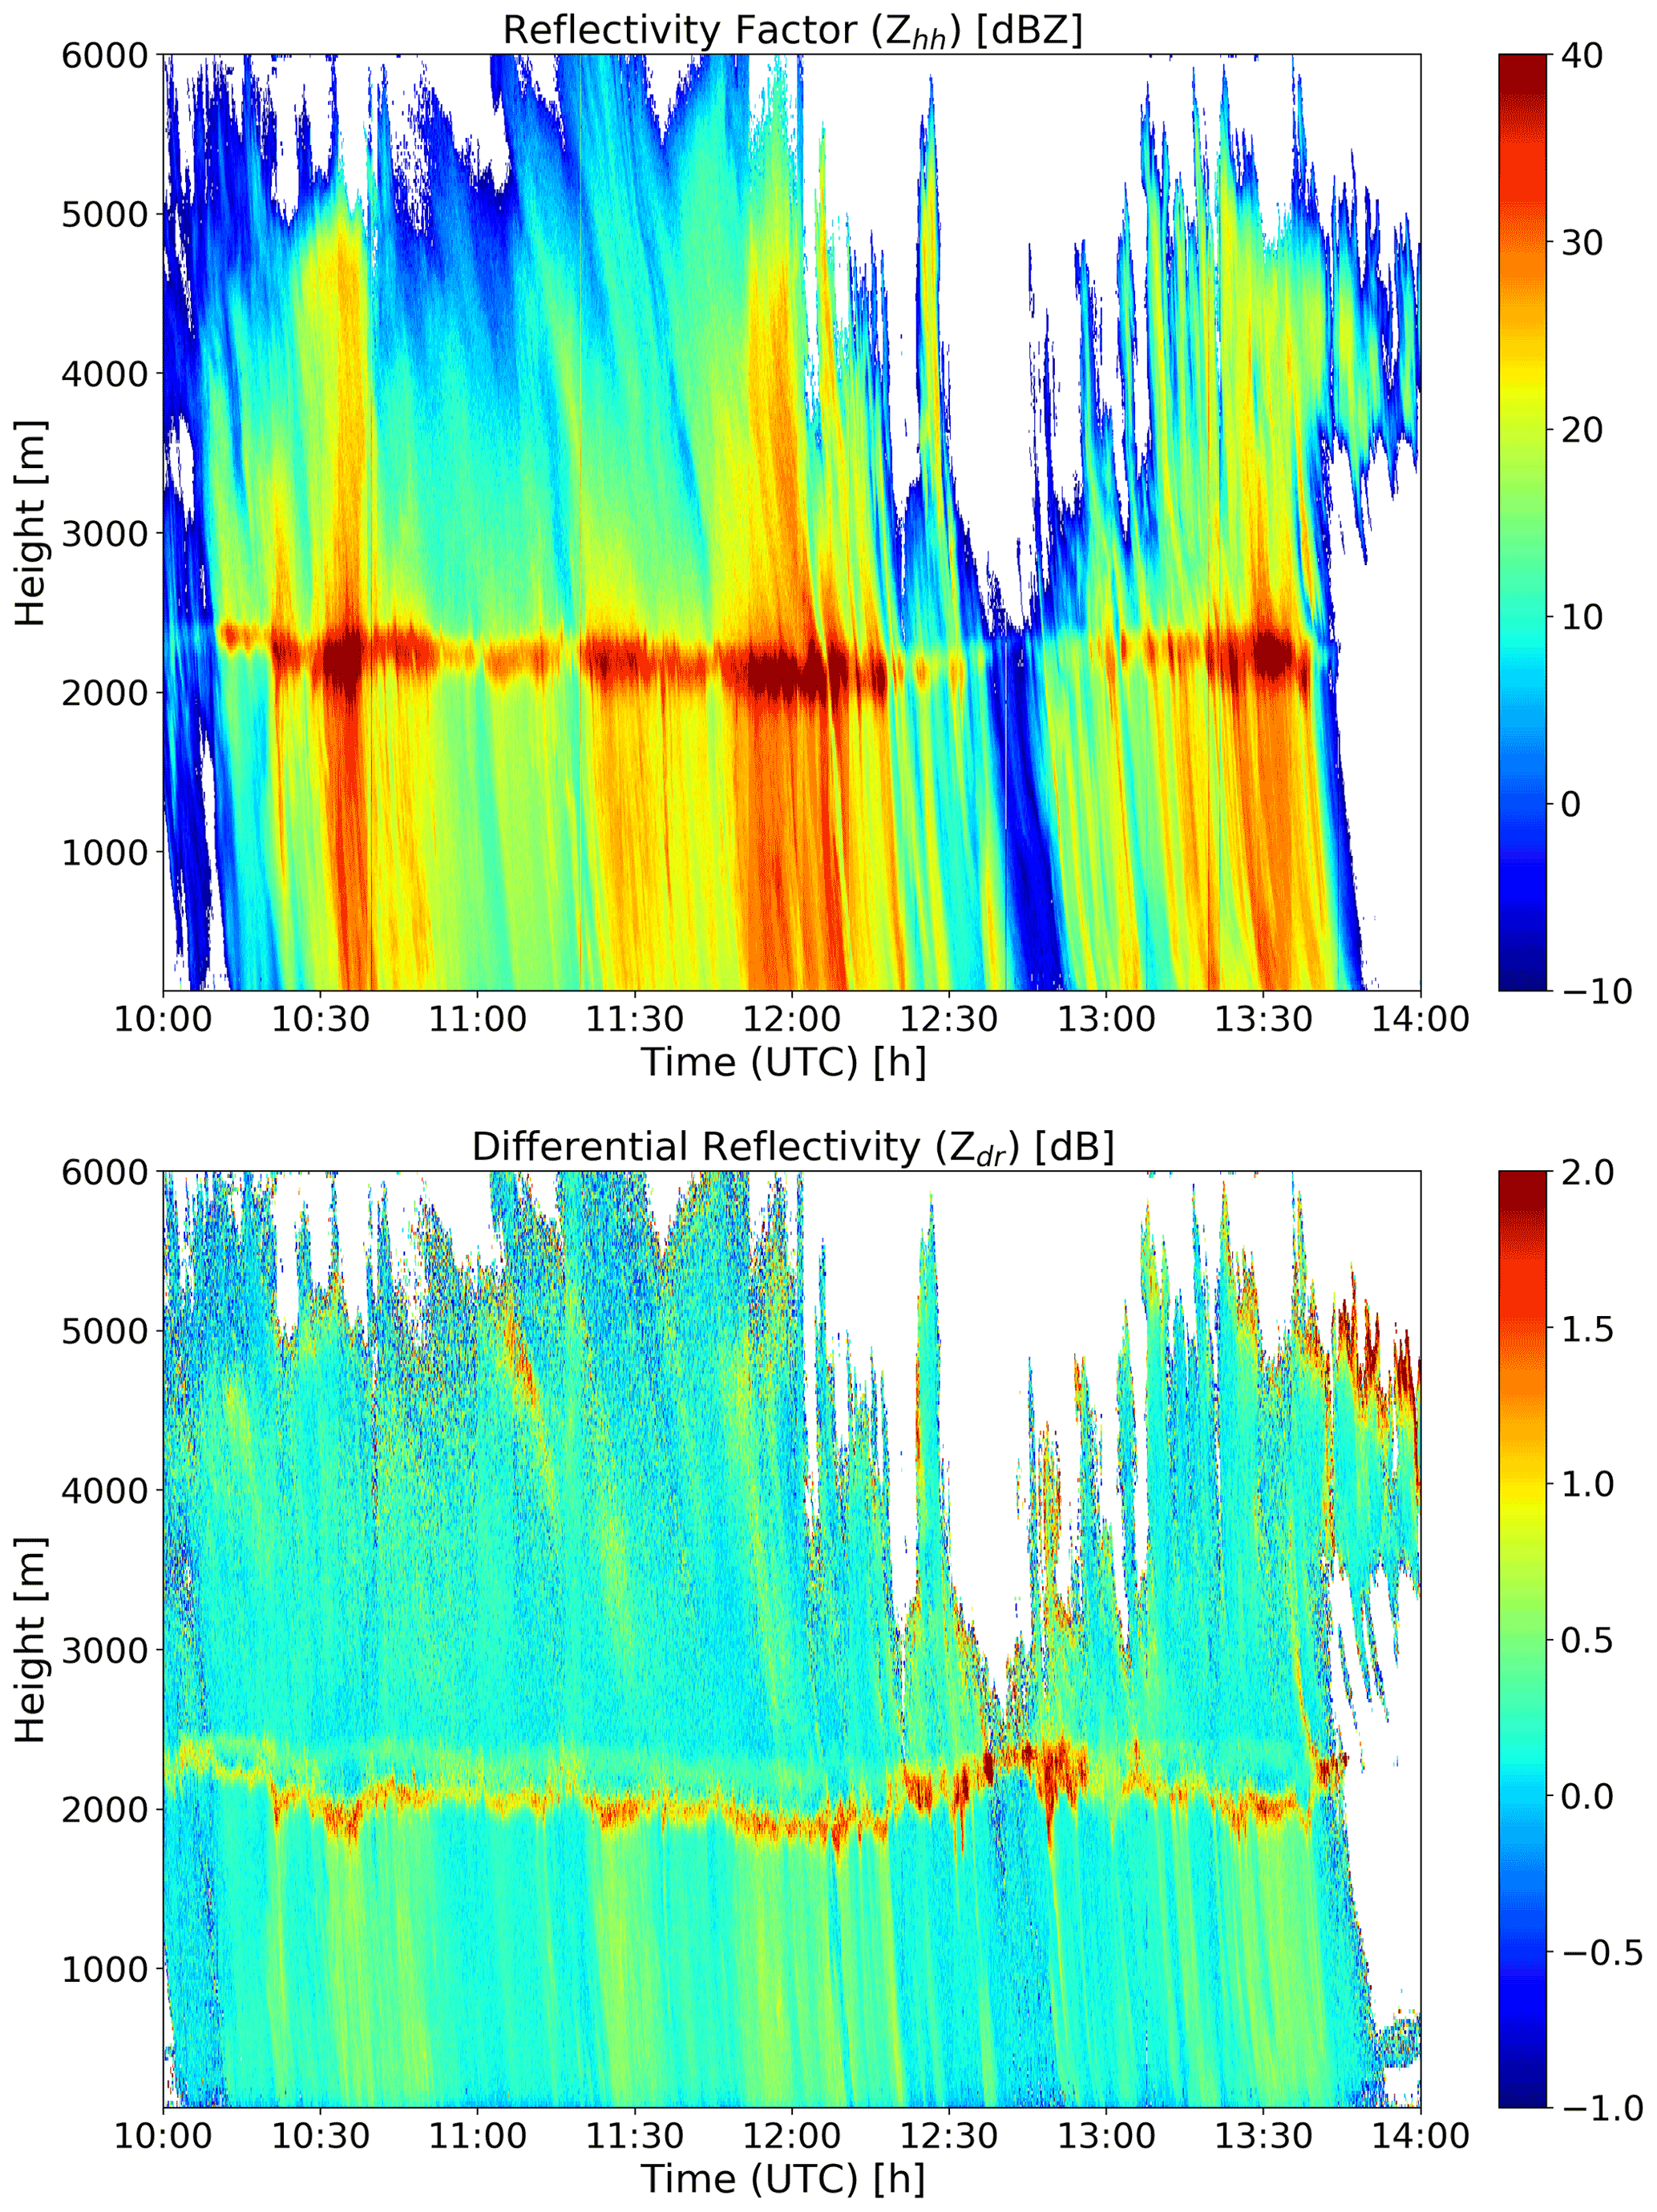
Figure 1Height–time plots (top to bottom) of reflectivity factor (dBZ) and differential reflectivity (dB) on 11 October 2014.
In order to make the radar data comparable with the disdrometer data, all Zhh and Zdr measurements were down-sampled over successive 30 s sampling intervals. The radar and disdrometer data were then synchronized by determining the time shift that maximized the correlation coefficient between Zhh Parsivel and Zhh TARA.
Concerning the calibration of Zhh and Zdr, noise measurements were performed every day to account for possible variations in range, especially at the beginning and end of the IF filter. Before the start of the campaign, the calibration of Zdr was verified using vertical profiling of drizzle and very light rain. The resulting histograms showed a mean offset of −0.11 dB with a standard deviation of 0.05 dB. Consequently, an offset of +0.11 dB was added to the measured Zdr for the whole ACCEPT campaign. For the calibration of Zhh, the transmit power was stored in the dataset, and there was a near-field correction for the non-full-overlap of the transmit and receive antenna beams using the method described in Sekelsky and Clothiaux (2002). However, an end-to-end calibration for Zhh was missing.
2.3 List of events
A total of seven rain events over the whole measurement campaign were selected for further analysis. The criteria used to select events were as follows.
-
Each event must consist of predominantly stratiform rain and exhibit a well-defined melting layer signal in the radar data.
-
Each rain event must be at least 2 h in duration. This was deemed necessary to have enough data to fit a reliable μ–Λ relation and compute relevant performance metrics.
-
There should be no clear sign of changes in dynamics or microphysics (Jameson and Kostinski, 2001; Gorgucci et al., 2001; Uijlenhoet et al., 2003) with no long dry periods within each event.
-
Each event must contain several Zdr and Zhh values larger than 0.1 dB and 5 dBZ, respectively.
Table 1 presents a summary of the duration, rain intensity, and mass-weighted mean diameter (based on the disdrometer data) for each of the seven selected events. As can be seen, most of the events last between 120 and 150 min. The longest on 3 November is slightly longer than 4 h. The low rain intensity and mass-weighted mean drop diameter values confirm that the selected events are mostly comprised of light to moderate stratiform rain. This makes sense given the criteria used to select the events and the fact that the ACCEPT campaign took place in October–November in the Netherlands at a time when heavy convective events are rare.
For illustration purposes, one of the seven events (E2, 11 October 2014) is plotted in Fig. 1. As can be seen, this event mostly consists of stratiform rain with a moderate intensity of approximately 1.8 mm h−1 and a total duration of approximately 3 h between 10:30 and 13:45 UTC, including a short break between 12:45 and 12:55 UTC according to disdrometer observations on the ground (Fig. 2). The mass-weighted mean diameter is 1.1 mm, which is typical for light stratiform rain and small raindrop sizes. Event 2 was chosen because it has a relatively stable, well-defined melting layer around 2 km height as shown by the enhanced values of Zhh and Zdr in Fig. 1 at the top and bottom, respectively. The event also has a relatively low horizontal wind speed, which makes it easier to compare the radar retrievals aloft with the disdrometer measurements on the ground.
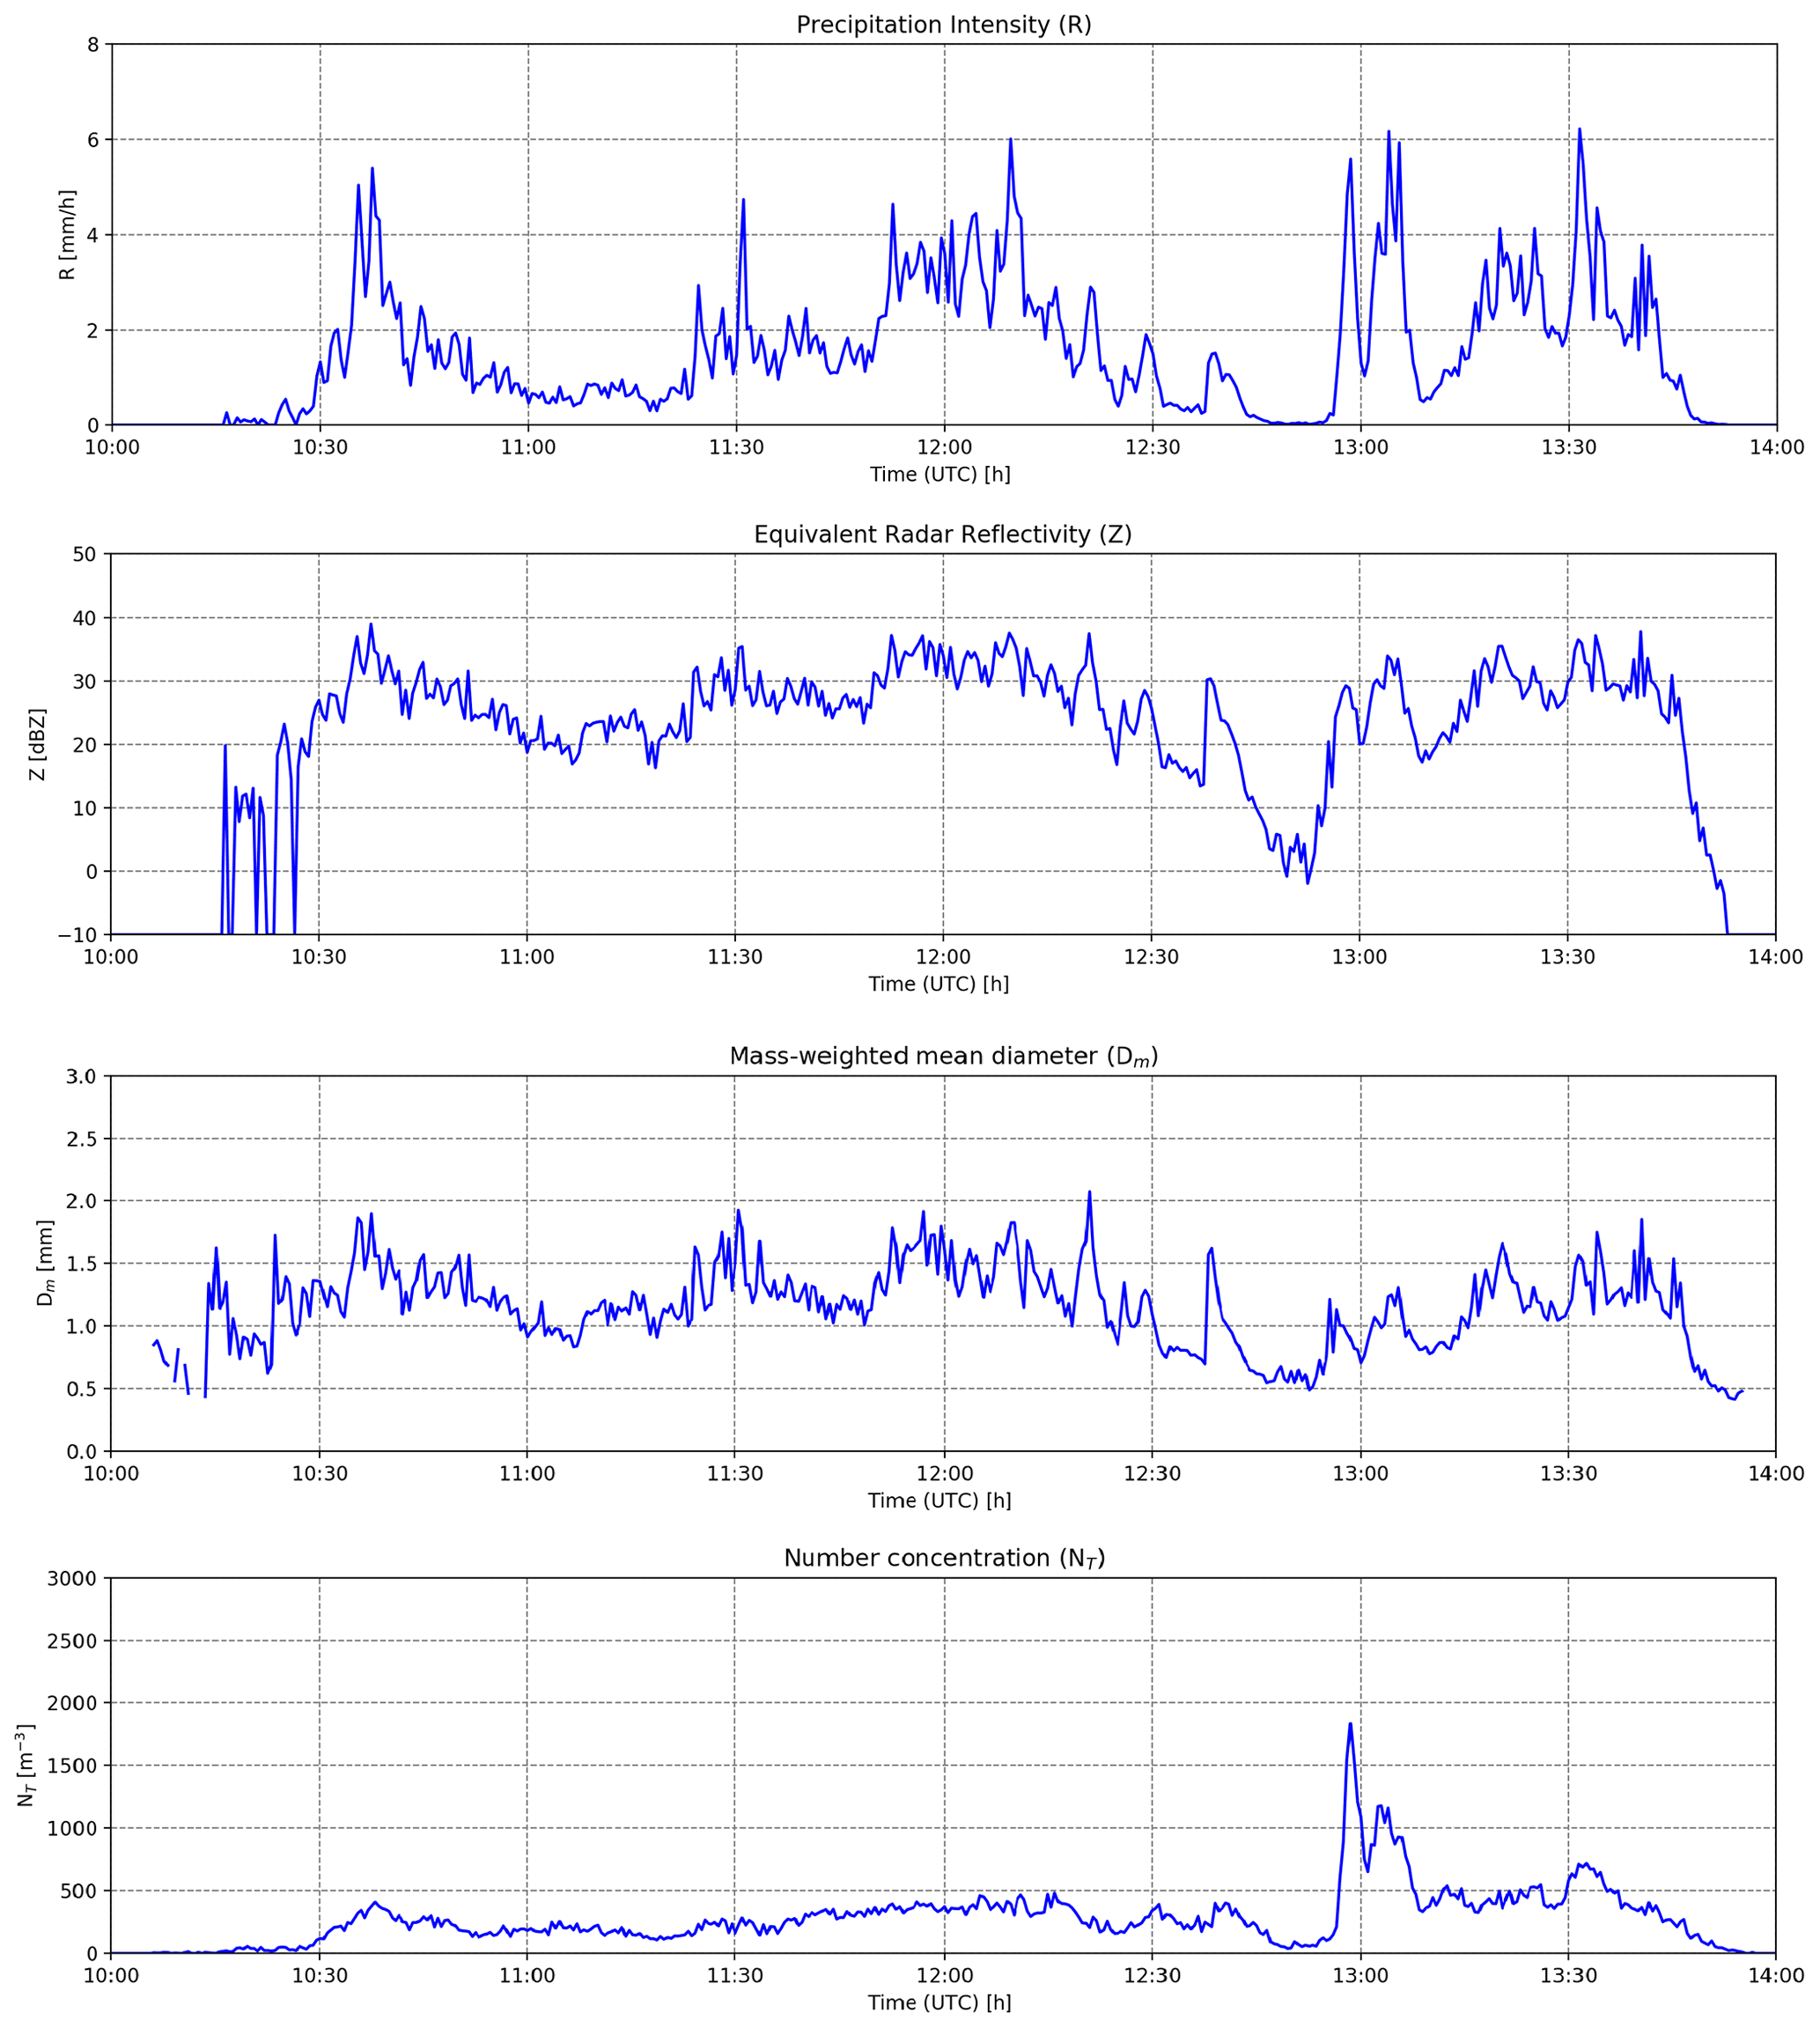
Figure 2Time series (top to bottom) of precipitation intensity (mmh−1), reflectivity factor (dBZ), mass-weighted mean diameter (mm), and number concentration (m−3) from Parsivel disdrometer data on 11 October 2014.
3.1 DSD model
The model used to approximate raindrop size distributions (DSDs) in this paper is the gamma distribution proposed by Ulbrich (1983):
where N(D) is the raindrop size distribution in mm−1 mm−3, μ is the shape parameter (unitless), Λ is the slope parameter (mm−1), N0 is the intercept parameter (mm−1 μ m−3), and NT is the total number concentration (m−3). The advantage of NT over N0 is that its unit does not depend on μ (Bringi and Chandrasekar, 2001). For convenience, the gamma model is reformulated in terms of the mass-weighted mean diameter Dm (mm) and the generalized intercept parameter Nw (mm−1 m−3) (Testud et al., 2001; Bringi et al., 2003) to
where f(μ), Nw, and Dm are given by
In the equations above, LWC denotes the liquid water content (in g m−3), and ρw is the density of liquid water (10−3 g mm−3).
It should be mentioned that even though the gamma distribution is the most popular and widely accepted model for representing DSDs in the literature, several studies have questioned its adequacy (Gatidis et al., 2020; Thurai et al., 2019; Cugerone and De Michele, 2015; Adirosi et al., 2016), setting criteria and proposing different tools to check the gamma hypothesis on a case-by-case basis.
3.2 Parameter fitting
The best parameters (μ, Dm, and Nw) for describing the DSDs measured by the disdrometer are obtained by using normalized parameterization of the gamma DSD model based on Dm (ratio of fourth- to third-order moment). To estimate μ, we first calculate Dm and Nw (directly from the measured DSD spectra). The value of μ is determined by testing all possible values of μ between −3 and 15 and choosing the one that minimizes the cost function (CF, Eq. 6). Finally, we derive Λ through its relationship with Dm and μ (Eq. 5):
where Di is the center of the ith diameter class in the Parsivel disdrometer and Nobs (Di) represents the volumetric size distribution measurements for each diameter class. Note that the index i ranges from 3 to 22 because the first two diameter classes in the Parsivel are always zero and the diameter classes above 22 correspond to particles that are too large to be associated with rain.
3.3 μ–Λ relation
When an empirical relation between shape and scale parameters is used the gamma model is often called constrained gamma. Note that the term “constrained gamma” denotes a gamma DSD model in which the shape and rate parameters are linked by a deterministic function. Mathematically, this is equivalent to reducing the number of free parameters from three to two, which is convenient in radar-based DSD retrievals. However, the uncertainty related to estimating μ and Λ based on observed DSD spectra remains. Hence, the constrained gamma DSD model and all its associated moments still remain stochastic in nature.
Numerous studies have used and proposed constrained relationships between these two DSD parameters. The most common models are based on second-order polynomial fits, firstly introduced by Zhang et al. (2001, 2003). Since then, several other studies have proposed updated polynomial μ–Λ relationships based on either seasonal (Seela et al., 2018) or regional criteria (Chen et al., 2016). Polynomial models between μ and Λ were also proposed for DSD retrievals using microwave link measurements (Berne and Schleiss, 2009; van Leth et al., 2020). In this study, μ–Λ relationships are modeled using a slightly different power-law model:
with two coefficients α and β as given in Eq. (8).
The power-law model above was chosen mainly for mathematical reasons since it ensures that Λ remains positive across all scales and avoids the problem of having to choose between a first-, second-, or third-order polynomial. The power-law model is also easier to justify than a parabola from a physical and mathematical point in light of the scale invariance of DSDs under proper normalization, as pointed out by previous researchers (Torres et al., 1994; Testud et al., 2001). However, for the sake of completeness, we also examined the polynomial model during our study and concluded that it did not make a big difference from a practical point of view (i.e., it has similar goodness of fit over the considered range of μ values). Nevertheless, we decided to use the power-law model in this study since it is more appropriate than a polynomial from a theoretical point of view.
Note that the goal of this study is not to question the validity of previous μ–Λ relationships nor optimize the parameters behind them (which depend on the dataset used) but to take a closer look at the sensitivity of the obtained fits to various underlying assumptions. Critical aspects that were investigated include whether the μ–Λ relation remains stable with respect to different sampling resolutions, drop number concentrations, types of stratiform rain events, or the validity of the gamma DSD hypothesis itself. At the same time, one has to keep in mind that the limitation of the Parsivel in terms of the detection of small droplets might lead to overestimated Dm and μ values, since the width of the distribution will be underestimated.
3.4 DSD retrieval method
Because the gamma DSD model involves three parameters, three different radar measurements representative of three weighted moments of the DSD are required to retrieve the DSD in a given radar resolution volume. The retrieval method used in this paper is described in Zhang et al. (2001). It involves a combination of reflectivity factor at horizontal polarization (Zhh), differential reflectivity (Zdr), and a empirical relationship between the DSD shape parameter (μ) and slope parameter (Λ), commonly referred to as a μ–Λ relationship. The main steps of the retrieval method can be summarized as follows.
-
Impose a μ–Λ relationship Λ=g(μ) based on nearby disdrometer observations or literature values. In our case, a power-law relationship is used:
where the prefactor and exponent were determined by combining all the data from all seven events in Table 1.
-
Consider all possible values of μ between −3 and 15 in steps of 0.01. For each μ value, calculate Zdr through Eq. (9):
where σhh (mm2) and σvv (mm2) are the copolar radar cross-sections of raindrops with equivolume spherical diameter D at horizontal and vertical polarizations, respectively, and Dmax (mm) is a reasonable maximum drop diameter (e.g., 7 mm in our case). In the literature several studies tried to link Dmax with D0 such as Ulbrich and Atlas (1984), who concluded that is what is typically observed in natural rainfall, and Carey and Petersen (2015), who recommended using . The detailed expression of the radar cross-sections can be found in Eq. (3) in Unal (2015).
-
Keep the μ value for which the Zdr value in Eq. (9) is closest to the measured Zdr value by the radar.
-
Infer Nw from Zhh in Eq. (10), where is the retrieved μ value from the previous step:
where λ is the radar wavelength in millimeters (i.e., 90.96 mm for TARA), is the dielectric factor of water, and .
-
Retrieve by integrating the retrieved DSD:
4.1 Variations in μ–Λ relationship from one event to another
In the following, we analyze the variations of the μ–Λ relationships from one event to another. For this, a filter was applied identical to Gatidis et al. (2020), and only the cases which satisfied the gamma model hypothesis were considered. The adequacy of the gamma model was assessed based on a combination of a Kolmogorov–Smirnov goodness-of-fit test and Kullback–Leibler divergence. In total, approximately 40 % of the DSDs passed the tests and were accepted. On an event-to-event basis, that number varies between 36 % and 45 %.
In order to investigate and visualize possible differences between events, all seven events were plotted using different colors in Fig. 3. The overall relationships by Zhang et al. (2001, 2003) were added for comparison. As can be seen in Fig. 3, most of the event-specific μ–Λ relations stay relatively close to the overall relation, except for events 2 and 6 for which larger deviations for higher values of μ (i.e., μ>8) are visible. For event 6, the differences can be explained by the limited range of μ, with most values remaining between 3 and 5 and only a single observation falling between 5 and 15. This limited range of variability significantly affects the reliability of the estimated μ–Λ relationship, especially for values smaller than 3 and larger than 5. For event 2, the differences can be explained by the presence of a few outliers in the upper-right part of the scatter plot, corresponding to DSDs with low number concentrations and high sampling uncertainties.
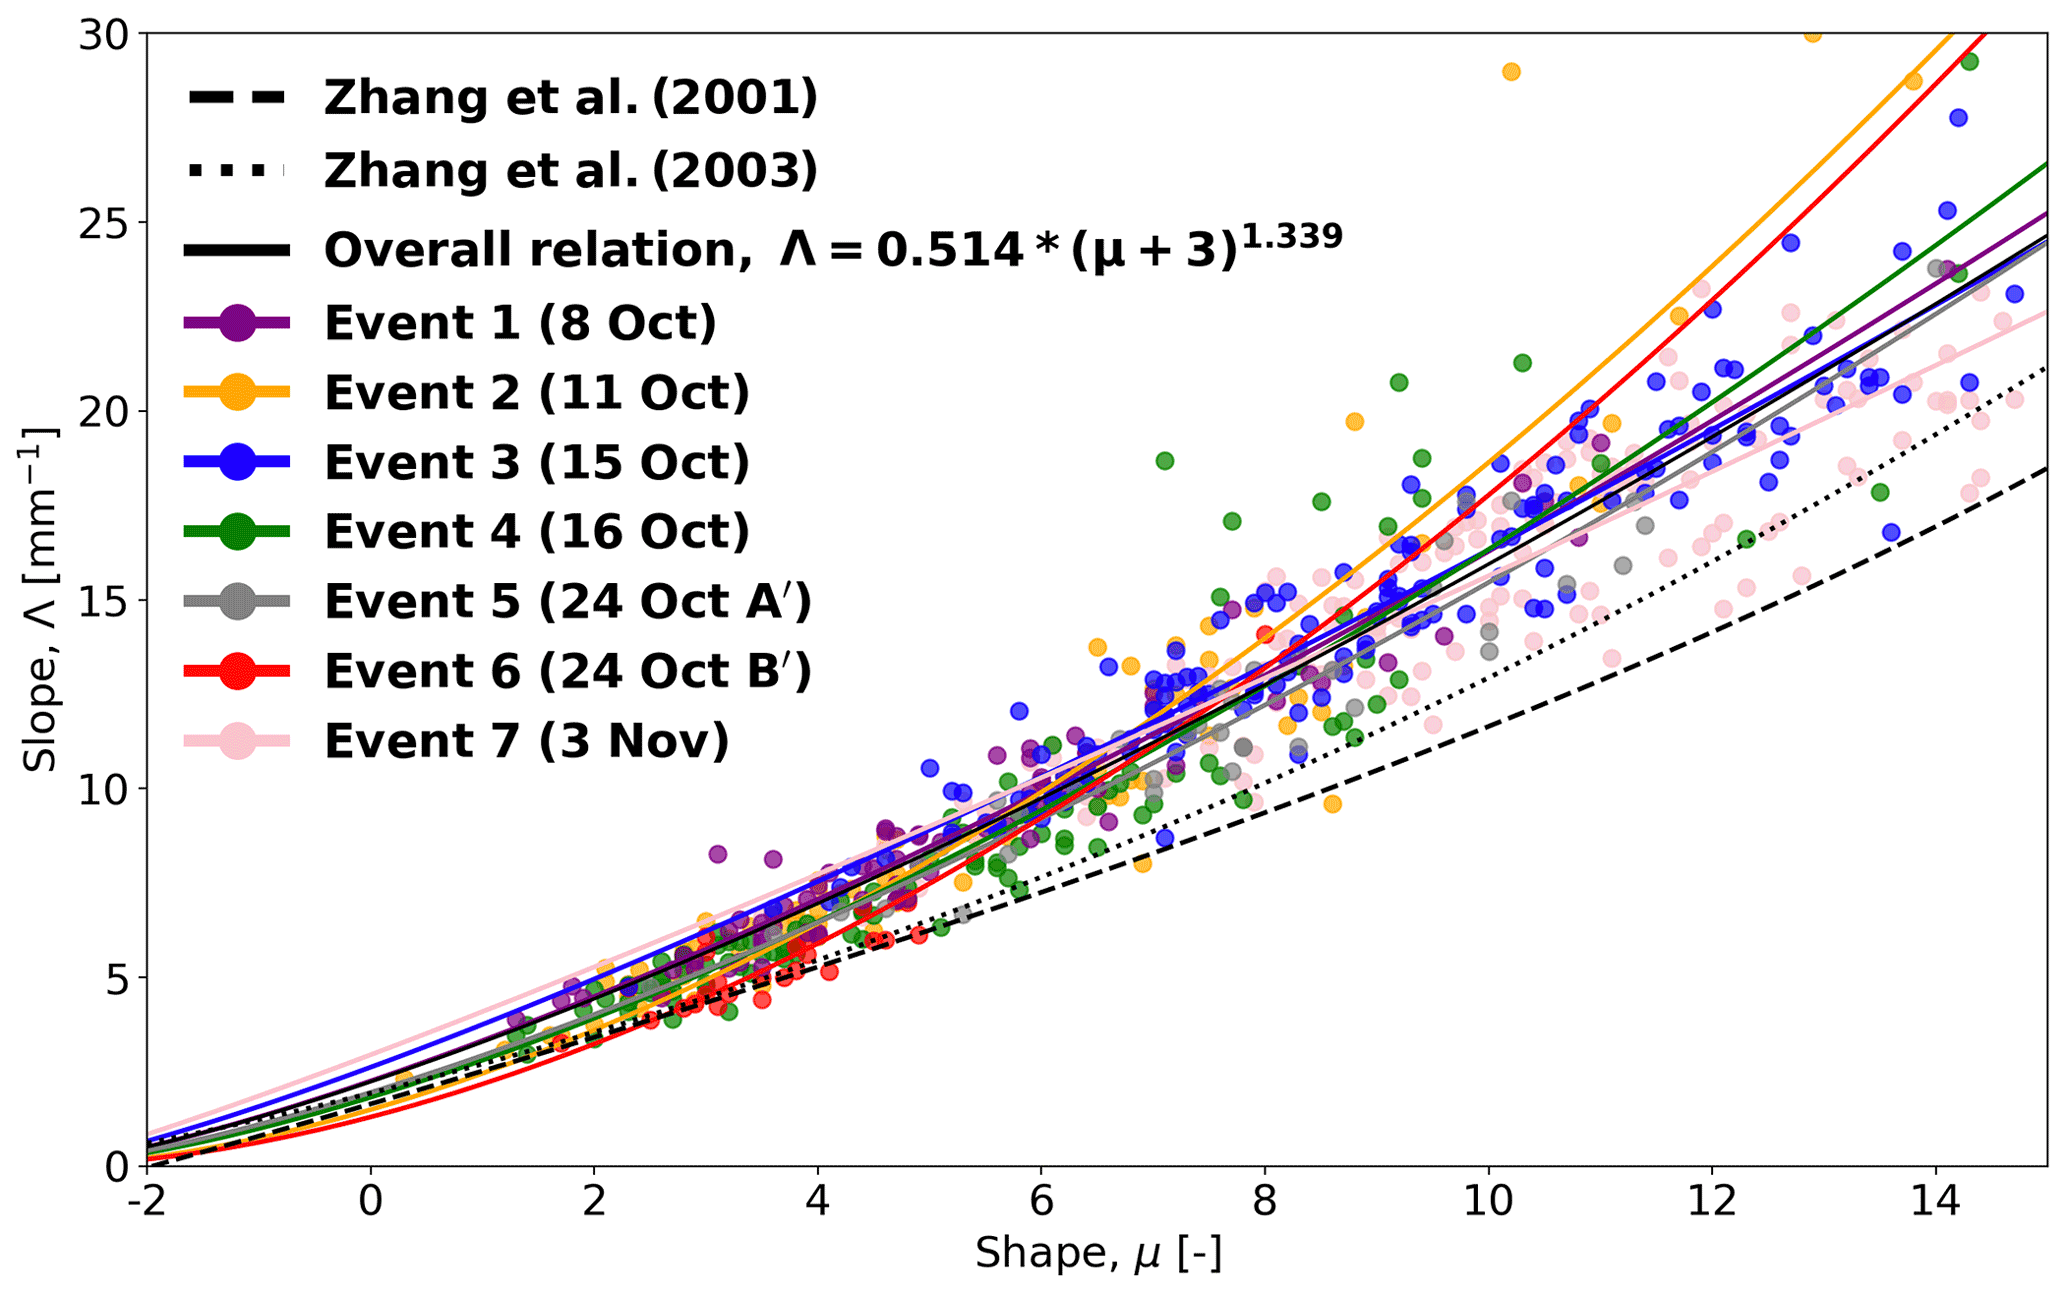
Figure 3Scatter plot between μ and Λ of the selected events colored by event (only gamma DSDs were considered). The μ–Λ relationship of each event was fitted and plotted against the overall relationship. The proposed relations by Zhang et al. (2001, 2003) were plotted as a reference from the literature.
For each selected event, the sample sizes, the fitted power-law parameters α and β, and their percentage relative differences against the overall relation are presented in Table 1. The relative errors of the parameters depend on the characteristics of each event, with event 1 being the closest to the overall relation and event 6 exhibiting the largest differences. In order to have a more complete picture of each event, the correlation coefficient between μ and Λ as well as the root mean square deviation (RMSD) between μ and Λ points of each event and the overall relationship were calculated and are presented in Table 1. Even though event 6 has the weakest correlation coefficient, it has the lowest RMSD mainly due to its small sample size (the smallest in the event list) and the way the data are concentrated close to the fitted line. Event 1 shows the strongest relation between μ and Λ, while at the same time event 2 has the highest RMSD because of its outliers in the upper-right part of the scatter plot.
The event-specific and overall μ–Λ relations are clearly different from previously proposed relations by Zhang et al. (2001, 2003). For a fixed μ value, the overall μ–Λ relation for the seven selected events predicts higher Λ values compared with the ones by Zhang et al. (2001, 2003). This can be explained by the fact that Λ is inversely proportional to the mass-weighted mean diameter and that the Zhang et al. (2001, 2003) relations were derived under different climatological conditions in Oklahoma in the US, where convective rain events with larger raindrops are more common than in the Netherlands.
Although the overall relationship might not necessarily be optimal for each individual event, our results show that it still provides a fairly good approximation of the average μ–Λ relationship across all seven considered events. Also, one has to keep in mind that the low sample sizes and limited ranges for μ make it practically impossible to derive reliable and representative μ–Λ relations for each individual event. To avoid sampling issues such as those encountered in event 6 and increase the robustness of our results, all remaining sensitivity analyses and retrievals were therefore conducted using the overall μ–Λ relation.
4.2 Sensitivity of μ–Λ relationship to gamma hypothesis
One crucial factor that could affect the μ–Λ relationship is the gamma DSD assumption. To investigate this issue, we temporarily added back all DSDs that were excluded from the previous analysis because they did not conform to the gamma model according to the criteria set by Gatidis et al. (2020). For each event, we recalculated the individual μ–Λ relationship and compared the new results to the ones obtained using only the DSDs that satisfied the gamma assumption. In six out of seven cases, the inclusion of the non-gamma cases resulted in larger α and smaller β values. However, these changes were not reflected visually in the μ–Λ scatter plot as the two opposite changes compensate for each other. Therefore, apart from slightly changing the parameter values, the gamma hypothesis does not appear to have a strong effect on the overall μ–Λ relation. Also, the changes to α (0.518 from 0.514) and β (1.328 from 1.339) were rather small and not statistically significant. The fact that the overall μ–Λ relation is rather stable with respect to the gamma DSD hypothesis is an interesting result, especially given the fact that there are large differences in sample sizes between non-gamma (1829) and gamma DSDs (652).
4.3 Sensitivity of μ–Λ relationship to NT
Using the overall relationship from Sect. 4.1 as a reference, the influence of the number concentration on the μ–Λ relationship was investigated. It would be interesting to investigate whether the events for which the DSD is predominantly number-controlled lead to more or less stable μ–Λ relationships than events with size-controlled DSDs. Three different NT thresholds corresponding to different percentiles of NT (25 %, 50 % and 75 %) were applied, and only the DSDs with number concentrations above these thresholds were considered. In Fig. 4, the three derived μ–Λ relations obtained after applying the NT filters are shown against the overall relation (no filter). As the NT threshold is increased from 225 to 300 and 390 m−3 (Figs. 4b–d), the μ–Λ relation remains relatively stable for lower μ values, gradually getting closer to the one proposed by Zhang et al. (2003), especially for higher values of the shape parameter (μ>7). This can be partly explained by the fact that, on average, higher NT values correspond to higher rainfall intensities and larger drop diameters. Also, the average mass-weighted mean diameter increases by approximately 10 % as we increase the threshold on NT. This may not represent a big change, but it can be enough to slightly affect the μ–Λ relation. However, we believe the main reason the μ–Λ relation changes with increasing NT is sampling uncertainty. Indeed, our dataset predominantly features stratiform rain events with low rainfall intensities, low number concentrations, and relatively low and constant mass-weighted mean diameters (see Table 1). As we apply higher thresholds on NT, the DSD samples that only contain a small number of drops and are associated with a higher sampling uncertainty get removed. Consequently, the remaining DSDs with higher number concentrations tend to be associated with lower sampling uncertainties, which leads to more reliable μ–Λ estimates. Moreover, it is worth pointing out that because of the way μ is estimated through the cost function in Eq. (6), the error distribution of μ tends to be positively skewed. On average, we are therefore more likely to overestimate μ and underestimate the spread of the DSD rather than the opposite. Since μ and Λ values are positively correlated through their relation with Dm in Eq. (5), any overestimated μ value automatically results in an overestimated Λ value (to compensate and get the correct Dm). Consequently, as we increase the NT threshold, sampling errors get reduced and the positively skewed outliers with high μ and Λ values progressively disappear. This removes more and more points on the upper side of the μ–Λ curve, pushing the new relation down towards the one proposed by Zhang et al. (2003). Regarding the sensitivity of the α and β parameters describing the μ–Λ relationship, our analyses show that they exhibit an opposite behavior, increasing and decreasing, respectively, as we increase the threshold on NT. The latter can be attributed to a gradual flattening of the relationship and increase of the intercept parameter. Note that another similar approach to reduce the uncertainty in the estimated μ–Λ relationship without applying a threshold on NT could be to consider temporal aggregation intervals longer than 30 s. However, this would significantly reduce the amount of data available for analysis.
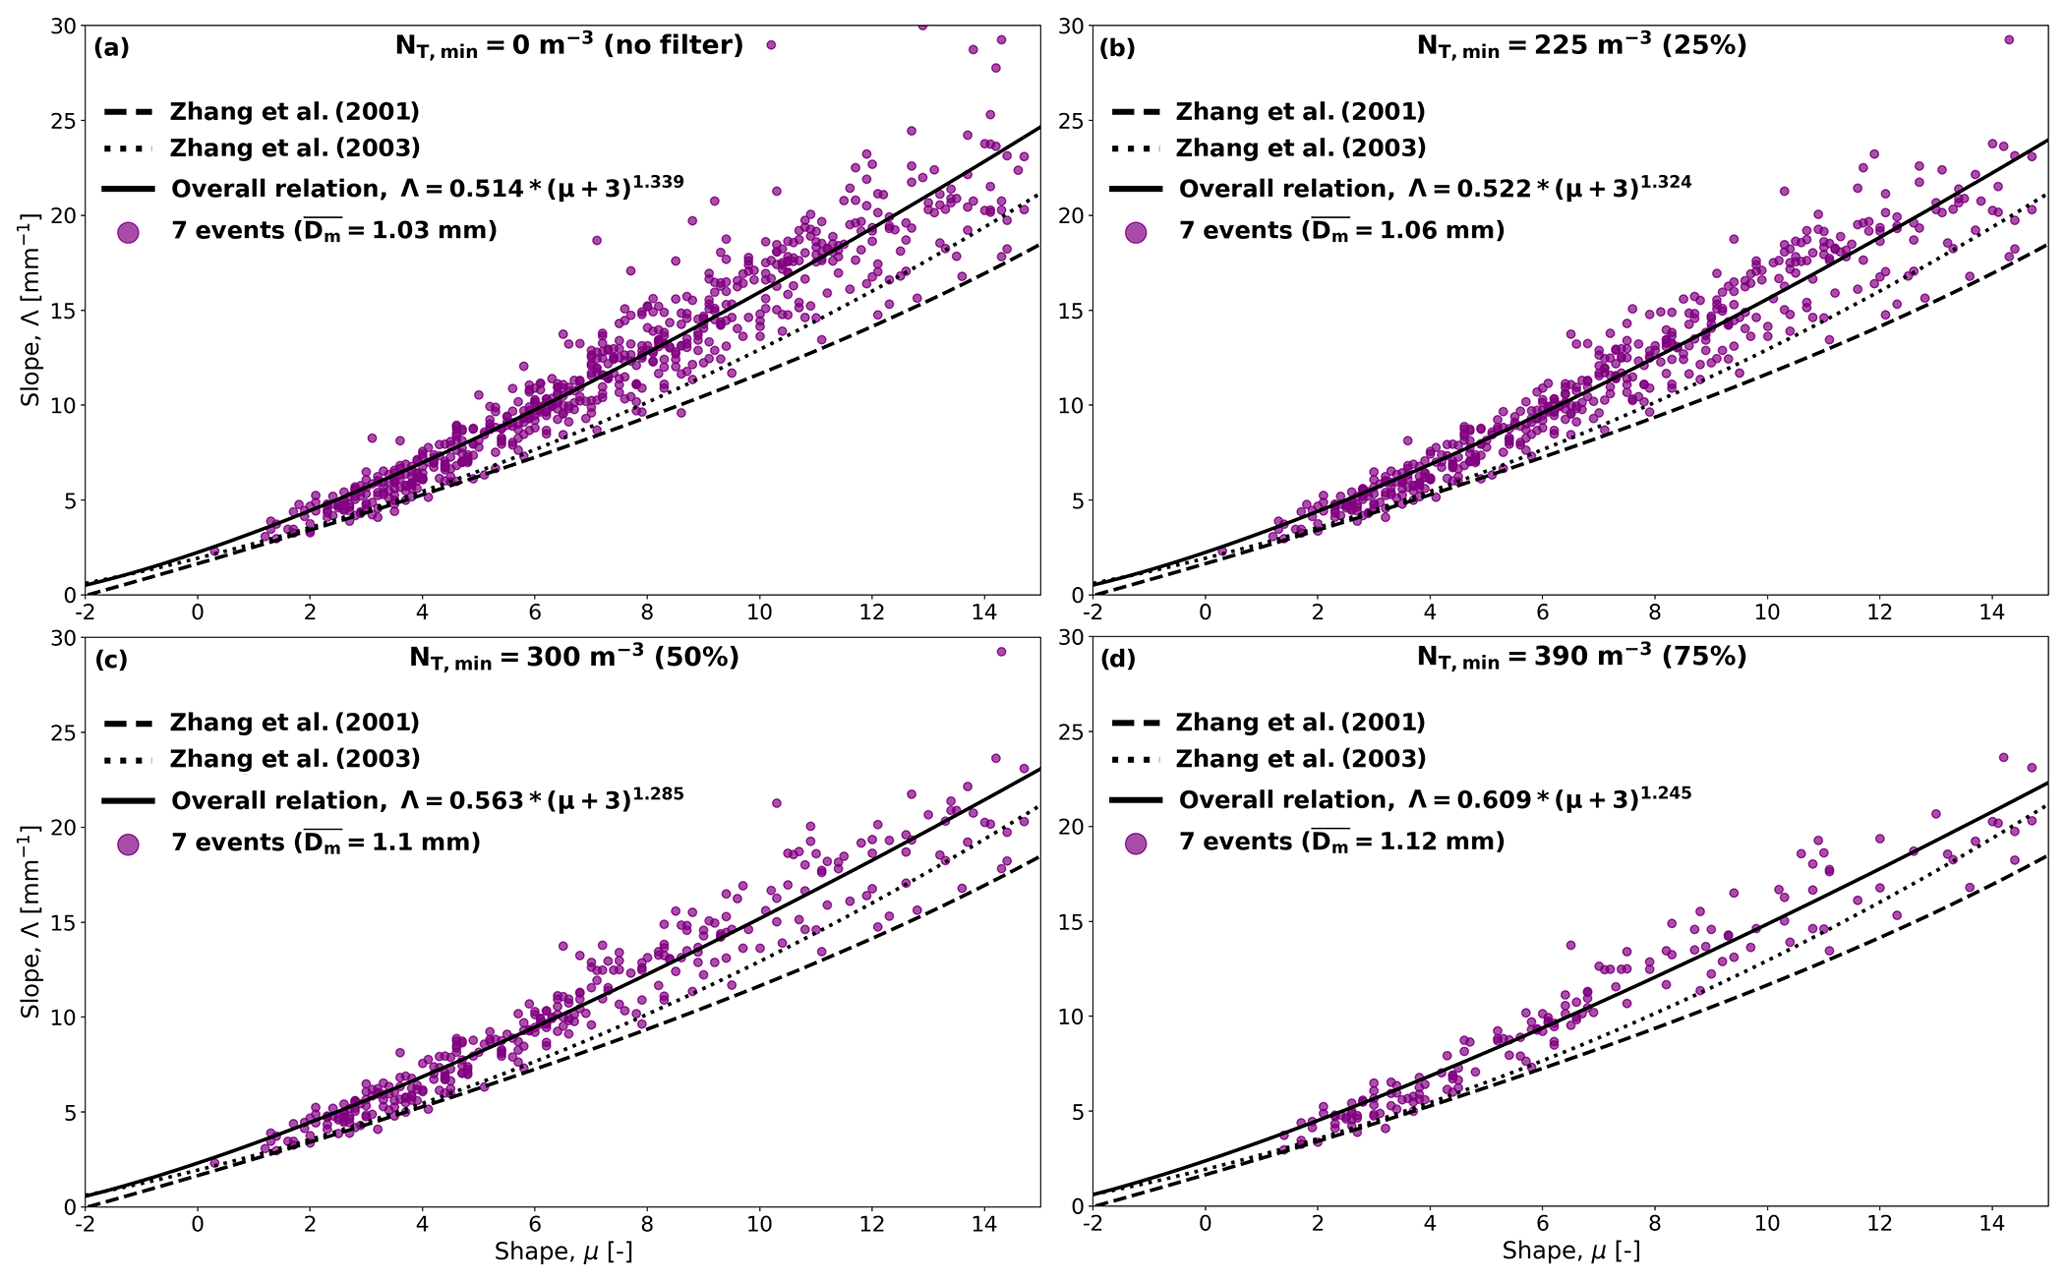
Figure 4Four scatter plots between μ and Λ of the selected events using four different minimum NT thresholds corresponding to different percentiles of NT. The μ–Λ relationship of each NT threshold was fitted and plotted against the proposed relations by Zhang et al. (2001, 2003). (a) m−3 (no filter), (b) m−3, (c) m−3, and (d) m−3.
4.4 Influence of sampling resolution on the overall μ–Λ relation
In the following, the DSD data corresponding to the seven selected events were resampled at four different temporal resolutions of 30, 60, 240, and 480 s to investigate the sensitivity of the μ–Λ relationship to the choice of the temporal resolution. Similarly to before, only the resampled DSDs which satisfied the gamma hypothesis were kept for analysis. Figure 5 shows that the overall μ–Λ relationship remains very stable, regardless of the considered sampling resolution. Table 2 shows more details about the fitted power-law parameters α and β at each resolution, including their percentage relative differences against the overall relation at 30 s. We can see that the relative error affecting the parameters slightly increases as the temporal resolution is reduced. The latter can be attributed to the lower number of samples available for fitting the parameters. Apart from these obvious sampling effects, the choice of the temporal aggregation scale seems to have very little effect on the overall μ–Λ relationship, which remains rather stable across multiple aggregation timescales.
Table 2The parameters of the μ–Λ relationship (α, β) for different sampling resolutions and their percentage relative error against the corresponding values at 30 s.
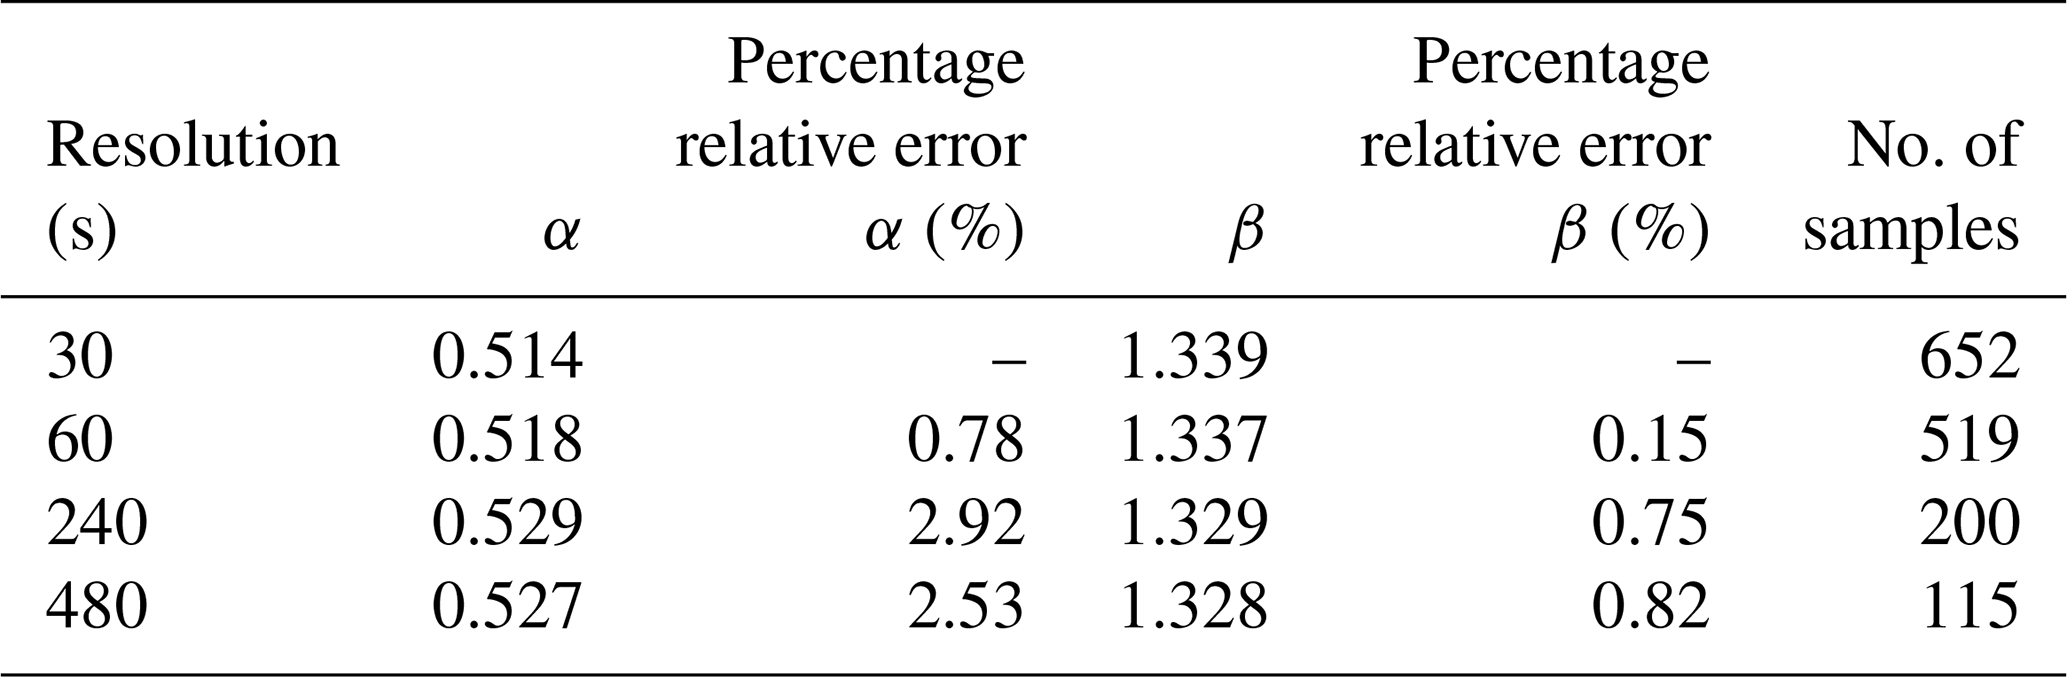
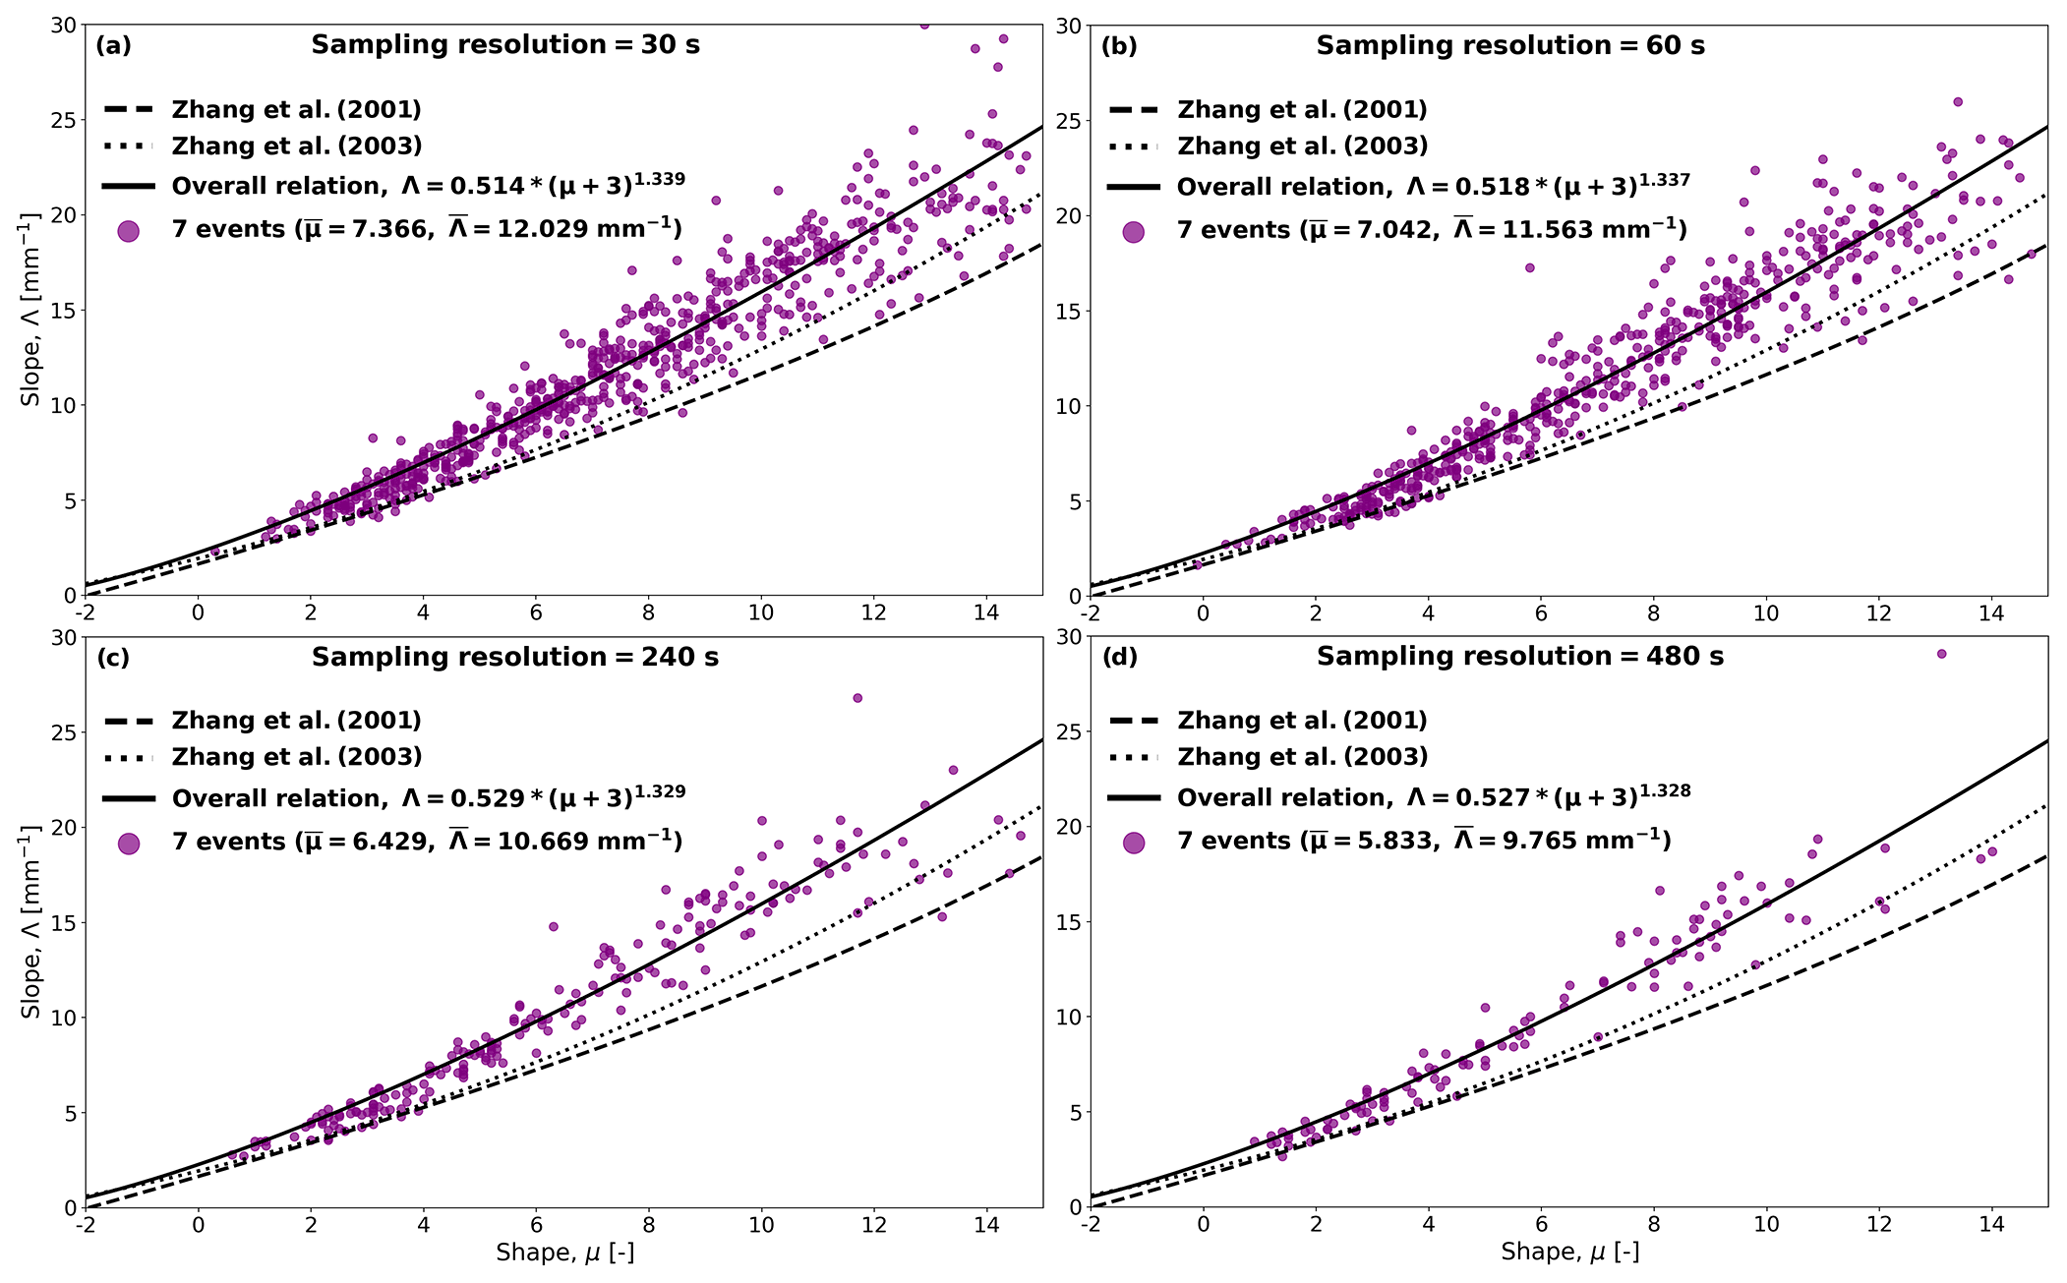
Figure 5Four scatter plots between μ and Λ of the selected events using different resolutions. The μ–Λ relationship of each resolution was fitted and plotted against the proposed relations by Zhang et al. (2001, 2003). (a) 30 s, (b) 60 s, (c) 240 s, and (d) 480 s.
Note that as we decrease the temporal resolution, the mean values of μ and Λ (Fig. 5) also decrease. This means that there is a progressive transition from peaked DSDs at higher sampling resolutions to broader, more widespread DSDs at lower resolutions. Decreasing the sampling resolution therefore causes the μ and Λ values to shift toward the bottom-left part of the scatter plot. However, while the points shift, they remain remarkably close to the initial μ–Λ curve derived at the highest temporal resolution of 30 s. The fact that the μ and Λ values change with resolution but that the overall relation between them is preserved across scales suggests that there is a fundamental physical link between certain moments of the DSD, such as the spread and the mean. Also, this relation seems to be quite robust regardless of whether the gamma assumption is valid or not and is only slightly affected by NT. In steady rainfall conditions, it should therefore be possible to use the same μ–Λ relationship for DSD retrievals across multiple temporal scales. This is of high importance given the fact that μ–Λ relations are often used to retrieve DSDs from radar observations, which have different sampling volumes and levels of aggregation than disdrometer data. Moreover, the use of a μ–Λ relationship may still be justified from a physical point of view, even if the underlying DSDs do not strictly comply with the gamma distribution hypothesis. Obviously, the fact that we have selected relatively similar stratiform events with low rainfall intensities and low temporal variability is a crucial factor here since it means that by resampling, we do not significantly change the properties of the DSDs or mix together different rainfall regimes. By contrast, larger differences in μ–Λ relationships can be expected for mixed-type rainfall events with multiple and rapid alternations between stratiform and convective rain.
On the other hand, there is still substantial controversy in the literature around the reason why μ–Λ relations exist in the first place and why certain DSD parameters are linked to each other. One justification could be that the effective number of parameters needed to describe most DSDs is probably fewer than three. In other words, under proper normalization, all DSDs look rather similar to each other. For example, Torres et al. (1994) introduced a single DSD normalization technique based on one reference moment (usually the rain rate). Later, Testud et al. (2001) and Lee et al. (2004) proposed a more general normalization technique based on two reference moments (usually the third and sixth moments). The existence of a μ–Λ relationship may just be the consequence of such scaling laws. In their study, Moisseev and Chandrasekar (2007) have also argued that data filtering can have a strong influence on the relation itself, leading to spurious links between μ and Λ. However, this is not the case in our study. On the contrary, our results show that when events with similar characteristics are chosen, the overall μ–Λ relationship can be rather stable, barely depending on the different filters applied to the data (e.g., inclusion or exclusion of non-gamma DSDs or minimum threshold for Zhh and Zdr). Other studies have pointed out that the constraints linking μ and Λ during parameter fitting can lead to correlated errors between estimated gamma DSD parameters and biased relationships (Williams et al., 2014; Moisseev and Chandrasekar, 2007). Indeed, because of the way we fit μ and Λ through Dm (see Sect. 3.1, DSD model), the parameters end up being positively correlated with each other. In other words, if μ is overestimated, Λ will also be overestimated because it has to compensate for the bias in μ. To address this, Williams et al. (2014) proposed a σ'–Dm relationship, wherein Dm is the mass-weighted mean diameter and σ' a new mass spectrum standard deviation, defined and constructed to be statistically independent of Dm. Even though their approach seems to lead to smaller biases, our results show that it is also possible to derive reliable μ–Λ relationships without defining a new σ, simply by excluding the non-gamma DSDs cases and carefully filtering out DSDs with very low NT values.
In this section, the sensitivity of the DSD retrieval method as a whole is evaluated. First, the TARA and Parsivel observations are compared with each other to highlight their differences and understand how possible biases in reflectivity or differential reflectivity affect the accuracy of the retrievals. Then, the sensitivity of the retrieved DSD parameters to different bias corrections, scale corrections, and data filters is quantified, and possible ways to mitigate errors during retrievals are proposed.
5.1 Overall agreement between radar and disdrometer
5.1.1 Agreement of Zhh and Zdr observations between TARA and Parsivel
In this section the agreement between the Parsivel and TARA measurements is investigated. For the sake of the comparison between TARA and Parsivel observables, the radar equivalent reflectivity factor derived from disdrometer data was used as the measured reflectivity factor at horizontal polarization (Zhh,Pars). As for the differential reflectivity, using Rayleigh scattering, the calculated radar cross-sections of raindrops with equivolume spherical diameter D at horizontal and vertical polarization were used (Eq. 9) for estimating reflectivity at horizontal and vertical polarization, respectively. From those, the differential reflectivity value from the Parsivel (Zdr,Pars) can be obtained.
The goal is to quantify how well the measurements of the two sensors agree with each other before the DSD retrievals. Fig. 6 shows the scatter plots of the reflectivity factor (Zhh, top) and differential reflectivity (Zdr, bottom) from the disdrometer versus TARA at 200 m of height. For this first comparison, the Zhh and Zvv measurements of TARA were aggregated (in linear scale) to 30 s in order to be comparable with the disdrometer data. No other additional filter was applied. Figure 6a shows that Zhh measurements are highly correlated (correlation coefficient = 0.94). However, the radar significantly underestimates Zhh compared with the disdrometer. The offset in Zhh slightly varies with time but is of the order of 6 to 7 dBZ (overall bias 6.44 dBZ). Additional bias analyses at a different height of 400 m show that the offset does not change substantially with height, which suggests that the FMCW incomplete beam overlap correction at near ranges (see Sect. 2.2, radar data) works well and that the offset in reflectivity is likely due to calibration issues of TARA rather than range-related issues. Unlike Zhh, the differential reflectivity measurements appear to be in much better agreement with the disdrometer (overall bias −0.03 dB), as can be seen in the bottom panel of Fig. 6. However, the correlation for Zdr is lower (correlation coefficient = 0.71) and there is significant scatter, especially for higher values of Zdr. Note that the vast majority of Zdr values are small (less than 0.2 dB), which makes sense given that we are mostly dealing with light stratiform rain and that the elevation angle of 45∘ in TARA further reduces the magnitude of Zdr.
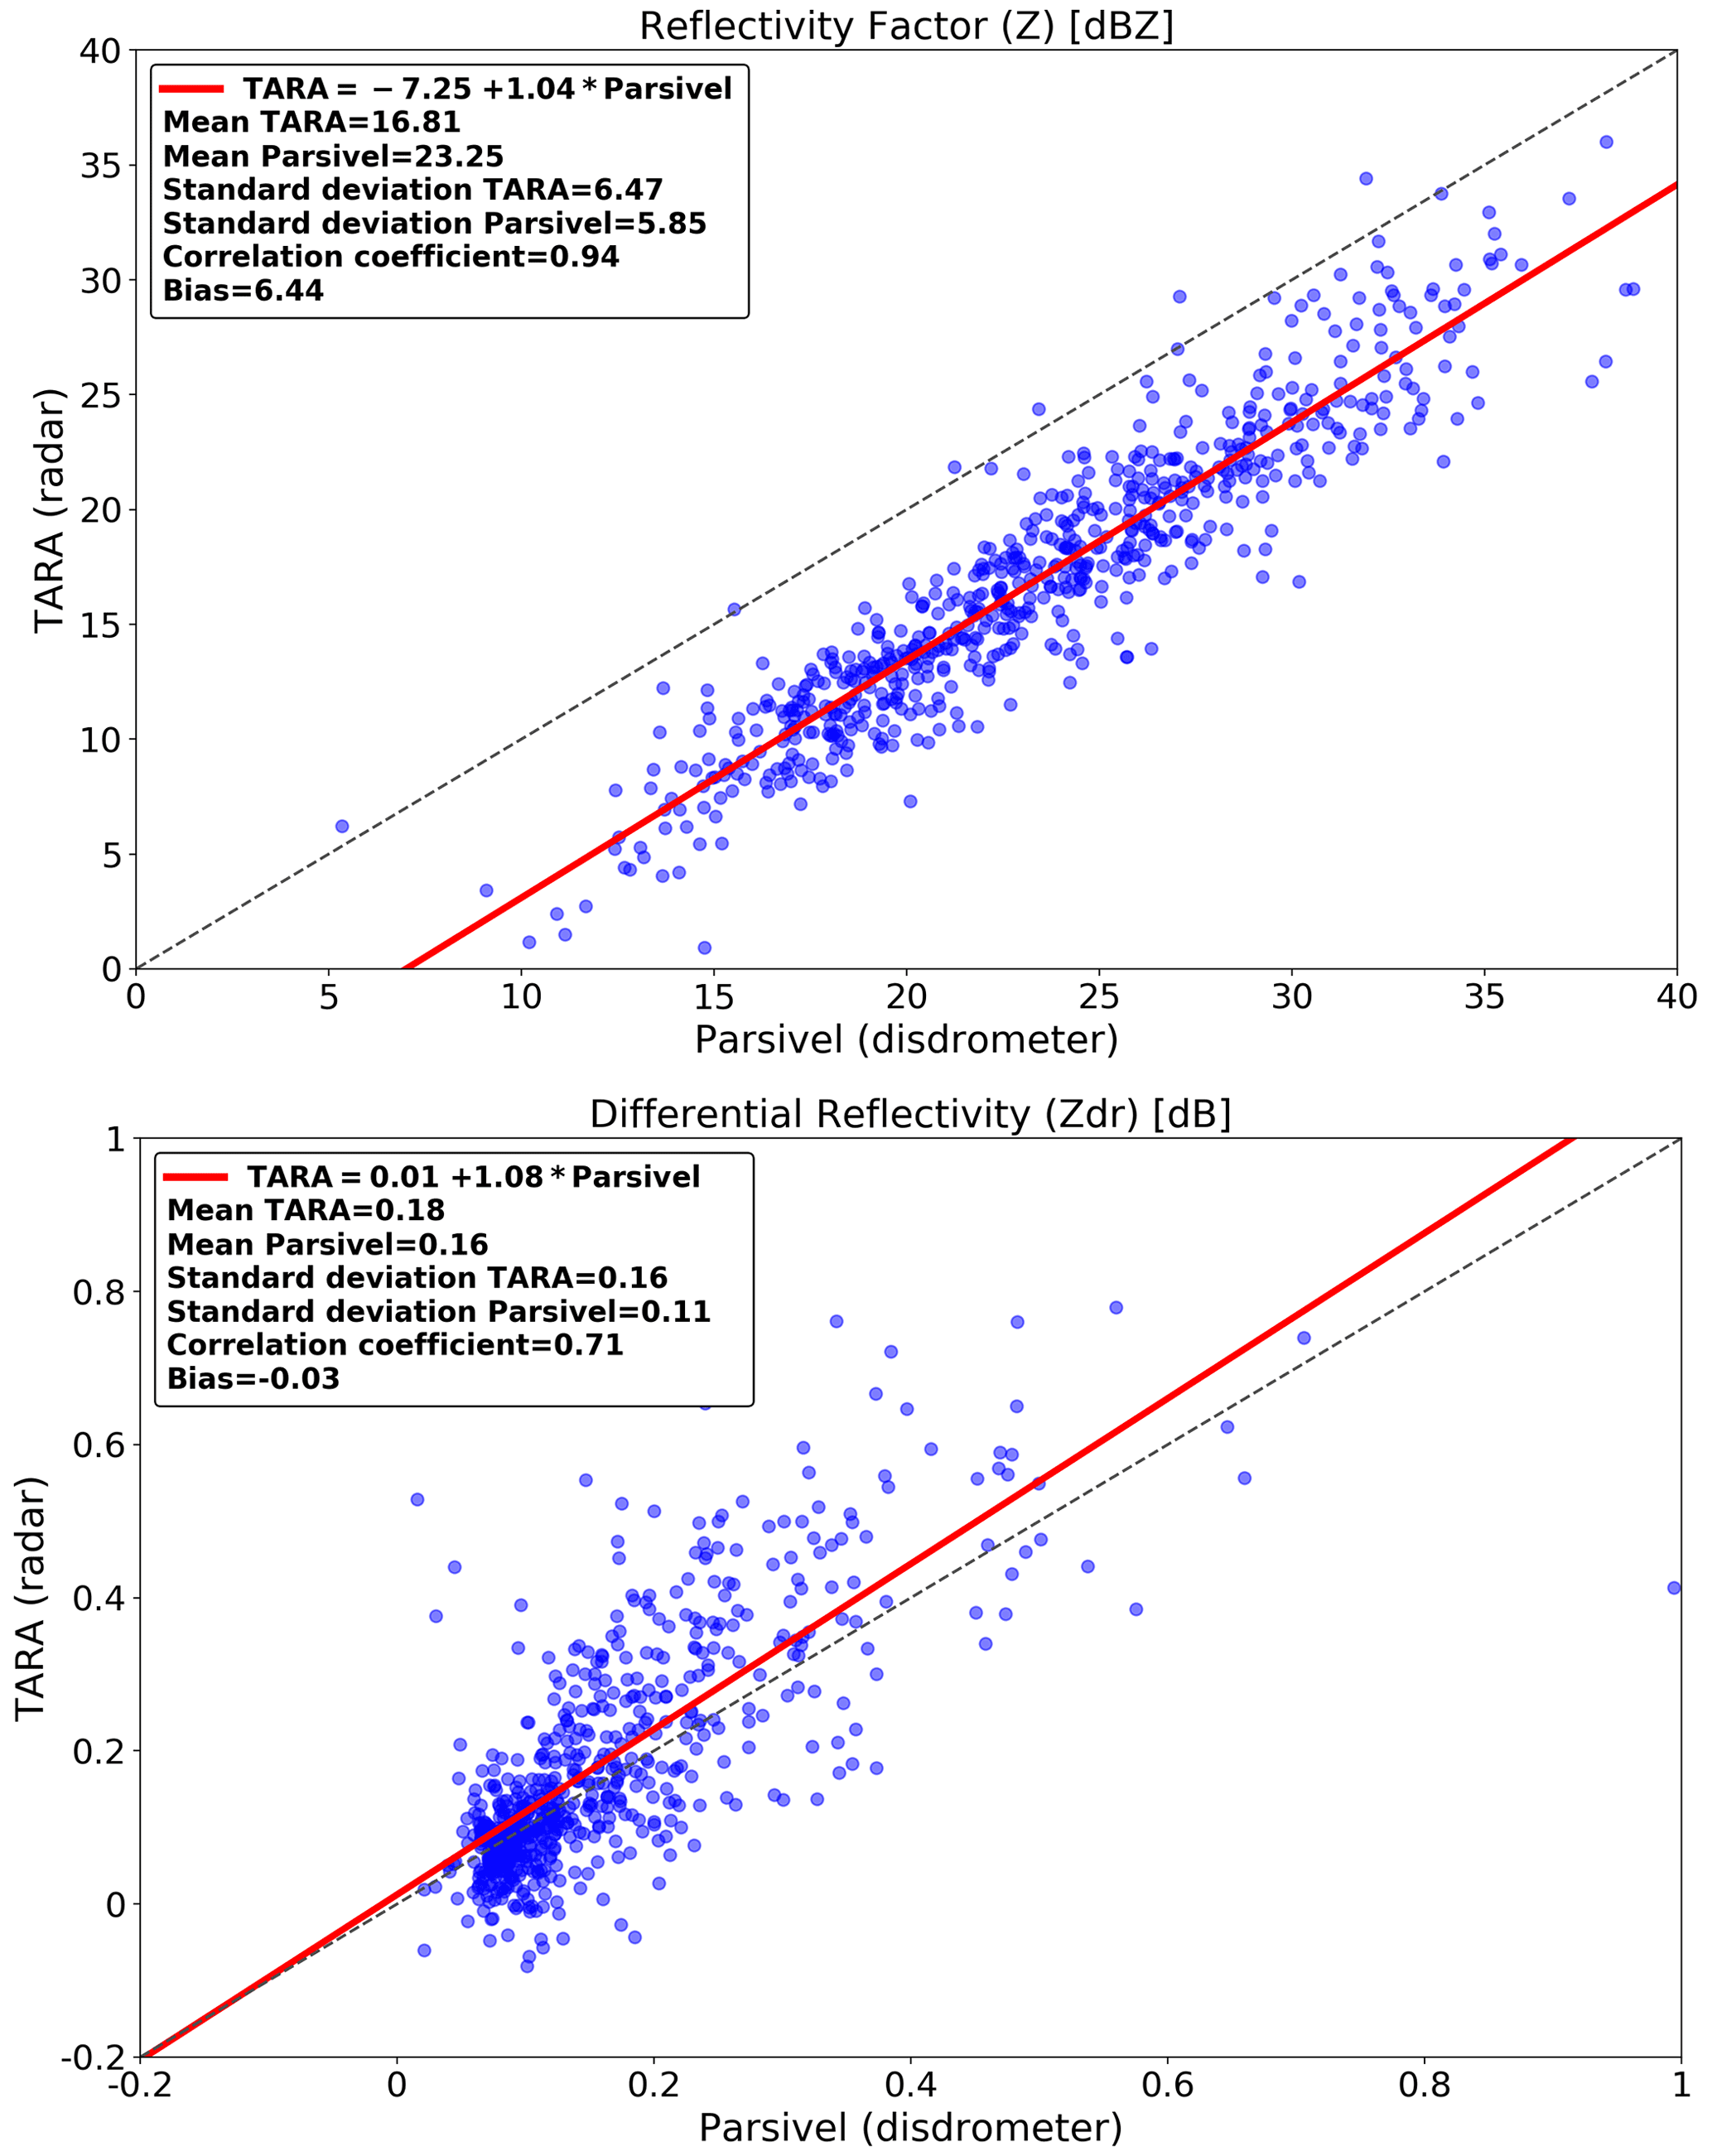
Figure 6Scatter plot between the observations of Zhh (dBZ) and Zdr (dB) from the disdrometer and the radar.
5.1.2 Zhh–Zdr relationships for TARA and Parsivel
In the top panel of Fig. 7, the Zhh–Zdr relation of each sensor is presented. It shows that most of the time, TARA measures higher Zdr values for a given Zhh than the disdrometer. Once the calibration bias in Zhh is removed (Fig. 7, bottom), the agreement improves and the radar and disdrometer-derived relationships nicely overlap with each other. Nevertheless, and despite the bias correction, TARA still tends to measure slightly higher Zdr values than the Parsivel for a given Zhh. This can be due to a difference in height or scale between the two measurements. The absence of a clear relation between Zhh and Zdr is not really a problem for the DSD retrieval method itself. In fact, a relation between Zhh and Zdr is not always expected since Zhh depends on NT, while Zdr does not. However, the fact that TARA and the Parsivel disdrometer exhibit different Zhh–Zdr relationships might negatively impact the accuracy and consistency of the retrieved DSDs.
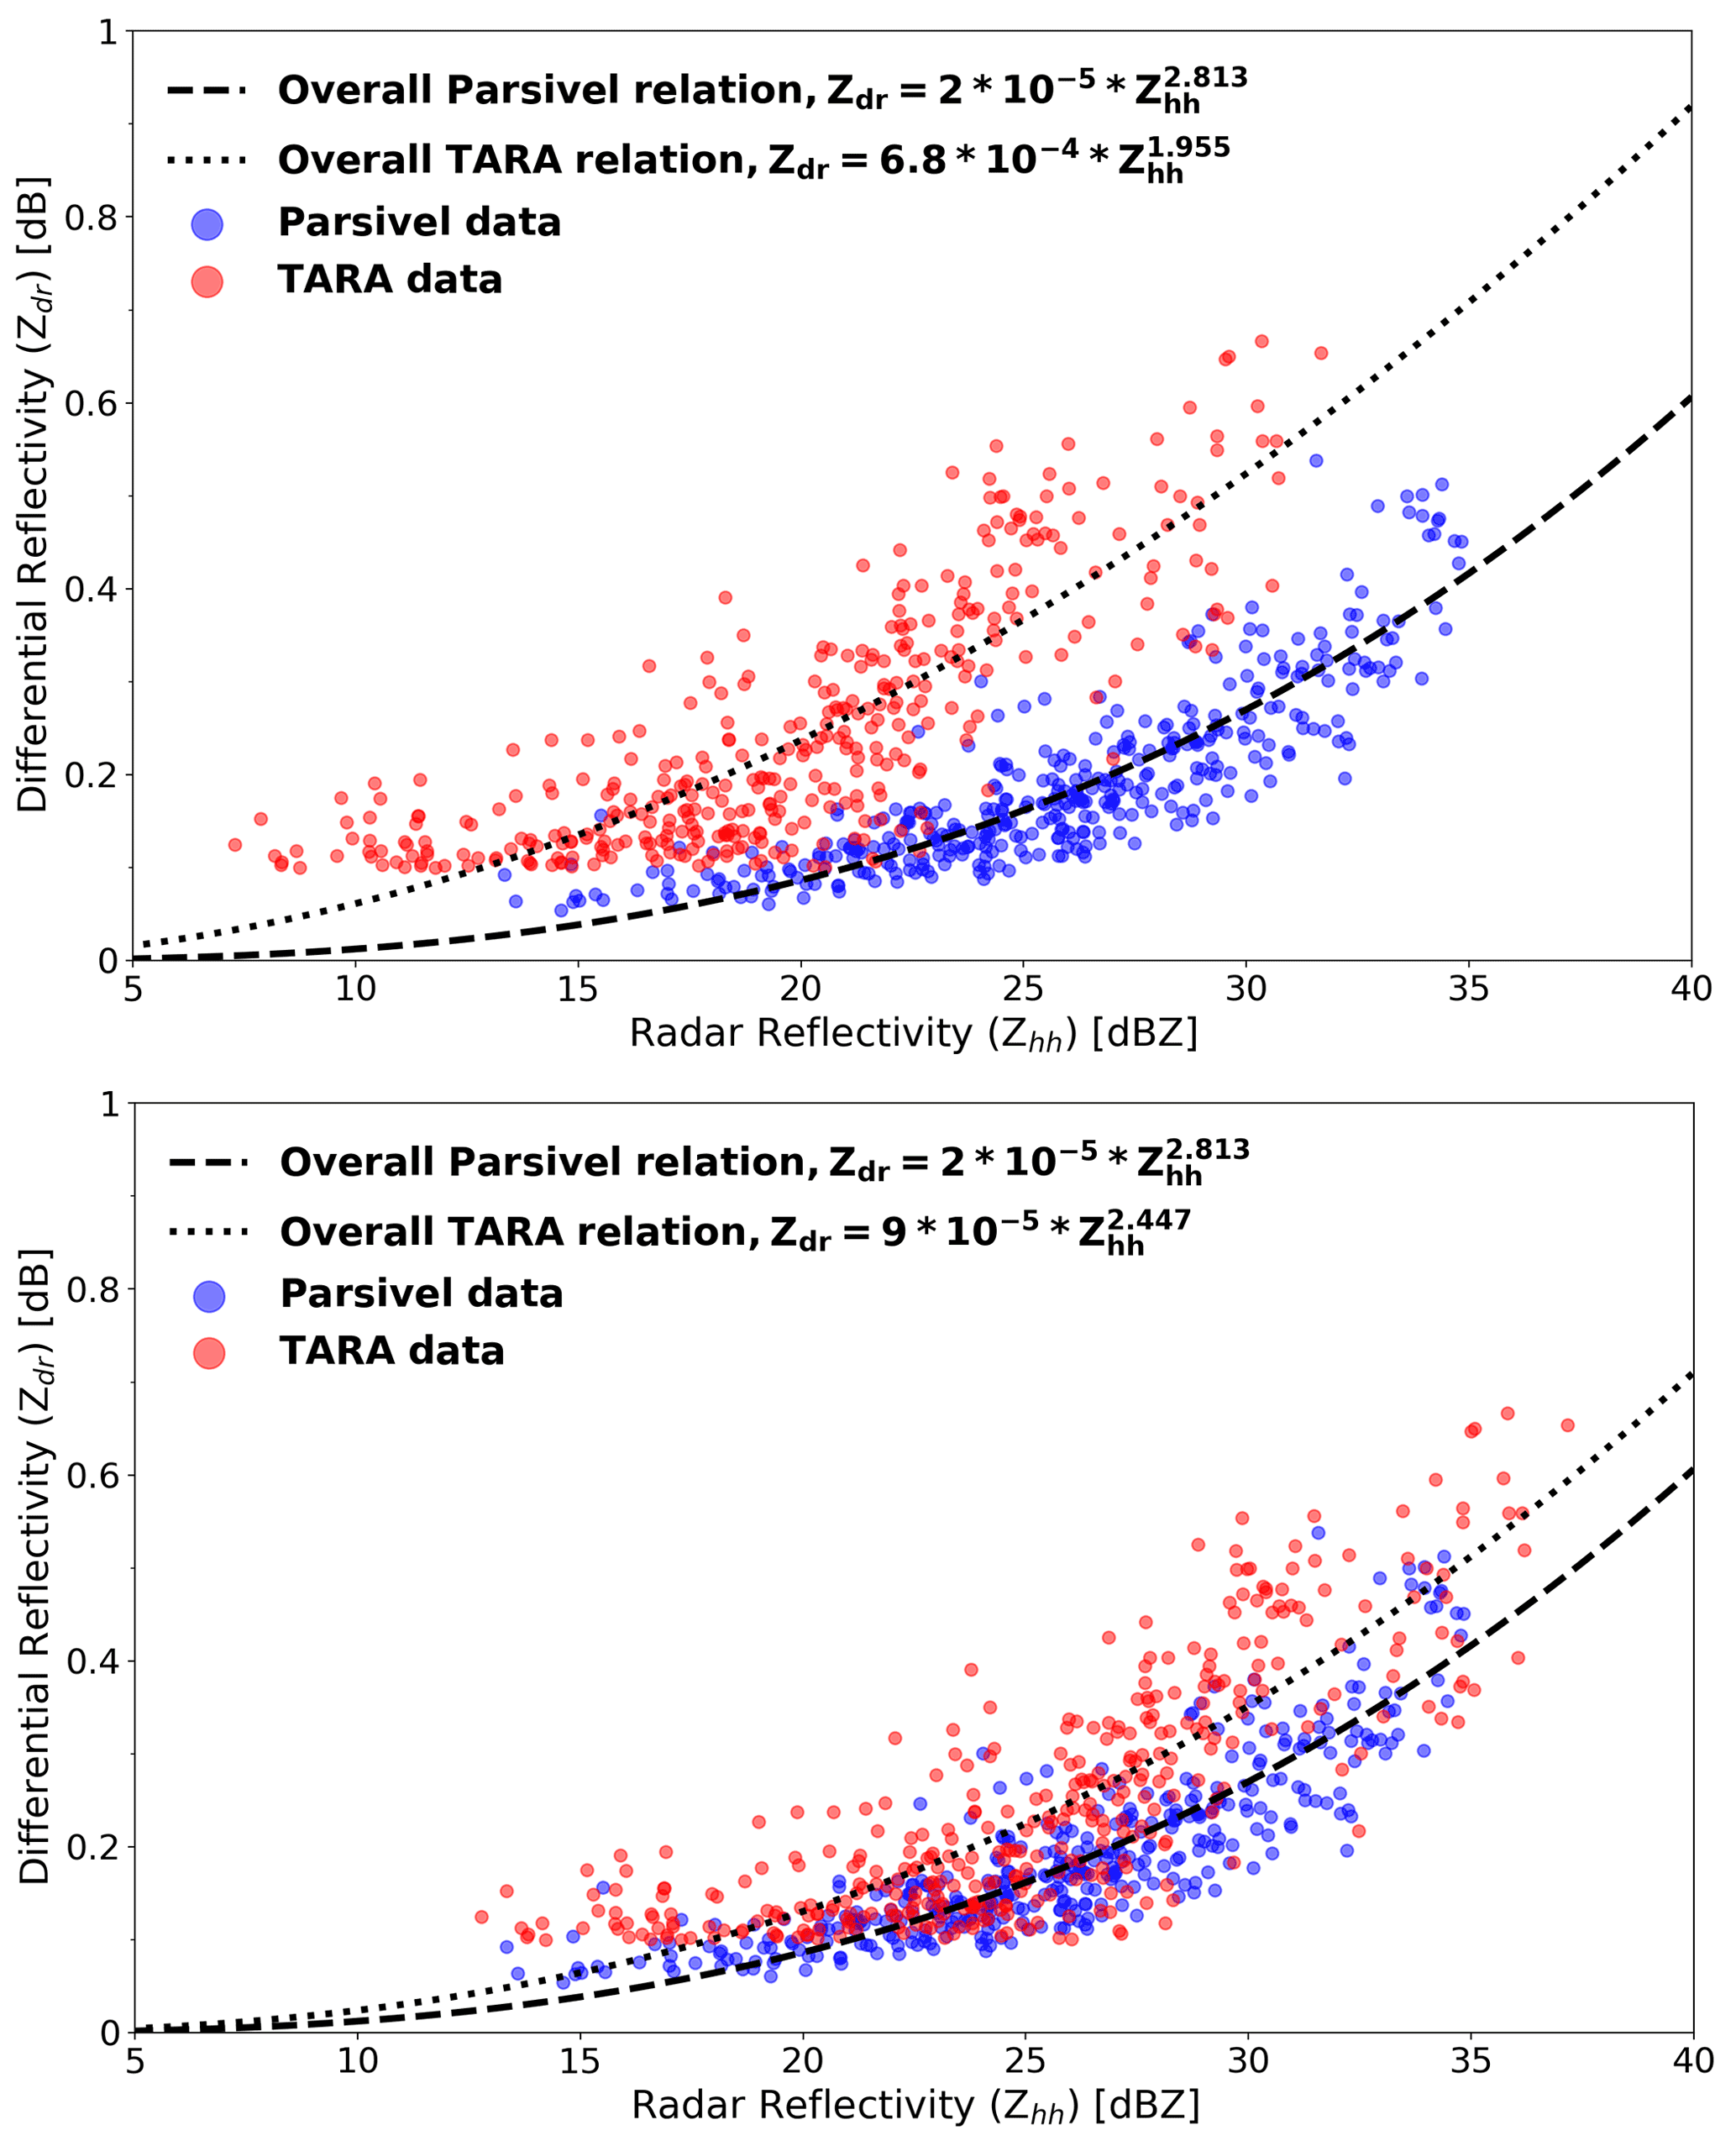
Figure 7Zhh–Zdr relations between the disdrometer and the radar (top to bottom) before and after the calibration bias in Zhh is removed.
5.1.3 First retrievals
In the following, we apply the DSD retrieval method described in Sect. 3.4 using Zhh and Zdr measurements from TARA and compare the results to the disdrometer data at 30 s resolution. For the retrievals, we used the overall μ–Λ relationship inferred in Sect. 3.4 (DSD retrieval method) from the disdrometer observations at 30 s sampling resolution.
For illustration purposes, the event on 11 October 2014 was chosen. The time series of retrieved μ, Dm, and NT as well as observed Zhh and Zdr values for this event are presented in Figs. 8 and 9 (top). Overall, we see that there is rather good agreement in terms of the retrieved μ and Dm values as long as the Zdr values are not too low (i.e., > 0.1 dB). When Zdr is low (e.g., between 12:20 and 13:15 UTC), we see that the retrievals become very uncertain, exhibiting much larger fluctuations over time.

Figure 8Time series of the DSD retrievals (μ and Dm) as well as Zhh and Zdr observations from the disdrometer and the radar.
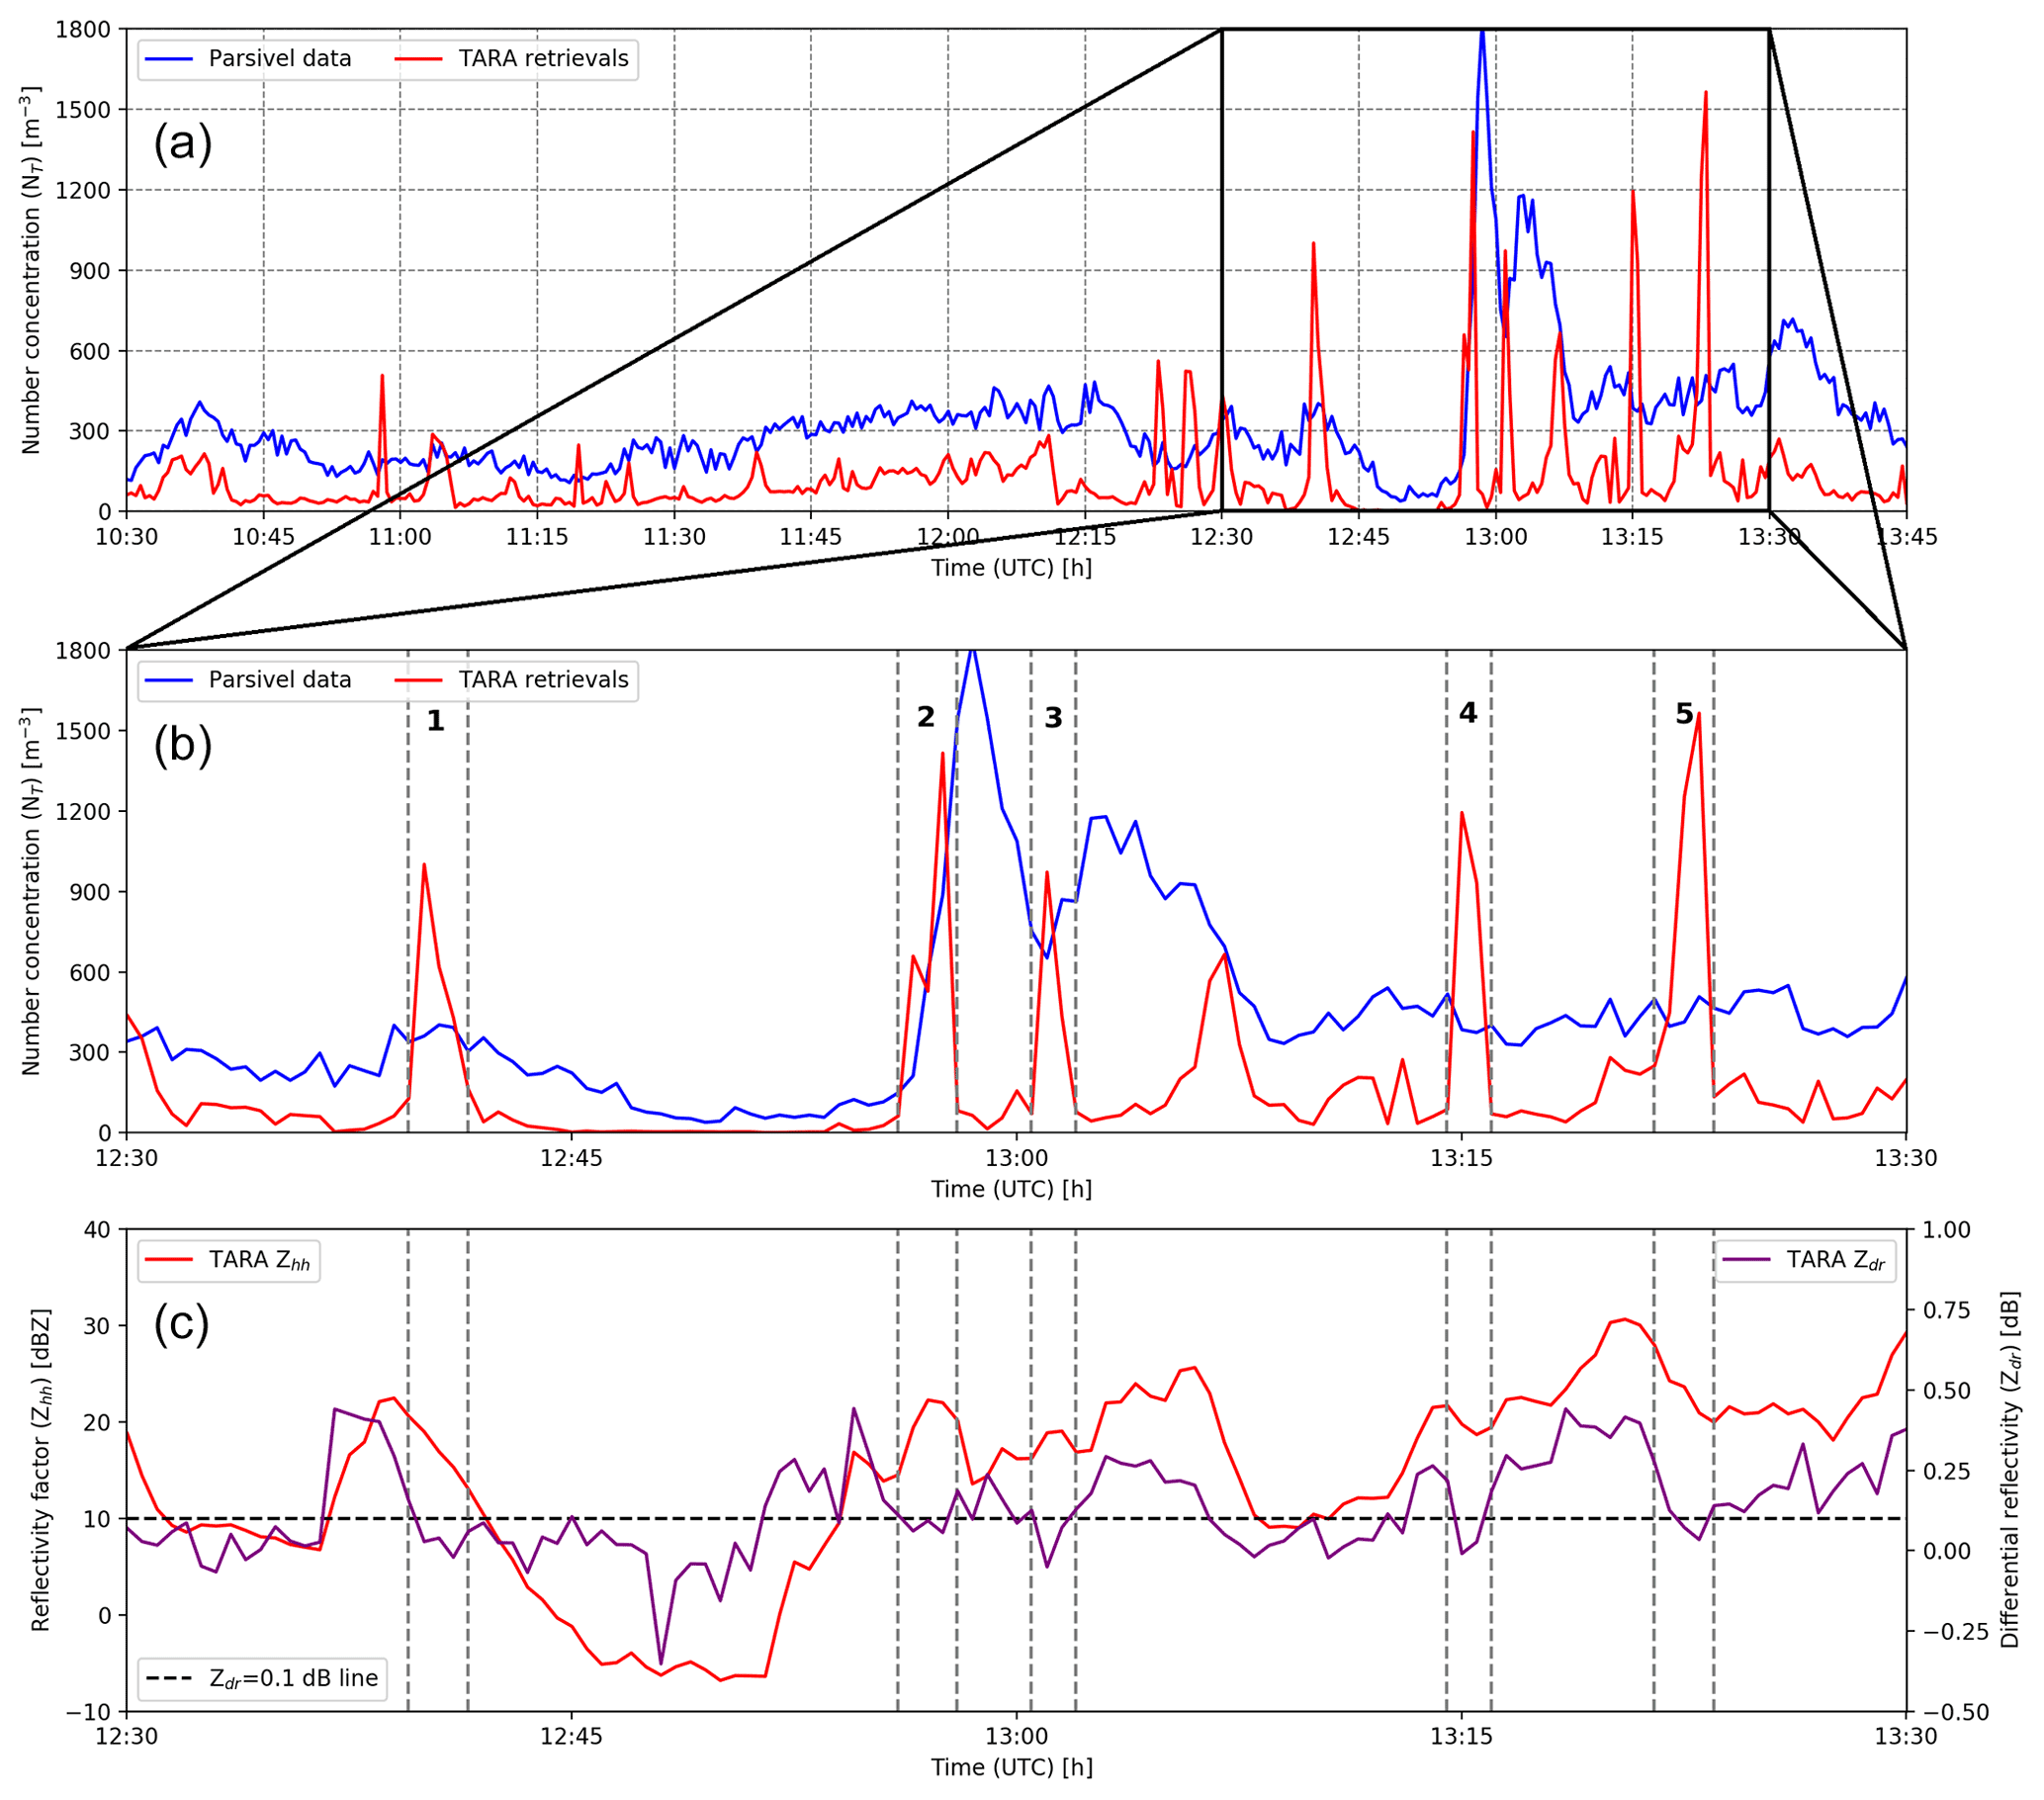
Figure 9Time series of the NT retrievals: (a) zoomed version for the period between 12:30 and 13:30 UTC (b) and the corresponding Zhh and Zdr observations from the disdrometer and the radar (c).
Compared with μ, the retrieved NT values are substantially more uncertain. There are some outliers, and, on average, the retrieved NT values from TARA are about 100 m−3 lower than those from the Parsivel disdrometer. This bias is attributed to the 6–7 dB offset in Zhh in TARA, which propagates nonlinearly to NT through the link between Zhh and NT in Eqs. (10)–(11). On the other hand, we also see some isolated cases in which NT is overestimated, such as at the beginning (10:57 UTC) and end (13:15 and 13:23 UTC) of the event. These periods are characterized by underestimated Zdr and Dm values by TARA, which, in combination with the relatively high Zhh values, leads to an overestimation of NT.
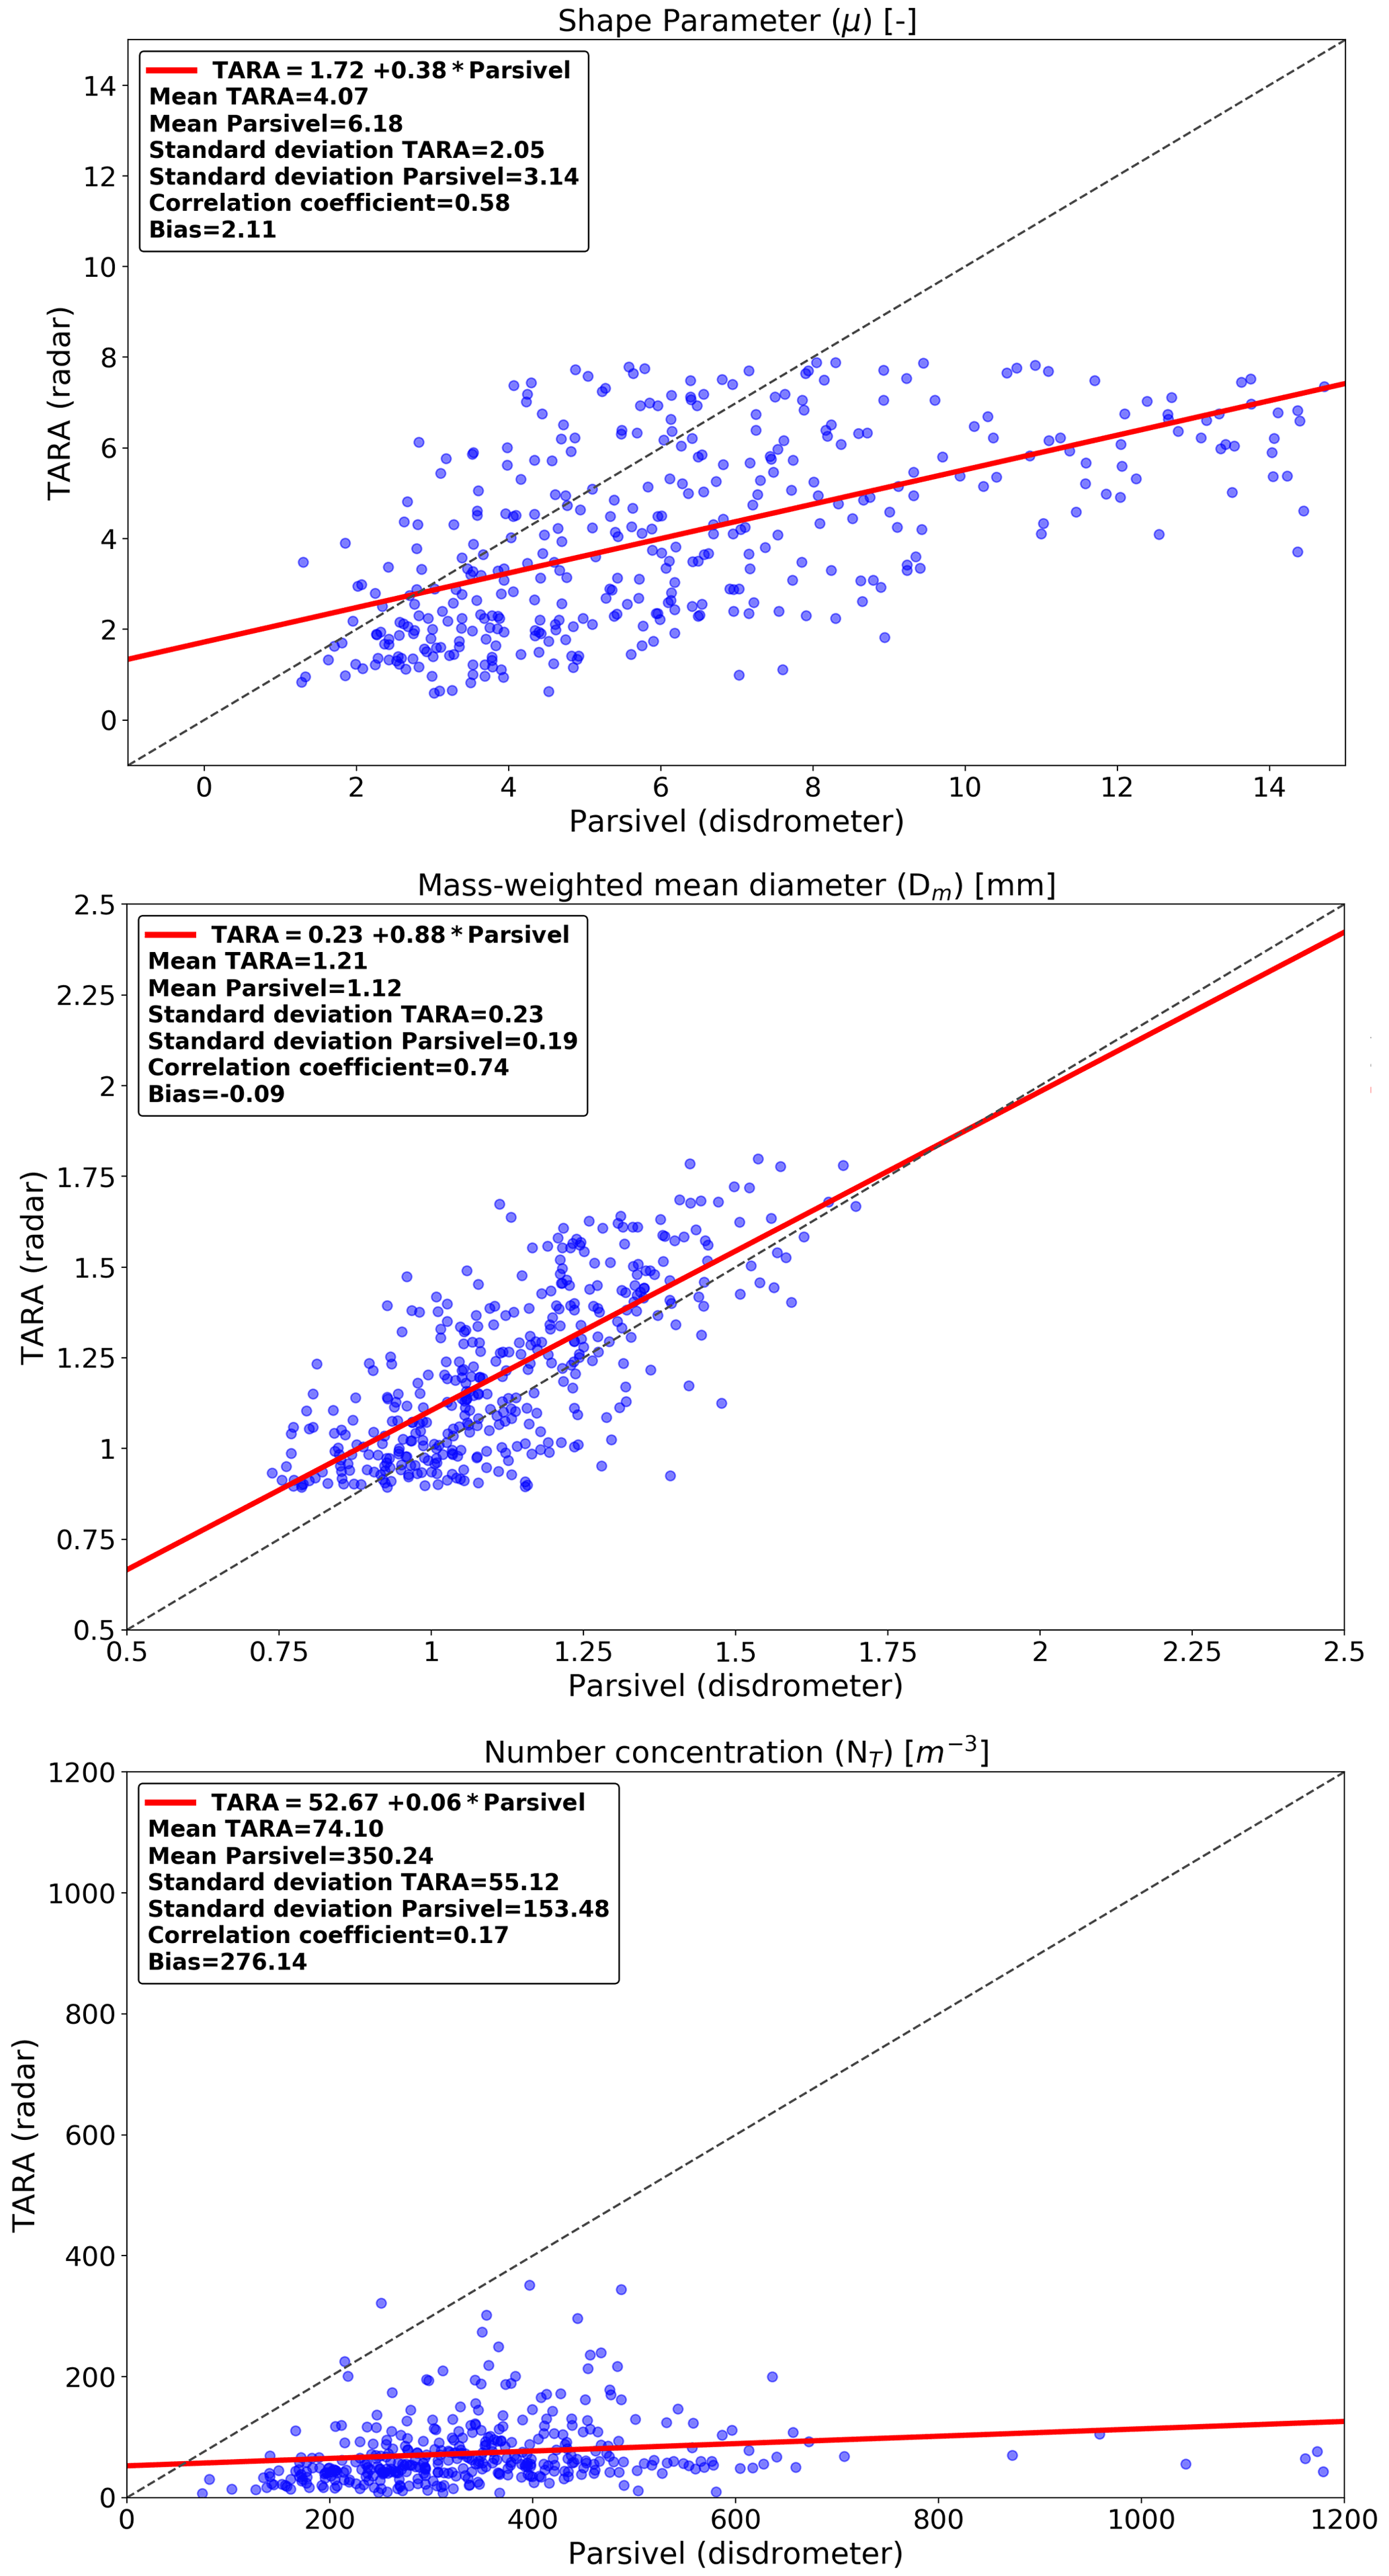
For a better overview, the retrieved DSD parameters (μ, Dm, and NT) for all selected events are plotted against the ones from the disdrometer in Fig. 10. We can see that the retrieved μ values from the radar tend to be lower compared with the disdrometer. The overall bias in the retrieved μ values is 2.11, which is rather large and not immediately apparent from the case study on 11 October (Fig. 8). Note that the retrieved μ values from TARA can never exceed 8 due to the 0.1 dB cutoff applied to Zdr observations (very light rain, peaked DSDs). Because of this, there is a slight conditional bias in the retrieved μ values for low Zdr values. Since μ values are unaffected by the bias in reflectivity and Zdr measurements appear to be well-calibrated, the bias we see in μ values must either be due to the μ–Λ relationship or to differences in scale, height, and measurement principles between the two sensors. Unlike μ, there is better agreement for Dm retrievals with −0.09 overall bias. This is the case for the case study on 11 October as well, for which Dm retrievals from Parsivel and TARA are almost similar throughout the event (Fig. 8, middle) except for the period between 12:45 and 13:00 when Zdr is low. Looking at the number concentration (Fig. 10, bottom), we see a significant underestimation in NT from TARA (overall bias = 276 m−3, multiplicative bias = 4.52), which can be explained by the large 6.44 dBZ bias in Zhh in TARA and is consistent with the previously reported underestimation for the event on 11 October 2014.
Despite the fact that NT values tend to be underestimated on average, we can also see several large spikes in retrieved NT values, such as during the second half of the case study event (Fig. 9, top). If we perform a more in-depth analysis of this period (i.e., between 12:30 and 13:30 UTC) in Fig. 9 (middle) and compare it with the Zhh and Zdr observations of the corresponding period (Fig. 9, bottom), we see that all five spikes in NT correspond to low values of Zdr and relatively high Zhh values. The low Zdr leads to large μ values and underestimated raindrop sizes during the retrieval. To compensate for this and achieve the correct reflectivity, NT needs to be increased by a lot. Note that spikes in NT can still occur even if Zhh is modest or decreasing locally, as long as Zdr is very small; for example, for spikes 2 and 3 there is a local maximum for Zhh, while for the other spikes the Zhh decreases.
The differences documented above are important because they show that DSD retrievals can be very sensitive to combined biases in Zdr and Zhh relative to each other. The latter can be linked to calibration issues. However, inconsistencies can also arise due to differences in height, sampling volumes, and temporal aggregation scales between radar and disdrometer measurements, also known as the nonuniform beam-filling problem (Ryzhkov, 2007; Durden and Tanelli, 2008).
5.2 Sensitivity to calibration bias correction
Given the systematic underestimation of the reflectivity factor in TARA, a bias correction was applied before proceeding with the DSD retrievals. Indeed, the bias correction was considered essential to get more reliable results, especially for NT. Since the NT retrievals require the reflectivity to be converted from logarithmic (dB) to linear scale (mm6 m−3), a multiplicative adjustment factor known as the ratio (i.e., the ratio of the sum of Parsivel to TARA reflectivity values) was used to bias-correct the TARA measurements, treating the disdrometer observations as the reference truth. The value of the ratio was 4.52, which confirmed the large calibration bias of TARA. To address the bias, all TARA reflectivity values (in linear scale) were multiplied by 4.52 and the new DSD parameters were retrieved. As expected, the first two DSD parameters μ and Dm were completely unaffected by the bias adjustment, as they only depend on Zdr (see Sect. 3.4, DSD retrieval method). Figure 11, on the other hand, shows that NT retrievals were substantially improved, and the bias decreased from 276 to 89 m−3. Despite the lower bias, we can see that large uncertainties remain in the retrieved NT values, as highlighted by the large scatter and frequent outliers.
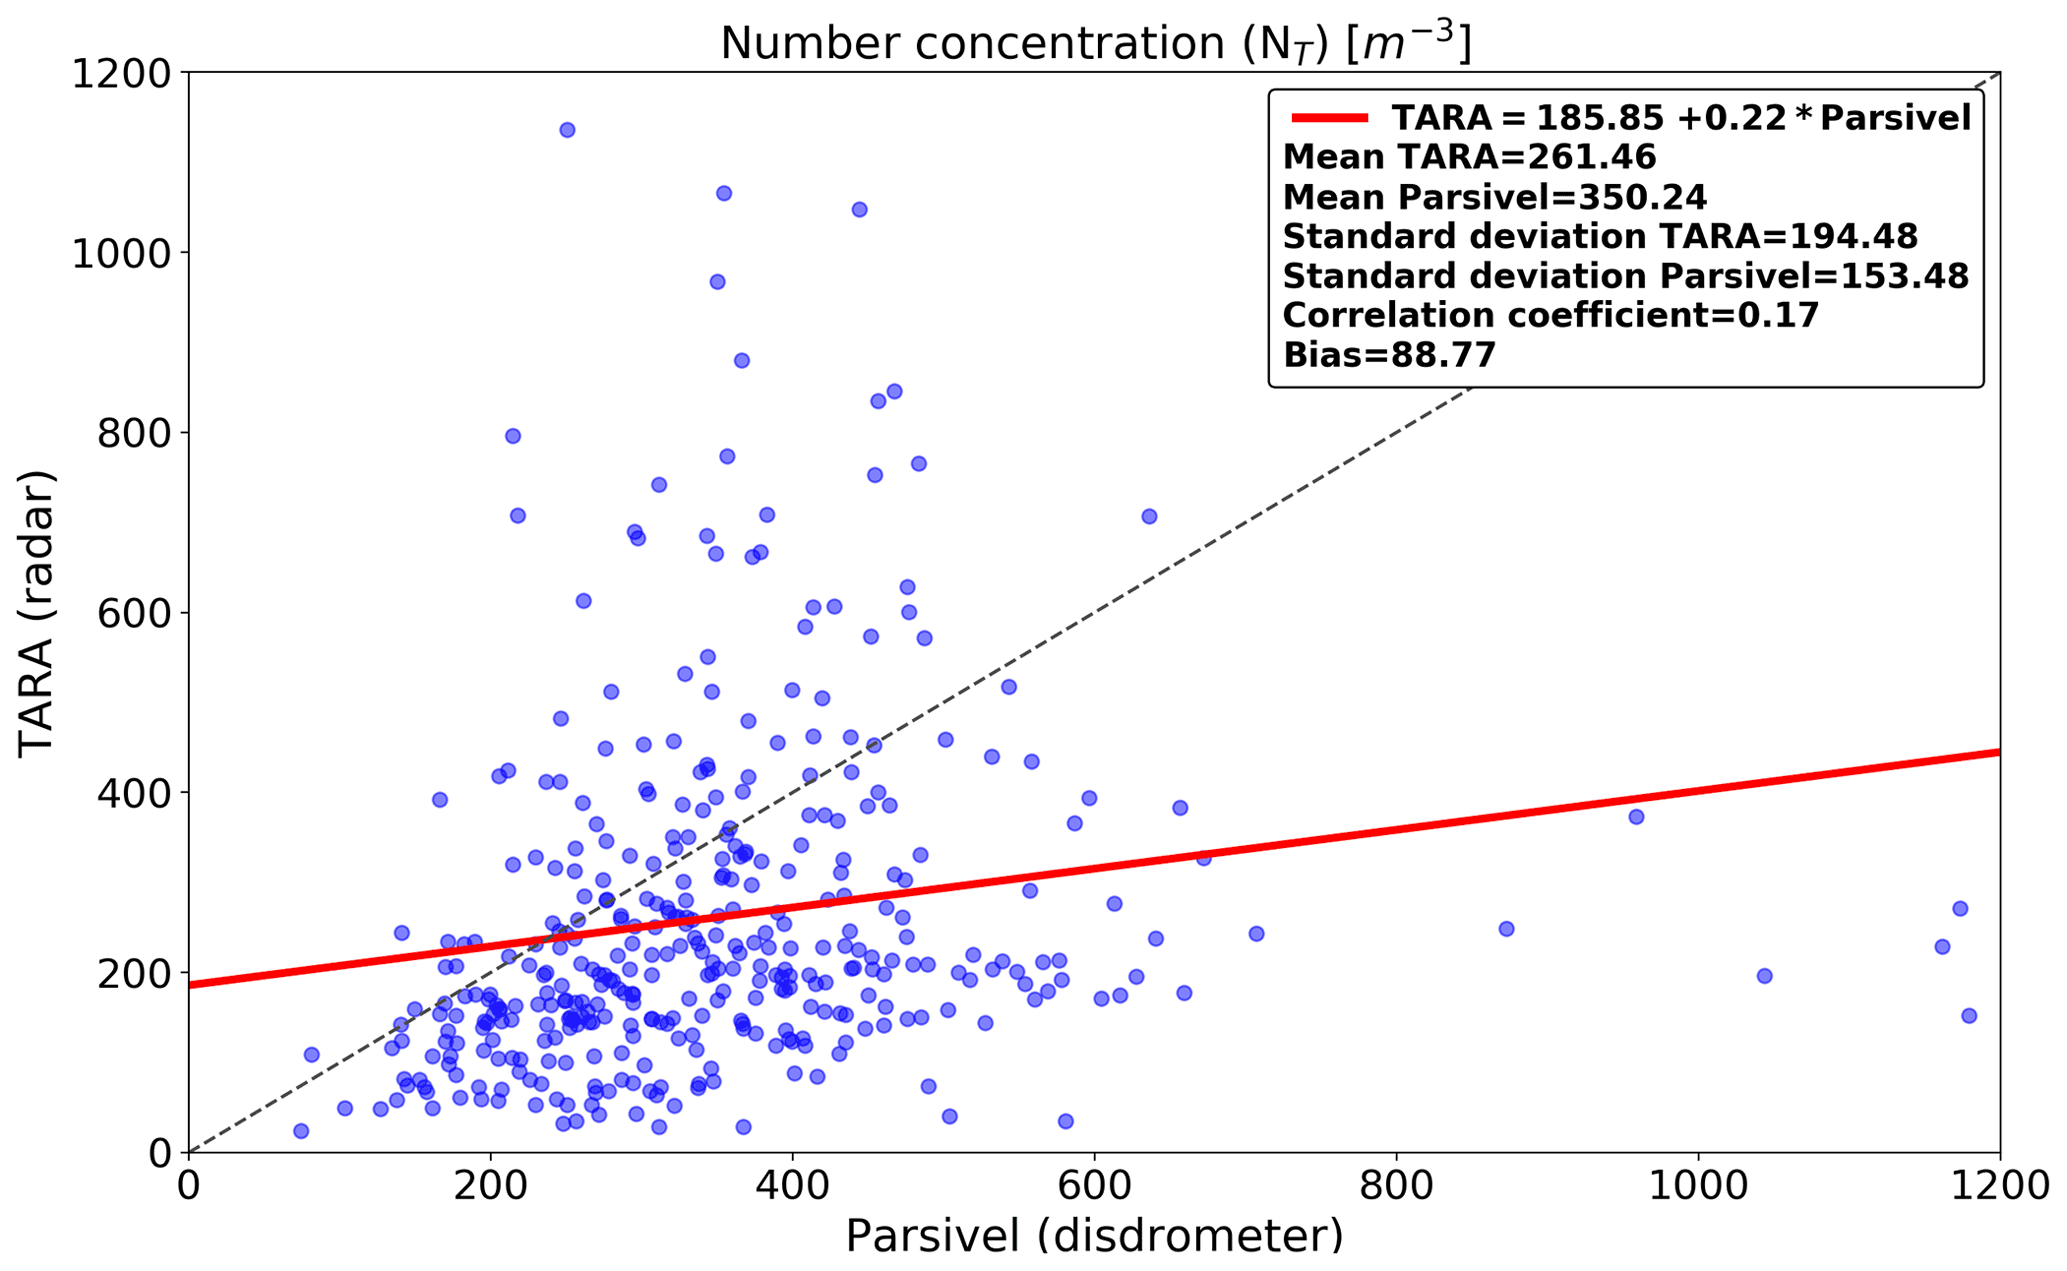
Figure 11Scatter plot of NT retrievals between the radar and disdrometer after applying the calibration bias correction to Zhh.
5.3 Sensitivity to scale bias correction
In the following, a small additional bias adjustment was applied to Zdr to try to account for the large difference in sampling volumes between the TARA radar and the Parsivel disdrometer. This second adjustment is conceptually different from the one applied to Zhh, which was primarily due to calibration issues. Contrarily to Zhh, the differential reflectivity Zdr of TARA is assumed to be well-calibrated. Therefore, the differences in mean and standard deviation are primarily attributed to differences in scale, height, and measurement principles. Note that this scale bias also applies to Zhh. However, for Zhh, the effect is masked by the large calibration bias and the two cannot be separated.
According to Fig. 6 (bottom), the average Zdr values measured by TARA are 0.03 dB larger than the ones from the Parsivel disdrometer; this makes sense given that the radar sees a larger measurement volume, which makes it more likely to contain at least a few larger drops. Even though a 0.03 dB difference seems small, such a bias can have a significant effect on the DSD retrievals given that the majority of Zdr values are rather small (e.g., between 0.1 and 0.2 dB). A 0.03 dB bias in Zdr therefore represents a relative error of 15 %–30 %.
Figure 12 shows the retrieved DSD parameters after correcting for the scale bias. We see a reduction of the bias affecting μ and Dm, which are directly linked to Zdr. The bias affecting μ is halved from 2.11 to 1.12, and the bias affecting Dm is reduced from −0.09 to −0.02 mm. The correlation coefficient remains relatively stable, regardless of the scale correction. Despite the improvements for μ and Dm, the NT retrievals remain problematic, with a low correlation coefficient of 0.12 (compared to 0.17 without scale bias correction) and moderate bias of −32 m−3 (compared to 89 m−3 without correction). Also, the average NT value increased significantly from 261 to 382 m−3 (+46 %), which highlights the large sensitivity of NT to changes in the differential reflectivity.

Figure 12Scatter plot of DSD retrievals between the radar and disdrometer after applying the scale bias correction to Zdr.
5.4 Sensitivity of NT to outliers
The results presented in the previous sections have shown that, unlike μ and Dm, the uncertainty surrounding the NT retrievals tends to be much larger. This can be explained by the fact that NT is the last parameter to be retrieved in Eq. (11), which makes it more susceptible to error propagation and accumulation during the first steps of the retrieval procedure. Errors in retrieved NT values can be due to the retrieval method itself (e.g., the assumed μ–Λ relation and gamma DSD model), biased radar observations (e.g., calibration errors in Zhh or/and Zdr), or additional biases due to differences in measurement scale, height, and measurement principle between radars and disdrometers. Considering the fact that the events used in this study mainly consist of weak or light stratiform rain, the errors and uncertainty affecting the measured Zdr values are very likely to play an important role.
The scatter plot of retrieved NT values versus disdrometer data in Fig. 10 (bottom) shows a low correlation coefficient and a significant underestimation from TARA, mainly due to the huge bias in Zhh (6.44 dBZ). However, it is worth noticing that even after applying a calibration bias correction to Zhh, there was no substantial improvement in terms of the NT retrievals (Fig. 11). Even though the bias in NT was reduced (89 m−3 compared to 276 m−3), the scatter increased and the correlation coefficient remained low (0.17). The scale correction for Zdr results in even worse agreement (correlation coefficient 0.12; Fig. 12, bottom). In general, two distinct groups of data points with drastically different error properties can be seen. For the first, the retrieved NT values are severely overestimated compared to the Parsivel disdrometer by up to 1 order of magnitude. For the second group, the retrieved NT values are up to 10 times lower than the disdrometer values.
The conclusion is that there are two different types of combinations of Zhh–Zdr that result in unreliable NT retrievals. The first group is comprised of low Zdr values compared to Zhh, which results in overestimated NT values. These are all the pairs of Zhh–Zdr in the lower-right part of Fig. 14. Since Zdr is low, the only way to get a high reflectivity is by increasing NT. The second group consists of relatively high Zdr values compared to Zhh, which leads to underestimated NT values. These points correspond to the top-left part of Fig. 14. Since Zdr is large, the only way to get a low Zhh is to decrease NT. Together, these two different types of outliers are responsible for the large scatter observed in retrieved NT values.

Figure 13Scatter plot of DSD retrievals between the radar and disdrometer after applying the Zhh–Zdr relation outlier removal.
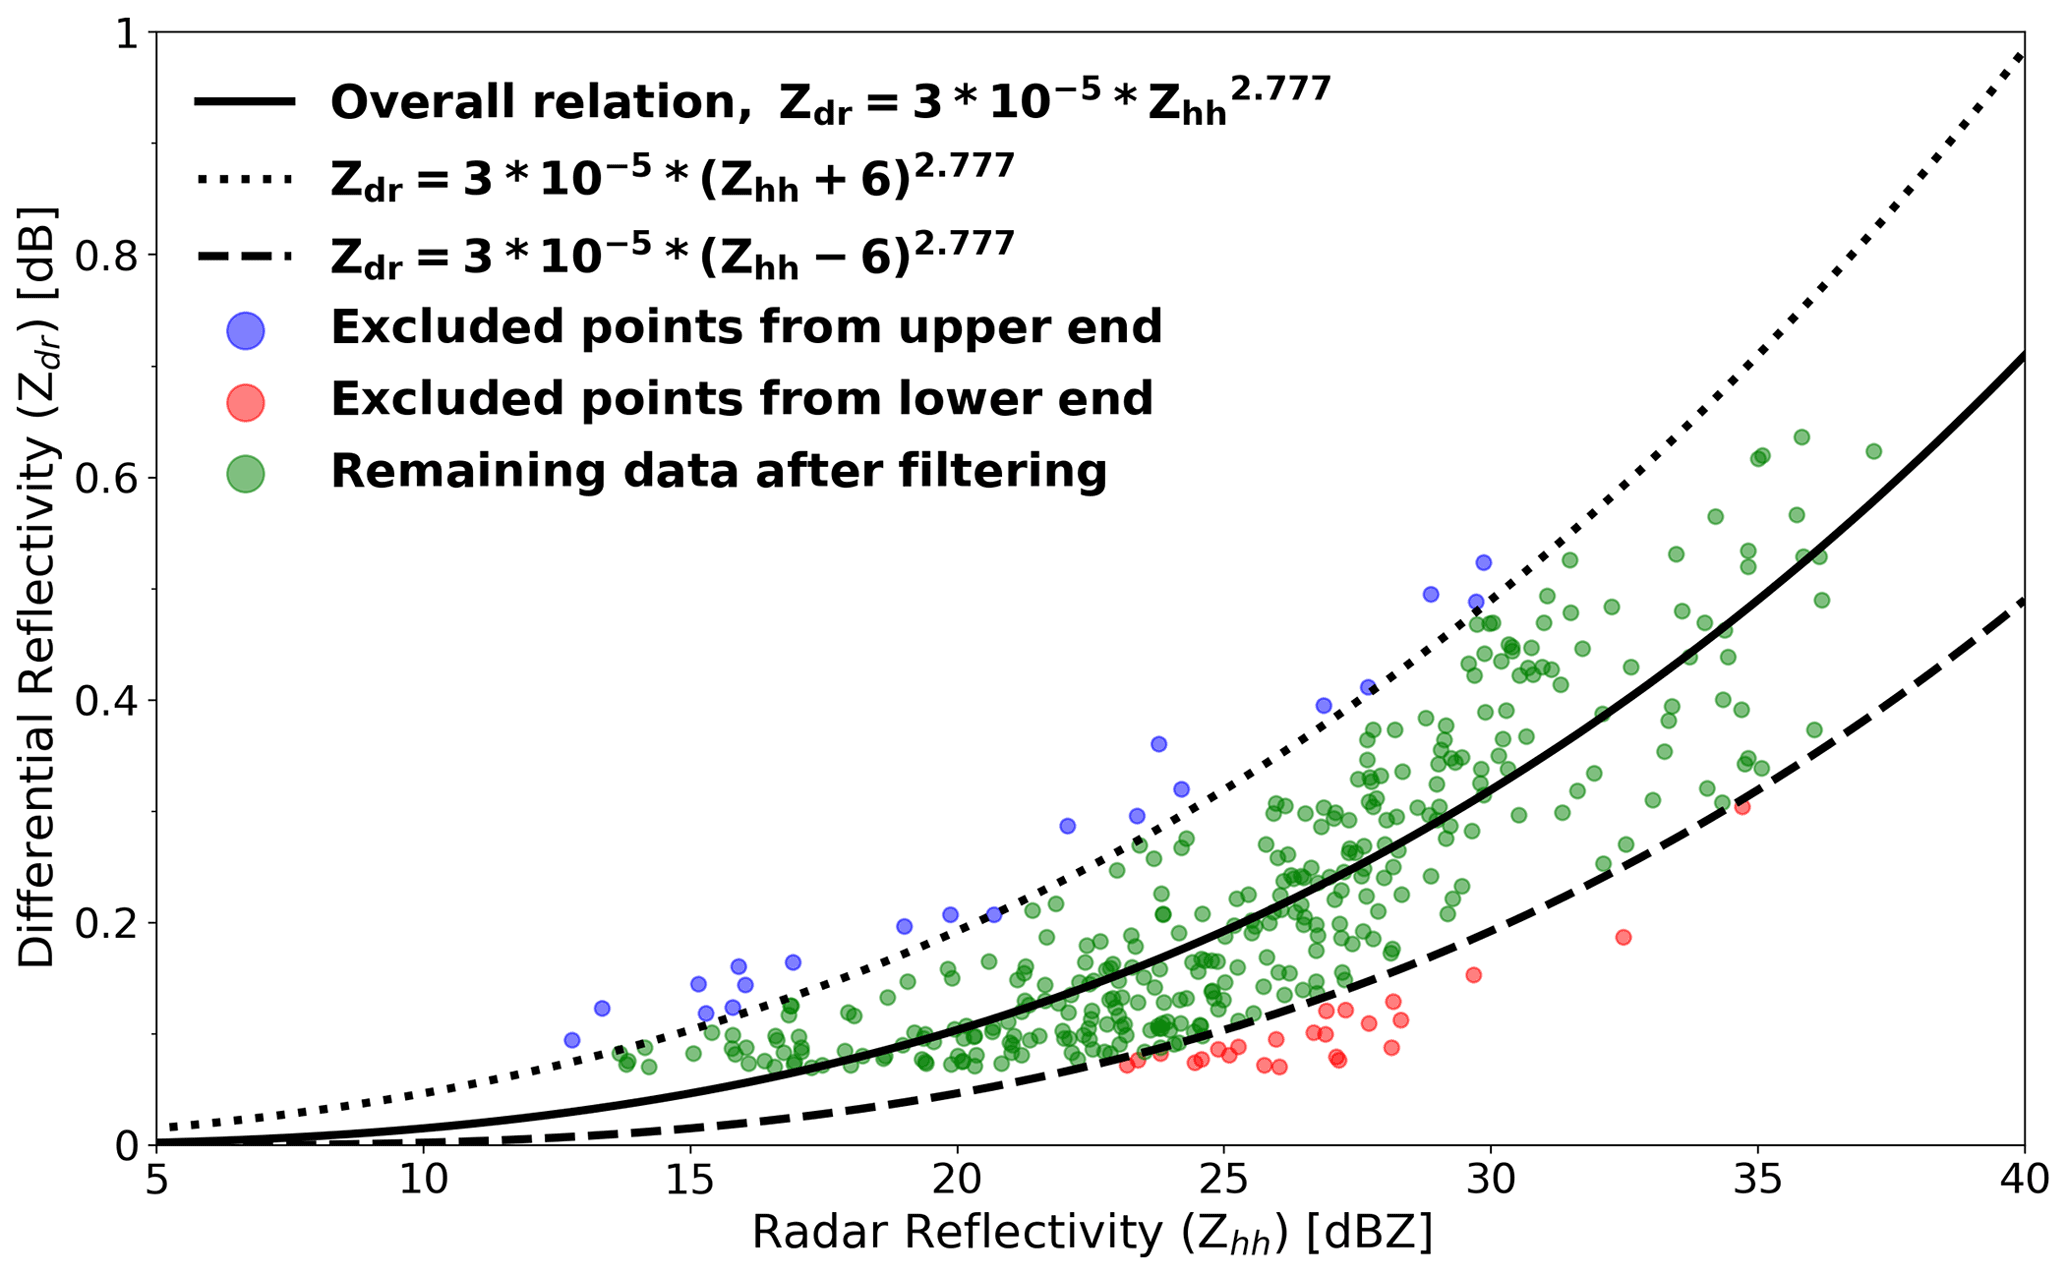
Figure 14Example of the filtering based on the Zhh–Zdr relationship with the overall power-law fit and the corresponding ones for the upper and lower end using ±6 dBZ.
Each retrieval has its own uncertainty and error characteristic, depending on the pair of Zhh–Zdr. For example, the scale correction has different impacts on the different subgroups. Even though there is a general increase in NT to compensate for the new reduced value of Zdr, the aforementioned correction had a significant impact on the subgroup, which corresponds to the points that are overestimated by TARA and negligible for the ones that are underestimated.
A possible way to reduce the uncertainty affecting the NT retrievals and thereby avoid large errors is to filter out all potentially problematic combinations of Zhh–Zdr. In the following, a filter which aims to control the uncertainty in NT by removing certain Zhh–Zdr combinations that are difficult to handle is applied. Note that these “outliers” in the Zhh–Zdr space are not necessarily wrong. They are just problematic in the sense that they can potentially result in very large errors in terms of retrieved NT. The applied filter is two-dimensional depending on both Zhh and Zdr values since the uncertainty derives from their combination. A power-law model was used to fit the radar observables Zhh and Zdr after calibration and scale bias correction, respectively. Based on that model, an upper and lower curve defining the limits of acceptable Zhh and Zdr pairs is obtained by adding or subtracting a given tolerance from Zhh as in Fig. 14. For illustration purposes ±6 dB was selected, but several other options (i.e., 2, 4, and 8 dB) were examined as well. Table 3 lists all options together with their corresponding performances for μ, Dm, and NT. We see that by removing certain points beyond the lower and upper limits in the Zhh–Zdr space, it is possible to improve the correlation between the observed and retrieved μ, Dm, and NT values while keeping a similar bias. For μ and Dm, the best tolerance (in terms of correlation) seems to be ±2 and ±4 dB. However, these are rather strict, which means that a large fraction of the data points would have to be discarded (i.e., 56 % and 23 %, respectively) for a modest gain in performance. For the NT retrievals, the optimal tolerance appears to be ±6 dB, which discards less than 9 % of the data but still manages to increase the correlation (0.12 to 0.24) and decrease the absolute value of the bias (−32 to 10 m−3). Note that, contrarily to μ and Dm, filtering out more data points does not necessarily increase the performance in terms of the NT retrievals. Figure 13 shows the final radar DSD retrieval results after applying a filter with a tolerance of ±6 dB.
Table 3Filter performance (correlation coefficient, bias) of DSD retrievals (μ, Dm, and NT) for different levels of tolerance (±2, 4, 6, 8, and 10 dBZ).

A previously proposed method for retrieving DSDs based on radar reflectivity measurements (Zhh), differential reflectivity (Zdr), and an empirical relation between the shape (μ) and slope (Λ) parameters of a gamma DSD model was investigated. Observations from a nearby optical disdrometer were used to derive the μ–Λ relationship as well as for performing an indirect validation of the retrieved DSDs. While the retrieval method itself is well-known, this study primarily focused on the critical assumptions behind it in order to outline potential sources of errors and uncertainties. First, a thorough sensitivity analysis of the μ–Λ relation to various factors such as the temporal sampling resolution, the adequacy of the gamma model hypothesis, sensitivity to the concentration number (NT), and event-by-event variations was conducted. Then, the influence of calibration errors in radar observations and scale differences between radar and disdrometer observations were highlighted and investigated. Finally, a filter designed to mitigate uncertainty during NT retrievals was proposed. According to the results the following conclusions can be drawn.
-
The μ–Λ relationship derived from a nearby disdrometer proved quite robust to the choice of the temporal sampling resolution, validity of the gamma model hypothesis, sample size, and event-by-event variability. However, only seven rather similar stratiform rain events were considered. More research is necessary to fully understand and quantify the inter-event variability of μ–Λ relationships in convective rain.
-
Radar calibration biases significantly affect the accuracy and reliability of the retrieved DSDs. Both Zhh and Zdr must be bias-corrected before retrieving the DSD.
-
Even for well-calibrated radars, a small additional bias correction to account for the scale difference between radar and disdrometer observations can be useful to reduce conditional biases in retrieved μ and NT values.
-
Finding the right bias and scale corrections for Zhh and Zdr is not straightforward. Often the bias due to scale differences cannot be separated from the bias due to calibration errors and measurement noise. In our case, Zdr was very well-calibrated, which allowed us to investigate the scale correction in more detail. However, due to the large calibration offset, the scale correction for Zhh could not be determined.
-
Despite our best efforts, the retrieved NT values remained highly uncertain. Two different types of outliers were identified, resulting in severely underestimated or overestimated NT values. A simple filter for removing outliers in the Zhh–Zdr space was proposed. The filter gets rid of some problematic cases, which slightly improves the reliability of the NT retrievals. But improvements remained modest and removing more data did not systematically result in better performances.
Finally, it should be mentioned that we do not expect the exact same adjustments to hold for other DSD retrieval algorithms or radar systems. The adjustments mentioned in this study are specific to the TARA radar and Parsivel optical disdrometer. For example, the radar elevation angle was 45∘, which is not ideal for such retrievals. Uncertainties for lower elevation angles would probably be smaller due to higher Zdr values. Depending on the radar system, corrections more elaborate than a simple shift in Zdr might be necessary to achieve optimal performance across a larger number of rain events. Similarly, more convective rain events should be included to study the performance and reliability of DSD retrievals based on μ–Λ relationships during heavy convective rain with larger drop sizes. Finally, future work could look at the importance of μ–Λ relations in DSD retrievals from other relevant rainfall sensors, such as satellite observations, which have much larger sampling volumes and errors than ground-based radar and for which the scale corrections might therefore play a more important role.
The DSD data collected by a Parsivel disdrometer during ACCEPT campaign in the Netherlands, are available under https://doi.org/https://doi.org/10.4121/20511111.v1 (Gatidis et al., 2022). The data was a collaboration between TU Delft and TROPOS and was uploaded by Christos Gatidis.
The supplement related to this article is available online at: https://doi.org/10.5194/amt-15-4951-2022-supplement.
CG mainly worked on data processing, visualization of the results, and writing (original draft preparation). MS and CU focused on the supervision of CG with fundamental ideas about the direction of the research, the methodology used, and finally the writing (review and editing).
The contact author has declared that none of the authors has any competing interests.
Publisher's note: Copernicus Publications remains neutral with regard to jurisdictional claims in published maps and institutional affiliations.
This work was supported by the Netherlands Organisation for Scientific Research (NWO) through the “User Support Programme Space Research 2012-2016”, project ALW-GO/15-35. We are grateful to TROPOS for collecting and sharing the Parsivel disdrometer data used in this study.
This research has been supported by the Nederlandse Organisatie voor Wetenschappelijk Onderzoek (grant no. ALW-GO/15-35).
This paper was edited by Gianfranco Vulpiani and reviewed by three anonymous referees.
Adirosi, E., Volpi, E., Lombardo, F., and Baldini, L.: Raindrop size distribution: Fitting performance of common theoretical models, Adv. Water Res., 96, 290–305, https://doi.org/10.1016/j.advwatres.2016.07.010, 2016. a
Battaglia, A., Rustemeier, E., Tokay, A., Blahak, U., and Simmer, C.: PARSIVEL Snow Observations: A Critical Assessment, J. Atmos. Ocean. Technol., 27, 333–344, https://doi.org/10.1175/2009JTECHA1332.1, 2010. a
Berne, A. and Schleiss, M.: Retrieval of the rain drop size distribution using telecommunication dual-polarization microwave links, 34th Conference on Radar Meteorology, Williamsburg, VA, USA, October 2009, American Meteorological Society, https://ams.confex.com/ams/34Radar/techprogram/paper_155668.htm (last access: 9 October 2009), 2009. a
Bringi, V. N. and Chandrasekar, V.: Polarimetric Doppler Weather Radar: Principles and Applications, Cambridge University Press, https://doi.org/10.1017/CBO9780511541094, 2001. a, b
Bringi, V. N., Huang, G.-J., Chandrasekar, V., and Gorgucci, E.: A Methodology for Estimating the Parameters of a Gamma Raindrop Size Distribution Model from Polarimetric Radar Data: Application to a Squall-Line Event from the TRMM/Brazil Campaign, J. Atmos. Ocean. Technol., 19, 633–645, https://doi.org/10.1175/1520-0426(2002)019<0633:AMFETP>2.0.CO;2, 2002. a
Bringi, V. N., Chandrasekar, V., Hubbert, J., Gorgucci, E., Randeu, W. L., and Schoenhuber, M.: Raindrop Size Distribution in Different Climatic Regimes from Disdrometer and Dual-Polarized Radar Analysis, J. Atmos. Sci., 60, 354–365, https://doi.org/10.1175/1520-0469(2003)060<0354:RSDIDC>2.0.CO;2, 2003. a
Carey, L. D. and Petersen, W. A.: Sensitivity of C-Band Polarimetric Radar–Based Drop Size Estimates to Maximum Diameter, J. Appl. Meteorol. Climatol., 54, 1352–1371, 2015. a
Chen, B., Wang, J., and Gong, D.: Raindrop Size Distribution in a Midlatitude Continental Squall Line Measured by Thies Optical Disdrometers over East China, J. Appl. Meteorol. Climatol., 55, 621–634, https://doi.org/10.1175/JAMC-D-15-0127.1, 2016. a
Cugerone, K. and De Michele, C.: Johnson SB as general functional form for raindrop size distribution, Water Resour. Res., 51, 6276–6289, https://doi.org/10.1002/2014WR016484, 2015. a
Durden, S. L. and Tanelli, S.: Predicted Effects of Nonuniform Beam Filling on GPM Radar Data, IEEE Geosci. Remote Sens. Lett., 5, 308–310, https://doi.org/10.1109/LGRS.2008.916068, 2008. a
Frech, M. and Hubbert, J.: Monitoring the differential reflectivity and receiver calibration of the German polarimetric weather radar network, Atmos. Meas. Tech., 13, 1051–1069, https://doi.org/10.5194/amt-13-1051-2020, 2020. a
Gatidis, C., Schleiss, M., Unal, C., and Russchenberg, H.: A Critical Evaluation of the Adequacy of the Gamma Model for Representing Raindrop Size Distributions, J. Atmos. Ocean. Technol., 37, 1765–1779, https://doi.org/10.1175/JTECH-D-19-0106.1, 2020. a, b, c, d
Gatidis, C., Schleiss, M., and Unal, C.: ACCEPT campaign – Parsivel disdrometer Drop Size Distribution (DSD), TU Delft [data set], https://doi.org/https://doi.org/10.4121/20511111.v1, 2022. a
Gorgucci, E., Scarchilli, G., Chandrasekar, V., and Bringi, V. N.: Rainfall Estimation from Polarimetric Radar Measurements: Composite Algorithms Immune to Variability in Raindrop Shape–Size Relation, J. Atmos. Ocean. Technol., 18, 1773–1786, https://doi.org/10.1175/1520-0426(2001)018<1773:REFPRM>2.0.CO;2, 2001. a
Gorgucci, E., Chandrasekar, V., Bringi, V. N., and Scarchilli, G.: Estimation of Raindrop Size Distribution Parameters from Polarimetric Radar Measurements, J. Atmos. Sci., 59, 2373–2384, https://doi.org/10.1175/1520-0469(2002)059<2373:EORSDP>2.0.CO;2, 2002. a
Heijnen, S., Ligthart, L., and Russchenberg, H.: First measurements with TARA; An S-Band transportable atmospheric radar, Phys. Chem. Earth, Part B, 25, 995–998, https://doi.org/10.1016/S1464-1909(00)00140-4, 2000. a
Hubbert, J. and Pratte, F.: Differential Reflectivity Calibration for NEXRAD, in: 2006 IEEE International Symposium on Geoscience and Remote Sensing, 519–522, https://doi.org/10.1109/IGARSS.2006.138, 2006. a
Jameson, A. R. and Kostinski, A. B.: What is a Raindrop Size Distribution?, B. Am. Meteorol. Soc., 82, 1169–1178, https://doi.org/10.1175/1520-0477(2001)082<1169:WIARSD>2.3.CO;2, 2001. a
Lee, G. W., Zawadzki, I., Szyrmer, W., Sempere-Torres, D., and Uijlenhoet, R.: A General Approach to Double-Moment Normalization of Drop Size Distributions, J. Appl. Meteorol., 43, 264–281, https://doi.org/10.1175/1520-0450(2004)043<0264:AGATDN>2.0.CO;2, 2004. a
Löffler-Mang, M. and Joss, J.: An Optical Disdrometer for Measuring Size and Velocity of Hydrometeors, J. Atmos. Ocean. Technol., 17, 130–139, https://doi.org/10.1175/1520-0426(2000)017<0130:AODFMS>2.0.CO;2, 2000. a
Moisseev, D. N. and Chandrasekar, V.: Examination of the μ-Λ Relation Suggested for Drop Size Distribution Parameters, J. Atmos. Ocean. Technol., 24, 847–855, https://doi.org/10.1175/JTECH2010.1, 2007. a, b
Mróz, K., Battaglia, A., Kneifel, S., D'Adderio, L. P., and Dias Neto, J.: Triple-Frequency Doppler Retrieval of Characteristic Raindrop Size, Earth Space Sci., 7, e2019EA000789, https://doi.org/10.1029/2019EA000789, 2020. a
Pfitzenmaier, L., Unal, C. M. H., Dufournet, Y., and Russchenberg, H. W. J.: Observing ice particle growth along fall streaks in mixed-phase clouds using spectral polarimetric radar data, Atmos. Chem. Phys., 18, 7843–7862, https://doi.org/10.5194/acp-18-7843-2018, 2018. a, b
Raupach, T. H. and Berne, A.: Correction of raindrop size distributions measured by Parsivel disdrometers, using a two-dimensional video disdrometer as a reference, Atmos. Meas. Tech., 8, 343–365, https://doi.org/10.5194/amt-8-343-2015, 2015. a
Rose, C. R. and Chandrasekar, V.: A GPM Dual-Frequency Retrieval Algorithm: DSD Profile-Optimization Method, J. Atmos. Ocean. Technol., 23, 1372–1383, 2006. a
Ryzhkov, A. V.: The Impact of Beam Broadening on the Quality of Radar Polarimetric Data, J. Atmos. Ocean. Technol., 24, 729–744, https://doi.org/10.1175/JTECH2003.1, 2007. a
Seela, B. K., Janapati, J., Lin, P.-L., Wang, P. K., and Lee, M.-T.: Raindrop Size Distribution Characteristics of Summer and Winter Season Rainfall Over North Taiwan, J. Geophys. Res.-Atmos., 123, 11602–11624, https://doi.org/10.1029/2018JD028307, 2018. a
Sekelsky, S. M. and Clothiaux, E. E.: Parallax Errors and Corrections for Dual-Antenna Millimeter-Wave Cloud Radars, J. Atmos. Ocean. Technol., 19, 478–485, https://doi.org/10.1175/1520-0426(2002)019<0478:PEACFD>2.0.CO;2, 2002. a
Seliga, T. A. and Bringi, V. N.: Potential Use of Radar Differential Reflectivity Measurements at Orthogonal Polarizations for Measuring Precipitation., J. Appl. Meteorol., 15, 69–76, https://doi.org/10.1175/1520-0450(1976)015<0069:PUORDR>2.0.CO;2, 1976. a
Testud, J., Oury, S., Black, R. A., Amayenc, P., and Dou, X.: The Concept of “Normalized” Distribution to Describe Raindrop Spectra: A Tool for Cloud Physics and Cloud Remote Sensing, J. Appl. Meteorol., 40, 1118–1140, https://doi.org/10.1175/1520-0450(2001)040<1118:TCONDT>2.0.CO;2, 2001. a, b, c
Thompson, G., Rasmussen, R. M., and Manning, K.: Explicit Forecasts of Winter Precipitation Using an Improved Bulk Microphysics Scheme. Part I: Description and Sensitivity Analysis, Mon. Weather Rev., 132, 519–542, https://doi.org/10.1175/1520-0493(2004)132<0519:EFOWPU>2.0.CO;2, 2004. a
Thurai, M. and Bringi, V. N.: Rain microstructure from polarimetric radar and advanced disdrometers, 233–284, Springer Berlin Heidelberg, Berlin, Heidelberg, https://doi.org/10.1007/978-3-540-77655-0_10, 2008. a
Thurai, M., Petersen, W. A., Tokay, A., Schultz, C., and Gatlin, P.: Drop size distribution comparisons between Parsivel and 2-D video disdrometers, Adv. Geosci., 30, 3–9, https://doi.org/10.5194/adgeo-30-3-2011, 2011. a
Thurai, M., Bringi, V., Gatlin, P. N., Petersen, W. A., and Wingo, M. T.: Measurements and Modeling of the Full Rain Drop Size Distribution, Atmosphere, 10, 39, https://doi.org/10.3390/atmos10010039, 2019. a
Tokay, A., Wolff, D. B., and Petersen, W. A.: Evaluation of the New Version of the Laser-Optical Disdrometer, OTT Parsivel2, J. Atmos. Ocean. Technol., 31, 1276–1288, https://doi.org/10.1175/JTECH-D-13-00174.1, 2014. a
Torres, D. S., Porrà, J. M., and Creutin, J.-D.: A General Formulation for Raindrop Size Distribution, J. Appl. Meteorol. Climatol., 33, 1494–1502, https://doi.org/10.1175/1520-0450(1994)033<1494:AGFFRS>2.0.CO;2, 1994. a, b
Uijlenhoet, R., Steiner, M., and Smith, J. A.: Variability of Raindrop Size Distributions in a Squall Line and Implications for Radar Rainfall Estimation, J. Hydrometeorol., 4, 43–61, https://doi.org/10.1175/1525-7541(2003)004<0043:VORSDI>2.0.CO;2, 2003. a
Ulbrich, C. W.: Natural Variations in the Analytical Form of the Raindrop Size Distribution, J. Clim. Appl. Meteorol., 22, 1764–1775, https://doi.org/10.1175/1520-0450(1983)022<1764:NVITAF>2.0.CO;2, 1983. a, b
Ulbrich, C. W. and Atlas, D.: Assessment of the contribution of differential polarization to improved rainfall measurements, Radio Sci., 19, 49–57, https://doi.org/10.1029/RS019i001p00049, 1984. a
Unal, C.: High-Resolution Raindrop Size Distribution Retrieval Based on the Doppler Spectrum in the Case of Slant Profiling Radar, J. Atmos. Ocean. Technol., 32, 1191–1208, https://doi.org/10.1175/JTECH-D-13-00225.1, 2015. a, b
van Leth, T. C., Leijnse, H., Overeem, A., and Uijlenhoet, R.: Estimating raindrop size distributions using microwave link measurements: potential and limitations, Atmos. Meas. Tech., 13, 1797–1815, https://doi.org/10.5194/amt-13-1797-2020, 2020. a
Williams, C. R., Bringi, V. N., Carey, L. D., Chandrasekar, V., Gatlin, P. N., Haddad, Z. S., Meneghini, R., Joseph Munchak, S., Nesbitt, S. W., Petersen, W. A., Tanelli, S., Tokay, A., Wilson, A., and Wolff, D. B.: Describing the Shape of Raindrop Size Distributions Using Uncorrelated Raindrop Mass Spectrum Parameters, J. Appl. Meteorol. Climatol., 53, 1282–1296, https://doi.org/10.1175/JAMC-D-13-076.1, 2014. a, b
Zhang, G., Vivekanandan, J., and Brandes, E.: A method for estimating rain rate and drop size distribution from polarimetric radar measurements, IEEE Trans. Geosci. Remote Sens., 39, 830–841, https://doi.org/10.1109/36.917906, 2001. a, b, c, d, e, f, g
Zhang, G., Vivekanandan, J., Brandes, E. A., Meneghini, R., and Kozu, T.: The Shape–Slope Relation in Observed Gamma Raindrop Size Distributions: Statistical Error or Useful Information?, J. Atmos. Ocean. Technol., 20, 1106–1119, https://doi.org/10.1175/1520-0426(2003)020<1106:TSRIOG>2.0.CO;2, 2003. a, b, c, d, e, f, g, h