the Creative Commons Attribution 4.0 License.
the Creative Commons Attribution 4.0 License.
 | 03 Nov 2022
Intercomparison of airborne and surface-based measurements during the CLARIFY, ORACLES and LASIC field experiments
Paul A. Barrett
Steven J. Abel
Ian Crawford
Amie Dobracki
James Haywood
Steve Howell
Anthony Jones
Justin Langridge
Greg M. McFarquhar
Graeme J. Nott
Hannah Price
Jens Redemann
Yohei Shinozuka
Kate Szpek
Jonathan W. Taylor
Robert Wood
Huihui Wu
Paquita Zuidema
Stéphane Bauguitte
Ryan Bennett
Keith Bower
Hong Chen
Sabrina Cochrane
Michael Cotterell
Nicholas Davies
David Delene
Connor Flynn
Andrew Freedman
Steffen Freitag
Siddhant Gupta
David Noone
Timothy B. Onasch
James Podolske
Michael R. Poellot
Sebastian Schmidt
Stephen Springston
Arthur J. Sedlacek III
Jamie Trembath
Alan Vance
Maria A. Zawadowicz
Jianhao Zhang
Data are presented from intercomparisons between two research aircraft, the FAAM BAe-146 and the NASA Lockheed P3, and between the BAe-146 and the surface-based DOE (Department of Energy) ARM (Atmospheric Radiation Measurement) Mobile Facility at Ascension Island (8∘ S, 14.5∘ W; a remote island in the mid-Atlantic). These took place from 17 August to 5 September 2017, during the African biomass burning (BB) season. The primary motivation was to give confidence in the use of data from multiple platforms with which to evaluate numerical climate models. The three platforms were involved in the CLouds–Aerosol–Radiation Interaction and Forcing for Year 2017 (CLARIFY-2017), ObseRvations of Aerosols above CLouds and their intEractionS (ORACLES), and Layered Atlantic Smoke and Interactions with Clouds (LASIC) field experiments. Comparisons from flight segments on 6 d where the BAe-146 flew alongside the ARM facility on Ascension Island are presented, along with comparisons from the wing-tip-to-wing-tip flight of the P3 and BAe-146 on 18 August 2017. The intercomparison flight sampled a relatively clean atmosphere overlying a moderately polluted boundary layer, while the six fly-bys of the ARM site sampled both clean and polluted conditions 2–4 km upwind. We compare and validate characterisations of aerosol physical, chemical and optical properties as well as atmospheric radiation and cloud microphysics between platforms. We assess the performance of measurement instrumentation in the field, under conditions where sampling conditions are not as tightly controlled as in laboratory measurements where calibrations are performed. Solar radiation measurements compared well enough to permit radiative closure studies. Optical absorption coefficient measurements from all three platforms were within uncertainty limits, although absolute magnitudes were too low (<10 Mm−1) to fully support a comparison of the absorption Ångström exponents. Aerosol optical absorption measurements from airborne platforms were more comparable than aircraft-to-ground observations. Scattering coefficient observations compared adequately between airborne platforms, but agreement with ground-based measurements was worse, potentially caused by small differences in sampling conditions or actual aerosol population differences over land. Chemical composition measurements followed a similar pattern, with better comparisons between the airborne platforms. Thermodynamics, aerosol and cloud microphysical properties generally agreed given uncertainties.
Please read the corrigendum first before continuing.
-
Notice on corrigendum
The requested paper has a corresponding corrigendum published. Please read the corrigendum first before downloading the article.
-
Article
(8101 KB)
- Corrigendum
-
Supplement
(1147 KB)
-
The requested paper has a corresponding corrigendum published. Please read the corrigendum first before downloading the article.
- Article
(8101 KB) - Full-text XML
- Corrigendum
-
Supplement
(1147 KB) - BibTeX
- EndNote


A number of in situ and remote sensing observational field campaigns involving multiple airborne and ground-based measurement platforms operated in the south-eastern Atlantic region from 2016 to 2018 (Figure 1, Table 1). The overarching aim of this unprecedented observational effort was to provide constraints with which to address the disparity in radiative forcing estimates due to cloud and aerosol processes between leading climate models, such as those contributing to the AeroCom intercomparison exercise (Stier et al., 2013). The uncertainty in radiative forcing estimates in the south-eastern Atlantic is related to poorly constrained optical properties of the absorbing biomass burning aerosols (BBAs), discrepancies between the representation of marine boundary layer clouds, the location in the vertical of the aerosols relative to these clouds and the interaction of these aerosols with oceanic boundary layer clouds (Zuidema et al., 2016).
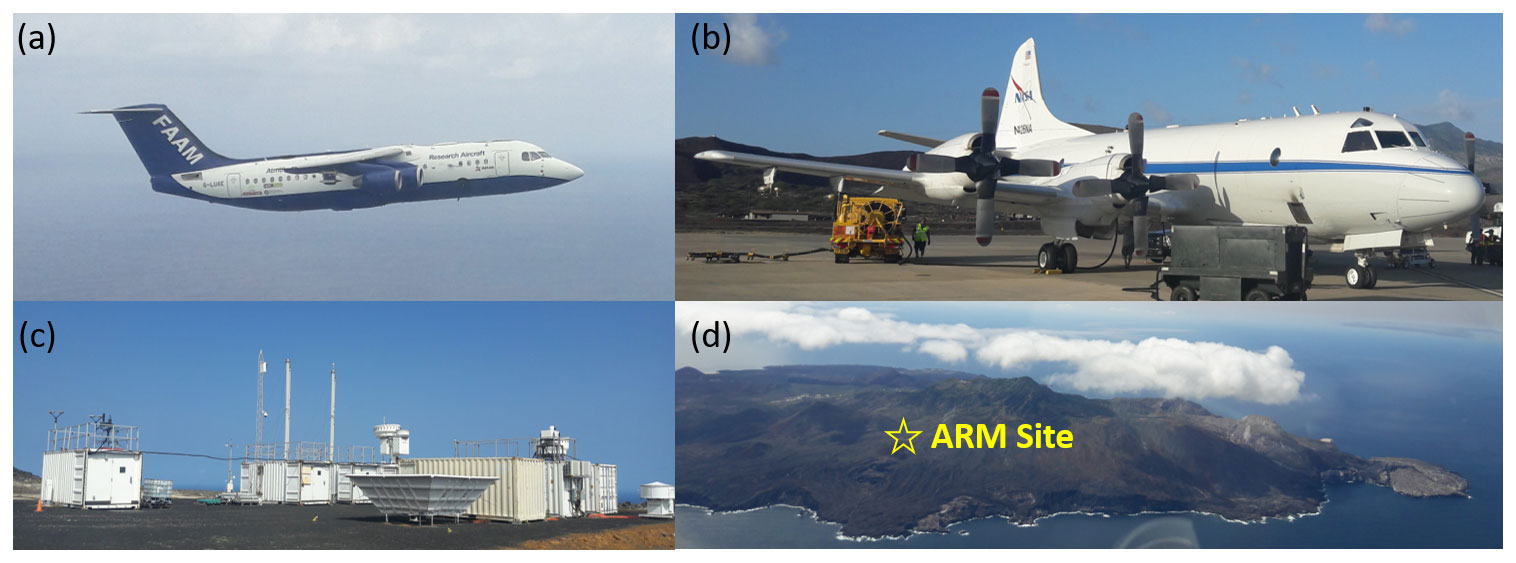
Figure 1The observation platforms during (a) CLARIFY: the FAAM BAe-146; (b) ORACLES: the NASA P3; and (c) LASIC: ARM Mobile Facility no. 1. (d) The location of the ARM Mobile Facility no. 1 on Nasa Road, Ascension Island. This photograph was taken looking approximately north-north-east, showing the site exposed to the prevailing south-westerly winds.
Table 1Deployments of ground-based and airborne measurements in the south-eastern Atlantic during three biomass burning seasons from 2016 to 2018.
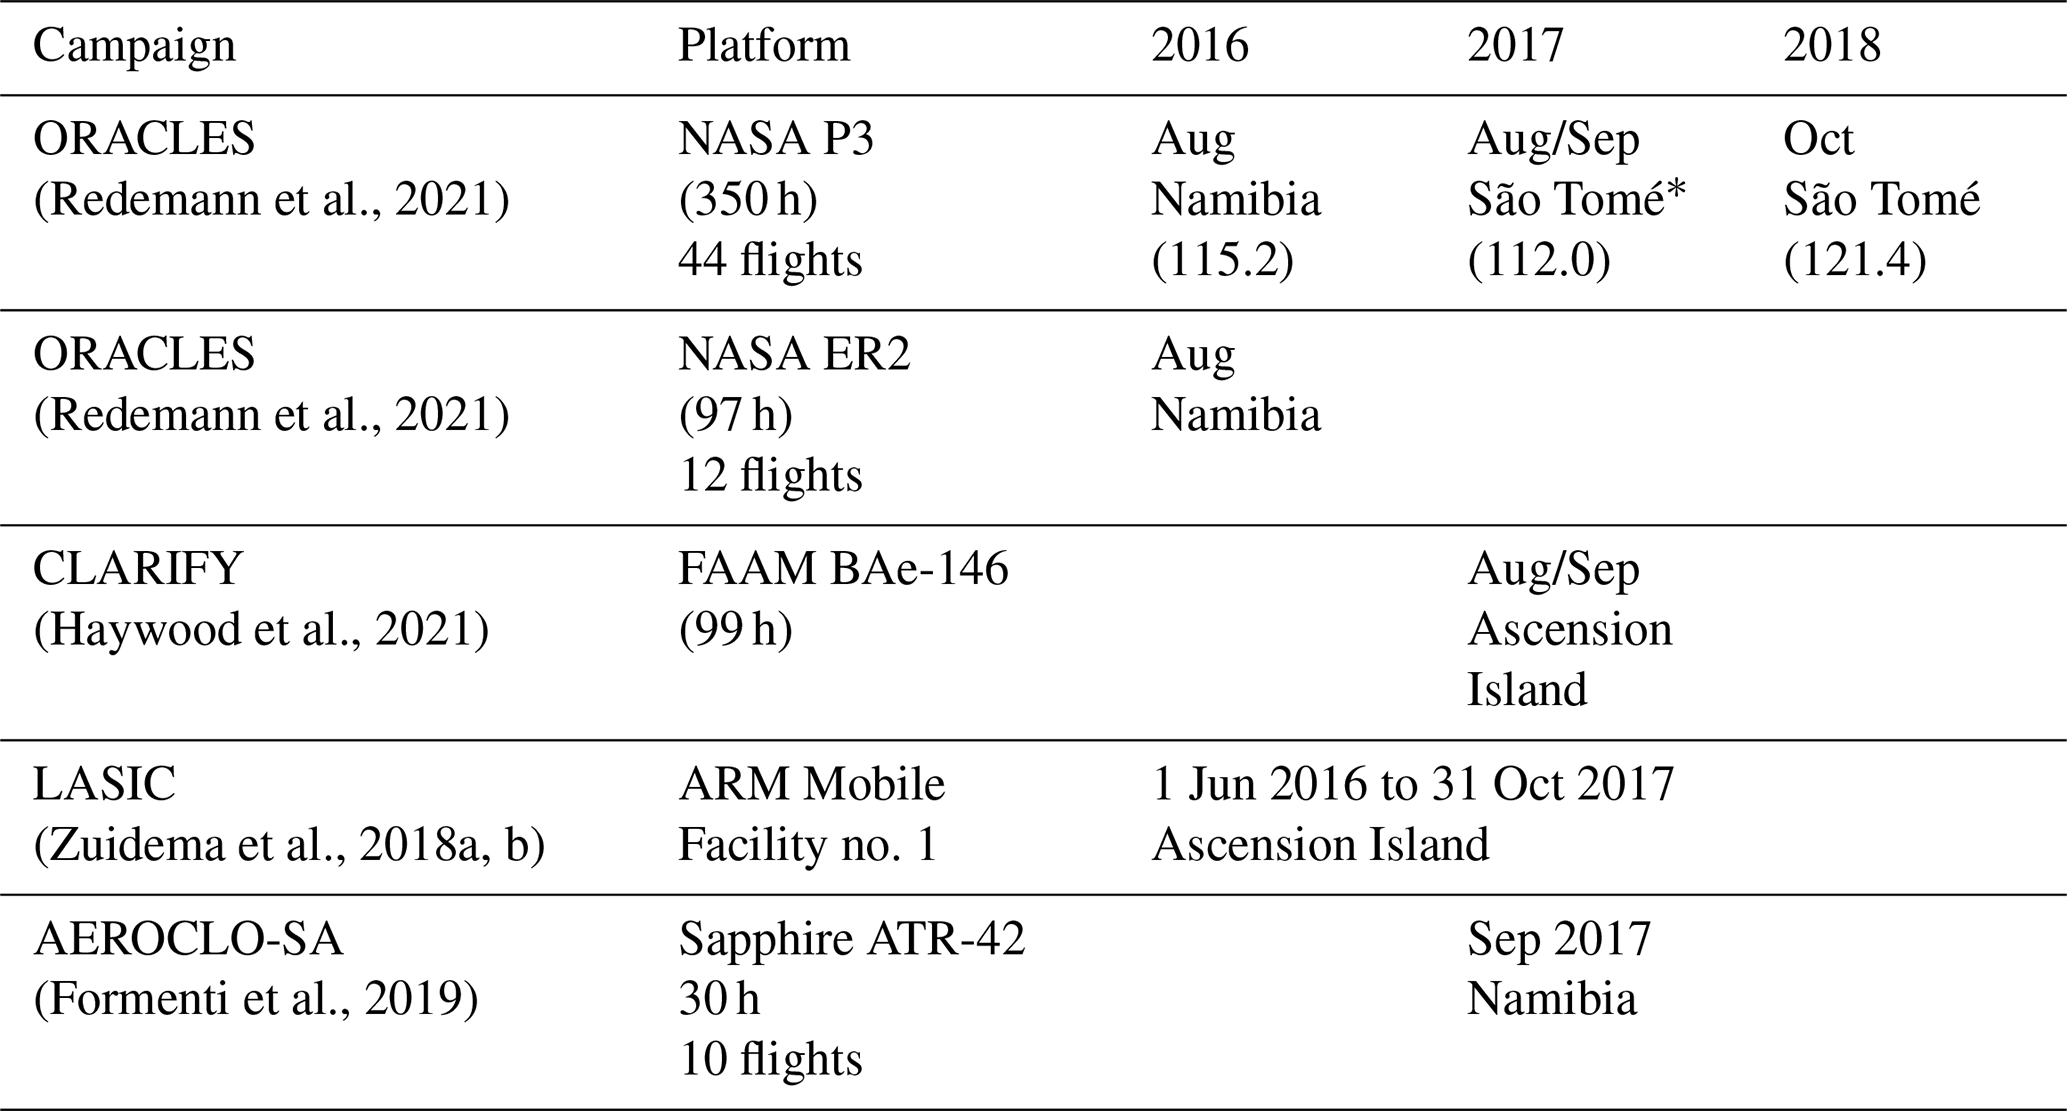
* The NASA P3 relocated to Ascension Island temporarily to conduct the intercomparison flight in this study.
International projects (Zuidema et al., 2016) including CLouds–Aerosol–Radiation Interaction and Forcing for Year 2017 (CLARIFY-2017; Haywood et al., 2021), ObseRvations of Aerosols above CLouds and their intEractionS (ORACLES; Redemann et al., 2021), Layered Atlantic Smoke and Interactions with Clouds (LASIC; Zuidema et al., 2018a, b), and AEROCLO-SA (AErosol, RadiatiOn, and CLouds in Southern Africa; Formenti et al., 2019) had many overlapping objectives, aiming to determine the optical, chemical and physical properties of BBAs and thus the radiative impacts of those aerosols on climate, through both direct radiative effects and impacts on the properties of clouds. Figure 2 shows the flight tracks over the 3 years of sampling between 2016 and 2018 for the airborne platforms. CLARIFY and ORACLES focussed on measurements over the south-eastern Atlantic Ocean, and AEROCLO-SA supplemented this with observations over Namibia and the near-coastal ocean. Direct comparisons with the AEROCLO-SA were not possible due to the separation in space and time between it and the other campaigns. Here we focus on observations from the CLARIFY, ORACLES and LASIC components as side-by-side intercomparison data are available.
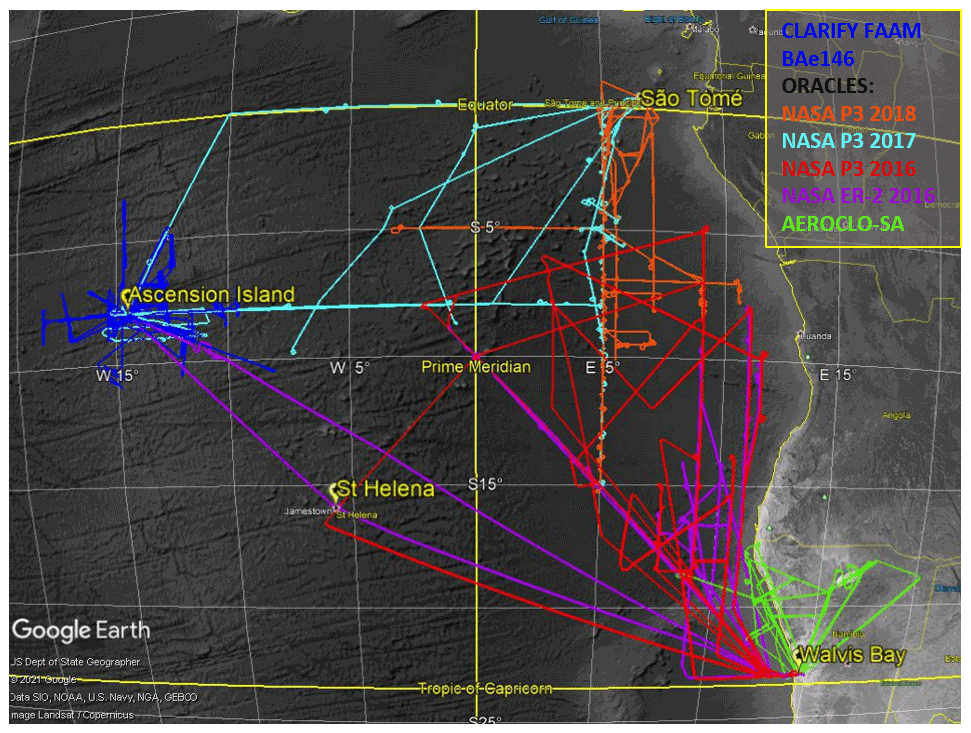
Figure 2Flight tracks for science flights (transit and ferry flights omitted; © Google Earth 2021) from CLARIFY 2017 (FAAM BAe-146); ORACLES 2016 (NASA P3 and ER-2), 2017 (P3) and 2018 (P3); and AEROCLO-SA (Falcon20).
Most measurements of relatively fresh BBA close to the coast of Africa were taken with the P3 during ORACLES, while more aged BBA was measured from the LASIC and CLARIFY-2017 platforms. Flight tracks for the airborne sampling from all years are shown in Fig. 2. Confidence that the contrasts between the measurement sets are not simply a result of instrument biases is critical for understanding aerosol ageing. A key benefit of this collaboration is that it provides information regarding the comparability of measurements made from the various platforms, provided the instrumentation remains well calibrated. This facilitates more reliable assessment of spatiotemporal gradients made by compositing data from the different platforms.
Here we present results from a wing-tip-to-wing-tip airborne intercomparison flight between the NASA P3 (Flight PRF05Y17) and the FAAM BAe-146 (Flight C031) on 18 August 2017, with both aircraft departing from the Wideawake Airfield on Ascension Island. The intercomparison was composed of flight segments in the pristine free troposphere, within a moderately polluted marine boundary layer and through a vertically elevated pollution layer. Additional comparisons were made by FAAM flying adjacent to an ARM (Atmospheric Radiation Measurement) site on Ascension Island following this airborne intercomparison and on five further flights throughout August and September 2017 (Table 2). FAAM–LASIC intercomparisons took place at nominally the same altitude as the ARM site with the FAAM BAe-146 operating between 2 and 4 km offshore and upwind of the LASIC observation site.
We offer the results of this study as a “transfer standard” upon which other comparisons and scientific conclusions can be baselined. A key aim is to provide comparisons of parameters that are required to determine aerosol optical, physical and chemical properties as well as cloud microphysics, atmospheric radiation and tracers for air mass characterisation.
The following section provides an overview of the instrumentation from each platform that is considered in this intercomparison. Section 3 describes the methods employed in executing the intercomparisons and the processing of resulting measurement data. Results presented in Sect. 4 are discussed in Sect. 5. Conclusions are presented in Sect. 6. A key to acronyms is found in Table 8.
A brief introduction follows for each of the instruments and inlets under study here along with the calibration procedures undertaken. When multiple instruments providing a given measurement were available on a particular platform, we chose to focus primarily on what would be considered the standard, routine data product. However, in some cases, datasets are included from supplementary instruments where this proves informative. We provide sufficient information for the reader to understand instrument operation and its installation configuration on the platform, and the reader is directed to the references provided for full descriptions of instrumentation characteristics. Parameters depending on sample concentration or flow rates, such as particulate measurements and gas concentrations, are converted to standard temperature and pressure (STP) conditions of 273.15 K and 1013.25 hPa. Timing offsets between instruments, introduced for example by flow-rate offsets, were first corrected for.
2.1 Particle and gas inlets
Gas samples were drawn into the BAe-146 aircraft through dedicated whole-air sample pipes, and samples containing aerosol particles were drawn into the aircraft through modified Rosemount Aerospace Inc. Type 102 total temperature housings, which, while aspirated, operate at sub-isokinetic flow velocities. The Rosemount inlets are mounted in pairs at three locations towards the front of the aircraft, the inlets in each pair offset from one another to avoid interference. The EXtinction SCattering and Absorption of Light for AirBorne Aerosol Research rack (EXSCALABAR; Sect. 2.5.2) of instrumentation was fed by the Rosemount pair located above the starboard doorway towards the front of the aircraft. The Single Particle Soot Photometer (SP2; Sect. 2.4.1) took its feed from the other of this forward-starboard Rosemount inlet pair. The aerosol mass spectrometer (AMS) rack (Sect. 2.4.2), which includes a scanning mobility particle sizer (SMPS; Sect. 2.6), was fed from the lower Rosemount pair on the port side. On the port side of the FAAM BAe-146 is a blister pod that houses large radiometers. This feature sits just upstream (in terms of airborne streamlines around the fuselage) of the Rosemount particle inlets for AMS, SMPS and the condensation particle counter (CPC; Sect. 2.6) and may provide a potential barrier to the airflow and shadow a certain portion of the particle size distribution. However, the transmission efficiency for submicron low-density aerosols (i.e. not dust) has been demonstrated to be close to unity for individual Rosemount inlets (Trembath et al., 2012; Trembath, 2013), with agreement demonstrated between two pairs of Rosemount inlets on the port side of the aircraft.
Aerosol particles were brought into the P3 through the solid diffuser inlet (SDI), which was operated isokinetically, with the flow rate matched to external airflow velocity to within 5 % (Dobracki et al., 2022). The inlet has been shown to efficiently transmit particles at dry diameters up to 4.0 µm (McNaughton et al., 2007), with good agreement (10 % to 30 %) for submicron-sized scattering aerosols between this and ground-based tower observations. Internal pipe work was designed to minimise transport losses for particles up to 4.0 µm, using open-source software from Baron (2001), although additional complications associated with airborne sampling mean that not all losses may be well accounted for, and differences may exist owing to different flow rate and pathways to different instruments (Dobracki et al., 2022).
Aerosol sampling during LASIC at the ARM facility on Ascension Island took place within shipping containers fed by a centrally located community inlet at the top of a 10 m mast and delivered to a five-way distribution port through a 2′′ polished stainless steel pipe. This nominally transmitted aerosols as large as 10 µm (PM10), but a selectable impactor was used periodically to select only those particles smaller than 1 µm (PM1; at 50 % efficiency; Uin et al., 2020). The latter data stream is available only to the nephelometers. The switching regime tended to be 5 min on PM1, 1 min off (i.e. PM10), 4 min on, 1 min off and 1 min on, followed by the inverse with 5 min on PM10, etc.
2.2 Meteorological parameters
On the FAAM BAe-146, aircraft position and attitude are provided by an Applanix POS AV 410 global-positioning-system-aided inertial navigation system with static pressure taken from the aircraft's air data computer (BAe Systems 2000). Vertical wind data were produced by combining data from pressure sensors in a nose-mounted five-port turbulence probe and aircraft position and attitude data, recorded at 32 Hz, and analysed here at 1 Hz (Barrett et al., 2020). Temperature was provided by a Rosemount Aerospace Inc. Type 102 non-de-iced total temperature housing fitted with an open-wire platinum resistance thermometer sensing element located on the nose cone of the aircraft. Temperature data were reported at 32 Hz, averaged to 1 Hz. The uncertainty in temperature was computed by combining in quadrature the uncertainties associated with sensor drift, the data acquisition system, the calibration standard itself and the digital voltmeter used in the calibration. For flight C031 (Sect. 3.1) non-de-iced temperature sensor uncertainties were smaller than 0.4 K.
Humidity data were recorded by a Buck Research Instruments CR2 chilled-mirror dew point hygrometer with heated inlet (Price, 2022). The Buck CR2 has computed in-flight uncertainty in dew point temperature (when conditions were suitable) of a mean value of 0.2 K, with 99 % of values below 1.0 K. When converted to water vapour concentrations the uncertainty was below 2 % across the range encountered during the intercomparison flight. Whilst this humidity sensor is stable and calibrated to traceable standards it is combined with a tunable diode laser (TDL) hygrometer where faster response measurements are required. The TDL, a water vapour sensing system (WVSS-II, SpectraSensors), recorded data at 0.4 Hz, which was linearly interpolated to 1 Hz, fed by the standard flush-mounted inlet as described by Vance et al. (2015). The wet bias noted by Vance et al. (2015) was subsequently shown not to result from the performance of the flush-mounted inlet (Vance et al., 2018), which is expected to perform well in the humidity range encountered during the measurements in this study. The WVSS-II is an absolute measure of water vapour concentration with an uncertainty of ±5 % (above a minimum of ±50 ppmv; Vance et al., 2015), but the sample-cell temperature and pressure are not known, and so data are subject to unknown uncertainties. Therefore, data were first baselined against the Buck CR2 to known good data using the method detailed in Price (2020). This WVSS-II data product is deemed the primary humidity measurement provided by FAAM, in part due to the combination of a stable calibrated sensor, the Buck CR2 and the faster response time of the WVSS-II TDL sensor.
On the NASA P3, a Honeywell Sperry AZ-800 air data system provided static pressure, pressure altitude and true airspeed, with aircraft position, attitude, ground speed and vertical speed coming from a Universal Avionics UNS-1Fw (NASA, 2010). Vertical wind data were provided by this system and reported at 1 Hz, where the uncertainty was ±0.15 m s−1. The magnitude of the vertical wind velocities and the fluctuations about the run mean values were interrogated. Total air temperature was provided by a Rosemount 102 type non-deiced probe with a manufacturer-reported uncertainty of approximately 0.35 K over 1 s. Water vapour concentrations were measured with the “WISPER” system comprised of a Picarro L2120-i fed from the SDI (Pistone et al., 2021), nominally “TOT2”, with a similar measurement made by a second Picarro L2210-i instrument fed from the counterflow virtual impactor inlet (CVI) when out of cloud, nominally “TOT1”. A secondary measurement from the COMA system (see Sect. 2.3) came from a Los Gatos Research 23r, also fed from the SDI. Comparisons during ORACLES-2016 showed agreement between the COMA and WISPER systems, with the slope of linear regressions within 2 %, with COMA detecting slightly higher concentrations in general, although lower concentrations at altitudes greater than 1.3 km. The airborne humidity instruments under test here reported values of water vapour volume mixing ratio (vmr) with NASA operating the WISPER TOT2 as the primary instrument. WISPER TOT1 is employed as a support measurement (it sometimes made cloud measurements from the CVI inlet) along with the COMA instrument (which also measured CO). All three are considered here.
LASIC ARM site observations of temperature, pressure and relative humidity (RH) were supplied from a Vaisala weather transmitter WXT520B (Campbell Scientific) at a frequency of 1 Hz. Measurements of temperature were obtained using a capacitive ceramic THERMOCAP® sensor with manufacturer-quoted instrumental accuracy of ±0.3 K and RH with a HUMICAP® thin-film polymer sensor accurate to ±3 % RH (below 90 % RH).
2.3 Gaseous constituents
Carbon monoxide (CO) concentrations from the FAAM aircraft were provided by an inboard Aero-Laser GmbH model AL5002 VUV resonance fluorescence spectrometer (Gerbig et al., 1999). The instrument was calibrated periodically during flights with reference gases with CO =500 ppb and CO =0 ppb.
CO concentrations on board the NASA P3 were provided with a gas-phase analyser (ABB/Los Gatos Research analyser (907-0029)) modified for aircraft use and referred to as the “COMA” system. The analyser uses patented integrated cavity output spectroscopy (ICOS) technology to make stable cavity-enhanced absorption measurements of CO, CO2 and H2O in the infrared spectral region. The instrument reports mixing ratio (mole fraction) at a 1 Hz rate based on measured absorption, gas temperature and pressure using Beer's Law. The technology has been demonstrated to operate with a precision of 0.5 ppbv if averaged over 10 s on other airborne research platforms (Liu et al., 2017). Quoted uncertainty for CO is 6 % ±1 ppb. Altitude-dependent sample line timing offsets were corrected for.
Likewise, the instrument responsible for CO concentrations at the LASIC ARM site was a Los Gatos Research instrument, with a quoted uncertainty in the measurement of ±2 ppb.
Ozone concentrations on the BAe-146 were provided by an inboard Core Thermo Fisher Scientific Inc. model 49i UV absorption ozone photometer with a manufacturer-quoted instrumental uncertainty of 1 % ±1 ppb. NASA ozone measurements were made with a 2B Technologies Model 205 instrument with an uncertainty of 6 % ±1 ppb. The LASIC ozone measurements were provided by a Thermo Fisher Scientific Inc. model 49i UV absorption photometer with uncertainty of ±2 ppb (or 5 %, whichever is greater).
2.4 Aerosol composition
2.4.1 Black carbon particulate matter
The FAAM BAe-146 flew an SP2 instrument manufactured by Droplet Measurements Technologies Inc. (DMT) to monitor refractory black carbon number (BCn) and mass concentrations (BCm; Schwarz et al., 2006). The SP2 detects black carbon (BC) for particles between ∼80 and 500 nm volume-equivalent diameter (assuming BC density of 1.8 kg m−3). The instrument was located on the starboard side of the aircraft behind a Rosemount inlet (Taylor et al., 2020). Calibrations were performed using nebulised mass-selected Aquadag (using a centrifugal particle mass analyser) and corrected by a factor of 0.75 as recommended by Laborde et al. (2012). An SP2 was also installed at the LASIC ARM site, with this instrument calibrated using fullerene following Laborde et al. (2012) and Gysel et al. (2011), giving accuracy of 10 % and precision of 30 % (Sedlacek, 2017).
The NASA P3 SP2 instrument was affected by a leak on the supply rack during the part of the flight immediately before the intercomparison segments, and so data are compromised. Nonetheless, data are presented in Sect. S5 in the Supplement for completeness. The P3 SP2 instrument was calibrated in the same manner as the one at the ARM site, and its data are expected to be of good quality at other times in the ORACLES campaign. The installation location was on the front rack some 8 m behind the SDI inlet.
2.4.2 Aerosol mass spectrometers
The FAAM BAe-146 flew an Aerodyne compact time-of-flight aerosol mass spectrometer (AMS; Aerodyne Research Inc, Billerica, MA, USA; Drewnick et al., 2005) to measure the chemical composition of non-refractory aerosols in the 50 to 600 nm vacuum aerodynamic diameter range. According to Morgan et al. (2009) for a particle with a density of 1600 kg m−3, 600 nm equates to an upper mobility diameter of 440 nm. Morgan et al. (2009) describe the operation of the AMS on the FAAM aircraft, including calibration and corrections, while Wu et al. (2020) outline its use during CLARIFY. The aerosol samples entered the aircraft through a modified Rosemount inlet on the port side of the aircraft above the radiometer blister. Data were processed using the SeQUential Igor data RetRiEvaL, v.1.60N (Allan et al., 2003, 2004) algorithm (SQUIRREL) to return unit masses of ion fragments in the mass–charge () range 10–500 (Wu et al., 2020). The AMS was calibrated using monodisperse ammonium nitrate, and the relative ionisation efficiencies (RIEs) of ammonium and sulfate were calculated by varying concentrations of ammonium nitrate and ammonium sulfate. The RIE of sulfate was found to be 1.0834, while the RIE of ammonium was 4.0516. Organics and nitrate RIEs were kept as the SQUIRREL defaults of 1.4 and 1.1, respectively. Limits of detection for species were 0.3 µg m−3 (organics), 0.1 µg m−3 (sulfate) and 0.03 µg m−3 (nitrate and ammonium).
The NASA P3 flew a high-resolution time-of-flight AMS (HR-AMS), also manufactured by Aerodyne Research Inc. (Dobracki et al., 2022). Particles between 70 and 700 nm vacuum aerodynamic diameter were analysed with the AMS peaks processed using the Particle Integration by Key v.1.16 (PIKA) algorithm (DeCarlo et al., 2006). The nitrate ionisation efficiency values for the HR-AMS centred on , with a nominal 10 % uncertainty assigned to it following Bahreini et al. (2009). The ionisation efficiencies for ammonium, sulfate and organics relative to those for nitrate are thereafter determined within SQUIRREL as 4 for ammonium, 1.1 for measured nitrate relative to the calibration value, 1.2 for sulfate and 1.4 for organics, following Jimenez (2009). Overall uncertainties for components of the composition are between 33 % and 37 % (Dobracki et al., 2022). The instrument sat 8 m downstream of the SDI. Sampling transit times of 6 s due to pipe work transit times were accounted for by comparison to wing-mounted passive cavity aerosol spectrometer probe (PCASP; Sect. 2.6) measurements. Cloud shatter events were screened out by considering number concentrations of (nominal) 10 µm sized cloud particles from a wing-mounted phase doppler interferometer cloud microphysics probe (Chuang et al., 2008), including screening of data from 10 s post-event. The limit of detection for organics was 0.15, 0.03 µg m−3 for sulfate, 0.04 µg m−3 for nitrate and 0.01 µg m−3 for ammonium.
During CLARIFY, a time- and composition-dependent collection efficiency (CE) was applied to the data based on the algorithm by Middlebrook et al. (2012). The CE for each airborne AMS during the airborne comparisons was 0.5. This was demonstrated in the free troposphere for ORACLES data (Dobracki et al., 2022) and for the CLARIFY boundary layer and free-troposphere measurements more relevant to the region of these tests (Fig. S3 in the Supplement). Differences between the SQUIRREL and PIKA algorithms only accounted for 7 % differences between estimates of sulfate mass concentrations (Sect. S4).
LASIC operated an Aerodyne aerosol chemical speciation monitor (ACSM) to measure mass loading and chemical composition of non-refractory aerosol particles in real time, with data taken from the C2 dataset. The aerosol size range spans 40 to 700 nm (nominal) vacuum aerodynamic diameter (Liu et al., 2007). The ACSM was calibrated against a dedicated scanning mobility particle sizer (SMPS) both before and after the LASIC campaign, using monodisperse ammonium nitrate and ammonium sulfate. The nitrate ionisation efficiency (IE) and relative ionisation efficiencies (RIEs) for ammonium and sulfate were calculated using varying concentrations of ammonium nitrate and ammonium sulfate. The calibrated nitrate IE was found to be , and ammonium and sulfate RIEs were 5.51 and 0.75, respectively. Composition-dependent collection efficiency (Middlebrook et al., 2012) was unity on all comparison days, at the closest time point, but not for all days during the preceding or subsequent hours. Once the correct collection efficiency is applied the ACSM can obtain mass concentrations of particulates to within a detection limit of organics (0.148 µg m−3), sulfate (0.024 µg m−3), nitrate (0.012 µg m−3), ammonium (0.284 µg m−3) and chloride (0.011 µg m−3) for 30 min of signal averaging (Ng et al., 2011). Results are presented for the closest 30 min sample to the FAAM fly-past, with the range given as the standard deviation for the time span 1 h before and after. Data were not available for 5 September. Overall accuracy is ±30 % (Watson, 2017).
2.5 Aerosol optical properties
2.5.1 NASA P3 nephelometer and PSAP
Aerosol optical properties on the P3 were obtained by measuring optical scattering coefficients (σSP) with a TSI 3563 nephelometer and optical absorption coefficients (σAP) with a Radiance Research tri-wavelength particle soot absorption photometer (PSAP). The PSAP measured σAP at 470 nm (blue), 530 nm (green) and 660 nm (red). Data were corrected as per Pistone et al. (2019) following the method of Virkkula (2010; further details in Sect. 11.2). This has been shown to provide a good level of correction for BBAs over the south-eastern Atlantic region, mitigating against the impacts of scattering and absorption artefacts on the filter-based measurement (e.g. Davies et al., 2019). The instrument optics were heated to 30 ∘C during the 2017 ORACLES campaign, resulting in a “dried” sample while minimising vaporisation of volatile components. Errors of 0.5 Mm−1 remain when averaging for 240 to 300 s, as shown by McNaughton et al. (2009, 2011). The limited sampling time of ∼120 s available in this work and low aerosol concentrations encountered will result in larger errors. The particular PSAP unit employed here was the “rear” instrument as the “front” instrument suffered problems during sampling.
A TSI 3563 nephelometer recorded σSP at 450 nm (blue), 550 nm (green) and 700 nm (red) wavelengths, corrected according to Anderson and Ogren (1998). Blue and red channel data were then interpolated to 470 and 660 nm, respectively, using an interpolation based on linear regression between the logarithms of scattering optical depths (τ0(σSP) and τ1(σSP)) and wavelengths (λ0 and λ1; Eq. 2). First the scattering Ångström exponent, ÅSP, was derived from observations at the native wavelengths, prior to use of Eq. (2) again to determine scattering at the desired wavelength for amalgamation with PSAP data. Calibrations were performed in the field with refrigerant R-134A (1,1,1,2-tetrafluoroethane). RH data are measured within the nephelometer, but outside the sensing chamber, so estimates of sample RH are made by using laboratory calibrations to correct the real-time data. During boundary layer sampling, the RH was above 60 % and often at the threshold maximum reported value of 70 % (not shown). Overall uncertainty is of the order of 10 % when averaged over 240 s, so errors at the shorter comparison times available for this study will be greater than this. The optical extinction coefficient (σEP) was computed from the sum of the nephelometer-measured σSP and PSAP-measured σAP at 470 and 660 nm wavelengths using Eq. (1). Note that humidity may be different in each instrument.
Flow supplied to aerosol optical instruments on the P3 was from the port-side SDI and switched through either a PM1 impactor or directly through the PM10 (nominal) sampling line. The nephelometer drew at 30 L min−1 and the PSAP at 2 L min−1. Timing offsets were corrected for by comparing against aerosol particle measurements from a wing-mounted outboard PCASP (Sect. 2.6). Although data are output at 1 Hz, the effective sample temporal resolution is 6 s, and data are first smoothed with a 10 s moving average to reduce the impact of additional transit pipe work to the rear PSAP instrument and to facilitate comparison with other instruments under test. Periods where shattering of cloud particles may have degraded the quality of the P3 measurements were removed by consulting liquid water content (LWC) data from a King hot-wire probe and cloud particle number concentration data from a cloud droplet probe (CDP; Sect. 2.6).
2.5.2 FAAM BAe-146 EXSCALABAR
FAAM flew state-of-the art instrumentation for measurement of aerosol optical properties: EXtinction SCattering and Absorption of Light for AirBorne Aerosol Research (EXSCALABAR). The bespoke instrument was developed by the Met Office and University of Exeter for use on the BAe-146 aircraft (Davies et al., 2018a, 2019). Cavity ring-down spectroscopy (CRDS; Langridge et al., 2011) was employed to measure σEP and photoacoustic spectroscopy (PAS; Davies et al., 2018a, 2019) to measure σAP. CLARIFY was the first major campaign for EXSCALABAR following initial work during the Methane Observations and Yearly Assessments (MOYA) experiment (Wu et al., 2021), which comprised a limited number of flights sampling West African BBA close to the source of emissions.
The instrument racks are located towards the front of the BAe-146 on the starboard side, supplied by a Rosemount aerosol inlet. The 8 L min−1 total sample flow first passed through a Nafion™ dryer (Permapure, PD-200T-12-MSR) and a custom-built activated carbon “honeycomb” scrubber to remove ozone and NOx. The sample then passed through a custom-made impactor (Brechtel Manufacturing Inc.) with nominal aerodynamic diameter cut size, D50, of 1.3 µm (50 % of particles of this diameter are captured). All EXSCALABAR sampling occurred with the impactor in line. Custom-built splitters then feed eight parallel 1 L min−1 sample lines. Transmission losses between the instrument inlet and sample cells (i.e. through the sample conditioning) have been characterised and corrected for, as have time lags between measurement cells. Transit through the airflow system and detection cells results in an effective temporal resolution of 6 s, and here 1 s reported data are smoothed using a 10 s moving average prior to further analysis and for direct comparability with measurements from P3.
Dry σEP (RH below 10 %) is provided by CRDS channels for blue (405 nm) and red (660 nm) wavelengths (Davies et al., 2018a). Given aerosol loadings between 10 and 100 Mm−1, the measurement precision dominates total extinction uncertainty. The precision of 1 Hz data has been characterised in ground-based tests from Allan–Werle deviation analyses as being better than 0.4 Mm−1 for the CRDS spectrometers used in this work. Assessments of the CRDS measurement accuracy demonstrated that the measured aerosol extinction cross sections are within 3.6 % of expected values (Cotterell et al., 2020); indeed, this excellent accuracy is expected given that CRDS is a direct, calibration-free approach to aerosol optical property characterisations and is not subject to the artefacts that degrade characterisations from nephelometry or filter-based approaches.
Dry σAP at 405 nm (blue), 515 nm (green) and 660 nm (red) wavelengths is measured by PAS. Blue and red PAS cells are each positioned in series downstream of the blue and red dry CRDS cells. The green dry PAS cell operates in parallel with these blue and red sample lines. The PAS cells were calibrated either before or after each flight using ozone at concentrations determined using the CRDS cells (Davies et al., 2018a). Calibrations were stable throughout the campaign for all channels except PAS red dry, for which the optics were adjusted slightly mid-campaign. For all except the PAS red dry cell, an average of all calibrations was applied to each flight. For the red dry channel, calibrations before and after the adjustment were averaged and applied to all flights during their respective periods. Various pressure dependencies were corrected for using methods described by Cotterell et al. (2021).
Measurements of the aerosol-free background are required for both CRDS and PAS data analysis. A filtered-air stream is passed through the sample chambers and the response measured for ∼45 s every 10 min during flight, with additional background measurements following large pressure (i.e. altitude) changes. From these filtered-air measurements, background corrections were determined. Absorption coefficients encountered during the intercomparison flight were low. As such, they were especially sensitive to variations in acoustic background signal that occurred. Absolute measurement uncertainties (i.e. the combined uncertainties associated with measurement sensitivity and sources of bias) in the range of 8 % to 55 % can be achieved with the upper end of absolute uncertainty corresponding to the limit of absorption tending to 1 Mm−1 (Davies et al., 2019). The background signal varies with pressure. During this campaign, it was also affected by recent previous exposure to BBA, which complicated the derivation of a background signal. The cell design has subsequently been improved to minimise this effect (Cotterell et al., 2019a, b).
For comparison with P3 data, the values of σEP and σAP from the blue (405 nm) EXSCALABAR channels were interpolated to a common wavelength of 470 nm, to avoid extrapolation of data outside of any instrument's sampled range of wavelengths. This is done for σEP and σAP by determining the extinction or absorption Ångström exponent (ÅEP, ÅAP) between the red and blue CRDS cells and blue and green PAS cells (Eq. 2), before interpolating the 405 nm CRDS data to the 470 nm wavelength using Eq. (2). The red cell wavelength of 660 nm already matches that of the P3 PSAP. The absorption Ångström exponent, σAP, was computed using Eq. (2) for all combinations of wavelength pairs.
A TAP (tri-wavelength absorption photometer) was also installed in parallel with EXSCALABAR's PAS cells and has previously been used to compare absorption instrument filter-based correction schemes (Davies, 2018b; Davies et al., 2019). This filter-based technique operates at wavelengths of 476 nm (blue), 528 nm (green) and 652 nm (red) and was subjected to the same sample conditioning as the sample entering the PAS cells. Data are presented here after undergoing filtering and processing as described by Davies et al. (2019), who provide σAP at a sampling rate of 30 s (which is a longer averaging time than used for other measurements in this paper), and as they are supplementary, data are left at the native wavelengths. Here, we take data from the airborne intercomparison for more direct comparison with the filter-based measurement on board the NASA P3 and utilise the Virkkula (2010)-corrected data. ÅAP was computed using Eq. (2) for all combinations of wavelength pairs.
2.5.3 LASIC ARM site nephelometer and PSAP and CAPS PMSSA
Aerosol-laden air samples entered the LASIC cabin through the roof-mounted inlet. Scattering observations took place using a TSI 3563 nephelometer, which reported at 450 nm (blue), 550 nm (green) and 700 nm (red) wavelengths. The sample was not actively dried, but the RH of the sample in the measurement cell was estimated to be between 45 % and 60 % (Supplement of Zuidema et al., 2018a). Data were corrected according to Anderson and Ogren (1998). Prior to use in this study the data from the blue and red channels were interpolated to 470 and 660 nm, the native wavelengths of the PSAP. Dilution of the sample stream was accounted for.
A Radiance Research tri-wavelength PSAP measured σAP at 464 nm (blue), 529 nm (green) and 648 nm (red). The wavelengths differed from those detailed in Sect. 2.5.1 for NASA P3 (470, 530 and 660 nm) because they had been empirically determined with an Ocean Optics grating spectrometer registered to a mercury pen lamp (Springston, 2018a). The sample was actively dried by a Nafion™ dryer, and further dilution with a clean, dry airstream occurred. Whilst the RH was not measured, it is estimated to be below 25 % (Supplement of Zuidema et al., 2018a). PSAP data were constructed as the average of the Ogren (2010) corrections and Virkkula (2010) wavelength-averaged corrections. Flow rate was calibrated against a Gilibrator instrument and measurements. Prior to use in this study the data from blue and red channels were interpolated to 470 and 660 nm to be comparable with data from the aforementioned spectroscopy instruments.
A cavity-attenuated phase shift single-scattering albedo (CAPS PMSSA) monitor operating at a wavelength of 530 nm was deployed on Ascension from 4 August to 22 September 2017, overlapping with the CLARIFY time period, for the express purpose of assessing the filter-based LASIC single-scattering albedo (ω0) calculation. The CAPS PMSSA monitor provides a direct measurement of the particle single-scattering albedo by simultaneously measuring σSP and σEP, calculating ω0 from their ratio. Absolute particle extinction is measured using the cavity-attenuated phase shift technique, and particle scattering is derived from the light collected using an integrating sphere within the same optical path (Onasch et al., 2015), with absorption calculated from the difference. The total extinction was calibrated at Aerodyne prior to LASIC using 600 nm diameter polystyrene latex (PSL) particles, and another calibration was done in the field on 20 August 2017. The scattering was calibrated to the extinction for white (non-absorbing) particles (by definition, ω0=1.0). A 2 % truncation correction was applied to the scattering channel, based on ultra-high-sensitivity aerosol probe (UHSAS) size distribution data. The uncertainty in the ω0 measurements is estimated at ±0.03 (Onasch et al., 2015). Early assessments found excellent agreement (within 1 %) between the PSAP and CAPS PMSSA absorption measurements, with the nephelometer scattering exceeding the CAPS PMSSA scattering measurements (within 10 %). The monitor sampled from both the PM1 and PM10 inlets. The CAPS PMSSA measured from the same inlet as the UHSAS and PSAP, behind the nephelometer, which measured air with a relative humidity of 46 %–65 %. Here we use the data to estimate σAP by inputting the measured quantities into Eq. (1). The CAPS PMSSA measurement uncertainties for absorption coefficients are estimated in Onasch et al. (2015). For a typical ω0 ∼0.8 during LASIC, a conservative uncertainty estimate for the absorption coefficient is ∼20 %.
2.6 Aerosol and cloud microphysical and bulk properties
Total aerosol particle number concentrations in the form of measurements of condensation nuclei (CN) particle number concentrations were provided on all three platforms by CPC instruments. The NASA P3 flew a TSI 3010 instrument, which has a nominal lower size threshold of 10 nm and flow rate of 1.0 L min−1. Uncertainty in concentration of 5 % is primarily due to flow rate uncertainty. Data are multiplied by a constant factor of 1.02 following laboratory intercomparisons with other TSI 3010 CN counters used in the ORACLES campaign. On board the BAe-146 was a TSI 3776 with a lower size threshold of 2.5 nm and 5 % flow rate uncertainty. LASIC used a TSI 3776, an ultrafine CPC with a lower size threshold of 2.5 nm, which was operated without dilution flow. TSI 3776 instruments operate with a flow rate of 0.05 L min−1.
Both FAAM and LASIC had access to scanning mobility particle sizer (SMPS) data, which provided aerosol particle number concentrations for fixed particle mobility diameter. In the case of LASIC a TSI 3081 differential mobility analyser (DMA) associated with a TSI 3080 column supplied a full scan of data at 5 min intervals following a 260 s scan period. The instrument was located behind an impactor with D50=700 nm and has a lower size threshold of 10 nm. FAAM data were provided by a similar system with a TSI DMA 3081 connected to a TSI CPC 3786 (Wu et al., 2020) and reported particle mobility diameter in the size range of 20 to 350 nm. Previously a comparison was made for CLARIFY data between estimated volume concentrations derived from AMS + SP2 total mass concentrations and PM1 volume concentrations from PCASP (assuming spherical particles). Estimated AMS + SP2 volumes were approximately 80 % of the PCASP-derived values, which was considered reasonable and within the uncertainty in the volume calculations (Wu et al., 2020), demonstrating consistency between inboard and outboard measurements. Discrepancies between SMPS (inboard) and PCASP (outboard) number concentrations remained however, and so the SMPS concentrations were reduced by a collection efficiency factor of 1.8 to give better correspondence in the overlap region of the particle size distributions (PSDs). The cause remains unknown.
UHSASs were operated by both LASIC and NASA (located within the aircraft). These instruments have been shown to undersize particles where BBAs are present (Howell et al., 2021). The high-power laser modifies the measured size distribution through heating and evaporation of brown carbon, thus reducing particle size at the time of measurement. Reductions (up to 35 %) were observed for the larger particles of BC. NASA P3 data are first corrected using the power law introduced by Howell et al. (2021), which scales the default bin dimensions to be closer to mobility diameters as determined in real time in flight by size-selecting particles with a DMA. Moore et al. (2021) noticed similar behaviour in laboratory tests of a UHSAS for highly absorbing aerosols. Here we use the NASA P3 UHSAS data for comparison with the outboard FAAM BAe-146 PCASPs.
FAAM and NASA flew wing-mounted DMT PCASPs (Liu et al., 1992) with updated electronics (nominally SPP200; DMT, 2021), which were exposed to the free airstream. NASA operated a single unit located in the inner position of the inner pylon located under the port wing. FAAM flew two units mounted externally: PCASP1 and PCASP2. A third probe, PCASP3 (also with SPP200 electronics), was located within the fuselage as part of the EXSCALABAR suite of instruments, fed by a Rosemount inlet. PCASPs measure aerosol particle sizes in 30 channels in the nominal size range 0.1 to 3 µm optical diameter (polystyrene latex sphere (PSL)-equivalent). Data are reported at a frequency of 1 Hz. Concentrations from the NASA PCASP channels were calibrated in the laboratory by comparison with an SMPS and a scaling factor applied to certain channels to ensure comparability. For all PCASPs, channels that bracket gain-stage crossovers were merged following the method in Ryder (2013), and the smallest size bin was rejected as the lower size threshold is unbounded, resulting in 26 usable channels. Errors include Poisson counting uncertainties (square root of the number of counts) and flow rate errors (assumed to be 10 %), combined in quadrature. The air intake of an external PCASP is designed to decelerate the particle flow, resulting in sample heating and some reduction in RH of the sample compared to ambient, which may affect particle size. The inboard BAe-146 PCASP sample was subjected to the same conditioning as that for EXSCALABAR cells – most notably dried to <10 % RH and behind the impactor – and adjusted for transmission losses through that conditioning section.
Data for externally mounted PCASPs for the airborne comparisons are presented in manufacturer nominal bin boundary diameters, and no adjustment has been made for the absorbing characteristics of BBA-laden air masses or refractive index (RI) of other materials. All external instruments sample the same material without the complication of inlets, and so when instruments employ the same measurement technique, i.e. optical detection, this should not impact the results of this comparison. Comparisons with the NASA UHSAS should be approached with caution as this instrument is effectively calibrated to particle mobility diameter. The internally mounted FAAM PCASP3 is compared against the outboard PCASP2 and against the internally mounted SMPS instrument (which measures mobility diameter). The purpose of this comparison is, in part, to assess the performance of the Rosemount inlets and transmission loss corrections. A RI correction was applied to the nominal bin boundaries for PCASP2 (outboard) and PCASP3 (inboard) using the observationally derived value of 1.54-i0.027, appropriate for the BBA-laden air masses (following Peers et al., 2019, and using an updated calculation). This correction was applied to bin boundaries for diameters smaller than 800 nm. Differences between the nominal and BBA bins were as large as 25 % for the smallest bin but typically 10 % for particle diameters smaller than 800 nm. At sizes larger than this, the nominal bin dimensions (at PSL-equivalent RI) were used.
Both aircraft operated cloud droplet probes (CDPs; Lance et al., 2010), which detect and size cloud particles in the size range 3 to 50 µm diameter in 30 particle size bins. The FAAM BAe-146 instrument was located on the inner lower position of the port pylon, and the NASA P3 instrument was located on the outer location of the outer port pylon. The pylon holding the CDP during ORACLES 2017 and 2018 was further ahead and lower relative to the aircraft wing compared to the pylon used in ORACLES 2016. These forward-scattering probes have size bins defined using the RI for water of 1.33. The CDP on the NASA P3 used the manufacturer default sample area of 0.26±0.05 mm2 and optics collection angle of 4 to 12∘. The sample area of the BAe-146 CDP has been experimentally determined by DMT as 0.252±0.05 mm2, with the collection angle for the optics found to be 1.7 to 14∘ (after Lance et al., 2012). BAe-146 CDP performance was observed to be stable throughout the campaign as monitored through daily pre-flight, glass bead calibrations. A linear fit between the median calibration response to these daily tests showed that the BAe-146 CDP with nominal bin dimensions undersized cloud particles by ∼7 %. This linear fit was applied to the nominal bin boundaries (Sect. S3). Nominal bin dimensions applicable to BAe-146 and P3 CDPs along with calibrated bin dimensions for BAe-146 are given in Table S1 in the Supplement. Gupta et al. (2022) compared data from the P3 CDP against those collected by a cloud and aerosol spectrometer (CAS) also installed on the P3, concluding that the CDP provided data most consistent with bulk water contents measured by a King probe and less than calculated adiabatic water contents. Errors are comprised of Poisson counting uncertainties, true airspeed uncertainties assumed to be 5 % and sample area uncertainty of 5 %, all combined in quadrature.
Larger cloud particles and drizzle drops were sampled on both aircraft using Stratton Park Engineering Company (SPEC) 2DS optical array probes (OAPs; Lawson et al., 2006), which measure the sizes of particles between 10 and 1280 µm as they cast shadows on a 128-element charged-coupled-device (CCD) array illuminated by a laser. FAAM BAe-146 OAP data were processed using the Optical Array Shadow Imaging Software (OASIS) software package (Crosier et al., 2011; Taylor et al., 2016) and presented at a native bin resolution of 10 µm. P3 data were processed using the University of Illinois/Oklahoma Optical Array Probe Processing Software (McFarquhar et al., 2018) as described by Gupta et al. (2021). Errors in channel concentrations were estimated by combining Poisson counting uncertainty values and size-dependent sample volume uncertainties in quadrature.
Bulk condensed water properties on FAAM were measured with a Nevzorov hot-wire probe (Abel et al., 2014). Bulk water content on board the NASA P3 was identified with a King hot-wire probe (King et al., 1981; Strapp et al., 2003). LWC derived from the Picarro L2120-i hygrometer (Sect. 2.3) fitted downstream of the counterflow virtual impactor inlet (CVI) was used to determine when the NASA P3 was under cloud-free conditions by locating times when the bulk water content was determined to be zero. Closure tests between the LWC derived from the P3 cloud probe spectra and the King hot-wire were conducted for in-cloud measurements from each ORACLES deployment (Gupta et al., 2022).
When out-of-cloud, the CDP from BAe-146 and the 2DS probes from both platforms were used to measure the coarse mode aerosol particle size distributions and identify the presence of supermicron aerosol particles (Miller et al., 2021). However, when out-of-cloud the NASA P3 CDP did not report data, and so aerosol observations are not available.
The altitude of the ARM site at 341 m above mean sea level was low in the boundary layer, and always below cloud base.
2.6.1 Derived microphysical parameters
Aerosol and cloud particle number concentrations per size channel (Ni) were reported at 1 Hz from microphysics probes. Particle size distributions (PSDs) as a function of particle diameter Ni(Di) were computed from these data using Eq. (3). For CDP and 2DS the individual channel concentrations were scaled by the size-dependent sample volume (SVi; Eq. 3.1), which is a function of the sample area (SA(i)) and the aircraft true airspeed (TAS). For PCASP and UHSAS the sample volume is internally determined by the sample flow rate and is uniform across size channels. Aerosol (NA) and cloud drop (NC) number concentrations were generated using Eq. (4) by summation of the individual discrete channel concentrations, excluding the smallest size channel, which is susceptible to electrical noise and has an unbounded lower size threshold. This results in the smallest reported bin edge of diameter (D) greater than 3 µm for the CDP and greater than 105 nm for the PCASP. Count median diameters of the particle size distributions were computed as the diameter where 50 % of the observations were above and below the given size. Effective radius (Re) and mean volume radius (Rv) were computed for individual probes by summation across the particle size channels using Eqs. (5) and (6). For aerosol observations this was done for the accumulation mode only, by selecting only particles smaller than 800 nm (PSL-equivalent) to compare probe performance in the optically important BBA mode (e.g. Peers et al., 2019). The restrictions on these computations of Re and Rv mean that the values should not be compared to those from other field campaigns – the values are representative of probe response only. Full scientific comparisons require detailed analysis of the material composition and size-dependent refractive index. Bulk LWC values for cloud particle spectrometers were computed using Eq. (7).
2.6.2 Cloudy and clear-sky masks
Cloudy periods are readily identified from the airborne datasets by taking CDP observations of LWC and setting the lower threshold to 0.05 g m−3 at times when Nc>3 cm−3.
Cloud-free periods were identified more rigorously to avoid cloud-contaminating the aerosol measurements. A clear-sky mask was generated for P3 data by taking LWC data from behind the CVI probe and cloud particle concentrations from CDP. A threshold number concentration of 2 cm−3 from CDP and times when zero LWC was reported serve as the raw mask. To account for sporadic sampling of low-concentration events a 2 s safety margin (approximately 200 m) was applied around any positively identified cloudy points to generate the final clear-sky mask. The FAAM clear-sky mask employed bulk water content data from the three Nevzorov probe elements and the particle number concentrations from CDP as detailed in Barrett et al. (2020). To summarise here, the high-resolution 32 Hz raw power data from the three Nevzorov sensing elements show a bimodal distribution during cloudy- and clear-sky sampling with the lower-power mode arising from clear skies. The threshold between the cloudy- and clear-sky modes depends on a number of environmental factors and must be chosen empirically on a case-by-case basis. Here an upper limit of ∼3.1 mW was chosen, below which the Nevzorov was deemed to be in clear skies. A second constraint of particle number concentration from CDP below 1 cm−3 was specified, being less strict than the limit on P3 by virtue of the higher sensitivity of the Nevzorov flag catching more of the cloudy data points. The same 2 s safety window was applied.
The ARM site, located within the surface mixed layer at 340 m, did not suffer from cloud occurrence in situ since cloud bases were consistently higher.
2.7 Atmospheric radiation
The radiation measurements equipment on the FAAM BAe-146 during CLARIFY that will be compared to the measurements from the NASA P3 include the following.
(a) Two upward- and two downward-facing Eppley broadband radiometers (BBRs) were fitted with clear and red domes covering the 0.3–3.0 and 0.7–3.0 µm spectral regions (e.g. Haywood et al., 2003). Degradation of the upper red domes owing to scouring of the leading face of the domes when flying in mineral dust during previous campaigns based close to the Sahara Desert (e.g. DABEX, GERBILS and FENNEC campaigns; Haywood et al., 2008, 2011; Ryder et al., 2013) was evident, and thus data from the upper red domes were considered unsatisfactory and are not presented in the following analysis. Data from red-domed Eppley lower radiometers were satisfactory. The BBRs are installed at a 3∘ pitched-forward angle to the airframe, which partially accounts for the nominal pitch of the aircraft when under standard operating conditions of 6∘ nose-up. Owing to the non-perfect alignment of the radiometers with the horizontal plane when mounted on the aircraft, box-pattern and pirouette manoeuvres are performed to correct any alignment discrepancies in the upper BBRs as described in Sect. S1 in the Supplement. The fluxes measured by the BBRs have an estimated error of ±5 W m−2 for upward fluxes (Haywood et al., 2001) and 3 %–5 % for downward fluxes, the higher uncertainty in the downwelling fluxes being due to aircraft pitch and roll correction uncertainties, which vary as a function of the diffuse fraction and hence the altitude of the aircraft (Foot et al., 1986).
(b) The Shortwave Hemispheric Irradiance Measurement System (SHIMS) measures the upward and downward spectrally resolved solar irradiances. Each of the upper and lower SHIMS uses two temperature-controlled Carl Zeiss spectrometer modules operating across the visible (VIS) spectral range 0.30–1.15 µm and near-infrared (NIR) range 0.95–1.70 µm. Data from the VIS module were truncated at 0.95 µm to match up with the IR module at the short wavelength end. The pixel separation is approximately 0.0033 µm in the VIS module and 0.006 µm in the NIR module, giving approximate spectral resolutions of 0.010 and 0.018 µm with an in-house-designed integrating head. The SHIMS instrument provides counts per millisecond. During this measurement campaign, laboratory and transfer calibrations were performed. The combination of lab work and this knowledge of the uncertainties associated with the BBRs suggests a likely uncertainty for SHIMS of ±10 % (Vance et al., 2017). However, when operated on the aircraft a bias of up to 30 % between the SHIMS and BBR observations is apparent. An additional spectrally invariant adjustment based on idealised model radiative transfer data was used to adjust the SHIMS observations to account for this, as described in Sect. S1 in the Supplement.
Comparable shortwave spectrally resolved irradiances were provided on the NASA P3 by the Solar Spectral Flux Radiometer (SSFR) in zenith and nadir directions (Pilewskie et al., 2003). A mechanical levelling platform ensured correct orientation of the sensors, and data were corrected for aircraft altitude and the angular response of light collectors (Cochrane et al., 2019, 2021). The nominally visible wavelength range 0.35–1.0 µm is monitored with a Zeiss grating spectrometer with a silicon linear diode array and the near-infrared range 0.95–2.10 µm with a Zeiss grating spectrometer with an InGaAs linear diode array. The devices have moderate spectral resolution of 0.008 to 0.012 µm with radiometric uncertainty of 3 % to 5 % for both zenith and nadir and precision of 0.5 % (Cochrane et al., 2019, 2021). A National Institute of Standards and Technology (NIST) traceable lamp was used to calibrate the instrument before and after the campaign, and portable field calibrators monitored the performance of the instrument during the campaign.
One semi-permanent cloud feature that occurs on Ascension Island is the generation of orographically forced cloud over Green Mountain, whose altitude reaches 859 m. This cloud frequently impacted LASIC radiation measurements. As FAAM measurements were limited to a minimum distance of 2–4 km offshore of Ascension Island, the local impact of the orographically generated cloud hampered direct comparisons of downwelling solar irradiances, and these are therefore not pursued further in this study.
3.1 Airborne and side-by-side intercomparison
Both aircraft departed from Wideawake Airfield on Ascension Island on 18 August 2017 within a few minutes of one another; climbed out of the boundary layer; and transited approximately 400 km ESE to a rendezvous point located close to 9∘ S, 11∘ W. The location for the flight intercomparison segments was chosen based on numerical weather prediction and aerosol forecasts to give the best possibility of encountering good conditions for sampling aerosol and cloud (Fig. 3). Overall, the two aircraft collected co-located data for a period of 75 min between 12:50 and 14:05 UTC, over a horizontal distance in excess of 450 km. Aerosol optical depth measured over Ascension Island using a handheld sun photometer indicated a column aerosol optical depth at 500 nm of 0.16, suggesting that the conditions on the day were relatively lightly polluted (Haywood et al., 2021). Satellite imagery on the day identified a region of broken cumulus clouds to the south of the island that was a suitable target (Fig. 3a). The flight intercomparison segments were located along the 9∘ S latitude line, offset ∼100 km south of the island and the ground-based ARM site to maximise the chances of sampling adequate clouds.
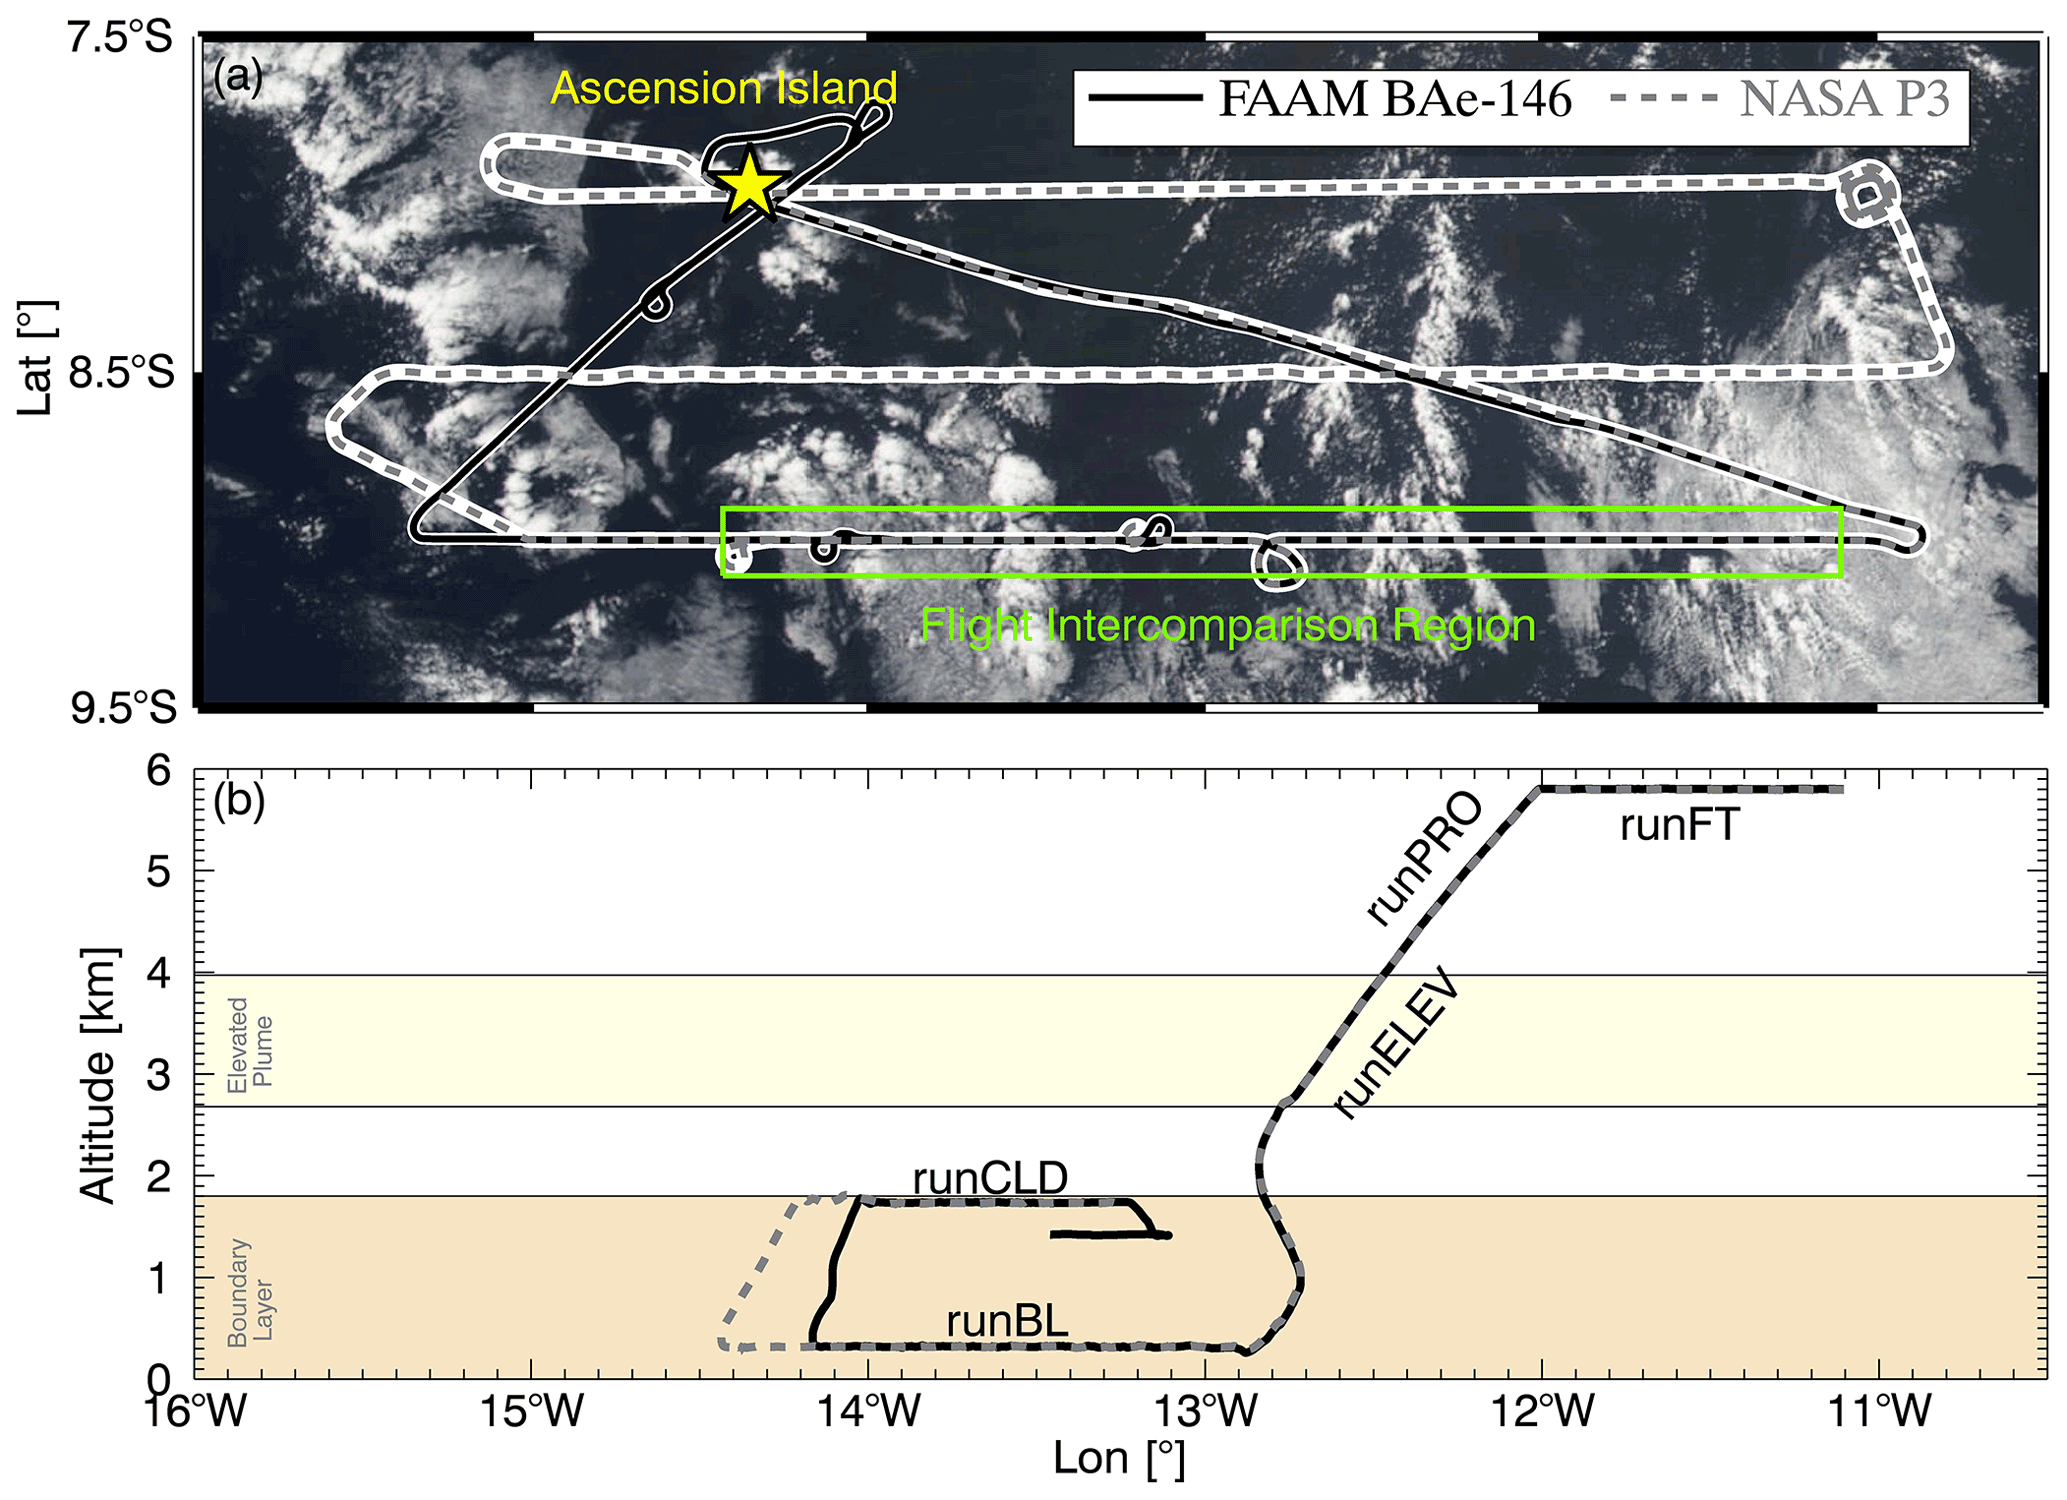
Figure 3(a) Flight tracks for both the FAAM BAe-146 and NASA P3 flights with the intercomparison flight segment marked (green box), overlaid on Visible Infrared Imaging Radiometer Suite (VIIRS) corrected-reflectance (true colour) imagery from 18 August 2017 (the imagery was obtained from NASA Worldview). (b) Flight vertical cross sections as a function of longitude for the intercomparison segment for FAAM BAe-146 and NASA P3, which commenced at 5.8 km. Run names are indicated (see Table 2), along with horizontal bands which mark out the vertically elevated pollution plume (yellow) and boundary layer (light orange).
Following rendezvous in the free troposphere (FT) at ∼5.8 km (Fig. 3), the two aircraft performed a wing-tip-to-wing-tip flight leg (hereafter: runFT) for 10 min, from 12:51:19 UTC along the 9∘ S latitude line (Table 2), with the BAe-146 to the starboard side of the P3. The flight leg, runFT, was conducted under clean FT conditions characterised by low aerosol number concentrations and clean conditions (NA<30 cm−3 and CO <90 ppb; Fig. 4). While remaining in formation, the two aircraft made a profile descent from 5.8 km (runPRO), through a vertically elevated pollution layer (runELEV) where lidar depolarisation observations indicated a small number of dust particles, and into the boundary layer to finish at 330 m pressure altitude, which is nominally the same altitude as the ARM site. The vertically elevated pollution layer was located between ∼2.7 and 4 km. Neither aircraft passed through cloud during the descent. Upon reaching the lower altitude both aircraft commenced a wing-tip-to-wing-tip straight-and-level run (SLR), hereafter runBL, flown at the same constant altitude, sampling cloud-free boundary layer air for 19 min. During SLRs, the FAAM BAe-146 sat between 7 and 13 m lower than the NASA P3. For runBL many instruments operated independently or had bespoke averaging times as documented in Table 2. Following runBL both aircraft climbed to 1.7 km and implemented a 14 min cloud sampling leg at this altitude – hereafter runCLD. For safety reasons, when performing this cloud sampling flight leg, the BAe-146 trailed behind the P3 by 5 min in time but followed the same track. Flying across wind meant that any turbulence or exhaust from the lead aircraft will have advected away from the region before the arrival of the second aircraft. Afterwards, the FAAM BAe-146 returned to Ascension Island to perform an intercomparison with the ARM site, while the NASA P3 continued to make measurements remotely from the island. Only the most relevant and appropriate measurement sections of the intercomparison flight as indicated in Fig. 3b are analysed here.
Table 2Event timing markers during FAAM C031/NASA PRF05Y17 intercomparison flight on 18 August 2017 and FAAM-LASIC ARM site intercomparison flight legs on 6 d between 17 August and 5 September 2017. FAAM Altitudes are GPS-corrected to WGS84 geoid.
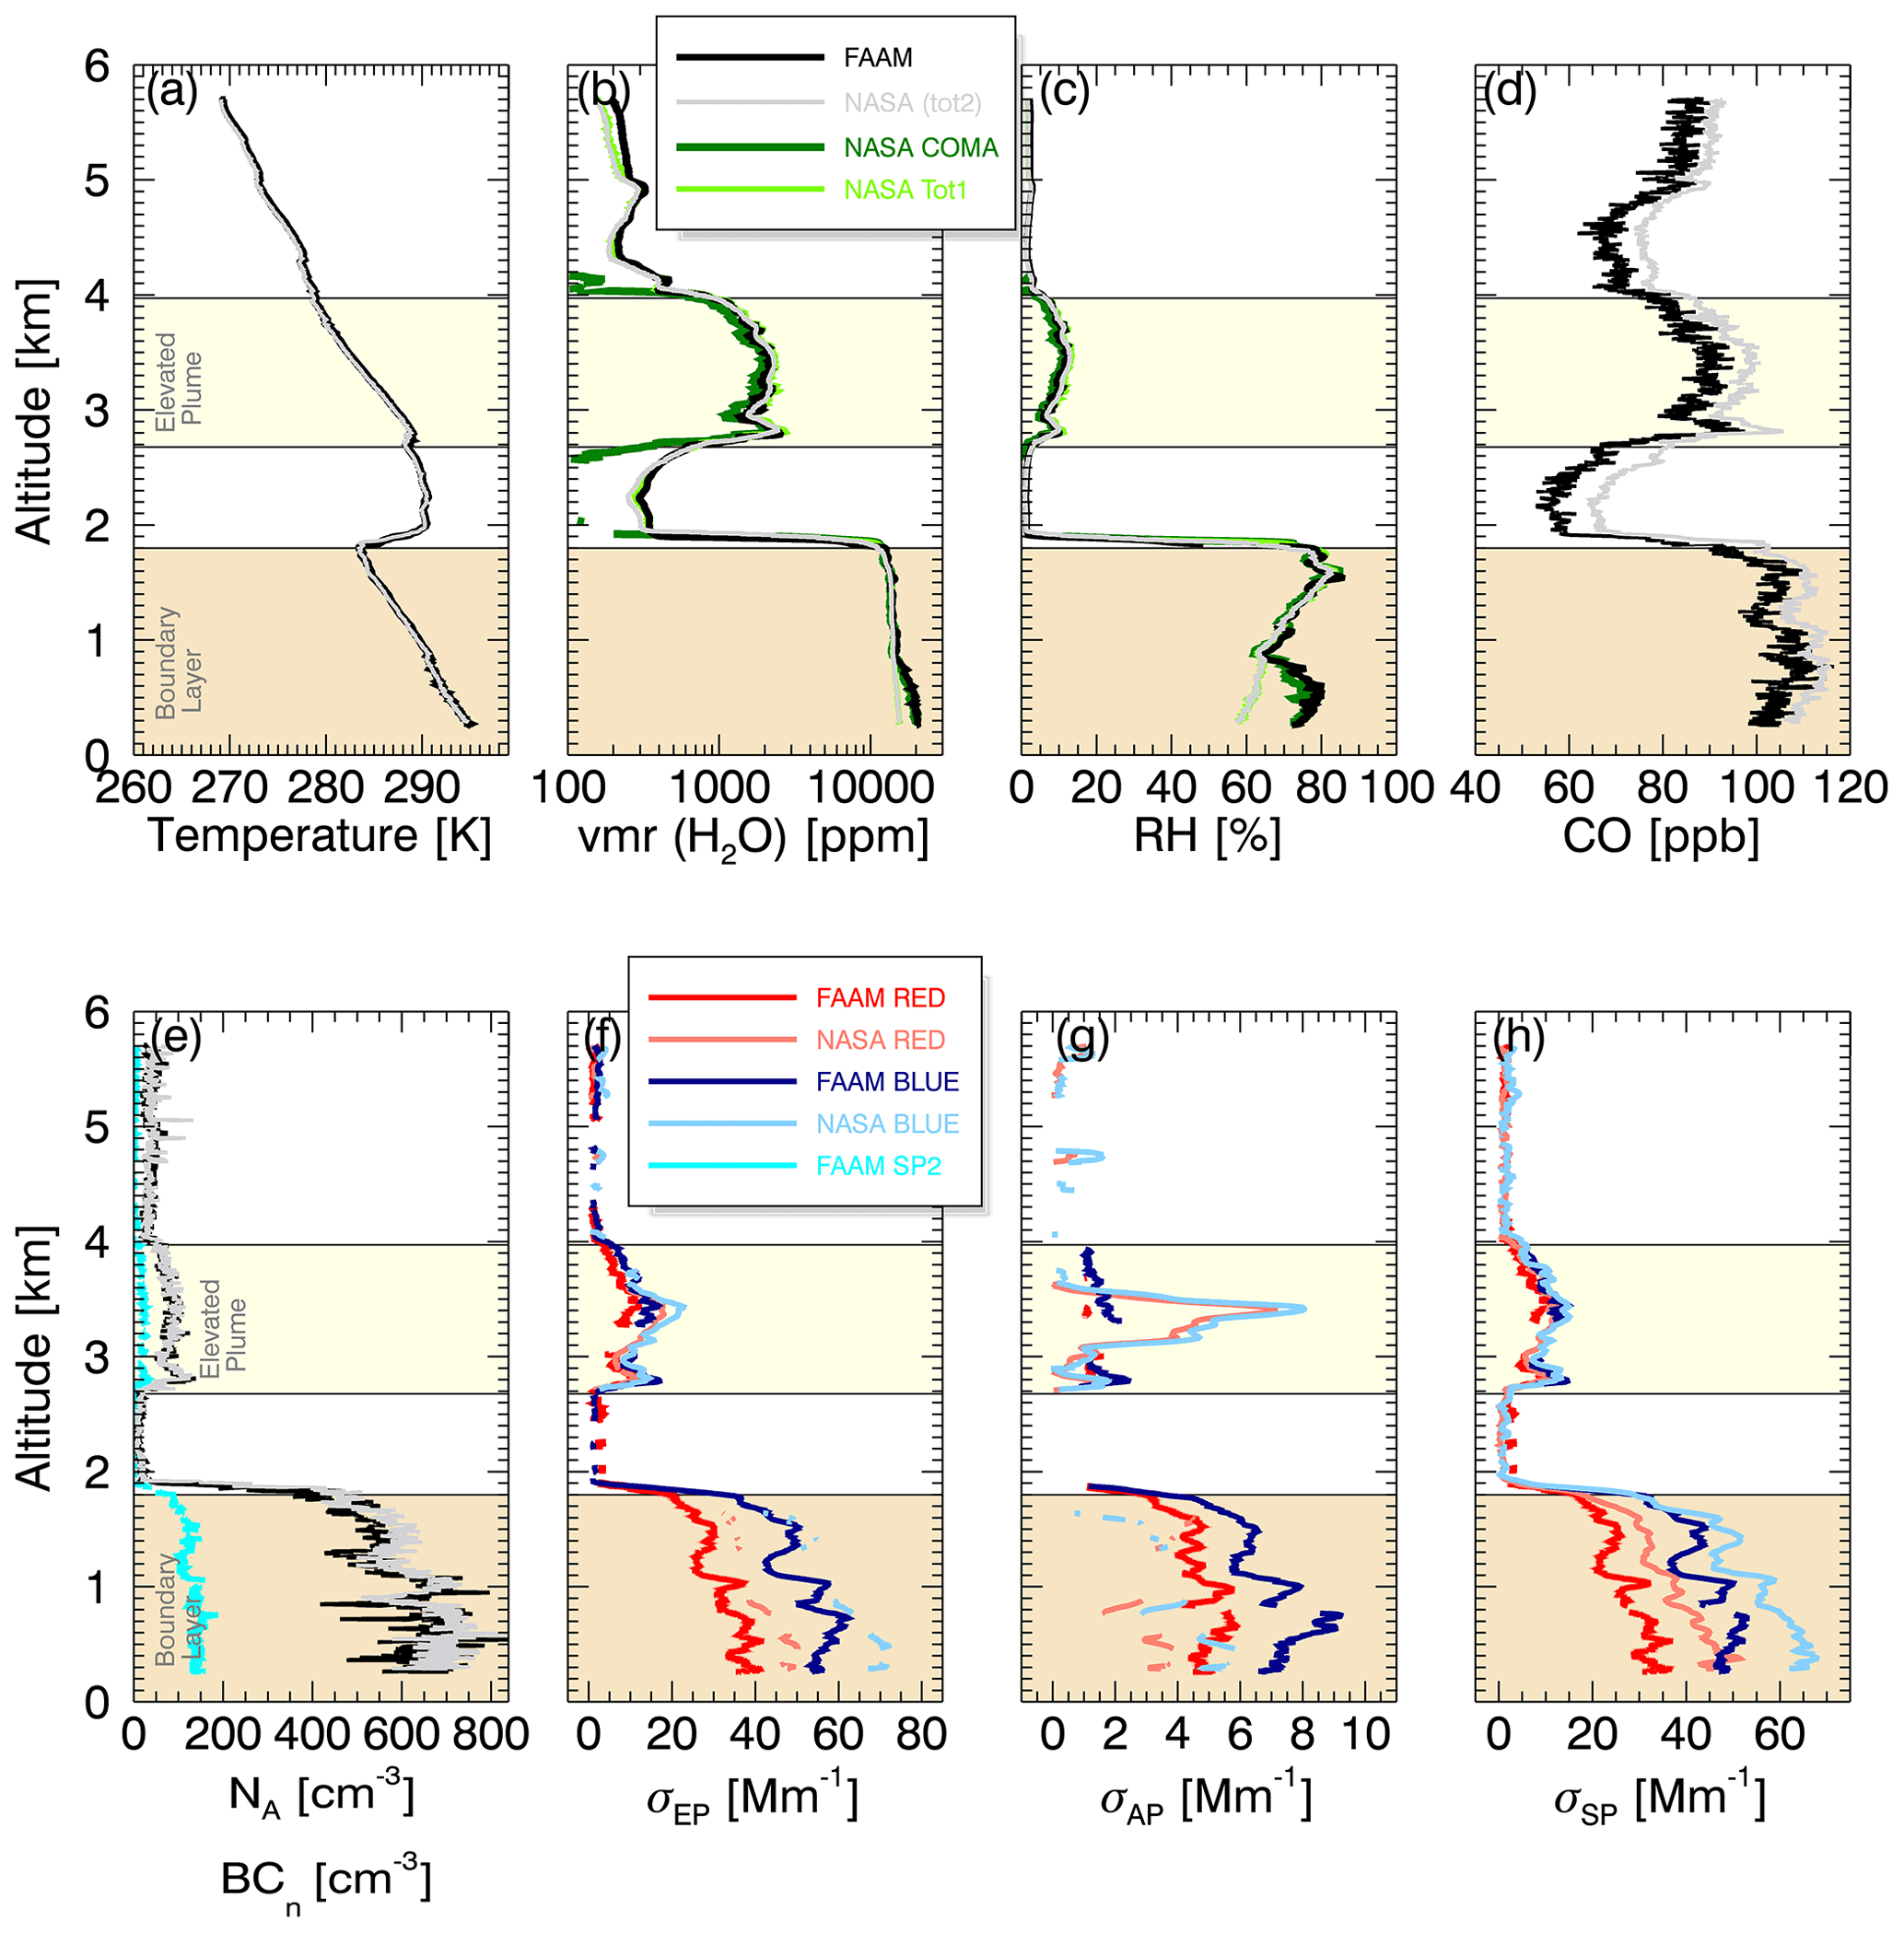
Figure 4Vertical profiles of data from FAAM BAe-146 and NASA P3 for intercomparison “runPRO” descent from 5.8 km to 300 m. Horizontal bands mark out the vertically elevated pollution plume (yellow) and boundary layer (light orange). (a) Temperature; (b) water vapour mixing ratio; (c) RH; (d) CO; (e) NA from PCASP, with BCn from FAAM SP2; (f) optical extinction, σEP, from FAAM CRDS and NASA PSAP+nephelometer; (g) optical absorption, σAP, from FAAM PAS and NASA PSAP; (h) optical scattering, σSP, from FAAM CRDS-PAS and NASA nephelometer. The legend in panel (b) applies to panels (a)–(e). The legend in panel (f) applies only to panels (f)–(h) for wavelengths of 470 nm (blue) and 660 nm (red).
3.1.1 Meteorological parameters
The meteorological conditions encountered during the airborne intercomparison between FAAM BAe-146 and NASA P3 are summarised in the vertical profiles from runPRO, shown in Fig. 4. The temperature profiles (Fig. 4a) show the decoupled stability profile expected for this location with a surface mixed layer in the lowest 600 m of the atmosphere, characterised by high RH >70 % (Fig. 4c) and a well-mixed temperature profile. Above the surface mixed layer and beneath the trade-wind inversion located close to 1.7 km sat a cloud-containing layer characterised by increasing RH with altitude. Broken cumulus clouds were present at this altitude throughout the period of the intercomparison.
Moderate levels of pollution due to BBAs mixing into the boundary layer were found through the depth of the decoupled boundary layer system with CO >100 ppb (Fig. 4d). Concentrations close to the surface were NA>600 cm−3 (Fig. 4e) and 400 cm−3 just beneath the inversion. A time series of CO data measured by LASIC at the ARM site is presented in Zhang and Zuidema (2019) for both August periods, 2016 and 2017, showing that concentrations ranged between 50 and 150 ppb during 2017 and reached somewhat higher to >200 ppb in 2016. Ultraclean conditions in the Ascension Island region during the biomass burning (BB) season are defined by NA<50 cm−3 and typically have median concentrations of CO =69 ppb and an inter-quartile range (IQR) of 62 to 74 ppb (Pennypacker et al., 2020), with almost all cases having CO concentration levels <80 ppb.
For the first 800 m above the trade inversion, the free troposphere was pristine and dry, with NA<30 cm−3, CO <60 ppb (using FAAM measurements) and low vmr (Fig. 4b). During the runELEV segment of the profile descent, the aircraft passed through a thermodynamically stable, slightly polluted layer between 2.7 and 4.0 km, with NA>50 cm−3 and CO >85 ppb. Water vapour concentrations were also higher than the layers immediately above and below, leading to slightly increased RH locally, as is typical of the continental pollution plume (Pistone et al., 2021).
At 5.8 km conditions were relatively pristine and dry, with NA<30 cm−3 and CO <85 ppb and a vmr of 168 ppb reported by FAAM.
Back trajectory calculations using the Met Office Unified Model (not shown) were used to estimate source regions for air masses arriving at 9∘ S, 12∘ W, at 12:00 UTC on 18 August 2017, chosen to be representative of the time and location of the airborne intercomparison. Boundary layer trajectories, ending at 500 and 1500 m, showed air mass histories predominantly over the ocean to the south-east for the previous 10 d, with the 1500 m trajectory over land for 10 to 12 August. Back trajectory calculations presented by Diamond et al. (2022) showed that air mass had likely been sampled by ORACLES P3 flight PRF03Y17 on 15 August 2017 to the south-east between 12 and 15∘ S within 1∘ longitude of 5∘ E. A trajectory ending at 3.5 km was located over Africa at altitudes between 6 and 8 km, from 10 to 13 August, where it may have encountered BBA in plumes or else lofted to that altitude through convection. Other trajectories ending in the free troposphere were exclusively over ocean for at least the previous 7 d. The large-scale synoptic conditions of the day were typical of the region with broken cumulus clouds.
3.2 FAAM – LASIC ARM site fly-pasts
FAAM flew sections upwind of the ARM site on six occasions (Table 2) between 17 August and 5 September, providing a wide dynamic range of pollution parameters. One such flight leg took place following the FAAM—NASA intercomparison on 18 August as the BAe-146 returned to base. The aircraft flew at a nominal altitude of ∼330 m, a similar altitude to the ARM site (340 m), and was displaced from the coast by between 2 and 4 km at the pilot's discretion depending on local flying conditions. Flight segments took place across the mean wind direction and were between 7 and 15 min duration (40 to 90 km long). LASIC run times are 30 min long from the start of the aircraft run. The mean wind speed at the ARM site was of the order of 7 m s−1, meaning that sampling took place over a distance equivalent to 12 km. This approach assumes that local variability is negligible across the aircraft track.
When comparing measurements from two instruments, it is useful to explicitly consider statistical uncertainties, which differ between individual data points, and systematic uncertainties, which affect all data points from an instrument. Statistical uncertainties are large when instrument noise is large compared to the measured signal, and/or the measured property exhibits a high degree of variability within the sampling period. The effect of instrument noise can be minimised by choosing a longer averaging time, and this is the approach we take for the comparisons between the BAe-146 and ARM site. The straight and level runs were designed to minimise the variability in measured properties during the comparisons, and we average the data to one point per run. Conversely, where a large statistical uncertainty is caused by real variation in the measured property within the measurement period, a shorter averaging time must be used. This is the approach we use when comparing the BAe-146 and P3 aircraft, and here we average the data to 0.1 Hz to balance real variation with instrument noise.
Once a set of points for comparison has been gathered, we compare the variables using orthogonal distance regression (ODR) with results summarised in Table 3 and shown in more detail in the Supplement (Sect. S7). These straight-line fits utilise the uncertainty in both the x and y variables (taken to be the standard error, equal to the standard deviation divided by the square root of the number of data points), to produce a fit uncertainty that accounts for the measurement uncertainty in each data point used to produce the fit. Comparison between the different platforms can then take place by comparing the slopes of the fits. Where they are different from unity both the statistical uncertainty in the fit and the systematic uncertainty in both instruments may contribute. When quoted in the literature, this systematic uncertainty tends to be the calibration uncertainty, although other factors such as different inlets tend to make this uncertainty larger. Summary values of ODR fits for all parameters along with uncertainties are to be found in Table 3. More completed tabulated results are available in the Supplement (Table S2).
Table 3Summary of orthogonal distance regression or ratios of weighted means between observations from FAAM : NASA and FAAM : LASIC comparisons. Particle observations are for PM1 unless otherwise stated.
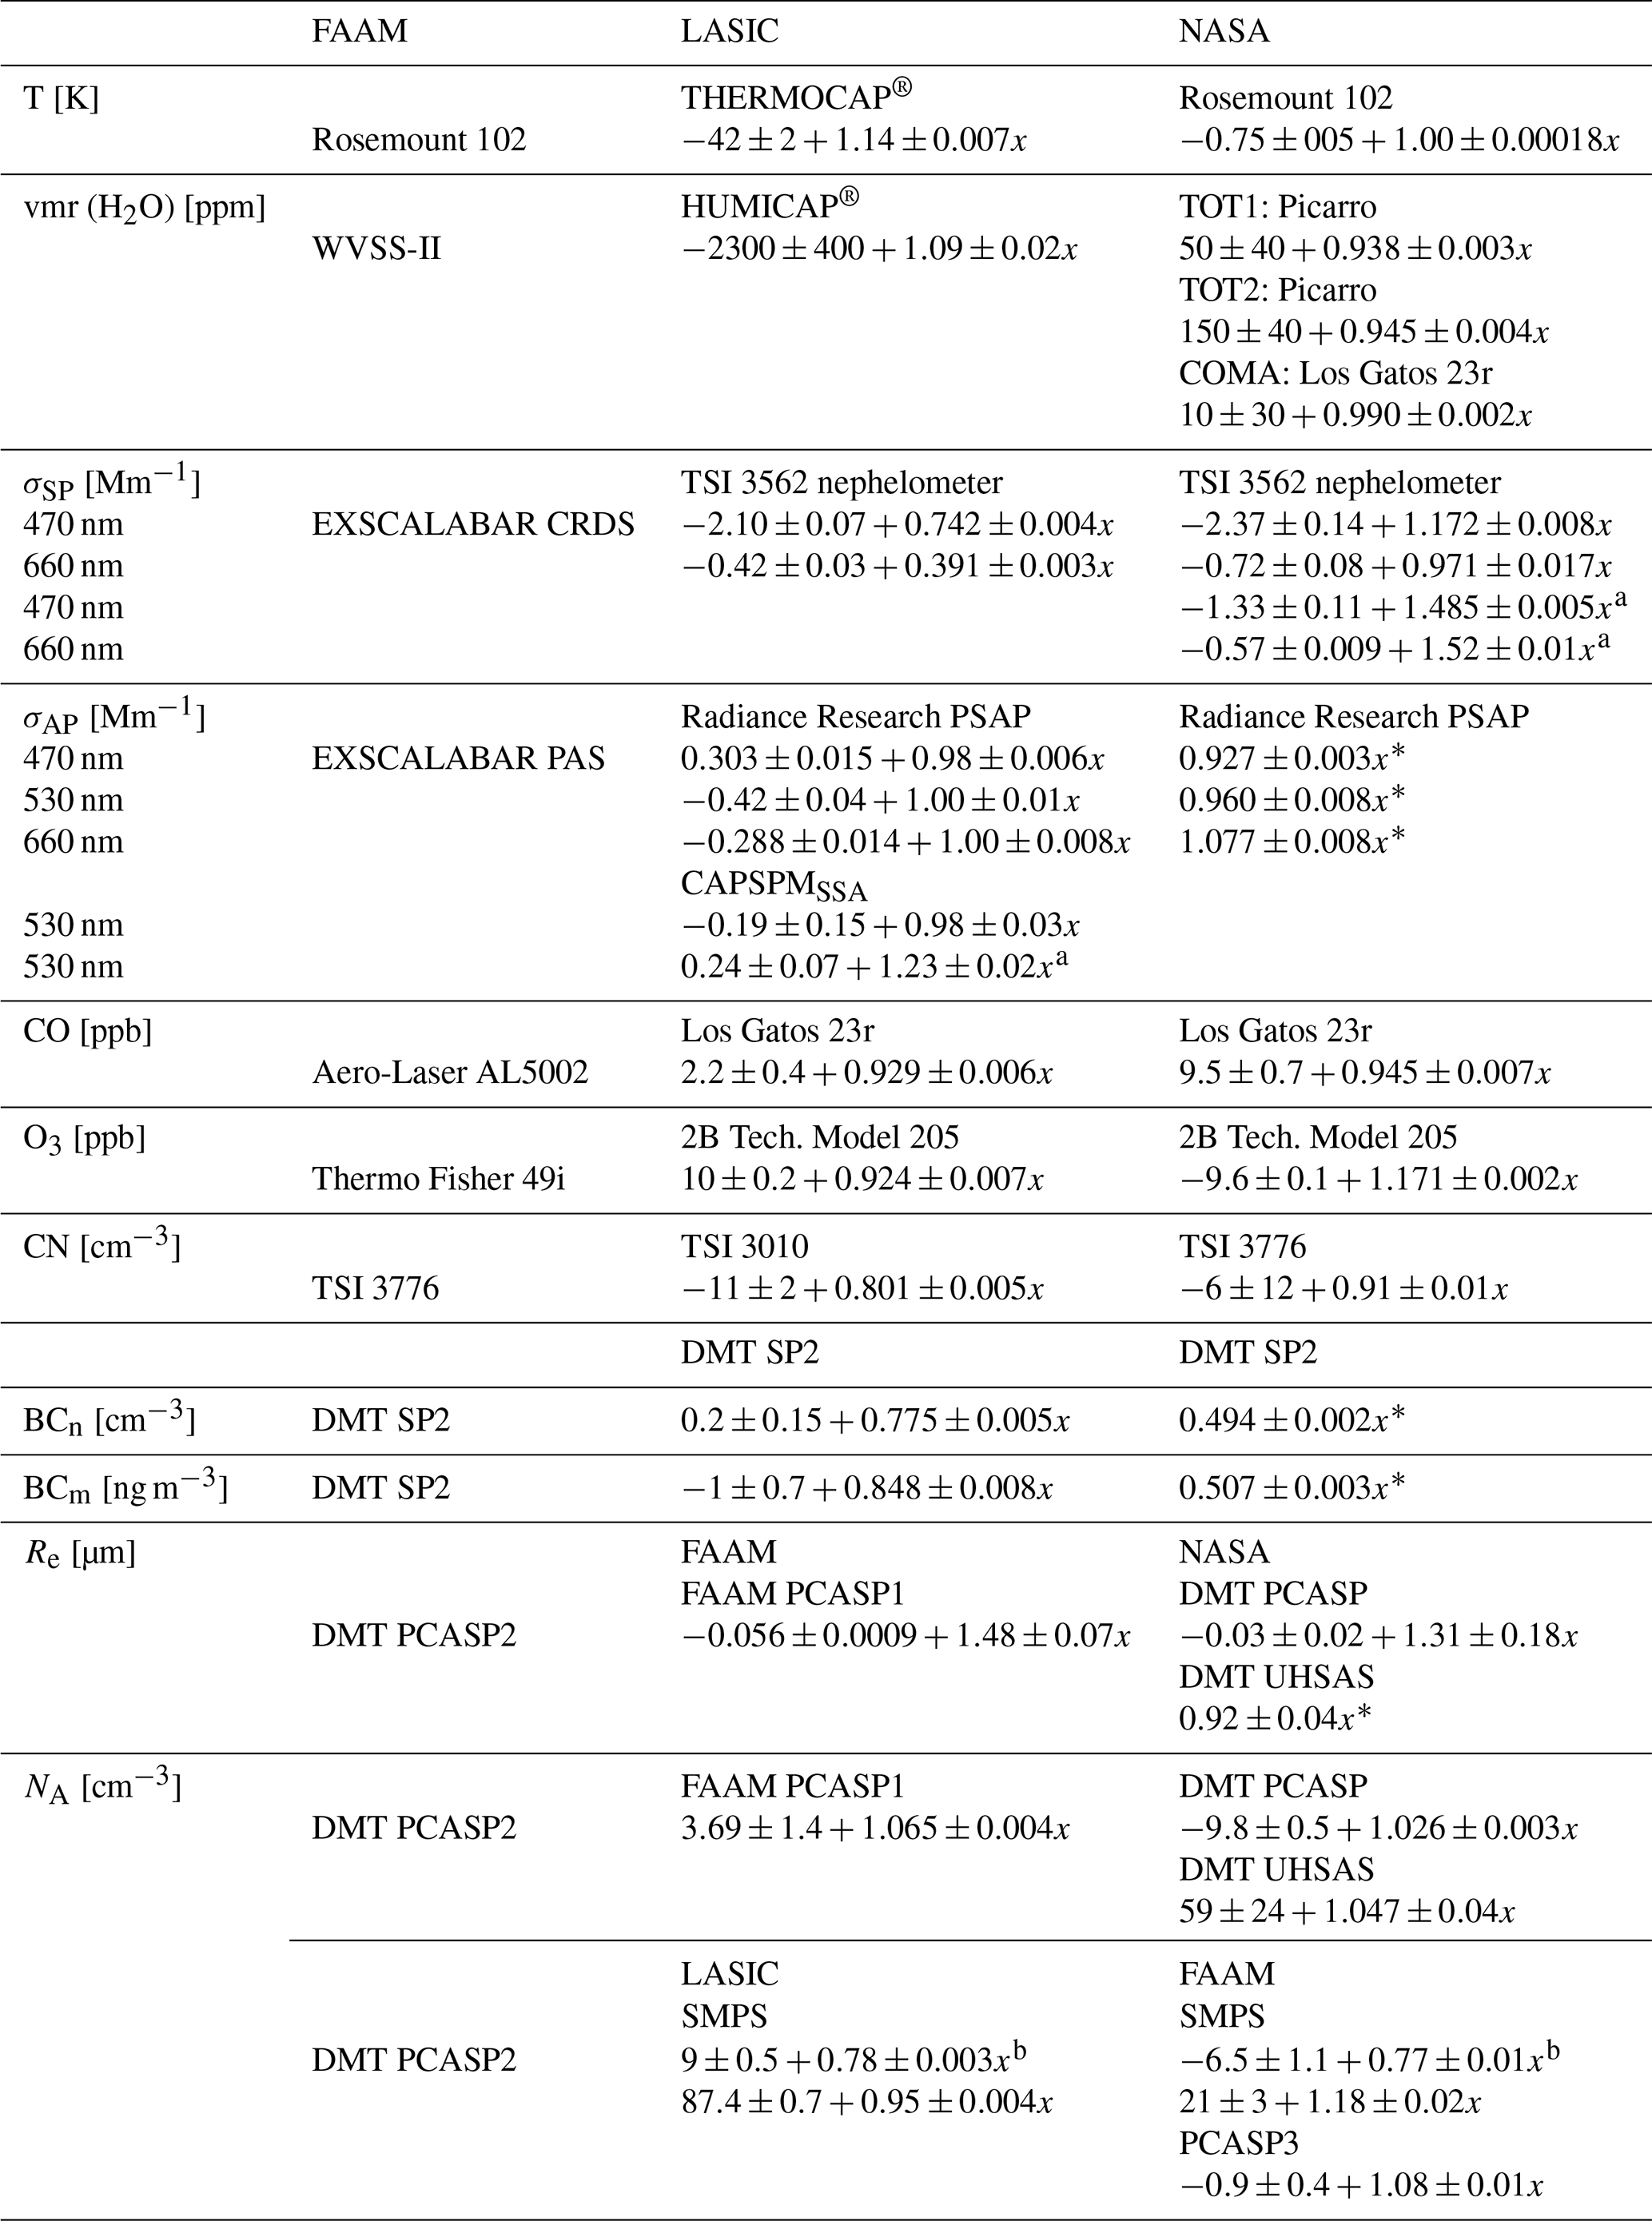
a PM10 observations. b Particle diameters larger than 120 nm only. ∗ Ratio of weighted means. Note the change in instruments and platforms for Re and NA comparisons.
4.1 Air mass characteristics
Vertical profiles of the thermodynamic state of the atmosphere during the airborne intercomparison are presented for temperature (T), vmr and RH (Fig. 4a–c, respectively). The temperature observations from NASA and FAAM are essentially unbiased (Fig. 5b with ODR slope of 1.00±0.00018; LASIC data at the ARM site tend to report warmer temperatures; Fig. 5a), with an ODR slope of 1.14±0.007, which could be related to an island heat effect or a genuine bias but is likely related to the narrow dynamic range available on which to perform a fit. The aircraft tended to fly between 15 and 30 m lower than the ARM site, which does not account for the differences.
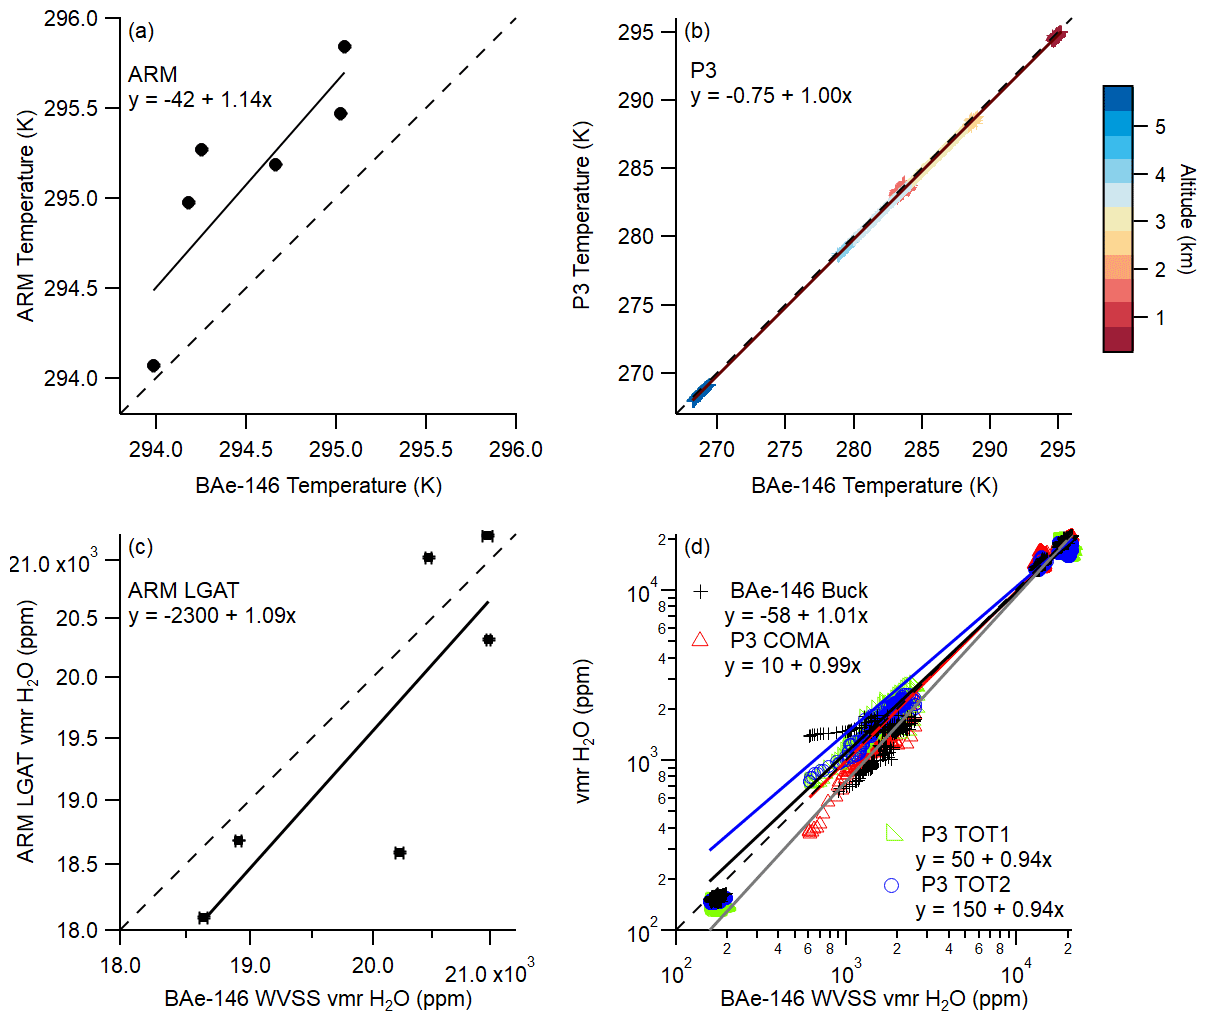
Figure 5Correlations from various flight segments (Table 2) between temperatures for (a) FAAM BAe-146 and LASIC ARM site and (b) FAAM BAe-146 and NASA P3 and for humidity vmr for (c) FAAM BAe-146 and LASIC ARM site and (d) FAAM BAe-146 and NASA P3. In panel (b) the data points are coloured by altitude. In panel (d) the instruments are given a different colour for clarity.
During the aircraft descent in Fig. 4b the vmr variations are tracked in a similar manner by FAAM WVSS-II and the NASA WISPER instrument until passing through 800 m altitude, where WISPER (both TOT1 and TOT2) reported drier conditions than both FAAM and the NASA COMA instrument. Correlations plotted in Fig. 5d show the performance of each NASA instrument relative to the FAAM WVSS-II, with ODR slopes of 0.938±0.003 (TOT1) 0.945±0.003 (TOT2) and 0.990±0.002 (COMA), respectively. FAAM to LASIC had an ODR slope of 1.09±0.02 (Fig. 5c), although this is over a much narrower dynamic range of vmr.
Summary values for derived quantities dew point temperature and RH are available in the Supplement (Table S3). Possible impacts of any discrepancies in RH reported by NASA, LASIC and FAAM would be encountered when using the distributions of boundary layer humidity to estimate CCN (cloud condensation nuclei) concentrations or when using aerosol growth models to predict optical scattering from aerosol as a function of RH.
During the boundary layer sampling leg, runBL, the two aircraft measured turbulent wind components with the standard deviation of vertical velocity and the skewness of the distribution (Table 6). Vertical winds from the BAe-146 show a larger standard deviation than data collected by the NASA P3 during this side-by-side sampling leg. The skewness was more positive on the NASA P3, indicating that it occasionally sampled stronger updraughts than the FAAM BAe-146 encountered. The two aircraft inevitably encountered different conditions when sampling at the cloud level (see Sect. 4.5) – a consequence of the 5 min separation in time.
4.2 Gaseous and particulate pollution tracers
Carbon monoxide (CO) has a lifetime of over 1 month in the troposphere and is not susceptible to removal through precipitation processes. As such it is a suitable tracer for pollution from combustion and as such an important parameter for marking out air masses. Figure 4d shows CO concentration data for the airborne profile descent, and Fig. 6a shows the correlations between CO from the FAAM aircraft with various flight level data from NASA and during the six fly-pasts of the ARM site. The FAAM–LASIC comparisons sampled a range of 60 to 110 ppb, indicative of clean through to moderately polluted conditions with a similar range encountered during the airborne intercomparison. LASIC data reported lower concentrations of CO with an ODR slope of 0.929±0.006, with the ODR slope from the airborne comparison 0.945±0.007 (Table 3). NASA data are offset by ppb from FAAM data. It is noted that the FAAM instrument was regularly calibrated with reference gases during flights (Sect. 2.3), giving confidence in that instrument's performance. The difference between the CO measurements from the NASA P3 and the LASIC ARM site is expected to be larger than between the aircraft platforms, something which remains an unresolved issue. The implications of these measurements on the characterisation of air masses are discussed in Sect. 5.1. These and other composition data results are tabulated in the Supplement (Table S5).
Figure 6Correlations between pollution and aerosol parameters as a function of those measured on board the FAAM BAe-146 for both the NASA P3 from various flight segments (Table 2) and LASIC ARM site from six flights for (a) CO, (b) O3, (c) CN, (d) BCn, (e) BCm, (f) σSP at 470 nm and (g) σSP at 660 nm, and (h) σAP at 470 nm and (i) σAP at 660 nm. The 1:1 ratio line is shown in all panels as a dashed black line, and linear fit parameters and ratio of weighted means are shown. Data points from airborne comparisons are coloured by altitude, except for NASA PM1 data, which are a single colour to aid clarity.
Ozone concentrations for each platform relative to the measurements made on board FAAM are shown in Fig. 6b, with a slope from the airborne comparison of 1.171±0.002 and an offset of and for the ground-to-air comparison a slope of 0.924±0.007 and offset of 10.0±0.02 (Table 3). There are no systematic biases evident in the gas phase sampling systems that are common between platforms.
SP2 probes systematically reported lower black carbon concentrations at the LASIC ARM site than on board the FAAM BAe-146 (Fig. 6d and e), with ODR slopes of 0.775±0.005 (BCn) and 0.848±0.008 (BCm). Number concentrations from FAAM SP2, BCn, follow similar trends in the profile descent as the aerosol number concentrations (Fig. 4e). Pollution events at Ascension Island have been defined by Zhang and Zuidema (2019) using thresholds of BCm. During August, 100 ng m−3 was set as the upper limit for clean conditions, and >500 ng m−3 defined the most polluted tercile of conditions (Zhang and Zuidema, 2019). Data from the intercomparisons presented are found in both the cleaner lower tercile and the moderately polluted middle tercile. The data from ARM and FAAM are shown to be in sufficient agreement to use these to determine the membership of clean and polluted conditions reliably. However, data from NASA are 50 % lower than those from FAAM (Table 3). Specifically, during part of the flight on 18 August 2017, a leak was detected in one of the instrumentation racks. This limited the data that was recoverable from the flight, and it is therefore likely that the data from the intercomparison period were also affected. NASA P3 SP2 comparisons against FAAM BAe-146 are discussed in the Supplement (Sect. S5), although it is expected that the temporary leak makes the NASA SP2 data unusable.
Accumulation mode NA concentrations from NASA and FAAM PCASPs during the profile descent are shown in Fig. 4e along with the BCn values from the SP2 (FAAM only). Qualitative correlations between NA and BCn, pollution tracer CO, and thermodynamic properties of temperature and humidity are apparent along with being closely related to the optical coefficients shown in Fig. 4f–h. The greatest NA concentrations were observed during runBL, with NASA P3 reporting 550±61 cm−3, as compared with 516±63 and 484±63 cm−3 from the two FAAM PCASPs. UHSAS data show particle number concentrations for diameters greater than 0.1 µm of 570±54 cm−3 (See Table S6). At these concentrations flow rate errors dominate (assumed to be 10 % for the PCASP), which means that the number concentrations were comparable, although it is noted that the two NASA measurements were closer to one another than the FAAM measurements. At the cloud level (although when out of cloud) the number concentrations were slightly lower, of the order of 400 cm−3; Fig. 11c). Further observations were made during runFT and during descent through the vertically elevated pollution layer and in the clear-sky portions of the cloud sampling leg. Number concentrations as low as 16±5 cm−3 (FAAM PCASP1) were recorded on the runFT leg and were of the order of 74±23 cm−3 (FAAM PCASP1) in the vertically elevated pollution layer. In general NASA and FAAM PCASP1 were within 10 % of one another, while NASA and FAAM PCASP2 were separated by slightly larger amounts. ODR fits comparing FAAM PCASP2 to NASA PCASP and UHSAS had slopes of 1.026±0.003 and 1.047±0.04, respectively (Fig. 7f), with the comparison between FAAM PCASP1 and FAAM PCASP1 giving a slope of 1.065±0.004.
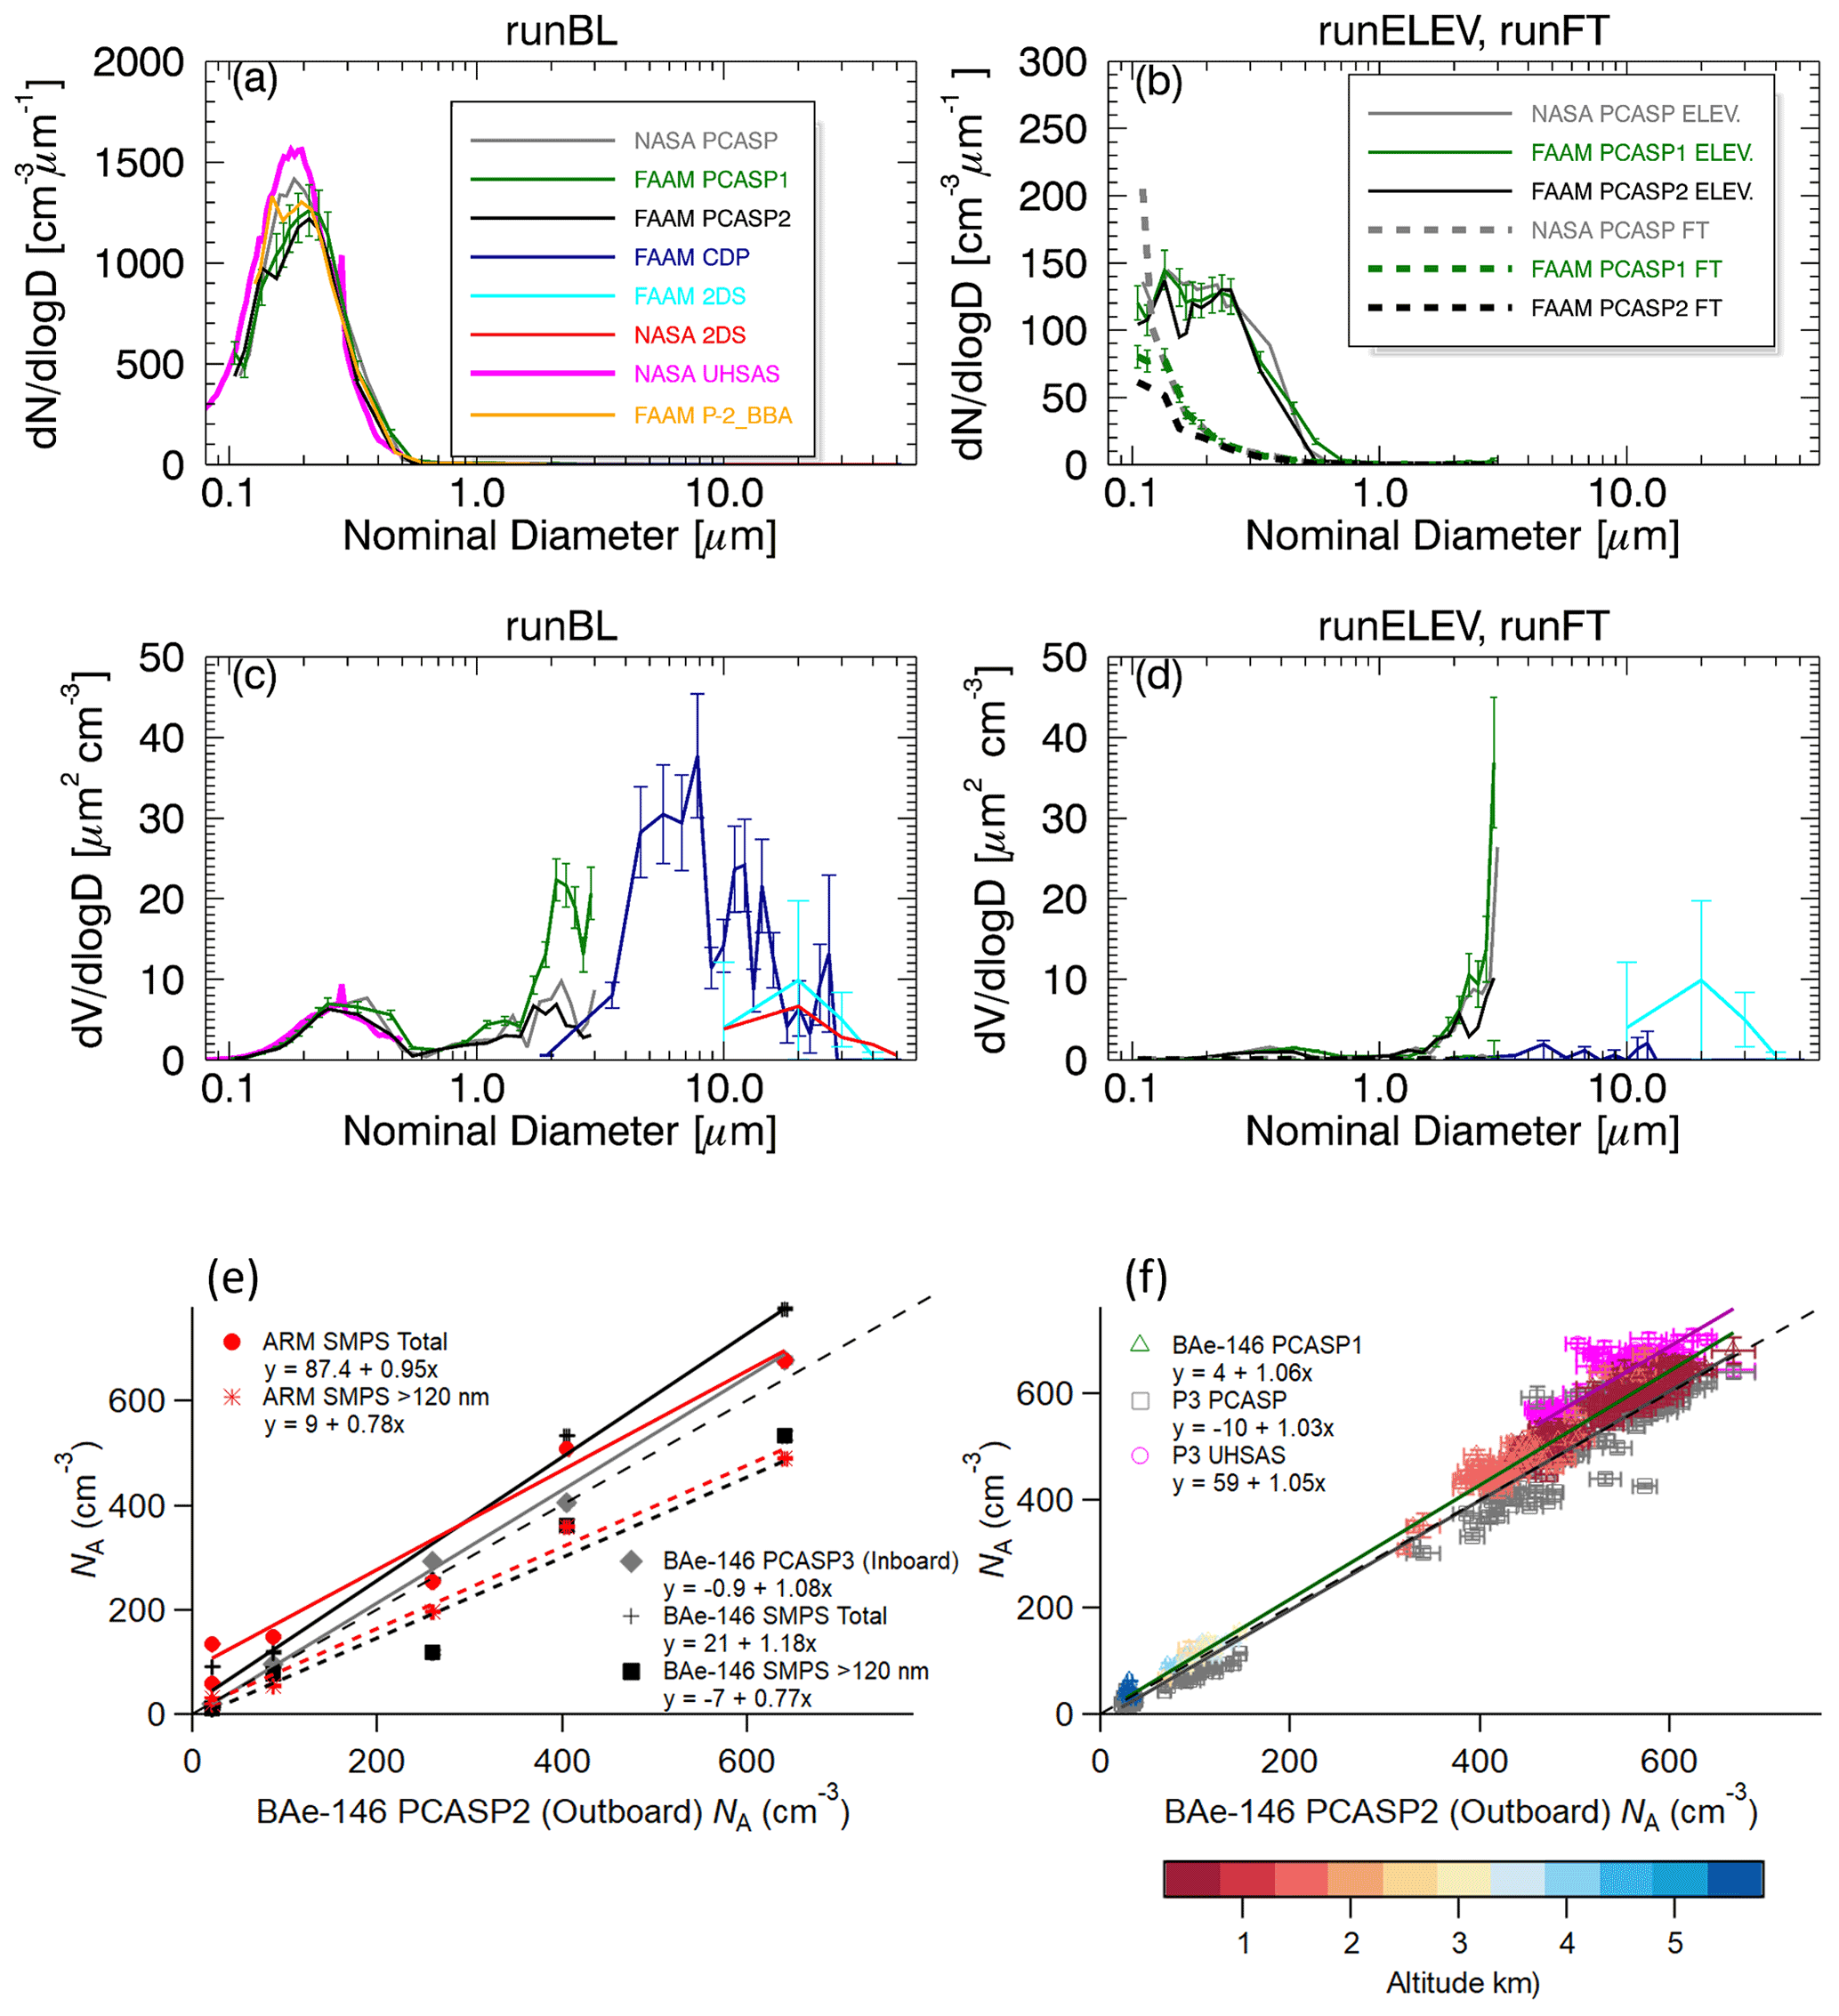
Figure 7Aerosol particle size distribution for (a) runBL, (b) runELEV (solid lines) and runFT (dashed lines) and volume size distribution for (c) runBL, (d) runELEV (solid lines) and runFT (dashed lines). Errors (positive only) are only shown for FAAM PCASP1, FAAM CDP and FAAM 2DS to aid clarity; see main text for details. The legend in panel (a) applies to panels (a), (c) and (d). Correlations from various flight segments (Table 2) between aerosol number concentration measurements are shown for between FAAM BAe-146 PCASP2 for (e) ground–airborne comparisons, where dashed lines refer to LASIC SMPS data restricted to particles with diameter larger than 120 nm, and solid lines refer to all sizes of particles and (f) airborne comparisons, where sample altitude is given by the colour bar for the FAAM PCASP2 and FAAM PCASP1 comparisons and a single colour for other probes to aid clarity.
Comparisons of NA with the ground-based site were performed using the LASIC SMPS and FAAM PCASP2, which only sampled particles larger than 120 nm. The slope of an ODR fit, when restricting LASIC SMPS to particles larger than 120 nm, was 0.78±0.003. A similar fit slope of 0.77±0.01 was observed between the two FAAM instruments, PCASP2 and SMPS (Fig. 7e). Interestingly the slopes considering all particle sizes are 0.95±0.004 (LASIC) and 1.18±0.02 (FAAM). This suggests that sizing differences are present, which may be accounted for using detailed RI corrections, which should be done for detailed science studies. The differences between the FAAM and LASIC slopes for the SMPS data where all particle sizes are considered suggest some influence of the sampling conditions that has not been fully characterised.
Number concentrations of CN are shown in Fig. 6c. An ODR of CN concentrations showed that NASA P3 data had an ODR slope of 0.91±0.01 relative to the BAe-146 concentrations. This trend is the opposite of that shown by the PCASP observations, although it is noted that the NASA CPC instrument only counts particles larger than 10 nm, whereas the FAAM instrument can detect particles as small as 2.5 nm. CN concentration data from the ARM site showed an ODR slope of 0.801±0.005 relative to the BAe-146 data, even though both of these platforms operated the same model of CPCs, which can detect particles as small as 2.5 nm.
4.3 Aerosols
4.3.1 Aerosol composition
Comparisons between the airborne AMSs were possible for runBL, where concentrations were larger than limits of detection. Concentrations on FAAM were too low during runELEV to be considered for this. Likewise, data from elsewhere in the FT were also below limits of detection for some parameters. Table 4 shows that organic aerosol (OA) concentrations from NASA were 80 % of those reported by FAAM. Similarly, ammonium concentrations were lower, by 90 %, from NASA measurements compared to those sampled from FAAM. Concentrations of nitrate throughout the profile were low and close to the FAAM limit of detection, with NASA reporting 80 % of FAAM concentrations. Conversely, the NASA-reported sulfate concentrations were 40 % higher than those reported by FAAM. Some fragment markers from the AMS measurements can provide information on the OA composition and oxidation states, e.g. 43 and 44. The 43 is mainly from the fragments of saturated hydrocarbon compounds and long alkyl chains and are good indicators of fresh aerosols (Alfarra et al., 2007). The 44 is the signal of the CO2+ ion from carboxylic acids and organo-peroxides and suggests the presence of oxygenated organic compounds (Aiken et al., 2008). Proportional contributions were calculated as the ratios of these OA fragment markers to the total OA mass concentration, respectively (f43 and f44). The f44 values were relatively consistent between two aircraft measurements for runBL, and the f43 are also within observed standard deviations (Table 5).
Table 4Aerosol composition properties, organic aerosol (OA), sulfate (SO4), nitrate (NO3) and ammonia (NH4) for FAAM, NASA and LASIC platforms. Data are not available from 5 September. Missing data are represented as NaN (not a number).
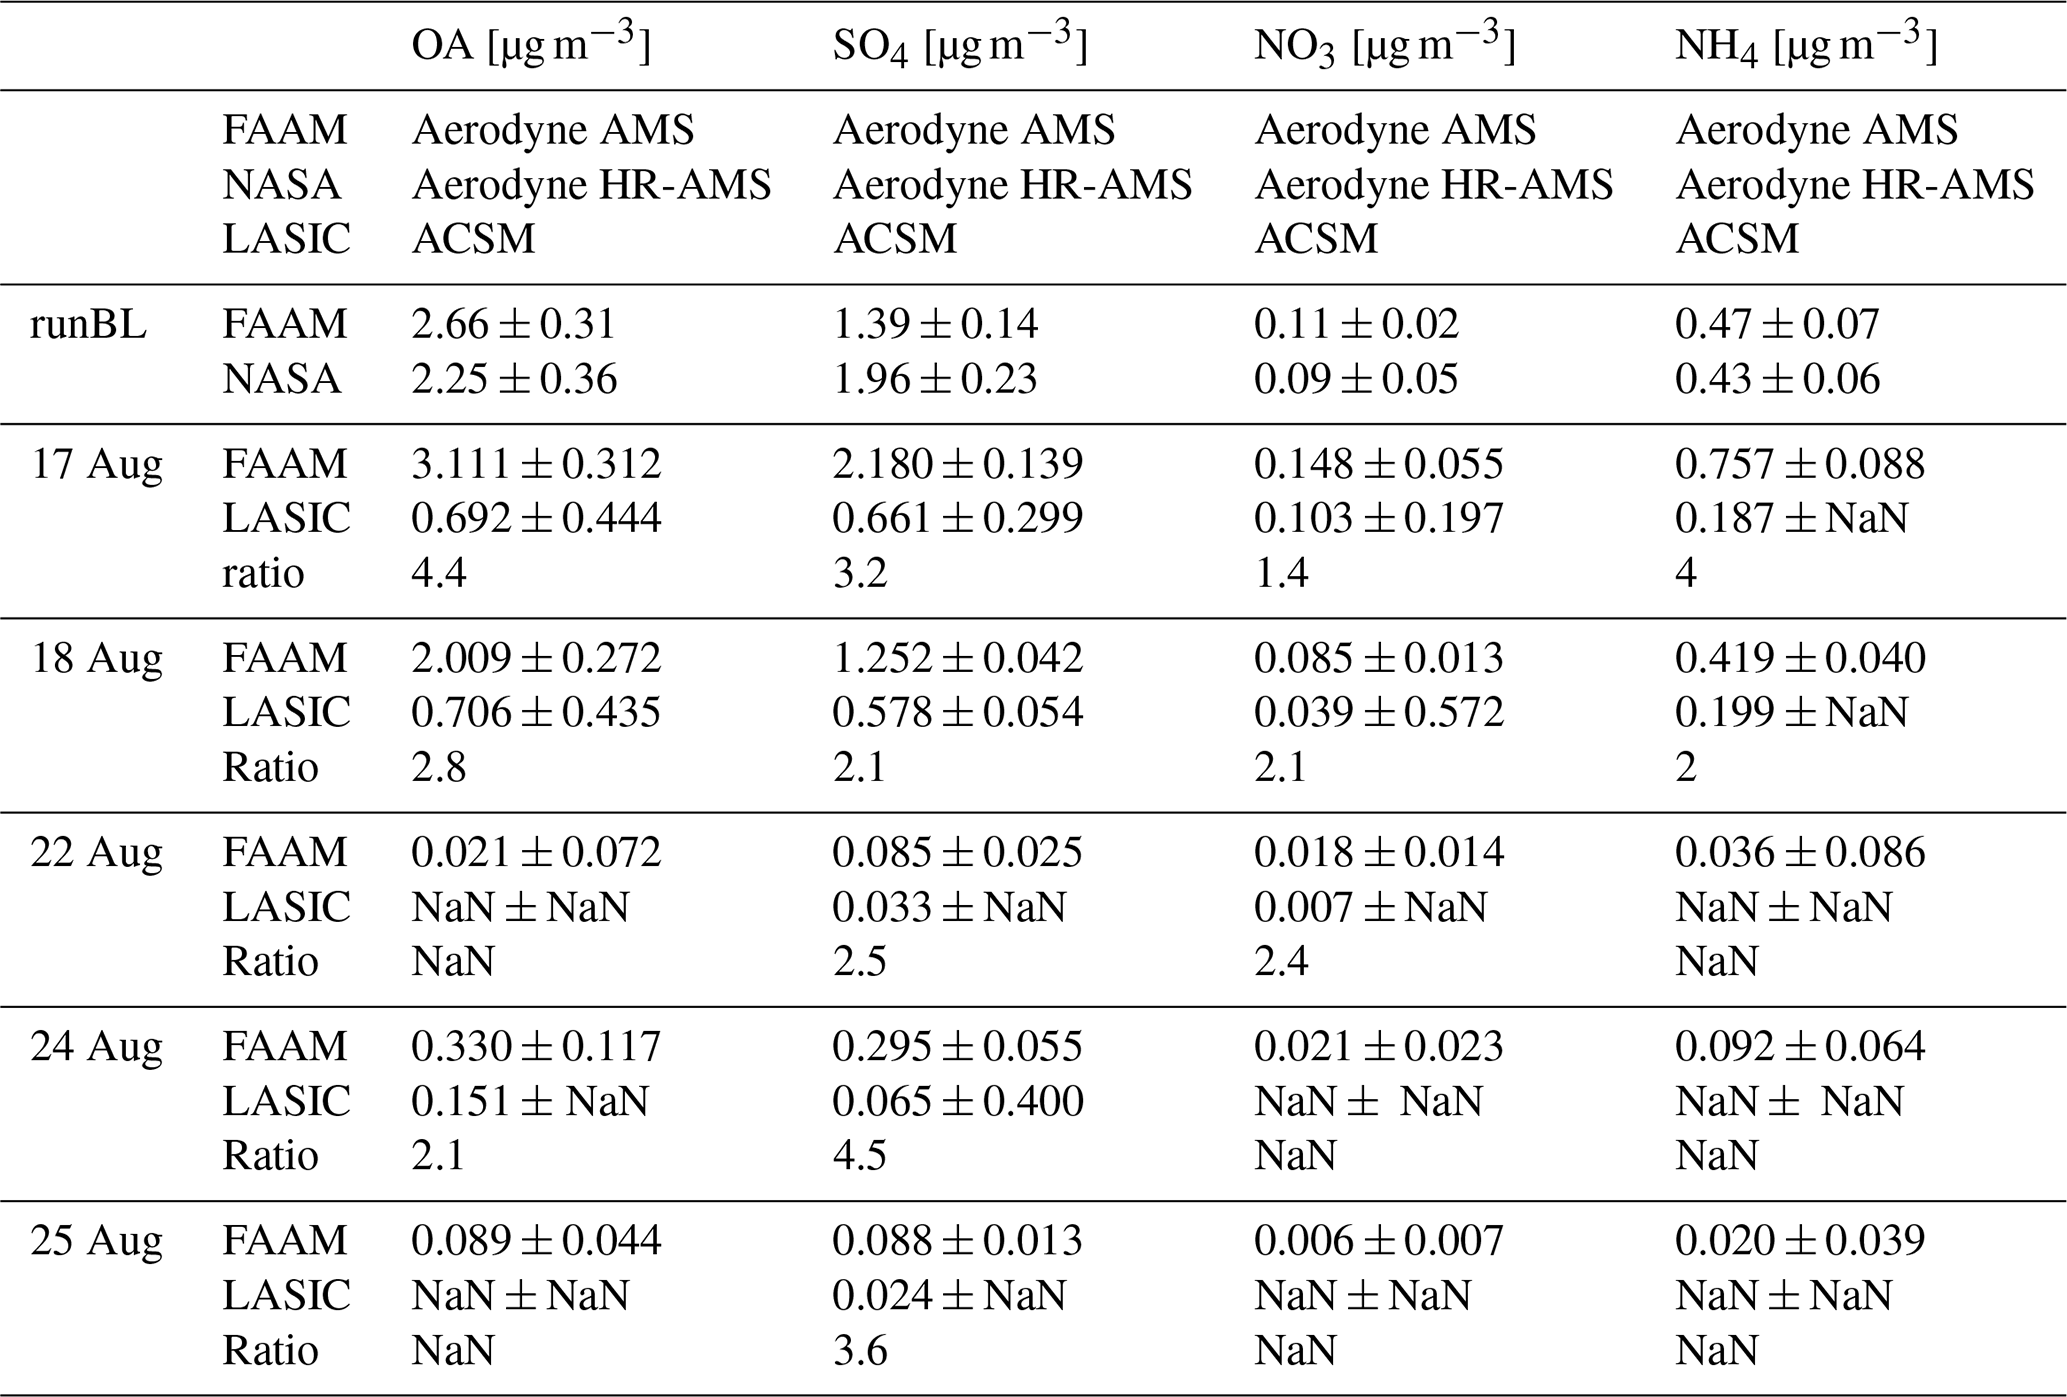
Table 5Aerosol-composition-derived parameters from runBL for FAAM and NASA platforms.
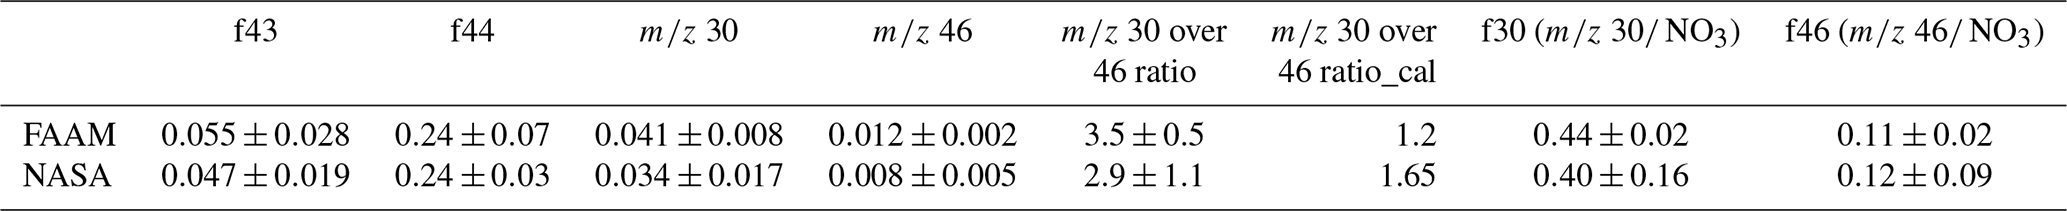
Data from LASIC ACSM (using the c2 dataset) do not compare well with those from FAAM (Table 4), with LASIC–FAAM mass ratios in the ranges of 2.1–4.4 (OA), 2.1–4.5 (SO4), 1.4–2.4 (NO3) and 2.0–4.1 (NH4). These differences remain unexplained.
4.3.2 Aerosol physical properties
Aerosol PSDs are presented as number distributions (ddlogD) for runBL in Fig. 7a and for the runELEV and runFT leg in Fig. 7b, with corresponding volume distributions (ddlogD) in Fig. 7c and d, respectively. For completeness the surface area distributions are provided in the Supplement (Fig. S4). The accumulation mode number distribution in the boundary layer looks to be captured in a similar manner by the NASA PCASP and FAAM outboard PCASP1 and PCASP2 (Fig. 7a). Data from PCASP probes here are not adjusted to a composition-specific RI. Poisson counting uncertainties (e.g. Lance et al., 2010) for individual channels are below 1 % for sub-0.5 µm diameter aerosol particles (available here for FAAM probes and expected to be of similar magnitude for the NASA probe). Data for runBL were also available from the NASA UHSAS, first corrected for the characteristics of BBA as described in Howell et al. (2021), for diameters up to 0.5 µm (the stated upper size limit for the correction algorithm). Concentrations are larger than those reported by any of the PCASPs. By converting the FAAM PCASP2 bin boundaries to those for BBA-equivalent RI it can be seen that the PSD more closely matches that from the UHSAS, although concentrations are still lower. This demonstrates the importance of considering the material RI when combining measurements from multiple probes with differing techniques.
The accumulation mode aerosol effective radius (Re) ODR fits for the airborne comparison are shown in Table 3 with slopes of 1.31±0.18 for NASA PCASP and a mean ratio of 0.92±0.04 for the NASA UHSAS, which only operated at a single altitude. For comparison the FAAM PCASP1 had an ODR slope of 1.48±0.07 relative to FAAM PCASP2. Correlations are plotted in Fig. S5 for completeness and tabulated in Table S6. These numbers do not reflect ambient conditions as this would require adjustment to the RI of the material under test. There is greater variability between probes on the same platform than between platforms.
A coarse aerosol mode was also present during runBL. This can be seen most clearly in Fig. 7c, which shows the volume distribution ddlogD for runBL. The magnitude of the differences between PCASPs is much larger than the combined uncertainties at supermicron diameters. The largest differences are apparent between the two probes on the FAAM BAe-146 platform, while FAAM PCASP2 and the NASA PCASP are in closer agreement. Only the FAAM CDP reported aerosol data in the particle diameter range 1–5 µm, but, at larger diameters, data from 2DS probes on both aircraft cross over with CDP observations and show distributions with similar shapes. The cross-over between CDP and PCASP is likely dominated by uncertainty in the larger sizes of the PCASP. This coarse mode will contribute to the total optical scattering from aerosol particles, as evidenced by the NASA runBL nephelometer data (Sect. 4.3.3) when switching between PM1 and PM10. At diameters larger than 0.5 µm, where particle counts are much lower, Poisson counting uncertainties become significant: 40 % at 1.5 µm and more than 200 % at 3.0 µm. The bin boundaries of the PCASP and CDP have not been corrected for the material RI, which is not known. The 2DS is a shadow imaging probe and so not affected by the RI of the material. Detailed scientific analysis should account for the material's RI, and not doing so here does limit the utility of the results in the probe cross-over regions
A comparison of number PSDs from the vertically elevated pollution layer and the runFT leg is shown in Fig. 7b. The PCASP probes detected much greater concentrations of accumulation mode aerosol particles in the vertically elevated pollution layer than the clean free troposphere during runFT. The PCASP probes have the ability to distinguish the vertically elevated pollution layer from the cleaner surrounding free troposphere, when taking instrumental uncertainties into account. The volume size distribution is not well sampled (Fig. 7d) in either runFT or runELEV. There is evidence from PCASP (FAAM and NASA) and 2DS (FAAM) that a coarse mode was present in the vertically elevated pollution layer that was not present in the clean free troposphere. It was possibly composed of dust particles, although there is limited external information with which to verify this other than a weak depolarising signal on the lidar (not shown). The CDP does not sample the coarse mode well; number concentrations are low, and the sample volume of the CDP is small, resulting in poor sampling efficiency. NASA CDP and 2DS did not report data here. For this set of probes to faithfully sample the coarse mode volume distribution in this environment a much longer sample time would be required in order to increase the amount of material sampled.
Comparisons between LASIC and FAAM of aerosol PSDs took place on six occasions shown in Fig. 8, utilising the ARM site SMPS and the BAe-146 PCASP2 (outboard), PCASP3 (inboard) and SMPS (inboard). A dominant accumulation mode was observed on 17 and 18 August and on 5 September with good correspondence observed in the overlap region between all PCASP and SMPS instruments. Only the SMPSs can detect the Aitken mode, which was most evident on 22, 24 and 25 August. The Aitken mode was dominant or comparable to the accumulation mode in magnitude on 22 and 25 August, both notable for accumulation mode max particle number concentrations (in terms of ddlogD) below 100 cm−3. When the Aitken mode max concentration was low on 24 and 25 August (ddlogD<200 cm−3), the ARM SMPS reported higher concentrations than the empirically scaled (Wu et al., 2020) aircraft SMPS and more comparable to the unscaled values. For 22 August the FAAM aircraft SMPS (scaled) and ARM SMPS concentrations were very similar, as was found for the accumulation mode. Generally, all instruments reported similar width and mean for both modes. The application of the empirical scaling factor (Wu et al., 2020) to FAAM SMPS data is supported by this comparison, although there is evidence that there may be some size-dependent features, in particular at the Aitken mode size range, that are not captured by the simple single number correction.
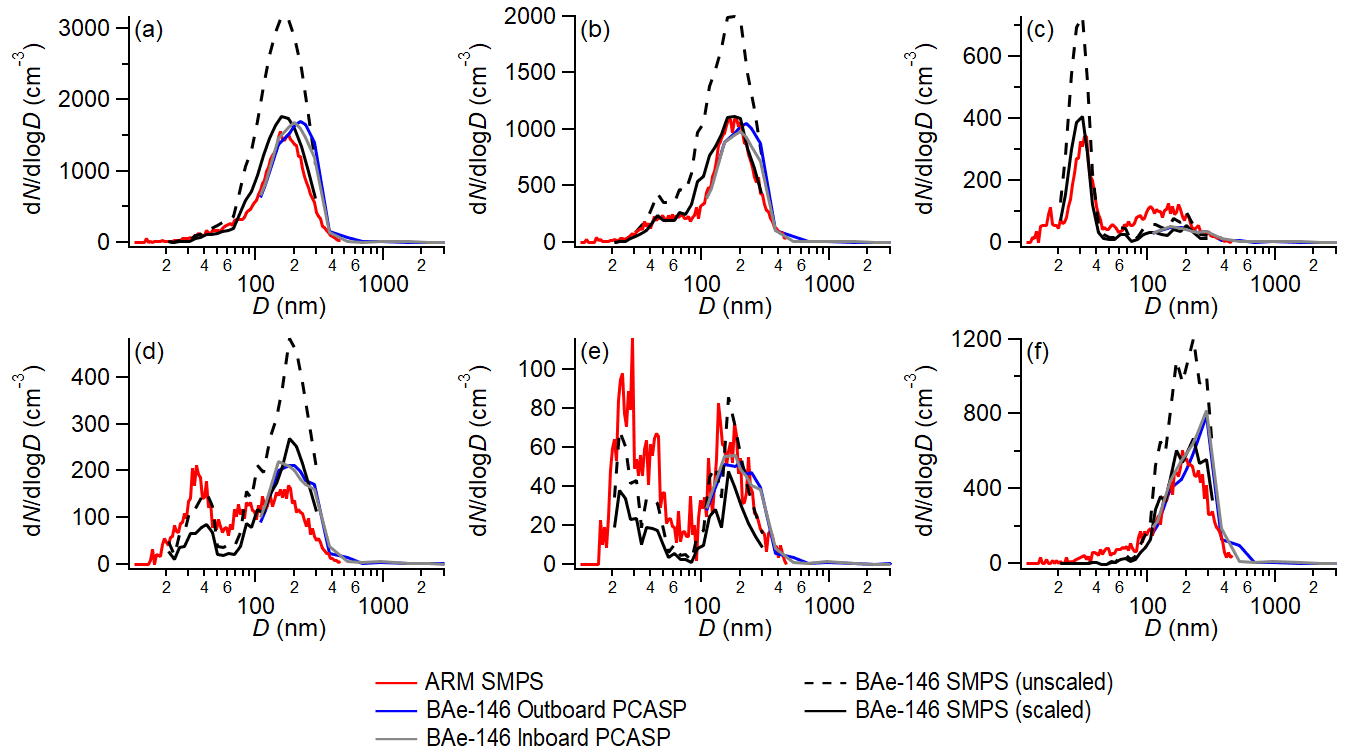
Figure 8Particle size distribution for six FAAM–LASIC fly-past flight legs for (a) 17 August 2017, (b) 18 August 2017, (c) 22 August 2017, (d) 24 August 2017, (e) 25 August 2017 and (f) 5 September 2017.
4.3.3 Aerosol optical properties
The vertical profiles of aerosol optical scattering, σSP, (Fig. 4h) show that data from the NASA and FAAM aircraft both identify the large-scale features of the vertically elevated pollution layer and the aerosol-laden boundary layer. Results for aerosol optical scattering and absorption are tabulated in the Supplement (Table S4). The nephelometer on board NASA P3 reported larger scattering magnitudes in the boundary layer below 1.7 km compared to scattering measurements (the difference between σEP (CDRS) and σAP (PAS) from FAAM). During the descent, the NASA P3 instruments sampled the full particle size range (PM10), whereas the FAAM CRDS instruments sampled behind an impactor with an aerodynamic D50 cut off at 1.3 µm. During runBL, the NASA P3 alternately sampled downstream of either a PM10 or PM1 inlet as detailed in Table 2.
Observations of σSP (470 nm) made on board NASA from the three PM10 periods (runBL_A, runBL_B, runBL_C; Table 2) showed a decreasing trend along the run from values at the start of 67±2 to 44±3 Mm−1 at the end of the run, with corresponding data from behind the PM1 impactor for periods runBL_1 and runBL_2 (Table 2) of 48±4 and 43±3 Mm−1 (not shown). Comparison of measured PM1 and PM10 σSP along runBL shows that the recorded σSP after the PM10 impactor was on average higher by ∼14 Mm−1, indicative of the contribution to scattering from supermicron particles, most likely of marine origin (Wu et al., 2020).
Comparisons of σSP for red and blue channels for runBL are shown in Fig. 6f and g as a function of data from FAAM BAe-146 for the NASA P3 and LASIC ARM site. The intercomparison of σSP observations from the two aircraft shows that NASA P3 observes 50 % more scattering than the FAAM BAe-146 for non-size-selected observations (runBL_A, runBL_B, runBL_C), as given by the ODR slopes of 1.485±0.005 (blue channel) and 1.52±0.01 (red channel). The two were closer, within 20 %, when the NASA P3 sampled only submicron aerosols (Fig. 6f and g) with ODR slopes of 1.172±0.008 (blue channel) and 0.971±0.017 (red channel).
Blue channel σSP data from the ARM site has an ODR slope of 0.742±0.004 compared with the BAe-146 data and 0.391±0.003 for the red channel during the six intercomparison flight legs. While the EXSCALABAR optical properties from PAS and CDRS are for dry aerosol, the LASIC nephelometer is reported to operate between 50 % RH–60 % RH. Ideally all platforms would carry identical instrumentation and operate it under similar parameters, but the FAAM EXSCALABAR is a state-of-the-art bespoke instrument, whilst LASIC and NASA use their unique solutions for airborne and ground-based installations of commercially available technologies, PSAP and nephelometers. However, it would be preferable to record all data at a constant humidity for example, and this should be considered for future campaigns with multiple platforms. Adequate control of humidity does present challenges however, and so this may not always be possible, giving rise to the need for intercomparisons such as this.
However, if RH-controlled growth of aerosol were the only difference, the LASIC σSP would be larger than EXSCALABAR σSP, even for aerosol dominated by only weakly hygroscopic organics. Two further possible explanations for these discrepancies in σSP are (1) that the aerosol population sampled at the ARM site is different to that encountered by FAAM or (2) that the aerosol sample is modified in some way during sampling. The ARM site is located on land, which presents an opportunity for introduction of aerosols not encountered during the airborne sampling over the ocean. Relative humidity is not thought to be the cause of the discrepancy because the LASIC data are not actively dried unlike the FAAM data. Hence, the LASIC data might be expected to produce more scattering, with the population of aerosols in a more humid environment growing to some degree based on the hygroscopicities.
There may be important size-dependent transmission efficiency artefacts. These would have to affect only larger particles as there is good correspondence between σAP (see below) and BC observations along with NA, all of which are dominated by aerosol smaller than 600 nm diameter (e.g. Peers et al., 2019). Comparisons of scattering at the ARM site between the nephelometer and the CAPS PMSSA data (Table S5) show internal consistency, suggesting that the difference between the airborne and ground-based measurements is not related to a specific instrument but a systematic issue. Aerosol sampling – in particular inlets and particle transmission – is discussed further in Sect. 5.5.
The FAAM PAS σAP data from the profile descent (Fig. 4f) show that absorbing aerosols are present in magnitudes greater than the lower threshold of the instrument in the boundary layer, runBL, and upper pollution layer, runELEV. Data follow similar trends from the NASA PSAP in the boundary layer. In the vertically elevated pollution layer the NASA PAS data look suspect; for example signals from red and blue are nearly identical, suggesting an unphysical absorption Ångström exponent (ÅAP). This is likely because the PSAP is not suitable for operating in regions where RH (or pressure or other external factors) changes rapidly, such as during descent, especially, as is the case for NASA PSAP, where the sample is not actively dried. These data should be treated with caution and are not used in subsequent correlations (Fig. 6h and i). Consequently, the data for σEP (Fig. 4f) from NASA (nephelometer + PSAP) should be treated with caution in the vertically elevated pollution layer when compared against the FAAM CRDS measurement, which measures optical extinction directly.
The correlations between σAP from FAAM and NASA when sampling behind the 1 µm impactor for nominal blue (470 nm) and red (660 nm) wavelengths are shown in Fig. 6h and i. Because data are only present from the boundary layer leg, the result is shown as a ratio of weighted means, both of which are within 10 % of one another (0.927±0.003 (blue channel) and 1.077±0.008 (red channel)), although in opposite directions. Data at 530 nm show a slope of 0.96±0.008. This wavelength dependence is explored in more detail. Figure 9a shows submicron σAP as a function of wavelength for runBL_1. NASA reported lower magnitudes of σAP compared to the FAAM PAS data, as can be seen by considering interpolated values of FAAM PAS and NASA PSAP data. FAAM σAP data were derived as a function of wavelength between 405 and 660 nm by computing ÅAP between adjacent wavelengths and interpolating from the nearest observation in wavelength space. The same was done for NASA σAP data between 470 and 660 nm, with values extrapolated at wavelengths shorter than 470 nm. This shows that NASA PSAP data points at native wavelengths are within 1 Mm−1 of the interpolated FAAM PAS. We also show σAP data from the FAAM TAP instrument at the three native wavelengths. The TAP observations were very close to the interpolated values for the EXSCALABAR PAS data that it shared an inlet with. Filter-based absorption measurements including NASA PSAP and FAAM TAP are subject to larger biases and uncertainties than spectroscopic techniques such as those used in EXSCALABAR (e.g. Davies et al., 2019). However, there is no evidence of biases related to filter-based techniques impacting these comparisons of σAP. The extrapolated values of σAP from the NASA PSAP at wavelengths shorter than 470 nm fall just outside the 1 Mm−1 maximum expected error range from the FAAM PAS data. The wavelength dependence in FAAM PAS data is seen to steepen here, yet there are no NASA PSAP observations at wavelengths shorter than 470 nm with which to constrain this.
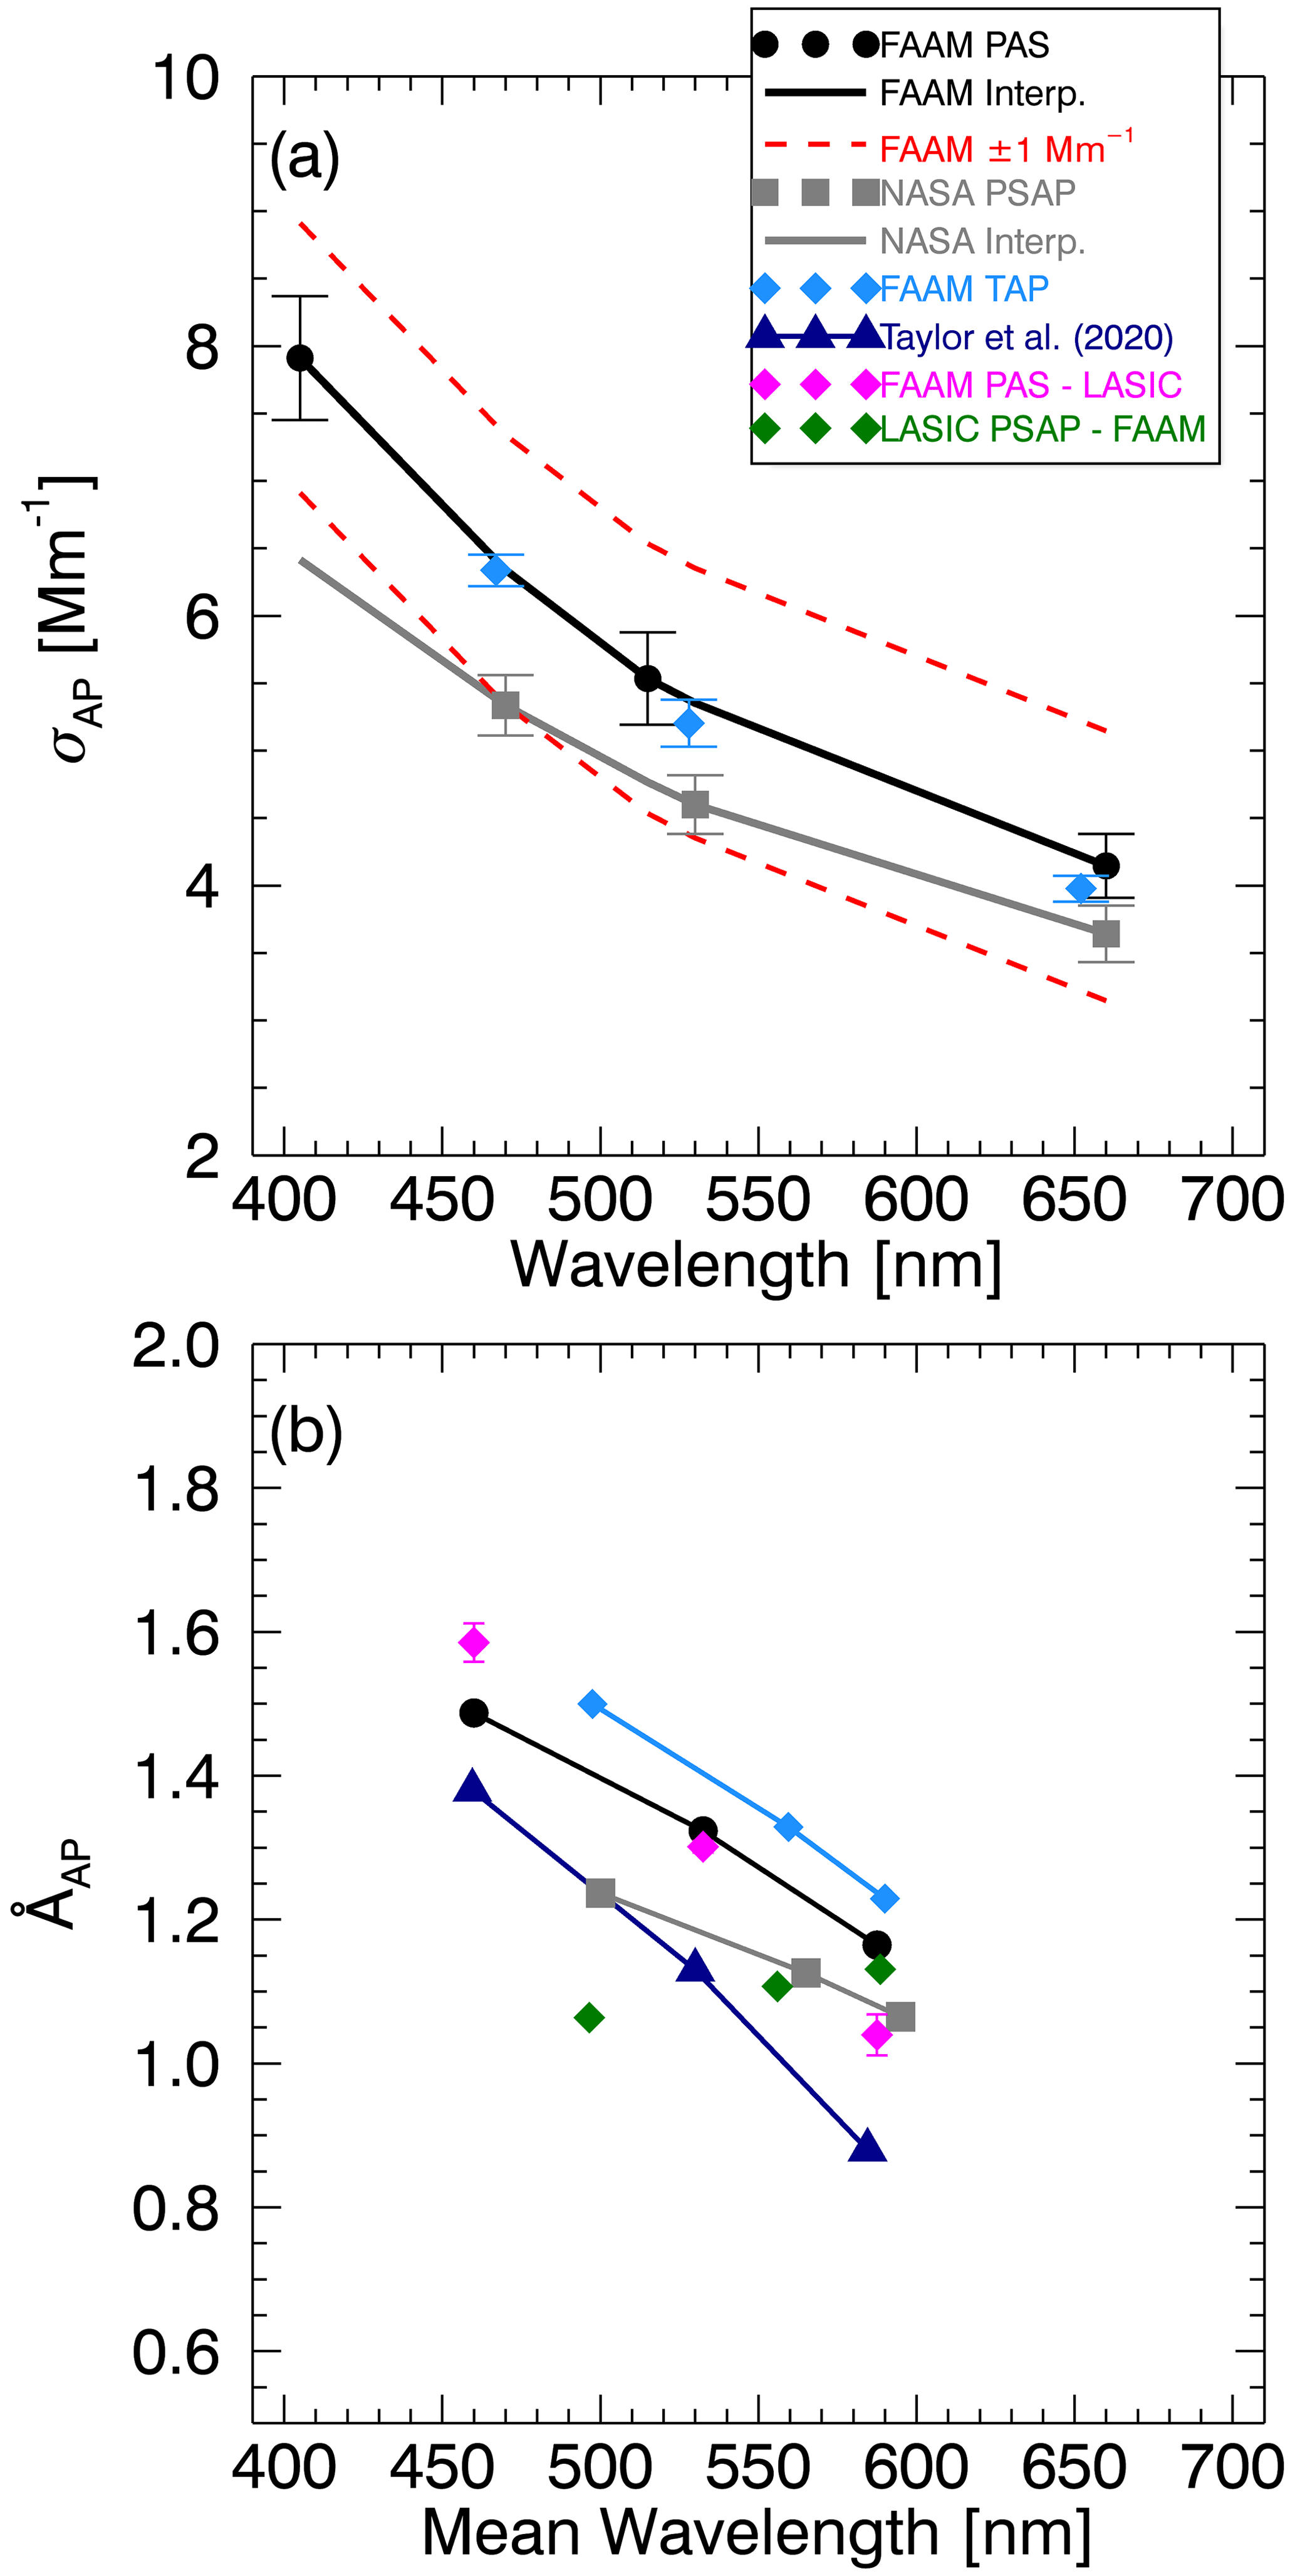
Figure 9Optical absorption coefficient as a function of wavelength for boundary layer leg runBL_2 (Table 2). Observations are shown as mean (symbols) and standard deviation (error bars) for FAAM EXSCALABAR PAS and NASA PSAP data, along with FAAM TAP data. Interpolated values of σAP are shown, which use ÅAP from observations for FAAM and NASA. (b) ÅAP as a function of pairs of mean wavelengths for runBL_1 and the weighted mean of observations from four FAAM fly-pasts of the LASIC ARM site are shown (17, 18, 22 and 24 August). Full CLARIFY campaign data are reproduced from Taylor et al. (2020).
The comparison of σAP at the LASIC ARM site with FAAM measurements shows that the 470 nm data had an ODR slope of 0.98±0.006 during the six intercomparison flight legs (Table 2) with an offset of Mm−1. Similar performance was found at 660 nm, with a slope of 1.00±0.008 and offset of Mm−1; note that FAAM reported σAP greater than 1.0 Mm−1 on only two occasions. For the 530 nm data (not available for σSP) the ODR between FAAM PAS and LASIC PSAP data had a slope of 1.00±0.01 and an offset of Mm−1, with comparisons available for 17, 18, 22 and 24 August. At the LASIC ARM site the CAPS PMSSA probe (530 nm) data gave an ODR slope of 0.98±0.03 for PM1 data, consistent with other observations (Fig. S6).
Absorption Ångström exponents, ÅAP, computed from pairs of wavelengths as a function of mean wavelength are shown in Fig. 9b for runBL_1 for NASA PSAP, FAAM EXSCALABAR PAS and the FAAM TAP. A general trend of increasing ÅAP at shorter wavelengths is apparent in these measurements from the intercomparison data, as would be expected considering the CLARIFY campaign-mean data from Taylor et al. (2020). Data from NASA PSAP are in better agreement with the CLARIFY EXSCALABAR PAS campaign-mean values than the FAAM TAP data (which are also filter-based).
Similar comparisons of ÅAP for the FAAM EXSCALABAR and LASIC PSAP observations are also shown in Fig. 9b for three segments with σAP>1.0 Mm−1. FAAM ÅAP data over these segments are shown as the mean and the range and are largest at shortest mean wavelength, following the trend of the aircraft intercomparison with other observations. Contrary to this, the LASIC data show a slightly decreasing trend towards shorter mean wavelength, although within the bounds of the uncertainties.
Determination of ω0 from observations of optical properties is hampered by the low magnitude of σAP and the short averaging times available for this study. There is additional discussion of this in Sect. 5.4.
4.4 Atmospheric radiation
4.4.1 Comparisons of downwelling spectral irradiances from FAAM SHIMS against those from the NASA SSFR
Three opportunities to compare the spectral irradiance from the SHIMS and SSFR radiometers are available for runs with the FAAM BAe-146 and NASA P3 aircraft: (i) runFT, which is the SLR at 5.8 km; (ii) runPRO, which consisted of the profile descent from 5.8 to 330 m; and (iii) runBL, which is the SLR at 330 m. These manoeuvres were performed wing tip to wing tip.
Figure 10a–i show the downwelling spectral irradiance from SSFR (NASA; first column) and SHIMS (FAAM; second column). The third column shows the fractional difference between the measured spectral irradiances. Similarity between the measurements is apparent. For runBL, the spectral irradiances are variable at around peak values of 400–2500 W m−2 µm−1. This is likely a consequence of the two aircraft operating below patchy cloud, where solar radiation is generally diminished, but, on occasion, three-dimensional reflectance effects from the edge of clouds can lead to a local enhancement of radiation (Marshak and Davies, 2005). The agreement in the spectral irradiances during runBL when integrated over wavelength is on average within 0.04 % for the VIS SHIMS module (0.30–1.15 µm) and within 0.57 % for the NIR SHIMS module (0.95–1.70 µm; Table 7). The agreement between the irradiances when integrated over wavelength during runFT and runPRO is in somewhat poorer agreement and is on average some 1.5 %–2 % higher in the VIS SHIMS module, but 0.5 %–1.7 % lower in the NIR SHIMS module.
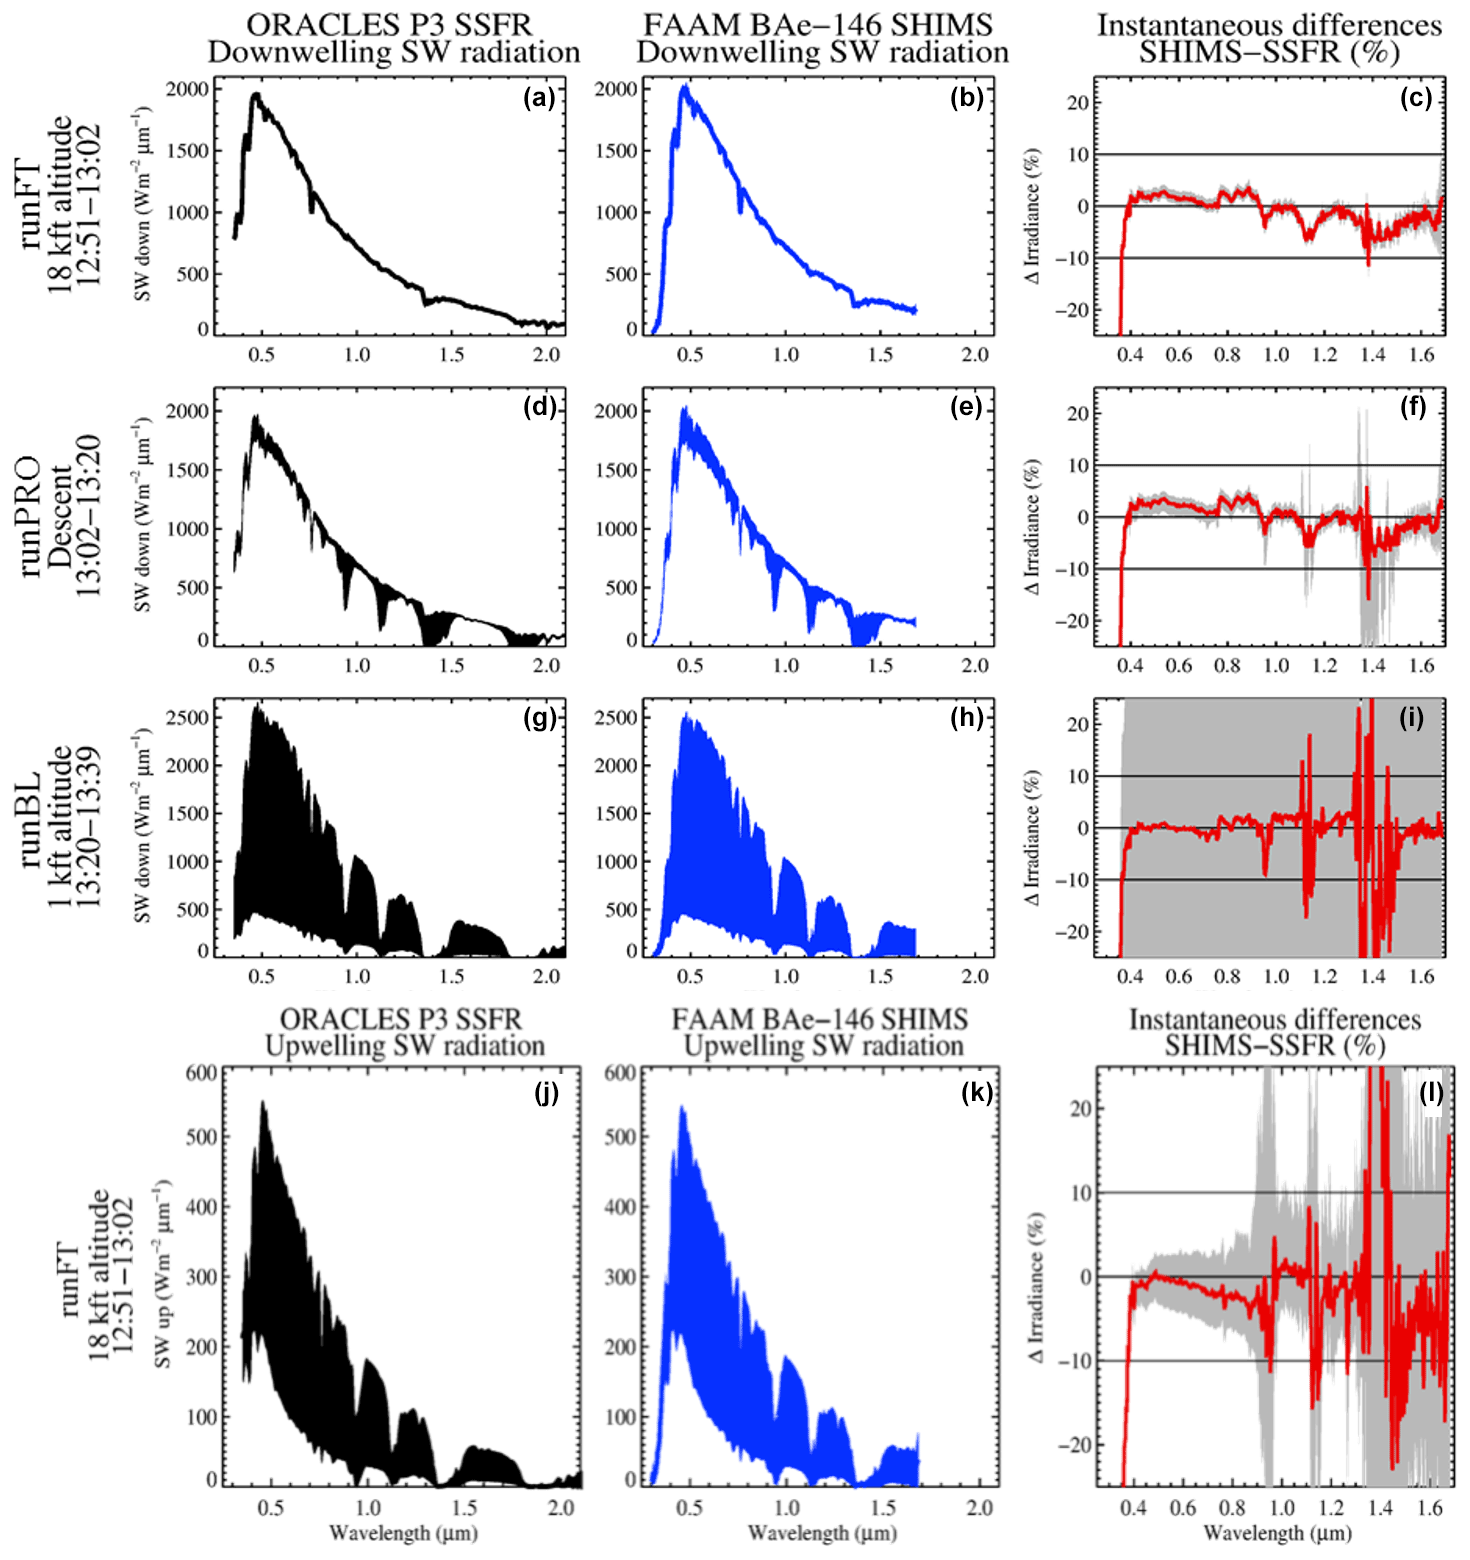
Figure 10Intercomparison of downwelling shortwave spectral irradiance from (a, d, g, j) ORACLES NASA P3 and (b, e, h, k) CLARIFY FAAM BAe-146 and (c, f, i, l) percentage differences for three wing-tip-to-wing-tip manoeuvres: (a–c) runFT, (d–f) runPRO and (g–i) runBL. Intercomparison of upwelling shortwave spectral irradiance for runFT (as a–c). Filled black and blue contours in (a), (d), (g), (j), (b), (e), (h) and (k) show the observed spectral irradiance ranges. Filled grey contours in (c), (f), (i) and (l) show the range of percentage differences in paired measurements, overlaid with the average percentage difference (red line).
Table 6Cloud microphysical and bulk properties; mean and standard deviations; 75th, 90th and 95th percentiles; and boundary layer turbulence.
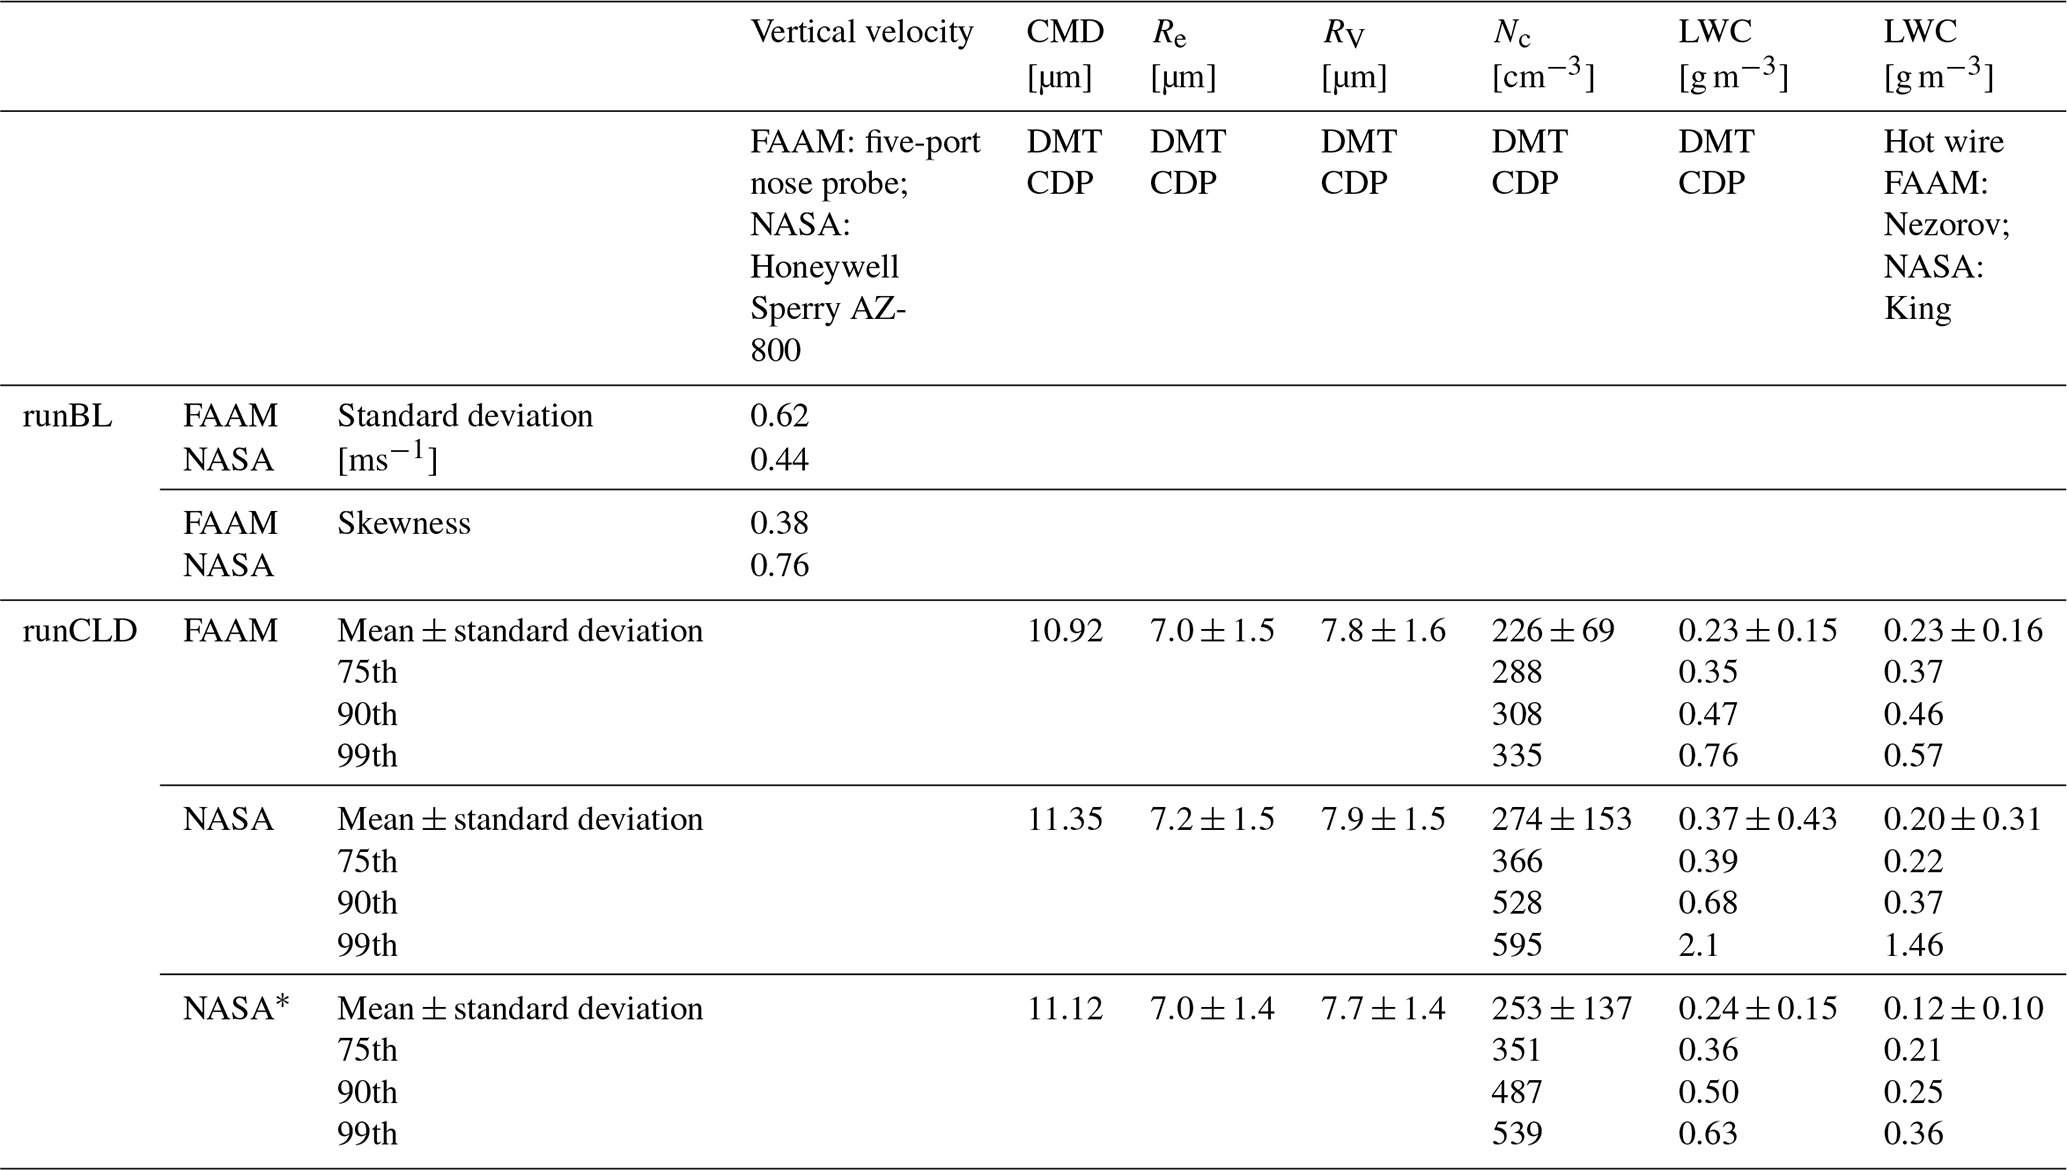
∗ Values without strong updraughts.
Table 7The integrated fluxes derived from the SHIMS and SSFR instruments over the SHIMS module spectral ranges. The measurements in standard font represent downwelling irradiances, while those in italics represent upwelling irradiances. Values in brackets denote 2 standard deviations.
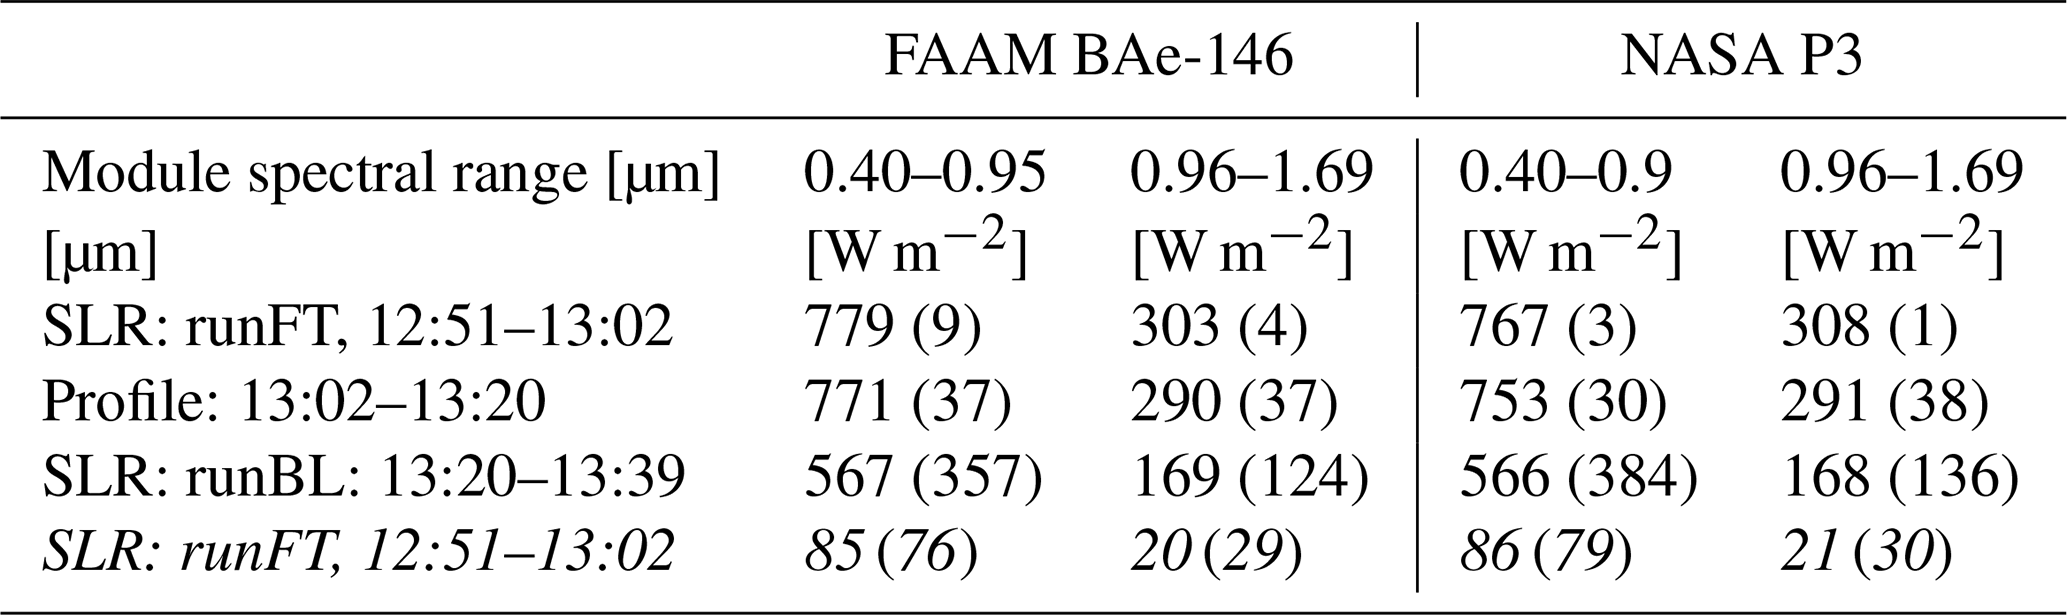
4.4.2 Comparisons of upwelling spectral irradiances from FAAM SHIMS against those from the NASA SSFR
The upwelling spectral irradiances from the FAAM and NASA aircraft are shown in Fig. 10j–k for runFT along with instantaneous differences between them (Fig. 10l). Considerable variability owing to the aircraft passing over variable amounts of cloud and, to a lesser extent, aerosol is apparent. Once again the measurements from the BAe-146 and the P3 aircraft are in reasonable agreement, with differences in the integrated irradiances of just 1 W m−2 (max 5 %) and similar measures of variability (see also Table 7).
4.5 Cloud microphysical and bulk properties
The longitudinal cross section of Nc (Fig. 11c) shows that broken cumulus clouds were sampled in situ by both aircraft, with concentrations varying across the run. It is worth recalling that due to safety considerations the sampling by the two aircraft was separated by a distance equivalent to 5 min travel time. The composite cloud PSDs from all cloud passes along the runs are shown in Fig. 11a for data from the CDP and 2DS probes. The errors are presented for the FAAM instrument only for clarity since the magnitude of errors will be similar between similar instruments. There are large uncertainties in the sample volume of the 2DS instrument in the smallest size channels, resulting in large uncertainties in the bin concentrations there.
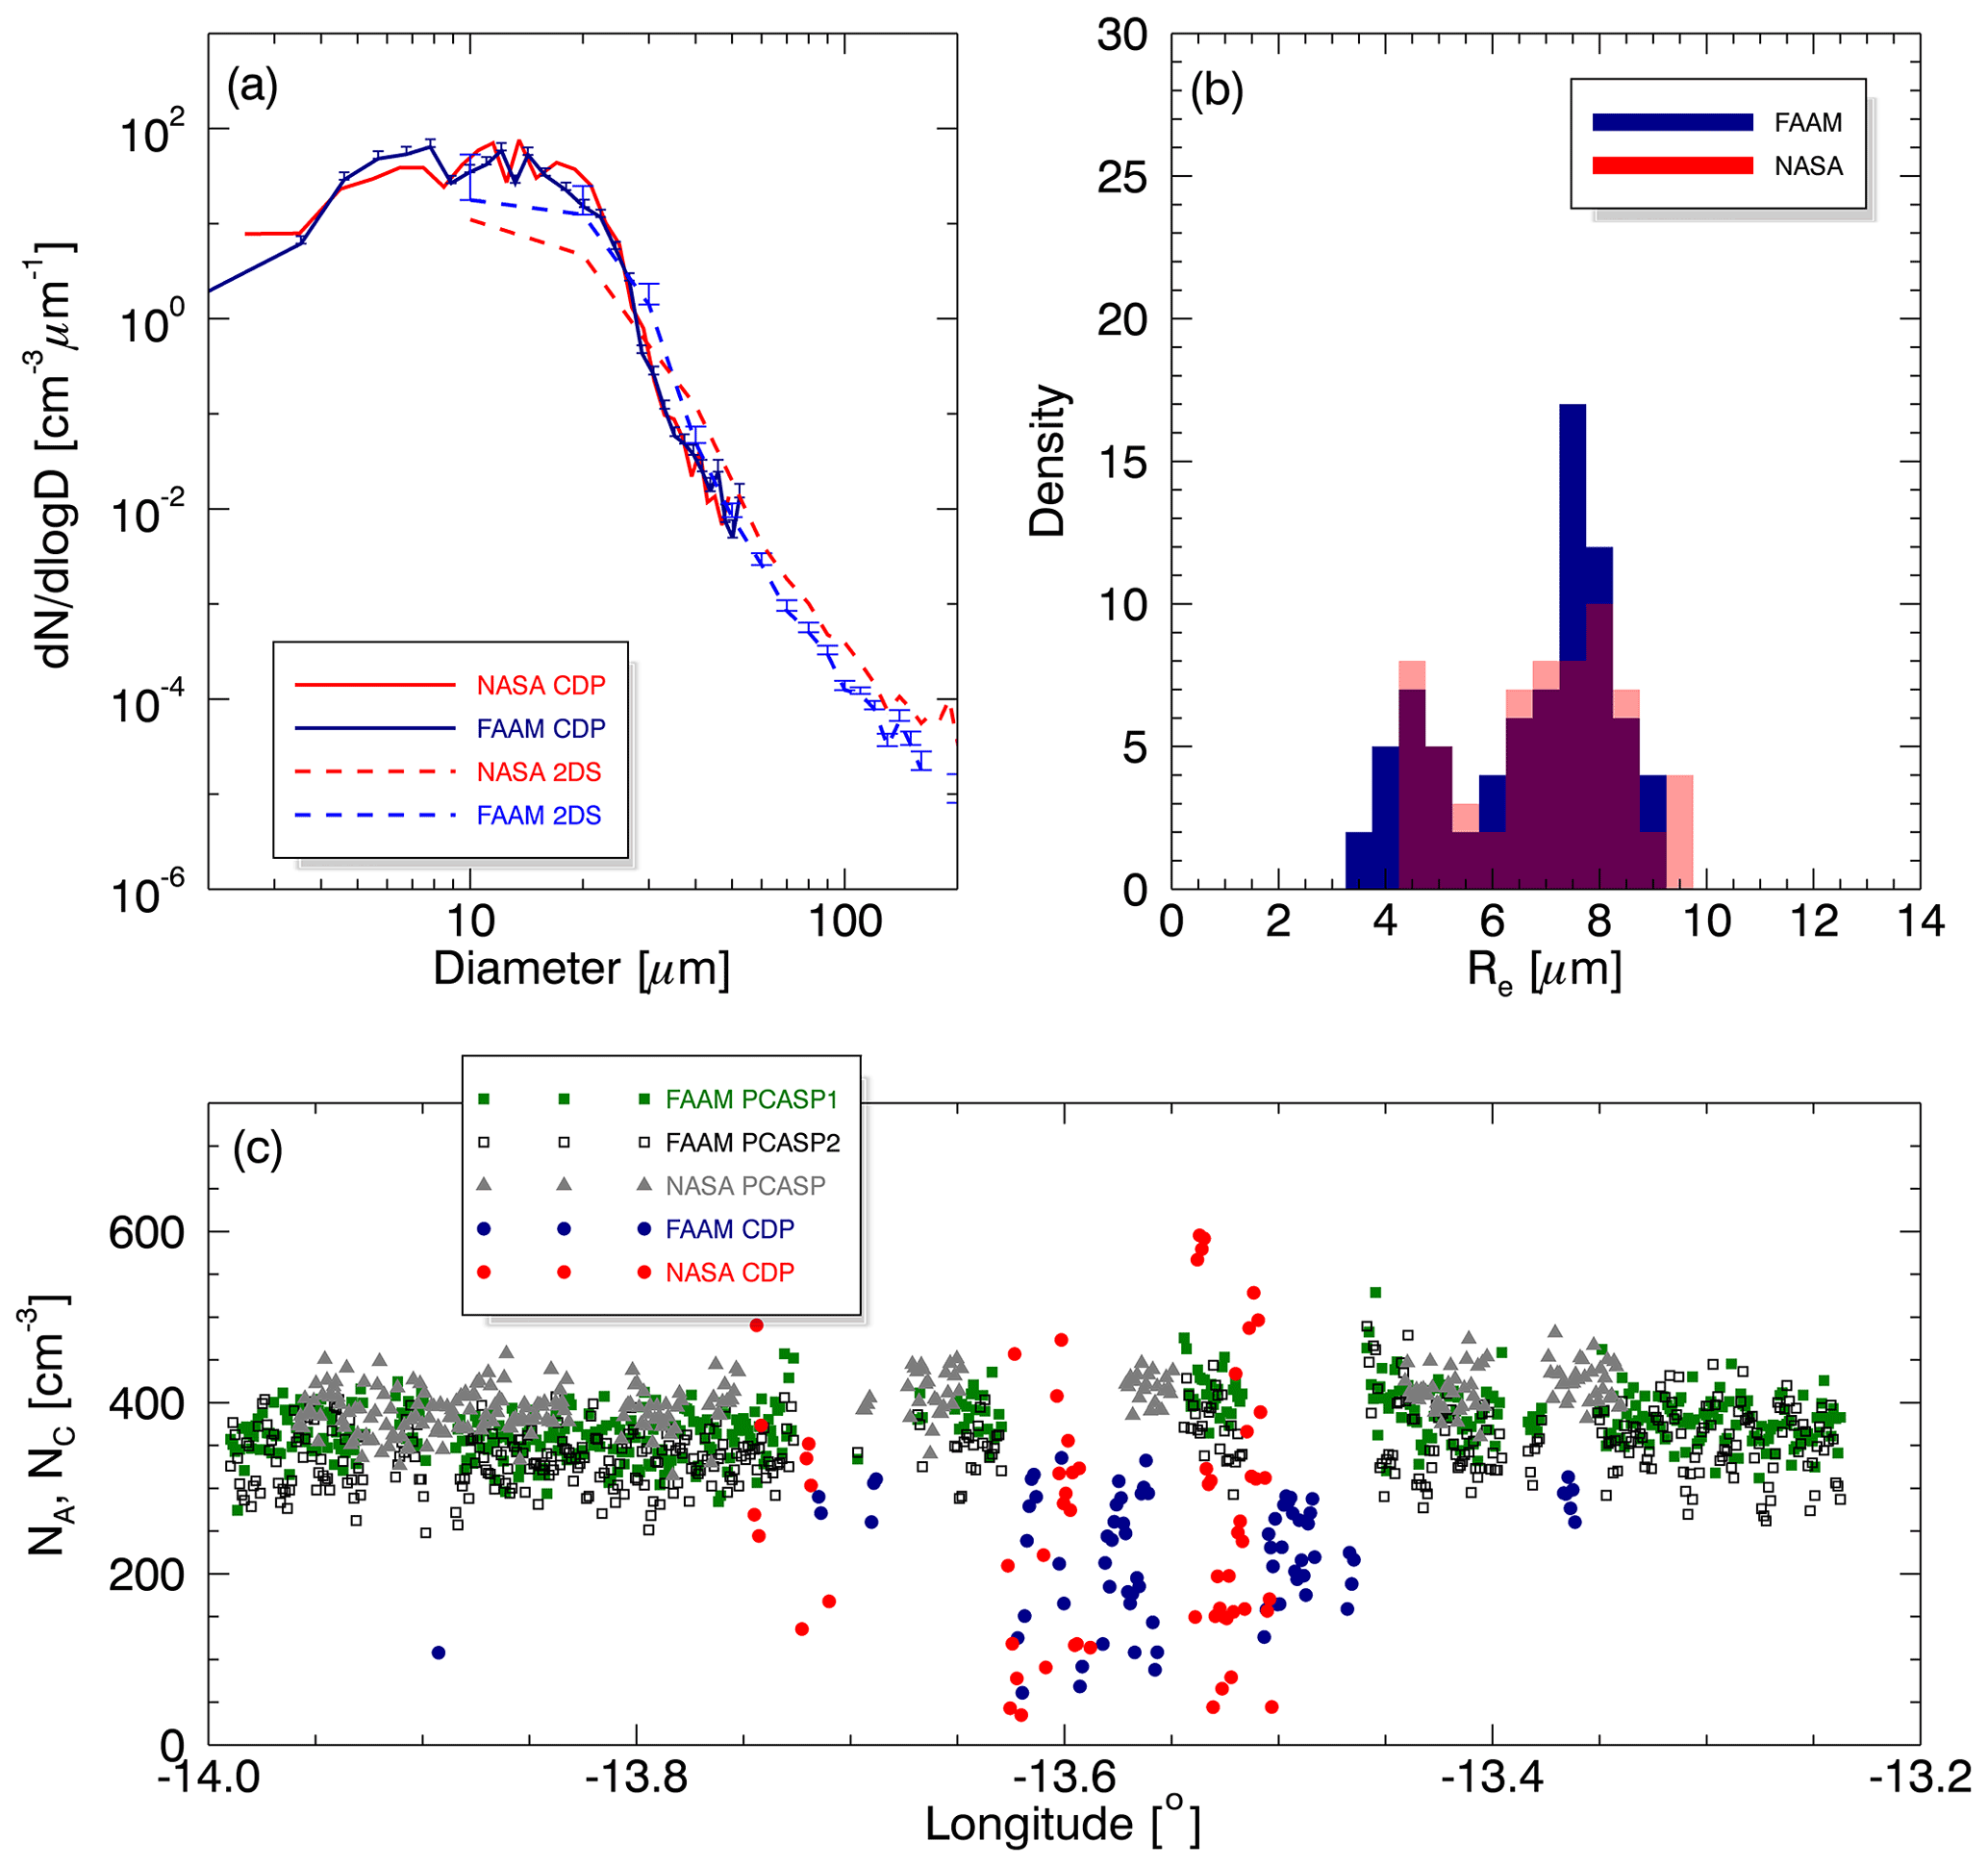
Figure 11(a) Cloud PSD, (b) PDF of cloud particle Re, and (c) time series of Nc (CDP) and interstitial NA (PCASP) at cloud level. Errors in PSD as Fig. 7 are shown only for FAAM platform to aid clarity.
The probability distribution functions (PDFs) of cloud drop effective radius, Re, shown in Fig. 11b, have a bimodal nature from both FAAM and NASA observations, with modes overlapping well.
Mean NC values were slightly greater and with a larger standard deviation on the NASA platform (274±153 cm−3) than from FAAM (226±69 cm−3; Table 6). The 90th percentiles of the distributions were 528 cm−3 (NASA) and 308 cm−3 (FAAM), and 99th percentiles were 595 cm−3 (NASA) and 335 cm−3 (FAAM). Errors due to particle coincidence in the sample volume are expected to be minimal at these concentrations (<1 % at 800 cm−3 according to Lance et al., 2012). Number concentrations of NA were lower at this cloud level than encountered along runBL at 402±28 cm−3 (NASA) and 374±33 cm−3 (FAAM PCASP1; Table S6). These NA values were below the peak cloud drop number concentrations, implying that the clouds were nucleated some way below the flight level – something which was observed visually from the flight deck.
Occasionally the NASA P3 encountered much greater cloud drop number concentrations, NC>500 cm−3, with the 90th and 99th percentiles some 30 % greater than for FAAM. Inspection of the time series of in situ vertical wind velocities (not shown) indicated that the P3 flew through a strong updraught in excess of 6 m s−1, a feature not encountered by FAAM. Such an updraught would be expected to increase the supersaturation, nucleate a greater number of cloud particles from the aerosol population and condense more water. The particle size distributions (Fig. 11) for cloud (CDP) and small drizzle (2DS) from both platforms exhibit similar shapes at all sizes given the demonstrated magnitudes of the uncertainties. The NASA 2DS reports slightly larger concentrations of particles larger than 40 µm, possibly due to the enhanced updraughts encountered. To investigate the impact of this the derived metrics of the PSD are computed with the data from the strongest updraughts removed – chosen to be above a threshold of 2 m s−1, as this was seldom encountered by FAAM. Away from strong updraughts the NASA mean NC is 253±137 cm−3, which is closer to the values reported by FAAM.
Derived size metrics count median diameter, Re and Rv were similar across the two platforms; again when the data from within the strong updraught are excluded the agreement is improved (Table 6). FAAM employed bulk-water-corrected bin diameters, but the magnitude of differences between those and nominal bins is less than 5 %, especially at diameters close to the mode of the PSD. Re is identical away from strong updraughts as sampled by the CDPs, at 7.0 µm, with Rv also very similar: 7.7 µm (NASA) and 7.8 µm (FAAM).
LWCs are also very similar away from strong updraughts, at 0.24±0.15 g m−3 (NASA) and 0.23±0.15 g m−3 (FAAM). The 75th, 90th and 99th percentiles of the distribution are also broadly similar, whereas the LWC from locations including the updraught passage has a higher mean and 99th percentile values over 2.0 g m−3. Additional LWC data come from the hot-wire probes. The FAAM Nevzorov reported 0.23±0.16 g m−3, and while this is very similar to the FAAM CDP, recall that these data were used to effectively baseline the CDP calibration (Sect. S3). Excluding data during strong updraughts, data from the NASA King probe are low in comparison at 0.12±0.10 g m−3. The expected uncertainty range for these evaporative probes according to Baumgardner et al. (2017) is between 10 % and 30 %. The FAAM Nevzorov LWC compares well with LWC derived from the optical probes on the NASA aircraft, but the NASA King probe exhibits a low bias. This may be due to a different size-dependent collection efficiency or inadequate baseline removal (e.g. Abel et al., 2014).
5.1 Air mass determination
The magnitude of the differences in CO measurements between platforms does not preclude robust identification of pollution regimes within the South Atlantic region (Wu et al., 2020; Gupta et al., 2021), although the most polluted conditions encountered during biomass burning season were not sampled during the intercomparisons. For August 2017 at Ascension Island the vast majority of CO concentrations were between 50 and 150 ppb, although during August 2016 there were multiple days where CO concentrations above 150 ppb and as much as 200 ppb were observed at the ARM site (Zhang and Zuidema 2019). ORACLES 2016 generally operated within 10∘ of the coast between, 8 and 24∘ S, and encountered CO concentrations between 60 and 500 ppb (Shinozuka et al., 2020), although concentrations of CO in the planetary boundary layer rarely exceeded 120 ppb (Diamond et al., 2018). Outside the BBA season, between December 2016 and April 2017, conditions observed at the LASIC ARM site had a median value of 59 ppb and an IQR of 55 to 65 ppb (Pennypacker et al., 2020), similar to pristine oceanic conditions in the Southern Hemisphere that have previously been observed (between 50 and 60 ppb; Allen et al., 2008, 2011). Ultraclean days were also observed during the BBA season (typified by NA<50 cm−3), which corresponded to median CO concentrations of 69 ppb and an IQR of 62 to 74 ppb (Pennypacker et al., 2020), with Abel et al. (2020) observing 70 ppb in the vicinity of pockets-of-open-cells convection during BBA season.
5.2 Aerosol chemical composition
Comparisons between the two airborne AMS instruments are generally within 1 standard deviation for ammonium and nitrate and within the 30 % to 37 % quoted uncertainty in the NASA P3 AMS. NASA P3 reported more sulfate, and FAAM BAe-146 reported a greater mass of organics. Differences may arise from low magnitudes of material or differences between retrieval algorithms, collection efficiencies within the AMS instruments or relative ionisation efficiencies of the chemical components. These differences, detailed further below, were not able to explain the differences in the sulfate masses, ultimately leading to the conclusion that the two instruments can be meaningfully compared.
Limits of detection were found to be material-specific using ORACLES 2016 flight data (Dobracki et al., 2022). However, during the intercomparison the mass concentrations were well above those limits, aside from some of the individual mass fragments of organics, for which mass concentrations were close to their 0.15 µg m−3 limit of detection.
To explore any potential effect of using different post-analysis algorithms, data from the NASA P3 high-resolution AMS were also analysed using the SQUIRREL algorithm used by the FAAM BAe-146 AMS. This demonstrated that the different algorithms can account for only 7 % of the difference (Dobracki et al., 2022). Relative ionisation efficiency (RIE) characterisation could account for only minimal differences between instruments. Calibrations performed on the FAAM BAe-146 instrument resulted in changes to the RIE coefficients for ammonium of less than 2 % and for sulfate of 10 %. Further information is to be found in the Supplement (Sect. S4).
Another possible source of the difference lies in the application of collection efficiencies. Liquid, primarily acidic, aerosols are collected more efficiently than neutralised particles (Dobracki et al., 2022). Collection efficiency values were set at 0.5 for each airborne AMS, since the aerosol was shown to be sufficiently neutralised in the free troposphere for the ORACLES dataset (Dobracki et al., 2022) and for both the boundary layer and free troposphere for the CLARIFY dataset (Fig. S3).
The source of the nitrate in this region may be either ammonium nitrate or organic in nature (Dobracki et al., 2022). This can be explored to some extent by considering the ratio of NO+ ( 30) to NO ( 46), given the observations of Farmer et al. (2010). However, given the low concentrations of nitrate within the boundary layer, large uncertainties in the ratio of 30 to 46 are expected. Considering the uncertainties can exceed 50 % for the values and 75 % for the fractional values, with larger errors in NASA P3 data in this instance, the measurements of the ratio are comparable (Table 5).
Ammonium nitrate is semi-volatile under atmospheric conditions, and to investigate this a model of evaporation of aerosols to the gas phase was developed after Dassios and Pandis (1999) was run for a range of atmospheric conditions and a sample temperature of 30 ∘C and a sample residence time of 2 s. This showed that the worst-case-scenario losses of aerosol mass to the gas were 7 %, assuming unity accommodation coefficient, instantaneous heating upon sample collection and a single aerosol component. Pressure and relative humidity exerted much weaker controls (<2 %). Sample residence times may well be longer on the aircraft, but the uncertainty is related to the differences between the sampling set-ups on the aircraft rather than absolute values, which also reduces the impact of this on the comparisons.
Uncertainty in OA mass concentrations stems from the determination of organic nitrates, with greater mass of OA reported by BAe-146. By assessing the magnitude of the contributions of mass fragments 30 (NO+) and 46 (NO it is possible to assess the balance of organic to inorganic nitrates. During the airborne intercomparison nitrate concentrations were low and close to the FAAM limit of detection. While it is possible to compute and compare values for the ratio of f30 to f46 it is not clear that in these circumstances that would be particularly instructive given the low total nitrate mass.
Useful analysis of chemical composition takes place when derived quantities are computed, for example to give information of the age state of a polluted air parcel. For example, in the Ascension Island region the BB OA is highly oxidised and of low volatility, suggesting it is well aged (Wu et al., 2020; Dang et al., 2022). Closer to the coast, where ORACLES 2017 operated, the aerosol might be expected to be younger. For OA fragment markers, the f44 compares well between two aircraft measurements, and the f43 is within 1 standard deviation. The difference in f43 may arise from the low magnitude as the BB OA is highly oxidised in the Ascension Island region, and the fraction of hydrocarbon-like OA is low. Good performance of the OA fragment markers (e.g. f44 and f43) between the two instruments and similarity between calibrated values suggest that the CLARIFY and ORACLES datasets should be useful in determination of the chemical age of biomass burning products.
Insight into the conditions at the time of combustion can be gleaned from ratios BCCO and OACO, where ΔCO is the difference from the background concentration in the boundary layer of (from CLARIFY data) COback=66 ppb (Wu et al., 2020). CLARIFY observations of BCCO were indicative of flaming combustion in both the free troposphere and similar in the boundary layer, with perhaps some inefficient cloud processing (Wu et al., 2020). The 50 % difference between FAAM and NASA BC mass concentrations (likely due to an SP2 leak; Sect. 2.4.1) drives discrepancies in BCCO, where FAAM =14 ng µg−1 and NASA between 5 and 7 ng µg−1. Accounting for the CO bias makes the comparison worse. Despite this, the width of the range representative of flaming combustion is such that conclusions on combustion type would be the same for each platform. For the six measurements available from the FAAM–LASIC comparison, the results are more comparable with FAAM =10.6 ng µg−1 and LASIC =10.3 ng µg−1.
Comparisons of OACO yield 0.96 µg µg−1 (FAAM) and 0.92 µg µg−1 (NASA). The positive biases in OA and CO measurements reported by NASA P3 compared to FAAM BAe-146 combine favourably, although note that the numbers reported here rely on only the CLARIFY CO values.
The comparison between the FAAM BAe-146 AMS and the LASIC ARM site ACSM is poor. There is a difference of a factor of between 3 and 4.5 between individual species mass concentrations, with the larger magnitudes observed at the ARM site. The cause of this is unknown. To investigate LASIC ACSM, data points from 30 min either side of the valid time were looked at and the resultant range compared to the FAAM AMS data. This did not result in better agreement. Unlike the airborne AMS collection efficiencies of 0.5, at the time of the comparison all LASIC data points had composition-dependent collection efficiencies of unity, although adjacent time sometimes had values below 1.0. The slight difference in quoted upper cut diameters of 600 nm (FAAM) and 700 nm (LASIC) does not explain these differences. The unexplained differences would benefit from further investigation.
5.3 Aerosol physical properties
During the airborne intercomparison PSDs in the accumulation mode compared well between airborne PCASPs and the UHSAS once the evaporation of absorbing particles due to the high laser power was accounted for (Howell et al., 2021). Individual studies will be required to assess the probe response to the particular RI of aerosols encountered (e.g. Peers et al., 2019) and to conduct optical closure studies with radiometric measurements. It was shown by Peers et al. (2019) that aerosols were effectively sampled by FAAM in the optically active region of the accumulation mode, which fell between 0.3 and 0.5 µm diameter (77 % of extinction).
The external PCASPs were able to distinguish between particle number size distributions in the vertically elevated pollution plume and the cleaner surrounding free troposphere. Here the performance of the NASA PCASP is more similar to the FAAM PCASP2. The accumulation mode at runFT is less well defined, and Poisson counting uncertainty is large at sizes greater than 0.5 µm. The presence of a coarse mode in the vertically elevated pollution layer fits with back trajectory calculations, which had the air parcel history over the African continent (not shown). This is consistent with similar conditions during ORACLES 2016, where back trajectories showed polluted above-cloud air masses (Gupta et al., 2021). The volume size distribution was not well sampled in the vertically elevated pollution plume, where the CDP sample volume is crucial to measurement of the coarse mode but suffers from a small sample volume, and the sampling time in this case was short.
A coarse mode of marine aerosols was observed in the boundary layer and captured by PCASPs, the FAAM CDP and 2DS probes. The source of the discrepancy between the response of PCASP probes at larger diameters above 2 µm is unknown, but the inlet sampling efficiency of large particles, low concentrations, inlet jet alignment and possibly instrument RH differences may all contribute. The CDP cross-over with PCASPs is poor, and large errors exist from low counting statistics at larger sizes and correspond to the region where 2DS sample volume uncertainties are largest, although the cross-over is good, as is comparison between 2DS probes from NASA and FAAM. Sampling the coarse mode and being able to account for its scattering is important for optical studies. At larger sizes >600 nm the aerosol composition will not contain a large amount of BBA (e.g. Wu et al., 2020) and likely consists of purely optically scattering hydrated salts, meaning comparison with probes such as CDP and OAPs is therefore likely to be more valid.
Observations of PSDs generally agreed between LASIC and FAAM, when considering the scaled FAAM SMPS data and either the external PCASP2 or internal PCASP3 with calibrated bin boundaries corrected to an appropriate RI for BBA. Condensation particle number concentrations were slightly lower for the LASIC dataset. The mean ratio of bin concentrations for sizes smaller than 600 nm (BBA RI-corrected) between PCASP2 and PCASP3 was close to unity, although individual flights saw differences for the larger sizes up to 30 % (average of 14 %).
5.4 Aerosol optical properties
Observations of σAP from FAAM and NASA agree within instrumental uncertainties given the low magnitude of the signal and short averaging time. Likewise, there is comparability between FAAM and LASIC for observations of σAP, to better than 2 % or 0.55 Mm−1 for the LASIC PSAP. Additional data from the CAPS PMSSA probe support the observations and suggest no inherent bias between the ground and airborne measurements or from filter correction schemes. This study does not attempt to replicate previous work considering filter-based correction schemes such as Davies et al. (2019). Instead, it compares the data as published by each group. NASA data were based on the Virkkula (2010) wavelength-averaged scheme for comparability with other studies (e.g. Pistone et al., 2019) and the LASIC data using an average of the absorption calculated using the correction schemes from Virkkula (2010; wavelength-averaged) and Ogren (2010).
Aerosol ω0 and ÅAP are two important climate-relevant parameters that are derived from observations of aerosol optical properties (e.g. Sherman and McComiskey, 2018). ÅAP was compared between the two aircraft and against the CLARIFY campaign mean (Taylor et al., 2020). The trend of larger ÅAP at shorter mean wavelength is apparent in all airborne datasets, including filter-based retrievals. The data from the LASIC ARM site show different behaviour for the three comparison segments under consideration, with similar or slightly lower values (accounting for uncertainties) of ÅAP for shorter mean wavelength. Zuidema et al. (2018a) noted spectrally flat behaviour for the 2016 BBA season based on LASIC ARM measurements. The range of values encountered for the blue–green pair during the season was large during the BBA season of 2016, with extreme values smaller than 0.8 and greater than 1.4 (Zuidema et al., 2018a). The variability during that year is not expected to be unusual, and so the range of values encountered during these short intercomparison segments may just reflect this natural variability. The short sample time may not be sufficient to capture that variability.
Campaign-mean ω0 comparisons have been discussed elsewhere for the CLARIFY and LASIC campaigns, with Wu et al. (2020) noting that the measurements collected at the ARM site were lower than the measurements made on board the FAAM BAe-146, especially at longer wavelengths. Airborne ω0 measurements made in the free troposphere during ORACLES 2016 (Pistone et al., 2019) were shown to be slightly larger than those made by CLARIFY (Wu et al., 2020). While both ORACLES and LASIC used filter-based absorption in the computation of ω0, in this instance the filter correction schemes are not thought to be the dominant source of uncertainty (Haywood et al., 2021). Rather, the differences between measurements of scattering (or extinction) coefficients are the likely source of discrepancies in ω0.
5.5 Inlets and particle transmission
Here we consider the effects of inlet systems, internal pipe work and sampling system components such as impactors on the comparisons.
Transmission of a representative sample of aerosol particles into an aircraft while flying at high speed is challenging. The NASA P3 SDI has been well characterised and is expected to have a transmission function approaching unity for submicron aerosols: differences between this and other inlets were shown to be below 16 % (McNaughton et al., 2007). Likewise, the Rosemount inlets employed on FAAM have been shown to transmit with a function reasonably close to unity for submicron particles (Trembath et al., 2012), although these inlets are less well characterised than the SDI.
The starboard side of the BAe-146 within the vicinity of the Rosemount inlets for EXSCALABAR and SP2 is aerodynamically clean, with no barriers to the airflow. Close correspondence was observed between FAAM BAe-146 and NASA P3 data for σAP and submicron σSP. There is support from LASIC σAP data, which follow the FAAM measurements very closely, but not from LASIC σSP measurements, which are much lower than those from FAAM. However, LASIC BCn is within 20 % of FAAM and BCm within 10 %, both lower. BC measurements were much lower from NASA than FAAM, although a leak was identified at other times, which possibly also affected the data collected during the intercomparison period. From observations presented here it seems reasonable to conclude that the starboard-mounted Rosemount inlets adequately sample submicron aerosols.
The BAe-146 port-side Rosemount inlets are potentially compromised by the large-radiometer blister pod. CN number concentrations from FAAM and NASA are within 10 %. However, LASIC CN number concentrations are approximately 80 %, lower than FAAM. This ratio is similar to the ratios between BC measurements and suggestive of a small systematic effect. AMS data from the two aircraft showed generally good agreement within uncertainties, and some differences were accounted for through CE and RIE. Organic aerosols have been shown to be contained in particles smaller than 0.4 µm (Wu et al., 2020), and it is here that the largest difference between FAAM and NASA data occur – with FAAM reporting 40 % greater mass concentrations. The AMS data (biased to larger particles with greater mass) and CN concentrations (biased to smaller particles with greater number) are not suggestive of particle shadowing by the BAe-146 blister pod.
The FAAM SMPS measured aerosol PSDs behind a port-side Rosemount inlet, and data from the six LASIC fly-past segments mostly compare well with the LASIC SMPS and FAAM PCASP2 and PCASP3. There are differences, although they do not appear to be systematic but vary day to day, with concentrations larger in either the accumulation or Aitken modes from the FAAM SMPS compared the one at LASIC. It is noted that there is agreement in the overlap region on all 6 d between the LASIC SMPS and the externally mounted FAAM PCASP2 and the internally mounted FAAM PCASP3. During CLARIFY as a whole, agreement between the FAAM SMPS and the FAAM PCASPs was demonstrated in the cross-over region (Wu et al., 2020). Externally mounted PCASPs on FAAM BAe-146 and NASA P3 also show close agreement, along with the internally mounted NASA UHSAS, once corrected for particle heating and evaporation, although it is important for individual studies to pay attention to composition-dependent collection efficiencies.
Overall, there are no observable biases introduced into the datasets by sampling submicron aerosols through Rosemount inlets on either the aerodynamically clean starboard side of the FAAM BAe-146 or the port side, which supports the blister pod. This study does not have sufficient data to conclusively answer questions relating to the size-dependent collection efficiencies of Rosemount inlets in various locations on the FAAM BAe-146 platform (a task begun by Trembath et al., 2012, and Trembath, 2013). Should better precision be required than that shown here, then an additional study involving detailed flow modelling will likely be required.
Differences between the platforms may result from transmission losses within internal plumbing. Careful design of flow paths within pipe work can mitigate against some of the potential losses of aerosol particles. Sample line losses can then be modelled, for example Baron (2001). Aerosol particle data from FAAM EXSCALABAR were corrected for measured sample line losses. Transmission losses of aerosols in the submicron range from the NASA P3 SDI to the AMS are demonstrated to be lower than 20 % as an average for the ORACLES campaign, although this is not explicitly accounted for when calculating concentrations (Dobracki et al., 2022). Similar losses are to be expected for other internal FAAM instruments, where concentrations were not corrected for line losses.
Differences remain between the LASIC ARM site and FAAM BAe-146 σSP observations. The BAe-146 EXSCALABAR sampled downstream of a 1.3 µm aerodynamic diameter impactor (Taylor et al., 2020), and the LASIC ARM site employed a 1.0 µm aerodynamic impactor upstream of instruments. Assuming the density of the sampled material to be 1.6 kg m−3 (the mid-point of the range given in Levin et al., 2010, to two significant figures), the FAAM impactor has a physical cut size diameter of approximately 1.0 µm, to within 3 % (computed using AeroCalc; Baron, 2001). Ammonium sulfate, having only a slightly higher density (1.77 kg m−3), therefore has a similar cut size. For the LASIC ARM site impactor, the physical cut size diameter (assuming spherical particles) is 0.78 µm.
Scattering by coarse mode particles was observed by the NASA nephelometer, when not sampling behind its impactor. Since the small end of the coarse mode very probably extends to diameters less than 1.0 µm, these submicron coarse mode particles are likely to contribute more to the extinction measured behind the EXSCALABAR impactor than the scattering measured behind the LASIC impactor. Thus, differences between σSP (and subsequently ω0) from LASIC and FAAM may stem from this difference in the upper cut size of the impactors, especially where marine boundary layer aerosols are present. However, closer agreement between NASA and FAAM was demonstrated for σSP when NASA also operated behind a nominal 1.0 µm aerodynamic diameter impactor. This may be a fortuitous result of the conditions encountered during the airborne intercomparison. It would have been beneficial to use the impactors with the same cut size for the different campaigns being compared. Caution should be taken when comparing scattering measurements and derived parameters across these campaigns. This might take the form of detailed optical modelling and closure with radiation measurements.
5.6 Atmospheric radiation
In cloud-free skies over ocean, where the surface reflectance is relatively well known, the direct radiative effect can be inferred simply from measurements of the upwelling-integrated solar irradiance and the spectral solar irradiance (e.g. Haywood et al., 2003). However, this does not constitute radiative closure because the additional upwelling flux from the aerosol layer is a convolution of the aerosol optical depth, the backscattered fraction and the degree of absorption of the aerosol, and the solutions are therefore non-unique. Among other studies, Haywood et al. (2011) and Cochrane et al. (2019) demonstrated that measurements of both the upwelling and downwelling integrated irradiances are needed if a unique solution relating the aerosol physical and optical properties unambiguously to the upwelling and downwelling solar irradiances is to be achieved. In cloudy skies, where the reflectance from clouds varies far more than the reflectance from the well-characterised sea surface, it is even more important to understand the accuracy and variability in the upwelling spectral irradiances if radiative closure is to be achieved.
For downwelling irradiances, the agreement in the radiometric measurements appears to be better under diffuse sunlight conditions than during direct illumination conditions. This may be due to inaccuracies in the pitch and roll correction for the SHIMS instrument, which requires an accurate partitioning between the pitch- and roll-corrected direct irradiance and the non-pitch- and non-roll-corrected diffuse irradiance (see Jones et al., 2018). Other factors such as the directional sensitivity of the two instruments and the non-perfect cosine response could also be factors in why there are more significant differences between the measurements when the instruments are subject to direct illumination. Nevertheless, given the need to apply an adjustment to the SHIMS instrument calibration based on the BBR and radiative transfer (Sect. S1 in the Supplement) and uncertainty estimates as high as 10 %, the agreement in the spectral irradiances (within 2 % for all cases) is gratifying. This suggests that data from the instruments can be used for scientific purposes such as assessing the impact of aerosols on the spectral irradiances.
For upwelling irradiances, which benefitted from a reliable red-dome Eppley radiometer measurement (Sect. S1 in the Supplement), the agreement between the measurements from SHIMS and SSFR is within 1 W m−2 (or 5 %).
The general agreement between the instrumentation lends confidence to the measurements, and the uncertainties in the measurements are small enough to suggest that radiative closure studies may be pursued using either the instrumentation on the BAe-146 or P3 platforms.
Generally, intercomparison of radiation measurements made by the LASIC ARM site was hampered by the frequent occurrence of orographically generated cloud, which is a persistent feature over Ascension Island.
Central to the purpose of the overlapping field campaigns CLARIFY, ORACLES and LASIC was to provide combined datasets with which to undertake process studies and model evaluation work assessing the impact of biomass burning aerosols on climate. These datasets are distributed in space, being close to the coast of southern Africa, or in the far field, and in time, across 3 years, as well as from early or later in the biomass burning season. Broad comparability between the measurements made during the CLARIFY, ORACLES and LASIC field experiments has been demonstrated. This gives confidence in any studies of the spatial and temporal evolution in parameters using combined datasets.
Temperature, humidity and concentrations of CO were found to compare well enough to be able to confidently categorise air masses by their pollution state and air mass history. This is important when using data from multiple regions, seasons and periods. There were differences in CO that would benefit from further investigation. Black carbon, another pollution tracer, compared well between CLARIFY and LASIC, but NASA data were compromised during the intercomparison. Particle number concentrations, condensation nuclei and the particle size distributions of submicron aerosols are comparable between all three field campaigns. There are larger differences between probes on a single platform than between two independent platforms, suggesting that platform-specific aspects such as mounting location, aircraft angle of attack and other specifics of installation do not result in significant biases to the sampling of accumulation mode aerosols.
Absorption coefficient measurements are comparable across all three platforms, although magnitudes of σAp were low during the airborne intercomparison. The wavelength dependence of absorption, characterised by ÅAP, followed similar trends for both airborne platforms and indicated an increasing absorption coefficient at shorter visible wavelengths. Conversely, observations from the LASIC ARM site show a reduction in absorption at shorter wavelengths. This may be a consequence of limited sampling time or potentially size-dependent sampling. The low absorption coefficient magnitude prevented study of the ω0, and so caution must be exercised when combining data from multiple platforms. Submicron measurements of σSP are similar between the FAAM BAe-146 and the NASA P3, suggesting that derived values of ω0 can be trusted when larger amounts of material are present. LASIC and FAAM showed that the scattering measurements at the ARM site were of much lower magnitude than those on board the BAe-146 and that the comparison was worse at the longer red wavelength.
Composition observations are in general agreement between ORACLES and CLARIFY, leading to the conclusion that study of the evolution of the BBA plume as it advects away from the coast is possible using a combined dataset from both campaigns. The masses of chemical components at the LASIC ARM site were much larger than those reported by CLARIFY, in contrast to observations such as concentrations of condensation nuclei and black carbon particles, which tended to be ∼20 % lower, and black carbon mass concentrations, which were 10 % lower. The cause of the greater masses recorded at the ARM site is unknown, and so caution is recommended when interpreting these datasets.
Previous work has shown that the FAAM SHIMS radiometer requires a bias correction to FAAM BBRs of ∼30 %. Once this is applied, there is good agreement with the comparable measurements made by the P3 SSFR instrument. Comparable observations of the aerosol PSDs permit radiometric closure studies to be undertaken.
Observations of cloud particles were comparable between ORACLES and CLARIFY.
Further work is needed to characterise inlet systems on aircraft and at ground-based facilities, including improvements in understanding airflow around airframes, size-dependent particle transmission and characterisations of the RH within sampling lines.
Processing code for the FAAM core measurements suite is available from GitHub (Sproson et al., 2020).
Airborne data for the CLARIFY campaign are available from the Centre for Environmental Data Analysis (Facility for Airborne Atmospheric Measurements et al., 2017) and for the ORACLES campaign from NASA Earth Science Project Office (ORACLES Science Team, 2020). The LASIC ground-based data sets are publicly available from the Atmospheric Radiation Measurement Climate Research Facility (Zuidema et al., 2017) with specialist data sets available for the following:
-
SP2 – https://iop.archive.arm.gov/arm-iop/2016/ (last access: 25 October 2022, Sedlacek, 2017),
-
CO – https://doi.org/10.5439/1046183 (Springston, 2018b),
-
CAPS PMSSA – https://adc.arm.gov/discovery/#/results/s::caps-ssa (Onasch et al., 2015),
-
ACSM – https://doi.org/10.5439/1763029 (Zawadowicz and Howie, 2021).
The supplement related to this article is available online at: https://doi.org/10.5194/amt-15-6329-2022-supplement.
SJA, PAB, JH, JR, GMM, RW and PZ developed the concept and scope and designed the flights and ARM site intercomparison data collection. PAB analysed the data and wrote the initial manuscript with contributions from SJA, HuC, IC, AD, SH, AJ, JL, GN, HP, YS, KS, JWT, HW and PZ. All authors performed instrument or data work for one or more instruments or systems on one or more platforms. All authors reviewed the manuscript.
At least one of the (co-)authors is a guest member of the editorial board of Atmospheric Measurement Techniques for the special issue “New observations and related modelling studies of the aerosol–cloud–climate system in the Southeast Atlantic and southern Africa regions (ACP/AMT inter-journal SI)”. The peer-review process was guided by an independent editor, and the authors also have no other competing interests to declare.
Publisher's note: Copernicus Publications remains neutral with regard to jurisdictional claims in published maps and institutional affiliations.
This article is part of the special issue “New observations and related modelling studies of the aerosol–cloud–climate system in the Southeast Atlantic and southern Africa regions (ACP/AMT inter-journal SI)”. It is not associated with a conference.
Airborne data were obtained using the BAe-146-301 Atmospheric Research Aircraft flown by Airtask Ltd and managed by FAAM Airborne Laboratory, jointly operated by UKRI and the University of Leeds along with the Lockheed P-3 Orion (N426NA) operated by NASA Goddard Space Flight Center's Wallops Flight Facility Aircraft Office. Data were obtained from the Atmospheric Radiation Measurement (ARM) user facility, a US Department of Energy (DOE) Office of Science user facility managed by the Biological and Environmental Research programme. We thank David Sproson (FAAM) for reprocessing the FAAM BAe-146 datasets with the latest version of the decades-ppandas processing codes.
We acknowledge the use of imagery from the NASA Worldview application (https://worldview.earthdata.nasa.gov/, last access: 21 February 2022), part of the NASA Earth Observing System Data and Information System (EOSDIS).
Hugh Coe, Ian Crawford, James Haywood, Anthony Jones, Jonathan W. Taylor, Huihui Wu, Keith Bower and Michael Cotterell were supported through the CLARIFY-2017 Natural Environment Research Council large grant proposal (grant nos. NE/L013797/1, NE/L013584/1, and NE/P013406/1). Nicholas Davies was supported by a NERC/Met Office Industrial Case studentship (grant no. 640052003). James Haywood, Anothony Jones and Michael Cotterell were also supported by the Research Council of Norway via the projects AC/BC (grant no. 240372) and NetBC (grant no. 244141). Paquita Zuidema and Jianhao Zhang were supported by the US Department of Energy, Office of Science (grant nos. DE-SC0018272 and DE-SC0021250), with Paquita Zuidema receiving further support from NASA EVS-2 ORACLES grant NNX15AF98G. Amie Dobracki was supported by grants DESC0018272 and NNX15AF98G. Sabrina Cochrane, Sebastian Schmidt and Hong Chen were supported by NASA (grant no. NNX15AF62G). Robert Wood was supported by NASA (grant no. NNX15AF96G-S13). Siddhant Gupta and Greg M. McFarquhar were supported by NASA (grant nos. 80NSSC18K0222, NNX15AF93G and NNX16A018H). Maria A. Zawadowicz was supported by the US Department of Energy Atmospheric Systems Research (ASR) programme under contract DE-SC0012704 to Brookhaven National Laboratory.
This paper was edited by Frank Eckardt and reviewed by two anonymous referees.
Abel, S. J., Cotton, R. J., Barrett, P. A., and Vance, A. K.: A comparison of ice water content measurement techniques on the FAAM BAe-146 aircraft, Atmos. Meas. Tech., 7, 3007–3022, https://doi.org/10.5194/amt-7-3007-2014, 2014.
Aiken, A. C., Decarlo, P. F., Kroll, J. H., Worsnop, D. R., Huffman, J. A., Docherty, K. S., Ulbrich, I. M., Mohr, C., Kimmel, J. R., Sueper, D., Sun, Y., Zhang, Q., Trimborn, A., Northway, M., Ziemann, P. J., Canagaratna, M. R., Onasch, T. B., Alfarra, M. R., Prevot, A. S. H., Dommen, J., Duplissy, J., Metzger, A., Baltensperger, U., and Jimenez, J. L.: and ratios of primary, secondary, and ambient organic aerosols with high resolution time-of-flight aerosol mass spectrometry, Environ. Sci. Technol., 42, 4478–4485, https://doi.org/10.1021/es703009q, 2008.
Alfarra, M. R., Prevôt, A. S. H., Szidat, S., Sandradewi, J., Weimer, S., Lanz, V. A., Schreiber, D., Mohr, M., and Baltensperger, U.: Identification of the mass spectral signature of organic aerosols from wood burning emissions, Environ. Sci. Technol., 41, 5770–5777, https://doi.org/10.1021/es062289b, 2007.
Allen, G., Vaughan, G., Bower, K. N., Williams, P. I., Crosier, J., Flynn, M., Connolly, P., Hamilton, J. F., Lee, J. D., Saxton, J. E., Watson, N. M., Gallagher, M., Coe, H., Allan, J., Choularton, T. W., and Lewis, A. C.: Aerosol and trace-gas measurements in the Darwin area during the wet season, J. Geophys. Res.-Atmos., 113, D23303, https://doi.org/10.1029/2007JD008706, 2008.
Allen, G., Coe, H., Clarke, A., Bretherton, C., Wood, R., Abel, S. J., Barrett, P., Brown, P., George, R., Freitag, S., McNaughton, C., Howell, S., Shank, L., Kapustin, V., Brekhovskikh, V., Kleinman, L., Lee, Y.-N., Springston, S., Toniazzo, T., Krejci, R., Fochesatto, J., Shaw, G., Krecl, P., Brooks, B., McMeeking, G., Bower, K. N., Williams, P. I., Crosier, J., Crawford, I., Connolly, P., Allan, J. D., Covert, D., Bandy, A. R., Russell, L. M., Trembath, J., Bart, M., McQuaid, J. B., Wang, J., and Chand, D.: South East Pacific atmospheric composition and variability sampled along 20∘ S during VOCALS-REx, Atmos. Chem. Phys., 11, 5237–5262, https://doi.org/10.5194/acp-11-5237-2011, 2011.
Allan, J. D., Jimenez, J. L., Williams, P. I., Alfarra, M. R., Bower, K. N., Jayne, J. T., Coe, H., and Worsnop, D. R.: Quantitative sampling using an Aerodyne aerosol mass spectrometer 1. Techniques of data interpretation and error analysis, J. Geophys. Res., 108, 4090, https://doi.org/10.1029/2002JD002358, 2003.
Allan, J. D., Delia, A. E., Coe, H., Bower, K. N., Alfarra, M. R., Jimenez, J. L., Middlebrook, A. M., Drewnick, F., Onasch, T. B., Canagaratna, M. R., Jayne, J. T., and Worsnop, D. R.: A generalised method for the extraction of chemically resolved mass spectra from Aerodyne aerosol mass spectrometer data, J. Aerosol Sci., 35, 909–922, https://doi.org/10.1016/j.jaerosci.2004.02.007, 2004.
Anderson, T. L. and Ogren, J. A.: Determining aerosol radiative properties using the TSI 3563 integrating nephelometer, Aerosol Sci. Tech., 29, 57–69, https://doi.org/10.1080/02786829808965551, 1998.
Bahreini, R., Ervens, B., Middlebrook, A. M., Warneke, C., de Gouw, J. A., DeCarlo, P. F., Jimenez, J. L., Atlas, E., Brioude, J., Brock, C. A., Fried, A., Holloway, J. S., Peischl, J., Richter D., Ryerson, T. B., Stark, H., Walega, J., Weibring, P., Wollny, A. G., and Fehsenfeld, F. C.: Organic aerosol formation in urban and industrial plumes near Houston and Dallas, TX, J. Geophys. Res.-Atmos., 114, D00F16, https://doi.org/10.1029/2008JD011493, 2009.
Baron, P.: Aerosol Calculator AeroCalc_2001_1, [code], https://www.tsi.com/getmedia/540a30fa-8444-49f6-814f-891495c70aa1/Aerocalc2001_1 (last access: October 2022), 2001.
Barrett, P. A., Blyth, A., Brown, P. R. A., and Abel, S. J.: The structure of turbulence and mixed-phase cloud microphysics in a highly supercooled altocumulus cloud, Atmos. Chem. Phys., 20, 1921–1939, https://doi.org/10.5194/acp-20-1921-2020, 2020.
Baumgardner, D., Abel, S. J., Axisa, D., Cotton, R., Crosier, J., Field, P., Gurganus, C., Heymsfield, A., Korolev, A., Krämer, M., Lawson, P., McFarquhar, G., Ulanowski, Z., and Um, J.: Cloud Ice Properties: In situ measurement challenges, Meteor. Mon., 58, 9.1–9.23, https://doi.org/10.1175/AMSMONOGRAPHS-D-16-0011.1, 2017.
Chuang, P. Y., Saw, E. W., Small, J. D., Shaw, R. A., Sipperley, C. M., Payne, G. A., and Bachalo, W. D.: Airborne phase doppler interferometry for cloud microphysical measurements, Aero. Sci. Tech. 42, 8, https://doi.org/10.1080/02786820802232956, 2008.
Cochrane, S. P., Schmidt, K. S., Chen, H., Pilewskie, P., Kittelman, S., Redemann, J., LeBlanc, S., Pistone, K., Kacenelenbogen, M., Segal Rozenhaimer, M., Shinozuka, Y., Flynn, C., Platnick, S., Meyer, K., Ferrare, R., Burton, S., Hostetler, C., Howell, S., Freitag, S., Dobracki, A., and Doherty, S.: Above-cloud aerosol radiative effects based on ORACLES 2016 and ORACLES 2017 aircraft experiments, Atmos. Meas. Tech., 12, 6505–6528, https://doi.org/10.5194/amt-12-6505-2019, 2019.
Cochrane, S. P., Schmidt, K. S., Chen, H., Pilewskie, P., Kittelman, S., Redemann, J., LeBlanc, S., Pistone, K., Kacenelenbogen, M., Segal Rozenhaimer, M., Shinozuka, Y., Flynn, C., Dobracki, A., Zuidema, P., Howell, S., Freitag, S., and Doherty, S.: Empirically derived parameterizations of the direct aerosol radiative effect based on ORACLES aircraft observations, Atmos. Meas. Tech., 14, 567–593, https://doi.org/10.5194/amt-14-567-2021, 2021.
Cotterell, M. I., Ward, G. P, Hibbins, A. P., Haywood, J. M., Wilson, A., and Langridge, J. K.: Optimizing the performance of aerosol photoacoustic cells using a finite element model. Part 1: Method and application to single-resonator multipass cells, Aero. Sci. Tech, 53, 1107–1127, https://doi.org/10.1080/02786826.2019.1650161, 2019a.
Cotterell, M. I., Ward, G. P, Hibbins, A. P., Wilson, A., Haywood, J. M., and Langridge, J. K.: Optimizing the performance of aerosol photoacoustic cells using a finite element model. Part 2: Application to a two resonator cell, Aero. Sci. Tech, 53, 1128–1148, https://doi.org/10.1080/02786826.2019.1648749, 2019b.
Cotterell, M. I., Szpek, K., Haywood, J. M., and Langridge, J. M.: Sensitivity and accuracy of refractive index retrievals from measured extinction and absorption cross sections for mobility-selected internally mixed light absorbing aerosols, Aero. Sci. Tech., 54, 1034–1057, https://doi.org/10.1080/02786826.2020.1757034, 2020.
Cotterell, M. I., Szpek, K., Tiddeman, D., Haywood, J. M., and Langridge, J. M.: Photoacoustic studies of energy transfer from ozone photoproducts to bath gases following Chappuis band photoexcitation, Phys. Chem. Chem. Phys., 23, 536–553, https://doi.org/10.1039/D0CP05056C, 2021.
Crosier, J., Bower, K. N., Choularton, T. W., Westbrook, C. D., Connolly, P. J., Cui, Z. Q., Crawford, I. P., Capes, G. L., Coe, H., Dorsey, J. R., Williams, P. I., Illingworth, A. J., Gallagher, M. W., and Blyth, A. M.: Observations of ice multiplication in a weakly convective cell embedded in supercooled mid-level stratus, Atmos. Chem. Phys., 11, 257–273, https://doi.org/10.5194/acp-11-257-2011, 2011.
Dang, C., Segal-Rozenhaimer, M., Che, H., Zhang, L., Formenti, P., Taylor, J., Dobracki, A., Purdue, S., Wong, P.-S., Nenes, A., Sedlacek III, A., Coe, H., Redemann, J., Zuidema, P., Howell, S., and Haywood, J.: Biomass burning and marine aerosol processing over the southeast Atlantic Ocean: a TEM single-particle analysis, Atmos. Chem. Phys., 22, 9389–9412, https://doi.org/10.5194/acp-22-9389-2022, 2022.
Dassios, K. G. and Pandis, S. N.: The mass accommodation coefficient of ammonium nitrate aerosol, Atmos. Environ. 33, 2993–3003, https://doi.org/10.1016/S1352-2310(99)00079-5, 1999.
Davies, N. W., Cotterell, M. I., Fox, C., Szpek, K., Haywood, J. M., and Langridge, J. M.: On the accuracy of aerosol photoacoustic spectrometer calibrations using absorption by ozone, Atmos. Meas. Tech., 11, 2313–2324, https://doi.org/10.5194/amt-11-2313-2018, 2018a.
Davies, N. W.: The climate impacts of atmospheric aerosols using in-situ measurements, satellite retrievals and global climate model simulations PhD thesis, University of Exeter, http://hdl.handle.net/10871/34544 (last access: 24 October 2022), 2018b.
Davies, N. W., Fox, C., Szpek, K., Cotterell, M. I., Taylor, J. W., Allan, J. D., Williams, P. I., Trembath, J., Haywood, J. M., and Langridge, J. M.: Evaluating biases in filter-based aerosol absorption measurements using photoacoustic spectroscopy, Atmos. Meas. Tech., 12, 3417–3434, https://doi.org/10.5194/amt-12-3417-2019, 2019.
DeCarlo, P. F., Kimmel, J. R., Trimborn, A., Northway, M. J., Jayne, J. T., Aiken, A. C., Gonin, M., Fuhrer, K., Horvath, T., Docherty, K. S., Worsnop, D. R., and Jimenez, J. L.: Field-deployable, high-resolution, time-of-flight aerosol mass spectrometer, Anal. Chem., 78, 24, https://doi.org/10.1021/ac061249n, 2006.
Diamond, M. S., Dobracki, A., Freitag, S., Small Griswold, J. D., Heikkila, A., Howell, S. G., Kacarab, M. E., Podolske, J. R., Saide, P. E., and Wood, R.: Time-dependent entrainment of smoke presents an observational challenge for assessing aerosol–cloud interactions over the southeast Atlantic Ocean, Atmos. Chem. Phys., 18, 14623–14636, https://doi.org/10.5194/acp-18-14623-2018, 2018.
Diamond, M. S., Saide, P. E., Zuidema, P., Ackerman, A. S., Doherty, S. J., Fridlind, A. M., Gordon, H., Howes, C., Kazil, J., Yamaguchi, T., Zhang, J., Feingold, G., and Wood, R.: Cloud adjustments from large-scale smoke–circulation interactions strongly modulate the southeastern Atlantic stratocumulus-to-cumulus transition, Atmos. Chem. Phys., 22, 12113–12151, https://doi.org/10.5194/acp-22-12113-2022, 2022.
DMT: Passive Cavity Aerosol Spectrometer Probe (PCASP-100X), Operator Manual DOC-0228, Rev C, https://www.dropletmeasurement.com/manual/operations-manual-passive-cavity, last access: 26 April 2021.
Dobracki, A., Zuidema, P., Howell, S., Saide, P., Freitag, S., Aiken, A. C., Burton, S. P., Sedlacek III, A. J., Redemann, J., and Wood, R.: An attribution of the low single-scattering albedo of biomass-burning aerosol over the southeast Atlantic, Atmos. Chem. Phys. Discuss. [preprint], https://doi.org/10.5194/acp-2022-501, in review, 2022.
Drewnick, F., Hings, S. S., DeCarlo, P., Jayne, J. T., Gonin, M., Fuhrer, K., Weimer, S., Jimenez, J. L., Demerjian, K. L., Borrmann, S., and Worsnop, D. R.: A new Time-of-Flight Aerosol Mass Spectrometer (TOF-AMS)—Instrument description and first field deployment, Aerosol Sci. Tech., 39, 637–658, https://doi.org/10.1080/02786820500182040, 2005.
Facility for Airborne Atmospheric Measurements, Natural Environment Research Council, and Met Office: FAAM C031 CLARIFY flight: Airborne atmospheric measurements from core instrument suite on board the BAe-146 aircraft, Centre for Environmental Data Analysis [data set], https://catalogue.ceda.ac.uk/uuid/a070273597ab45619bbc4241d722bf61 (last access: 25 November 2021), 2017.
Farmer, D. K., Matsunaga, A., Docherty, K. S., Surratt, J. D., Seinfeld, J. H., Ziemann, P. J., and Jimenez, J. L.: Response of an aerosol mass spectrometer to organonitrates and organosulfates and implications for atmospheric chemistry, Proc. Natl. Acad. Sci. USA, 107, 6670–6675, https://doi.org/10.1073/pnas.0912340107, 2010.
Foot, J. S., Hignett, P., and Kilsby, C. G.: Investigation into errors associated with upward = facing pyranometers fitted to the Met Office, MRF Internal Notes 31, https://library.metoffice.gov.uk/Portal/Default/en-GB/RecordView/Index/649422# (last access: 24 October 2022), 1986.
Formenti, P., D'Anna, B., Flamant, C., Mallet, M., Piketh, S. J., Schepanski, K., Waquet, F., Auriol, F., Brogniez, G., Burnet, F., Chaboureau, J.-P., Chauvigné, A., Chazette, P., Denjean, C., Desboeufs, K., Doussin, J.-F., Elguindi, N., Feuerstein, S., Gaetani, M., Giorio, C., Klopper, D., Mallet, M. D., Nabat, P., Monod, A., Solmon, F., Namwoonde, A., Chikwililwa, C., Mushi, R., Welton, E. J., and Holben, B.: The Aerosols, Radiation and Clouds in Southern Africa Field Campaign in Namibia: Overview, illustrative observations, and way forward, B. Am. Meteorol. Soc., 100, 7, https://doi.org/10.1175/BAMS-D-17-0278.1, 2019.
Gerbig, C., Schmitgen, S., Kley, D., Volz-Thomas, A., Dewey, K., and Haaks, D.: An Improved Fast-Response Vacuum-UV Resonance Flouresence CO Instrument, J. Geophys. Res.-Atmos., 104, 1699–1704, https://doi.org/10.1029/1998JD100031, 1999.
Gupta, S., McFarquhar, G. M., O'Brien, J. R., Delene, D. J., Poellot, M. R., Dobracki, A., Podolske, J. R., Redemann, J., LeBlanc, S. E., Segal-Rozenhaimer, M., and Pistone, K.: Impact of the variability in vertical separation between biomass burning aerosols and marine stratocumulus on cloud microphysical properties over the Southeast Atlantic, Atmos. Chem. Phys., 21, 4615–4635, https://doi.org/10.5194/acp-21-4615-2021, 2021.
Gupta, S., McFarquhar, G. M., O'Brien, J. R., Poellot, M. R., Delene, D. J., Miller, R. M., and Small Griswold, J. D.: Factors affecting precipitation formation and precipitation susceptibility of marine stratocumulus with variable above- and below-cloud aerosol concentrations over the Southeast Atlantic, Atmos. Chem. Phys., 22, 2769–2793, https://doi.org/10.5194/acp-22-2769-2022, 2022.
Gysel, M., Laborde, M., Olfert, J. S., Subramanian, R., and Gröhn, A. J.: Effective density of Aquadag and fullerene soot black carbon reference materials used for SP2 calibration, Atmos. Meas. Tech., 4, 2851–2858, https://doi.org/10.5194/amt-4-2851-2011, 2011.
Haywood, J. M., Francis, P. N., Glew, M. D., and Taylor, J. P.: Optical properties and direct radiative effect of Saharan Dust: A case study of two Saharan dust outbreaks using aircraft data, J. Geophys. Res.-Atmos., 106, 18417–18428, https://doi.org/10.1029/2000JD900319, 2001.
Haywood, J. M., Francis, P., Osborne, S. R., Glew, M., Loeb, N., Highwood, E., Tanré, D., Myhre, G., Formenti, P., and Hirst, E.: Radiative properties and direct radiative effect of Saharan dust measured by the C-130 aircraft during SHADE: 1. Solar spectrum, J. Geophys. Res.-Atmos., 108, 8577, https://doi.org/10.1029/2002JD002687, 2003.
Haywood, J. M., Pelon, J., Formenti, P., Bharmal, N., Brooks, M., Capes, G., Chazette, P., Chou, C., Christopher, S., Coe, H., Cuesta, J., Derimian, Y., Desboeufs, K., Greed, G., Harrison, M., Heese, B., Highwood, E. J., Johnson, B., Mallet, M., Marticorena, B., Marsham, J., Milton, S., Myhre, G., Osborne, S. R., Parker, D. J., Rajot, J.-L., Schulz, M., Slingo, A., Tanré, D., and Tulet, P.: Overview of the Dust and Biomass burning Experiment and African Multidisciplinary Monsoon Analysis Special Observational Period-0, J. Geophys. Res.-Atmos., 113, D00C17, https://doi.org/10.1029/2008JD010077, 2008.
Haywood, J. M., Johnson, B. T., Osborne, S. R., Baran, A. J., Brooks, M., Milton, S. F., Mulcahy, J., Walters, D., Allan, R. P., Woodage, M. J., Klaver, A., Formenti, P., Brindley, H. E., Christopher, S., and Gupta, P.: Motivation, rationale and key results from the GERBILS Saharan dust measurement campaign, Q. J. R. Meteorol. Soc., 137, 1106–1116, https://doi.org/10.1002/qj.797, 2011.
Haywood, J. M., Abel, S. J., Barrett, P. A., Bellouin, N., Blyth, A., Bower, K. N., Brooks, M., Carslaw, K., Che, H., Coe, H., Cotterell, M. I., Crawford, I., Cui, Z., Davies, N., Dingley, B., Field, P., Formenti, P., Gordon, H., de Graaf, M., Herbert, R., Johnson, B., Jones, A. C., Langridge, J. M., Malavelle, F., Partridge, D. G., Peers, F., Redemann, J., Stier, P., Szpek, K., Taylor, J. W., Watson-Parris, D., Wood, R., Wu, H., and Zuidema, P.: The CLoud–Aerosol–Radiation Interaction and Forcing: Year 2017 (CLARIFY-2017) measurement campaign, Atmos. Chem. Phys., 21, 1049–1084, https://doi.org/10.5194/acp-21-1049-2021, 2021.
Howell, S. G., Freitag, S., Dobracki, A., Smirnow, N., and Sedlacek III, A. J.: Undersizing of aged African biomass burning aerosol by an ultra-high-sensitivity aerosol spectrometer, Atmos. Meas. Tech., 14, 7381–7404, https://doi.org/10.5194/amt-14-7381-2021, 2021.
Jimenez, J. L., Canagaratna, M. R., Donahue, N. M., Prévôt, A. S. H., Zhang, Q., Kroll, J. H., DeCarlo, P. F., Allan, J. D., Coe, H., Ng, N. L., Aiken, A. C., Docherty, K. D., Ulbrich, I. M., Grieshop, A. P., Robinson, A. L., Duplissy, J., Smith, J. D., Wilson, K. R., Lanz, V. A., Hueglin, C., Sun, Y. L., Tian, J., Laaksonen, A., Raatikainen, T., Rautiainen, J., Vaattovaara, P., Ehn, M., Kulmala, M., Tomlinson, J. M., Collins, D. R., Cubison, M. J., Dunlea, E. J., Huffman J. A., Onasch, T. B., Alfarra, M. R., Williams, P. I., Bower, K., Kondo, Y., Schneider, J., Drewnick, F., Borrmann, S., Weimer, S., Demerjian, K., Salcedo, D., Cottrell, L., Griffin, R., Takami, A., Miyoshi, T., Hatakeyama, S., Shimono, A., Sun, J. Y., Zhang, Y. M., Dzepina, K., Kimmel, J. R., Sueper, D., Jayne, J. T., Herndon, S. C., Trimborn, A. M., Williams, L. R., Wood, E. C., Kolb, C. E., Middlebrook, A. M., Baltensperger, U., and D. R. Worsnop.: Evolution of organic aerosols in the atmosphere, Science, 326, 1525–1529, https://doi.org/10.1126/science.1180353, 2009.
Jones, A. C., Haywood, J. M., Vance, A., and Ryder, C.: Pitch and roll corrections for the CLARIFY-2017 radiation data, Met Office, OBR Technical Note 91, https://library.metoffice.gov.uk/Portal/Default/en-GB/RecordView/Index/646187 (last access: 24 October 2022), 2018.
King, W. D., Maher, C. T., and Hepburn, G. A.: Further performance tests on the CSIRO liquid water probe, J. Appl. Meteorol., 20, 195–202, https://doi.org/10.1175/1520-0450(1981)020<0195:FPTOTC>2.0.CO;2, 1981.
Laborde, M., Schnaiter, M., Linke, C., Saathoff, H., Naumann, K.-H., Möhler, O., Berlenz, S., Wagner, U., Taylor, J. W., Liu, D., Flynn, M., Allan, J. D., Coe, H., Heimerl, K., Dahlkötter, F., Weinzierl, B., Wollny, A. G., Zanatta, M., Cozic, J., Laj, P., Hitzenberger, R., Schwarz, J. P., and Gysel, M.: Single Particle Soot Photometer intercomparison at the AIDA chamber, Atmos. Meas. Tech., 5, 3077–3097, https://doi.org/10.5194/amt-5-3077-2012, 2012.
Lance, S.: Coincidence Errors in a Cloud Droplet Probe (CDP) and a Cloud and Aerosol Spectrometer (CAS), and the Improved Performance of a Modified CDP, J. Atmos. Oceanic Technol., 29, 1532–1541, https://doi.org/10.1175/JTECH-D-11-00208.1, 2012.
Lance, S., Brock, C. A., Rogers, D., and Gordon, J. A.: Water droplet calibration of the Cloud Droplet Probe (CDP) and in-flight performance in liquid, ice and mixed-phase clouds during ARCPAC, Atmos. Meas. Tech., 3, 1683–1706, https://doi.org/10.5194/amt-3-1683-2010, 2010.
Langridge, J. M, Richardson, M. S., Lack, D., Law, D., and Murphy, D. M.: Aircraft instrument for comprehensive characterization of aerosol optical properties, Part I: Wavelength-dependent optical extinction and its relative humidity dependence measured using cavity ringdown spectroscopy, Aero. Sci. Tech., 5, 1305–1318, https://doi.org/10.1080/02786826.2011.592745, 2011.
Lawson, R.P., O'Connorm, D., Zmarzly, P., Weaver, K., Baker, B., Mo, Q., and Jonsson, H.: The 2D-S (Stereo) probe: Design and preliminary tests of a new airborne, high-speed, high-resolution particle imaging probe. J. Atmos. Ocean. Technol., 23, 1462–1477, https://doi.org/10.1175/JTECH1927.1, 2006.
Levin, E. J. T, McMeeking, G. R., Carrico, C. M., Mack, L. E., Kreidenweis, S. M., Wold, C. E., Moosmüller, H., Arnott, W. P., Hao, W. M., Collet Jr., J. L., and Malm, W. C.: Biomass burning smoke aerosol properties measured during Fire Laboratory at Missoula Experiments (FLAME), J. Geophys. Res.-Atmos., 115, D18210, https:/doi.org/https://doi.org/10.1029/2009JD013601, 2010.
Liu, P. S. K., Leaitch, W. R., Strapp, J. W., and Wasey, M. A.: Response of Particle Measuring Systems Airborne ASASP and PCASP to NaCl and latex particles, Aerosol Sci. Tech., 16, 83–95, https://doi.org/10.1080/02786829208959539, 1992.
Liu, P. S. K, Deng, R., Smith, K. A., Williams, L. R, Jayne, J. T., Canagartna, M. R., Moore, K., Onasch, T. B., Worsnop, D.R., and Deshler, T.: Transmission efficiency of an aerodynamic focusing lens system: Comparison of model calculations and laboratory measurements for the Aerodyne Aerosol Mass Spectrometer, Aero. Sci. Tech., 41, 721–733, https://doi.org/10.1080/02786820701422278, 2007.
Liu, X., Huey, L. G., Yokelson, R. J., Selimovic, V., Simpson, I. J., Müller, M., Jimenez, J. L., Campuzano-Jost, P., Beyersdorf, A. J., Blake, D. R., Butterfield, Z., Choi, T., Crounse, J. D., Day, D. A., Diskin, G. S., Dubey, M. K., Fortner, E., Hanisco, T. F., Hu, W., King, L. E., Kleinman, L., Meinardi, S., Mikoviny, T., Onasch, T. B., Palm, B. B., Peischl, J., Pollack, I. B., Ryerson, T. B., Sachse, G. W., Sedlacek, A. J., Shilling, J. E., Springston, S., St. Clair, J. M., Tanner, D. J., Teng, A. P., Wennberg, P. O., Wisthaler, A., and Wolfe, G. M.; Airborne measurements of western U.S. wildfire emissions: Comparison with prescribed burning and air quality implications, J. Geophys. Res.-Atmos., 122, 6108–6129, https://doi.org/10.1002/2016JD026315, 2017.
Marshak, A. and Davis, A. (Eds.): 3D radiative transfer in cloudy atmospheres, Physics of Earth and Space Environments, 1st edn., Springer Science and Business Media, pp. XII, 686, ISBN: 978-3-540-23958-1, 2005.
McFarquhar, G. M., Finlon, J. A., Stechman, D. M., Wu, W., Jackson, R. C., and Freer, M.: University of Illinois/Oklahoma Optical Array Probe (OAP) processing software, Zenodo [code], https://doi.org/10.5281/zenodo.1285969, 2018.
McNaughton, C. S., Clarke, A. D., Howell, S. G., Pinkerton, M., Anderson, B., Thornhill, L., Hudgins, C., Winstead, E., Dibb, J. E., Scheuer, E., and Maring, H.: Results from the DC-8 Inlet Characterization Experiment (DICE): Airborne versus surface sampling of mineral dust and sea salt aerosols, Aerosol Sci. Tech., 41, 136–159, https://doi.org/10.1080/02786820601118406, 2007.
McNaughton, C. S., Clarke, A. D., Kapustin, V., Shinozuka, Y., Howell, S. G., Anderson, B. E., Winstead, E., Dibb, J., Scheuer, E., Cohen, R. C., Wooldridge, P., Perring, A., Huey, L. G., Kim, S., Jimenez, J. L., Dunlea, E. J., DeCarlo, P. F., Wennberg, P. O., Crounse, J. D., Weinheimer, A. J., and Flocke, F.: Observations of heterogeneous reactions between Asian pollution and mineral dust over the Eastern North Pacific during INTEX-B, Atmos. Chem. Phys., 9, 8283–8308, https://doi.org/10.5194/acp-9-8283-2009, 2009.
McNaughton, C. S., Clarke, A. D., Freitag, S., Kapustin, V. N., Kondo, Y., Moteki, N., Sahu, L., Takegawa, N., Schwarz, J. P., Spackman, J. R., Watts, L., Diskin, G., Podolske, J., Holloway, J. S., Wisthaler, A., Mikoviny, T., de Gouw, J., Warneke, C., Jimenez, J., Cubison, M., Howell, S. G., Middlebrook, A., Bahreini, R., Anderson, B. E., Winstead, E., Thornhill, K. L., Lack, D., Cozic, J., and Brock, C. A.: Absorbing aerosol in the troposphere of the Western Arctic during the 2008 ARCTAS/ARCPAC airborne field campaigns, Atmos. Chem. Phys., 11, 7561–7582, https://doi.org/10.5194/acp-11-7561-2011, 2011.
Middlebrook, A. M., Bahreini, R., Jimenez, J. L., and Canagaratna, M. R.: Evaluation of composition-dependent collection efficiencies for the Aerodyne aerosol mass spectrometer using field data, Aerosol Sci. Tech., 46, 258–271, https://doi.org/10.1080/02786826.2011.620041, 2012.
Miller, R. M., McFarquhar, G. M., Rauber, R. M., O'Brien, J. R., Gupta, S., Segal-Rozenhaimer, M., Dobracki, A. N., Sedlacek, A. J., Burton, S. P., Howell, S. G., Freitag, S., and Dang, C.: Observations of supermicron-sized aerosols originating from biomass burning in southern Central Africa, Atmos. Chem. Phys., 21, 14815–14831, https://doi.org/10.5194/acp-21-14815-2021, 2021.
Moore, R. H., Wiggins, E. B., Ahern, A. T., Zimmerman, S., Montgomery, L., Campuzano Jost, P., Robinson, C. E., Ziemba, L. D., Winstead, E. L., Anderson, B. E., Brock, C. A., Brown, M. D., Chen, G., Crosbie, E. C., Guo, H., Jimenez, J. L., Jordan, C. E., Lyu, M., Nault, B. A., Rothfuss, N. E., Sanchez, K. J., Schueneman, M., Shingler, T. J., Shook, M. A., Thornhill, K. L., Wagner, N. L., and Wang, J.: Sizing response of the Ultra-High Sensitivity Aerosol Spectrometer (UHSAS) and Laser Aerosol Spectrometer (LAS) to changes in submicron aerosol composition and refractive index, Atmos. Meas. Tech., 14, 4517–4542, https://doi.org/10.5194/amt-14-4517-2021, 2021.
Morgan, W. T., Allan, J. D., Bower, K. N., Capes, G., Crosier, J., Williams, P. I., and Coe, H.: Vertical distribution of sub-micron aerosol chemical composition from North-Western Europe and the North-East Atlantic, Atmos. Chem. Phys., 9, 5389–5401, https://doi.org/10.5194/acp-9-5389-2009, 2009.
NASA: P-3B Orion (N426NA) Airborne Laboratory Experimenter Handbook 548-HDBK-0001 Release: Baseline, Effective Date: August 2010, https://airbornescience.nasa.gov/sites/default/files/P-3B%20Experimenter%20Handbook%20548-HDBK-0001.pdf, (last access: 2 February 2021), 2010.
Ng, N. L., Herndon, S. C., Trimborn, A., Canagaratna, M. R., Croteau, P. L., Onasch, T. B., Sueper, D., Worsnop, D. R., Zhang, Q., Sun, Y. L., and Jayne J. T.: An Aerosol Chemical Speciation Monitor (ACSM) for routine monitoring of the composition and mass concentrations of ambient aerosol, Aerosol Sci. Tech., 45, 780–794, https://doi.org/10.1080/02786826.2011.560211, 2011.
Ogren, J. A.: Comment on “Calibration and intercomparison of filter-based measurements of visible light absorption by aerosols”, Aerosol Sci. Tech., 44, 589–591, https://doi.org/10.1080/02786826.2010.482111, 2010.
Onasch, T., Massoli, P., Kebabian, P., Hills, F., Bacon, F., and Freedman, A.: Single scattering albedo monitor for airborne particulates, Aerosol Sci. Tech., 49, 267–279, https://doi.org/10.1080/02786826.2015.1022248, 2015 (data available at: https://adc.arm.gov/discovery/#/results/s::caps-ssa, last access: 24 October 2022).
ORACLES Science Team: Suite of Aerosol, Cloud, and Related Data Acquired Aboard P3 During ORACLES 2017, Version 3, NASA Ames Earth Science Project Office [data set], https://doi.org/10.5067/Suborbital/ORACLES/P3/2017_V3, 2020.
Peers, F., Francis, P., Fox, C., Abel, S. J., Szpek, K., Cotterell, M. I., Davies, N. W., Langridge, J. M., Meyer, K. G., Platnick, S. E., and Haywood, J. M.: Observation of absorbing aerosols above clouds over the south-east Atlantic Ocean from the geostationary satellite SEVIRI – Part 1: Method description and sensitivity, Atmos. Chem. Phys., 19, 9595–9611, https://doi.org/10.5194/acp-19-9595-2019, 2019.
Pennypacker, S., Diamond, M., and Wood, R.: Ultra-clean and smoky marine boundary layers frequently occur in the same season over the southeast Atlantic, Atmos. Chem. Phys., 20, 2341–2351, https://doi.org/10.5194/acp-20-2341-2020, 2020.
Pilewskie, P., Pommier, J., Bergstrom, R., Gore, W., Howard, S., Rabbette, M., Schmid, B., Hobbs, P. V., and Tsay, S. C.: Solar spectral radiative forcing during the Southern African Regional Science Initiative, J. Geophys. Res.-Atmos., 108, D13, https://doi.org/10.1029/2002JD002411, 2003.
Pistone, K., Redemann, J., Doherty, S., Zuidema, P., Burton, S., Cairns, B., Cochrane, S., Ferrare, R., Flynn, C., Freitag, S., Howell, S. G., Kacenelenbogen, M., LeBlanc, S., Liu, X., Schmidt, K. S., Sedlacek III, A. J., Segal-Rozenhaimer, M., Shinozuka, Y., Stamnes, S., van Diedenhoven, B., Van Harten, G., and Xu, F.: Intercomparison of biomass burning aerosol optical properties from in situ and remote-sensing instruments in ORACLES-2016, Atmos. Chem. Phys., 19, 9181–9208, https://doi.org/10.5194/acp-19-9181-2019, 2019.
Pistone, K., Zuidema, P., Wood, R., Diamond, M., da Silva, A. M., Ferrada, G., Saide, P. E., Ueyama, R., Ryoo, J.-M., Pfister, L., Podolske, J., Noone, D., Bennett, R., Stith, E., Carmichael, G., Redemann, J., Flynn, C., LeBlanc, S., Segal-Rozenhaimer, M., and Shinozuka, Y.: Exploring the elevated water vapor signal associated with the free tropospheric biomass burning plume over the southeast Atlantic Ocean, Atmos. Chem. Phys., 21, 9643–9668, https://doi.org/10.5194/acp-21-9643-2021, 2021.
Price, H. C.: Temperature and humidity measurements on the FAAM aircraft (1.0), Zenodo, https://doi.org/10.5281/zenodo.5846962, 2022.
Redemann, J., Wood, R., Zuidema, P., Doherty, S. J., Luna, B., LeBlanc, S. E., Diamond, M. S., Shinozuka, Y., Chang, I. Y., Ueyama, R., Pfister, L., Ryoo, J.-M., Dobracki, A. N., da Silva, A. M., Longo, K. M., Kacenelenbogen, M. S., Flynn, C. J., Pistone, K., Knox, N. M., Piketh, S. J., Haywood, J. M., Formenti, P., Mallet, M., Stier, P., Ackerman, A. S., Bauer, S. E., Fridlind, A. M., Carmichael, G. R., Saide, P. E., Ferrada, G. A., Howell, S. G., Freitag, S., Cairns, B., Holben, B. N., Knobelspiesse, K. D., Tanelli, S., L'Ecuyer, T. S., Dzambo, A. M., Sy, O. O., McFarquhar, G. M., Poellot, M. R., Gupta, S., O'Brien, J. R., Nenes, A., Kacarab, M., Wong, J. P. S., Small-Griswold, J. D., Thornhill, K. L., Noone, D., Podolske, J. R., Schmidt, K. S., Pilewskie, P., Chen, H., Cochrane, S. P., Sedlacek, A. J., Lang, T. J., Stith, E., Segal-Rozenhaimer, M., Ferrare, R. A., Burton, S. P., Hostetler, C. A., Diner, D. J., Seidel, F. C., Platnick, S. E., Myers, J. S., Meyer, K. G., Spangenberg, D. A., Maring, H., and Gao, L.: An overview of the ORACLES (ObseRvations of Aerosols above CLouds and their intEractionS) project: aerosol–cloud–radiation interactions in the southeast Atlantic basin, Atmos. Chem. Phys., 21, 1507–1563, https://doi.org/10.5194/acp-21-1507-2021, 2021.
Ryder, C. L., Highwood, E. J., Rosenberg, P. D., Trembath, J., Brooke, J. K., Bart, M., Dean, A., Crosier, J., Dorsey, J., Brindley, H., Banks, J., Marsham, J. H., McQuaid, J. B., Sodemann, H., and Washington, R.: Optical properties of Saharan dust aerosol and contribution from the coarse mode as measured during the Fennec 2011 aircraft campaign, Atmos. Chem. Phys., 13, 303–325, https://doi.org/10.5194/acp-13-303-2013, 2013.
Schwarz, J. P., Gao, R. S., Fahey, D. W., Thomson, D. S., Watts, L. A., Wilson, J. C., Reeves, J. M., Darbeheshti, M., Baumgardner, D. G., Kok, G. L., Chung, S. H., Schulz, M., Hendricks, J., Lauer, A., Kärcher, B., Slowik, J.G., Rosenlof, K. H., Thompson, T. L., Langford, A. O., Loewenstein, M., and Aikin, K. C.: Single-particle measurements of midlatitude black carbon and light-scattering aerosols from the boundary layer to the lower stratosphere, J. Geophys. Res.-Atmos., 111, D16207, https://doi.org/10.1029/2006JD007076, 2006.
Sedlacek, A.: Single-Particle Soot Photometer (SP2) Instrument Handbook, United States, ARM Tech. Rep. DOE/SC-ARM-TR-169, 24 pp., https://doi.org/10.2172/1344179, 2017.
Sherman, J. P. and McComiskey, A.: Measurement-based climatology of aerosol direct radiative effect, its sensitivities, and uncertainties from a background southeast US site, Atmos. Chem. Phys., 18, 4131–4152, https://doi.org/10.5194/acp-18-4131-2018, 2018.
Shinozuka, Y., Saide, P. E., Ferrada, G. A., Burton, S. P., Ferrare, R., Doherty, S. J., Gordon, H., Longo, K., Mallet, M., Feng, Y., Wang, Q., Cheng, Y., Dobracki, A., Freitag, S., Howell, S. G., LeBlanc, S., Flynn, C., Segal-Rosenhaimer, M., Pistone, K., Podolske, J. R., Stith, E. J., Bennett, J. R., Carmichael, G. R., da Silva, A., Govindaraju, R., Leung, R., Zhang, Y., Pfister, L., Ryoo, J.-M., Redemann, J., Wood, R., and Zuidema, P.: Modeling the smoky troposphere of the southeast Atlantic: a comparison to ORACLES airborne observations from September of 2016, Atmos. Chem. Phys., 20, 11491–11526, https://doi.org/10.5194/acp-20-11491-2020, 2020.
Springston, S. R.: Particle Soot Absorption Photometer (PSAP) Instrument Handbook, DOE/SC-ARM-TR-176, https://www.osti.gov/servlets/purl/1246162 (last access: 5 May 2021), 2018a.
Springston, S.: AOS: Carbon Monoxide Analyzer, Atmospheric Radiation Measurement [data set], https://doi.org/10.5439/1046183, 2018b.
Sproson, D., Tiddenman, D., and Wellpot, A.: FAAM DECADES post processing package, Github [code], https://github.com/ncasuk/decades-pp (last access: 25 October 2022), 2020.
Stier, P., Schutgens, N. A. J., Bellouin, N., Bian, H., Boucher, O., Chin, M., Ghan, S., Huneeus, N., Kinne, S., Lin, G., Ma, X., Myhre, G., Penner, J. E., Randles, C. A., Samset, B., Schulz, M., Takemura, T., Yu, F., Yu, H., and Zhou, C.: Host model uncertainties in aerosol radiative forcing estimates: results from the AeroCom Prescribed intercomparison study, Atmos. Chem. Phys., 13, 3245–3270, https://doi.org/10.5194/acp-13-3245-2013, 2013.
Strapp, J. W., Oldenburg, J., Ide, R., Lilie, L., Bacic, S., Vukovic, Z., Oleskiw, M., Miller, D., Emery, E., and Leone, G.: Wind tunnel measurements of the response of hot-wire liquid water content instruments to large droplets, J. Atmos. Sci., 20, 791–806, https://doi.org/10.1175/1520-0426(2003)020<0791:WTMOTR>2.0.CO;2, 2003.
Taylor, J. W., Choularton, T. W., Blyth, A. M., Liu, Z., Bower, K. N., Crosier, J., Gallagher, M. W., Williams, P. I., Dorsey, J. R., Flynn, M. J., Bennett, L. J., Huang, Y., French, J., Korolev, A., and Brown, P. R. A.: Observations of cloud microphysics and ice formation during COPE, Atmos. Chem. Phys., 16, 799–826, https://doi.org/10.5194/acp-16-799-2016, 2016.
Taylor, J. W., Wu, H., Szpek, K., Bower, K., Crawford, I., Flynn, M. J., Williams, P. I., Dorsey, J., Langridge, J. M., Cotterell, M. I., Fox, C., Davies, N. W., Haywood, J. M., and Coe, H.: Absorption closure in highly aged biomass burning smoke, Atmos. Chem. Phys., 20, 11201–11221, https://doi.org/10.5194/acp-20-11201-2020, 2020.
Trembath, J., Bart, M., and Brooke, J.: FAAM Technical Note 01: Efficiencies of modified Rosemount housings for sampling aerosol on a fast atmospheric research aircraft, Tech. Rep., Facility for Airborne Atmospheric Measurement (FAAM), https://www.faam.ac.uk/contact/ (last access: 25 October 2022), 2012.
Trembath, J.: Airborne CCN Measurements, PhD thesis, University of Manchester, https://www.escholar.manchester.ac.uk/item/?pid=uk-ac-man-scw:212956 (last access: 24 October 2022), 2013.
Uin, J., Smith, S.: Southern Great Plains (SGP) Aerosol Observing System (AOS) instrument handbook, DOE/SC-ARM-TR-267, https://www.arm.gov/publications/tech_reports/handbooks/doe-sc-arm-tr-267.pdf (last access: 5 May 2021), 2020.
Vance, A. K., Abel, S. J., Cotton, R. J., and Woolley, A. M.: Performance of WVSS-II hygrometers on the FAAM research aircraft, Atmos. Meas. Tech., 8, 1617–1625, https://doi.org/10.5194/amt-8-1617-2015, 2015.
Vance, A. K., Norwood-Brown, J., and O'Sullivan, D.: SWS-SHIMS calibration and uncertainties – interim report to Christmas 2017, Met Office, OBR Technical Note 90, https://library.metoffice.gov.uk/Portal/Default/en-GB/RecordView/Index/650108 (last access: 24 October 2022), 2017.
Vance, A., Price, H., Woolley, A., and Szpek, K.: Update on the performance of the WVSS-II hygrometers fitted to the FAAM BAe 146, Met Office, OBR Technical Note 93, https://library.metoffice.gov.uk/Portal/Default/en-GB/RecordView/Index/647266, (last access: 24 October 2022), 2018.
Virkkula, A.: Correction of the calibration of the 3 wavelength Particle Soot Absorption Photometer (3λ PSAP), Aerosol Sci. Tech., 44, 706–712, https://doi.org/10.1080/02786826.2010.482110, 2010.
Watson, T. B.: Aerosol Chemical Speciation Monitor (ACSM) instrument handbook, ARM CRM DOE/SC-ARM-TR-196, https://www.arm.gov/publications/tech_reports/handbooks/acsm_handbook.pdf (last access: 20 May 2021), 2017.
Wu, H., Taylor, J. W., Szpek, K., Langridge, J. M., Williams, P. I., Flynn, M., Allan, J. D., Abel, S. J., Pitt, J., Cotterell, M. I., Fox, C., Davies, N. W., Haywood, J., and Coe, H.: Vertical variability of the properties of highly aged biomass burning aerosol transported over the southeast Atlantic during CLARIFY-2017, Atmos. Chem. Phys., 20, 12697–12719, https://doi.org/10.5194/acp-20-12697-2020, 2020.
Wu, H., Taylor, J. W., Langridge, J. M., Yu, C., Allan, J. D., Szpek, K., Cotterell, M. I., Williams, P. I., Flynn, M., Barker, P., Fox, C., Allen, G., Lee, J., and Coe, H.: Rapid transformation of ambient absorbing aerosols from West African biomass burning, Atmos. Chem. Phys., 21, 9417–9440, https://doi.org/10.5194/acp-21-9417-2021, 2021.
Zawadowicz, M. and Howie, J.: Aerosol Chemical Speciation Monitor, corrected for composition-dependent collection efficiency, c2, Atmospheric Radiation Measurement [data set], https://doi.org/10.5439/1763029, 2021.
Zhang, J. and Zuidema, P.: The diurnal cycle of the smoky marine boundary layer observed during August in the remote southeast Atlantic, Atmos. Chem. Phys., 19, 14493–14516, https://doi.org/10.5194/acp-19-14493-2019, 2019.
Zuidema, P., Redemann, J., Haywood, J., Wood, R., Piketh, S., Hipondoka, M., and Formenti, P.: Smoke and clouds above the Southeast Atlantic: Upcoming field campaigns probe absorbing aerosol's impact on climate, B. Am. Meteorol. Soc., 97, 7, https://doi.org/10.1175/BAMS-D-15-00082.1, 2016.
Zuidema, P., Alvarado, M., Haywood, J., Romps, D., Chiu, J.-Y. Christine, Kollias, P., Turner, D., de Szoeke, S., Lewis, E., Wang, H., Fairall, C., McComiskey , A., Wood, R., Feingold, G., Mechem, D., Yuter, S., Ghan, S., Redemann, J., and Zhu, P.: Layered Atlantic smoke interactions with clouds (LASIC), Atmospheric Radiation Measurements Mobile Facilty no. 1, Dept. of Energy [data set], https://www.arm.gov/research/campaigns/amf2016lasic (last access: 24 October 2022), 2017.
Zuidema, P., Sedlacek III, A. J., Flynn, C., Springston, S., Delgadillo, R., Zhang, J., Aiken, A. C., Koontz, A., and Muradyan, P: The Ascension Island boundary layer in the remote Southeast Atlantic is often smoky, Geophys. Res. Lett., 45, 4456–4465, https://doi.org/10.1002/2017GL076926, 2018a.
Zuidema, P., Alvarado, M., Chiu, C., DeSzoeke, S., Fairall, C., Feingold, G., Freedman, A., Ghan, S., Haywood, J., Kollias, P., Lewis, E., McFarquhar, G., McComiskey, A., Mechem, D., Onasch, T., Redemann, J., Romps, D., Turner, D., Wang, H., Wood, R., Yuter, S., and Zhu P.: Layered Atlantic Smoke Interactions with Clouds (LASIC) field campaign report, edited by: Stafford, R., DOE/SC-ARM-18-018, ARM Climate Research Facility, Report DOE/SC-ARM-18-018, US Dept. of Energy, Office of Science, https://www.osti.gov/biblio/1437446 (last access: 24 October 2022), 2018b.
The requested paper has a corresponding corrigendum published. Please read the corrigendum first before downloading the article.
- Article
(8101 KB) - Full-text XML
- Corrigendum
-
Supplement
(1147 KB) - BibTeX
- EndNote