the Creative Commons Attribution 4.0 License.
the Creative Commons Attribution 4.0 License.
 | 01 Nov 2023
Intercomparison of detection and quantification methods for methane emissions from the natural gas distribution network in Hamburg, Germany
Antonio Delre
Charlotte Scheutz
Anders M. Fredenslund
Stefan Schwietzke
Hugo Denier van der Gon
Thomas Röckmann
In August and September 2020, three different measurement methods for quantifying methane (CH4) emissions from leaks in urban gas distribution networks were applied and compared in Hamburg, Germany: the “mobile”, “tracer release”, and “suction” methods. The mobile and tracer release methods determine emission rates to the atmosphere from measurements of CH4 mole fractions in the ambient air, and the tracer release method also includes measurement of a gaseous tracer. The suction method determines emission rates by pumping air out of the ground using soil probes that are placed above the suspected leak location. The quantitative intercomparison of the emission rates from the three methods at a small number of locations is challenging because of limitations of the different methods at different types of leak locations.
The mobile method was designed to rapidly quantify the average or total emission rate of many gas leaks in a city, but it yields a large emission rate uncertainty for individual leak locations. Emission rates determined for individual leak locations with the tracer release technique are more precise because the simultaneous measurement of the tracer released at a known rate at the emission source eliminates many of the uncertainties encountered with the mobile method. Nevertheless, care must be taken to properly collocate the tracer release and the leak emission points to avoid biases in emission rate estimates. The suction method could not be completed or applied at locations with widespread subsurface CH4 accumulation or due to safety measures. While the number of gas leak locations in this study is small, we observe a correlation between leak emission rate and subsurface accumulation. Wide accumulation places leaks into a safety category that requires immediate repair so that the suction method cannot be applied to these larger leaks in routine operation. This introduces a sampling bias for the suction method in this study towards the low-emission leaks, which do not require immediate repair measures. Given that this study is based on random sampling, such a sampling bias may also exist for the suction method outside of this study. While an investigation of the causal relationship between safety category and leak size is beyond the scope of this study, on average higher emission rates were observed from all three measurement-based quantification methods for leaks with higher safety priority compared to the leaks with lower safety concern. The leak locations where the suction method could not be applied were the biggest emitters, as confirmed by the emission rate quantifications using mobile and tracer methods and an engineering method based on the leak's diameter, pipeline overpressure, and depth at which the pipeline is buried. The corresponding sampling bias for the suction technique led to a low bias in derived emission rates in this study. It is important that future studies using the suction method account for any leaks not quantifiable with this method in order to avoid biases, especially when used to inform emission inventories.
- Article
(7213 KB) - Full-text XML
-
Supplement
(2667 KB) - BibTeX
- EndNote


Natural gas combustion has a lower carbon footprint than combustion of other fossil fuel sources for the same thermal output (EIA, 2021). However, fugitive methane (CH4) emissions can significantly turn the balance in terms of climate impact (Alvarez et al., 2012) because the global warming potential of CH4 over a 20-year timescale is 84 times higher than that of carbon dioxide (CO2) (Myhre et al., 2013). The atmospheric abundance of CH4 has increased about 2.5-fold since the pre-industrial era (Bousquet et al., 2006). Following a short period of stable levels after the year 2000, atmospheric CH4 has continued to increase since 2006. Worden et al. (2017) concluded that about 50 % to 80 % of the post-2006 increase originated from fossil sources, and Jackson et al. (2020) attributed the accelerated increase of 6–13 ppb yr−1 from 2014 to 2017 (Nisbet et al., 2019) equally to the emission increase from the fossil fuel industry of the energy sector and agriculture sector.
Gas distribution networks in cities are subject to maintenance programmes by the operators to detect and fix leakages that occur, as CH4 is an incendiary gas and can be explosive at mixing ratios between 4 % and 16 % in ambient air (DVGW, 2022). Since the safe operation of the distribution network and leak repair is the primary objective of this maintenance, quantification of emissions from leakages is rarely performed. The absence of regulations on CH4 emissions is another reason why leak rates are not routinely quantified; however CH4 emissions from the energy sector need to be addressed properly within the EU CH4 strategy by 2050 (EC, 2020). Nevertheless, from the perspective of climate change and possible mitigation options, it is important that emissions from gas leakages are (i) quickly detected and fixed and (ii) well quantified. Weller et al. (2020) and Alvarez et al. (2018), respectively, reported 5 and 1.6 times higher CH4 emissions from leaks in the US gas distribution network based on such observations compared to the national inventory reports.
Leaks from buried pipelines can be due to corrosion or failure/defects in joints or materials (EPA, 1996). When a leak occurs on a buried urban gas pipeline, the gas will generally accumulate in the air space below the surface and then find its path to the atmosphere through a single or several surface outlets. The outlets can be either unpaved soil surfaces or cracks in the road or pavement, or they can be associated with different types of cavities (manholes, communication covers, rain drains, etc.). The major outlet is generally the one with the highest overall permeability for gas released from the buried natural gas pipeline. On the way from the leak location in a buried pipeline to the atmosphere through outlets, CH4 may be oxidized by methanotrophs in the soil and/or merge with CH4 from other sources, e.g. biogenic CH4 emissions from sewage systems.
Routine leak surveys in Germany are conducted by walking with handheld CH4 sensors above buried pipelines, referred to as the carpet method (DVGW, 2019). The success of leak detection with the carpet method depends primarily on soil permeability (Ulrich et al., 2019), which is influenced by soil moisture, texture, soil organic content, and the location of the groundwater table (Wiesner et al., 2016). Based on the risk of explosion, gas leaks are classified into four types: A1, A2, B, and C (DVGW, 2019). This classification is based on the accumulation of CH4 in cavities (e.g. manholes, rain drains) or buildings and the distance of gas leaks to buildings and cavities. If natural gas leaks into buildings or cavities, the leak classifies as A1, and it must be repaired immediately to minimize explosion risk. If the gas leak has a distance of up to 1 m to buildings and does not fill cavities, it is classified as A2, and it must be fixed within a week. If the distance is between 1 and 4 m to buildings, the leak is classified as B, and the repair time window is 3 months, and if the distance is more than 4 m then, the leak is considered to be in category C and can be fixed according to the scheduled repair plan. There is 6500 km of low-pressure and 250 km of medium-pressure gas pipelines in Hamburg, which are monitored every 4 years with the carpet method based on the national regulations in Germany. Gas leaks in cities are not quantified and thus also not a parameter affecting the course of action. Moreover, high-pressure pipelines are monitored on an annual basis with additional helicopter-based measurement platforms.
In recent years, mobile measurement methods using vehicles with fast and high-precision laser instrumentation have been established for leak detection and emission quantification in numerous cities (Jackson et al., 2014; von Fischer et al., 2017; Weller et al., 2018; Keyes et al., 2020; Ars et al., 2020; Maazallahi et al., 2020b; Defratyka et al., 2021; Luetschwager et al., 2021; Fernandez et al., 2022). In situ measurements of atmospheric CH4 from mobile vehicles are used to pinpoint and quantify CH4 emission sources at street level in urban areas. The mobile method was calibrated using aboveground controlled-release experiments, in which known amounts of CH4 were released from gas cylinders (Weller et al., 2019). Simultaneous measurements of carbon dioxide (CO2) and ethane (C2H6) can provide valuable additional information for attributing CH4 sources (Maazallahi et al., 2020b). A characteristic of the resulting emissions distribution from gas distribution grids in cities is the existence of a few leak locations with very high leak rates, up to 100 L min−1, resulting in a right-skewed leak emission rate distribution (Weller et al., 2020). Usually about 10 % of the leaks are responsible for between 30 % and 70 % of the emissions (Weller et al., 2019; Maazallahi et al., 2020b). Therefore, the CH4 emission from the gas distribution system can be reduced very effectively if the largest leaks can be found and fixed quickly, thus augmenting the routine leak detection (carpet method) and repair programmes with the mobile method.
The tracer dispersion method is another method to quantify CH4 emissions from point and area sources. With this method, a tracer gas is released at a known rate close to the outlet of the gas leak, and both tracer and target gas mixing ratios are measured downwind. From these measurements and the known tracer gas release rate, the target gas emission rate can be determined with an uncertainty of ±15 % (Lamb et al., 1995) or less than 20 % (Fredenslund et al., 2019). Lamb et al. (2015) applied the tracer method to quantify leaks from urban underground pipelines, where they reported moderate agreement (±50 %) to excellent agreement (±5 %) between the tracer and high-flow sampler method. With the high-flow sampler method, air was drawn at a flow rate of about 0.2 m3 min−1 through a flexible enclosure, which covered a leak from a component completely. With this method, the CH4 mixing ratio was measured with catalytic oxidation and thermal-conductivity hydrocarbon sensors, and a thermal-flow meter was used to determine gas flow.
Another approach to quantify underground leak rates from buried gas pipelines is the so-called suction method. With this method air is pumped out of the ground at a known rate via probes surrounding the underground leaks until an equilibrium CH4 mixing ratio is reached in air outflow, from which the CH4 leak rate can be calculated. In Germany, this approach is applied to a limited number of leak locations, which do not have to be repaired immediately or within 1 week. Suction measurements normally find leak rates that are <2 L min−1 (E.ON, personal communication, 2020). The reported uncertainty range of this method is ±10 % based on 23 measurements in the 1990s (E.ON, personal communication, 2020). The discrepancy between these rather low leak rates compared to leak rates inferred with the mobile method calls for further investigation, since the suction method is also employed to derive network-wide emission factors for the German country-wide gas distribution network (Federal Environment Agency, 2020).
Hendrick et al. (2016) used surface flux chamber measurements carried out between 2012 and 2014 to estimate gas leak rates from 100 leak locations in the Boston area that were detected using mobile measurements (n=45) in 2011 from Phillips et al. (2013) and additional locations from later mobile surveys (n=55). They reported CH4 emission rates from gas leaks ranging from 0.003 to 16 g min−1, corresponding to roughly 0.0–24.4 L min−1. They also reported that their estimate using chamber measurements underestimated total CH4 emissions, likely because the chambers did not capture the total CH4 emitted from the leak. This is similar to the enclosure measurement results from Weller et al. (2018).
The flow through a hole in a pipeline can also be calculated theoretically and empirically from the physical properties of the hole, mainly the ratio of the hole to the pipeline diameter and the overpressure in the pipeline. There are three different engineering model types to estimate emissions from gas leaks: the hole model, the rupture model, and modified models to bridge the gap between the hole and rupture models (Hou et al., 2020; Moloudi and Abolfazli Esfahani, 2014; Yuhua et al., 2002; Arnaldos et al., 1998). These types of models are either to estimate leak strength from a pipeline in open space or a buried pipeline. A leak on a buried pipeline has higher surrounding resistance depending on soil conditions compared to a situation where the pipeline is in open space. Such models have been used to quantify emissions from holes in pipelines in open space (Hou et al., 2020; Manda and Morshed, 2017; Moloudi and Abolfazli Esfahani, 2014; Mahgerefteh et al., 2005; Yuhua et al., 2002; Kayser and Shambaugh, 1991) but also from buried pipelines (Liu et al., 2021; Ebrahimi-Moghadam et al., 2018; Okamoto and Gomi, 2011; Yan et al., 2015). Cho et al. (2020) introduced a model which takes into account soil properties including absolute and relative permeability and porosity, the underground spread of the leak, surface CH4 mole fractions, and depth of the buried pipeline based on experiments with a controlled-release rate. This model was calibrated based on release rates ranging from 1.3 to 5.7 g min−1, corresponding to roughly 2.0–8.7 L min−1.
In this study, we present results from measurements with the mobile, the tracer release, and the suction methods in Hamburg, Germany, in August and September 2020. We present the quantitative emission estimates as well as a qualitative intercomparison of the three methods, in particular related to the applicability and the strengths and weaknesses of the different methods at different leak locations. We investigate differences between the leaks detected from mobile measurements and leak locations reported from the routine leak detection surveys performed by the local gas utility (hereinafter LDC, local distribution company). Finally, we discuss implications of our study for national emission inventories.
2.1 Campaign preparation and general overview
As preparation for the intercomparison campaign, all partners contributed to the preparation of an “intercomparison matrix”, where the characteristics and deployment details of the different methods were specified. This matrix is provided in Sect. S1 of the Supplement. The matrix includes descriptions related to the identification of gas leaks, the quantification of gas leaks, adjustments of the method to the intercomparison exercise, and upscaling. It also lays out an initial plan for the intercomparison in terms of identification of suitable locations and deployment of the different methods.
According to this plan (Fig. 1), we first applied the mobile method to identify potential gas leak locations, namely leak indications (LIs). When the mobile method detected one or more emission outlets (see Sect. S2) and classified them as a potential gas leak location, the carpet method was applied to confirm the leak and determine the leak location. Some additional locations that had previously been identified by the carpet method (leak categories B and C) were added to the list of target locations.
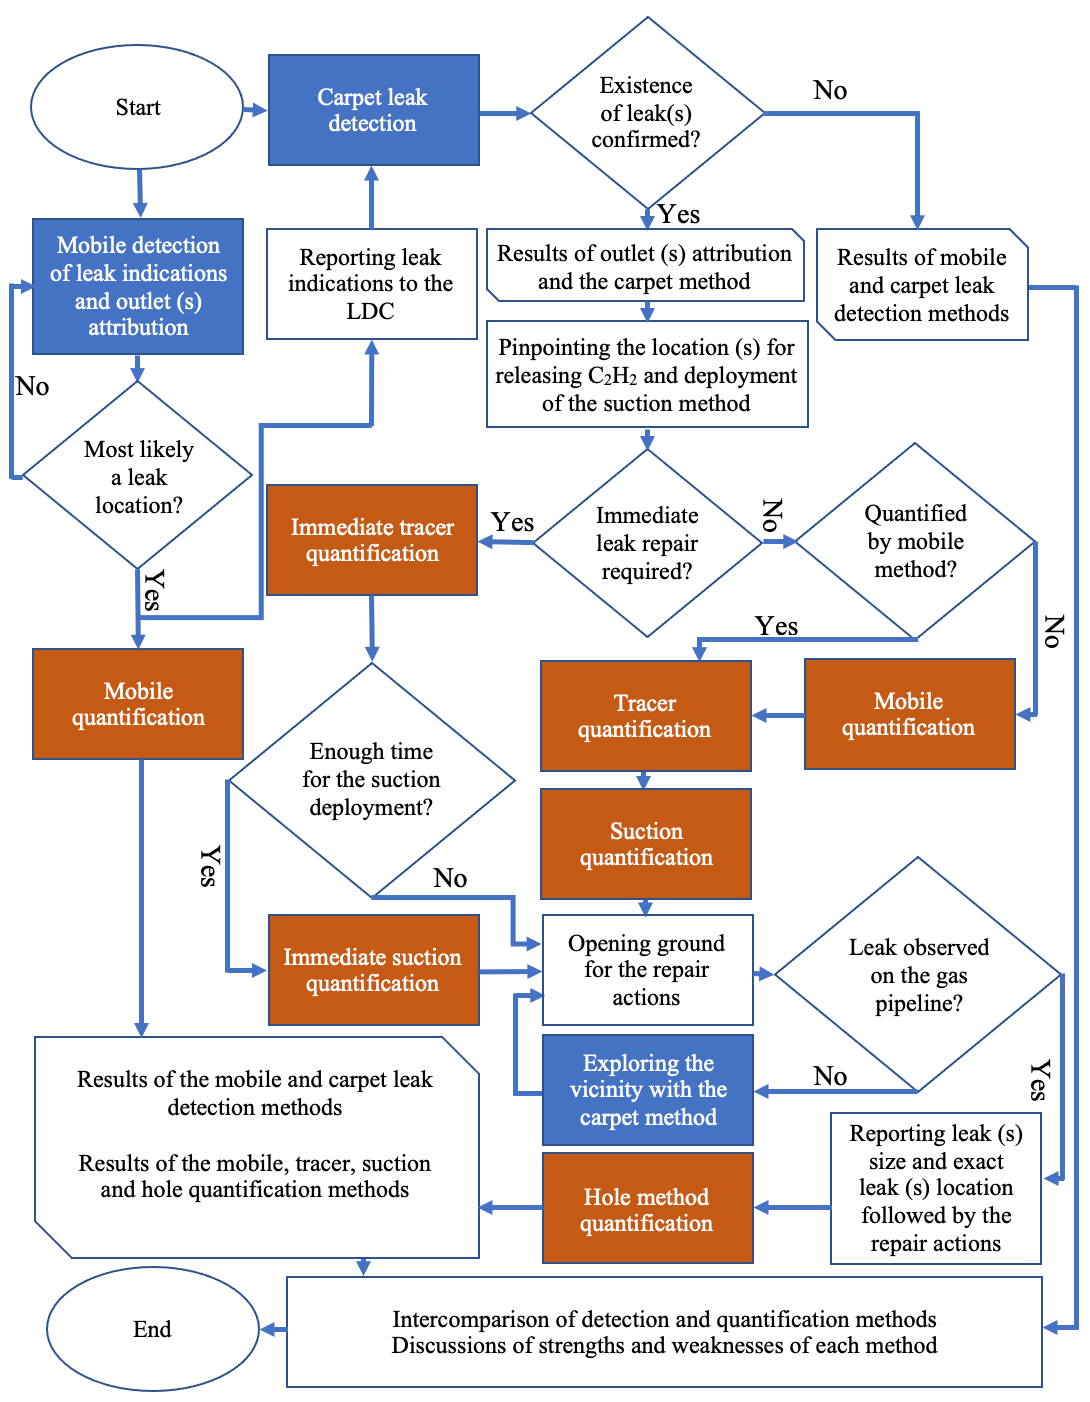
Figure 1Flowchart of application of leak detection methods (blue colours) and quantification methods (red colours) followed by repair measures and intercomparison of the detection and quantification methods.
Following leak detection, the mobile quantification method (multiple transects) was applied at all the locations, and the tracer and suction methods were applied at the confirmed leak locations, with some restrictions regarding safety, e.g., time allowed between detection and repair of leaks for different leak types, and method capacities, e.g. time required, labour intensity, and logistics. The release location for the tracer quantification method was confirmed based on surface screening using a handled methane analyser. For comparison of the mobile and tracer release methods with the suction and hole methods we assumed that (i) a steady state between pipeline leakage underground CH4 accumulation and emission to the atmosphere had been reached (Kirchgessner et al., 1997), and (ii) methanotrophs and methanogens have a negligible impact on quantification of gas leak emissions. Thus, the total emission rate of all outlets in the vicinity of a leak location is equal to the natural gas emission rate from the pipeline leak. We discuss implications of the above assumptions for selected cases. After leak repair, the LDC reported leak hole sizes, pipeline diameters, and pipeline operational pressures, allowing leak rate estimation with the hole method.
2.2 Measurement set-ups
2.2.1 Mobile measurement set-up
On board the measurement vehicle (VW Transporter) we operated two cavity ring-down spectrometers (CRDSs), model G2301 and model G4302 (Picarro, Santa Clara, California, USA). The G2301 measures CH4, CO2, and water vapour (H2O) at a flow rate of ≈0.2 L min−1 and 0.3 Hz frequency. The G4302 has a flow rate of ≈2.2 L min−1 and sampling frequency of about 1 Hz for CH4, C2H6, and H2O. The air intake for both instruments was from the same tubing attached to the front bumper. This set-up allowed us to directly compare the enhancements observed from the two instruments during surveys. The G4302, which is in the shape of a backpack, was also used in attribution of outlet emissions in walking surveys to check the presence of C2H6 in emission outlets.
2.2.2 Tracer release measurement set-up
The tracer release method was applied by releasing acetylene (C2H2) at the emission outlet identified by the mobile leak detection and confirmed by the carpet method. The tracer gas was released at the main emission outlet, which was confirmed by surface screening using a handheld CH4 analyser. The tracer release rates were between 1.3 and 2.6 L min−1 from a gas cylinder. A Picarro CRDS G2203 instrument was used to measure CH4 and C2H2 mole fractions continuously with ≈0.3 Hz frequency. The instrument was installed in a measurement vehicle (VW Caddy), and air was sampled from the atmosphere through an inlet on the roof about 2 m aboveground. The tracer method was applied in either static mode, where air was sampled in one or a few locations downwind from the outlets and tracer release locations (n=11), or mobile mode (n=5), where the plumes were transected while measuring mixing ratios of CH4 and C2H2. The choice of mode depended on the site conditions, including road accessibility and wind direction. The tracer release set-up, including instrumentation used as well as mobile mode, is described in detail in Delre (2018) and Mønster et al. (2014), and the principle of the static mode is described in Fredenslund et al. (2010).
2.2.3 Suction measurement set-up
With the suction method, 12 probes were used to insert into the soil around the confirmed gas leak location by the LDC. The probes are connected to a pump to extract accumulated subsurface CH4 from the leak. CH4 mole fraction at the outflow is measured with a flame ionization detector (MEEM, 2018).
2.2.4 Carpet method set-up
Leak detection experts from the LDC operate a methane detector (SEWERIN, Gütersloh, Germany) on a rolling device, where a plastic cover (the carpet) moves over the ground and provides a loose seal to the surrounding atmosphere, facilitating preferential analysis of air emanating from the surface right below the carpet. The instrument gives an acoustic signal when high CH4 from a potential leak has been detected. The instrument can detect C2H6 by gas chromatography in batch mode, which means that after taking air samples from a suspected outlet, the instrument operator needs to wait for a couple of minutes to test the possible detection of C2H6. This is substantially slower than the instrument with 1 Hz frequency used with the mobile method.
2.3 Detection, confirmation, and attribution of emissions at gas leak locations
2.3.1 Mobile detection of possible leak location
For leak detection with the mobile method, we first evaluated CH4, C2H6, and CO2 signals during mobile surveys. If (i) CH4 and C2H6 signals were observed with a ratio of less than 10 % with no CO2 signal, or (ii) CH4 was observed (<500 ppb enhancement on G4302) with no C2H6 and CO2 signals, then we parked the mobile measurement car, detached the G4302 analyser from the system, and searched for gas outlets on foot with the G4302. This detailed search for outlets was performed to (i) confirm the presence of both CH4 and C2H6 signals, (ii) map the spatial spread of outlets, and (iii) spatially constrain the possible gas leak location. The reported possible gas leak locations from the mobile method were then reported to the LDC for confirmation and localization of the leak with the carpet method and subsequent underground measurements.
2.3.2 Attribution of leak indication signals from mobile measurements
To attribute an observed leak indication (LI) from mobile measurements to a source category, namely fossil, microbial, and combustion, we used CO2 and C2H6 signals, which were continuously measured along with CH4. We quantitatively evaluated C2:C1 ratios (%) when (i) the CH4 enhancements were larger than 0.5 ppm, (ii) C2H6 enhancements were also larger than 15 ppb, and (iii) the determination coefficient (R2) of the linear regression between CH4 and C2H6 was larger than 0.7. If CH4 signals in mobile measurements were associated with CO2 and high C2H6 mole fractions ( %), we attributed those emissions to combustion (Maazallahi et al., 2020b). When we repeatedly observed CH4 enhancements, C2:C1 ratios between 1 % and 10 %, and no CO2 enhancements, or we observed persistent CH4 signals in several passes, we did further on-foot inspection of the outlets. If the emissions from the outlets clearly pointed to a fossil origin based on the CH4 and C2H6 signals, we labelled the locations as potential gas leak locations and reported them to the LDC for confirmation. We only considered a location to be a gas leak for further investigation if the LDC confirmed the existence of a gas leak.
If at a particular location, we observed several CH4 maxima, for example from different outlets, we considered the “strongest” outlet to be the main emission point. The “strongest” emission point refers to a point where we observed the highest CH4 mole fraction when the G4302 intake inlet was put at a distance of ≈ 2–5 cm above the surface or outlet. When several emission outlets with the same order of magnitude of mole fractions were found, we considered the spatial average of the coordinates to be the main emission point. The tracer method then released C2H2 at the main outlet emission point.
The LDC reported a C2:C1 ratio of 3.0 % (96.20±0.02 mol % CH4 and 2.88±0.00 mol % C2H6; Gasnetz Hamburg, GNH, personal communication, 2021) for the gas composition in the grid for the period of August and September 2020 in Hamburg. This ratio was reported to be 3.5 % (95.09 mol % CH4 and 3.37 mol %; GNH, personal communication, 2021) in April 2020.
2.3.3 LDC leak detection and confirmation
Since the pipeline locations are known to the LDC, the method can be applied precisely above the pipelines, including visible cracks and cavity outlets in the close vicinity, increasing the possibility of leak detection. Once the carpet method detects a CH4 source, a second measurement is performed above the location with the highest signal, where air is accumulated and analysed for the presence of C2H6. The C2H6 detection with the carpet method is not online with a higher detection threshold and in batch mode (gas chromatography), which takes time, 5–10 min per location. If sufficiently high CH4 and C2H6 levels are found, the leak is categorized into one of the safety categories of A1, A2, B, or C.
2.3.4 Precise underground leak localization
When a leak has been confirmed with the carpet method, a precise localization of the leak is performed by drilling holes about 20–40 cm into the ground along the pipeline track and measuring the subsurface CH4 mixing ratio. The location with the maximum subsurface reading is assigned the most likely leak location where the repair teams open the road and attempt to repair the leak. The final exact leak location is reported after opening the ground for the repair measures. Mostly the locations reported from the carpet method match the locations reported from the leak repair team, which depends on the transport pathways of emission undersurface and surface coverage.
2.4 Emission quantification
2.4.1 Mobile measurement quantifications
After the detection of the target locations, we performed additional transects at these locations on different days. We accepted a mobile measurement transect of a leak location for further analysis if (i) the GPS signals of transects were logged correctly along the street track; (ii) at least one of the two instruments, G2301 (for quantification and attribution) and/or G4302 (for attribution), was running during the transect; and (iii) the transect track included at least one GPS coordinate less than 50 m from the leak location. The start and end points of the accepted transects were determined as the locations where the driving tracks intersected with a circle with a radius of 100 m centred at the gas leak location reported by the LDC or a reported outlet location from the mobile method for the locations where the LDC did not confirm a leak. The segments between the start and end points were evaluated one by one (see an example in Sect. S4.1) to determine various parameters, e.g. the maximum CH4 enhancements, plume area, driving speed, distance to the actual leak locations. The plume area is the integral of the CH4 enhancements above the background along the driving track from the location where the CH4 enhancement exceeds >10 ppb until the location where it falls again below the 10 ppb threshold.
Gas leak quantification from mobile measurements is based on an empirical equation derived from controlled-release experiments reported by von Fischer et al. (2017) and re-evaluated in Weller et al. (2019) (Eq. 1).
In Eq. (1), Cmax is the maximum CH4 enhancement (ppm) observed during each transect next to the leak location. The maximum CH4 enhancement should be more than 10 % above the CH4 background level to be considered for the quantification algorithm. The emission rate is denoted by Q, and it is in litres per minute. is the mean of the logarithm of the maximum mole fraction enhancements for all accepted transects.
The standard quantification method only uses transects where CH4 enhancements are more than 10 % or ≈200 ppb above the background level. This 10 % enhancement threshold corresponds to an emission rate of about 0.5 L min−1 in Eq. (1). Thus, ≈0.5 L min−1 is the minimum emission rate that can be quantified with Eq. (1), and leaks with smaller emission rates are ignored by design of the method. Below we investigate the effect of relaxing the enhancement threshold. The application of the tracer release technique in mobile mode allowed us to use the known C2H2 release rate and the measured C2H2 plumes to independently validate the mobile approach, including the effect of the enhancement threshold. We also investigated the effect of distance between CH4 maxima and gas leak locations, which is not a parameter in Eq. (1).
The uncertainty in the emission rate for each location with the mobile method was calculated using the standard error and t factor (95 % confidence) for the locations with at least three CH4 enhancements greater than the 10 % threshold.
In addition to evaluating the maximum CH4 enhancement from each transect we also derived the plume area (mixing ratio times distance, ppm m) for comparison between the instruments. In principle, the plume area should provide a more robust quantification of an ambient CH4 plume than the maximum enhancement: when a plume spreads out, individual realizations of the plume can be sharper and higher or wider and lower, depending on meteorological conditions, but the plume area should be less affected. In addition, when an instantaneous plume is sampled with two instruments with different gas flow rates, instruments with a lower flow rate will be affected by mixing of air in the measurement cell. This will lead to a lower maximum enhancement but a wider peak, and thus the peak area should lead to a better comparison between the instruments.
2.4.2 Tracer measurement quantifications
The tracer method uses Eq. (2a) to quantify CH4 emissions in mobile mode (integral over space dimension) and Eq. (2b) in the static mode (integral over time dimension). Parameters relevant for the evaluation with the tracer method are provided in Sect. S4.2.
Here C is the mole fraction (ppm), and MW is the molecular weight of the species, 16 g mol−1 for CH4 and 26 g mol−1 for C2H2. is the CH4 emission rate estimate for CH4 (g s−1), and is the controlled-release rate of C2H2 (g s−1). The C2H2 flow rate was controlled and measured with a flow controller (Brooks Sho-Rate). In addition, the mass of C2H2 released at each location was measured by weighing the release cylinder before and after the tracer release with a precise scale (KERN DE60K5A). The change in mass was then converted to a mass flow rate using the release time. To convert the emission rate from mass (g s−1) to volume (L min−1) we used normal temperature and pressure (NTP) conditions: T=293.15 K, p=1.01325 bar. The locations of tracer release (C2H2) at the confirmed gas locations were determined with combined information from the mobile and the carpet methods.
The tracer gas can also be used to pinpoint and confirm the emission source location. Prior to quantification, it is important that the emission outlet is located for proper tracer release (see Fig. 1) and source simulation and that other potential interfering emission sources can be ruled out. This is secured by performance of upwind and downwind CH4 mole fraction screening. During transecting of the CH4 and tracer plumes, the two plumes should match; if this is not the case, the tracer release should be relocated until a proper plume match is obtained. If an emission source consists of multiple outlets, the combined emission from all outlets can be measured by releasing the tracer at the main outlet and increasing the measuring distance until one confined overlapping plume of CH4 and tracer gas is obtained. If the distance cannot be increased to access limitations, the tracer should be released at each single emission outlet.
2.4.3 Suction measurement quantifications
The quantification of a leak with the suction method is possible after pumping accumulated air out of the soil and reaching CH4 mole fraction equilibrium in the outflow. With the equilibrium CH4 reached and the known pumping rate through the probes, it is then possible to calculate emission rate (see Sect. S4.3).
2.4.4 Hole method, based on leak and pipeline properties
The LDC reported the physical properties of gas leaks and pipeline conditions. These include leak area, pipeline diameter, and pipeline operational pressure. In order to get an estimate of the upper physical limits of gas leakage through a hole with the given properties, we used the empirical model by Liu et al. (2021), which was designed to quantify emissions from buried natural gas pipelines to estimate emission rates from the leaks (Eq. 3), hereinafter the “hole” method.
Here, Q is the gas leak rate in cubic metres per hour (under standard atmospheric conditions and converted to NTP), h is the depth of the buried pipeline in centimetres, d is the gas leak hole diameter in millimetres, and p is the pipeline overpressure in kilopascals. We used 150 cm as the pipeline depth for all the locations in Hamburg to estimate emission rate. We note that the model that we employed is for buried pipelines, not pipelines in open space, and emission estimates for the gas leak emission rate in open space would be even higher (see Sect. S4.4). Ebrahimi-Moghadam et al. (2018) showed that CH4 emission from a pipeline hole area can be between 7 and 10 times higher in open space relative to the subsurface conditions.
3.1 Leak detection
A total of 15 possible leak locations were detected by the mobile method in the initial surveys (labelled as HH001–HH015). At 13 out of these 15 locations, leaks were confirmed by the LDC; the HH007 and HH012 locations were not confirmed as gas leak locations. In addition, the LDC identified five other leak locations (labelled as HH100–HH104) that had not yet been fixed (categories B and C). An overview of the measurements (detection and quantification) is provided in the Supplement (see Sect. S5). At some locations we also observed that vegetation was impacted negatively by the presence of leaks in their vicinities, a known phenomenon as high levels of methane cause harmful anoxic conditions for the plant roots (see Sect. S6). At several locations the outlet identification was straightforward because we only observed one outlet, but at five locations we observed numerous outlets spread over a large area. Figure 2 shows the spread of emission outlets at one of the locations (Fig. 2a), with correlations of CH4 and C2H6 at the “strongest” outlet (Fig. 2b). Figure 2c shows precise gas leak location practice of the LDC at one of the other locations.
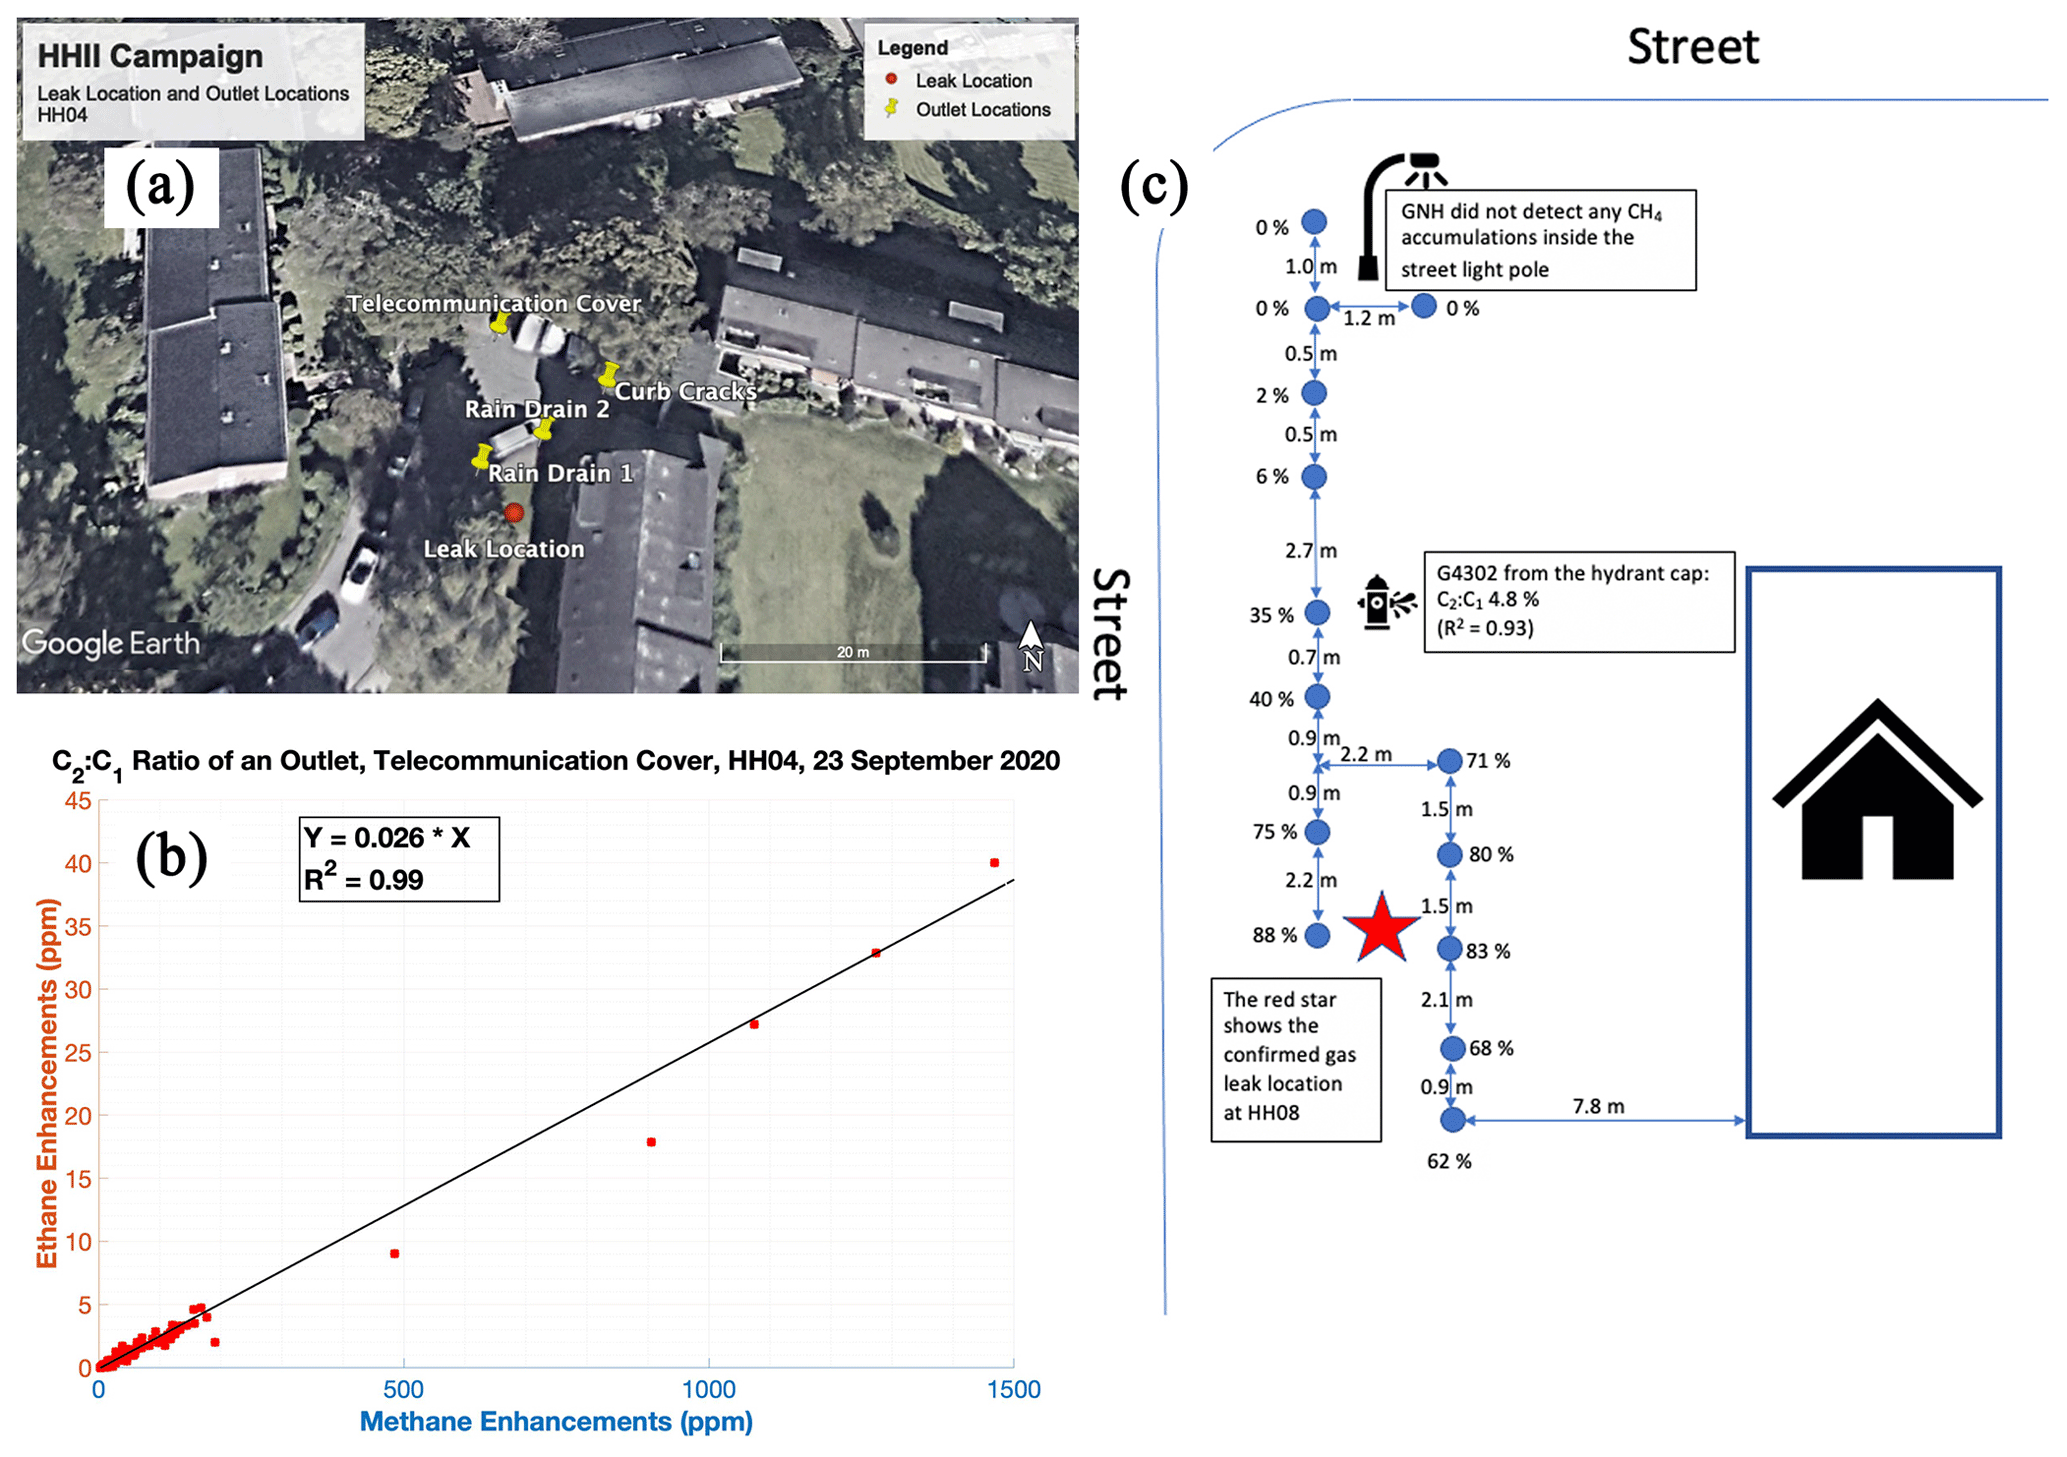
Figure 2(a) Aerial image of location HH004 (© Google Maps). Yellow pins show surface emission outlet locations, and the red point shows the actual pipeline leak location reported by the LDC. (b) Correlation between CH4 and C2H6 measured from a telecommunication cover. (c) Map (not to scale) of drilled holes (blue dots) to locate the pipeline gas leak at HH008. The red star shows the actual pipeline gas leak location as indicated by the undersurface CH4 mole fractions (see Sect. S3 and Fig. S3 in the Supplement).
3.2 Leak quantification
Table 1 shows the results of the leak emission rate quantifications from the four methods. All these locations were quantified by the mobile method, although for six of them the 10 % enhancement threshold was not reached. A total of 16 locations were quantified by the tracer release method and 8 by the suction method. A complete overview of key parameters for all measurements (detection and quantification) is provided in Sect. S5.
Table 1Results of gas leak quantification with different methods in Hamburg, Germany. INC: incomplete; CPLT: complete.
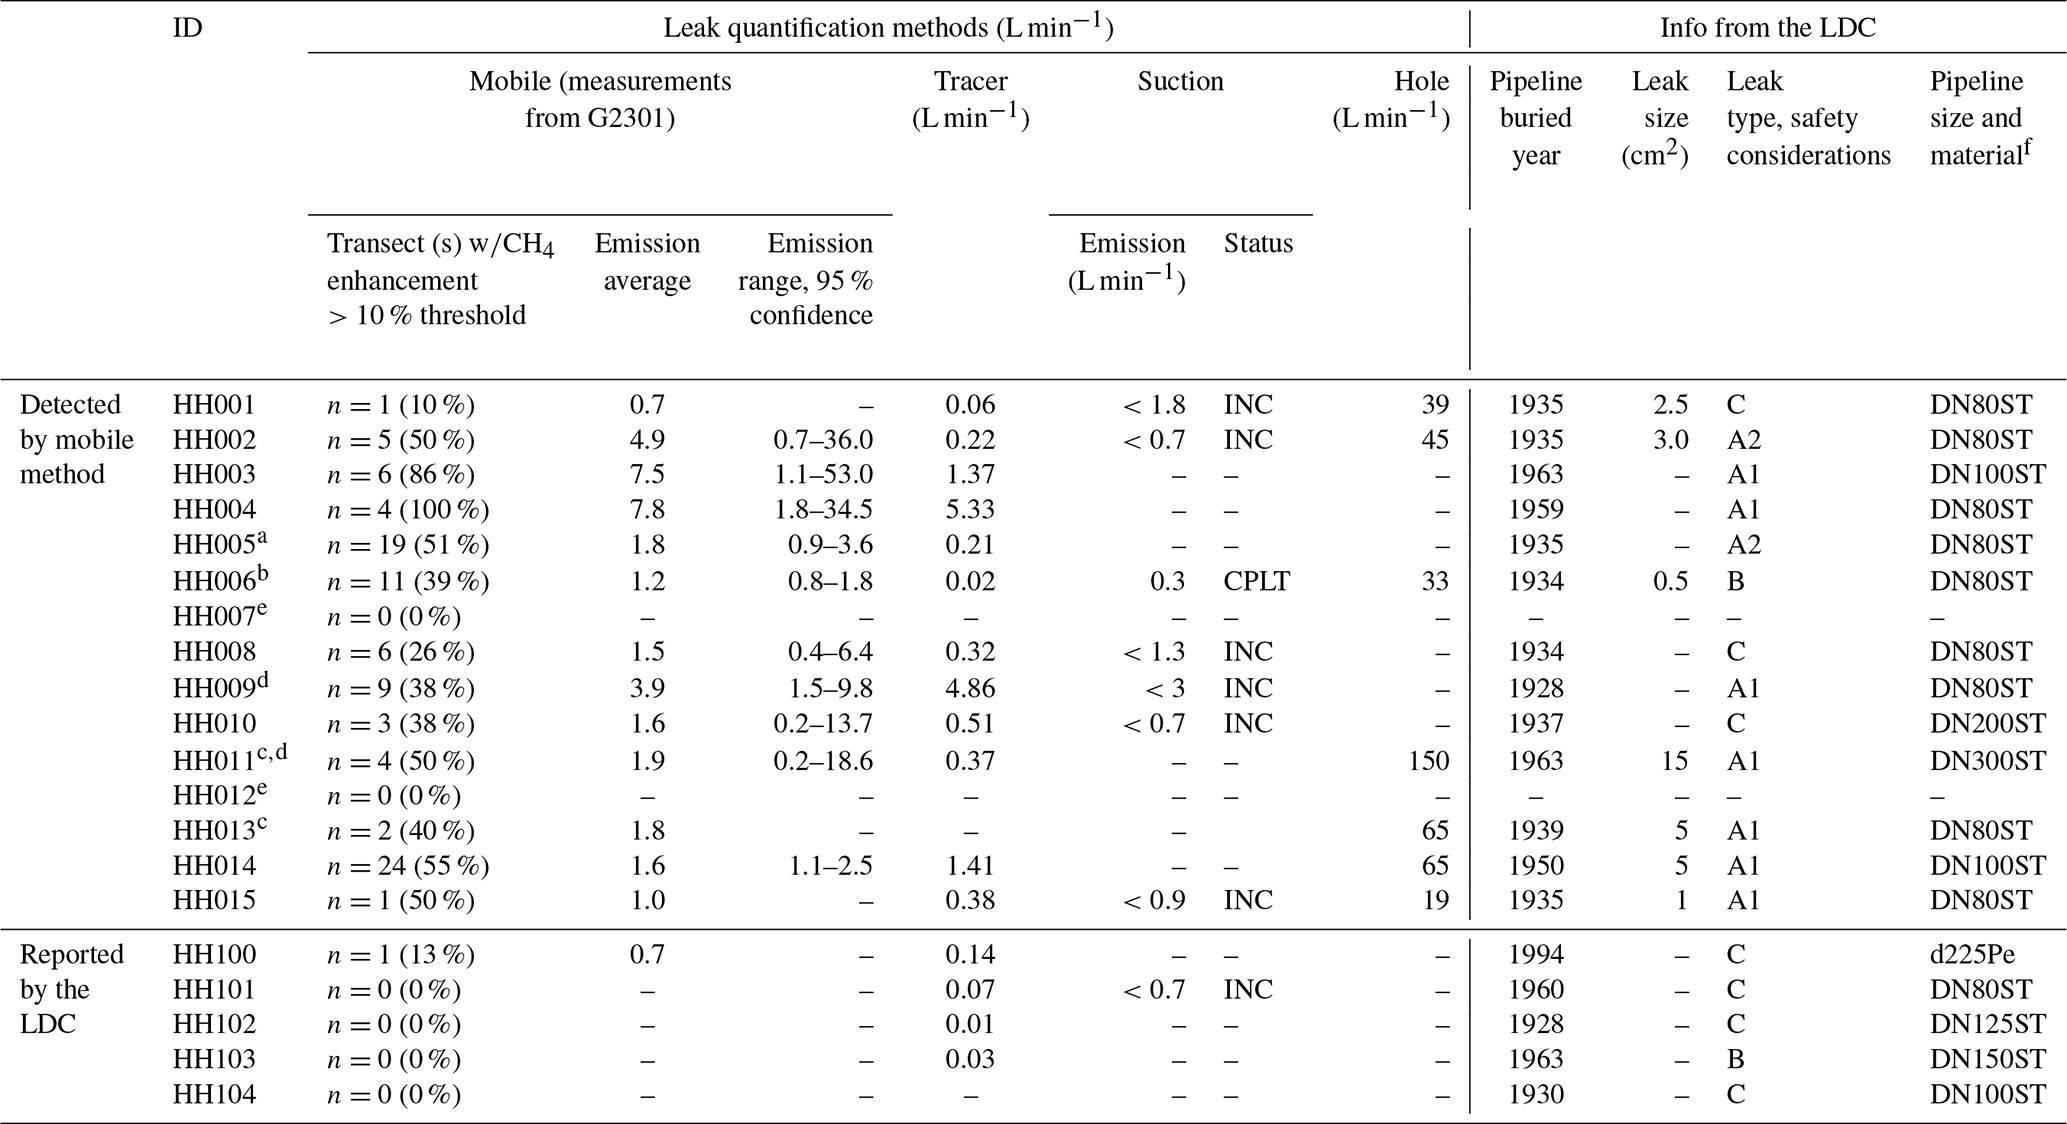
a The LDC reported three leak locations, ≈30 m distance between the two ends, for this location: two leaks with an area of 5 cm2 and one leak with an area of 1 cm2.
b Complete measurements for the suction method and used for averaging.
c Leak size reported as sum of total hole area of all the leaks in the pipeline.
d Large difference between leak location and the tracer release location.
e The LDC did not confirm a gas leak.
f Pipeline materials (steel, ST, or polyethylene, Pe), pipeline nominal diameter (DN), which is close to the inner pipeline diameter in millimetres.
3.2.1 Mobile method
The mobile method was applied at all 20 locations (18 confirmed and 2 unconfirmed gas leak locations). At 14 (all confirmed gas leak locations) out of the 20 locations, CH4 enhancements above the 10 % threshold were observed and could be evaluated with the standard algorithm. The emission rate estimates for these 14 gas leak locations ranged from 0.7 to 7.8 L min−1. At the six other locations we did not observe any CH4 enhancements above the 10 % threshold. When we lowered the enhancement threshold to 10 ppb, the emission rates were 0.07 (HH007, not a confirmed gas leak location), 0.1 (HH012, not a confirmed gas leak location), 0.04 (HH101), 0.02 (HH102), 0.05 (HH103), and 0.02 L min−1 (HH104). Of the five leak locations reported by the LDC, four did not show any enhancement maximum above the 10 % threshold; i.e. these locations would not have been identified with the default algorithm (Weller et al., 2018) and would thus not produce an emission estimate.
Figure 2 shows a summary of all individual observed enhancement maxima with the G2301 analyser from all transects with the mobile vehicle, which were used for the quantification of emission rates with Eq. (1). The figure illustrates the large spread in enhancement maxima for multiple passes at each location, similar to Luetschwager et al. (2021), leading to large uncertainties in emission estimates of individual locations. Figure 2 also shows the diversity of the various locations, where at some locations most or all of the observed enhancement maxima are above the 10 % threshold (e.g. HH003 and HH004), at several locations none of the enhancement maxima were above the threshold (e.g. HH101 and HH104), and at other locations many transects showed enhancement maxima both above and below the threshold (e.g. HH006, HH008, HH009, HH014).
As shown in Fig. 3, there is a wide range of CH4 enhancement observations per location. This depends on wind conditions, distance of the observed plume maximum to the emission outlet location, the superposition of emissions from several outlets, and likely other variables such as soil water content. The mean relative uncertainty from the mean emission rate values for the mobile method is ≈70 % for the lower and 400 % for the upper ends for the locations with at least three transects (n=10) which pass the 10 % enhancement threshold (significant signals) in this study. The lower and upper ranges go down to 60 % and 275 % for the locations with at least five transects (n=7) with significant CH4 enhancements.
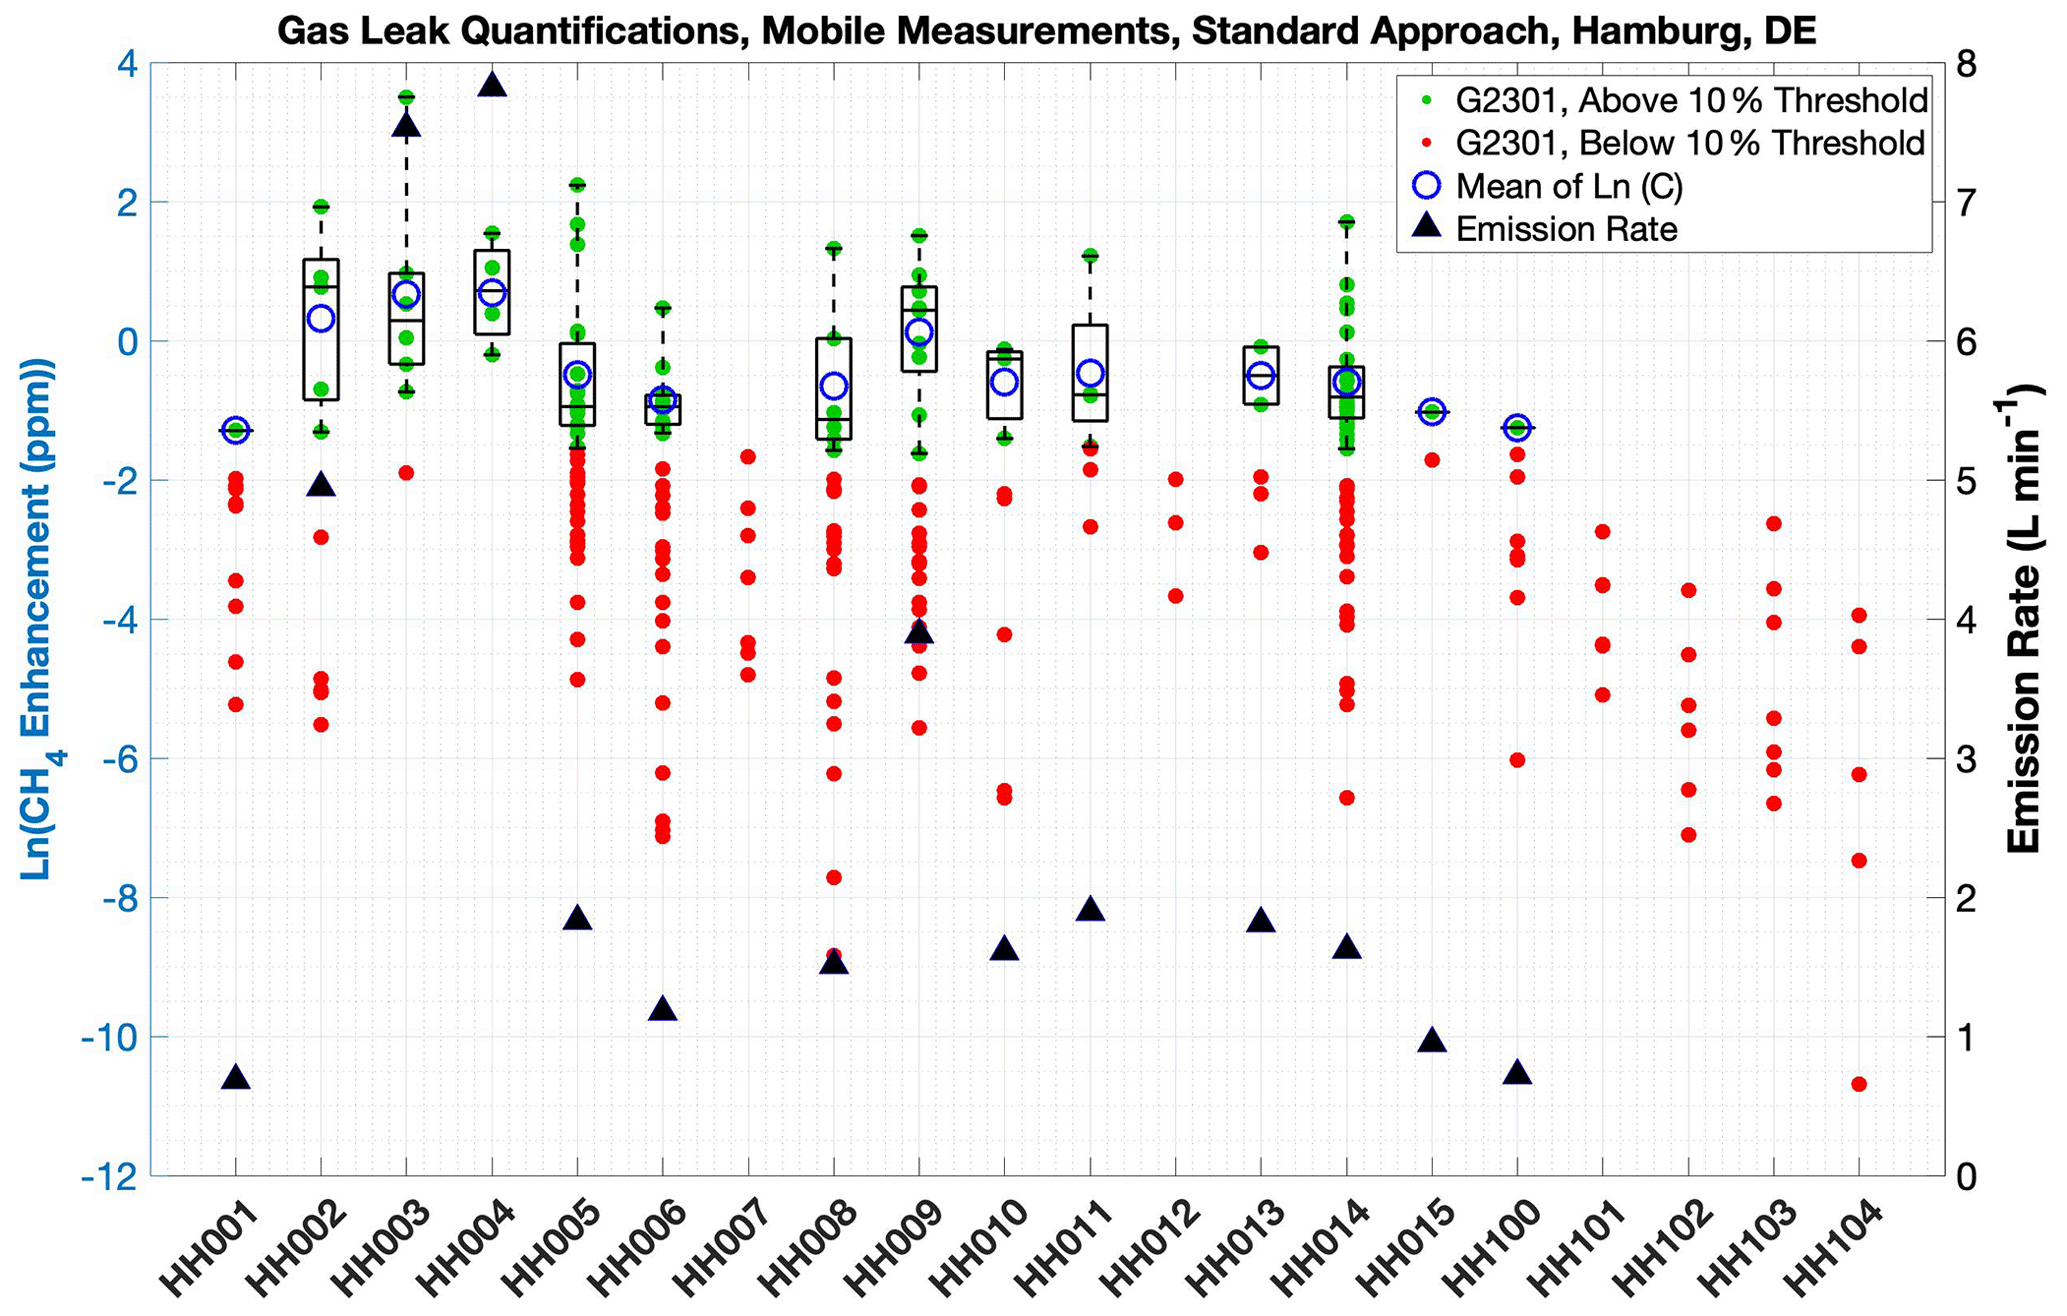
Figure 3CH4 enhancement maxima from all individual transects for each location using G2301. Red points show CH4 enhancement maxima below the 10 % threshold, and green points show CH4 enhancement maxima above the 10 % threshold. Blue circles show the of all the green points for each location, and black triangles show the derived mean emission rate (based on all green points) using Eq. (1) for the location with at least one green point (right y axis).
3.2.2 Tracer method
The tracer method performed emission rate quantification at 16 gas locations out of 20 locations. The derived emission rates range from 0.03 to 5.3 L min−1 (Table 1). For four locations the tracer method was not applied because (i) the emissions were not persistently observable, and the LDC also did not confirm the existence of gas leaks at these locations (n=2; HH007 and HH012); (ii) the leak had already been repaired (n=1; HH013); or (iii) no emission was detectable during the visit of the tracer team (n=1, HH104). For two of the locations (HH11 and HH09) where leaks were confirmed, and the tracer method was successfully deployed, later investigations during repair measures (see Fig. 1) showed that the surface emission outlets were located far (15 to 60 m) from the actual gas pipeline leak location, indicating underground gas migration. It is evident from Table 1 that the tracer technique can also quantify very small emission rates, below the cut-off of the mobile technique of 0.5 L min−1. Emission rate estimates derived from the tracer technique were in general lower than the ones derived from the mobile technique, except for three sites where those were comparable (HH004, HH009, and H014).
3.2.3 Suction method
Due to the time-consuming nature of the suction measurements, initially 10 gas leak locations had been planned for deployment of the suction method in this campaign. The goal was to cover a wide range of expected emission rates, as stated in the intercomparison matrix. The suction method was applied at eight gas leak locations (see Table 1). At only one location could the quantification be completed according to protocol, where an equilibrium mixing ratio has to be reached. This was at HH006, with a derived emission rate of 0.3 L min−1. At several of the locations where the mobile method had indicated high emission rates, subsurface accumulation was widespread, and the suction method was either not deployed (n=3; HH003, HH04, HH011), or the measurements were incomplete (n=7; HH001, HH002, HH008, HH009, HH010, HH015, and HH101) because of either safety reasons or because the suction team estimated that they would be unable to complete the measurements within a day. For the seven locations with incomplete suction measurements, the emission rates were reported to range from 0.7 to 3 L min−1. These can be regarded as upper limit estimates because suction was not yet completed, and CH4 mixing ratios would have likely dropped further.
3.2.4 Hole method
For five locations where the leak area of a single gas pipeline leak was reported, the corresponding emission rates are between 19 and 65 L min−1. For locations HH011 and HH013, the hole area was reported as the sum of several holes, and the total hole area for these two locations resulted in an emission rate of 150 and 65 L min−1, respectively. The quantification from the hole method is higher than from the mobile, tracer, and suction methods by at least an order of magnitude.
3.3 Leak categories
The 20 (18 confirmed + 2 not confirmed) locations can be divided into 4 main categories related to measurement challenges of the various methods. These categories may overlap:
- I.
large subsurface CH4 accumulation
- II.
insufficient CH4 enhancements for mobile quantification
- III.
large CH4 enhancement variability for mobile quantification
- IV.
several outlets and/or leaks or atmospheric turbulence.
In this section we present the overall results and discuss in detail one selected location for each of these categories. The remaining locations (with similar characteristics) are presented in the Supplement.
3.3.1 Location type I – large subsurface CH4 accumulation and multiple outlets
The spatial spread of surface emission outlet locations identified with the G4302 instrument as part of the mobile method provides an indicator for the extent of the subsurface accumulation of CH4. For five locations, emission outlets were found at great distance from each other, on the order of tens of metres. The total emission of a gas leak is equal to the sum of emissions from all the surface outlets at a location; thus it is necessary to quantify each outlet separately to get the total emission.
HH011 (Fig. 4) is an example where very widespread CH4 accumulation and migration were observed. During the initial mobile gas leak detection, leaks were located at the intersection of streets 1 and 2, close to a subsurface vent and a rain drain, ≈2 m apart (the yellow pin in Fig. 4a), based on clear signals from these outlets and a sign next to the road indicating the presence of gas pipelines. The vent showed a C2:C1 ratio of 2 % (R2 of 0.8 and max CH4 mole fraction of 31 ppm), and we observed a C2:C1 ratio of 2.8 % with R2 of 0.96 and max CH4 mole fraction of ≈70 ppm from the rain drain, clearly indicating a large and dominant contribution from fossil CH4. However, after quantifying the emission from these two leaks using the mobile and the tracer release methods, the LDC found the actual gas pipeline leak during the repair measures on the south side of the intersection, far from the vent and the rain drain, at the intersection of street nos. 3 and 2, indicating that the gas had travelled about 60 m underground. It is possible that the leak resulted in several gas emission outlets, likely closer to the gas pipeline leak location. The emission rate measured using the mobile method was 1.6 L min−1 based on five plume transects and is likely underestimated because some emission outlets potentially were not included in the performed plume transect. It should also be noted that the distance from the gas pipeline leak location to the plume transect is larger than the distances applied during the controlled-release calibrations (average 15 m) (Weller et al., 2019).
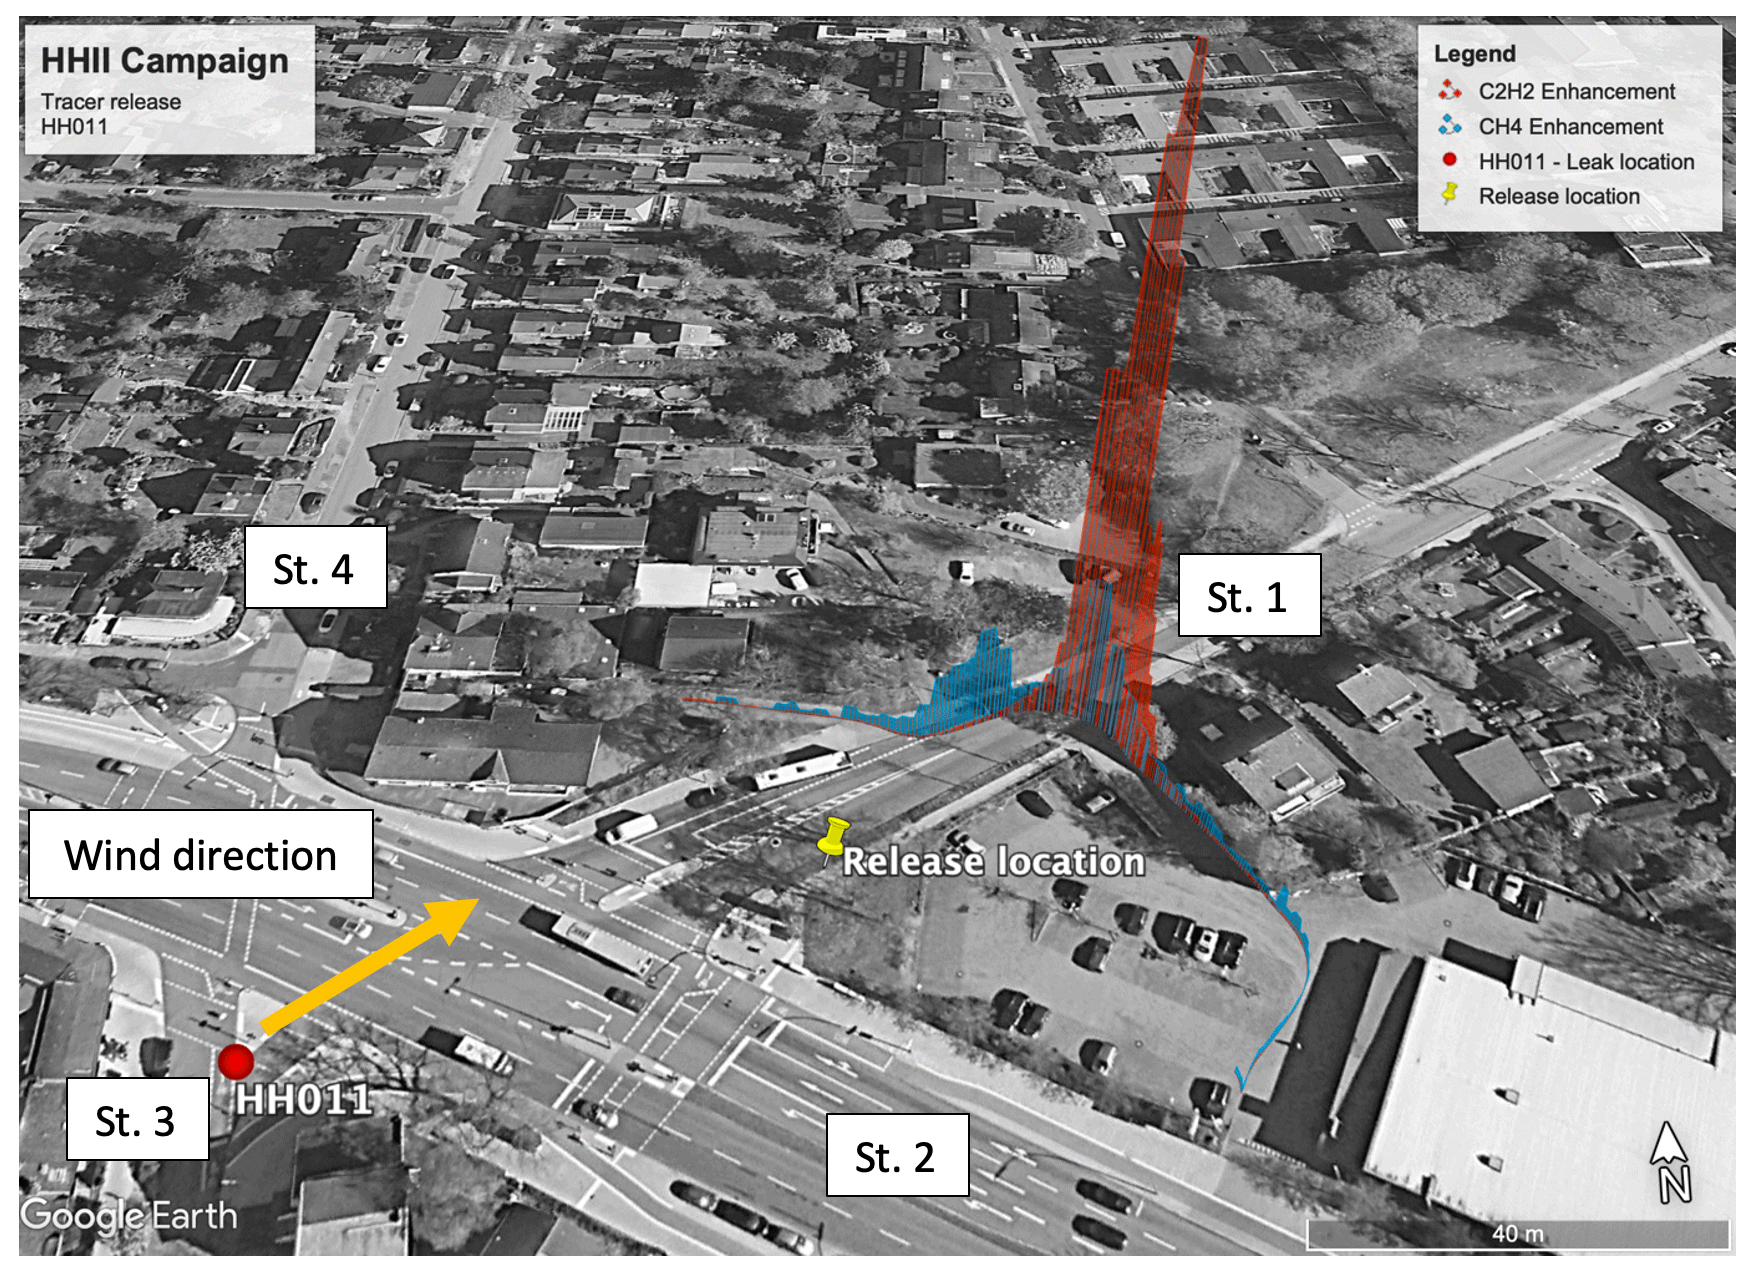
Figure 4Aerial image of HH011 (© Google Maps). A gas leak location with widespread undersurface CH4 accumulation. The yellow pin shows the assumed leak location and location of tracer release, which was very different from the actual leak location as identified by the LDC (red circle). St. 1–4 are added to identify streets that are discussed in the text. General wind direction during tracer release deployment is shown with an orange arrow. CH4 (in blue) and C2H2 (in red) levels measured at a plume transect. One of the CH4 plumes is proportional to the C2H2 plume, while the other CH4 plume lacks the C2H2 signals, suggesting the existence of at least another emission outlet.
The tracer was released at the vent and the rain drain and thus measured the combined emission from these two outlets to be 0.4 L min−1. If the gas pipeline leak gave rise to multiple unidentified surface emission outlets, the emission from the gas pipeline is underestimated. In fact, Fig. 4b shows that a CH4 plume without C2H2 was observed during the tracer release measurements at HH011, confirming that at least one other source of methane emission was present nearby.
Based on the previous experience at locations with widespread subsurface accumulation it was concluded that the suction method could not be applied at this location. The other case in this category was HH009.
The LDC reported the total area of several holes in the pipeline as 15 cm2 for HH011, which is the largest leak size among all the locations. If we assume that there was one hole with this size, then the emission rate estimated by Eq. (3) will be 150 L min−1; a hole of 5 cm2 yields an emission rate of 65 L min−1. The pipeline for this location was DN300ST and has been in operation since 1963.
3.3.2 Location type II – insufficient CH4 enhancements for mobile quantification
At HH101, on a narrow (≈3 m wide) street, which had about 1 m wide bare soil pavement on one side, the LDC reported a gas leak location based on their routine surveys. On both sides of the street there were about ≈1.5 m tall bushes and some trees. All three methods (mobile, tracer, and suction method) were deployed at this location. Gas emissions found their way to the atmosphere through cracks in the asphalt with a C2:C1 ratio of 2.5 % (R2 of 0.93) and a max CH4 mole fraction of ≈25 ppm. None of the CH4 enhancement maxima observed during the mobile surveys at this location were above the 10 % enhancement threshold with the G2301 instrument; thus this location would not be labelled as a LI, and no quantification would be reported from the mobile method as implemented in Weller et al. (2019) and Maazallahi et al. (2020b). The tracer method was applied in static mode at a distance of ≈15 m and reported an emission rate of 0.1 L min−1, which is compatible with the emission strength being below the “detection limit” defined by the 10 % cut-off of the standard algorithm (0.5 L min−1). When the emission strength is evaluated using the CH4 enhancements below the cut-off, the value is 0.04 L min−1. The suction method was applied at this location, but an equilibrium was not achieved after 9 h, i.e. incomplete suction measurements, and an upper limit for the emission rate of ≈0.7 L min−1 was reported. The fact that the suction measurement was incomplete at this location with a small emission rate shows that subsurface accumulation can also be large for smaller leaks.
Three of the leak locations in this study only showed one CH4 enhancement above the threshold. The 10 % threshold is a constraint which removes enhancements less than about 200 ppb. This means that for the locations where we only have one transect with CH4 enhancements more than the 10 % threshold, the minimum emission rate estimated is about 0.5 L min−1, no matter how many transects we had with CH4 enhancements less than the 10 % threshold. This situation was observed for HH001, HH015, and HH100 (Fig. 5). In this case, the mobile method likely overestimates the total leak rate because only the maximum enhancement is used for quantification. The tracer method reported low emission rates for these three sites, 0.12 L min−1 on average (n=6).
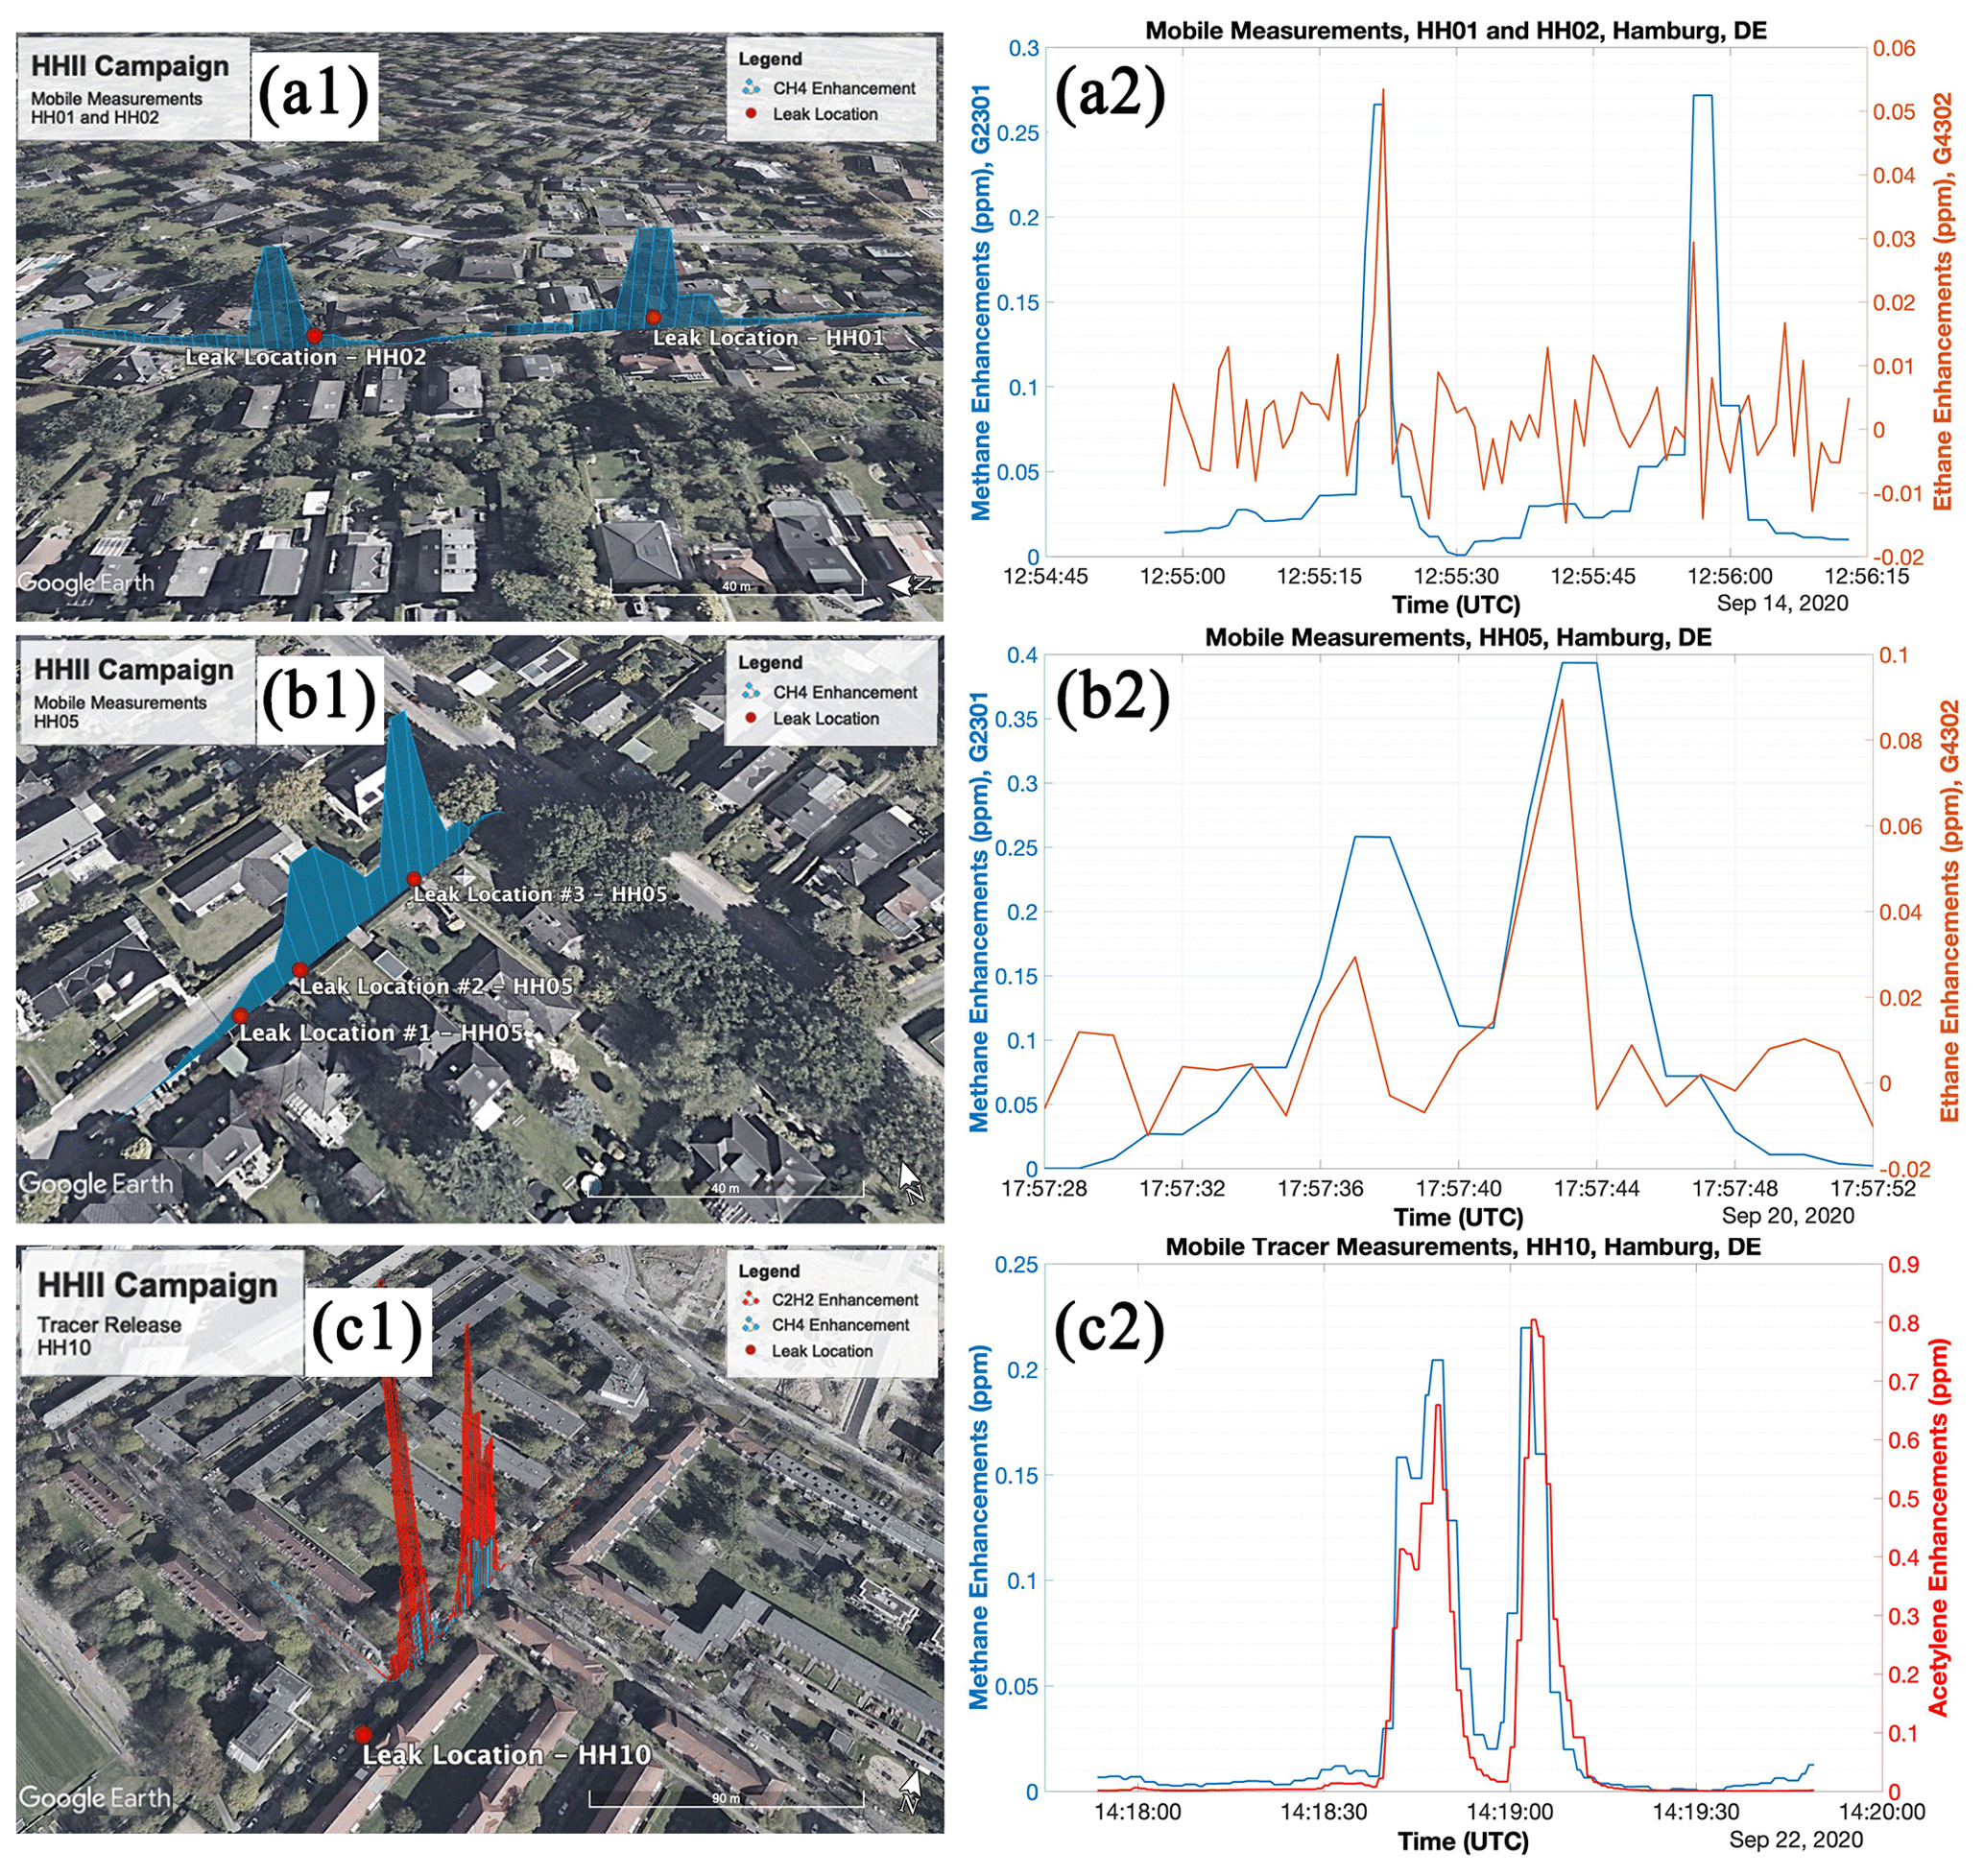
Figure 5Several maxima observed during a single transect on one street showing different situations: two well-isolated leaks with about 80 m distance from each other (a1 and a2, HH001 and HH002), three pipeline leaks close to each other with several emission outlets (b1 and b2, HH005), and one leak and one outlet but several CH4 enhancement maxima due to turbulence (c1 and c2, HH010). Aerial images: © Google Maps.
For the two locations (HH007 and HH012) where the LDC did not confirm gas leaks (despite periodic observation of C2H6 at outlets during the mobile surveys) none of the transects showed CH4 enhancement maxima above the 10 % threshold. At HH007, the outlet was through cracks in the pavement, but at HH012 the outlets were from manholes. At HH007 the outlet location had shifted by about 2 m for 2 different days (4-week gap). We note that the correlation coefficients between CH4 and C2H6 at these locations were between 0.4 and 0.6, so less than 0.7, which is the threshold correlation we accepted for the outlets. As a leak was not confirmed for these locations, the tracer and suction methods were not applied.
3.3.3 Location type III – large CH4 enhancement variability for mobile quantification
For several locations, we observed a large variability in CH4 enhancements from different transects. One example is HH008, where only 6 of the 23 transects exceeded the 10 % threshold; i.e. the leak was only observed in about every fourth transect. The leak location of HH008 is an example where CH4 enhancements from several transects cover a wide range. Based on the six transects which showed enhancement maxima above the 10 % threshold, a leak rate of 1.5 L min−1 is derived. This may be an overestimate since many transects with maxima below the threshold were not considered. For this location the mobile tracer method was applied, which resulted in a leak rate quantification of 0.3 L min−1.
The suction method derived an upper emission estimate of 1.3 L min−1 from incomplete measurements at HH008. The LDC reported a category C leak for this location from a DN80ST pipeline, which was installed in 1934.
3.3.4 Location type IV – several outlets and/or leaks or atmospheric turbulence
On a ≈5 m wide street, we detected two leaks about 80 m away from each other, HH001 and HH002 (Fig. 5a). It was a cobblestone street, and there were bushes and a few trees planted, mostly on one side of the street. The mobile method performed 10 transects at both locations, and all the transects were accepted for the evaluation. The tracer team could quantify both locations using static measurements. The suction team began to quantify HH002 and HH001, but during quantification of HH001, there was a small accident (fire due to contact of the drilling head with an electric cable), and the leak had to be fixed immediately. The plumes on this street were sufficiently separated to positively identify two different leaks on the same street. In contrast, at location HH005, we observed several maxima for the same transect, but because the maxima were close to each other, those were clustered together in the mobile measurement algorithm (Fig. 5b). Later the LDC even reported three individual pipeline leaks on this street. In another example (HH010), some transects showed several plume maxima, although only one emission outlet and later on only one gas pipeline leak was found (Fig. 5c). However, the release of the tracer resulted in several matching CH4 and tracer gas plumes, confirming that the emission indeed occurred form a single outlet and that the multiple plumes at this location were due to inhomogeneous plume dispersion. This illustrates that the existence of several maxima in one transect does not necessarily correspond to the presence of several leaks and/or outlets, but it can also be related to a spatially heterogeneous or disturbed plume. This shows that the signals from the mobile detection method are not sufficient to allow determination of the number of leaks at a location with several plumes at a close distance from each other in a single transect.
After detection by mobile measurements, emissions out of the ground were detected at HH001 and HH002 with the G4302 backpack within 3 m distance from the gas pipeline leak locations, which was later reported by the LDC. For the single transect with a maximum above the 10 % threshold observed with the mobile method, the derived emission rate at HH001 was 0.8 L min−1 (n=1). For HH002, the derived emission estimate for the transects with maxima above the threshold is 5.2 L min−1 (n=5) from the mobile method. At HH002, individual derivation of emission from separate CH4 enhancements gives a wide range between 0.7 and 36.0 L min−1 (95 % confidence) from the mobile method (see category III above). For HH001, the tracer method was applied in static mode at ≈30 m distance to the release point and ≈40 m from HH002. With the tracer method, the derived emission rate for HH001 is 0.06 L min−1, and for HH002 it is 0.22 L min−1. For HH001, after about 5 h of pumping, the suction quantification had to be stopped due to the incident described above. Based on the incomplete suction measurement an upper limit for an emission rate of ≈1.8 L min−1 for HH01 was estimated. An emission estimate of ≈0.7 L min−1 was derived for HH002 from an incomplete suction measurement. The LDC reported leak sizes of ≈2.5 cm2 for HH001 and of ≈3 cm2 for HH002, which then give emission rates of 39 and 45 L min−1, respectively, from the hole method. For both locations, leaks were due to pipeline corrosion.
3.4 Emission rates of different leak safety types
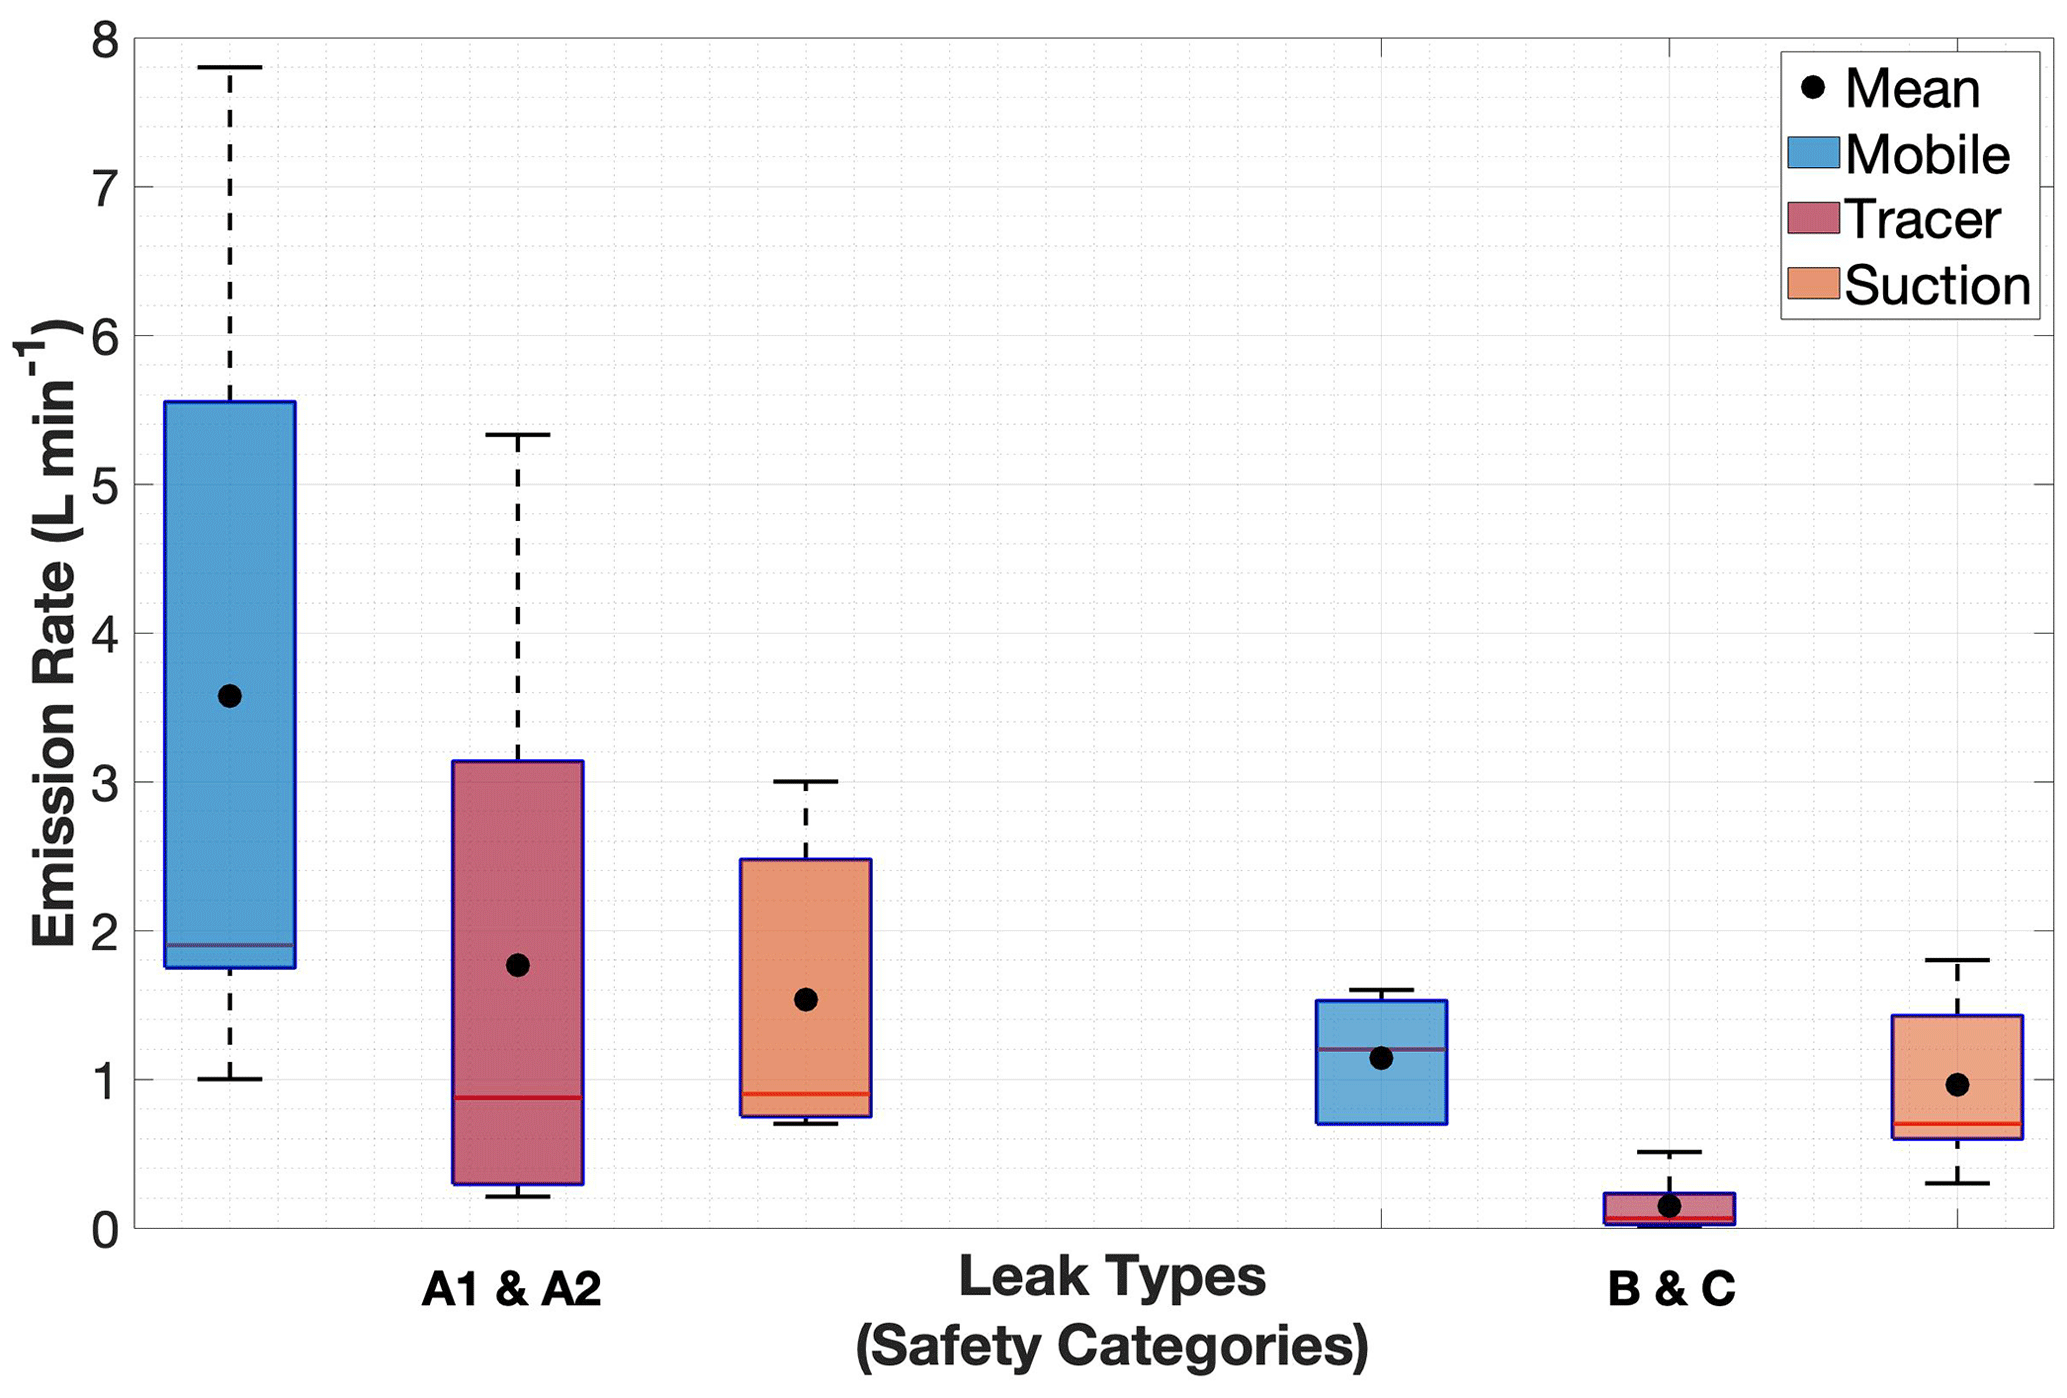
The 18 confirmed gas leak locations that were investigated in the campaign were categorized into the 4 safety categories: A1 (n=7), A2 (n=2), B (n=2), and C (n=7). The mobile method quantified all the A1 and A2 leaks (n=9) as having an average emission rate of 3.6 L min−1. Five out of nine leaks in categories B and C were quantified with the mobile technique, including the 10 % threshold with an average emission rate of 1.1 L min−1 (n=5). Apart from one location, which had to be fixed before the measurements, the tracer method quantified the A1 and A2 leaks (n=8) and reported an average emission rate of 1.8 L min−1. The tracer method also quantified all the B and C leaks (n=9) as having an average emission rate of 0.1 L min−1. The suction method could provide incomplete measurements at only three locations of A1 and A2 leaks, with an average emission rate of 1.5 L min−1 (n=3), mostly due to the safety and time constraints and medium to large underground accumulations of CH4. The suction method was used to measure at five out of nine B and C locations; one of the measurements was complete, and the others were incomplete, with an average emission rate of 1.0 L min−1 (n=5). Although the number of quantified leaks is limited, all the three methods show that the emission rates from category A1 and A2 leaks are higher than category B and C leaks (Fig. 6). This indicates that the site selection bias of measurements for the suction method due to safety concerns (see qualifier above) can lead to a bias in the emission rate with this method. Except for three leaks (HH003, HH009, and HH011), leaks were located by the repair team where the carpet method reported the existence of gas leak(s). These three leaks were finally found at some distance from the location initially indicated by the carpet method. These three leaks are medium or high emitters and belong to type A1. Although the number of locations in this study is very small, this supports the common sense assumption that bigger leaks can spread out more widely in soil and contaminate a larger undersurface area. Therefore, the bigger leaks may be mislocated by the carpet method, and they are also more likely to fill cavities, placing them in a higher safety category.
4.1 Leak detection methods
4.1.1 Leak location vs. outlet location
There is a difference between the location of the leak in the gas pipeline (leak location; see Sect. S7) and the location where the gas is emitted to the atmosphere (outlet locations; see Sect. S2). Furthermore, a single leak in the gas pipeline can result in multiple emission outlets at the surface. In this campaign we observed that in most cases (2 out of 18), the emission outlet at the surface occurred only a few metres (sometimes <1 m) from the location of the leak in the gas pipeline. However, in one case, an emission outlet was detected about 60 m away from the leak location, indicating significant underground gas accumulation and migration (see Fig. 4).
4.1.2 Intercomparison of the gas leak detection methods
The mobile method detects atmospheric CH4 enhancements while measuring continuously with parts-per-billion precision from an inlet installed at the front bumper of the car, while LDCs apply the carpet method with an instrument precision at the parts-per-million level. High precision for the carpet method is not needed as the inlet to their instruments is connected to a carpet, which is attached to the ground. The mobile method can cover larger areas in shorter times, but not all roads, walkways, or other surface areas where pipelines are buried are accessible with a vehicle. The advantage of the carpet method is that it can precisely follow the pipeline map, which also means that it can locate leaks more precisely. The mobile method uses a 10 % threshold to neglect unreliable gas leak sources, which sometimes results in neglecting actual signals from small leaks. Also the mobile measurements do not detect all leaks due to the dependence on the wind direction (only downwind-source leaks can be detected). Luetschwager et al. (2021) suggested that five to eight plume transects gives >90 % probability of gas leak detection at a given location, so if all the streets in an urban area are covered five to eight times, >90 % of the leaks can be detected by mobile measurements.
Both the mobile and the carpet method use C2H6 signals for distinguishing between fossil and microbial CH4 emissions, and as for C2H6, the instrument used with the mobile method is more sensitive and faster. With the carpet method, the laboratory analysis of C2H6 is slow and has a higher detection threshold compared to the mobile method, where C2H6 is measured in real time during the surveys and also on foot from the emission outlet. The CRDS instrument provides real-time measurements of CH4 and C2H6 at 1 Hz frequency, so checking various outlets at a possible gas leak location is faster.
At 14 out of the 20 locations in this study, gas leaks were detected (CH4 signals passing the 10 % threshold) and quantified with the mobile method. However, we observed that four out of five locations reported by the LDC would not have been detected in mobile surveys without prior information on the existence of the leaks because the maximum enhancement was below the mobile detection threshold. At the only location (HH100) from the list of the LDC where the mobile method could quantify the emissions, the outlets were located on the road, and the vehicle was driving on top of the outlet. For this location only one of the transects passed the 10 % enhancement threshold, and the quantification for this location was ≈0.7 L min−1, close to the detection threshold of this method, ≈0.5 L min−1. One of the other locations, HH101, reported by the LDC had similar surrounding conditions (e.g. presence of buildings, road conditions) to the other leaks detected by the mobile method, but still the mobile method was not able to detect a gas leak at this location without a priori information from the utility. The quantifications made by the tracer method suggest that the emission rates of the locations provided by the LDC were much lower than the locations detected by mobile measurements (Table 1). The 10 % threshold with the mobile method precludes the identification of small leaks (<0.5 L min−1), which would only be identified by the carpet method.
4.2 Signal attribution with mobile detection method
4.2.1 Attribution during mobile survey in car
During the mobile measurements we used two approaches to find a correlation between CH4 and C2H6. When we compare the online measurements point by point, the probability of detecting a fossil signal is high, as only one single significant reading is sufficient to indicate a fossil signal. When we use the R2 of the linear correlation between CH4 and C2H6 enhancements above the cut-off, the attribution is more reliable. In a large dataset without a priori information on the existence of a gas leak at different locations, the correlation method is more trustworthy as the point-by-point method could be affected by instrument noise and/or spikes.
We also used CO2 signals and their correlation with CH4 signals to investigate interference from combustion or microbial processes. For only seven plumes at six locations did we detect correlations between CO2 and CH4, which could indicate either oxidation of CH4 to CO2 or mixture of microbial CH4 emissions from, for example, the sewer system with the emissions from natural gas leaks. The number of these possible co-emissions is low compared to the number of total transects (only ≈7 % of the plumes with CH4 enhancements greater than 10 %), thus such an admixture of microbial CH4 should not impact the quantification from the mobile method significantly.
4.2.2 Plume attribution to emission outlets
The outlet attribution was performed using the G4302 CRDS instrument, which is portable like a backpack. We checked the outlets (see Sect. S2, Fig. S1) around the locations of interest and evaluated the correlation between CH4 and C2H6 and the persistence of the emissions on different days. In theory, it is possible to estimate contributions of fossil and microbial CH4 in a plume using the ethane signals during the mobile measurements with the vehicle and the reference C2:C1 ratio provided by the LDC. However, due to the inconclusive and variable C2H6 signals in ambient air, sometimes the ratio measured and constrained between 1 % and 10 % was higher than what the LDC reported, and it was not feasible to quantify the possible contribution of microbial methane emissions. Nevertheless, the C2H6 signals of the G4302 CRDS instrument were still very useful to identify a location as a possible gas leak location or not. For all 15 locations which were initially detected by the mobile method, we observed detectable C2H6 signals, including the two locations which later were not confirmed as a gas leak location by the LDC. This suggests that either the leak is at a greater distance, and depending on the transport of the emission we can periodically see the signals at the detected outlets, or there are sources that produce both CH4 and C2H6 in the vicinity of the location.
4.3 Leak quantification methods
4.3.1 Mobile method
If the outlets are close to each other, we may observe several CH4 enhancements close to each other or overlapping when a single transect is performed at a close distance. If we assume that the number of CH4 maxima is equivalent to the number of real outlets that exist on a road and only use the maximum enhancements from the most pronounced plume to calculate the emission rate, the total emission will be underestimated with the mobile method.
Emission rate estimates with the mobile method from individual transects are associated with high uncertainty, related to variabilities under either aboveground or underground conditions. For example, an unfavourable wind direction (aboveground condition) can result in missing a plume from a gas leak. The mobile measurement van itself may also affect the measurement, e.g. by creating pressure fluctuations. Luetschwager et al. (2021) showed that the quantifications from the same leak in individual mobile transects can vary by more than an order of magnitude. In Hamburg, we found that the range can even be a factor of 50 or 100 in exceptional cases (Table 2). This high variability illustrates that if we perform only one transect per location, the estimated leak emission rate can result in high under- or overestimation in emission estimates for the single location, as was also reported by Maazallahi et al. (2020b). This large uncertainty for individual locations is less severe when the results are extrapolated to the city level, where the sample size is also large, including over- and underestimates (Brandt et al., 2016).
In our previous study in Hamburg (Maazallahi et al., 2020b) the overall average emission rate for all the LIs was estimated to be 3.4 L min−1 per leak indication (n=145), while for the fossil-attributed locations it was 5.2 L min−1 per leak indication (n=45, standard error of 3.1). This showed that the biggest emitters were among the fossil categories. In the present study, the average emission rate from mobile measurements for the gas leak locations is 2.7 L min−1 per leak indication (n=14, standard error of 0.6). The higher average emission rate per fossil location in the first campaign may have been caused by the fact that in that campaign only a smaller number of transects were performed per location (on average 1.1 in the precious study versus 6.9 transects with a CH4>10 % threshold per location in the present study). Luetschwager et al. (2021) stated that after six transects with CH4 exceeding the 10 % threshold per location the average overestimation of leak size estimates will be less than 10 %. In addition, the differences in sample size and locations in these two studies (45 versus 14 locations in the first and second studies, respectively) may partially explain the difference in average. This is because the probability of detecting large emitters, which increase the average emission rate of all leaks, increases with sample size.
The two CH4 sensors in the mobile van play specific roles in the detection and quantification of leaks. CH4 enhancements on the G2301 are 3.8 times lower than the G4302. This is an artefact of the G2301, which smoothes the signal compared to the G4302 because of the slower pump and sampling rate (see Sect. S8.1). On the other hand, this results in more signals passing the 10 % threshold on G4302. This then also leads to higher detection probabilities using G4302 (see Sect. S.82). A larger record of CH4 enhancements also results in higher emission rate quantification using Eq. (1) (see Sect. S8.3). We use the G2301 for quantification, since this is the instrument that was also used for introduction of the mobile equation quantification in Weller et al. (2019). The quantification of the gas leak locations using Eq. (1) depends only on the CH4 enhancements. This yields emission rates about a factor of 2 higher from G4302 than from G2301 for the same plumes. When we evaluate the plume areas from the two instruments, they are much closer to the 1:1 line (see Sect. S8.3). This agrees with findings from another study using two different in situ instruments in a mobile car (see Fig. S6 from Ars et al., 2020 and Table S3 from Maazallahi et al., 2020b). They also found that the plume area is closer to the 1:1 line with mobile measurements even if the air intakes are not at the same location on the vehicle. This suggests that the plume area is a more robust parameter than maximum enhancement for emission rate quantification, and a leak rate quantification equation using the plume area should be developed.
In general, the closer the air intake is to the emission point the higher the CH4 mole fraction reading is (see Sect. S9), but when several outlets are present at one location it is not possible to uniquely determine the distance to the emission point or to determine which plume belongs to which outlet. Equation (1) from Weller et al. (2019) only uses the maximum CH4 enhancements above the 10 % threshold from each pass. In their controlled-release experiments the average distance between the leak and measurement was 15.75 m. Analysis of our results (Table S4, Sect. S5) shows that higher maximum mixing ratios are encountered more often when the distances of the transect to the leak location are small. For example, at HH002 the transect was very close to the main emission point, which likely leads to the substantially higher emission rate estimate derived from the mobile method (4.9 L min−1) compared to the tracer method (0.22 L min−1). On the other hand, at HH011 the mobile method underestimates the emission rate (see Sect. 3.3.1), as at this location the measurement distance to the leak was larger than the reference distance of 15.75 m applied by Weller et al. (2019). This suggests that to reduce the quantification error for individual leak locations, distance should also be included in an improved transfer equation. Although distance is a parameter with some quantification methods, e.g. Gaussian plume dispersion, and not in others, e.g. in mass balance, to the best of our knowledge, this is the first study providing field evidence that distance is a factor that can affect emission quantification using the Weller et al. (2019) method.
The effect of neglecting or retaining the transects with enhancement maxima below the 10 % threshold was quantitatively investigated for five locations where the tracer team conducted mobile measurements (see Sect. S10). These measurements were evaluated as “controlled-release” experiments for C2H2 because the actual C2H2 release rate is known, and measurements were made in mobile mode. The standard mobile quantification algorithm with the 10 % threshold yields emission estimates that are in relatively good agreement with the released quantities, whereas the estimates are biased considerably low when measurements with maxima below the threshold are retained. This supports the use of the original method, which removes transects with an improper realization of the plume. Relating to Sect. 4.5, it must be noted, however, that in these measurements the distances of the C2H2 maxima to the release points were between 30 and 45 m, thus larger than the normal distance of mobile CH4 measurement to the emission outlets (from few a metres up to 30 m).
4.3.2 Tracer method
The tracer method is more labour-intensive than the mobile method. However, the strength of the method is the application of a tracer gas providing the plume dilution and avoiding the use of atmospheric dispersion models and weather information. If the tracer release location does not reflect the sum of all the outlet emissions at a gas leak location or misses some of the outlets, then the total emission quantification from the gas leaks will be underestimated. An example of such a case is site HH011 in this study, where the leak location in the gas pipeline (after quantification; see Fig. 1) was found to be located about 60 m upwind from the targeted emission outlet. During tracer quantification, an additional CH4 plume (not defined by the tracer gas) was observed, indicating more than one emission outlet (Fig. 4). The confirmation for this is the finding of the gas leak location by the carpet method. The emission rate of the targeted emission source (the vent and the drain) thus does not represent the combined emission from the gas leak in the pipeline located 60 m upwind from the emission source. Further surface screening and leak detection would have been needed to identify and quantify all emission outlets.
4.3.3 Suction method
The suction method is the most labour-intensive quantification method. Following a strict, safety first protocol the gas utilities fix leaks in the A1 safety category immediately upon detection and A2 leaks within a week. Given logistical constraints, the suction method therefore mainly or exclusively quantifies B or C leaks (50 % of confirmed gas leak location in this study). We investigated whether such a site selection bias could lead to a bias in the average quantified emission rate in the inventory report. In this study, we observed that the leaks detected from the mobile methods were mostly in categories A1 and A2, and the biggest emitters (based on the mobile and tracer release measurements) had soil CH4 accumulation of a magnitude that prevented successful application of the suction method. Further research is needed to identify the physical mechanism(s) to explain the observed correlation between A1 and A2 leaks and high emission rates. As a hypothesis, the presence of soil cavities associated with leak category A1 may result in higher permeability, i.e. lower underground resistance, which then leads to a higher emission rate for the same pipeline hole size compared to locations with no cavity.
The suction method was intended to be deployed right before the repair measures. For some of these locations, the suction method was in operation for more than 10 h, but due to the high soil CH4 accumulation, the measurements were stopped and labelled as incomplete in this study. For the other locations with high soil CH4 accumulation, the suction method was not attempted, given the expectation (based on experience at the incomplete locations) that completion of measurements for leak rate quantification at those locations was unlikely.
4.3.4 Hole method
Based on the leak size, pipeline depth, and overpressure, the average emission rate was estimated at 40 L min−1 (n=5). We note that these estimated should be regarded as upper limits since flow restrictions outside the pipe are not included. The emission range of individual gas leaks based on the hole method is between 19 and 150 L min−1 for 1 to 15 cm2 hole sizes, respectively, larger than any of the measurement-based quantification methods. This method requires information about the overpressure of the gas pipeline, depth of the buried pipeline, and size of a leak, and it does not include the information about soil properties, which can impact the emission rate.
4.3.5 Intercomparison of methods
In this study, a reliable quantitative intercomparison of the three methods (mobile, tracer, and suction methods) was attempted. A complete comparison of all three methods was possible at only 1 out of 20 locations (18 confirmed gas leak locations) because of the long time (> 8–10 h) needed for full equilibrium of the suction method, whereby emission rates for 7 out of the 8 leaks quantified by the suction method were reported as maxima rather than absolute values (Table 1). At these seven locations the emission was thus overestimated.
In total, the average CH4 emissions from natural gas pipeline leaks for the same locations where we have quantifications from mobile and tracer methods (n=13) are 2.8 and 1.2 L min−1, respectively. The suction method could only be completed at one location. The average emission rate reported for all the locations from the suction method (high bias due to incomplete measurement) is 1.2 L min−1 (n=8).
The higher emission rates derived with the mobile method are in qualitative agreement with previous studies. Weller et al. (2018) compared quantifications from the mobile measurements described in von Fischer et al. (2017) with the tracer method and surface enclosure method in four US cities. They reported that mobile measurement estimates were ≈2.3 L min−1 greater than the tracer method mean estimates of ≈3.2 L min−1 (n=59). This was attributed to the overestimation of small leaks (<2.4 L min−1) with the mobile measurement method, which we also discuss above for our dataset. In addition, the performance of only a few transects at individual locations also leads to systematically highly biased emission rate estimates for higher emission rates (Luetschwager et al., 2021). Indeed, at the locations where we only have one transect with CH4 enhancements above the 10 % threshold, there is an overestimation from the mobile method compared to the tracer method. For example, at HH001 (n=1), HH015 (n=1), and HH100 (n=1) the mobile method estimated emissions that were a factor of 4 higher in comparison to the tracer method. The analysis of Luetschwager et al. (2021) clearly shows that this high bias is reduced when numerous transects are performed. Therefore, we carried out multiple transects to reduce this systematic bias. We note that there are also large differences between the mobile and tracer methods, e.g. HH002 and HH006. We suspect that the very short gas leak location distance to the mobile driving transects can partially explain the difference. Moreover, the existence of another leak in the category of A1 at the HH006 location, which had to be fixed prior to the tracer method, could explain the difference in emission rate magnitude at this location. Nevertheless, the limited number of transects and the 10 % threshold can contribute to an overestimation of the average leak rate with the mobile method at an individual location. At the same time, however, the mobile method fails to detect leaks entirely when the leak outlet is located downwind of the mobile van. The fact that the mobile method misses downwind emissions constitutes a method-specific factor towards biassing city-wide emissions low, which qualitatively counteracts the high bias above. Generally, the tracer method has higher precision than the mobile method, but it is more labour-intensive. Although the mobile method has lower precision for emission quantification of individual gas leaks, this method can be implemented widely in a shorter time frame at the city scale. The mobile method is an empirical statistical quantification approach based on controlled-release experiments, and a large sample size gives a better estimation of total emission (Weller et al., 2020). Acting on parameters in plume dispersion, such as distance and wind speed, which are not included with the method, the mobile method can overestimate and underestimate individual gas leaks, but with a large number of gas leak quantifications these over- and underestimations may cancel each other out. If (i) particularly large concurrent subsurface CH4 and C2H6 accumulations with multiple emission outlets are observed (this has priority – indication of a large leak), or (ii) a few of the leaks are significantly larger, with smaller subsurface accumulation than the other leaks, an optimal approach may be to supplement the mobile method with use of a more precise measurement method such as the tracer method at those selected locations. The divergence to accurate city-wide quantification is dependent on urban planning, e.g. width of streets, location of gas pipelines (under streets, pavement, etc.) and emission outlet location(s).
4.4 Possible sampling bias of suction method toward low-gas-leak-emission locations
Following our communications with the emission inventory experts (Christian Böttcher, personal communications, 2022), we cannot fully reconstruct the methods that are used in the existing national inventory report to establish the emission factors due to lack of transparency. However, the German Environmental Agency (UBA) is considering using the results of the recent large-scale measurement campaign based on the suction method (MEEM, 2018) in future publications of the national emission inventory in Germany (Federal Environment Agency, 2021). The utilities choose leak locations for application of the suction method where there are no safety concerns, and/or immediate leak closure is compulsory. This implies that this method is not applied at locations of category A1, which demand immediate repair (p. 27 in MEEM, 2018). Due to logistic constraints and the time-consuming nature of the suction measurements, they are likely also not (or rarely) applied at locations in category A2, which require repair within a week. Thus, suction measurements have a location sampling bias towards leaks in categories B and C. This is supported by the fact that the leak locations that were contributed by the LDC to the intercomparison campaign were locations in categories B and C. This study investigated whether this location sampling bias could result in an emission rate bias, which could contribute to the fact that the suction method did not report leaks with emission rates as high as they have been reported by the mobile method in this study or during previous measurements in the same city (Maazallahi et al., 2020b).
In this study, emission rates from category A1 and A2 leaks were larger compared to those from category B and C leaks (Fig. 6). The emission rate differences vary by measurement method: a factor of 2 for the mobile method (n=9 for A1 and A2, n=4 for B and C), a factor of 11 for the tracer method (n=8 for A1 and A2, n=8 for B and C), and a factor of 1.6 for the suction method (n=3 for A1 and A2, n=5 for B and C). For the mobile method, there is a clear separation between categories A1 and A2 versus categories B and C. The highest emission estimate for the B and C group (HH010) is similar to the lowest emission rate estimate for the A1 and A2 group (HH014). Furthermore, HH011 in category A1 was very likely biased low because of the wrongly assumed leak location.
For the tracer method, the difference between the two groups is largest, an order of magnitude, and we know that emissions are underestimated at least at one location of category A1 (HH011). The uncertainty in the tracer method is much smaller than the difference between the two groups. The tracer method also illustrates that four of the five leaks that were contributed by the LDC to the intercomparison campaign were extremely small. If these would be representative of locations where the suction method is usually applied, it would indeed indicate a severe emission rate bias for the suction method, not because the measurements themselves are biased, but because locations with low emission rates are targeted with this method. In the intercomparison campaign, we attempted to also apply the suction method at locations of category A, but at eight out of nine locations from category A, the suction measurements could not be applied for safety reasons, or suction could not be completed because of the widespread subsurface accumulation (Table 2). At the other A location (HH014), the suction method could not be applied as the ground had already been opened for the repair.
In summer 2020, we compared three gas-leak-rate quantification methods, namely the mobile, tracer, and suction methods, in Hamburg, Germany. While the mobile and tracer methods have been compared previously, this is the first peer-reviewed study to include the suction method, although suction measurements could not be completed in 1 d at most locations.
The mobile method can cover large areas in a short time, but some of the smaller leaks (<0.5 L min−1) are not identified as a gas leak location due to the 10 % enhancement threshold in the standard mobile quantification algorithm. While the mobile method quantification algorithm is designed to accurately report city-level total gas distribution leak rates (i.e. considering a large sample size), it has large (known) uncertainties for individual leaks. The tracer method has a smaller uncertainty, but it is labour-intensive in comparison to the mobile method. On average, CH4 emissions from natural gas pipeline leaks were higher from mobile quantifications in comparison to tracer quantifications. For many locations, we encountered several outlets with widespread underground gas accumulations. At one location, after deployment of the mobile and the tracer quantification methods and during the repair measures, it was found that the actual leak in the gas pipeline was located ≈60 m away from the identified emission outlet, indicating significant underground gas migration. It is possible that this leak had several emission outlets that were not identified, and the emission quantified from the single outlet is thus not representative of the whole emission from this leak.
The suction method has a low reported uncertainty, but it is even more labour- and time-intensive than the tracer method. Due to the time and effort needed to plan and execute the measurements, the suction method is likely never applied in routine operation at A1 or A2 safety category leaks that mandate immediate or timely repair. In our study, it was also not feasible to apply the suction method at locations with large subsurface CH4 accumulations. Our results thus indicate a systematic difference between A1 and A2 (high emissions) versus B and C (low emissions) category locations, and generally larger emission rates are inferred with the mobile and tracer methods for sites with widespread subsurface accumulation.
This study did not allow a direct, quantitative comparison of emission rates estimated with all three different methods because of the inability to quantify the same leak locations with all methods. However, this inability illuminates the importance of site selection for deriving representative emission factors based on empirical measurements. Specifically, the results suggest that a significant emission rate bias could exist for measurements that are carried out with the suction method. Our results therefore stipulate that representative site selection includes sampling in all leak safety categories (MEEM, 2018). Otherwise, this could lead to a sampling and emission rate bias in the national inventory of gas leak CH4 emission in Germany.
A MATLAB® code to analyze urban surveys is available on GitHub at https://doi.org/10.5281/zenodo.3928972 (Maazallahi et al., 2020a).
The mobile and tracer release datasets are available on the Integrated Carbon Observation System (ICOS) portal from Maazallahi et al. (2023a).
A virtual tour of the measurements is available on the Leibniz Information Centre for Science and Technology and University Library (TIB) portal from Maazallahi et al. (2023b).
The supplement related to this article is available online at: https://doi.org/10.5194/amt-16-5051-2023-supplement.
TR, HM, and SS conceived and designed the study. TR coordinated the campaign in collaboration with DBI, Technical University of Denmark (DTU), Environmental Defense Fund (EDF), E.ON, and Gasnetz Hamburg (GNH) teams. HM carried out the mobile measurements and emission outlet attribution, performed the analyses of mobile data, and collectively with TR analysed the intercomparison results. AD, CS, and AMF performed the tracer method and reported the emission rates from the tracer dataset. HDvdG and TR made instruments and equipment available for the mobile method, and CS provided those for the tracer method. HM wrote the paper, and all co-authors supported the interpretation of the results and contributed to improving the paper.
At least one of the (co-)authors is a member of the editorial board of Atmospheric Measurement Techniques. The peer-review process was guided by an independent editor, and the authors also have no other competing interests to declare.
Publisher’s note: Copernicus Publications remains neutral with regard to jurisdictional claims made in the text, published maps, institutional affiliations, or any other geographical representation in this paper. While Copernicus Publications makes every effort to include appropriate place names, the final responsibility lies with the authors.
We appreciate the efforts from Luise Westphal, Michael Dammann, Ralf Luy, Christian Feickert, Volker Krell, Turhan Ulas, Dieter Bruhns, and Sönke Graumann from Gasnetz Hamburg GmbH, who facilitated this study by hosting the teams, arranging and applying the carpet method leak detection and confirmation procedures, making information on gas leaks and pipelines available for the data analysis, and applying leak repair protocols. We extend our appreciation to Andre Lennartz, Stefan Gollanek, and Dieter Wolf from E.On for their contribution to the planning of the campaign, deploying the suction method at the locations, and exchanging their knowledge and experiences from their previous campaigns. We thank the team from DBI Gas and Environmental Technologies GmbH Leipzig (DBI GUT Leipzig), including Charlotte Große, who contributed to providing information for structuring the campaign planning.
This study was carried out with the financial support of the Environmental Defense Fund. Extra financial support was provided by the H2020 Marie Skłodowska-Curie Actions through the “Methane goes Mobile – Measurements and Modelling” project (MEMO2; https://h2020-memo2.eu/, last access: 20 April 2022; grant no. 722479). The Robertson Foundation supported the contribution of Stefan Schwietzke to this study.
This paper was edited by Linlu Mei and reviewed by five anonymous referees.
Alvarez, R. A., Pacala, S. W., Winebrake, J. J., Chameides, W. L., and Hamburg, S. P.: Greater focus needed on methane leakage from natural gas infrastructure, P. Natl. Acad. Sci. USA, 109, 6435–6440, https://doi.org/10.1073/pnas.1202407109, 2012.
Alvarez, R. A., Zavala-Araiza, D., Lyon, D. R., Allen, D. T., Barkley, Z. R., Brandt, A. R., Davis, K. J., Herndon, S. C., Jacob, D. J., Karion, A., Kort, E. A., Lamb, B. K., Lauvaux, T., Maasakkers, J. D., Marchese, A. J., Omara, M., Pacala, S. W., Peischl, J., Robinson, A. L., Shepson, P. B., Sweeney, C., Townsend-Small, A., Wofsy, S. C., and Hamburg, S. P.: Assessment of methane emissions from the U.S. oil and gas supply chain, Science, 361, 186–188, https://doi.org/10.1126/science.aar7204, 2018.
Arnaldos, J., Casal, J., Montiel, H., Sánchez-Carricondo, M., Vílchez, J. A., Design of a computer tool for the evaluation of the consequences of accidental natural gas releases in distribution pipes, J. Loss Prevent. Proc., 11, 135–148, https://doi.org/10.1016/S0950-4230(97)00041-7, 1998.
Ars, S., Vogel, F., Arrowsmith, C., Heerah, S., Knuckey, E., Lavoie, J., Lee, C., Mostafavi Pak, N., Phillips, J. L., and Wunch, D.: Investigation of the Spatial Distribution of Methane Sources in the Greater Toronto Area Using Mobile Gas Monitoring Systems, Environ. Sci. Technol., 54, 15671–15679, https://doi.org/10.1021/acs.est.0c05386, 2020.
Bousquet, P., Ciais, P., Miller, J. B., Dlugokencky, E. J., Hauglustaine, D. A., Prigent, C., Van der Werf, G. R., Peylin, P., Brunke, E. G., Carouge, C., Langenfelds, R. L., Lathière, J., Papa, F., Ramonet, M., Schmidt, M., Steele, L. P., Tyler, S. C., and White, J.: Contribution of anthropogenic and natural sources to atmospheric methane variability, Nature, 443, 439–443, https://doi.org/10.1038/nature05132, 2006.
Brandt, A. R., Heath, G. A., and Cooley, D.: Methane Leaks from Natural Gas Systems Follow Extreme Distributions, Environ. Sci. Technol., 50, 12512–12520, https://doi.org/10.1021/acs.est.6b04303, 2016.
Cho, Y., Ulrich, B. A., Zimmerle, D. J., and Smits, K. M.: Estimating natural gas emissions from underground pipelines using surface concentration measurements, Environ. Pollut., 267, 115514, https://doi.org/10.1016/j.envpol.2020.115514, 2020.
Defratyka, S. M., Paris, J. D., Yver-Kwok, C., Fernandez, J. M., Korben, P., and Bousquet, P.: Mapping Urban Methane Sources in Paris, France, Environ. Sci. Technol., 55, 8583–8591, https://doi.org/10.1021/acs.est.1c00859, 2021.
Delre, A.: Greenhouse gas emissions from wastewater treatment plants: measurements and carbon footprint assessment, PhD thesis, Department of Environmental Engineering, Technical University of Denmark (DTU), Copenhagen, https://orbit.dtu.dk/en/publications/ greenhouse-gas-emissions-from-wastewater-treatment-plants-measure (last access: 15 June 2021), 2018.
DVGW: Technische Regel-Arbeitsblatt; DVGW G465-1 (A), https://shop.wvgw.de/var/assets/leseprobe//510544_lp_G 465-1_2019_05.pdf (last access: 15 December 2021), 2019.
DVGW: High-performing infrastructure, https://www.dvgw.de/english-pages/topics/safety-and-security/technical-safety-gas (last access: 25 January 2022), 2022.
Ebrahimi-Moghadam, A., Farzaneh-Gord, M., Arabkoohsar, A., and Jabari Moghadam, A.: CFD analysis of natural gas emission from damaged pipelines: Correlation development for leakage estimation, J. Clean. Prod., 199, 257–271, https://doi.org/10.1016/j.jclepro.2018.07.127, 2018.
EC: EU strategy to reduce methane emissions, https://eur-lex.europa.eu/legal-content/EN/TXT/?uri=CELEX%3A52020DC0663&qid=1644853088591 (last access: 28 March 2022), 2020.
EIA: Carbon Dioxide Emissions Coefficients, https://www.eia.gov/environment/emissions/co2_vol_mass.php (last access: 28 March 2022), 2021.
EPA: Methane emissions from the natural gas industry: underground pipelines, https://www.epa.gov/sites/production/files/2016-08/documents/9_underground.pdf (last access: 6 October 2023), 1996.
Federal Environment Agency: National Inventory Report for the German Greenhouse Gas Inventory 1990–2018, https://unfccc.int/documents/226313 (last access: 30 March 2022), 2020.
Federal Environment Agency: National Inventory Report for the German Greenhouse Gas Inventory 1990–2019, https://unfccc.int/documents/194930 (last access: 15 December 2022), 2021.
Fernandez, J. M., Maazallahi, H., France, J. L., Menoud, M., Corbu, M., Ardelean, M., Calcan, A., Townsend-Small, A., van der Veen, C., Fisher, R. E., Lowry, D., Nisbet, E. G., and Röckmann, T.: Street-level methane emissions of Bucharest, Romania and the dominance of urban wastewater, Atmospheric Environment: X, 13, 2590–1621, 100153, https://doi.org/10.1016/j.aeaoa.2022.100153, 2022.
Fredenslund, A. M., Scheutz, C., and Kjeldsen, P.: Tracer method to measure landfill gas emissions from leachate collection systems, Waste Manage., 30, 2146–2152, https://doi.org/10.1016/j.wasman.2010.03.013, 2010.
Fredenslund, A. M., Rees-White, T. C., Beaven, R. P., Delre, A., Finlayson, A., Helmore, J., Allen, G., and Scheutz, C.: Validation and error assessment of the mobile tracer gas dispersion method for measurement of fugitive emissions from area sources, Waste Manage., 83, 68–78, https://doi.org/10.1016/j.wasman.2018.10.036, 2019.
Hendrick, M. F., Ackle, R., Sanaie-Movahed, B., Tang, X., and Phillips, N. G.: Fugitive methane emissions from leak-prone natural gas distribution infrastructure in urban environments, Environ. Pollut., 213, 710–716, https://doi.org/10.1016/j.envpol.2016.01.094, 2016.
Hou, Q., Yang, D., Li, X., Xiao, G., and Ho, S. C. M.: Modified Leakage Rate Calculation Models of NaturalGas Pipelines, Math. Probl. Eng., 2020, 6673107, https://doi.org/10.1155/2020/6673107, 2020.
Jackson, R. B., Down, A., Phillips, N. G., Ackley, R. C., Cook, C. W., Plata, D. L., and Zhao, K.: Natural Gas Pipeline Leaks Across Washington, DC, Environ. Sci. Technol., 48, 2051–2058, https://doi.org/10.1021/es404474x, 2014.
Jackson, R. B., Saunois, M., Bousquet, P., Canadell, J. G., Poulter, B., Stavert, A. R., Bergamaschi, P., Niwa, Y., Segers, A., and Tsuruta, A.: Increasing anthropogenic methane emissions arise equally from agricultural and fossil fuel sources, Environ. Res. Lett., 15, 071002, https://doi.org/10.1088/1748-9326/ab9ed2, 2020.
Kayser, J. C. and Shambaugh, R. L.: Discharge coefficients for compressible flow through small-diameter orifices and convergent nozzles, Chem. Eng. Sci., 46, 1697–1711, https://doi.org/10.1016/0009-2509(91)87017-7, 1991.
Kirchgessner, D. A., Lott R. A., Cowgill, R. M., Harrison, M. R., and Shires, T. M.: Estimate of methane emissions from the U.S. natural gas industry, Chemosphere, 35, 1365–1390, https://doi.org/10.1016/S0045-6535(97)00236-1, 1997.
Keyes, T., Ridge G., Klein, M., Phillips, N., Ackley, R., and Yang, Y.: An enhanced procedure for urban mobile methane leak detection, Heliyon, 6, E04876, https://doi.org/10.1016/j.heliyon.2020.e04876, 2020.
Lamb, B. K., McManus, J. B., Shorter, J. H., Kolb, C. E., Mosher, B., Harriss, R. C., Allwine, E., Blaha, D., Howard, T., Guenther, A., Lott, R. A., Siverson, R., Westburg, H., and Zimmerman, P.: Development of atmospheric tracer methods to measure methane emissions from natural gas facilities and urban areas, Environ. Sci. Technol., 29, 1468–1479, https://doi.org/10.1021/es00006a007, 1995.
Lamb, B. K., Edburg, S. L., Ferrara, T. W., Howard, T., Harrison, M. R., Kolb, C. E., Townsend-Small, A., Dyck, W., Possolo, A., and Whetstone, J. R., Environ. Sci. Technol., 49, 5161–5169, https://doi.org/10.1021/es505116p, 2015.
Liu, C., Liao, Y., Liang, J., Cui, Z., and Li, Y.: Quantifying methane release and dispersion estimations for buried natural gas pipeline leakages, Process Saf. Environ., 146, 552–563, https://doi.org/10.1016/j.psep.2020.11.031, 2021.
Luetschwager, E., von Fischer, J. C., and Weller, Z. D.: Characterizing detection probabilities of advanced mobile leak surveys: Implications for sampling effort and leak size estimation in natural gas distribution systems, Elementa: Science of the Anthropocene, 9, 00143, https://doi.org/10.1525/elementa.2020.00143, 2021.
Maazallahi, H., Fernandez, J. M., Menoud, M., Zavala-Araiza, D., Weller, Z. D., Schwietzke, S., von Fischer, J. C., Denier van der Gon, H., and Röckmann, T.: MATLAB® code for evaluation of Urban Surveys, Zenodo [code], https://doi.org/10.5281/zenodo.3928972, 2020a.
Maazallahi, H., Fernandez, J. M., Menoud, M., Zavala-Araiza, D., Weller, Z. D., Schwietzke, S., von Fischer, J. C., Denier van der Gon, H., and Röckmann, T.: Methane mapping, emission quantification, and attribution in two European cities: Utrecht (NL) and Hamburg (DE), Atmos. Chem. Phys., 20, 14717–14740, https://doi.org/10.5194/acp-20-14717-2020, 2020b.
Maazallahi, H., Delre, A., Scheutz, C., Fredenslund, A. M., Schwietzke, S., Denier van der Gon, H., and Röckmann, T.: Data supplement to: Maazallahi et al, 2023. Intercomparison of detection and quantification methods for methane emissions from the natural gas distribution network in Hamburg, Germany, AMT, Integrated Carbon Observation System (ICOS) [data set], https://doi.org/10.18160/FEVG-0YGG, 2023a.
Maazallahi, H., Delre, A., Scheutz, C., Fredenslund, A. M., Schwietzke, S., Denier van der Gon, H., and Röckmann, T.: Virtual tour of an intercomparison campaign regarding measurement-based gas leak quantification methods in Hamburg, Germany, TIB-AV portal [video], https://doi.org/10.5446/63190, 2023b.
Mahgerefteh, H., Oke, A., and Atti, O.: Modelling outflow following rupture in pipeline networks, Chem. Eng. Sci., 61, 1811–1818, https://doi.org/10.1016/j.ces.2005.10.013, 2006.
Mandal, P. and Morshed, S.: Localization of fugitive methane emission from natural gas distribution network of Titas Gas, Pol. J. Chem. Technol., 19, 127–131, https://doi.org/10.1515/pjct-2017-0018, 2017.
MEEM (Methane emission estimation method for the gas distribution grid): https://www.dbi-gut.de/emissions.html?file=files/PDFs/Emissionen/Final%20Report_MEEM%20DSO_end_signed.pdf&cid=5804 (last access: 12 December 2022), 2018.
Moloudi, R. and Abolfazli Esfahani, J.: Modeling of gas release following pipeline rupture: Proposing non-dimensional correlation, J. Loss Prevent. Proc., 32, 207–217, https://doi.org/10.1016/j.jlp.2014.09.003, 2014.
Mønster, J. G., Samuelsson, J., Kjeldsen, P., Rella, C. W., and Scheutz, C.: Quantifying methane emission from fugitive sources by combining tracer release and downwind measurements – A sensitivity analysis based on multiple field surveys, Waste Manage., 34, 1416–1428, https://doi.org/10.1016/j.wasman.2014.03.025, 2014.
Myhre, G., Shindell, D., Bréon, F. M., Collins, W., Fuglestvedt, J., Huang, J., Koch, D., Lamarque, J. F., Lee, D., Mendoza, B., Nakajima, T., Robock, A., Stephens, G., Takemura, T., and Zhan, H.: Anthropogenic and Natural Radiative Forcing, in: Climate Change 2013: The Physical Science Basis, Contribution of Working Group I to the Fifth Assessment Report of the Intergovernmental Panel on Climate Change, Cambridge, UK and New York, NY, USA, https://www.ipcc.ch/site/assets/uploads/2018/02/WG1AR5_Chapter08_FINAL.pdf (last access: 6 October 2023), 2013.
Nisbet, E. G., Manning, M. R., Dlugokencky, E. J., Fisher, R. E., Lowry, D., Michel, S. E., Myhre, C. L., Platt, S. M., Allen, G., Bousquet, P., Brownlow, R., Cain, M., France, J. L., Hermansen, O., Hossaini, R., Jones, A. E., Levin, I., Manning, A. C., Myhre, G., Pyle, J. A., Vaughn, B. H., Warwick, N. J., and White, J. W. C.: Very strong atmospheric methane growth in the 4 Years 2014–2017: implications for the Paris agreement, Global Biogeochem. Cy., 33, 318–342, https://doi.org/10.1029/2018GB006009, 2019.
Okamoto, H. and Gomi, Y.: Empirical research on diffusion behavior of leaked gas in the ground, J. Loss Prevent. Proc., 24, 531–540, https://doi.org/10.1016/j.jlp.2011.01.007, 2011.
Phillips, N. G., Ackley, R., Crosson, E. R., Down, A., Hutyra, L. R., Brondfield, M., Karr, J. D., Zhao, K., and Jackson, R. B.: Mapping urban pipeline leaks: Methane leaks across Boston, Environ. Pollut., 173, 1–4, https://doi.org/10.1016/j.envpol.2012.11.003, 2013.
Ulrich, B. A., Mitton, M., Lachenmeyer, E., Hecobian, A., Zimmerle, D., and Smits, K. M.: Natural Gas Emissions from Underground Pipelines and Implications for Leak Detection, Environ. Sci. Tech. Let., 6, 401–406, https://doi.org/10.1021/acs.estlett.9b00291, 2019.
Von Fischer, J. C., Cooley, D., Chamberlain, S., Gaylord, A., Griebenow, C. J., Hamburg, S. P., Salo, J., Schumacher, R., Theobald, D., and Ham, J.: Rapid, Vehicle-Based Identification of Location and Magnitude of Urban Natural Gas Pipeline Leaks, Environ. Sci. Technol., 51, 4091–4099, https://doi.org/10.1021/acs.est.6b06095, 2017.
Weller, Z. D., Roscioli, J. R., Daube, W. C., Lamb, B. K., Ferrara, T. W., Brewer, P. E., and von Fischer, J. C.: Vehicle-Based Methane Surveys for Finding Natural Gas Leaks and Estimating Their Size: Validation and Uncertainty, Environ. Sci. Technol., 52, 11922–11930, https://doi.org/10.1021/acs.est.8b03135, 2018.
Weller, Z. D., Yang, D. K., and von Fischer, J. C.: An open source algorithm to detect natural gas leaks from mobile methane survey data, PLoS ONE, 14, e0212287, https://doi.org/10.1371/journal.pone.0212287, 2019.
Weller, Z. D., Hamburg, S. P., and von Fischer, J. C., A National Estimate of Methane Leakage from Pipeline Mains in Natural Gas Local Distribution Systems, Environ. Sci. Technol., 54, 8958–8967, https://doi.org/10.1021/acs.est.0c00437, 2020.
Wiesner, S., Gröngröft, A., Ament, F., and Eschenbach, A.: Spatial and temporal variability of urban soil water dynamics observed by a soil monitoring network, J. Soils Sediments, 16, 2523–2537, https://doi.org/10.1007/s11368-016-1385-6, 2016.
Worden, J. R., Anthony Bloom, A., Pandey, S., Jiang, Z., Worden, H. M., Walker, T. W., Houweling, S., and Röckmann, T.: Reduced biomass burning emissions reconcile conflicting estimates of the post-2006 atmospheric methane budget, Nat. Commun., 8, 2227, https://doi.org/10.1038/s41467-017-02246-0, 2017.
Yan, Y., Dong, X., and Li, J.: Experimental study of methane diffusion in soil for an underground gas pipe leak, J. Nat. Gas Sci. Eng., 27, 82–89, https://doi.org/10.1016/j.jngse.2015.08.039, 2015.
Yuhua, D., Huilin, G., Jing'en, Z., and Yaorong, F.: Evaluation of gas release rate through holes in pipelines, J. Loss Prevent. Proc., 15, 423–428, https://doi.org/10.1016/S0950-4230(02)00041-4, 2002.