the Creative Commons Attribution 4.0 License.
the Creative Commons Attribution 4.0 License.
 | 11 Apr 2024
Two new 222Rn emanation sources – a comparison study
Tanita J. Ballé
Stefan Röttger
Florian Mertes
Anja Honig
Petr Kovar
Petr P. S. Otáhal
Annette Röttger
More than 50 % of naturally occurring radiation exposure to the general public is due to the noble gas radon (222Rn) and its progenies, causing considerable health risks. Therefore, the European Union has implemented Council Directive 2013/59/EURATOM to measure 222Rn activity concentrations and to identify radon priority areas (RPAs) to specify areas where countermeasures are most needed. Although 222Rn measurements are far spread across Europe, traceability to the International System of Units (SI) is still lacking for radon activity concentrations below 300 Bq m−3. Consequently, measurement results cannot be reliably compared with each other. The European Metrology Research Programme for Innovation and Research (EMPIR) 19ENV01 traceRadon project aimed to address this issue and has developed two new 222Rn emanation sources, intended to be used as calibration standards for reference instruments. The goal of this paper is to investigate and compare the two sources to ensure their quality by comparing the calibration factors estimated from both sources for the same reference instrument. This was done for three reference instruments in total at two experimental sites. Differences in calibration factors for one reference instrument of up to 0.07 were derived. Despite the small differences between the calibration factors, all uncertainties are well within the intended target uncertainty of 10 % for k = 1.
- Article
(709 KB) - Full-text XML
- BibTeX
- EndNote


The radioactive noble gas radon (222Rn) has piqued the interest of researchers for quite some time due to its impact on natural radiation exposure to the general public and the associated lung cancer risks (Jacobi, 1993). 222Rn is generated through the α decay of radium (226Ra) and is part of the uranium (238U)-decay chain. A multitude of Rn isotopes are known to exist, the most abundant being 222Rn, with a half-life of ≈ 3.8 d.
Approximately 3 % to 12 % of all lung cancer deaths are attributed to the exposure to radiation from 222Rn (progenies), depending on the activity concentration of 222Rn in a certain area (Martin-Gisbert et al., 2023). Therefore, 222Rn progenies are the second-biggest cause of lung cancer after smoking. The World Health Organization (WHO) and other national and international organizations recommend 222Rn measurements to identify areas with high 222Rn activity concentrations, so-called radon priority areas (RPAs) (Cinelli et al., 2018). Additionally, the identification of RPAs is one of the key objectives of the European Metrology Research Programme for Innovation and Research (EMPIR) 19ENV01 project “Radon metrology for use in climate change observation and radiation protection at the environmental level”. The project outcomes will be utilized to fulfil the requirements set by European Council Directive 2013/59/EURATOM, thereby enabling decision-makers to enforce the respective 222Rn action plans within the EU member states and enhance radiation protection for the general public (Röttger et al., 2021).
All European countries operate automatic gamma dose rate systems and atmospheric radionuclide concentration detectors for environmental radioactive monitoring. The results of this radiological monitoring are exchanged through the European Radiological Data Exchange Platform (EURDEP, accessible at https://remap.jrc.ec.europa.eu/Advanced.aspx, last access: 19 March 2024) as requested by EU legislation (Council Decision 87/600/EURATOM of December 1987 on community arrangements for the early exchange of information in the event of radiological emergency; available at https://eur-lex.europa.eu/legal-content/EN/TXT/?uri=CELEX%3A31987D0600, last access: 19 March 2024), and the European Commission Joint Research Centre (JRC) has published a map of Europe, presenting indoor 222Rn measurements as early as 2006 (accessible at https://remap.jrc.ec.europa.eu/Atlas.aspx#, last access: 19 March 2024). This map has been composed by considering non-harmonized and punctually measured indoor radon activity concentration over the years.
However, despite extensive research, there is no outdoor 222Rn activity concentration measurement map published as of yet (March 2024) (Cinelli et al., 2018). On the one hand, this is attributed to the challenges of measuring 222Rn at the low activity concentrations found in outdoor environments (below 100 Bq m−3), making precise and comparable measurements traceable to the International System of Units (SI) complicated. On the other hand, there are few stations measuring outdoor radon activity concentration so far. 222Rn activity concentration in air depends on a multitude of factors. Major factors not only include atmospheric processes like wind speed and temperature but also soil properties like uranium concentration in soil and soil permeability, to name but a few (Čeliković et al., 2022). Different methods are implemented at different measurement sites, making comparisons of existing outdoor 222Rn activity concentration measurements challenging to impossible (Schmithüsen et al., 2017; Grossi et al., 2020).
Aside from being important to the radiation protection community, precise outdoor 222Rn activity concentration measurements are also of great importance to the climate community. Levin et al. (1999) showed already in 1999 that 222Rn exhalation from soil can be used as a tracer to measure greenhouse gas emissions from soil, implementing the so-called radon tracer method (Levin et al., 1999). For this reason, atmospheric 222Rn measurements are also carried out at stations of the Integrated Carbon Observation System (ICOS). Other researchers applied this method in different ecosystems, such as in Grossi et al. (2018).
A detailed study of commercial measurement devices proved their principle capability of measuring 222Rn activity concentrations below 100 Bq m−3, but due to the lack of a suitable calibration and often a small active volume, and therefore a low count rate, all of them had uncertainties of at least 15 % below 100 Bq m−3 (Radulescu et al., 2022) and therefore no traceability to the SI. Typical methods for the calibration of instruments use sources of 222Rn to create atmospheres of well-defined 222Rn activity concentration. Such sources are usually solid Pylon sources (Radulescu et al., 2022).
Within the EU, 40 countries are currently gathering gamma dose rate data at 5500 automated observation stations (data available at https://remap.jrc.ec.europa.eu/Advanced.aspx). The EMPIR 19ENV01 traceRadon project aims to improve this network by addressing the issues mentioned above and provide outdoor 222Rn activity concentrations from 1 to 100 Bq m−3 traceable to the SI, with uncertainties below 10 % for k = 1.
One of the implemented methods to reach this goal is presented in this paper. For this method, two new 222Rn emanation sources were developed: the Integrated Radon Source Detector (IRSD) developed by the Physikalisch-Technische Bundesanstalt (PTB, Germany) and the source developed by the Czech Metrology Institute (in the following referred to as the CMI source). The IRSD represents a completely new class of 222Rn emanation sources. A layer of 226Ra is placed directly on top of a commercially available passivated implanted planar silicon (PIPS) semiconductor. As the PIPS detector is capable of spectrometric measurements of α particles, the emanation of 222Rn during an experiment can be observed quasi-online, as described in more detail in Sect. 2.2. The CMI source, on the other hand, is based on the build-up of 222Rn within the source and a subsequent dilution with air. Up to a certain point, the 222Rn emanation can be adjusted by varying the airflow through the source. Details on the setup of the sources can be found in Mertes et al. (2022a) and Fialova et al. (2020). Here we present a comparison study of the two sources with regard to their suitability to be implemented as calibration standards. Thus, a calibration of existing measurement devices at 1 to 100 Bq m−3 will be possible with the required uncertainty and traceability to the SI.
To ensure the quality of the two sources, both were investigated with regard to inferred calibration factors at two experimental sites: at the PTB and at the National Institute for Nuclear, Biological and Chemical Protection (SUJCHBO, Czech Republic). At the PTB, a setup under laboratory conditions with 50 and 500 L closed reference volumes was chosen. To ensure comparability, a similar setup was chosen at the SUJCHBO with a 324 L closed reference volume. In addition, at the SUJCHBO a calibration factor was determined with a different experimental setup under outdoor conditions. The comparison is meant to show the reproducibility of calibrations factors regardless of the implemented source and details of the experimental setup. This is seen as an indication of the high quality of both sources.
In Sect. 2, the results from the PTB will be described, while Sect. 3 covers the results obtained at the SUJCHBO. In Sect. 4, the results of both experimental sites will be compared, followed by a short summary in Sect. 5.
In this section, the methodology and the results of the measurements at the PTB, implementing the two new 222Rn emanation sources as calibration standards, will be described and discussed.
2.1 Setup
Both the IRSD and the CMI source were tested using radon monitors as reference instruments (the radon reference instruments, RRI no. 1 and RRI no. 2, were both of the AlphaGUARD EF type and operated in diffusion mode). In the case of the IRSD, two different sources of the same type (IRSD no. 1 and IRSD no. 2) were implemented in two independent measurements. As they were created with differing amounts of 226Ra, they were expected to create atmospheres of differing 222Rn activity concentrations. For the first measurement, IRSD no. 1 was connected to a 500 L closed reference volume through a standard vacuum flange KF-40 T-piece with RRI no. 1 placed inside the reference volume. After a measurement period of about 2 months, IRSD no. 1 was removed and the CMI source was placed inside the reference volume with the valves open. Both experiments were repeated in a 50 L closed reference volume, implementing a second RRI and a second IRSD (RRI no. 2 and IRSD no. 2).
Comparison of both sources was carried out based on the derived values of the RRI calibration factors, k, with respect to the certified activity and emanation rate of each source. In the ideal case, both calibration factors determined for one RRI will be identical, as both sources are meant to be suitable as calibration standards and should therefore yield the same calibration factor for the same RRI. For the CMI source, the activity and emanation factor were taken from the issued calibration certificate of the CMI (see Grexová et al., 2021), whereas the PTB development, the IRSD, allows for quasi-online, data-driven computation of the 222Rn activity concentration, as described in the following section.
2.2 Methods implemented for the Integrated Radon Source Detector (IRSD) at the PTB
In the following, the method used to derive the 222Rn activity concentration will be outlined. First, the activity of 222Rn remaining in the 226Ra source, , can be calculated according to
This formula contains the decay constant of 222Rn, λRn; the activity of 222Rn decaying within the 226Ra source, (negative contribution); the activity of all 222Rn produced in the source (through the α decay of 226Ra atoms), (positive contribution), per unit time; and finally, the activity of 222Rn emanated into the gas surrounding the source, η(t) (negative contribution), in terms of atoms per unit time.
Since it is assumed that the reference volume is perfectly hermetically closed against any losses of 222Rn, the activity of 222Rn evolves by
Note that the IRSD measures only α particles emitted from within its layer of 226Ra. Due to the setup (see Mertes et al., 2022a), the contributions of α decay from 222Rn in the reference volume, , are negligible in comparison. Since the α decay of 226Ra and 222Rn is associated with different α-particle energies, and can both be determined based on the α spectra measured by the PIPS detector inside the IRSD. The RRI, on the other hand, measures solely the activity concentration in the volume, from which is derived by multiplication with the known reference volume. The evolution of is shown in Eq. (2). It is linked to and through η(t), as can be seen from the comparison of Eqs. (1) and (2). may also be inferred from the dynamics of the build-up of 222Rn in the volume, the continuity of the total amount of 222Rn expressed by Eqs. (1) and (2), and the supporting IRSD measurements. The statistical inference of based on the IRSD measurements of and will be described in the subsequent outline.
First, follows as
The coupled ordinary differential equations (ODEs) (Eqs. 1 and 3) may be combined by defining
and
which yields the combined inhomogeneous ODE
Only A and η depend on time, but and L do not.
This differential equation can be solved by the integrating factor method to yield
Since radioactivity is a Poisson process by definition, noise in the measurement of A(t) cannot be avoided, and therefore, a mere estimation of the time derivative in Eq. (1) yields unsatisfactory results in the pursuit of the determination of η(t). On the other hand, no information about η(t) can be inferred without relying on data. To model the temporal evolution of η(t), it is described as a stochastic process. As a result, it is possible to capture its time-dependent uncertainty. The emanation is modelled to obey the following stochastic differential equation (SDE) in the Itō sense, which has a Gaussian process as a solution:
where dβt describes the increments of a standard one-dimensional Wiener process and σ represents the standard variation.
The model for the emanation can be combined with the dynamics of the 222Rn source of the IRSD and the accumulation of 222Rn within the reference volume (essentially the combination of Eqs. (1)–(3) and (7)) through the definition of a state vector, x, which yields a combined SDE and may be solved analogously to Eq. (6) as
with
and
The process of the IRSD measurements is described as
where yt signifies a vector of peak areas corresponding to 226Ra and the 222Rn peaks obtained from the IRSD α spectrum at time t. Therein, a Gaussian approximation was chosen and the components of are known from the calibration of the IRSD as described in Mertes et al. (2022a), which is traceable to the primary defined-solid-angle (DSA) α-particle spectrometer at the PTB. The peak areas were determined from each IRSD α-particle spectrum using non-linear regression against a Poisson likelihood also described in Mertes et al. (2022a), while neglecting the integrating behaviour of the spectrometric measurements.
Inference of the state vector entails computation of the collection of probability density functions , which depend on all collected IRSD spectra within the measurement interval T, indicated by the notation “”, for all desired instants in time t. In this case, these are the time instants where the RRI reported a measurement of . The computation of the statistical moments (mean vector and covariance matrix) of ) may be achieved by the recursions of the Kalman filter and the Rauch–Tung–Striebel smoother for this specific type of model (see references Särkkä and Solin, 2019; Rauch et al., 1965; Kalman, 1960; Särkkä, 2013). The matrix exponential required in the discretization of the dynamical system, as given by Eq. (9), was computed symbolically.
A remaining unknown parameter of this model is the standard deviation σ in Eq. (7). The maximum-likelihood estimator for σ was determined by maximizing the marginal log-likelihood of the measurement series (), which is computed alongside the Kalman-filter recursions (analogous to Rauch et al., 1965; Kalman, 1960). Since the reference volume is known, the probability density for can be computed at any time instant, depending on the observed IRSD spectra, by implementing the described modelling procedure.
The uncertainty of the inferred emanation increases as the temporal distance to related IRSD measurement time instants increases, which is a feature of the model definition and captures the fact that the evolution of η(t) is unknown in the absence of IRSD measurements.
The Kalman-filter approach requires the specification of a Gaussian prior distribution of the state vector for time t0. At time t0, marking the beginning of the RRI measurements, the reference volume was opened to obtain a stable initial state. While the actual 222Rn activity concentration in the reference volume was low at this point, it was assumed to be greater than zero. To alleviate this, the 222Rn activity concentration at t0 was determined as the value which maximized the linearity of the RRI response in comparison to the inferred 222Rn activity concentration evolution at the assumed background reading. The background contribution of the RRI was later determined to be (30 ± 17) Bq m−3, based on measurements without a source while the reference volume was flooded with 222Rn-free synthetic air.
2.3 Results and discussion of the IRSD at the PTB
The results of the measurements and the calculations in becquerels versus time are shown in Figs. 1 and 2. The measurements are shown as black points. The difference in point density between the two figures is attributed to the difference in measurement time (more than 2 months in Fig. 1 and less than 1 month in Fig. 2), resulting in a higher number of measurements used in Fig. 1. The smoothing results, based on the IRSD data and treated according to the procedure described in Sect. 2.2, are presented as a blue line.
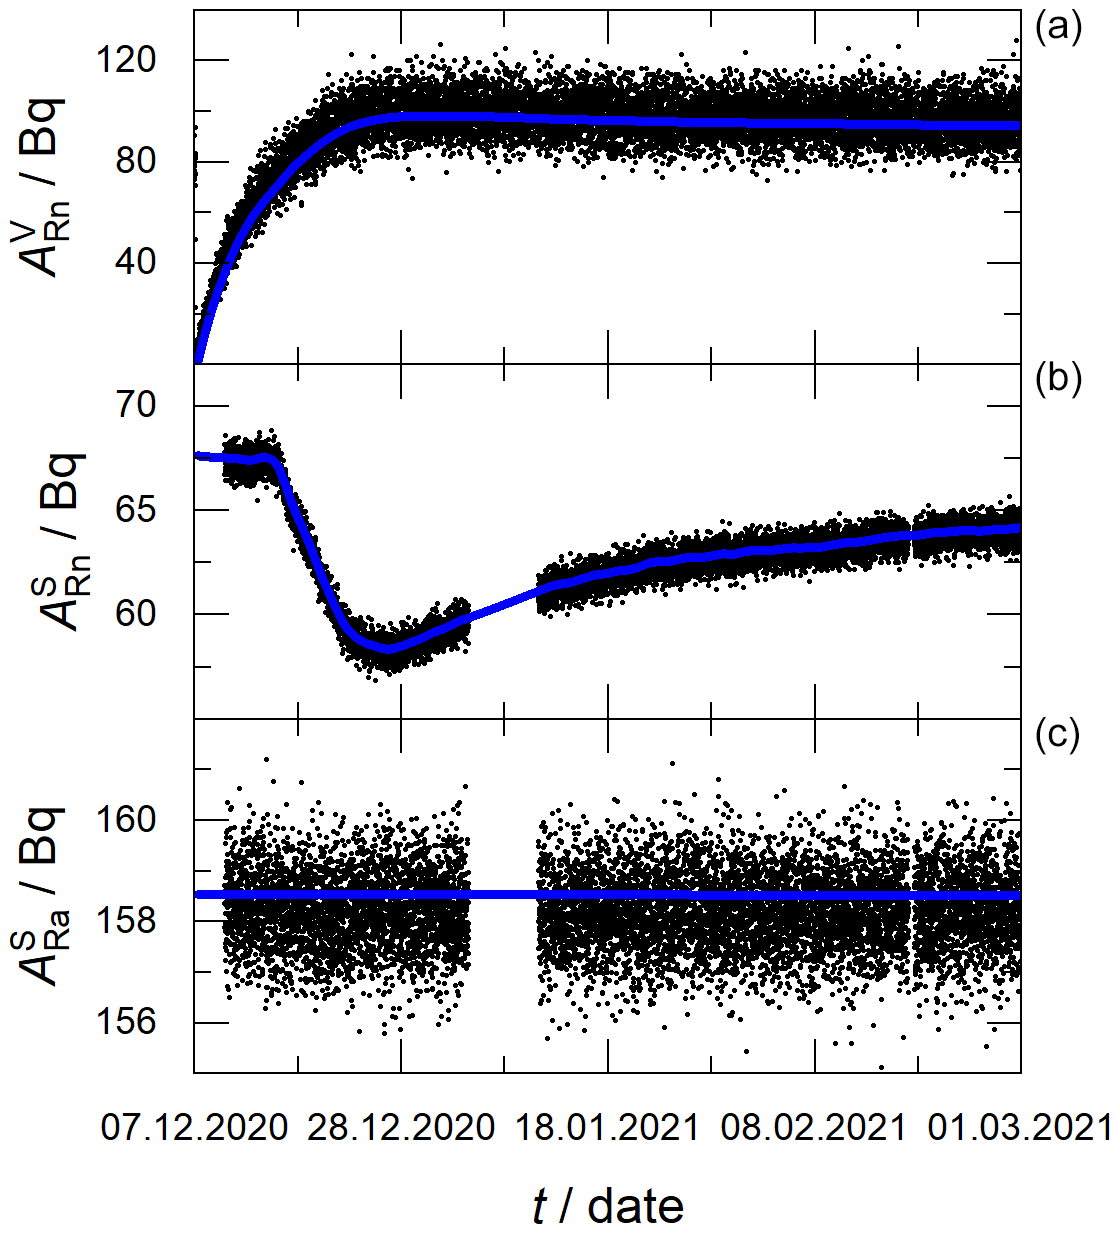
Figure 1Measurements of the activity in becquerels versus time. Panel (a) shows the 222Rn activity, , as measured by RRI no. 1. Measurements made with IRSD no. 1 are shown in panels (b) and (c). Presented are the activities of 222Rn and 226Ra, and , respectively. In all panels, the black points represent the measurements. In panels (b) and (c), the blue line shows the fit to the data based on Eq. (9), while in panel (a), the blue line represents the fit result from panels (b) and (c).
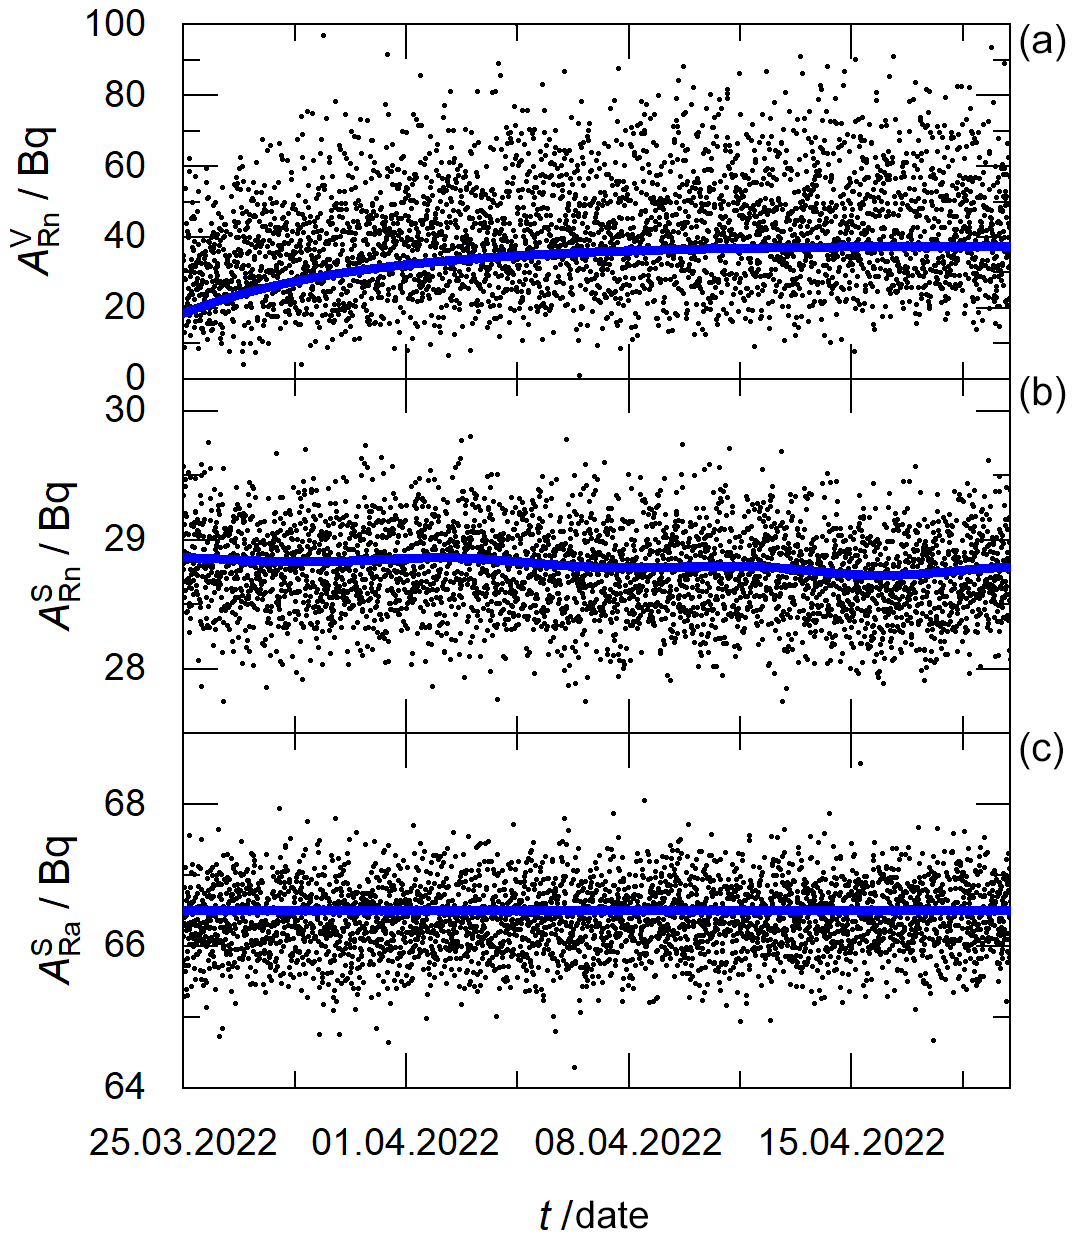
Figure 2Measurements of the activity in becquerels versus time. Panel (a) shows the 222Rn activity, , as measured by RRI no. 2. Measurements made with IRSD no. 2 are shown in panels (b) and (c). Presented are the activities of 222Rn and 226Ra, and , respectively. In all panels, the black points represent the measurements. In panels (b) and (c), the blue line shows the fit to the data based on Eq. (9), while in panel (a), the blue line represents the fit result from panels (b) and (c).
The measurements from RRI no. 1 and RRI no. 2 after conversion into becquerels with the known reference volume are plotted in panel (a) of Figs. 1 and 2, respectively, and represent an independent measurement of . The 222Rn activity concentration in the reference volume slowly rises, as 222Rn is released from the source into the reference volume until radioactive equilibrium is reached. Panels (b) and (c) show the activities of 222Rn and 226Ra remaining in the source, and , respectively. Shown in the panels are the peak areas determined from the IRSD spectra of 222Rn and 226Ra. Note that the emanation from the source is not stable due to changes in the relative humidity (panel b); however, this was considered based on the collected IRSD α-particle spectra and the modelling procedure. seems constant over the whole measurement (panel c). This is consistent with the long half-life of 226Ra of ≈ 1600 a, causing any changes in to be negligible considering the timescales of these measurements.
Comparing panel (a) of Fig. 1 with panel (a) from Fig. 2, it is apparent that the standard deviation of RRI no. 1 is much smaller than the standard deviation of RRI no. 2, despite both instruments being of the same type. This is due to the difference in setup: both instruments measure not the activity of 222Rn but the activity concentration. As the volume is known, the activity can be easily calculated. However, as RRI no. 1 was placed inside a 50 L volume and RRI no. 2 was placed in a 500 L volume, the absolute values measured by the two RRIs differed by 1 order of magnitude, resulting in a higher absolute activity concentration and thus smaller standard deviation for the RRI which was placed in the smaller volume.
The calibration factor, k, resulting from comparison of the IRSD data with the respective RRIs, is obtained as the reciprocal slope from the (unweighted) linear regression of the indicated RRI's 222Rn activity concentration inferred from the IRSD data. For RRI no. 1, it is inferred as
and for RRI no. 2, it is determined as
The uncertainty of the calibration factor is assumed to be 1.5 %, which is based on the systematic uncertainty of the IRSD calibration using the primary defined-solid-angle (DSA) α-spectrometry standard. Even though the outlined approach allows us to determine the statistical uncertainty associated with the IRSD measurements, this contribution is considered negligible in comparison because of the high number of data points. In addition, it is assumed that the influence of the uncertainty in σ resulting from the model is negligible.
2.4 Methods implemented with the CMI source at the PTB
The CMI source allows us to create atmospheres with different 222Rn activity concentrations, depending on the flow rate of air through the source. At the PTB, no active airflow was installed. The source was placed in the closed reference volume, and 222Rn diffused through the open valves into the reference volume.
The intrinsic background contribution of the measurement device in the reference volume without a 222Rn source was determined with 222Rn-free synthetic air to a value of
The following model was implemented to calculate the sensitivity and the calibration factor of the respective RRI:
with
with
and
ΔM represents the measured 222Rn activity concentration (including the background activity concentration) during time Δt, while ΔM0 represents the background contribution. The reference 222Rn activity concentration, C, is calculated from the 226Ra activity of the source, A; the emanation coefficient, χ; and the reference volume of the vessel, V, reduced by the volume occupied by the included components, such as the source and the monitor. The 226Ra activity from the source and the emanation coefficient were taken from the calibration certificate (see Grexová et al., 2021). The reference volume was carefully determined by measuring the volumes of the barrel, of the detector, and of the source.
Corrections for the background activity concentration, Cbg, and (in case of leakage) a loss of activity concentration, ΔC, are implemented for the purpose of the uncertainty calculation:
with .
The model shows consistency with the assumption that ΔC=0 and Cbg=0, but it is important to note that this assumption is valid.
2.5 Results and discussion of the CMI source at the PTB
The measurements of the CMI source performed at the PTB are shown in Fig. 3. The results for the 222Rn activity concentration in Bq m−3 are plotted as a function of time and represented by the black line. The sudden increase at the beginning marks the opening of the valves of the source. Even before that the 222Rn activity concentration exceeds the background activity concentration. This is ascribed to a leakage in the source valves causing some 222Rn to diffuse into the reference volume, even when the valves are closed.
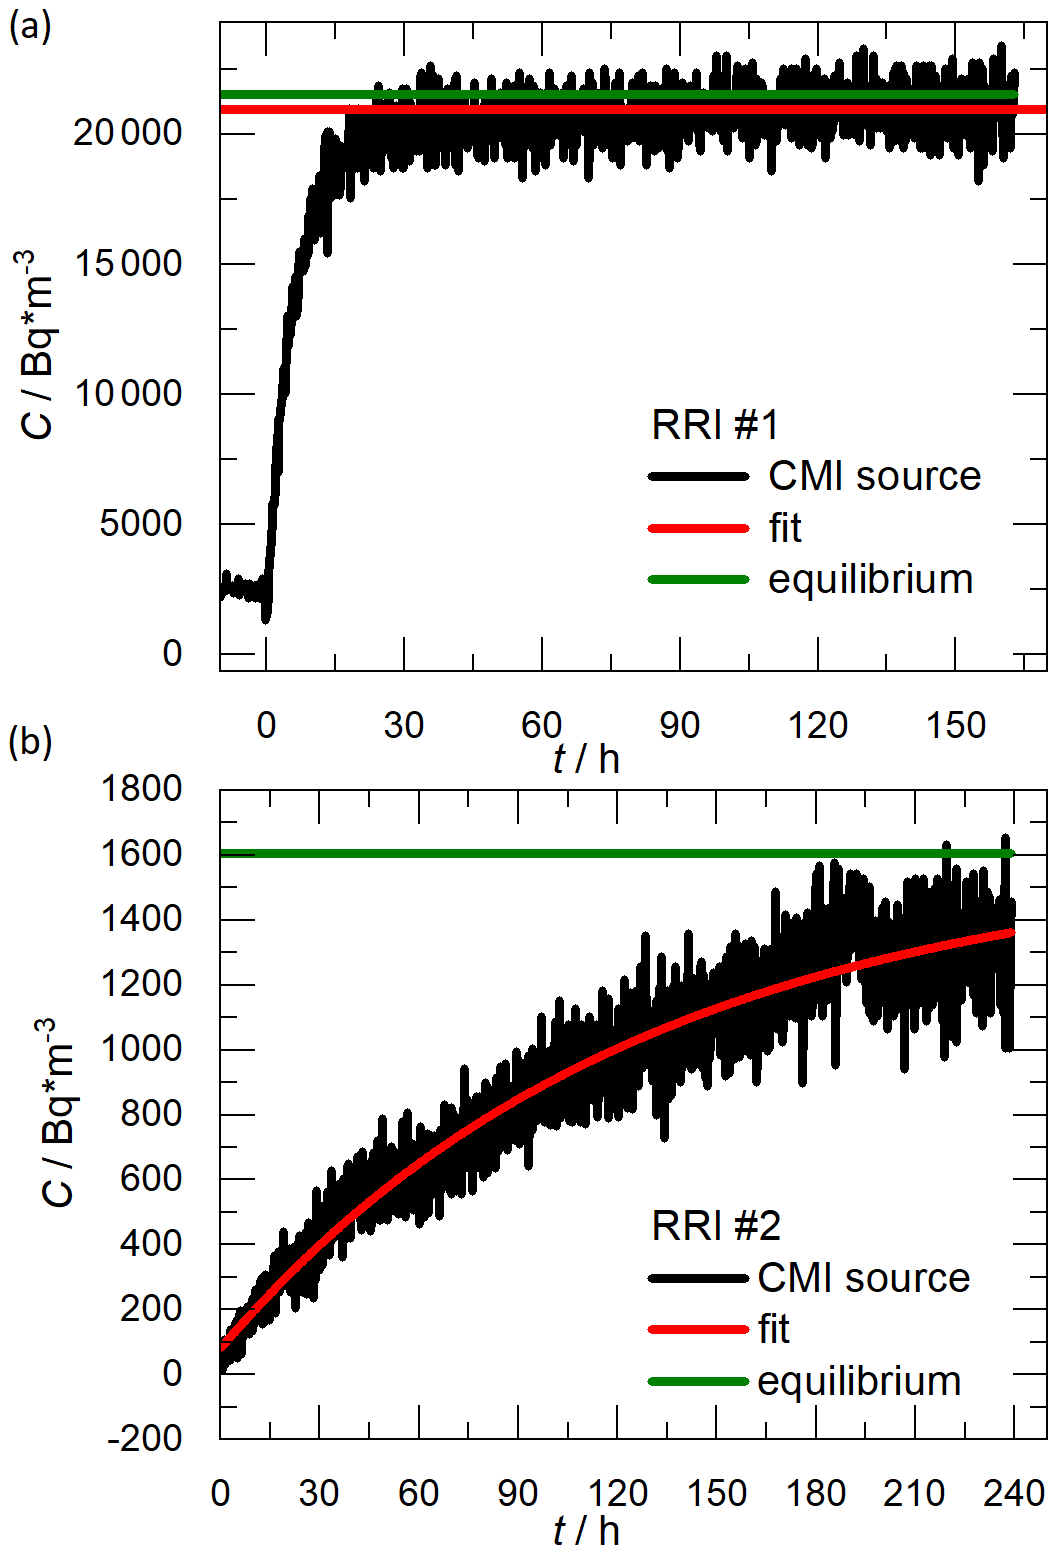
Figure 3222Rn activity concentration, C, in Bq m−3 plotted versus time. The measurement is shown in black. The red line shows the fit to the data, while the green line represents the 222Rn equilibrium activity concentration. (a) RRI no. 1. (b) RRI no. 2.
Once the valves of the source are opened, 222Rn gas, formerly trapped within the volume of the source, is released into the reference volume, causing a sudden rise in 222Rn activity concentration. The fit to the data (red line) was started once this process had finished. Afterwards, the 222Rn activity concentration continues to rise until radioactive equilibrium is reached. Considering the timescale of the measurement, this is not the case, but the equilibrium 222Rn activity concentration was calculated as part of the fitting process and is indicated by the green line.
The calibration shown here results in calibration factors of
for RRI no. 1 and of
for RRI no. 2.
The relative humidity, temperature, and pressure during the measurement were monitored as well but are not shown, since no significant changes were observed.
In this section, the comparison made at the SUJCHBO will be described. First, the general data analyses will be outlined, followed by the measurements made with the IRSD. Measurements implementing the CMI source will follow before the actual comparison of the sources.
3.1 Measurements under laboratory conditions
The laboratory conditions are described in the following and can be found in more detail in Fialova et al. (2020). A newly developed piece of equipment is a part of the Czech primary radon measurement device situated at the SUJCHBO, Kamenná (Central Bohemia). In particular, the equipment consists of an airtight low-level radon chamber (LLRCH), a humidifier, a mass flow controller of the Bronkhorst® EL-FLOW type (Bethlehem, PA, USA), and an aerosol filter. A bottle of synthetic 222Rn-free air can be attached. To achieve a specific low-level 222Rn activity concentration, it is necessary to ensure (1) a constant 222Rn supply and (2) constant defined ventilation in the 222Rn chamber. Because of the location of the SUJCHBO, which is close to a former uranium mine, it is possible to measure an outdoor 222Rn activity concentration in the range of tens or hundreds of Bq m−3. Therefore, it would not be possible to achieve a low-level 222Rn activity concentration there without using a bottle with a suitable supply of 222Rn-free air.
On its way to the low-level 222Rn source, air from the bottle with synthetic 222Rn-free air passes through a protective aerosol particle filter and then the calibrated mass flow controller. After passing through the source, the resulting mixture of air and 222Rn passes through a humidifier to the 222Rn chamber. The humidifier is included to ensure that the measurement conditions are as realistic as possible. The homogeneity of the atmosphere inside the 222Rn chamber is ensured by means of a continually regulated ventilator (the airflow speed can be set in the range of 0.1–3.5 m s−1). Sensors for the measurement of the climatic conditions are placed inside the LLRCH.
The LLRCH is of cylindrical shape and made of steel with a volume of 324 L. The whole chamber is earthed, and the inner surface is painted with a special coating to minimize the deposition of 222Rn decay products on the walls. The LLRCH is equipped with four sampling points to which system components can be connected to take samples of the inside air. These points are located in such a way that they allow sampling from different locations of the chamber. The climatic-monitoring capability includes temperature and air pressure readings by sensors placed inside and outside the 222Rn chamber (to monitor the differential pressure between the chamber and the laboratory atmosphere). In addition, the relative humidity inside the 222Rn chamber is monitored. The airtightness of the LLRCH was verified through a series of experiments as described in Fialova et al. (2020).
The emanation power of 222Rn from a 226Ra source depends on the humidity of the air flowing through the source. Synthetic air is ultra-dried, but to ensure this is also the case after passing through the source, a humidifier was placed behind the 222Rn source and the relative humidity in the chamber was measured with and without the humidifier being connected. When the humidifier was not connected, the relative humidity in the chamber was very close to zero. In the case of the humidifier being connected, the relative humidity in the chamber was in the range of 40 %–60 %, depending on the setting of the humidifier.
3.2 Measurements under field conditions
For better comparison, a similar setup was chosen for the measurements under field conditions. The respective source was connected to an AlphaGUARD (RRI no. 3) and measured in flow-through mode. In addition, a second AlphaGUARD (RRI no. 4) was implemented for the purpose of background measurements. With that, the high 222Rn activity concentrations in the outdoor air mentioned above were taken into account. The measurement procedure consisted of three phases. During the first phase, both RRIs measured the airflow without the 222Rn source. Consequently, both should measure the same (outdoor) 222Rn activity concentration. During the second phase, RRI no. 4 remained not connected to the 222Rn source (unchanged compared to the first phase), but RRI no. 3 was connected to the 222Rn source. In the third phase, again both RRIs were not connected to the 222Rn source (analogous to the first phase), and, based on the comparison of the measurements from RRI no. 3 and RRI no. 4, it was possible to determine the outdoor 222Rn activity concentration which would be measured in diffusion mode.
3.3 Reference level of radon for the CMI source
During the equipment design, a model of constant 222Rn input and constant ventilation was applied for the CMI source, as quantified in Eq. (17):
C is the 222Rn activity concentration at time t, λRn is the decay constant of 222Rn, k is the air exchange intensity, and V is the reference volume of the 222Rn chamber.
For a steady state (t = ∞) with a constant air exchange intensity and constant 222Rn activity concentration, Eq. (18) applies:
Qsettled is the flow rate, M is the molar mass, pQ is the air pressure at the time of the calibration (1013.25 hPa), R is the molar gas constant, TQ is the temperature at the calibration (273.16 K), pC is the measured air pressure during the experiment, TC is the measured temperature during the experiment, and RRn is the 222Rn emanation power.
Note that only depends on the flow rate, Qs. All other parameters were monitored and turned out to be constant during the measurement.
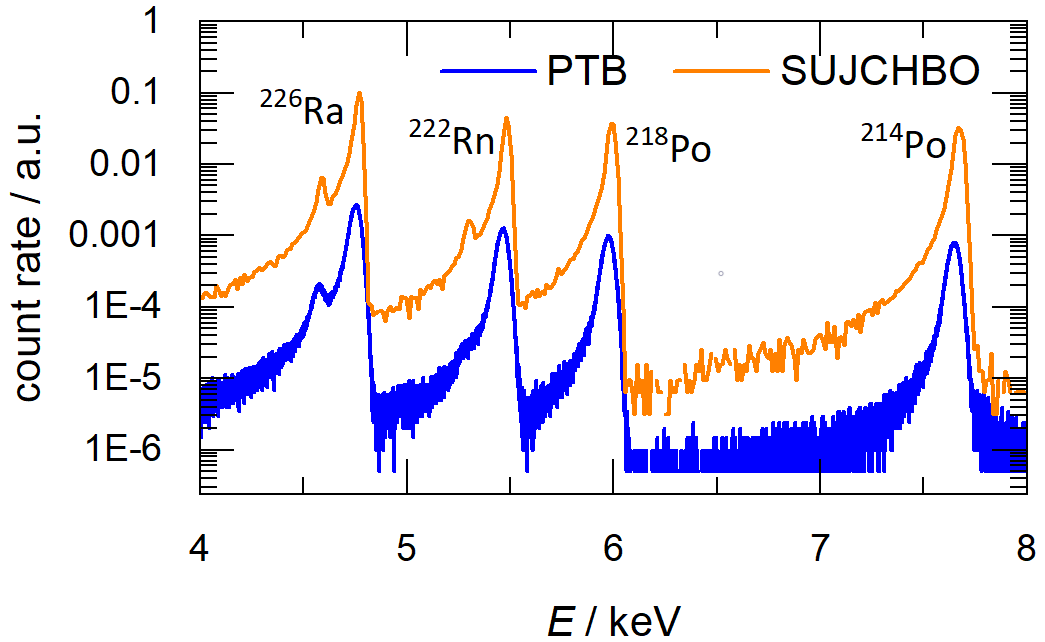
Figure 4Comparison of α spectra of the IRSD. The orange line was measured at the SUJCHBO, while the blue line was measured at the PTB.
3.4 Integrated Radon Source Detector (IRSD)
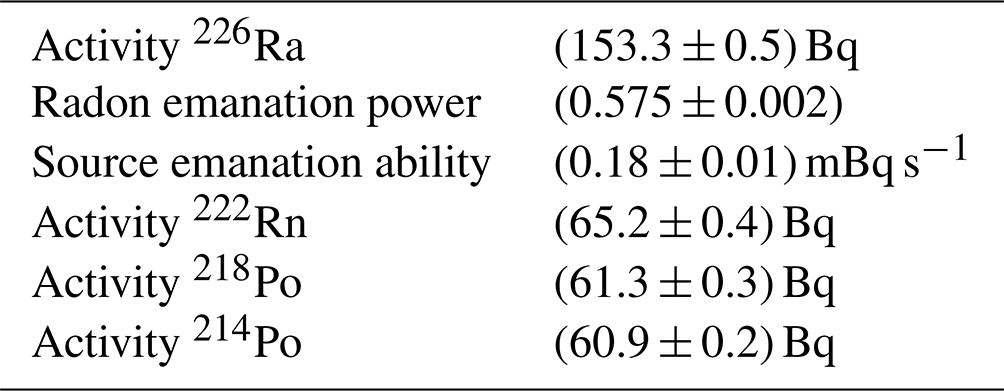
A Model 7401 α spectrometer was used to determine the 226Ra activity, 222Rn emanation power, and source emanation ability of the IRSD as preparation for the determination of the calibration factors. Two α spectra, measured at the SUJCHBO and the PTB, respectively, are compared in Fig. 4. Based on the results from α-spectrometry processing, the parameters of the supplied IRSD, as specified in Table 1, were determined.
For the measurements, the IRSD was placed in a flow-through flask and connected to the LLRCH. An AlphaGUARD (RRI no. 5) was operated in diffusion mode. The background 222Rn activity concentration of RRI no. 5 was determined as (2.42 ± 0.06) Bq m−3 and subsequently subtracted from the results.
Table 2CMI-source parameters as specified in Grexová et al. (2021).
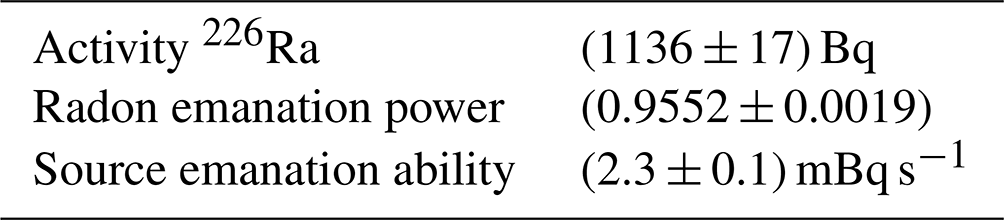
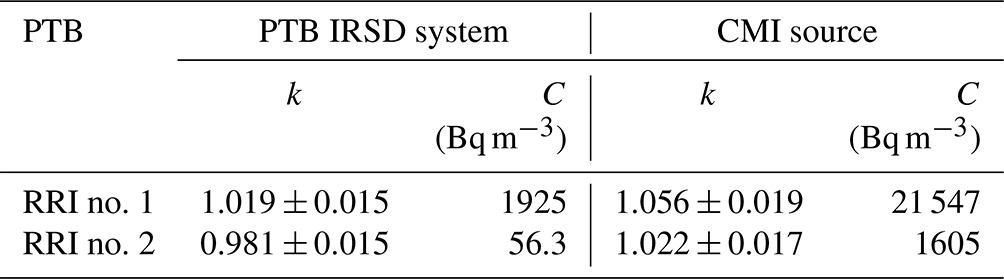
Table 3Calibration factors, k, determined for two radon reference instruments (RRI no. 1 and RRI no. 2) with both sources at the PTB and equilibrium activity concentrations, C, in Bq m−3 of the respective measurements.
The implemented measurements are shown in Fig. 5, and evaluation of their results leads to a calibration factor of
A large part of the determined uncertainty is formed by the uncertainty associated with the determination of the 222Rn activity concentration by RRI no. 5. The stated uncertainty applies to k = 1. It is higher than the uncertainty determined at the PTB due to the PIPS detector within the IRSD not being used. The third phase of the outdoor measurements is shown in Fig. 6. Since the 222Rn emanation is dependent on humidity, no calibration factor was determined.
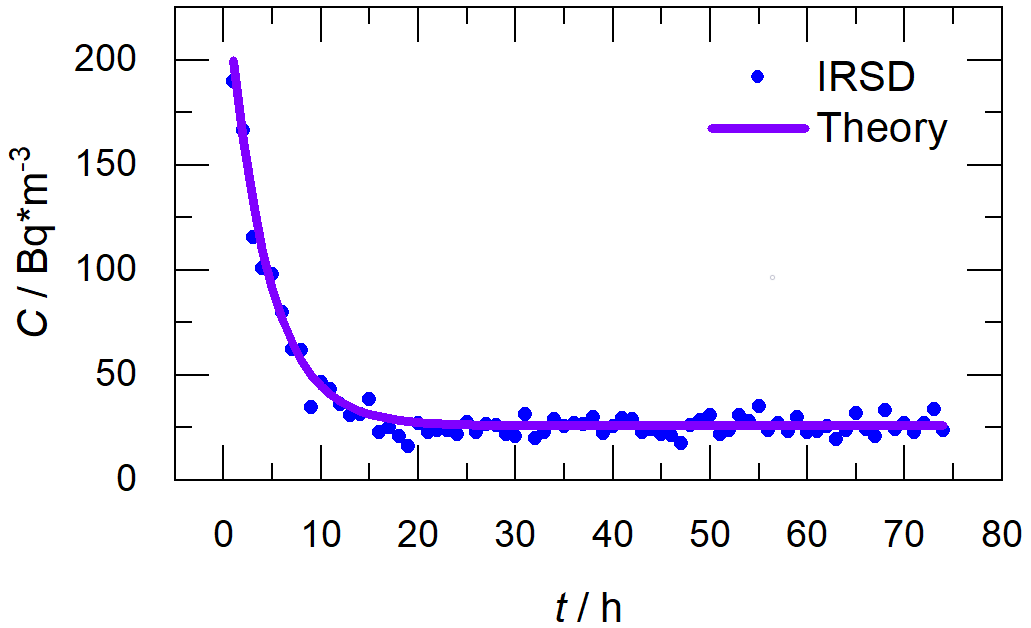
Figure 5222Rn activity concentration produced by the IRSD versus time (blue dots), including a fit based on the radioactive decay law (purple line).
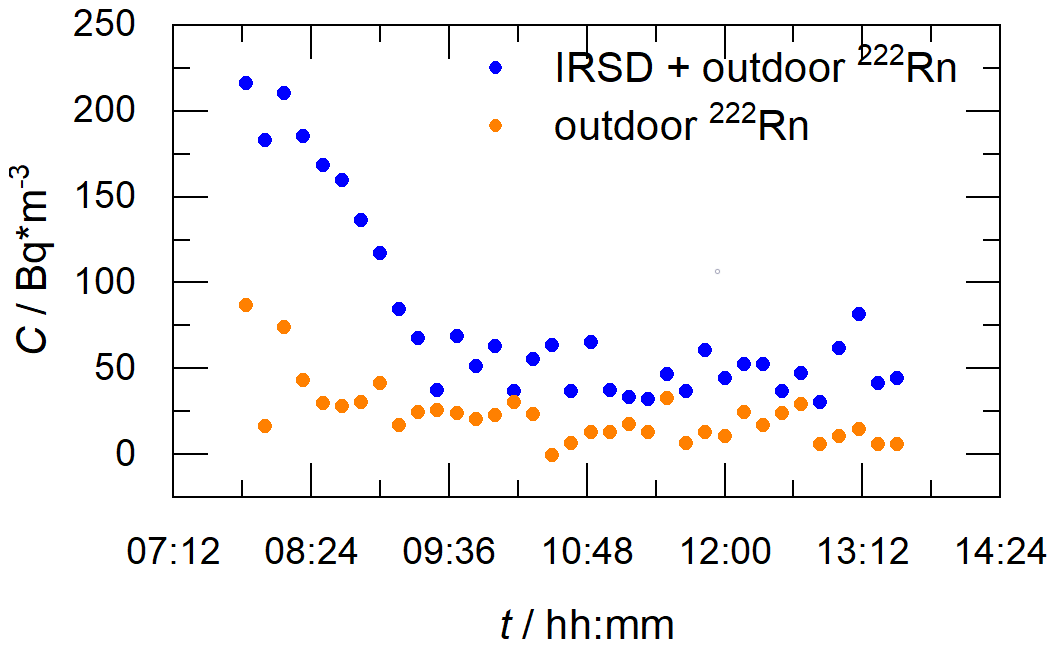
Figure 6222Rn activity concentration of the IRSD versus time as measured by RRI no. 3 (blue dots) and RRI no. 4 (orange dots).
3.5 CMI source
The main parameters of the CMI source were taken from the delivered certificate (see Grexová et al., 2021) and are summarized in Table 2. A flow rate of 1.74 L min−1 through the CMI source was used to achieve a 222Rn activity concentration of 80 Bq m−3 in accordance with Eq. (18). The stabilization time required to reach the desired 222Rn activity concentrations in the LLRCH was estimated to be 20 h. The course of the experiment is shown in Fig. 7.
Table 4Calibration factors, k, determined for a radon reference instrument (RRI) with both sources at the SUJCHBO and equilibrium activity concentrations, C, in Bq m−3 of the respective measurements. Note that the determined uncertainty of the IRSD is higher compared to that of the PTB because the detector within the IRSD was not used.
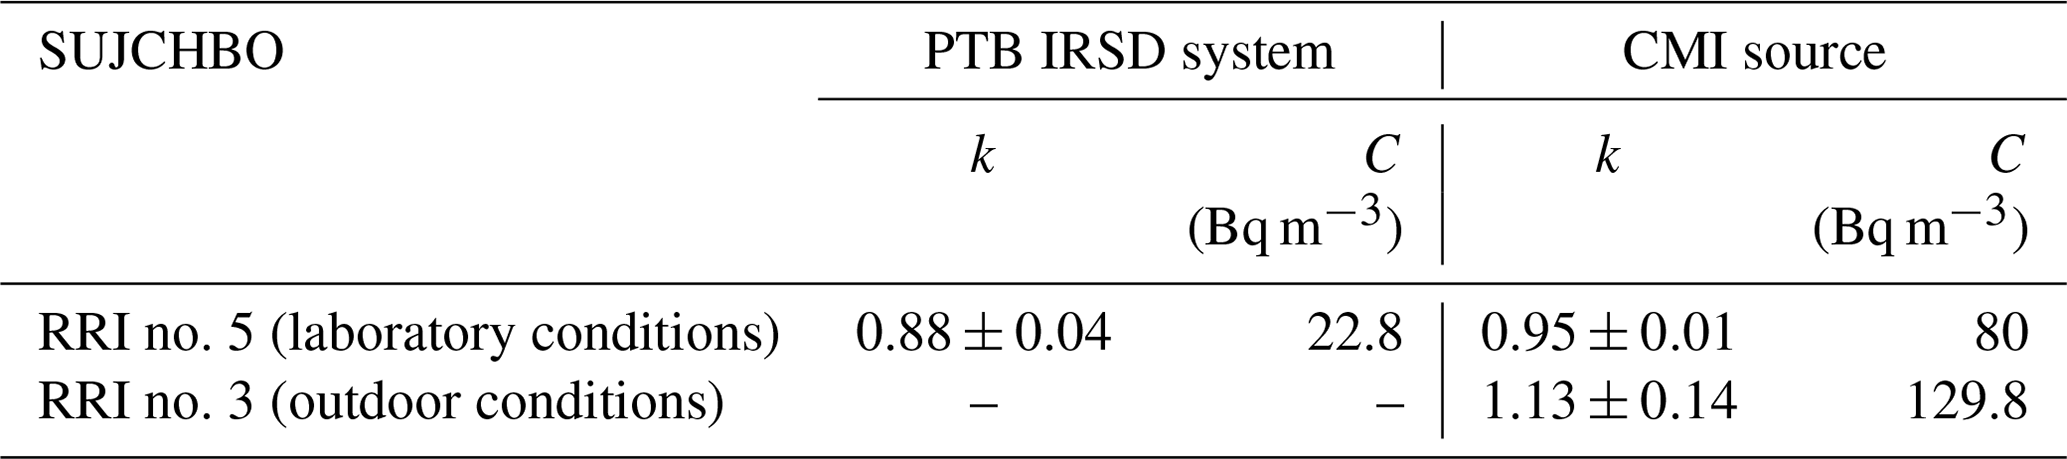
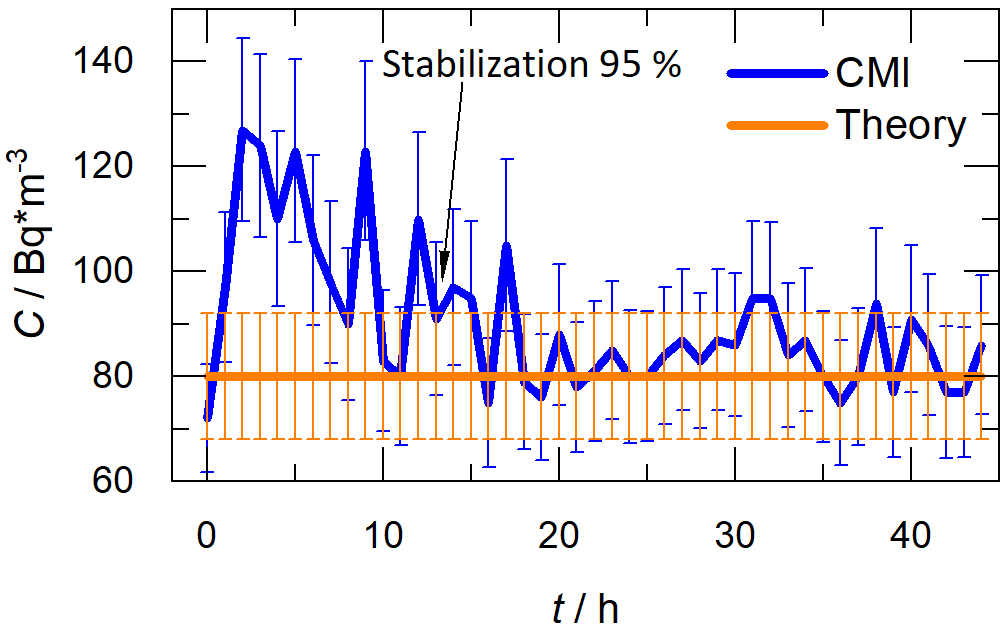
Figure 7222Rn activity concentration created by the CMI source under laboratory conditions versus time (blue line). The reference value of 80 Bq m−3 (orange line) was calculated according to Eq. (18).
The implemented measurements and evaluation of their results lead to a calibration factor of
A large part of the determined uncertainty is formed by the uncertainty associated with the determination of the 222Rn activity concentration by RRI no. 5. The stated uncertainty applies to k = 1.
During the field experiments, either one or two RRIs (RRI no. 3 and RRI no. 4) were used to measure the outdoor 222Rn activity concentration in three distinctive phases, as described in Sect. 3.2. The RRI no. 3 connected to the CMI source was operated in flow-through mode. Figure 8 presents the results of this approach.
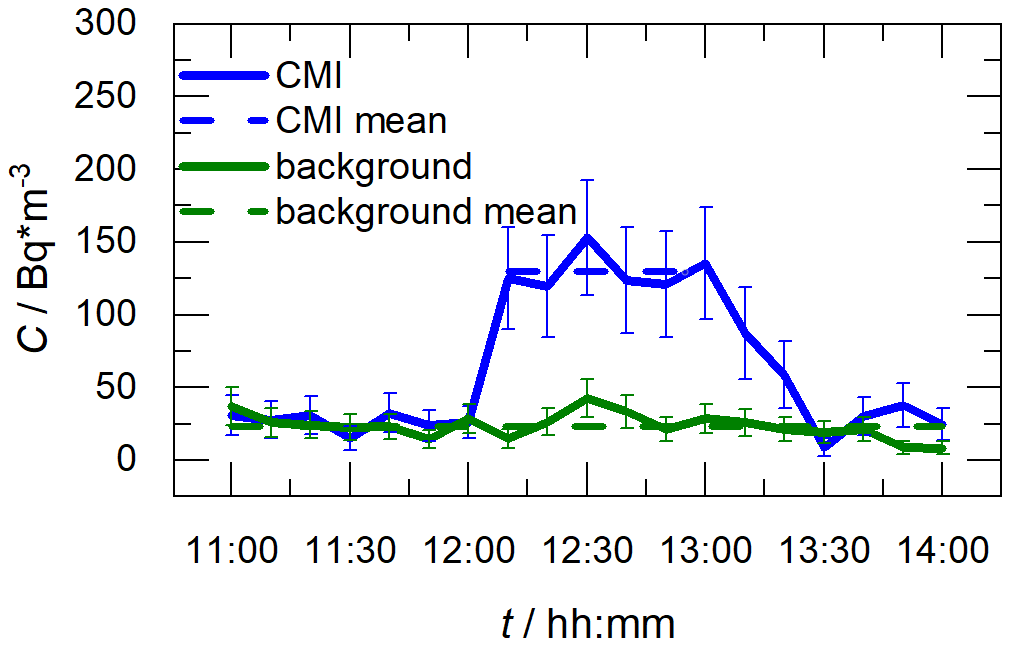
Figure 8222Rn activity concentration while implementing the CMI source under field conditions versus time, with RRI no. 3 (blue) and RRI no. 4 (green).
To determine the required value of the 222Rn activity concentration of the connected CMI source (solid blue line in Fig. 8), it is necessary to subtract the values of the 222Rn activity concentration in the outdoor air (dashed green line in Fig. 8). In the case of determining the 222Rn activity concentration in the outdoor air with the help of RRI no. 3, it is necessary to set aside two values (at a 10 min sampling interval) after disconnecting the source. These two values represent the 222Rn decay products that were deposited in RRI no. 3's chamber and increase the background activity concentration of the instrument.
Calibration factors determined using the CMI source in the field and one or both RRIs were determined as follows:
for both RRIs and
for one RRI.
The measurements prove both sources to be capable of providing stable reference atmospheres below 100 Bq m−3. The derived calibration factors from the SUJCHBO are summarized in Table 4. Even when the same device is implemented, significant differences can be observed. The uncertainty of the calibration factor from the RRI determined by implementing the IRSD is higher than that obtained by implementing the CMI source. This is in contrast to the results from the PTB (see Table 3). The reason for that is the PIPS detector within the IRSD is not used, and as a result, the 222Rn activity concentration is not well defined. Furthermore, the uncertainties of the calibration factors inferred at the PTB and the SUJCHBO are higher when a lower 222Rn activity concentration was measured.
Differences in the calibration factor determined with each of the two sources for the same RRI are mainly attributed to fit uncertainties and the very different methods used in the creation of the reference 222Rn activity concentration by the two sources. The CMI source causes a high 222Rn activity concentration in a small volume within the source that is diluted for the calibration in a low-level atmosphere and requires constant emanation of 222Rn (realized by constant environmental parameters). The IRSD, on the other hand, directly creates a low-level reference 222Rn activity concentration in the atmosphere and does not require constant environmental parameters, as the 222Rn emanation can be determined at a 10 min interval quasi-online.
All calibration factors determined are close to 1, indicating the high quality of the RRI. Furthermore, all procedures result in an uncertainty of the calibration factors lower than 10 %, which was the intended goal.
The two 222Rn sources were carefully analysed and compared at two experimental sites (the SUJCHBO and the PTB) to determine their suitability as standard radon (222Rn) calibration sources. Although both sources were thoroughly characterized, the measurements result in differing calibration factors for the same reference instrument. Nonetheless, they are well within the intended goal of an uncertainty of 10 % for k = 1. The comparison of the two sources proved that they are both of high quality.
The next step is to implement the new calibration sources, possibly for the calibration of the new transfer standards developed in the same project.
The code is available at https://doi.org/10.5281/zenodo.7798459 (Mertes, 2023), and the data are available at https://doi.org/10.7795/720.20220921 (Mertes et al., 2022b).
SR, FM, AH, and AR designed and executed the experiments at the PTB as well as the data analysis. The CMI source was prepared by PK. Experiment design, execution, and data analysis at the SUJCHBO were carried out by PPSO. TJB prepared the paper with the help of all co-authors.
The contact author has declared that none of the authors has any competing interests.
Publisher’s note: Copernicus Publications remains neutral with regard to jurisdictional claims made in the text, published maps, institutional affiliations, or any other geographical representation in this paper. While Copernicus Publications makes every effort to include appropriate place names, the final responsibility lies with the authors.
This article is part of the special issue “Outcomes of the traceRadon project: radon metrology for use in climate change observation and radiation protection at the environmental level”. It is a result of the 19ENV01 traceRadon project (June 2020–May 2023).
The 19ENV01 traceRadon project has received funding from the European Union's Horizon 2020 research and innovation programme. “19ENV01 traceRadon” denotes the EMPIR project reference.
This open-access publication was funded by the Physikalisch-Technische Bundesanstalt.
This paper was edited by Claudia Grossi and reviewed by Dafina Kikaj and Ileana Radulescu.
Čeliković, I., Pantelić, G., Vukanac, I., Nikolić, J. K., Živanović, M., Cinelli, G., Gruber, V., Baumann, S., Poncela, L. S. Q., and Rabago, D.: Outdoor Radon as a Tool to Estimate Radon Priority Areas – A Literature Overview, Int. J. Environ. Res. Pub. He., 19, 662, https://doi.org/10.3390/ijerph19020662, 2022.
Cinelli, G., Tollefsen, T., Bossew, P., Gruber, V., Bogucarskis, K., De Felice, L., and De Cort, M.: Digital version of the European Atlas of natural radiation, J. Environ. Radioact., 196, 240–252, https://doi.org/10.1016/j.jenvrad.2018.02.008, 2018.
Fialova, E., Otahal, P. P. S., Vosahlik, J., and Mazanova, M.: Equipment for testing measuring devices at a low-level radon activity concentration, Int. J. Environ. Res. Pub. He., 17, 1904, https://doi.org/10.3390/ijerph17061904, 2020.
Grexová, K., Sosnová, D., and Sochor, V.: CMI's Certificate No. 882/21 of the radionuclide Ra-226 standard No. 221121-221455, 2021.
Grossi, C., Vogel, F. R., Curcoll, R., Àgueda, A., Vargas, A., Rodó, X., and Morguí, J.-A.: Study of the daily and seasonal atmospheric CH4 mixing ratio variability in a rural Spanish region using 222Rn tracer, Atmos. Chem. Phys., 18, 5847–5860, https://doi.org/10.5194/acp-18-5847-2018, 2018.
Grossi, C., Chambers, S. D., Llido, O., Vogel, F. R., Kazan, V., Capuana, A., Werczynski, S., Curcoll, R., Delmotte, M., Vargas, A., Morguí, J.-A., Levin, I., and Ramonet, M.: Intercomparison study of atmospheric 222Rn and 222Rn progeny monitors, Atmos. Meas. Tech., 13, 2241–2255, https://doi.org/10.5194/amt-13-2241-2020, 2020.
Jacobi, W.: The history of the radon problem in mines and homes, Ann. ICRP, 23, 39–45, https://doi.org/10.1016/0146-6453(93)90012-W, 1993.
Kalman, R. E.: A New Approach to Linear Filtering and Prediction Problems, J. Basic Eng., 82, 35–45, https://doi.org/10.1115/1.3662552, 1960.
Levin, I., Glatzel-Mattheier, H., Marik, T., Cuntz, M., Schmidt, M., and Worthy, D. E.: Verification of German methane emission inventories and their recent changes based on atmospheric observations, J. Geophys. Res., 104, 3447–3456, 1999.
Martin-Gisbert, L., Ruano-Ravina, A., Varela-Lema, L., Penabad, M., Giraldo-Osorio, A., Candal-Pedreira, C., Rey-Brandariz, J., Mourino, N., and Pérez-Ríos, M.: Lung cancer mortality attributable to residential radon: a systematic scoping review, J. Expo. Sci. Environ. Epidemiol., 33, 368–376, https://doi.org/10.1038/s41370-022-00506-w, 2023.
Mertes, F.: FlorianMertes/RadonDeconvolution: Version 1.0 (Release), Zenodo [data set], https://doi.org/10.5281/zenodo.7798459, 2023.
Mertes, F., Röttger, S., and Röttger, A.: Development of 222Rn Emanation Sources with Integrated Quasi 2π Active Monitoring, Int. J. Environ. Res. Pub. He., 19, 110093, https://doi.org/10.3390/ijerph19020840, 2022a.
Mertes, F., Röttger, S., and Röttger, A.: IRSD raw alpha spectrum data for Rn-222 emanation determination, Physikalisch-Technische Bundesanstalt (PTB) [data set], https://doi.org/10.7795/720.20220921, 2022b.
Radulescu, I., Calin, M. R., Luca, A., Röttger, A., Grossi, C., Done, L., and Ioan, M. R.: Inter-comparison of commercial continuous radon monitors responses, Nucl. Instrum. Meth. A, 1021, 165927, https://doi.org/10.1016/j.nima.2021.165927, 2022.
Rauch, H. E., Tung, F., and Striebel, C. T.: Maximum Likelihood Estimates of Linear Dynamic Systems, Am. Inst. Aeronaut. Astronaut. J., 3, 1445–1450, https://doi.org/10.2514/3.3166, 1965.
Röttger, A., Röttger, S., Grossi, C., Vargas, A., Curcoll, R., Otáhal, P., Hernández-Ceballos, M. Á., Cinelli, G., Chambers, S., Barbosa, S. A., Ioan, M.-R., Radulescu, I., Kikaj, D., Chung, E., Arnold, T., Yver-Kwok, C., Fuente, M., Mertes, F., and Morosh, V.: New metrology for radon at the environmental level, Meas. Sci. Technol., 32, 124008, https://doi.org/10.1088/1361-6501/ac298d, 2021.
Särkkä, S.: Bayesian Filtering and Smoothing, Cambridge University Press, https://doi.org/10.1017/CBO9781139344203, 2013.
Särkkä, S. and Solin, A.: Applied Stochastic Differential Equations, Cambridge University Press, ISBN 9781108186735, https://doi.org/10.1017/9781108186735, 2019.
Schmithüsen, D., Chambers, S., Fischer, B., Gilge, S., Hatakka, J., Kazan, V., Neubert, R., Paatero, J., Ramonet, M., Schlosser, C., Schmid, S., Vermeulen, A., and Levin, I.: A European-wide 222radon and 222radon progeny comparison study, Atmos. Meas. Tech., 10, 1299–1312, https://doi.org/10.5194/amt-10-1299-2017, 2017.